Molecular Cell Article - Home | Department of … Cell Article ... 1Department of Cell Biology,...
13
Molecular Cell Article Frequency-Modulated Pulses of ERK Activity Transmit Quantitative Proliferation Signals John G. Albeck, 1 Gordon B. Mills, 2 and Joan S. Brugge 1, * 1 Department of Cell Biology, Harvard Medical School, Boston, MA 02115, USA 2 Department of Systems Biology, University of Texas M.D. Anderson Cancer Center, Houston, TX 77030, USA *Correspondence: [email protected] http://dx.doi.org/10.1016/j.molcel.2012.11.002 SUMMARY The EGF-stimulated ERK/MAPK pathway is a key conduit for cellular proliferation signals and a thera- peutic target in many cancers. Here, we characterize two central quantitative aspects of this pathway: the mechanism by which signal strength is encoded and the response curve relating signal output to prolifer- ation. Under steady-state conditions, we find that ERK is activated in discrete, asynchronous pulses with frequency and duration determined by extracel- lular concentrations of EGF spanning the physiolog- ical range. In genetically identical sister cells, cell- to-cell variability in pulse dynamics influences the decision to enter S phase. While targeted inhibition of EGFR reduces the frequency of ERK activity pulses, inhibition of MEK reduces their amplitude. Continuous response curves measured in multiple cell lines reveal that proliferation is effectively silenced only when ERK pathway output falls below a threshold of 10%, indicating that high-dose tar- geting of the pathway is necessary to achieve thera- peutic efficacy. INTRODUCTION Signal transduction networks transmit information about the external environment of the cell and integrate these inputs to trigger discrete cell fate decisions. The biochemical events in- volved in signal transduction have been studied in many systems, providing a detailed view of the molecular paths through which information flows from cell surface receptors to transcription factors and other effectors of cell state. However, much less is known about how quantitative information is transmitted by these networks. In the simplest cases, the number or fraction of responding signaling molecules activated inside the cell is proportional to the extracellular concentration of the stimulating ligand (Brent, 2009). In other cases, quantitative information about a constant extracellular stimulus is carried not by the number of molecules responding (or signal ‘‘amplitude’’), but by the frequency with which the pool of responding signaling mole- cules shifts between ‘‘on’’ and ‘‘off’’ states (and thus termed ‘‘fre- quency modulation’’) (Cai et al., 2008; Hao and O’Shea, 2012). While many quantitative studies of signal transduction have focused on unicellular systems, much remains to be learned in metazoans, where quantitative signaling properties play a central role in development and disease. Appropriate responses to quantitative variations in morphogen gradients are essential in developmental processes, and detailed ‘‘response curves’’ have been mapped in which cellular response is plotted as a continuous function of the strength of an upstream signal (Gre- gor et al., 2007). In cancer, key oncogenes such as c-Myc and Ras elicit different cellular responses depending on the extent to which they are activated, but these determinations have been made for only three to five discrete signal levels (Murphy et al., 2008; Sarkisian et al., 2007). Continuous signal-response maps spanning the full dynamic range of output for pathways involved in tumor growth and survival would facilitate rational cancer therapy by indicating the level of pathway inhibition necessary to achieve a biologically significant change in prolifer- ation rate (Figure 1A). The EGFR-ERK/MAPK (epidermal growth factor receptor extracellular-regulated kinase/mitogen-activated protein kinase) signaling cascade is a central driver of cell proliferation in many cancers and the target of clinically relevant inhibitors. While quantitative and systems-level analyses of EGF-stimu- lated ERK activity have been performed (Amit et al., 2007; Chen et al., 2009; Nakakuki et al., 2010; Santos et al., 2007; Sturm et al., 2010; Zwang et al., 2011), these studies have focused on acute restimulation of cells with growth factors following a period of withdrawal, which induces ERK signaling within minutes, followed by proliferation many hours later. This temporal separation between signal and response obscures the signal-response relationship because multiple characteris- tics of the initial signal pulse—including delay, amplitude, frequency, or duration—may contribute to control of phenotype (Asthagiri et al., 2000; Traverse et al., 1994). Signaling and prolif- eration can be more easily related when both processes have reached steady state (at the population level), because the magnitude of each can be represented by a single time-indepen- dent average (Figure 1A). Steady-state conditions also more accurately model the cellular response to chronic EGF exposure, which occurs in many physiological and tumor environments. Here, to understand how quantitative information is trans- mitted by the EGFR-ERK signaling pathway, we utilize live and fixed single-cell methods to measure signal strength and dy- namics under conditions of steady-state EGF stimulation. We find that this pathway incorporates both frequency- and ampli- tude-modulated elements: ERK is activated in discrete pulses Molecular Cell 49, 249–261, January 24, 2013 ª2013 Elsevier Inc. 249
Transcript of Molecular Cell Article - Home | Department of … Cell Article ... 1Department of Cell Biology,...

Molecular Cell
Article
Frequency-Modulated Pulses of ERK ActivityTransmit Quantitative Proliferation SignalsJohn G. Albeck,1 Gordon B. Mills,2 and Joan S. Brugge1,*1Department of Cell Biology, Harvard Medical School, Boston, MA 02115, USA2Department of Systems Biology, University of Texas M.D. Anderson Cancer Center, Houston, TX 77030, USA
*Correspondence: [email protected]://dx.doi.org/10.1016/j.molcel.2012.11.002
SUMMARY
The EGF-stimulated ERK/MAPK pathway is a keyconduit for cellular proliferation signals and a thera-peutic target in many cancers. Here, we characterizetwo central quantitative aspects of this pathway: themechanism by which signal strength is encoded andthe response curve relating signal output to prolifer-ation. Under steady-state conditions, we find thatERK is activated in discrete, asynchronous pulseswith frequency and duration determined by extracel-lular concentrations of EGF spanning the physiolog-ical range. In genetically identical sister cells, cell-to-cell variability in pulse dynamics influences thedecision to enter S phase. While targeted inhibitionof EGFR reduces the frequency of ERK activitypulses, inhibition of MEK reduces their amplitude.Continuous response curves measured in multiplecell lines reveal that proliferation is effectivelysilenced only when ERK pathway output falls belowa threshold of �10%, indicating that high-dose tar-geting of the pathway is necessary to achieve thera-peutic efficacy.
INTRODUCTION
Signal transduction networks transmit information about the
external environment of the cell and integrate these inputs to
trigger discrete cell fate decisions. The biochemical events in-
volved in signal transduction havebeen studied inmany systems,
providing a detailed view of the molecular paths through which
information flows from cell surface receptors to transcription
factors and other effectors of cell state. However, much less is
known about how quantitative information is transmitted by
these networks. In the simplest cases, the number or fraction of
responding signaling molecules activated inside the cell is
proportional to the extracellular concentration of the stimulating
ligand (Brent, 2009). In other cases, quantitative information
about a constant extracellular stimulus is carried not by the
number of molecules responding (or signal ‘‘amplitude’’), but by
the frequency with which the pool of responding signaling mole-
cules shifts between ‘‘on’’ and ‘‘off’’ states (and thus termed ‘‘fre-
quency modulation’’) (Cai et al., 2008; Hao and O’Shea, 2012).
Mo
While many quantitative studies of signal transduction have
focused on unicellular systems, much remains to be learned in
metazoans, where quantitative signaling properties play a central
role in development and disease. Appropriate responses to
quantitative variations in morphogen gradients are essential
in developmental processes, and detailed ‘‘response curves’’
have been mapped in which cellular response is plotted as
a continuous function of the strength of an upstream signal (Gre-
gor et al., 2007). In cancer, key oncogenes such as c-Myc and
Ras elicit different cellular responses depending on the extent
to which they are activated, but these determinations have
been made for only three to five discrete signal levels (Murphy
et al., 2008; Sarkisian et al., 2007). Continuous signal-response
maps spanning the full dynamic range of output for pathways
involved in tumor growth and survival would facilitate rational
cancer therapy by indicating the level of pathway inhibition
necessary to achieve a biologically significant change in prolifer-
ation rate (Figure 1A).
The EGFR-ERK/MAPK (epidermal growth factor receptor
extracellular-regulated kinase/mitogen-activated protein kinase)
signaling cascade is a central driver of cell proliferation in
many cancers and the target of clinically relevant inhibitors.
While quantitative and systems-level analyses of EGF-stimu-
lated ERK activity have been performed (Amit et al., 2007;
Chen et al., 2009; Nakakuki et al., 2010; Santos et al., 2007;
Sturm et al., 2010; Zwang et al., 2011), these studies have
focused on acute restimulation of cells with growth factors
following a period of withdrawal, which induces ERK signaling
within minutes, followed by proliferation many hours later. This
temporal separation between signal and response obscures
the signal-response relationship because multiple characteris-
tics of the initial signal pulse—including delay, amplitude,
frequency, or duration—may contribute to control of phenotype
(Asthagiri et al., 2000; Traverse et al., 1994). Signaling and prolif-
eration can be more easily related when both processes have
reached steady state (at the population level), because the
magnitude of each can be represented by a single time-indepen-
dent average (Figure 1A). Steady-state conditions also more
accurately model the cellular response to chronic EGF exposure,
which occurs in many physiological and tumor environments.
Here, to understand how quantitative information is trans-
mitted by the EGFR-ERK signaling pathway, we utilize live and
fixed single-cell methods to measure signal strength and dy-
namics under conditions of steady-state EGF stimulation. We
find that this pathway incorporates both frequency- and ampli-
tude-modulated elements: ERK is activated in discrete pulses
lecular Cell 49, 249–261, January 24, 2013 ª2013 Elsevier Inc. 249

Time (hr)
2020.50.1
0.050.010.0020
FIR
E s
igna
l (m
ed.)
unstim.
unstim.
102
Time (hr)
f-GM
NN
+FI
RE
(med
.)
101
A
Time
transient response steadystate
SignalProliferation
stimulation
Signal intensity
Pro
lifer
atio
n ra
teHighEGF
LowEGF
G
EGF (ng/ml)
B
EGF
ERK
Proliferation
Effectors
Live-cell
EKAR-EV
FIRE
RFP-geminin
Fixed-cell
pERK
c-Mycc-FosFra-1
pRb
E
D
inhibition
resp
onse
1
0210 20 40 60 80 100Time (hr)
0 24 48 72 96
0 24 48 72 96
f-GM
NN
+
F
EGF (pg/ml)0 100 101 102 103 104 105
0.0
0.9
f-pR
b+ (s
tead
y st
ate)
medium replacement
medium replacement
medium replacement
unstim.
f-GM
NN
+FI
RE
(a.u
.)
101
Time (hr)
102
0 24 48 72 960
0.6
unstim.
medium replacement
mVenus Fra-1 163-271PPERK/
RSK
101
102
~300%~700%
0 20 40 60 80 100Time (hr)
FIR
E (m
ed.)
100,000 pg/ml EGF
0 EGF
CmVenus Fra-1 163-271
dezilibatsdedargedyldipar
0 20 40 6050
450 DMSO
GefitinibMEKi3
MEKi4
Time (hr)
Inhibitors added
H
JI
0.4
0.2
0
0.6
0.4
0.2
2 1
2
FIR
E (m
ed.)
RFP
-gem
inin
FIR
E (m
ed.)
102
10-1
100
NLS NLS
(legend on next page)
Molecular Cell
Frequency-Modulated ERK Signaling in Proliferation
250 Molecular Cell 49, 249–261, January 24, 2013 ª2013 Elsevier Inc.

Molecular Cell
Frequency-Modulated ERK Signaling in Proliferation
that are integrated to set graded levels of downstream effectors.
We show that inhibitors acting at different levels of the ERK cas-
cade can modify the amplitude or the frequency of ERK activity,
and we use our quantitative measurements to map a continuous
signal-response relationship between ERK pathway output and
proliferation rate across the pathway’s full dynamic range.
RESULTS
ERK Pathway Dynamics at Steady StateWorking with MCF-10A mammary epithelial cells, which require
EGF-stimulated ERK signaling for proliferation (Ethier and Moor-
thy, 1991), we assembled a panel of live-cell and high-content
immunofluorescence (HCIF) measurements for ERK pathway
signaling and proliferation (Figure 1B). ERK activity was moni-
tored by HCIF detection of phosphorylated ERK (pERK) and by
live-cell measurement of a Forster resonance energy transfer
(FRET)-based ERK activity reporter, EKAR-EV, with rapid
response kinetics (Harvey et al., 2008; Komatsu et al., 2011).
Downstream output of the ERK pathway was monitored in fixed
cells by HCIF for ERK effectors, including c-Fos, c-Myc, and Fra-
1, and in live cells by a newly developed live-cell reporter con-
sisting of YFP fused to the PEST domain of Fra-1, termed FIRE
(Fra-1-based integrative reporter of ERK; Figure 1C). Because
phosphorylation by ERK (or the downstream kinase RSK) stabi-
lizes the Fra-1 PEST domain (Casalino et al., 2003; Vial and
Marshall, 2003), FIRE intensity increases by up to 7-fold upon
ERK induction (Figure 1D), and decays upon inhibition of ERK
or EGFR (Figure 1E). Cellular proliferation was monitored by
HCIF detection of phosphorylated Rb protein (pRb) or a gemi-
nin-based live-cell reporter (Sakaue-Sawano et al., 2008), both
of which initiate near the onset of S phase and remain ‘‘on’’ until
the beginning of the next cell cycle (Figure S1 available online).
Control experiments confirmed that the fraction of pRb-positive
(f-pRb+) cells within a population is closely correlated to the
population doubling rate (Figure S1).
Figure 1. Steady-State Signaling and Proliferation in Mammary Epithe
(A) Determining signal-response relationships. Left, a signal-response curve (yello
resulting reduction in proliferation (arrows). Right, this curve can be evaluated usin
EGF concentrations.
(B) EGFR-ERK signaling pathway measurements used in this study.
(C) Design of FIRE. Amino acids 163–271 of Fra-1 were fused in-frame to the C ter
(D) Induction of FIRE fluorescence. Curves depict the median fluorescence inte
untreated (black) cells.
(E) Decay of FIRE fluorescence upon ERK pathway inhibition. MCF-10A cells expr
1 mM gefitinib (EGFR inhibitor), 1 mM PD325901 (MEKi3), or 1 mM PD184161 (ME
a population of 100–1,000 cells for EGF-treated (green) or untreated (black) cells
(F) Live-cell measurements of ERK output (FIRE reporter) and cell cycle progres
stimulated at time 0 with 20,000 pg/ml EGF. Medium was replaced at �24 hr int
(G) Population-level measurements of signaling and proliferation in mammary epit
region indicates the 25th–75th percentile) and the fraction positive for RFP-gemin
treated as in (C). Yellow shaded region indicates a time period over which both FIR
volume culture conditions (see the Experimental Procedures).
(H) Fluctuations in signaling and proliferation under standard culture conditions. M
the Experimental Procedures).
(I) Establishment of multiple proliferative steady states. Cells were treated and a
(J) Percentage of pRb-positive cells at steady state. Error bars indicate standard d
proliferation.
Data shown are from one experiment representative of three or more independe
Mo
Using live-cell imaging, we monitored populations of 200–
1,000 cells over the course of 4 days, allowing individual cells
to be tracked for four to five successive cell cycles (Movie S1).
Although individual cells vary in signaling and cell-cycle status
over the course of the experiment (Figure 1F), it was possible
to maintain the population-average ERK signaling and prolifera-
tion at nearly constant steady-state levels between 48 and 72 hr
after stimulation (Figure 1G). Depletion of EGF from the medium
(resulting in periodic signal decay, Figure 1H) was prevented by
use of a high ratio of medium to cells (Kim et al., 2009; Knauer
et al., 1984). Using a range of EGF concentrations, we estab-
lished a series of steady-state conditions under which quantita-
tive characteristics of ERK signaling could be linked to prolifera-
tion rates ranging from �3% to �80% pRb-positive (Figures 1I
and 1J).
We next measured ERK network states associated with each
EGF concentration under steady-state conditions (58–60 hr after
stimulation). HCIF imaging of Fra-1 revealed a detectable range
for pathway output of�15-fold, with unimodally distributed pop-
ulations of cells indicative of a graded change in signal strength
in response to increasing EGF (Figure 2A). Similar behavior was
observed with other ERK effectors including c-Fos, c-Myc, and
Ets-1 (Figure S2). In contrast to its downstream targets, pERK
exhibited a bimodal staining pattern, in which the fraction of cells
in the positive peak varied as a function of EGF, implying all-or-
none regulation. Paradoxically, at intermediate EGF concentra-
tions in which only a subset of cells were positive for pERK or
pRb, the pERK-positive (pERK+) population did not correlate
with the pRb-positive population (pRb+; Figures 2B and 2C),
despite the absolute requirement of ERK activity for cell-cycle
progression.
This apparent discrepancy was resolved by dynamic analysis
of EKAR-EV, the live-cell ERK activity reporter. EKAR-EV dis-
played intermittent bursts of activity alternating with periods of
low activity, at a frequency dependent on the concentration of
EGF (Figures 3A and 3B). EKAR-EV emission ratios in the
lial Cells
w) relates the strength of pharmacological signal inhibition (e.g., of ERK) to the
g steady-statemeasurements of signal intensity and proliferation rate at various
minus of mVenus, with a nuclear localization sequence (NLS) at the N terminus.
nsity for populations of 100–1,000 cells treated with EGF at time 0 (green) or
essing FIRE were grown in the presence of 20,000 pg/ml EGF and treated with
Ki4) at the indicated time. Curves depict the median fluorescence intensity for
. Associated time-lapse images are shown in Movie S1.
sion (RFP-geminin) in a single cell deprived of growth factors for 48 hr and re-
ervals (dashed lines).
helial cells. Curves represent themedian intensity of FIRE signal (green; shaded
in (f-GMNN+, red) as determined by automated live-cell microscopy for cells
E and f-GMNN+ signals remain stable. Measurements were made under high-
easurements were performed as in (G), with standard culture conditions (see
nalyzed as in (G), with varying concentrations of EGF.
eviation of six replicates. See Figure S1 for characterization of pRb dynamics in
nt replicates. See also Figure S1 and Movie S1.
lecular Cell 49, 249–261, January 24, 2013 ª2013 Elsevier Inc. 251

pERK Fra-1 c-Myc pRbEGF
(pg/ml)
0
10
2000
200
50
A
B
pERK pRbDAPI
2000 pg/ml EGF200 pg/ml EGF0 ng/ml EGF
1%
8%
21%
55%
83%1.0
0.47
Intensity (a.u.) Intensity (a.u.) Intensity (a.u.) Intensity (a.u.)
0.15
0.08
0.07
1.0
0.72
0.33
0.18
0.120%
5%
14%
54%
98%103 104
pERK intensity (a.u.)
pRb
inte
nsity
(a.u
.)
102
22% 21%
21% 36%
103
104
102
C
102 103 104 103 104 103 104 101 102 103
Figure 2. Signaling States under Chronic EGF Stimulation
(A) Mammary epithelial cells were treated as in Figure 1G, fixed at 58 hr after treatment, and analyzed for the indicated proteins by HCIF. Histograms indicate the
distribution for a population of >5,000 cells; the distribution in the absence of EGF is shown in gray for comparison. See Figure S2 for HCIF analysis of additional
proteins.
(B) Representative HCIF images for cells analyzed as in (A).
(C) Quantitation of pRb+,pERK– cells cultured at steady state with 200 pg/ml EGF and analyzed as in (A).
Data shown are from one experiment representative of three or more independent replicates. See also Figure S2 and Movie S2.
Molecular Cell
Frequency-Modulated ERK Signaling in Proliferation
nucleus and cytoplasm were closely correlated (Figure 3C), and
pERK staining was distributed throughout the cell (Figure 3D),
suggesting that activity pulses were not constrained to specific
subcellular domains. EKAR-EV pulses were sporadic in the
absence of EGF, while low concentrations of EGF induced iso-
lated bursts lasting 20–30 min (mean 27 min) interspersed by
dormant periods of 1–4 hr (Figure 3A). With increasing concen-
trations of EGF, pulses increased in duration and decreased in
spacing, with individual bursts becoming indistinguishable at
higher concentrations of EGF (>200 pg/ml). Thus, pRb+/pERK–
cells can be observed at low EGF concentrations because the
population of ERK molecules within the cell alternates between
‘‘on’’ (mostly active) and ‘‘off’’ (mostly inactive) states at least
10 to 20 times during a single cell cycle. Because essentially
all cells within the population display pulsatory behavior (Fig-
ure 3B and Movie S2), the fraction of pERK+ cells observed by
HCIF reflects the average fraction of time spent in the ‘‘on’’ state
by each cell.
Control of S Phase Entry by ERK PulsesTo understand how sporadic pulses of ERK activity at low EGF
concentrations affect S phase entry, we employed MCF-10A
cells coexpressing EKAR-EV and RFP-geminin (Movie S3). To
limit the effects of genetic variability, local variation in media
252 Molecular Cell 49, 249–261, January 24, 2013 ª2013 Elsevier Inc
factors, and cell-cycle position, we analyzed sister cell pairs
in which one sister cell entered S phase at least 5 hr prior to
the other sister (Figures 4A and S3). Pulses of ERK activity
were identified with a combination of automated and manual
scoring (Figure 4B), and ERK activity profiles for 223 sister
cell pairs were aligned by the time of RFP-geminin induction
(Figure 4C). Analysis of the aligned profiles revealed a shift in
ERK pulse dynamics specific to the time interval preceding
S phase entry: median pulse length rose sharply at �12 hr prior
to RFP-geminin induction among the cells entering S phase, but
not in the corresponding sister cells. This increase in pulse
length suggested that longer periods of ERK activity stimulate
S phase entry.
To test this idea, we performed a statistical analysis of the
mean pulse length per cell, the longest pulse in each cell, and
the fraction of time spent in the ERKon state. All of these metrics
were significantly greater in the earlier-committing cell (‘‘cell 1’’)
for both the 12 hr immediately preceding S phase entry and for
the entire interval between the previous mitosis and S phase
entry, although the differences were largest within the 12 hr
period (Table S1). When cell 1 and cell 2 populations were
compared as a whole (Figure 4D), mean pulse length and longest
pulse were�50% larger in the cell 1 population (1.8 versus 1.2 hr
for mean pulse; 3.8 versus 2.6 hr for longest pulse) and the
.
AE
KA
R
EK
AR
E
KA
R
EK
AR
0 pg/ml EGF
10 pg/ml EGF
50 pg/ml EGF
200 pg/ml EGF
cells
Time (hr) 0784
0 pg/ml EGF
10 pg/ml EGF
50 pg/ml EGF
200 pg/ml EGF
B
−1.3
−1.2
−1.1
−1
−1.2
−1.1
−1
−1.2
−1.1
−1
−1.2
−1.1
−1
48 72Time (hr)C
D
ERK activity (EKAR)low high
cells
cells
cells0 20−0.75
−0.65
−0.55
Time (hr)
nucleuscytosol
20 pg/ml EGF
DAPI pERK Merge
EK
AR
Figure 3. EGF-Stimulated, Frequency-Modulated ERK Activity Pulses
(A and B) ERK activity in single cells under steady-state conditions. Individual MCF-10A cells expressing EKAR-EV were treated as in Figure 1G and imaged from
48 to 70 hr after stimulation. (A) EKAR-EV signal (CFP/YFP ratio) for single cells; note that the y axis is inverted as ERK activity induces a decrease in CFP/YFP
ratio. (B) EKAR-EV signal for 29 cells in each EGF concentration; each row in the heatmaps represents one cell. Data shown are from one experiment repre-
sentative of five independent replicates. Associated time-lapse imaging is shown in Movie S2.
(C) Comparison of nuclear and cytosolic ERK activity for an individual cell. Cells stably expressing EKAR-EV were transferred from full growthmedium to 20 pg/ml
EGF immediately prior to imaging. The ratio of CFP/YFP fluorescence wasmeasured in discrete regions within the nucleus or cytosol; results are representative of
all cells examined.
(D) Immunofluorescence of phospho-ERK under steady-state conditions. MCF-10A cells were grown in the presence of 20 pg/ml EGF for 60 hr prior to fixation
and staining. Note that in pERK-positive cells, pERK is present throughout the cell.
Molecular Cell
Frequency-Modulated ERK Signaling in Proliferation
fraction of time spent in the ERKon state was greater (70% versus
56%). Comparison of the same pulse parameters within each
pair also revealed a highly significant enhancement of ERKon
time for cell 1 (Figure 4E). In contrast, the number of pulses in
cell 1 was smaller than in cell 2 for the majority of pairs (Table
S1), suggesting that the length of time spent in the ERKon state,
and not the number of pulses, is a significant determinant of each
cell’s decision to enter S phase.
Mo
Modulation of EGFR-ERK Pathway Dynamics byInhibitorsTo understand the role of ERK dynamics in response to pharma-
cological inhibition,weevaluated theeffects of theEGFR inhibitor
gefitinib or the highly selective MAPK/ERK kinase (MEK) inhibitor
PD0325901 (PD) (Bain et al., 2007). Similar to titration with
EGF, varying concentrations of gefitinib produced a bimodal shift
in pERK intensity measured by HCIF (Figure 5A). In accord, live
lecular Cell 49, 249–261, January 24, 2013 ª2013 Elsevier Inc. 253

-40 -35 -30 -25 -20 -15 -10 -5 0
Mitoticexit
cells
Time relative to S-phase entry (hr) Time relative to sister’s S-phase entry (hr)
0 10 20 30 40
EKAR- daughter cell 1
EKAR- daughter cell 2
RFP-GMNN cell 1
cell 2
A B
E
C
D
Mitoticexit
-40 -35 -30 -25 -20 -15 -10 -5 0-45
med
. pul
sele
ngth
(hr)
0
6
)rh(sisotimecnisemiT)rh(sisotimecnisemiT
0 1-1Log10 ratio (cell 1/cell 2)cell 1 cell 2
p<10-4
p<10-6
-450
6
global median
Mean pulselength (hr)
Longest pulse(hr)
Fraction EKARon time
12
8
4
0cell 1 cell 2 cell 1 cell 2
12
8
4
0
1.0
0.8
0.6
0.4
0.9
0.7
0.5
0.3
0.2
0.1
Mean pulselength (hours)
Longest pulse(hours)
FractionEKARon time
Cell 2 greater or equal Cell 1 greater
# of
pai
rs
1.55.05.1- -0.5
# of
pai
rs#
of p
airs
S-phase entry (R
FP-gem
inin)
global median
p<10-15
EKARon EKARoff
15 20 25 30
EK
AR
EK
AR
EKARon detected
1
2
1
2
Figure 4. Stimulation of Cell-Cycle Progression by Sustained ERK Activity Pulses
(A) Imaging of ERK activity pulses and cell-cycle progression. MCF-10A cells expressing EKAR-EV and RFP-geminin were imaged in the presence of 50 pg/ml
EGF. Pairs of sister cells were analyzed in which one sister cell entered a subsequent round of DNA replication (as indicated by RFP-geminin induction) >5 hr prior
to the other sister. One representative cell pair is shown; see Figure S3 and Movie S3 for additional examples and time-lapse images.
(B) Automatic detection of ERK activity pulses. Top, regions of increased EKAR-EV activity (red circles) identified by a peak detection algorithm for a repre-
sentative cell pair. Bottom, heatmap of EKAR-EV signal in the same cell pair, with binary EKAR-EV values (solid blue and yellow) shown for each pair.
(legend continued on next page)
Molecular Cell
Frequency-Modulated ERK Signaling in Proliferation
254 Molecular Cell 49, 249–261, January 24, 2013 ª2013 Elsevier Inc.
Molecular Cell
Frequency-Modulated ERK Signaling in Proliferation
imaging of EKAR-EV upon gefitinib addition revealed complete
inhibition of the EGF-induced signal at high gefitinib concentra-
tions, but pulsatory behavior at intermediate concentrations (Fig-
ure 5B). These data, taken from cells stimulated with saturating
levels of EGF, demonstrate that ERK activity pulses are not
simply the result of fluctuations in the local concentration of
EGF, but are intrinsic to the intracellular signaling machinery.
In contrast to gefitinib, and in agreement with previous work
(Komatsu et al., 2011), titration of EGF-saturated cells with PD
resulted in a unimodal shift from high pERK intensity to low
(Figure 5A). Consistent with these data, live imaging revealed
a graded reduction in EKAR-EV intensity upon PD treatment,
rather than pulsatory behavior (Figure 5B). Using combinations
of EGF and PD (Figure 5C), it was possible to modulate both
the frequency and amplitude of ERK signaling simultaneously:
at 10 nM PD and 50–100 pg/ml EGF, for example, pERK retained
its bimodal pattern but the intensity of the ‘‘on’’ population
decreased by�30%. Thus, ERK activity is frequency modulated
(FM) by quantitative variation in receptor activity but amplitude
modulated (AM) by changes in MEK activity.
Integration of ERK Dynamics by Downstream EffectorsBecause ERK activity can vary in both amplitude and frequency,
measuring the integrated activity level of ERK directly poses
technical challenges. We therefore turned to downstream effec-
tors as potential indicators of integrated ERK pathway output,
focusing on Fra-1 because it displayed the largest measurable
dynamic range (Figure S2). To understand how unimodal distri-
butions of Fra-1 arise downstream of FM ERK activity, we per-
formed a kinetic analysis of changes in effector concentration.
When cells growing in full growth medium were treated with
MEK inhibitor, ERK phosphorylation was fully abrogated within
10min, while Fra-1 levels decayed slowly (t1/2 > 12 hr; Figure 6A).
A simplified kinetic model of Fra-1 stabilization based on re-
ported half-lives for phosphorylated Fra-1 (Casalino et al.,
2003) and pERK (Kleiman et al., 2011) was consistent with these
decay times (Figure 6B; see the Supplemental Experimental
Procedures and Tables S2 and S3 for details of model construc-
tion). Using the rate of phosphorylation of ERK as an input
parameter to the model, we simulated the experimentally ob-
served patterns of ERK pulses and found that the level of Fra-1
changed in a graded manner as a function of ERK frequency
(Figures 6C and 6D). This simulated behavior is consistent with
the observation that the median intensity of Fra-1 changes in
a graded manner as the frequency of ERK pulses varies (Fig-
(C) Patterns of EKAR-EV pulse dynamics prior to S phase entry. Binarized EKAR-E
the interval between the previous mitosis (green lines) and the subsequent induc
sponding sister cells not entering S phase are shown at right. At bottom, the me
indicates the overall median pulse length for all cells. Cyan line indicates 12 hr prior
cell 1 population.
(D) Distribution of ERK activity parameters in cells committing to S phase earlier (c
ERKon state were calculated for each cell within the 12 hr preceding RFP-gemin
indicate the median, boxes the 25th–75th percentile, dashed lines the total range,
analysis.
(E) Pairwise comparison of ERK activity parameters. For each pair of sister cells, t
(cell 2) committing cells was calculated. The logarithm of the cell 1/cell 2 ratio wa
parameter was larger in cell 1 (pink, > 0) or in cell 2 (blue, % 0). p values were ca
Data shown are collated from three independent experiments (n = 24, 59, and 1
Mo
ure 2A). The model also predicts that variation over time in
ERK pulse frequency, which is observed in individual cells
(Figures 3A and 3B) would result in slow fluctuations in Fra-1
(Figure 6E). This prediction is confirmed in individual cells ex-
pressing the Fra-1-based FIRE reporter; at concentrations of
EGF under which ERK activity is highly pulsatory (50 pg/ml;
see Figure 3A), fluctuations in Fra-1-based FIRE intensity
occurred on a much slower time scale (�12 hr; Figure 6F). The
sporadic nature of ERK activity pulses at intermediate EGF
concentrations should also result in increased variability in
effector expression, which is indeed observed as a broader
distribution of Fra-1 and c-Myc at 50 pg/ml EGF (Figure 2A).
Because the fraction of time spent in the ERKon state controls
entry to S phase (see Figure 4), our model would further predict
that individual cells with higher Fra-1 levels, which have experi-
enced a greater integrated ERKon time, would be more likely to
enter S phase. To test this idea, we analyzed immunofluores-
cence data from a population of cells treated with intermediate
levels (50 pg/ml) of EGF. Fra-1 expression was divided into
bins, and the cells at each Fra-1 level were assessed for the
frequency of pRb staining (Figure 6G,H). Across the range of
Fra-1 levels, the fraction of pRb+ cells increased from <0.05 at
low Fra-1 to >0.6 at high Fra-1. These data confirm that varia-
tions in ERK pulse activity, which are integrated over a 12–
24 hr window by Fra-1 expression, strongly influence the prolif-
erative activity of individual cells.
The correlation of Fra-1 intensity with both the frequency of
pERK+ cells under FM conditions and the intensity of pERK
staining under AM conditions (Figure 7A) makes it a useful
steady-state indicator of ERK pathway output independent of
ERK dynamics. Across a wide range of EGF and PD concentra-
tions, we compared ERK pathway output (measured by steady-
state Fra-1 intensity) to proliferation rate (measured by f-pRb+;
Figures 7B and 7C). Strikingly, these data fit a single curvilinear
relationship, suggesting that ERK output is the main quantitative
factor controlling steady-state proliferation within this system.
The inverted ‘‘L’’ shape of this relationship indicates that at low
levels of ERK pathway output (yellow region in Figure 7C), small
changes in signal intensity correspond to large changes in prolif-
erative rate, while large changes in signal intensity near the high
end of the dynamic range have little impact on proliferation. This
relationship predicts, and experiments confirm (Figures 7D and
7E), that under saturating concentrations of EGF, inhibition of
up to 85% of ERK output will have less than a 2-fold effect on
proliferation rate. However, once this threshold of inhibition is
Vmeasurements for 223 cells were ordered from top to bottom by the length of
tion of RFP-geminin (red line) in the first cell of the pair (cell 1, left); the corre-
dian EKARon pulse length for a sliding time window is shown; the dotted line
to RFP-geminin induction, wheremedian pulse length increases sharply for the
ell 1) or later (cell 2). Mean pulse length, longest pulse, and fraction of time in the
in induction (for cell 1), and within the same 12 hr period for cell 2. Red lines
and (+) the outliers for each population. See Table S1 for values and additional
he ratio of the indicated ERK pulse parameters for the earlier- (cell 1) and later-
s plotted as a histogram to show the frequency of pairs in which the indicated
lculated with a paired t test.
40). See also Figure S3, Table S1, and Movie S3.
lecular Cell 49, 249–261, January 24, 2013 ª2013 Elsevier Inc. 255

C
A0
0.5
1
2
5
10
20
50
100
PD (nM)
pERKpERK
0
2
5
10
20
50
100
200
500
gefitinib (nM)
102 103 104102 103 104
0 5 10 15−0.95
−0.6
−0.95
−0.6
EK
AR
Time (hr)
20,000 pg/ml EGF +
DMSO100 nM gefitinib
1000 nM gefitinib
B
0
pERK102 103 104
pERK102 103 104
pERK102 103 104
pERK102 103 104
50 100 20,000
+DM
SO
+10
nM P
D
EGF (pg/ml)
EK
AR
DMSO3 nM PD
100 nM PD
20,000 pg/ml EGF +
Figure 5. Modulation of ERK Frequency and Amplitude by Signaling
Inhibitors(A) Distributions of pERK at steady state in the presence of 20,000 pg/ml EGF
and the indicated concentrations of inhibitors. Histograms represent >5,000
cells measured by HCIF after 48 hr of treatment with the indicted inhibitors. For
gefitinib-treated cells, vertical red line represents the division between pERK+
and pERK– cells. For PD-treated cells, vertical red lines indicate the approxi-
mate median pERK fluorescence intensity (or ‘‘amplitude’’).
(B) Live-cell measurements of EKAR-EV signal (CFP/YFP ratio) upon EGFR
or MEK inhibition. Mammary epithelial cells growing in the presence of 20,000
pg/ml EGF were treated with the indicated concentrations of inhibitors
immediately prior to imaging at time 0.
(C) Simultaneous modulation of pERK frequency and amplitude. Cells were
grown at steady state with the indicated concentrations of PD and EGF and
Molecular Cell
Frequency-Modulated ERK Signaling in Proliferation
256 Molecular Cell 49, 249–261, January 24, 2013 ª2013 Elsevier Inc
passed, proliferation declines rapidly; 95% inhibition is sufficient
to reduce proliferation by 10-fold. Similar curves were measured
for 184A1 cells, an unrelated mammary epithelial cell line dis-
playing similar ERK activity patterns to MCF-10A (Figures 7F
and S4), and for SUM159, a triple-negative breast cancer line
dependent on ERK for proliferation (Figure 7G). Although the
slopes of these curves vary, in all cases the relationship between
ERK output and proliferation is nonlinear and steepest at the
lower end of the ERK dynamic range.
DISCUSSION
Information Transfer from EGFR to the Cell CycleThe EGFR-ERK system functions to relay information about
the extracellular concentration of growth factor ligands to the
core cell cycle circuitry; here we trace the representation of
quantitative information along this pathway with single-cell
methods. At the level of ERK, we find that the steady-state
concentration of EGF is represented by the frequency and
duration of pulses of ERK activity. At the next stage of the
pathway, expression levels of effectors such as Fra-1 and
c-Myc are controlled by ERK activity via an integrative pro-
cess, such that the total levels of these proteins are pro-
portional to the frequency of ERK activity pulses. From a
measurement perspective, exploiting this integrative control
by fusing phosphorylation-regulated degradation domains to
a fluorescent protein, such as in the FIRE reporter, represents
an underutilized approach to generating high dynamic range
biosensors for kinase activity. Finally, at the cell fate level,
the average rate of entry into the S phase of the cell cycle, a
commitment that is made discrete by positive feedback loops
(Yao et al., 2008), displays a nonlinear dependence on the
output of the ERK pathway.
We examined the quantitative relationship between ERK ac-
tivity and proliferation rate at two different scales. At the level
of individual cells (Figure 3), the pattern of ERK activity is unique
for each cell, and the total duration of ERK pulses regulates the
rate of entry into S phase (Figure 4). This trend may reflect the
existence of downstream network motifs that respond preferen-
tially to sustained ERK activity (Murphy et al., 2002; Yamamoto
et al., 2006). Our analysis of cell-wide changes in ERK activity
likely overlooks subtle effects of ERK activity localization (Har-
ding et al., 2005). Moreover, competition of EKAR-EV with en-
dogenous substrates for ERK and phosphatases, may perturb
the output of the system, which is sensitive to substrate levels
(Kim et al., 2011). Population-level studies have identified dis-
tinct periods of competency for cell-cycle induction by ERK
(Jones and Kazlauskas, 2001; Zwang et al., 2011); an individual
cell’s decision to enter into S phase may depend on the extent
that its unique pattern of ERK pulses falls within these windows
of competency, or on the timing of ERK pulses relative to other
signaling events. At the population scale, however, data from
analyzed by HCIF. Dashed lines indicate the approximatemedian of the pERK-
positive population; a shift in this value indicates decreased amplitude of the
ERK-on state.
Data shown are from one experiment representative of two or more inde-
pendent replicates.
.
0 5 10 15 20 25
104
103
pERKFra-1
sign
al (a
.u.)
MEK inhibitor added
Time (hr)
FIR
E s
igna
l
BA
C D
FEpERK frequency
stea
dy-s
tate
[Fra
-1]
Fra-1pERK
0 24 48 72
0
105
Time (hr)0
105
Fra-
1(m
olec
/cel
l)
pER
K
Fra-
1(m
olec
/cel
l)
0
106
0
106
pER
K10-2 10-1 100
105
104
0 24 48 72Time (hr)
960
105
Fra-
1(m
olec
/cel
l)
0
106
pER
K
pERKFra-1
MEK inactivation
0 10 20 30
100
10-1conc
. (no
rm.)
Time (hr)Time (hr)
G
).u.a( ytisnetni 1-arF).u.a( ytisnetni 1-arF
pRb
inte
nsity
(a.u
.)
fract
ion
pRb+
0
1H
0 20 40 60 80 100
102 103 104102 103 104102
103
104
Fra-1pERK
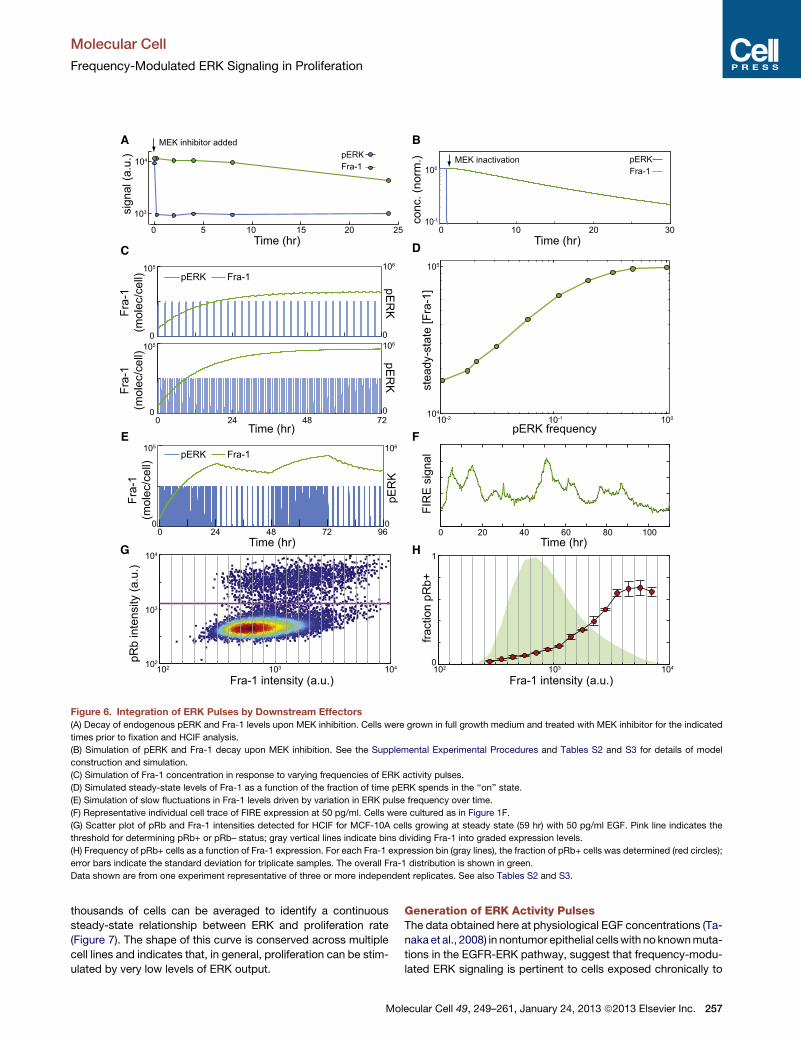
Figure 6. Integration of ERK Pulses by Downstream Effectors
(A) Decay of endogenous pERK and Fra-1 levels upon MEK inhibition. Cells were grown in full growth medium and treated with MEK inhibitor for the indicated
times prior to fixation and HCIF analysis.
(B) Simulation of pERK and Fra-1 decay upon MEK inhibition. See the Supplemental Experimental Procedures and Tables S2 and S3 for details of model
construction and simulation.
(C) Simulation of Fra-1 concentration in response to varying frequencies of ERK activity pulses.
(D) Simulated steady-state levels of Fra-1 as a function of the fraction of time pERK spends in the ‘‘on’’ state.
(E) Simulation of slow fluctuations in Fra-1 levels driven by variation in ERK pulse frequency over time.
(F) Representative individual cell trace of FIRE expression at 50 pg/ml. Cells were cultured as in Figure 1F.
(G) Scatter plot of pRb and Fra-1 intensities detected for HCIF for MCF-10A cells growing at steady state (59 hr) with 50 pg/ml EGF. Pink line indicates the
threshold for determining pRb+ or pRb– status; gray vertical lines indicate bins dividing Fra-1 into graded expression levels.
(H) Frequency of pRb+ cells as a function of Fra-1 expression. For each Fra-1 expression bin (gray lines), the fraction of pRb+ cells was determined (red circles);
error bars indicate the standard deviation for triplicate samples. The overall Fra-1 distribution is shown in green.
Data shown are from one experiment representative of three or more independent replicates. See also Tables S2 and S3.
Molecular Cell
Frequency-Modulated ERK Signaling in Proliferation
thousands of cells can be averaged to identify a continuous
steady-state relationship between ERK and proliferation rate
(Figure 7). The shape of this curve is conserved across multiple
cell lines and indicates that, in general, proliferation can be stim-
ulated by very low levels of ERK output.
Mo
Generation of ERK Activity PulsesThe data obtained here at physiological EGF concentrations (Ta-
naka et al., 2008) in nontumor epithelial cellswith no knownmuta-
tions in the EGFR-ERK pathway, suggest that frequency-modu-
lated ERK signaling is pertinent to cells exposed chronically to
lecular Cell 49, 249–261, January 24, 2013 ª2013 Elsevier Inc. 257

C
ERK output (med. Fra-1)
100
10-1
10-2
103
~2-fold ~7-fold
f-pR
b+
PD
(nM
) 013
10
MCF-10A
highlowEGF
20,000 pg/ml EGF
p-ERKDAPI
p-RbDAPI
PD (nM): 0 0.5 1 2 5 10 20 50 100 1000
Fra-1DAPI
B
D
PD (nM):01310
A
med
. Fra
-1EGF (pg/ml)
0 100 101 102 103 104
f-pR
b+
100
10-1
103
10-2
10-3
104
10-1 100
10-1
100 FM conditions(% pERK-positive)
AM conditions(median ERK intensity)
pERK
Fra-
1 in
tens
ity
10-2
102 103 104
10-2
10-1
100
10-4
10-3
FE 184A1 SUM159
103 10410-2
10-1
100
f-pR
b+
f-pR
b+G
PD (nM)
pRb (% pos.)
Fra-1 (med.)
0
1.0
0.8
1.2
0.4
0.6
0.2
0.0
-0.2
pERK (med.)
fract
ion
of m
ax
100 101 102 103
ERK output (med. Fra-1) ERK output (med. Fra-1)
Figure 7. Signal-Response Relationship between ERK Output and Proliferation Rate
(A) Correspondence between Fra-1 intensity and pERK at steady state. HCIFmeasurements for Fra-1 intensity were plotted against the fraction of pERK-positive
cells under FM conditions (titration of EGF) or median pERK intensity under AM conditions (titration of PD) at steady state (48 hr).
(B) HCIFmeasurements of Fra-1 intensity and f-pRb+ for combinations of EGF and PD under steady-state conditions (48 hr). Values represent themean, and error
bars the SD, for triplicate wells with >5,000 cells each.
(C) Relationship between ERK output (Fra-1 intensity) and f-pRb+ for the measurements shown in (B), as indicated by symbol shape and color. The yellow region
indicates the segment of the dynamic range over which proliferation changes rapidly as a function of ERK pathway output.
(D) Representative HCIF images of pERK, Fra-1, and pRb of mammary epithelial cells at steady state (60 hr after stimulation) in the presence of 20,000 pg/ml EGF
and varying concentrations of PD.
(E) Quantitation of fluorescence for images shown in (D). Error bars represent the SD of triplicate wells.
(F and G) Relationship between ERK output (Fra-1 intensity) and f-pRb+ for 184A1mammary epithelial cells and SUM159 breast cancer cells. Cells were grown in
varying concentrations of EGF and PD for 48 hr prior to fixation and staining. pRb and Fra-1 were measured and plotted as in (C).
Data shown are from one experiment representative of two or more independent replicates. See also Figure S4.
Molecular Cell
Frequency-Modulated ERK Signaling in Proliferation
EGF within normal epithelia. The bursts of ERK activity observed
here are distinct from highly regular, frequency-invariant oscilla-
tions in ERK localization (Shankaran et al., 2009) and damped
258 Molecular Cell 49, 249–261, January 24, 2013 ª2013 Elsevier Inc
oscillations immediately after EGF stimulation (Cohen-Saidon
et al., 2009; Nakayama et al., 2008). While the capacity of
ERK to respond in an all-or-none manner has been noted
.

Molecular Cell
Frequency-Modulated ERK Signaling in Proliferation
(Altan-Bonnet and Germain, 2005; Das et al., 2009; Markevich
et al., 2004; Qiao et al., 2007; Sturm et al., 2010), we show that
transitions between the ‘‘on’’ and ‘‘off’’ state are rapid and enable
a distinct mode of signaling for a central physiological regulator
of proliferation. The importance of frequency modulation for
signaling within this ubiquitous pathway mirrors similar findings
in other pathways (Lahav et al., 2004; Tay et al., 2010) and
suggests that FM signaling may be a widely used strategy for
information transfer in mammalian cells.
Theoretical modeling of oscillations and bistability in the ERK
pathway suggest that negative feedback is central in this
behavior (Kholodenko, 2000; Markevich et al., 2004). There are
several negative feedback pathways that may be involved,
including internalization of activated EGFR (Wells et al., 1990),
transcriptional activation of multiple dual specificity phospha-
tases (DUSPs) (Amit et al., 2007), stabilization of MKP1/DUSP1
by ERK-mediated phosphorylation (Brondello et al., 1997; Bron-
dello et al., 1999), and inhibitory phosphorylation of SOS (Lan-
glois et al., 1995), Raf (Brummer et al., 2003; Dougherty et al.,
2005), or MEK (Pages et al., 1994) by ERK. Positive feedback
may also control the rapid onset of ERK pulses and may arise
from the allosteric activation of SOS by GTP-bound Ras (Boyke-
visch et al., 2006; Margarit et al., 2003), phosphorylation of RKIP
by ERK (Shin et al., 2009), phosphorylation-induced degradation
of the MKP-3 (Marchetti et al., 2005), or stimulatory phosphory-
lation of Raf by ERK (Balan et al., 2006). The presence of many
redundant feedback pathways complicates analysis of the roles
of individual processes. However, given the �5–10 min time-
scale of ERK pulse induction and inactivation, feedbacks involv-
ing direct phosphorylation events are more likely to be involved
in pulse generation than slower processes involving transcrip-
tion, degradation, or receptor internalization.
Interpretation of Quantitative Changes in ERK SignalingERK phosphorylation and activity are frequently measured as
indicators of the activity of upstream oncogenes such as re-
ceptor tyrosine kinases or Ras. Very often, however, the impact
on cell phenotype of an observed change in ERK activity is not
clear; for example, what does a 2-fold change in pERK signify
for the cell?Our analysis of response curves provides aprototype
for translating such measurements of signal strength into ex-
pected cellular behaviors. However, the nonlinear nature of the
response curves measured here implies that the significance of
a quantitative difference cannot be established without knowing
in what region of the dynamic range ERK is operating. A 2-fold
change in ERK activity near the top of the dynamic range may
have little effect on proliferation, while a 2-fold effect on ERK
activity near the bottom of the dynamic range may stimulate a
5-fold change in proliferation rate. This characteristic under-
scores the need for quantitative techniques for measuring sig-
naling events. Transfer curves, which describe the input-output
behavior of system components, are ubiquitous and essential
in electrical and systems engineering; measurement of analo-
gous relationships for mammalian signaling systems will be
a key step in developing clinically useful predictive models.
The quantitative characteristics of information transfer in the
ERK network determined here suggest several avenues for clin-
ical intervention in tumors dependent on this pathway for growth.
Mo
Because inhibition of up to 85% of ERK output has little effect on
proliferation (a finding consistent with clinical data [Bollag et al.,
2010]), our findings provide rationale for combined inhibition of
multiple nodes in the ERK pathway, to constrain ERK output
below the threshold required for proliferation. Alternatively, it
may be advantageous to identify agents that shift the quantita-
tive relationship between ERK output and proliferation, such
that less stringent ERK inhibition is required; the quantitative
methods developed here will be of use in identifying such
compounds. Finally, as prolonged ERK activation is more effec-
tive in committing a single cell to proliferate (Figures 4D and 4E),
intermittent high-dose inhibition may provide a usable thera-
peutic index.
EXPERIMENTAL PROCEDURES
Experimental Culture Conditions
Signaling and proliferation experiments were performed in glass-bottom 12-,
24-, or 96-well plates (Mat-Tek, Matrical). For ‘‘standard’’ culture conditions
(Figure 1H only), the entire well bottom was pretreated with type I collagen
(BD Biosciences) to promote cell adherence and seeded with 2,500–5,000
cells/well in 200 ml culture medium (in a 96-well plate). To reduce the effect
of cell-mediated EGF depletion, all other experiments were performed in
‘‘high-volume’’ culture conditions, in which wells were pretreated with a 3–
10 ml droplet of collagen solution (depending on the size of the plate) to create
a region of high adherence�2–4 mm in diameter (area�0.03–0.12 cm2). Cells
(2 3 103–1 3 104) were then seeded directly on the collagen-coated region;
during the course of the experiments, cells remained confined to the coated
region, within which they were 50%–100% confluent. Wells were then filled
with the practical maximum volume of medium (0.4, 2.5, or 5 ml/well in 96-,
24-, or 12-well plates, respectively) and replenished daily by removing 80%
of the culture volume and adding an equivalent volume of fresh medium.
For steady-state experiments, cells were initially plated in full growth
medium to promote adherence, and then shifted to GM-GFS for 2 days. After
this starvation period, mediumwas replaced with GM-GFS supplementedwith
varying concentrations of EGF; this time point is designated ‘‘time 0.’’ For the
duration of the experiment (up to 96 hr), medium was replaced daily as
described above. Importantly, while serum and insulin are required for long-
term propagation of MCF-10A cells, we found that these cells will proliferate
normally in response to EGF alone for at least 2 weeks (data not shown). All
steady-state experiments were performed within this time window to enable
EGF-stimulated signaling and proliferation to be analyzed in isolation from
signals induced by insulin or growth factors present in the serum.
For sister-cell experiments, cells were plated as above in full growthmedium
and shifted to GM-GFS supplemented with 50 pg/ml EGF immediately prior to
beginning live-cell microscopy. This protocol allowed a large fraction of the
population to enter S/G2 phase and become poised for cell division prior to
imaging; cells dividing during the imaging phase were identified manually
immediately following division and then tracked using automated routines
(see below) through their subsequent cell cycles.
Live-Cell Microscopy
Time-lapse images were captured with a 203 0.75 NA objective on Nikon
Eclipse Ti or Applied Precision Instruments Deltavision inverted fluorescence
microscopes fitted with environmental chambers; cells were maintained at
37�C and�5%CO2for the duration of the experiments. Images were collected
at intervals of 5–20minwith a Hammamatsu Orca-ER digital camera with 23 2
binning. For higher-frequency imaging (<10 min intervals), neutral density
filters were used to reduce phototoxicity.
High-Content Immunofluorescence
After growth and treatment as indicated on glass-bottom 96-well plates, cells
were fixed for 15 min at room temperature with a freshly prepared solution of
2% paraformaldehyde in PBS and permeabilized with 100% methanol; rapid
lecular Cell 49, 249–261, January 24, 2013 ª2013 Elsevier Inc. 259

Molecular Cell
Frequency-Modulated ERK Signaling in Proliferation
fixation was essential to prevent decay of the pERK signal. Samples were then
stained with primary and secondary antibodies and scanned on an Applied
Precision Cellworx instrument with a 103 objective.
Image Processing
Immunofluorescence image analysis and was performed in MATLAB as
previously described (Worster et al., 2012), with routines derived from the
CellProfiler platform (Lamprecht et al., 2007). In brief, image segmentation
was performed on the nuclear (DAPI-stained) image for each field; after back-
ground subtraction, the fluorescence intensity for each channel was calcu-
lated as the mean pixel value for either the nuclear or cytoplasmic region of
each cell.
Population-level live-cell analysis of FIRE and RFP-geminin was performed
as for immunofluorescence, with NLS-mCerulean used as the segmenta-
tion marker. FIRE and RFP-geminin signals were normalized to the NLS-
mCerulean intensity to correct for changes in cell shape. Segmentation and
quantitation were performed independently for each time point. Analysis of
FIRE andRFP-geminin in individual live cells for time periods of >48 hr was per-
formed manually, to avoid tracking errors resulting from failure of automated
tracking to identify cell division events.
Analysis of EKAR-EV was performed with a customMATLAB algorithm, and
FRET intensity was calculated as the mean CFP/YFP ratio (calculated pixel-
by-pixel on background-subtracted images) for a dilated nuclear region that
included both cytoplasmic and nuclear regions. To avoid the introduction of
nonlinearities into the FRET measurement, the CFP-excitation, YFP-emission
channel was not used (Birtwistle et al., 2011). Analysis of EKAR-EV activity
pulses was performed automatically with MATLAB; transitions between the
ERK ‘‘on’’ and ‘‘off’’ state were identified as peaks in a vector calculated by
subtracting the CFP/YFP ratio in frame n from that in frame n-3, followed by
manual editing (blinded to cell fate) to correct errors.
SUPPLEMENTAL INFORMATION
Supplemental Information includes Supplemental Experimental Procedures,
four figures, three tables, and three movies and can be found with this article
online at http://dx.doi.org/10.1016/j.molcel.2012.11.002.
ACKNOWLEDGMENTS
Imaging facilities were provided by the Institute of Chemistry and Cell Biology
and the Nikon Imaging Center at Harvard Medical School. Plasmid DNA for
reporter constructs was provided by K. Aoki (EKAR-EV), A. Miyawaki (gemi-
nin), A. Bradley (PiggyBAC), and the Harvard Institute of Proteomics (Fra-1).
We thank S. Spencer and Y.P. Hung for advice on the manuscript. This work
was supported by the National Institutes of Health (5-R01-CA105134-07 to
J.S.B.) and by a Department of Defense Breast Cancer Research Program
postdoctoral fellowship (W81XWH-08-1-0609 to J.G.A.).
Received: July 22, 2012
Revised: October 9, 2012
Accepted: November 2, 2012
Published: December 6, 2012
REFERENCES
Altan-Bonnet, G., and Germain, R.N. (2005). Modeling T cell antigen discrimi-
nation based on feedback control of digital ERK responses. PLoSBiol. 3, e356.
Amit, I., Citri, A., Shay, T., Lu, Y., Katz, M., Zhang, F., Tarcic, G., Siwak, D.,
Lahad, J., Jacob-Hirsch, J., et al. (2007). A module of negative feedback regu-
lators defines growth factor signaling. Nat. Genet. 39, 503–512.
Asthagiri, A.R., Reinhart, C.A., Horwitz, A.F., and Lauffenburger, D.A. (2000).
The role of transient ERK2 signals in fibronectin- and insulin-mediated DNA
synthesis. J. Cell Sci. 113, 4499–4510.
Bain, J., Plater, L., Elliott, M., Shpiro, N., Hastie, C.J., McLauchlan, H.,
Klevernic, I., Arthur, J.S., Alessi, D.R., and Cohen, P. (2007). The selectivity
of protein kinase inhibitors: a further update. Biochem. J. 408, 297–315.
260 Molecular Cell 49, 249–261, January 24, 2013 ª2013 Elsevier Inc
Balan, V., Leicht, D.T., Zhu, J., Balan, K., Kaplun, A., Singh-Gupta, V., Qin, J.,
Ruan, H., Comb, M.J., and Tzivion, G. (2006). Identification of novel in vivo
Raf-1 phosphorylation sites mediating positive feedback Raf-1 regulation by
extracellular signal-regulated kinase. Mol. Biol. Cell 17, 1141–1153.
Birtwistle, M.R., von Kriegsheim, A., Kida, K., Schwarz, J.P., Anderson, K.I.,
and Kolch, W. (2011). Linear approaches to intramolecular Forster resonance
energy transfer probe measurements for quantitative modeling. PLoS ONE 6,
e27823.
Bollag, G., Hirth, P., Tsai, J., Zhang, J., Ibrahim, P.N., Cho, H., Spevak, W.,
Zhang, C., Zhang, Y., Habets, G., et al. (2010). Clinical efficacy of a RAF inhib-
itor needs broad target blockade in BRAF-mutant melanoma. Nature 467,
596–599.
Boykevisch, S., Zhao, C., Sondermann, H., Philippidou, P., Halegoua, S.,
Kuriyan, J., and Bar-Sagi, D. (2006). Regulation of ras signaling dynamics by
Sos-mediated positive feedback. Curr. Biol. 16, 2173–2179.
Brent, R. (2009). Cell signaling: what is the signal and what information does it
carry? FEBS Lett. 583, 4019–4024.
Brondello, J.M., Brunet, A., Pouyssegur, J., and McKenzie, F.R. (1997). The
dual specificity mitogen-activated protein kinase phosphatase-1 and -2 are
induced by the p42/p44MAPK cascade. J. Biol. Chem. 272, 1368–1376.
Brondello, J.M., Pouyssegur, J., and McKenzie, F.R. (1999). Reduced MAP
kinase phosphatase-1 degradation after p42/p44MAPK-dependent phos-
phorylation. Science 286, 2514–2517.
Brummer, T., Naegele, H., Reth, M., and Misawa, Y. (2003). Identification of
novel ERK-mediated feedback phosphorylation sites at the C-terminus of B-
Raf. Oncogene 22, 8823–8834.
Cai, L., Dalal, C.K., and Elowitz, M.B. (2008). Frequency-modulated nuclear
localization bursts coordinate gene regulation. Nature 455, 485–490.
Casalino, L., De Cesare, D., and Verde, P. (2003). Accumulation of Fra-1 in ras-
transformed cells depends on both transcriptional autoregulation and MEK-
dependent posttranslational stabilization. Mol. Cell. Biol. 23, 4401–4415.
Chen, W.W., Schoeberl, B., Jasper, P.J., Niepel, M., Nielsen, U.B.,
Lauffenburger, D.A., and Sorger, P.K. (2009). Input-output behavior of ErbB
signaling pathways as revealed by a mass action model trained against
dynamic data. Mol. Syst. Biol. 5, 239.
Cohen-Saidon, C., Cohen, A.A., Sigal, A., Liron, Y., and Alon, U. (2009).
Dynamics and variability of ERK2 response to EGF in individual living cells.
Mol. Cell 36, 885–893.
Das, J., Ho, M., Zikherman, J., Govern, C., Yang, M., Weiss, A., Chakraborty,
A.K., and Roose, J.P. (2009). Digital signaling and hysteresis characterize ras
activation in lymphoid cells. Cell 136, 337–351.
Dougherty, M.K., Muller, J., Ritt, D.A., Zhou, M., Zhou, X.Z., Copeland, T.D.,
Conrads, T.P., Veenstra, T.D., Lu, K.P., and Morrison, D.K. (2005).
Regulation of Raf-1 by direct feedback phosphorylation. Mol. Cell 17,
215–224.
Ethier, S.P., andMoorthy, R. (1991). Multiple growth factor independence in rat
mammary carcinoma cells. Breast Cancer Res. Treat. 18, 73–81.
Gregor, T., Tank, D.W., Wieschaus, E.F., and Bialek, W. (2007). Probing the
limits to positional information. Cell 130, 153–164.
Hao, N., and O’Shea, E.K. (2012). Signal-dependent dynamics of transcription
factor translocation controls gene expression. Nat. Struct. Mol. Biol. 19,
31–39.
Harding, A., Tian, T., Westbury, E., Frische, E., and Hancock, J.F. (2005).
Subcellular localization determines MAP kinase signal output. Curr. Biol. 15,
869–873.
Harvey, C.D., Ehrhardt, A.G., Cellurale, C., Zhong, H., Yasuda, R., Davis, R.J.,
and Svoboda, K. (2008). A genetically encoded fluorescent sensor of ERK
activity. Proc. Natl. Acad. Sci. USA 105, 19264–19269.
Jones, S.M., and Kazlauskas, A. (2001). Growth-factor-dependent mitogene-
sis requires two distinct phases of signalling. Nat. Cell Biol. 3, 165–172.
.

Molecular Cell
Frequency-Modulated ERK Signaling in Proliferation
Kholodenko, B.N. (2000). Negative feedback and ultrasensitivity can bring
about oscillations in the mitogen-activated protein kinase cascades. Eur. J.
Biochem. 267, 1583–1588.
Kim, J.H., Kushiro, K., Graham, N.A., and Asthagiri, A.R. (2009). Tunable inter-
play between epidermal growth factor and cell-cell contact governs the spatial
dynamics of epithelial growth. Proc. Natl. Acad. Sci. USA 106, 11149–11153.
Kim, Y., Paroush, Z., Nairz, K., Hafen, E., Jimenez, G., and Shvartsman, S.Y.
(2011). Substrate-dependent control of MAPK phosphorylation in vivo. Mol.
Syst. Biol. 7, 467.
Kleiman, L.B., Maiwald, T., Conzelmann, H., Lauffenburger, D.A., and Sorger,
P.K. (2011). Rapid phospho-turnover by receptor tyrosine kinases impacts
downstream signaling and drug binding. Mol. Cell 43, 723–737.
Knauer, D.J., Wiley, H.S., and Cunningham, D.D. (1984). Relationship between
epidermal growth factor receptor occupancy and mitogenic response.
Quantitative analysis using a steady state model system. J. Biol. Chem. 259,
5623–5631.
Komatsu, N., Aoki, K., Yamada, M., Yukinaga, H., Fujita, Y., Kamioka, Y., and
Matsuda, M. (2011). Development of an optimized backbone of FRET biosen-
sors for kinases and GTPases. Mol. Biol. Cell 22, 4647–4656.
Lahav, G., Rosenfeld, N., Sigal, A., Geva-Zatorsky, N., Levine, A.J., Elowitz,
M.B., and Alon, U. (2004). Dynamics of the p53-Mdm2 feedback loop in indi-
vidual cells. Nat. Genet. 36, 147–150.
Lamprecht, M.R., Sabatini, D.M., and Carpenter, A.E. (2007). CellProfiler: free,
versatile software for automated biological image analysis. Biotechniques 42,
71–75.
Langlois, W.J., Sasaoka, T., Saltiel, A.R., and Olefsky, J.M. (1995). Negative
feedback regulation and desensitization of insulin- and epidermal growth
factor-stimulated p21ras activation. J. Biol. Chem. 270, 25320–25323.
Marchetti, S., Gimond, C., Chambard, J.C., Touboul, T., Roux, D., Pouyssegur,
J., and Pages, G. (2005). Extracellular signal-regulated kinases phosphorylate
mitogen-activated protein kinase phosphatase 3/DUSP6 at serines 159 and
197, two sites critical for its proteasomal degradation. Mol. Cell. Biol. 25,
854–864.
Margarit, S.M., Sondermann, H., Hall, B.E., Nagar, B., Hoelz, A., Pirruccello,
M., Bar-Sagi, D., and Kuriyan, J. (2003). Structural evidence for feedback acti-
vation by Ras.GTP of the Ras-specific nucleotide exchange factor SOS. Cell
112, 685–695.
Markevich, N.I., Hoek, J.B., and Kholodenko, B.N. (2004). Signaling switches
and bistability arising from multisite phosphorylation in protein kinase
cascades. J. Cell Biol. 164, 353–359.
Murphy, L.O., Smith, S., Chen, R.H., Fingar, D.C., and Blenis, J. (2002).
Molecular interpretation of ERK signal duration by immediate early gene prod-
ucts. Nat. Cell Biol. 4, 556–564.
Murphy, D.J., Junttila, M.R., Pouyet, L., Karnezis, A., Shchors, K., Bui, D.A.,
Brown-Swigart, L., Johnson, L., and Evan, G.I. (2008). Distinct thresholds
govern Myc’s biological output in vivo. Cancer Cell 14, 447–457.
Nakakuki, T., Birtwistle, M.R., Saeki, Y., Yumoto, N., Ide, K., Nagashima, T.,
Brusch, L., Ogunnaike, B.A., Okada-Hatakeyama, M., and Kholodenko, B.N.
(2010). Ligand-specific c-Fos expression emerges from the spatiotemporal
control of ErbB network dynamics. Cell 141, 884–896.
Nakayama, K., Satoh, T., Igari, A., Kageyama, R., and Nishida, E. (2008). FGF
induces oscillations of Hes1 expression andRas/ERK activation. Curr. Biol. 18,
R332–R334.
Pages, G., Brunet, A., L’Allemain, G., and Pouyssegur, J. (1994). Constitutive
mutant and putative regulatory serine phosphorylation site of mammalianMAP
kinase kinase (MEK1). EMBO J. 13, 3003–3010.
Mo
Qiao, L., Nachbar, R.B., Kevrekidis, I.G., and Shvartsman, S.Y. (2007).
Bistability and oscillations in the Huang-Ferrell model of MAPK signaling.
PLoS Comput. Biol. 3, 1819–1826.
Sakaue-Sawano, A., Kurokawa, H., Morimura, T., Hanyu, A., Hama, H.,
Osawa, H., Kashiwagi, S., Fukami, K., Miyata, T., Miyoshi, H., et al. (2008).
Visualizing spatiotemporal dynamics of multicellular cell-cycle progression.
Cell 132, 487–498.
Santos, S.D., Verveer, P.J., and Bastiaens, P.I. (2007). Growth factor-induced
MAPK network topology shapes Erk response determining PC-12 cell fate.
Nat. Cell Biol. 9, 324–330.
Sarkisian, C.J., Keister, B.A., Stairs, D.B., Boxer, R.B., Moody, S.E., and
Chodosh, L.A. (2007). Dose-dependent oncogene-induced senescence in vivo
and its evasion during mammary tumorigenesis. Nat. Cell Biol. 9, 493–505.
Shankaran, H., Ippolito, D.L., Chrisler, W.B., Resat, H., Bollinger, N., Opresko,
L.K., and Wiley, H.S. (2009). Rapid and sustained nuclear-cytoplasmic ERK
oscillations induced by epidermal growth factor. Mol. Syst. Biol. 5, 332.
Shin, S.Y., Rath, O., Choo, S.M., Fee, F., McFerran, B., Kolch, W., and Cho,
K.H. (2009). Positive- and negative-feedback regulations coordinate the
dynamic behavior of the Ras-Raf-MEK-ERK signal transduction pathway.
J. Cell Sci. 122, 425–435.
Sturm, O.E., Orton, R., Grindlay, J., Birtwistle, M., Vyshemirsky, V., Gilbert, D.,
Calder, M., Pitt, A., Kholodenko, B., and Kolch, W. (2010). The mammalian
MAPK/ERK pathway exhibits properties of a negative feedback amplifier.
Sci. Signal. 3, ra90.
Tanaka, Y., Ogasawara, T., Asawa, Y., Yamaoka, H., Nishizawa, S., Mori, Y.,
Takato, T., and Hoshi, K. (2008). Growth factor contents of autologous human
sera prepared by different production methods and their biological effects on
chondrocytes. Cell Biol. Int. 32, 505–514.
Tay, S., Hughey, J.J., Lee, T.K., Lipniacki, T., Quake, S.R., and Covert, M.W.
(2010). Single-cell NF-kappaB dynamics reveal digital activation and analogue
information processing. Nature 466, 267–271.
Traverse, S., Seedorf, K., Paterson, H., Marshall, C.J., Cohen, P., and Ullrich,
A. (1994). EGF triggers neuronal differentiation of PC12 cells that overexpress
the EGF receptor. Curr. Biol. 4, 694–701.
Vial, E., and Marshall, C.J. (2003). Elevated ERK-MAP kinase activity protects
the FOS family member FRA-1 against proteasomal degradation in colon
carcinoma cells. J. Cell Sci. 116, 4957–4963.
Wells, A., Welsh, J.B., Lazar, C.S., Wiley, H.S., Gill, G.N., and Rosenfeld, M.G.
(1990). Ligand-induced transformation by a noninternalizing epidermal growth
factor receptor. Science 247, 962–964.
Worster, D.T., Schmelzle, T., Solimini, N.L., Lightcap, E.S., Millard, B., Mills,
G.B., Brugge, J.S., and Albeck, J.G. (2012). Akt and ERK control the prolifer-
ative response of mammary epithelial cells to the growth factors IGF-1 and
EGF through the cell cycle inhibitor p57Kip2. Sci. Signal. 5, ra19.
Yamamoto, T., Ebisuya, M., Ashida, F., Okamoto, K., Yonehara, S., and
Nishida, E. (2006). Continuous ERK activation downregulates antiproliferative
genes throughout G1 phase to allow cell-cycle progression. Curr. Biol. 16,
1171–1182.
Yao, G., Lee, T.J., Mori, S., Nevins, J.R., and You, L. (2008). A bistable Rb-E2F
switch underlies the restriction point. Nat. Cell Biol. 10, 476–482.
Zwang, Y., Sas-Chen, A., Drier, Y., Shay, T., Avraham, R., Lauriola, M., Shema,
E., Lidor-Nili, E., Jacob-Hirsch, J., Amariglio, N., et al. (2011). Two phases of
mitogenic signaling unveil roles for p53 and EGR1 in elimination of inconsistent
growth signals. Mol. Cell 42, 524–535.
lecular Cell 49, 249–261, January 24, 2013 ª2013 Elsevier Inc. 261