Molecular Biology and Biotechnology 5th ed Walker - (RSC, 2009) !
624
Molecular Biology and Biotechnology 5th Edition
-
Upload
sothyrupan-thiruchittampalam -
Category
Documents
-
view
113 -
download
8
Transcript of Molecular Biology and Biotechnology 5th ed Walker - (RSC, 2009) !

Molecular Biology and Biotechnology5th Edition


Molecular Biology andBiotechnology5th Edition
Edited by
John M Walker
School of Life Sciences, University of Hertfordshire, Hatfield, Hertfordshire
AL10 9AB, UK
Ralph Raply
School of Life Sciences, University of Hertfordshire, Hatfield, Hertfordshire
AL10 9AB, UK

ISBN: 978-0-85404-125-1
A catalogue record for this book is available from the British Library
r Royal Society of Chemistry, 2009
All rights reserved
Apart from fair dealing for the purposes of research for non-commercial purposes or forprivate study, criticism or review, as permitted under the Copyright, Designs and PatentsAct 1988 and the Copyright and Related Rights Regulations 2003, this publication may notbe reproduced, stored or transmitted, in any form or by any means, without the priorpermission in writing of The Royal Society of Chemistry or the copyright owner, or in thecase of reproduction in accordance with the terms of licences issued by the CopyrightLicensing Agency in the UK, or in accordance with the terms of the licences issued by theappropriate Reproduction Rights Organization outside the UK. Enquiries concerningreproduction outside the terms stated here should be sent to The Royal Society of Chemistryat the address printed on this page.
Published by The Royal Society of Chemistry,Thomas Graham House, Science Park, Milton Road,Cambridge CB4 0WF, UK
Registered Charity Number 207890
For further information see our website at www.rsc.org
Preface
One of the exciting aspects of being involved in the field of molecular
biology is the ever-accelerating rate of progress, both in the develop-
ment of new methodologies and in the practical applications of these
methodologies. Indeed, such developments led to the idea of the first
edition of Molecular Biology and Biotechnology and subsequent edi-
tions have reflected the fast-moving nature of the area, not least this
latest edition, which continues to reflect recent developments, with
new chapters in developing areas such as genome technology, nano-
biotechnology, regenerative medicine and biofuels.
The first six chapters deal with the technology used in current mole-
cular biology and biotechnology. These deal primarily with core nucleic
acid techniques and protein expression through microbial and genetic
detection methods. Further chapters address the huge advances made in
gene and genome analysis and update the rapid advances into yeast
analysis, which is providing very exciting insights into molecular path-
ways. Molecular biology also continues to affect profoundly progress in
biotechnology in areas such as vaccine development, use and application
of monoclonal antibodies, clinical treatment and diagnosis, the pro-
duction of transgenic animals, and many other areas of research relevant
to the pharmaceutical industry. Chapters on all these areas have been
retained and fully updated in this new edition and new chapters intro-
duced on the applications of molecular biology in the areas of drug
design and diseases, and regenerative medicine. In addition, we continue
to ensure that biotechnology is not just considered at the gene level and
full consideration continues to be given to applications and
Molecular Biology and Biotechnology, 5th Edition
Edited by John M Walker and Ralph Rapleyr Royal Society of Chemistry 2009
Published by the Royal Society of Chemistry, www.rsc.org
v

manufacturing, with chapters on downstream processing, biosensors,
the applications of immobilised biocatalysts, and a new chapter on the
developing area of biofuels.
Our continued intention is that this book should primarily have a
teaching function. As such, this book should prove of interest both to
undergraduates studying for biological or chemical qualifications and to
postgraduate and other scientific workers who need a sound introduc-
tion to this ever rapidly advancing and expanding area.
John M. Walker
Ralph Rapley
vi Preface

Contents
Chapter 1 Basic Molecular Biology Techniques
Ralph Rapley
1.1 Enzymes Used in Molecular Biology 1
1.2 Isolation and Separation of Nucleic Acids 3
1.2.1 Isolation of DNA 3
1.2.2 Isolation of RNA 5
1.3 Electrophoresis of Nucleic Acids 6
1.4 Restriction Mapping of DNA Fragments 8
1.5 Nucleic Acid Analysis Methods 8
1.5.1 DNA Blotting 9
1.5.2 RNA Blotting 10
1.6 Gene Probe Derivation 11
1.7 Labelling DNA Gene Probe Molecules 12
1.7.1 End Labelling of DNA Molecules 13
1.7.2 Random Primer Labelling 14
1.7.3 Nick Translation 15
1.8 The Polymerase Chain Reaction 15
References 18
Chapter 2 Molecular Cloning and Protein Expression
Stuart Harbron
2.1 Introduction 20
2.2 Host-related Issues 21
2.3 Vectors 24
2.4 Expression Systems 30
2.4.1 The pET Expression System 30
2.4.2 The pBAD Expression System 33
Molecular Biology and Biotechnology, 5th Edition
Edited by John M Walker and Ralph Rapley
r Royal Society of Chemistry 2009
Published by the Royal Society of Chemistry, www.rsc.org
vii
2.5 Problems 34
2.6 Fusion Proteins 37
2.6.1 Solubility-enhancing Tags 37
2.6.2 Purification-facilitating Tags 40
2.6.3 HT Approaches 43
2.7 Other Hosts 44
2.8 Cell-free Systems 44
2.9 Conclusion 45
References 45
Chapter 3 Molecular Diagnostics
Laura J. Tafe, Claudine L. Bartels, Joel A. Lefferts and
Gregory J. Tsongalis
3.1 Introduction 51
3.2 Technologies 52
3.3 The Infectious Disease Paradigm 53
3.4 Genetics 55
3.5 Hematology 59
3.6 Oncology 62
3.7 Pharmacogenomics 65
3.8 Conclusion 71
References 71
Chapter 4 Molecular Microbial Diagnostics
Karl-Henning Kalland
4.1 Introduction 76
4.2 Classical Microbiological Diagnosis 78
4.3 Sample Collection and Nucleic Acid Purification 79
4.3.1 Sample Collection and Transport 79
4.3.2 Extraction of Nucleic Acids 80
4.3.3 Manual Extraction of Nucleic Acids 81
4.3.4 Automated Extraction of Nucleic Acids 81
4.4 Nucleic Acid Amplification Techniques 81
4.4.1 Polymerase Chain Reaction (PCR) 81
4.4.2 The Contamination Problem 82
4.4.3 Reverse PCR – cDNA Synthesis 82
4.4.4 Nested PCR 83
4.4.5 Real-time PCR 83
4.4.6 Visualisation of Real-time PCR Amplification 84
4.4.7 Real-time PCR Equipment 86
4.4.8 Real-time Quantitative PCR 86
4.4.9 Determination of ‘Viral Load’ in Clinical
Microbiology 87
viii Contents
4.4.10 Internal Controls in Microbiological
Real-time qPCR 87
4.4.11 Multiplex Real-time PCR 88
4.4.12 Melting Curve Analysis 88
4.4.13 Genotyping 89
4.5 Other Techniques Used in Clinical Microbiology 90
4.5.1 Hybridisation Techniques 90
4.5.2 Nucleic Acid-based Typing of Bacteria 93
4.5.3 Pyrosequencing 97
4.5.4 TaqMan Low-density Arrays (TLDAs) 98
4.6 Selected Examples of Clinical Nucleic
Acid-based Diagnosis 99
4.6.1 Central Nervous System (CNS) Disease 99
4.6.2 Respiratory Infections 100
4.6.3 Hepatitis 100
4.6.4 Gastroenteritis 101
4.6.5 Sexually Transmitted Diseases 102
4.6.6 HIV Infection and AIDS 103
4.6.7 Bacterial Antibiotic Resistance and Virulence
Factor Genes 104
4.7 Conclusion and Future Challenges 106
References 107
Chapter 5 Genes and Genomes
David B. Whitehouse
5.1 Introduction 112
5.1.1 Background 112
5.2 Key DNA Technologies 115
5.2.1 Molecular Cloning Outline 115
5.2.2 Cloning Vectors 115
5.2.3 The Cloning Process 118
5.2.4 DNA Libraries 120
5.3 The Polymerase Chain Reaction (PCR) 122
5.3.1 Steps in the PCR 123
5.3.2 PCR Primer Design and Bioinformatics 125
5.3.3 Reverse Transcriptase PCR (RT-PCR) 126
5.3.4 Quantitative or Real-time PCR 126
5.4 DNA Sequencing 128
5.4.1 Dideoxynucleotide Chain
Terminators 129
5.4.2 Sequencing Double-stranded DNA 129
5.4.3 PCR Cycle Sequencing 130
5.4.4 Automated DNA Sequencing 130
5.4.5 Pyrosequencing 131
ixContents
5.5 Genome Analysis 131
5.5.1 Mapping and Identifying Genes 131
5.5.2 Tools for Genetic Mapping 132
5.5.3 Mutation Detection 139
5.6 Genome Projects Background 144
5.6.1 Mapping and Sequencing Strategies 144
5.7 Gene Discovery and Localisation 149
5.7.1 Laboratory Approaches 149
5.7.2 Bioinformatics Approaches 150
5.8 Future Directions 152
References 153
Chapter 6 The Biotechnology and Molecular Biology of Yeast
Brendan P. G. Curran and Virginia C. Bugeja
6.1 Introduction 159
6.2 The Production of Heterologous Proteins by Yeast 161
6.2.1 The Yeast Hosts 161
6.2.2 Assembling and Transforming Appropriate
DNA Constructs into the Hosts 162
6.2.3 Ensuring Optimal Expression of the Desired
Protein 165
6.3 From Re-engineering Genomes to Constructing Novel
Signal and Biochemical Pathways 170
6.3.1 Large-scale Manipulation of Mammalian and
Bacterial DNA 170
6.3.2 Novel Biological Reporter Systems 176
6.3.3 Novel Biochemical Products Include
Humanised EPO 179
6.4 Yeast as a Paradigm of Eukaryotic Cellular Biology 187
6.4.1 Genomic Insights 187
6.4.2 Transcriptomes, Proteomes and Metabolomes
and Drug Development 188
6.4.3 Systems Biology 190
6.5 Future Prospects 191
References 191
Chapter 7 Metabolic Engineering
Stefan Kempa, Dirk Walther, Oliver Ebenhoeh and Wolfram
Weckwerth
7.1 Introduction 196
7.2 Theoretical Approaches for Metabolic Networks 197
7.2.1 Kinetic Modelling 198
x Contents
7.2.2 Metabolic Control Analysis (MCA),
Elementary Flux Modes (EFM) and
Flux-balance Analysis (FBA) 202
7.3 Experimental Approaches for Metabolic Engineering 208
7.3.1 Tools for Metabolic Engineering 208
7.3.2 Metabolomics 209
7.3.3 Metabolomics in the Context of Metabolic
Engineering 210
7.4 Examples in Metabolic Engineering 211
7.4.1 Metabolic Engineering of Plants 211
7.4.2 Acetate Metabolism and Recombinant Protein
Synthesis in E. coli – a Test Case for Metabolic
Engineering 213
7.4.3 Metabolic Flux Analysis and a Bioartificial Liver 213
7.5 Omics Technologies Open New Perspectives for
Metabolic Engineering 214
7.6 Acknowledgement 215
References 215
Chapter 8 Bionanotechnology
David W. Wright
8.1 Introduction 220
8.2 Semiconductor Quantum Dots 222
8.2.1 Quantum Confinement Effects 222
8.2.2 Biotechnological Applications of Fluorescent
Semiconductor Quantum Dots 224
8.3 Magnetic Nanoparticles 226
8.3.1 Nanoscaling Laws and Magnetism 226
8.3.2 Biotechnological Applications of Magnetic
Nanoparticles 228
8.4 Zerovalent Noble Metal Nanoparticles 232
8.4.1 Nanoscale Properties of Zerovalent Nobel
Metal Nanoparticles 232
8.4.2 Bionanotechnology Application of Zerovalent
Noble Metal Nanoparticles 234
8.5 Making Nanoscale Structures Using Biotechnology 236
8.6 Conclusions 241
References 241
Chapter 9 Molecular Engineering of Antibodies
James D. Marks
9.1 Introduction 245
9.2 Antibodies as Therapeutics 246
xiContents
9.3 Antibody Structure and Function 250
9.4 Chimeric Antibodies 251
9.5 Antibody Humanization 255
9.6 Antibodies from Diversity Libraries and Display
Technologies 256
9.6.1 Antibody Phage Display 257
9.6.2 Alternative Display Technologies 262
9.7 Engineering Antibody Affinity 263
9.8 Enhancing Antibody Potency 264
9.9 Conclusion 265
References 265
Chapter 10 Plant Biotechnology
Michael G. K. Jones
10.1 Introduction 272
10.2 Applications of Molecular Biology to Speed Up the
Processes of Crop Improvement 273
10.2.1 Molecular Maps of Crop Plants 273
10.2.2 Molecular Markers 274
10.2.3 Types of Molecular Markers 274
10.2.4 Marker-assisted Selection 275
10.2.5 Examples of Marker-assisted Selection 276
10.2.6 Molecular Diagnostics 277
10.2.7 DNA Fingerprinting, Variety Identification 278
10.2.8 DNA Microarrays 279
10.2.9 Bioinformatics 279
10.3 Transgenic Technologies 279
10.3.1 Agrobacterium-mediated Transformation 280
10.3.2 Selectable Marker and Reporter Genes 280
10.3.3 Particle Bombardment 281
10.4 Applications of Transgenic Technologies 281
10.5 Engineering Crop Resistance to Herbicides 283
10.6 Engineering Resistance to Pests And Diseases 284
10.6.1 Insect Resistance 284
10.6.2 Engineered Resistance to Plant Viruses 285
10.6.3 Resistance to Fungal Pathogens 287
10.6.4 Natural Resistance Genes 288
10.6.5 Engineering Resistance to Fungal Pathogens 290
10.6.6 Resistance to Bacterial Pathogens 291
10.6.7 Resistance to Nematode Pathogens 292
10.7 Manipulating Male Sterility 292
10.8 Tolerance to Abiotic Stresses 293
10.9 Manipulating Quality 294
10.9.1 Prolonging Shelf Life 294
xii Contents
10.9.2 Nutritional and Technological Properties 294
10.9.3 Manipulation of Metabolic Partitioning 297
10.10 Production of Plant Polymers and Biodegradable
Plastics 298
10.11 Plants as Bioreactors: Biopharming and
Neutraceuticals 298
10.11.1 Edible Vaccines 298
10.11.2 Production of Antibodies in Plants 299
10.11.3 Plant Neutraceuticals 299
10.12 Plant Biotechnology in Forestry 300
10.13 Intellectual Property 300
10.14 Public Acceptance 301
10.15 Future Prospects 302
References 303
Chapter 11 Biotechnology-based Drug Discovery
K. K. Jain
11.1 Introduction to Drug Discovery 307
11.1.1 Basics of Drug Discovery in the Biopharma-
ceutical Industry 307
11.1.2 Historical Landmarks in Drug Discovery and
Development 308
11.1.3 Current Status of Drug Discovery 309
11.2 New Biotechnologies for Drug Discovery 310
11.3 Genomic Technologies for Drug Discovery 310
11.3.1 SNPs in Drug Discovery 311
11.3.2 Gene Expression Profiling 312
11.3.3 Limitations of Genomics for Drug Discovery
and Need for Other Omics 312
11.4 Role of Proteomics in Drug Discovery 313
11.4.1 Proteins as Drug Targets 313
11.4.2 Protein Expression Mapping by 2D Gel
Electrophoresis 314
11.4.3 Liquid Chromatography-based Drug
Discovery 314
11.4.4 Matrix-assisted Laser Desorption/Ionisation
Mass Spectrometry 314
11.4.5 Protein–Protein Interactions 315
11.4.6 Use of Proteomic Technologies for
Important Drug Targets 316
11.5 Metabolomic and Metabonomic Technologies for
Drug Discovery 317
11.6 Role of Nanobiotechnology
in Drug Discovery 318
xiiiContents
11.6.1 Nanobiotechnology for Target Validation 318
11.6.2 Nanotechnology-based Drug Design at
Cell Level 318
11.6.3 Nanomaterials as Drug Candidates 319
11.7 Role of Biomarkers in Drug Discovery 320
11.8 Screening in Drug Discovery 320
11.8.1 Cell-based Screening System 321
11.8.2 Receptor Targets: Human versus Animal
Tissues 321
11.8.3 Tissue Screening 322
11.9 Target Validation Technologies 322
11.9.1 Animal Models for Genomics-based
Target Validation Methods 322
11.9.2 Role of Knockout Mice in Drug Discovery 323
11.10 Antisense for Drug Discovery 323
11.10.1 Antisense Oligonucleotides for Drug
Target Validation 324
11.10.2 Aptamers 324
11.10.3 RNA as a Drug Target 325
11.10.4 Ribozymes 325
11.11 RNAi for Drug Discovery 326
11.11.1 Use of siRNA Libraries to Identify Genes
as Therapeutic Targets 327
11.11.2 RNAi as a Tool for Assay Development 328
11.11.3 Challenges of Drug Discovery with
RNAi 328
11.11.4 Role of MicroRNA in Drug Discovery 329
11.12 Biochips and Microarrays
for Drug Discovery 329
11.12.1 Finding Lead Compounds 330
11.12.2 High-throughput cDNA Microarrays 330
11.12.3 Use of Gene Expression Data to Find New
Drug Targets 330
11.12.4 Investigation of the Mechanism of Drug
Action 331
11.13 Applications of Bioinformatics
in Drug Discovery 331
11.13.1 Combination of In Silico and In vitro Studies 332
11.14 Role of Model Organisms in Drug Discovery 333
11.15 Chemogenomic Approach to Drug Discovery 334
11.16 Virtual Drug Development 334
11.17 Role of Biotechnology in Lead Generation and
Validation 335
11.18 Conclusion 335
References 336
xiv Contents
Chapter 12 Vaccines
Niall McMullan
12.1 An Overview of Vaccines and
Vaccination 337
12.2 Types of Vaccines in Current Use 338
12.2.1 Live, Attenuated Vaccines 338
12.2.2 Inactivated Vaccines 339
12.2.3 Subunit Vaccines 340
12.3 The Need for New Vaccines 342
12.4 New Approaches to Vaccine Development 343
12.4.1 Recombinant Live Vectors 343
12.4.2 Recombinant BCG Vectors 343
12.4.3 Recombinant Salmonella Vectors 344
12.4.4 Recombinant Adenovirus Vectors 345
12.4.5 Recombinant Vaccinia Vectors 346
12.4.6 DNA Vaccines 346
12.5 Adjuvants 347
12.5.1 Immune-stimulating Complexes (ISCOMs)
and Liposomes 347
12.5.2 Freund-type Adjuvants 347
12.5.3 CpG Oligonucleotides (CpG ODNs) 348
References 349
Chapter 13 Tissue Engineering
Nils Link and Martin Fussenegger
13.1 Introduction 351
13.1.1 Economic Impact of Healthcare 351
13.1.2 Tissue Engineering 352
13.1.3 Treating Disease Through Tissue
Engineering 353
13.2 Cell Types 356
13.2.1 Embryonic Stem Cells 356
13.2.2 Adult Stem Cells 360
13.2.3 Mature Cells 361
13.3 Extracellular Matrix 362
13.3.1 Biological Extracellular Matrices 362
13.3.2 Artificial Extracellular Matrices 364
13.4 Tissue Engineering Concepts 369
13.4.1 Cultivation of Artificial Tissues 369
13.4.2 Design of Scaffold-free Tissues 372
13.5 Conclusions 373
References 373
xvContents
Chapter 14 Transgenesis
Elizabeth J. Cartwright and Xin Wang
14.1 Introduction 390
14.1.1 From Gene to Function 390
14.2 Transgenesis by DNA Pronuclear Injection 391
14.2.1 Generation of a Transgenic Mouse 391
14.2.2 Summary of Advantages and Disadvantages
of Generating Transgenic Mice by
Pronuclear Injection of DNA 397
14.3 Gene Targeting by Homologous Recombination
in Embryonic Stem Cells 397
14.3.1 Basic Principles 398
14.3.2 Generation of a Knockout Mouse 400
14.3.3 Summary of Advantages and Disadvantages
of Generating Gene Knockout Mice 404
14.4 Conditional Gene Targeting 404
14.4.1 Generation of a Conditional Knockout
Mouse Using the Cre–loxP System 406
14.4.2 Chromosomal Engineering Using the
Cre–loxP System 410
14.4.3 Summary of Advantages and
Disadvantages of Conditional Gene
Targeting 410
14.5 Phenotypic Analysis of Genetically
Modified Mice 411
14.6 Ethical and Animal Welfare Considerations 412
14.7 Conclusions 414
14.8 Acknowledgements 414
References 415
Chapter 15 Protein Engineering
John Adair and Duncan McGregor
15.1 Introduction 418
15.1.1 Protein Structures 419
15.2 Tools of the Trade 420
15.2.1 Sequence Identification 420
15.2.2 Structure Determination and Modelling 420
15.2.3 Sequence Modification 421
15.2.4 Production 432
15.2.5 Analysis 433
15.3 Applications 434
15.3.1 Point Mutations 434
15.3.2 Domain Shuffling (Linking, Swapping
and Deleting) 435
xvi Contents
15.3.3 Whole Protein Shuffling 441
15.3.4 Protein–Ligand Interactions 441
15.3.5 Towards De Novo Design 442
15.4 Conclusions and Future Directions 443
References 447
Chapter 16 Immobilisation of Enzymes and Cells
Gordon F. Bickerstaff
16.1 Introduction 454
16.2 Biocatalysts 455
16.2.1 Enzymes 455
16.2.2 Ribozymes, Deoxyribozymes and Ribosomes 459
16.2.3 Splicesomes 460
16.2.4 Abzymes 461
16.2.5 Multienzyme Complexes 462
16.2.6 Cells 466
16.2.7 Biocatalyst Selection 468
16.3 Immobilisation 469
16.3.1 Choice of Support Material 470
16.3.2 Choice of Immobilisation Procedures 474
16.4 Properties of Immobilised Biocatalysts 483
16.4.1 Stability 483
16.4.2 Catalytic Activity 484
16.4.3 Coenzyme Regeneration 485
16.5 Applications 487
References 489
Chapter 17 Downstream Processing
Daniel G. Bracewell, Mohammad Ali S. Mumtaz and
C. Mark Smales
17.1 Introduction 492
17.2 Initial Considerations and Primary Recovery 493
17.2.1 Centrifugation and Filtration 494
17.2.2 Cell Lysis 494
17.2.3 Recovery of Material from Inclusion Bodies 495
17.3 Protein Precipitation 496
17.4 Chromatography 497
17.4.1 Ion-exchange Chromatography (IEX) 499
17.4.2 Affinity Chromatography 500
17.4.3 Hydrophobic Interaction Chromatography
(HIC) 501
17.4.4 Gel Filtration Chromatography 501
17.5 Alternatives to Packed Bed Chromatography 502
xviiContents
17.5.1 Expanded Bed Adsorption 502
17.5.2 Aqueous Two-phase Extraction 503
17.5.3 Membrane Chromatography and Filtration 503
17.5.4 Crystallisation 504
17.5.5 Monolith Columns 505
17.6 Design of Biomolecules for Downstream Processing 505
17.7 Scaledown Methods 506
17.8 Validation and Robustness 506
17.9 Formulation and Antiviral Treatments 507
17.9.1 Formulation 507
17.9.2 Antiviral Treatments 508
17.10 Current Developments and Future Directions 509
References 510
Chapter 18 Biosensors
Martin F. Chaplin
18.1 Introduction 513
18.2 The Biological Reaction 518
18.3 Theory 519
18.4 Electrochemical Methods 522
18.4.1 Amperometric Biosensors 522
18.4.2 Potentiometric Biosensors 531
18.4.3 Conductimetric Biosensors 533
18.5 Piezoelectric Biosensors 534
18.6 Optical Biosensors 536
18.6.1 Evanescent Wave Biosensors 538
18.6.2 Surface Plasmon Resonance 540
18.7 Whole Cell Biosensors 542
18.8 Receptor-based Sensors 543
18.9 Conclusion 545
References 546
Chapter 19 Biofuels and Biotechnology
Jonathan R. Mielenz
19.1 Introduction 548
19.2 Production of the Major Biofuels 549
19.2.1 Corn Processing and Ethanol 550
19.2.2 Biomass Conversion for Ethanol 552
19.2.3 Biodiesel 556
19.3 Application of Biotechnology Tools to Biofuels
Processes 557
19.3.1 Improved Production of Corn Ethanol 559
19.3.2 Ethanol Production from Biomass 561
xviii Contents

19.3.3 Biobutanol 572
19.3.4 Biodiesel 573
19.3.5 New Concepts 573
19.4 Future Perspectives 574
References 576
Subject Index 585
xixContents

CHAPTER 1
Basic Molecular Biology Techniques
RALPH RAPLEY
School of Life Sciences, University of Hertfordshire, Hatfield, Hertfordshire
AL10 9AB, UK
1.1 ENZYMES USED IN MOLECULAR BIOLOGY
The discovery and characterisation of a number of key enzymes have
permitted the development of various techniques for the analysis and
manipulation of DNA. In particular, the enzymes termed type II
restriction endonucleases have come to play a key role in all aspects of
molecular biology.1 These enzymes recognise specific DNA sequences,
usually 4–6 base pairs (bp) in length, and cleave them in a defined
manner. The sequences recognised are palindromic or of an inverted
repeat nature, that is, they read the same in both directions on each
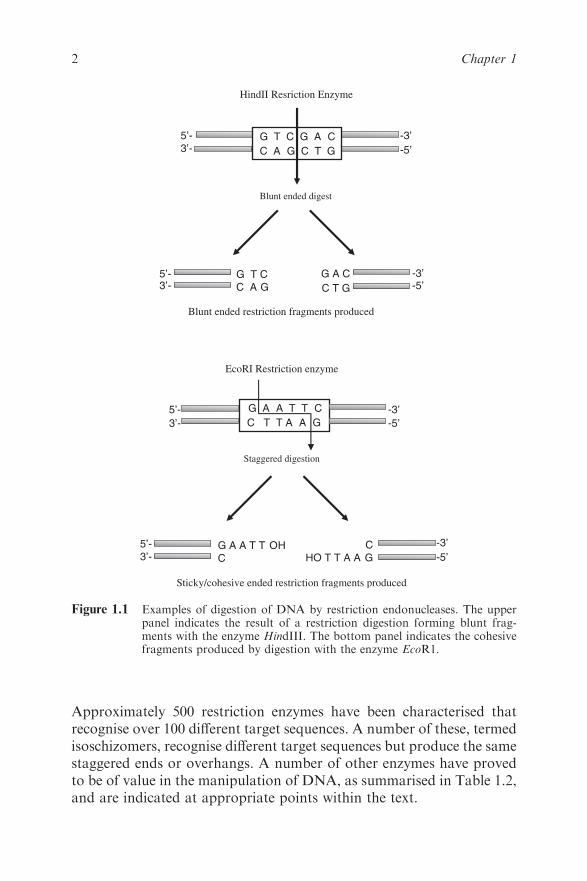
strand. When cleaved they leave a flush-ended or staggered (also termed
a cohesive-ended) fragment depending on the particular enzyme used
(Figure 1.1).
An important property of staggered ends is that those produced from
different molecules by the same enzyme are complementary (or ‘sticky’)
and so will anneal to each other (Table 1.1). The annealed strands are
held together only by hydrogen bonding between complementary bases
on opposite strands. Covalent joining of ends on each of the two strands
may be brought about by the enzyme DNA ligase. This is widely
exploited in molecular biology to allow the construction of recombinant
DNA, i.e. the joining of DNA fragments from different sources.
Molecular Biology and Biotechnology, 5th Edition
Edited by John M Walker and Ralph Rapleyr Royal Society of Chemistry 2009
Published by the Royal Society of Chemistry, www.rsc.org
1
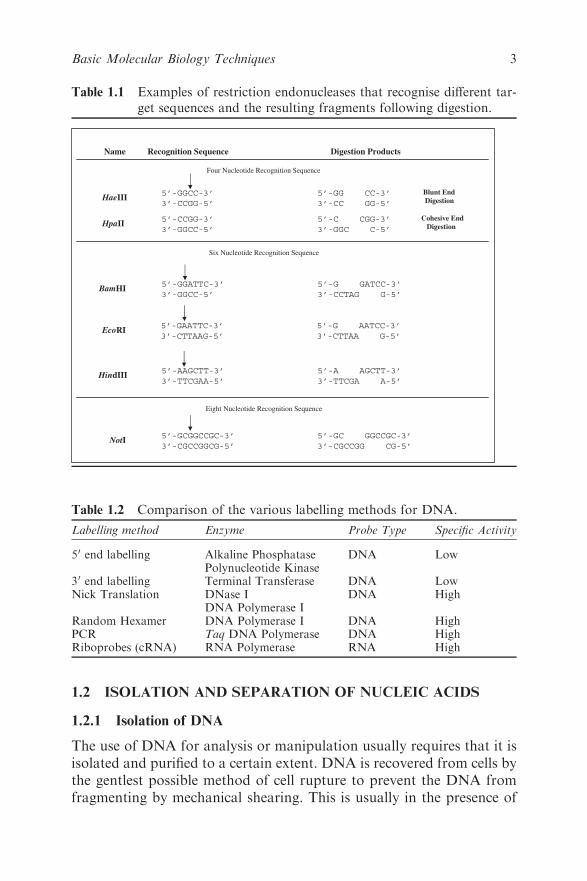
Approximately 500 restriction enzymes have been characterised that
recognise over 100 different target sequences. A number of these, termed
isoschizomers, recognise different target sequences but produce the same
staggered ends or overhangs. A number of other enzymes have proved
to be of value in the manipulation of DNA, as summarised in Table 1.2,
and are indicated at appropriate points within the text.
G A A T T C
C T T A A G
G A A T T OH
C
-3’
-5’
5’-
3’-
-3’
-5’
HO T T A A G
C5’-
3’-
EcoRI Restriction enzyme
Sticky/cohesive ended restriction fragments produced
Staggered digestion
G T C G A C
C A G C T G
G A C
C T G
G T C
C A G
5’-
3’-
5’-
3’-
-3’
-5’
-3’
-5’
HindII Resriction Enzyme
Blunt ended restriction fragments produced
Blunt ended digest
Figure 1.1 Examples of digestion of DNA by restriction endonucleases. The upperpanel indicates the result of a restriction digestion forming blunt frag-ments with the enzyme HindIII. The bottom panel indicates the cohesivefragments produced by digestion with the enzyme EcoR1.
2 Chapter 1
1.2 ISOLATION AND SEPARATION OF NUCLEIC ACIDS
1.2.1 Isolation of DNA
The use of DNA for analysis or manipulation usually requires that it is
isolated and purified to a certain extent. DNA is recovered from cells by
the gentlest possible method of cell rupture to prevent the DNA from
fragmenting by mechanical shearing. This is usually in the presence of
Table 1.1 Examples of restriction endonucleases that recognise different tar-
get sequences and the resulting fragments following digestion.
HaeIII5’-GGCC-3’ 5’-GG CC-3’
3’-CCGG-5’ 3’-CC GG-5’
5’-CCGG-3’ 5’-C CGG-3’
3’-GGCC-5’ 3’-GGC C-5’
5’-GGATTC-3’ 5’-G GATCC-3’
3’-GGCC-5’ 3’-CCTAG G-5’
5’-GAATTC-3’ 5’-G AATCC-3’
3’-CTTAAG-5’ 3’-CTTAA G-5’
5’-AAGCTT-3’ 5’-A AGCTT-3’
3’-TTCGAA-5’ 3’-TTCGA A-5’
5’-GCGGCCGC-3’ 5’-GC GGCCGC-3’
3’-CGCCGGCG-5’ 3’-CGCCGG CG-5’
HpaII
BamHI
EcoRI
HindIII
NotI
Name Recognition Sequence Digestion Products
Four Nucleotide Recognition Sequence
Six Nucleotide Recognition Sequence
Eight Nucleotide Recognition Sequence
Blunt End
Digestion
Cohesive End
Digestion
Table 1.2 Comparison of the various labelling methods for DNA.
Labelling method Enzyme Probe Type Specific Activity
50 end labelling Alkaline Phosphatase DNA LowPolynucleotide Kinase
30 end labelling Terminal Transferase DNA LowNick Translation DNase I DNA High
DNA Polymerase IRandom Hexamer DNA Polymerase I DNA HighPCR Taq DNA Polymerase DNA HighRiboprobes (cRNA) RNA Polymerase RNA High
3Basic Molecular Biology Techniques
EDTA which chelate the Mg21 ions needed for enzymes that degrade
DNA termed DNase. Ideally, cell walls, if present, should be digested
enzymatically (e.g. lysozyme treatment of bacteria) and the cell mem-
brane should be solubilised using detergent. If physical disruption is
necessary, it should be kept to a minimum and should involve cutting or
squashing of cells, rather than the use of shear forces. Cell disruption
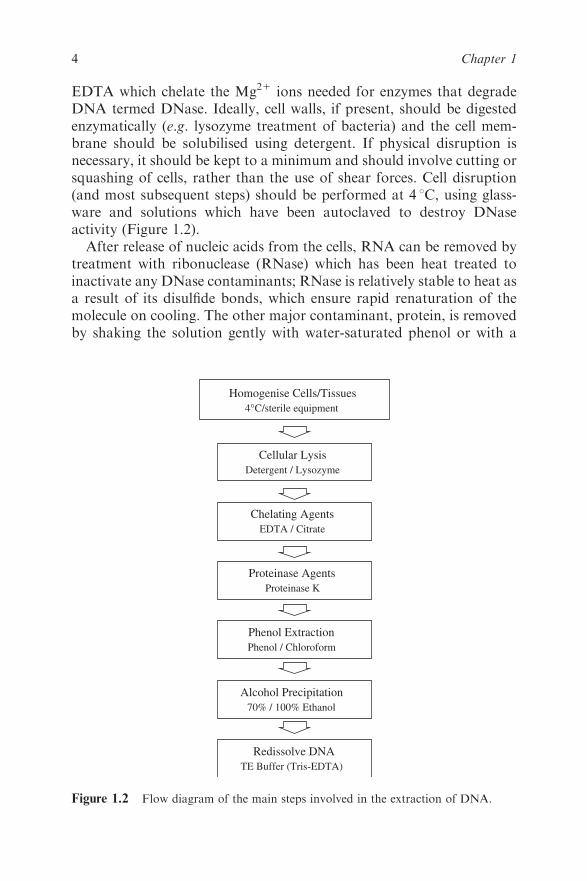
(and most subsequent steps) should be performed at 4 1C, using glass-
ware and solutions which have been autoclaved to destroy DNase
activity (Figure 1.2).
After release of nucleic acids from the cells, RNA can be removed by
treatment with ribonuclease (RNase) which has been heat treated to
inactivate any DNase contaminants; RNase is relatively stable to heat as
a result of its disulfide bonds, which ensure rapid renaturation of the
molecule on cooling. The other major contaminant, protein, is removed
by shaking the solution gently with water-saturated phenol or with a
Cellular Lysis
Detergent / Lysozyme
Chelating Agents
EDTA / Citrate
Proteinase Agents
Proteinase K
Phenol Extraction
Phenol / Chloroform
Alcohol Precipitation
70% / 100% Ethanol
Homogenise Cells/Tissues
4°C/sterile equipment
Redissolve DNA
TE Buffer (Tris-EDTA)
Figure 1.2 Flow diagram of the main steps involved in the extraction of DNA.
4 Chapter 1
phenol–chloroform mixture, either of which will denature proteins but
not nucleic acids. Centrifugation of the emulsion formed by this mixing
produces a lower, organic phase, separated from the upper, aqueous
phase by an interface of denatured protein. The aqueous solution is
recovered and deproteinised repeatedly, until no more material is seen at
the interface. Finally, the deproteinised DNA preparation is mixed with
two volumes of absolute ethanol and the DNA allowed to precipitate
out of solution in a freezer. After centrifugation, the DNA pellet is
redissolved in a buffer containing EDTA to inactivate any DNases
present. This solution can be stored at 4 1C for at least 1 month. DNA
solutions can be stored frozen, although repeated freezing and thawing
tend to damage long DNA molecules by shearing.
The procedure described above is suitable for total cellular DNA. If
the DNA from a specific organelle or viral particle is needed, it is best to
isolate the organelle or virus before extracting its DNA, since the
recovery of a particular type of DNA from a mixture is usually rather
difficult. Where a high degree of purity is required, DNA may be sub-
jected to density gradient ultracentrifugation through caesium chloride,
which is particularly useful for the preparation of plasmid DNA.2 It is
possible to check the integrity of the DNA by agarose gel electrophoresis
and determine the concentration of the DNA by using the fact that
1 absorbance unit equates to 50mgml�1 of DNA and so
50� A260 ¼ concentration of DNA sample ðmgml�1Þ ð1Þ
Contaminants may also be identified by scanning UV spectrophoto-
metry from 200 to 300 nm. A ratio of 260 nm:280 nm of approximately
1.8 indicates that the sample is free of protein contamination, which
absorbs strongly at 280 nm.
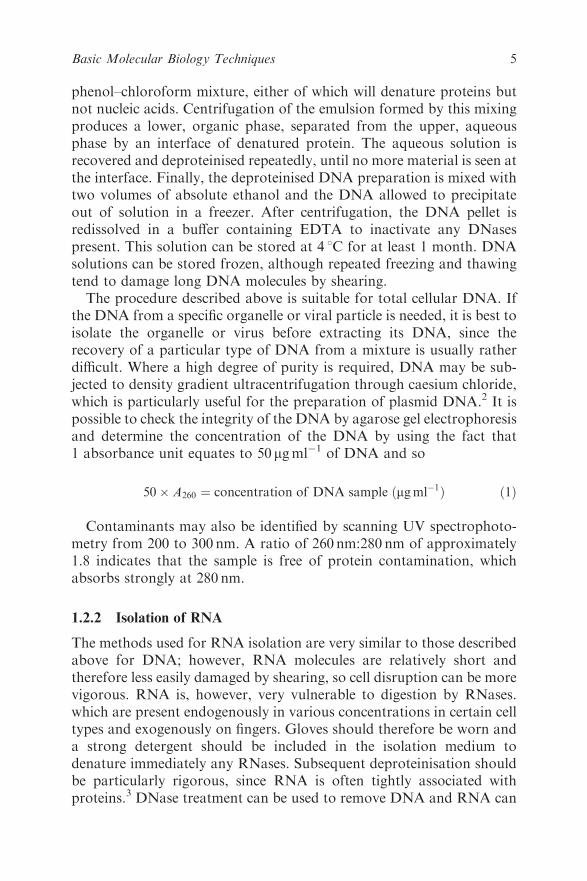
1.2.2 Isolation of RNA
The methods used for RNA isolation are very similar to those described
above for DNA; however, RNA molecules are relatively short and
therefore less easily damaged by shearing, so cell disruption can be more
vigorous. RNA is, however, very vulnerable to digestion by RNases.
which are present endogenously in various concentrations in certain cell
types and exogenously on fingers. Gloves should therefore be worn and
a strong detergent should be included in the isolation medium to
denature immediately any RNases. Subsequent deproteinisation should
be particularly rigorous, since RNA is often tightly associated with
proteins.3 DNase treatment can be used to remove DNA and RNA can
5Basic Molecular Biology Techniques

be precipitated by ethanol. One reagent in which is commonly used in
RNA extraction is guanadinium thiocyanate, which is both a strong
inhibitor of RNase and a protein denaturant. It is possible to check the
integrity of an RNA extract by analysing it by agarose gel electro-
phoresis. The most abundant RNA species are rRNA molecules, 23S
and 16S for prokaryotes and 18S and 28S for eukaryotes. These appear
as discrete bands on the agarose gel and indicate that the other RNA
components are likely to be intact. This is usually carried out under
denaturing conditions to prevent secondary structure formation in the
RNA. The concentration of the RNA may be estimated by using UV
spectrophotometry. At 260 nm, 1 absorbance unit equates to 40mgml�1
of RNA and therefore
40� A260 ¼ concentration of RNA sample ðmgml�1Þ ð2Þ
Contaminants may also be identified in the same way as for DNA by
scanning UV spectrophotometry; however, in the case of RNA a
260 nm:280 nm ratio of approximately 2 would be expected for a sample
containing no contamination.
In many cases, it is desirable to isolate eukaryotic mRNA, which
constitutes only 2–5% of cellular RNA, from a mixture of total RNA
molecules. This may be carried out by affinity chromatography on oligo
(dT)-cellulose columns. At high salt concentrations, the mRNA con-
taining poly(A) tails binds to the complementary oligo(dT) molecules of
the affinity column and so mRNA will be retained; all other RNA
molecules can be washed through the column with further high-salt
solution. Finally, the bound mRNA can be eluted using a low con-
centration of salt. Nucleic acid species may also be subfractionated by
more physical means such as electrophoretic or chromatographic
separations based on differences in nucleic acid fragment sizes or phy-
sicochemical characteristics.3
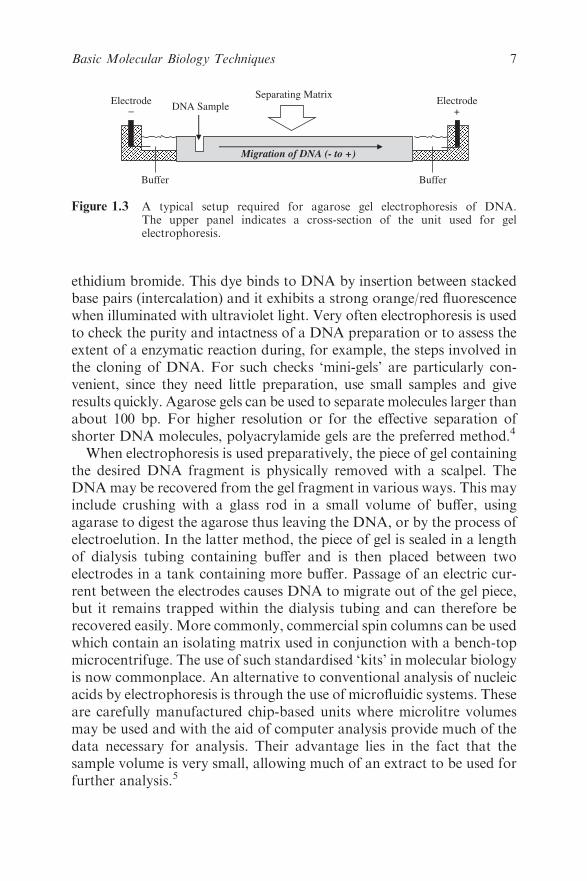
1.3 ELECTROPHORESIS OF NUCLEIC ACIDS
Electrophoresis in agarose or polyacrylamide gels is the most usual way to
separate DNA molecules according to size (Figure 1.3). The technique
can be used analytically or preparatively and can be qualitative or
quantitative. Large fragments of DNA such as chromosomes may also be
separated by a modification of electrophoresis termed pulsed field gel
electrophoresis (PFGE). The easiest and most widely applicable method
is electrophoresis in horizontal agarose gels, followed by staining with
6 Chapter 1
ethidium bromide. This dye binds to DNA by insertion between stacked
base pairs (intercalation) and it exhibits a strong orange/red fluorescence
when illuminated with ultraviolet light. Very often electrophoresis is used
to check the purity and intactness of a DNA preparation or to assess the
extent of a enzymatic reaction during, for example, the steps involved in
the cloning of DNA. For such checks ‘mini-gels’ are particularly con-
venient, since they need little preparation, use small samples and give
results quickly. Agarose gels can be used to separate molecules larger than
about 100 bp. For higher resolution or for the effective separation of
shorter DNA molecules, polyacrylamide gels are the preferred method.4
When electrophoresis is used preparatively, the piece of gel containing
the desired DNA fragment is physically removed with a scalpel. The
DNAmay be recovered from the gel fragment in various ways. This may
include crushing with a glass rod in a small volume of buffer, using
agarase to digest the agarose thus leaving the DNA, or by the process of
electroelution. In the latter method, the piece of gel is sealed in a length
of dialysis tubing containing buffer and is then placed between two
electrodes in a tank containing more buffer. Passage of an electric cur-
rent between the electrodes causes DNA to migrate out of the gel piece,
but it remains trapped within the dialysis tubing and can therefore be
recovered easily. More commonly, commercial spin columns can be used
which contain an isolating matrix used in conjunction with a bench-top
microcentrifuge. The use of such standardised ‘kits’ in molecular biology
is now commonplace. An alternative to conventional analysis of nucleic
acids by electrophoresis is through the use of microfluidic systems. These
are carefully manufactured chip-based units where microlitre volumes
may be used and with the aid of computer analysis provide much of the
data necessary for analysis. Their advantage lies in the fact that the
sample volume is very small, allowing much of an extract to be used for
further analysis.5
+−ElectrodeElectrode
Separating Matrix
BufferBuffer
DNA Sample
Migration of DNA (- to +)
Figure 1.3 A typical setup required for agarose gel electrophoresis of DNA.The upper panel indicates a cross-section of the unit used for gelelectrophoresis.
7Basic Molecular Biology Techniques
1.4 RESTRICTION MAPPING OF DNA FRAGMENTS
Restriction mapping involves the size analysis of restriction fragments
produced by several restriction enzymes individually and in combination.6
The principle of this mapping is illustrated, in which the restriction sites of
two enzymes, A and B, are being mapped. Cleavage with A gives frag-
ments 2 and 7 kilobases (kb) from a 9kb molecule, hence we can position
the single A site 2kb from one end. Similarly, B gives fragments 3 and 6kb,
so it has a single site 3 kb from one end; but it is not possible at this stage to
say if it is near to A’s site or at the opposite end of the DNA. This can be
resolved by a double digestion. If the resultant fragments are 2, 3 and 4kb,
then A and B cut at opposite ends of the molecule; if they are 1, 2 and 6kb,
the sites are near each other. Not surprisingly, the mapping of real
molecules is rarely as simple as this and computer analysis of the restriction
fragment lengths is usually needed to construct a map (Figure 1.4).
1.5 NUCLEIC ACID ANALYSIS METHODS
There are numerous methods for analysing DNA and RNA; however,
many of them are solution based or more recently include the use of
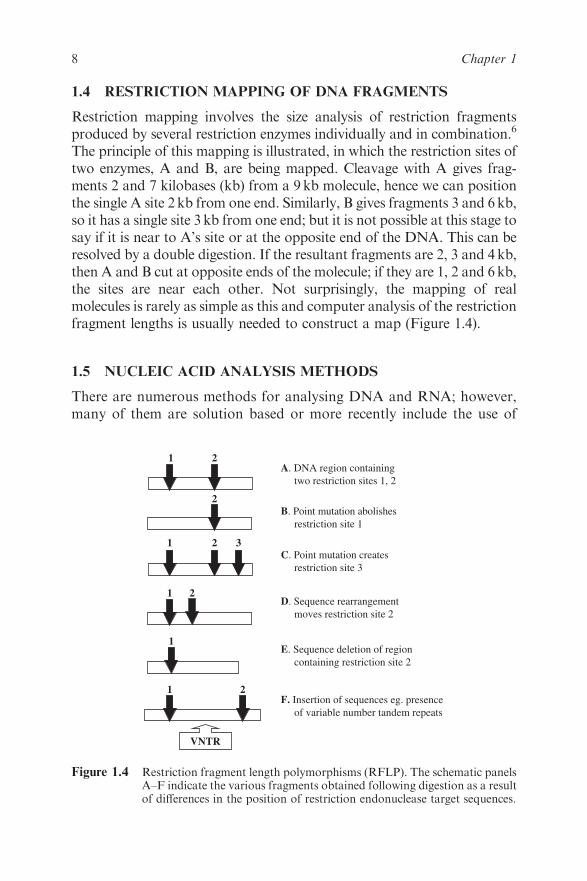
1
1
1
1
1
2
2
2
2
2
3
B. Point mutation abolishes
restriction site 1
C. Point mutation creates
restriction site 3
D. Sequence rearrangement
moves restriction site 2
E. Sequence deletion of region
containing restriction site 2
F. Insertion of sequences eg. presence
of variable number tandem repeats
A. DNA region containing
two restriction sites 1, 2
VNTR
Figure 1.4 Restriction fragment length polymorphisms (RFLP). The schematic panelsA–F indicate the various fragments obtained following digestion as a resultof differences in the position of restriction endonuclease target sequences.
8 Chapter 1
chip-based array systems. Indeed, the lab-on-a-chip approach is devel-
oping rapidly and it is possible to envisage many detection and analysis
methods being developed in this format in the future.7 However, tra-
ditional methods are still employed in many laboratories and much is
still made of producing a hard copy of digested and separated single-
stranded DNA fragments attached to a matrix such as nylon for analysis
with an appropriate labelled probe.
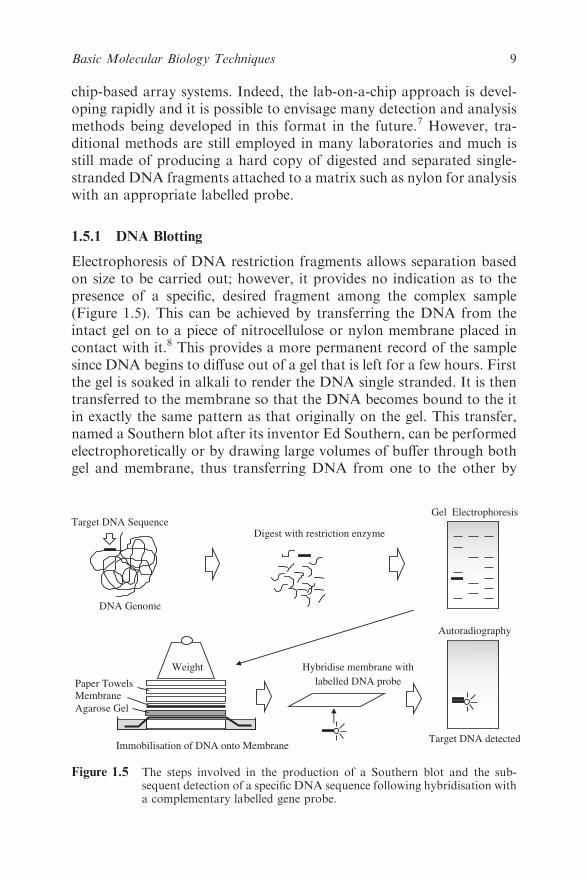
1.5.1 DNA Blotting
Electrophoresis of DNA restriction fragments allows separation based
on size to be carried out; however, it provides no indication as to the
presence of a specific, desired fragment among the complex sample
(Figure 1.5). This can be achieved by transferring the DNA from the
intact gel on to a piece of nitrocellulose or nylon membrane placed in
contact with it.8 This provides a more permanent record of the sample
since DNA begins to diffuse out of a gel that is left for a few hours. First
the gel is soaked in alkali to render the DNA single stranded. It is then
transferred to the membrane so that the DNA becomes bound to the it
in exactly the same pattern as that originally on the gel. This transfer,
named a Southern blot after its inventor Ed Southern, can be performed
electrophoretically or by drawing large volumes of buffer through both
gel and membrane, thus transferring DNA from one to the other by
DNA Genome
Target DNA Sequence Digest with restriction enzyme
Gel Electrophoresis
Immobilisation of DNA onto Membrane
Hybridise membrane with
labelled DNA probe
Autoradiography
Target DNA detected
Weight
Paper Towels
Membrane
Agarose Gel
Figure 1.5 The steps involved in the production of a Southern blot and the sub-sequent detection of a specific DNA sequence following hybridisation witha complementary labelled gene probe.
9Basic Molecular Biology Techniques
capillary action. The point of this operation is that the membrane can
now be treated with a labelled DNAmolecule, for example a gene probe.
This single-stranded DNA probe will hybridise under the right conditions
to complementary fragments immobilised on the membrane. The con-
ditions of hybridisation, including the temperature and salt concentra-
tion, are critical for this process to take place effectively. This is usually
referred to as the stringency of the hybridisation and it is particular for
each individual gene probe and for each sample of DNA. A series of
washing steps with buffer are then carried out to remove any unbound
probe and the membrane is developed, after which the precise location of
the probe and its target may be visualised. It is also possible to analyse
DNA from different species or organisms by blotting the DNA and then
using a gene probe representing a protein or enzyme from one of the
organisms. In this way, it is possible to search for related genes in dif-
ferent species. This technique is generally termed Zoo blotting.
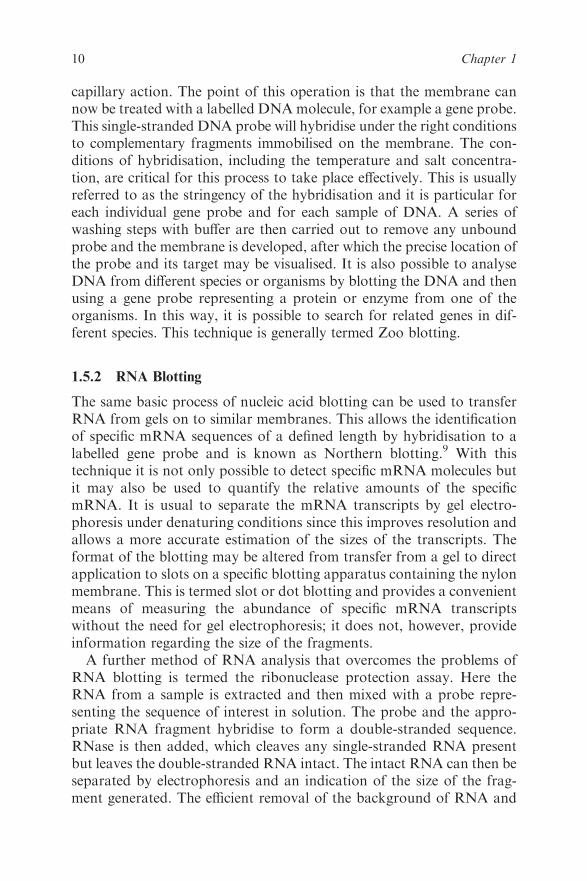
1.5.2 RNA Blotting
The same basic process of nucleic acid blotting can be used to transfer
RNA from gels on to similar membranes. This allows the identification
of specific mRNA sequences of a defined length by hybridisation to a
labelled gene probe and is known as Northern blotting.9 With this
technique it is not only possible to detect specific mRNA molecules but
it may also be used to quantify the relative amounts of the specific
mRNA. It is usual to separate the mRNA transcripts by gel electro-
phoresis under denaturing conditions since this improves resolution and
allows a more accurate estimation of the sizes of the transcripts. The
format of the blotting may be altered from transfer from a gel to direct
application to slots on a specific blotting apparatus containing the nylon
membrane. This is termed slot or dot blotting and provides a convenient
means of measuring the abundance of specific mRNA transcripts
without the need for gel electrophoresis; it does not, however, provide
information regarding the size of the fragments.
A further method of RNA analysis that overcomes the problems of
RNA blotting is termed the ribonuclease protection assay. Here the
RNA from a sample is extracted and then mixed with a probe repre-
senting the sequence of interest in solution. The probe and the appro-
priate RNA fragment hybridise to form a double-stranded sequence.
RNase is then added, which cleaves any single-stranded RNA present
but leaves the double-stranded RNA intact. The intact RNA can then be
separated by electrophoresis and an indication of the size of the frag-
ment generated. The efficient removal of the background of RNA and
10 Chapter 1
the improved sensitivity make the ribonuclease protection assay a
popular choice for the analysis of specific RNA molecules.
An important step in the field of RNA analysis was the development
of RNAi (RNA interference), which inhibits gene expression. Here
double-stranded DNA promotes the degradation of mRNA. Double-
stranded RNA in the cell is cleaved by a dicer enzyme, resulting in the
formation of small 21–25 bp interfering RNAs (siRNA). The siRNA are
complementary to a target RNA strand. Small RNAi proteins are gui-
ded by the siRNA to the appropriate mRNA, where the target is then
cleaved and is unable to be translated. Many areas are now benefiting
from the adoption of this technique in the molecular biology and bio-
technology fields.10
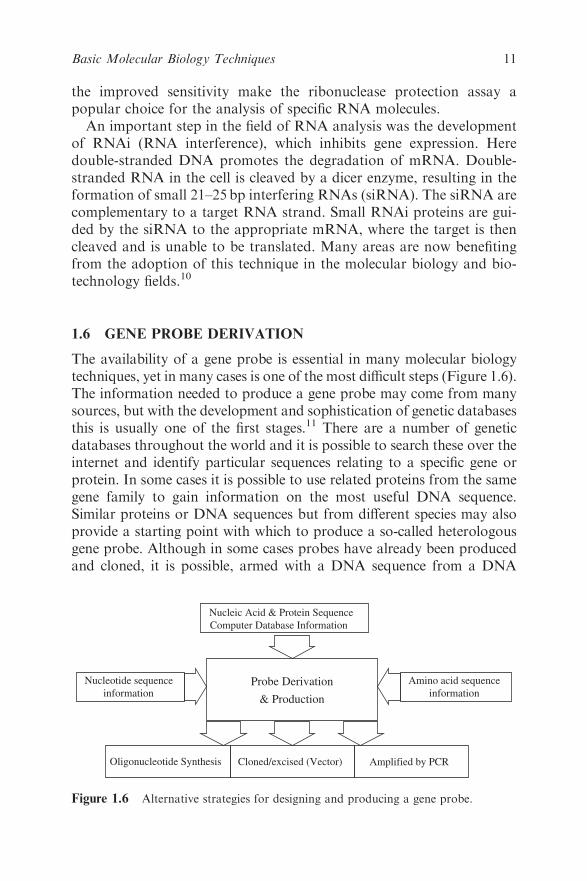
1.6 GENE PROBE DERIVATION
The availability of a gene probe is essential in many molecular biology
techniques, yet in many cases is one of the most difficult steps (Figure 1.6).
The information needed to produce a gene probe may come from many
sources, but with the development and sophistication of genetic databases
this is usually one of the first stages.11 There are a number of genetic
databases throughout the world and it is possible to search these over the
internet and identify particular sequences relating to a specific gene or
protein. In some cases it is possible to use related proteins from the same
gene family to gain information on the most useful DNA sequence.
Similar proteins or DNA sequences but from different species may also
provide a starting point with which to produce a so-called heterologous
gene probe. Although in some cases probes have already been produced
and cloned, it is possible, armed with a DNA sequence from a DNA
Probe Derivation
& Production
Amino acid sequence
information
Nucleic Acid & Protein Sequence
Computer Database Information
Nucleotide sequence
information
Cloned/excised (Vector) Amplified by PCROligonucleotide Synthesis
Figure 1.6 Alternative strategies for designing and producing a gene probe.
11Basic Molecular Biology Techniques

database, to synthesise chemically a single-stranded oligonucleotide
probe. This is usually undertaken by computer-controlled gene synthe-
sisers which link dNTPs together based on a desired sequence. It is
essential to carry out certain checks before probe production to determine
that the probe is unique, is not able to self-anneal or is self-com-
plementary, all of which may compromise its use.12
Where little DNA information is available to prepare a gene probe, it
is possible in some cases to use the knowledge gained from analysis of the
corresponding protein. Thus it is possible to isolate and purify proteins
and sequence part of the N-terminal end of the protein. From our
knowledge of the genetic code, it is possible to predict the various DNA
sequences that could code for the protein and then synthesise appropriate
oligonucleotide sequences chemically. Due to the degeneracy of the
genetic code, most amino acids are coded for by more than one codon,
hence there will be more than one possible nucleotide sequence which
could code for a given polypeptide. The longer the polypeptide, the
greater is the number of possible oligonucleotides which must be syn-
thesised. Fortunately, there is no need to synthesise a sequence longer
than about 20 bases, since this should hybridise efficiently with any
complementary sequences and should be specific for one gene. Ideally, a
section of the protein should be chosen which contains as many trypto-
phan and methionine residues as possible, since these have unique codons
and there will therefore be fewer possible base sequences which could
code for that part of the protein. The synthetic oligonucleotides can then
be used as probes in a number of molecular biology methods.
1.7 LABELLING DNA GENE PROBE MOLECULES
An essential feature of a gene probe is that it can be visualised by some
means. In this way, a gene probe that hybridises to a complementary
sequence may be detected and identify that desired sequence from a
complex mixture. There are two main ways of labelling gene probes;
traditionally it has been carried out using radioactive labels, but gaining
in popularity are non-radioactive labels. Perhaps the most often used
radioactive label is phosphorus-32 (32P), although for certain techniques
sulfur-35 (35S) and tritium (3H) are used. These may be detected by the
process of autoradiography, where the labelled probe molecule, bound
to sample DNA, located for example on a nylon membrane, is placed in
contact with an X-ray-sensitive film. Following exposure, the film is
developed and fixed just as a black and white negative and reveals the
precise location of the labelled probe and therefore the DNA to which it
has hybridised.
12 Chapter 1

Non-radioactive labels are increasingly being used to label DNA gene
probes. Until recently, radioactive labels were more sensitive than their
non-radioactive counterparts. However, recent developments have led
to similar sensitivities, which, when combined with their improved
safety, have led to their greater acceptance.
The labelling systems are termed either direct or indirect. Direct
labelling allows an enzyme reporter such as alkaline phosphatase to be
coupled directly to the DNA. Although this may alter the characteristics
of the DNA gene probe, they offer the advantage of rapid analysis since
no intermediate steps are needed. However, indirect labelling is at pre-
sent more popular. This relies on the incorporation of a nucleotide
which has a label attached. At present, three of the main labels in use are
biotin, fluorescein and digoxygenin. These molecules are covalently
linked to nucleotides using a carbon spacer arm of 7, 14 or 21 atoms.
Specific binding proteins may then be used as a bridge between the
nucleotide and a reporter protein such as an enzyme. For example,
biotin incorporated into a DNA fragment is recognised with a very high
affinity by the protein streptavidin. This may be either coupled or con-
jugated to a reporter enzyme molecule such as alkaline phosphatase.
This is able to convert a colourless substrate, p-nitrophenol phosphate
(PNPP), into a yellow compound, p-nitrophenol (PNP), and also offers a
means of signal amplification. Alternatively labels such as digoxygenin
incorporated into DNA sequences may be detected by monoclonal
antibodies, again conjugated to reporter molecules including alkaline
phosphatase. Thus, rather than the detection system relying on auto-
radiography, which is necessary for radiolabels, a series of reactions
resulting in either a colour or a light or chemiluminescent reaction takes
place. This has important practical implications since autoradiography
may take 1–3 days, whereas colour and chemiluminescent reactions take
minutes.
1.7.1 End Labelling of DNA Molecules
The simplest form of labelling DNA is by 50 or 30 end labelling; 50 end
labelling involves a phosphate transfer or exchange reaction where the
50 phosphate of the DNA to be used as the probe is removed and in its
place a labelled phosphate, usually 32P, is added. This is usually carried
out by using two enzymes; the first, alkaline phosphatase, is used to
remove the existing phosphate group from the DNA. Following removal
of the released phosphate from the DNA, a second enzyme, poly-
nucleotide kinase, is added, which catalyses the transfer of a phosphate
group (32P-labelled) to the 50 end of the DNA. The newly labelled probe
13Basic Molecular Biology Techniques
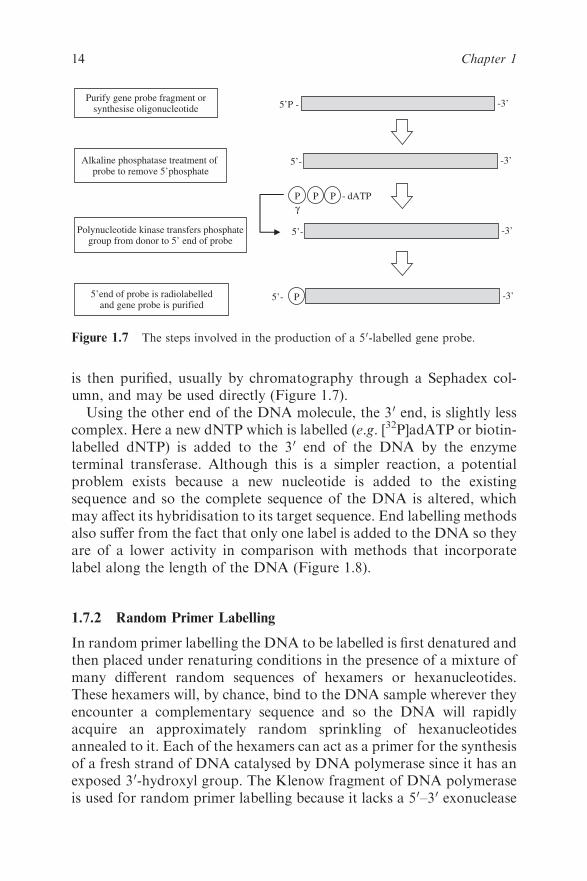
is then purified, usually by chromatography through a Sephadex col-
umn, and may be used directly (Figure 1.7).
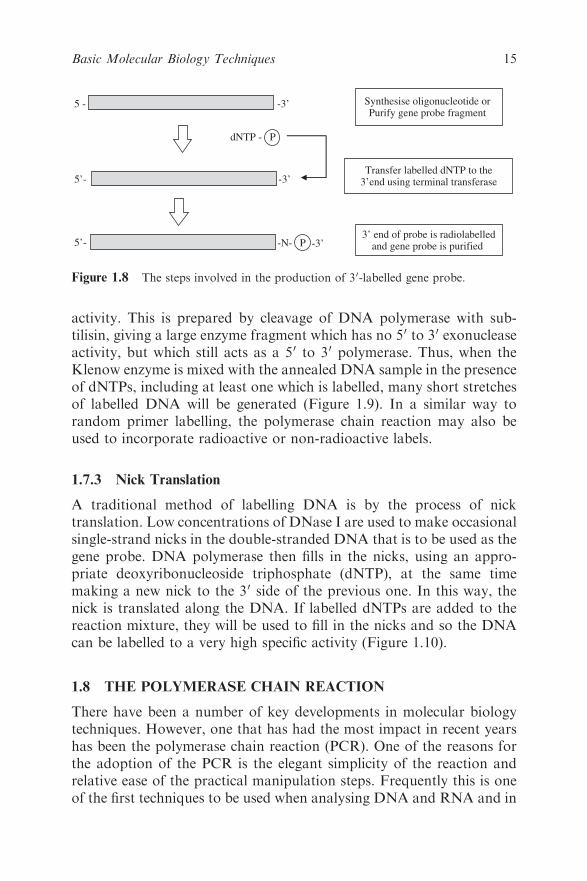
Using the other end of the DNA molecule, the 30 end, is slightly less
complex. Here a new dNTP which is labelled (e.g. [32P]adATP or biotin-
labelled dNTP) is added to the 30 end of the DNA by the enzyme
terminal transferase. Although this is a simpler reaction, a potential
problem exists because a new nucleotide is added to the existing
sequence and so the complete sequence of the DNA is altered, which
may affect its hybridisation to its target sequence. End labelling methods
also suffer from the fact that only one label is added to the DNA so they
are of a lower activity in comparison with methods that incorporate
label along the length of the DNA (Figure 1.8).
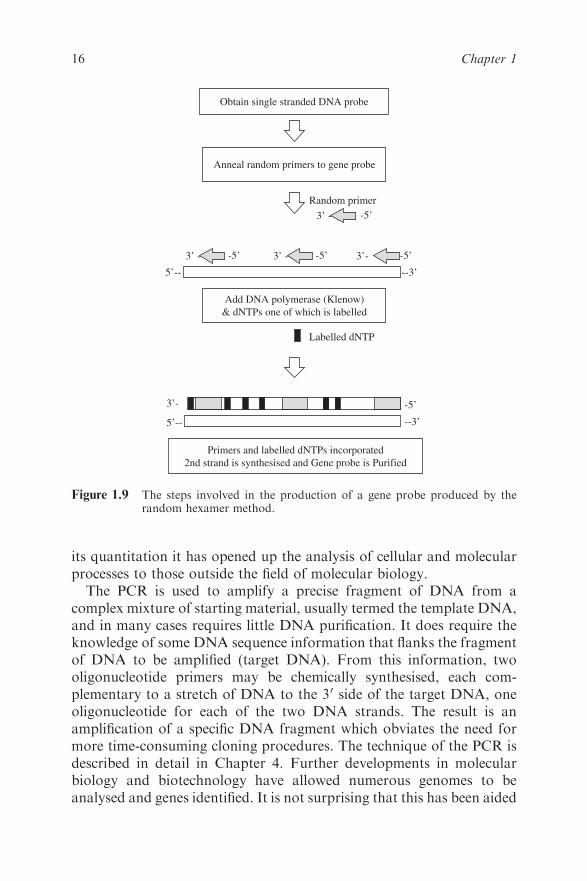
1.7.2 Random Primer Labelling
In random primer labelling the DNA to be labelled is first denatured and
then placed under renaturing conditions in the presence of a mixture of
many different random sequences of hexamers or hexanucleotides.
These hexamers will, by chance, bind to the DNA sample wherever they
encounter a complementary sequence and so the DNA will rapidly
acquire an approximately random sprinkling of hexanucleotides
annealed to it. Each of the hexamers can act as a primer for the synthesis
of a fresh strand of DNA catalysed by DNA polymerase since it has an
exposed 30-hydroxyl group. The Klenow fragment of DNA polymerase
is used for random primer labelling because it lacks a 50–30 exonuclease
Purify gene probe fragment orsynthesise oligonucleotide
Alkaline phosphatase treatment of probe to remove 5’phosphate
-3’
Polynucleotide kinase transfers phosphategroup from donor to 5’ end of probe
-3’
-3’5’P -
5’-
5’-
P P P - dATP
5’end of probe is radiolabelledand gene probe is purified
-3’5’- P
γ
Figure 1.7 The steps involved in the production of a 50-labelled gene probe.
14 Chapter 1
activity. This is prepared by cleavage of DNA polymerase with sub-
tilisin, giving a large enzyme fragment which has no 50 to 30 exonuclease
activity, but which still acts as a 50 to 30 polymerase. Thus, when the
Klenow enzyme is mixed with the annealed DNA sample in the presence
of dNTPs, including at least one which is labelled, many short stretches
of labelled DNA will be generated (Figure 1.9). In a similar way to
random primer labelling, the polymerase chain reaction may also be
used to incorporate radioactive or non-radioactive labels.
1.7.3 Nick Translation
A traditional method of labelling DNA is by the process of nick
translation. Low concentrations of DNase I are used to make occasional
single-strand nicks in the double-stranded DNA that is to be used as the
gene probe. DNA polymerase then fills in the nicks, using an appro-
priate deoxyribonucleoside triphosphate (dNTP), at the same time
making a new nick to the 30 side of the previous one. In this way, the
nick is translated along the DNA. If labelled dNTPs are added to the
reaction mixture, they will be used to fill in the nicks and so the DNA
can be labelled to a very high specific activity (Figure 1.10).
1.8 THE POLYMERASE CHAIN REACTION
There have been a number of key developments in molecular biology
techniques. However, one that has had the most impact in recent years
has been the polymerase chain reaction (PCR). One of the reasons for
the adoption of the PCR is the elegant simplicity of the reaction and
relative ease of the practical manipulation steps. Frequently this is one
of the first techniques to be used when analysing DNA and RNA and in
Synthesise oligonucleotide or Purify gene probe fragment
Transfer labelled dNTP to the3’end using terminal transferase-3’
-3’5 -
5’-
5’-3’ end of probe is radiolabelled
and gene probe is purified
dNTP - P
P -3’-N-
Figure 1.8 The steps involved in the production of 30-labelled gene probe.
15Basic Molecular Biology Techniques
its quantitation it has opened up the analysis of cellular and molecular
processes to those outside the field of molecular biology.
The PCR is used to amplify a precise fragment of DNA from a
complex mixture of starting material, usually termed the template DNA,
and in many cases requires little DNA purification. It does require the
knowledge of some DNA sequence information that flanks the fragment
of DNA to be amplified (target DNA). From this information, two
oligonucleotide primers may be chemically synthesised, each com-
plementary to a stretch of DNA to the 30 side of the target DNA, one
oligonucleotide for each of the two DNA strands. The result is an
amplification of a specific DNA fragment which obviates the need for
more time-consuming cloning procedures. The technique of the PCR is
described in detail in Chapter 4. Further developments in molecular
biology and biotechnology have allowed numerous genomes to be
analysed and genes identified. It is not surprising that this has been aided
Random primer
Labelled dNTP
Obtain single stranded DNA probe
5’-- --3’
Primers and labelled dNTPs incorporated
2nd strand is synthesised and Gene probe is Purified
-5’3’ -
Anneal random primers to gene probe
-5’3’--5’3’ --5’3’ -
Add DNA polymerase (Klenow)
& dNTPs one of which is labelled
5’-- --3’
-5’3’-
Figure 1.9 The steps involved in the production of a gene probe produced by therandom hexamer method.
16 Chapter 1

by the developments in the area of bioinformatics and whole genome
analysis.13 DNA databases and other nucleic acid sequence and protein
analysis software may all be accessed over the internet given the relevant
software and authority (Table 1.3). This is now relatively straightforward
with web browsers that provide a user-friendly graphical interface for
sequence manipulation. Consequently, the new expanding and exciting
areas of bioscience research are those that analyse genome and DNA
sequence databases, (genomics) and also their protein counterparts
G C G T A A G5’ - -3’
C G C A T T C3’ - -5’
One strand is nicked and
nucleotide removed by DNaseI
G G T A A G5’ - -3’
C G C A T T C3’ - -5’
Gap filled by labelled dNTP
next nucleotide removed by
DNA pol I
G C T A A G5’ - -3’
C G C A T T C3’ - -5’
dCTP
G C G A A G5’ - -3’
C G C A T T C3’ - -5’
dGTP
G C G T A G5’ - -3’
C G C A T T C3’ - -5’
dTTP
Nick moves from 5’ to 3’
Figure 1.10 The steps involved in the production of a gene probe by the nick trans-lation method.
17Basic Molecular Biology Techniques
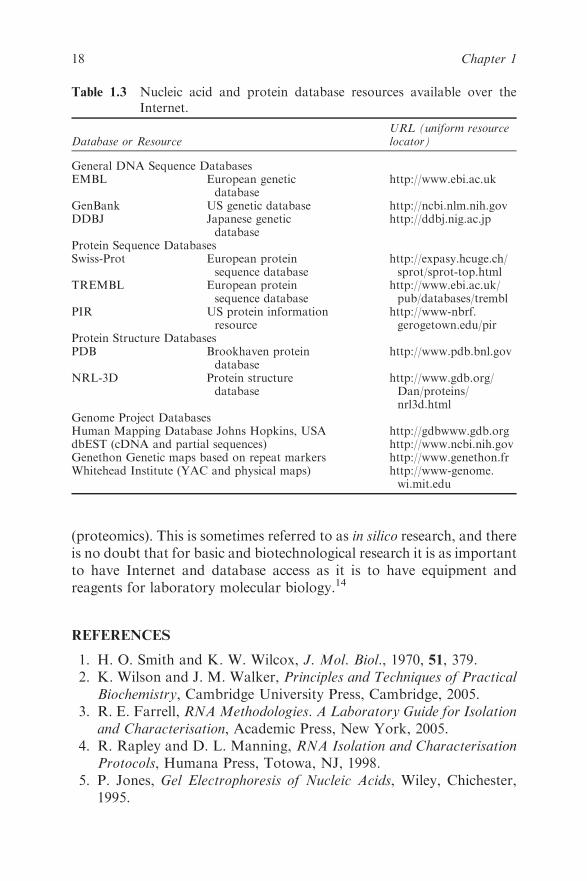
(proteomics). This is sometimes referred to as in silico research, and there
is no doubt that for basic and biotechnological research it is as important
to have Internet and database access as it is to have equipment and
reagents for laboratory molecular biology.14
REFERENCES
1. H. O. Smith and K. W. Wilcox, J. Mol. Biol., 1970, 51, 379.
2. K. Wilson and J. M. Walker, Principles and Techniques of Practical
Biochemistry, Cambridge University Press, Cambridge, 2005.
3. R. E. Farrell, RNAMethodologies. A Laboratory Guide for Isolation
and Characterisation, Academic Press, New York, 2005.
4. R. Rapley and D. L. Manning, RNA Isolation and Characterisation
Protocols, Humana Press, Totowa, NJ, 1998.
5. P. Jones, Gel Electrophoresis of Nucleic Acids, Wiley, Chichester,
1995.
Table 1.3 Nucleic acid and protein database resources available over the
Internet.
Database or ResourceURL (uniform resourcelocator)
General DNA Sequence DatabasesEMBL European genetic
databasehttp://www.ebi.ac.uk
GenBank US genetic database http://ncbi.nlm.nih.govDDBJ Japanese genetic
databasehttp://ddbj.nig.ac.jp
Protein Sequence DatabasesSwiss-Prot European protein
sequence databasehttp://expasy.hcuge.ch/sprot/sprot-top.html
TREMBL European proteinsequence database
http://www.ebi.ac.uk/pub/databases/trembl
PIR US protein informationresource
http://www-nbrf.gerogetown.edu/pir
Protein Structure DatabasesPDB Brookhaven protein
databasehttp://www.pdb.bnl.gov
NRL-3D Protein structuredatabase
http://www.gdb.org/Dan/proteins/nrl3d.html
Genome Project DatabasesHuman Mapping Database Johns Hopkins, USA http://gdbwww.gdb.orgdbEST (cDNA and partial sequences) http://www.ncbi.nih.govGenethon Genetic maps based on repeat markers http://www.genethon.frWhitehead Institute (YAC and physical maps) http://www-genome.
wi.mit.edu
18 Chapter 1
6. G. J. S. Jenkins, in Molecular Biomethods Handbook, 2nd edn, ed.
R. Rapley and J. M. Walker, Humana Press, Totowa, NJ, 2008,
pp. 17–27.
7. L. Chen, A. Manz and P. J. Day, Lab Chip, 2007, 7, 1413.
8. E. M. Southern, J. Mol. Biol., 1975, 98, 503.
9. J. C. Alwine, D. J. Kemp and G. R. Stark, Proc. Natl. Acad. Sci.
USA, 1977, 74, 5350.
10. M. Aquino de Muro, in Molecular Biomethods Handbook, 2nd edn,
ed. R. Rapley and J. M. Walker, Humana Press, Totowa, NJ, 2008,
pp. 41–54.
11. G. J. Hannon, RNAi. A Guide to Gene Silencing, Cold Spring
Harbor Laboratory Press, Cold Spring Harbor, NY, 2003.
12. T. P. McCreery and T. R. Barrette, in Molecular Biomethods
Handbook, ed. R. Rapley and J. M. Walker, Humana Press,
Totowa, NJ, 1998, pp. 73–76.
13. A. D. Baxevanis and B. F. Ouelette, Bioinformatics. A Practical
Guide to the Analysis of Genes and Proteins, Wiley, Chichester, 2004.
14. D. W. Mount, Bioinformatics Sequence and Genome Analysis, Cold
Spring Harbor Laboratory Press, Cold Spring Harbor, NY, 2004.
19Basic Molecular Biology Techniques

CHAPTER 2
Molecular Cloning and ProteinExpression
STUART HARBRON
The Enzyme Technology Consultancy, 44 Swing Gate Lane, Berkhamsted,
Hertfordshire HP4 2LL, UK
2.1 INTRODUCTION
Molecular cloning is a process for manipulating DNA that differs from
cell cloning and whole animal cloning (although some of the steps
involved in the process are common). Molecular cloning is used not only
for gaining a better understanding of the structure, function and control
of genes and their gene products, but also for commercial exploitation of
proteins. Producing recombinant proteins in forms that are biologically
useful is a key challenge to the pharmaceutical industry and molecular
cloning leading to expression of proteins of interest is the main focus of
this chapter.
Bacterial expression systems are highly attractive in this respect for a
number of reasons, including:
� their rapid growth rates;
� their ability to use relatively inexpensive substrates;
� their well-characterised genetics;
� the availability of a large number of cloning vectors; and
� a variety of mutant host strains.
Molecular Biology and Biotechnology, 5th Edition
Edited by John M Walker and Ralph Rapleyr Royal Society of Chemistry 2009
Published by the Royal Society of Chemistry, www.rsc.org
20
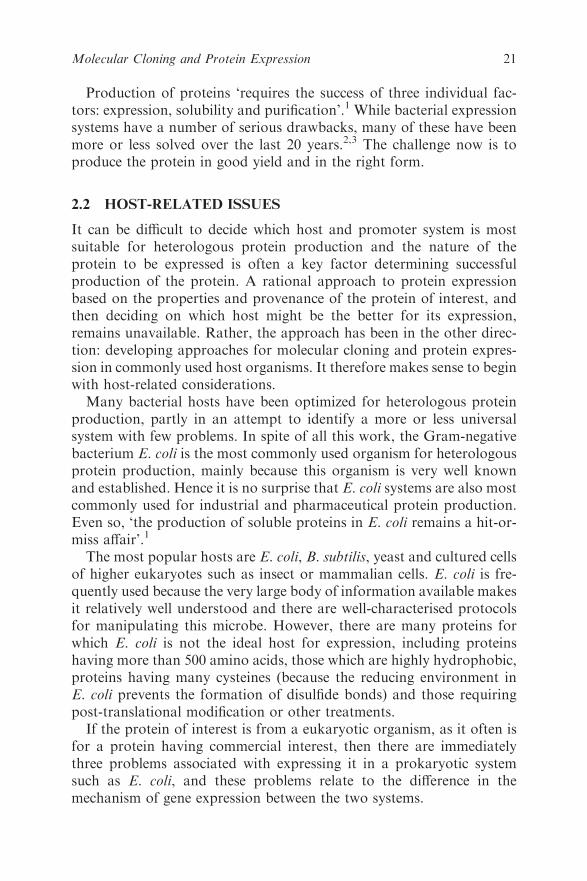
Production of proteins ‘requires the success of three individual fac-
tors: expression, solubility and purification’.1 While bacterial expression
systems have a number of serious drawbacks, many of these have been
more or less solved over the last 20 years.2,3 The challenge now is to
produce the protein in good yield and in the right form.
2.2 HOST-RELATED ISSUES
It can be difficult to decide which host and promoter system is most
suitable for heterologous protein production and the nature of the
protein to be expressed is often a key factor determining successful
production of the protein. A rational approach to protein expression
based on the properties and provenance of the protein of interest, and
then deciding on which host might be the better for its expression,
remains unavailable. Rather, the approach has been in the other direc-
tion: developing approaches for molecular cloning and protein expres-
sion in commonly used host organisms. It therefore makes sense to begin
with host-related considerations.
Many bacterial hosts have been optimized for heterologous protein
production, partly in an attempt to identify a more or less universal
system with few problems. In spite of all this work, the Gram-negative
bacterium E. coli is the most commonly used organism for heterologous
protein production, mainly because this organism is very well known
and established. Hence it is no surprise that E. coli systems are also most
commonly used for industrial and pharmaceutical protein production.
Even so, ‘the production of soluble proteins in E. coli remains a hit-or-
miss affair’.1
The most popular hosts are E. coli, B. subtilis, yeast and cultured cells
of higher eukaryotes such as insect or mammalian cells. E. coli is fre-
quently used because the very large body of information available makes
it relatively well understood and there are well-characterised protocols
for manipulating this microbe. However, there are many proteins for
which E. coli is not the ideal host for expression, including proteins
having more than 500 amino acids, those which are highly hydrophobic,
proteins having many cysteines (because the reducing environment in
E. coli prevents the formation of disulfide bonds) and those requiring
post-translational modification or other treatments.
If the protein of interest is from a eukaryotic organism, as it often is
for a protein having commercial interest, then there are immediately
three problems associated with expressing it in a prokaryotic system
such as E. coli, and these problems relate to the difference in the
mechanism of gene expression between the two systems.
21Molecular Cloning and Protein Expression
First, bacteria are not capable of processing RNA to remove introns.
Fortunately, this can be more or less easily overcome by generating
double-stranded DNA copies of mRNA molecules isolated from the
eukaryotic organism by using the mRNA as a template with a reverse
transcriptase. This double-stranded copy, or cDNA, will not contain
introns and can act as the coding sequence in expression vectors. Con-
verting the eukaryotic sequence of interest is not entirely without its
drawbacks, the most serious of which is if the mRNA is only present as a
small constituent of a eukaryotic cell’s mRNA population, because
purification of the mRNA can be difficult. Another potential issue is that
random termination of reverse transcription prior to completion of
complementary strand synthesis can occur, which means that the cDNA
sequence does not always include the 50 end of the gene. The problem of
introns has also been addressed by synthesising fragments of the gene
chemically and subsequent ligation, but this presupposes that the amino
acid sequence of the protein of interest is known.4–7
Second, the RNA polymerase of a prokaryotic host will not bind to
and transcribe the gene encoding the protein of interest unless it has an
appropriate promoter sequences upstream of the coding region. Since the
sequence and position of promoters are specific to each host, the choice
of promoter is vital for correct and efficient transcription. Although
many promoter sequences for E. coli are known, not a large number of
them are useful. To be useful as tools for protein expression, the pro-
moter must be strong, have a low basal expression, be easily transferred,
be easily and economically induced and be unaffected by commonly used
ingredients in culture media. Basal transcription, which is transcription
in the absence of the inducer, can be dealt with through the use of a
suitable repressor: this is especially important if the expression target
introduces cellular stress, which would select for plasmid loss. Either
thermal or chemical triggers can be used to initiate promoter induction
and some commonly used systems are listed in Table 2.1.8
Finally, prokaryotic ribosomes will not bind to the mRNA produced
by transcription unless there is a ribosome-binding site (RBS) on the
mRNA, just before the coding region. Initiation of translation can be a
significant limiting factor in expression of cloned genes.16 Translation
initiation from the translation initiation region of the transcribed mes-
senger RNA requires an RBS and a translation initiation codon.17
Efficiency of translation initiation is influenced by the codon following
the initiation codon and abundant adenine seems to lead to highly
expressed genes.18 In addition to an initiation codon, AUG, other
nucleotides, particularly in the 50 untranslated leader of the mRNA, are
needed to create suitable secondary and tertiary structures in mRNA
22 Chapter 2
and facilitate interaction between the mRNA and the ribosome. Perhaps
the best known of these sequences is the Shine–Dalgarno (S–D)
sequence, which is essential for translation. This sequence is located
7� 2 nucleotides upstream from the initiation codon, which is the
canonical AUG in efficient recombinant expression systems.19 It allows
a complex to form between the mRNA and the 30S subunit of the
ribosome via hydrogen bonding to the 16S rRNA. Not all E. coli
mRNAs have an identical S–D sequence but a consensus can be identi-
fied. Optimal translation initiation is obtained from mRNAs with the
SD sequence UAAGGAGG. The RBS secondary structure is highly
important for translation initiation and efficiency is improved by high
contents of adenine and thymine.20
Other sequences that increase the level of translation include trans-
lation enhancers such as the Epsilon sequence in the g10L ribosome-
binding site of phage T7.21,22
A transcription terminator placed downstream from the sequence
encoding the target gene enhances plasmid stability by preventing
transcription through the origin of replication and from irrelevant
promoters located in the plasmid. Transcription terminators stabilize
the mRNA by forming a stem loop at the three prime end.23
Translation termination is preferably mediated by the stop codon
UAA in E. coli. Increased efficiency of translation termination is achieved
by insertion of consecutive stop codons or the UAAU stop codon.24
To obtain expression of foreign genes in E. coli, it is necessary to
incorporate ribosome-binding motifs into the recombinant DNA mole-
cule. Furthermore, some sequences (such as the S–D sequence) must be
located at an optimal distance from the translation start codon. This is
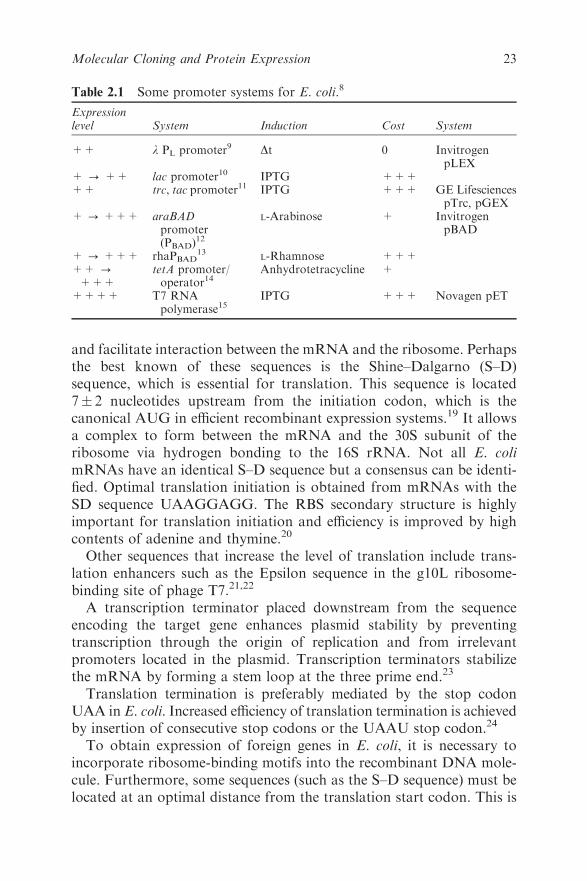
Table 2.1 Some promoter systems for E. coli.8
Expressionlevel System Induction Cost System
++ l PL promoter9 Dt 0 InvitrogenpLEX
+ - ++ lac promoter10 IPTG +++++ trc, tac promoter11 IPTG +++ GE Lifesciences
pTrc, pGEX+ - +++ araBAD
promoter(PBAD)
12
L-Arabinose + InvitrogenpBAD
+ - +++ rhaPBAD13
L-Rhamnose +++++ -
+++tetA promoter/operator14
Anhydrotetracycline +
++++ T7 RNApolymerase15
IPTG +++ Novagen pET
23Molecular Cloning and Protein Expression
most readily achieved by construction of fusion genes where an entire
untranslated leader and 50 coding sequence from a naturally occurring
gene is present. Nonetheless, all expression cassettes need to be tested
thoroughly and sequences reorganized if necessary to optimise transla-
tion initiation.
2.3 VECTORS
To counter some of the issues related to the capabilities of the host,
expression vectors have been developed which contain promoter and
ribosome-binding sites positioned just before one or more sites for
restriction endonucleases to allow the insertion of foreign DNA. These
regulatory sequences, such as that from the lac operon of E. coli, are
usually derived from genes which, when induced, are strongly expressed
in bacteria. Since the mRNA produced from the gene is read as triplet
codons, the inserted sequence must be placed so that its reading frame is
in phase with the regulatory sequence. Experimentally this can be
achieved by using three vectors which differ only in the number of bases
between promoter and insertion site, the second and third vectors being
respectively one and two bases longer than the first. When the insert is
cloned using all three vectors and the resulting clones can be screened for
the production of a functional foreign protein, it should be in the correct
reading frame in one of them.
Expression vectors are DNA constructs that are stably maintained
and propagated in a host. For a typical bacterial host, such as E.coli
which grows and divides rapidly, the expression vector is ideally derived
from a gene which, when induced, is strongly expressed. Expression
vectors vary in their complexity, ease of manipulation and the length of
DNA sequence they can accommodate (the insert capacity). Vectors
have in general been developed from naturally occurring entities such as
bacterial plasmids, bacteriophages or combinations of their constituent
elements, such as cosmids. For applications to do with the expression of
proteins, plasmids are the most important of these. A plasmid is an
autonomously replicating, extrachromosomal circular DNA molecule,
distinct from the normal bacterial genome and non-essential for cell
survival under non-selective conditions. Some plasmids are capable of
integrating into the host genome. Genes carried by plasmids often
include those for conferring antibiotic resistance, to allow conjugation
or for the metabolism of ‘unusual’ substrates. These are attractive
candidates for modification for use as vectors, particularly if they are
replicated at a high rate and are not easily ‘lost’ from the host in
non-selective conditions. It is clear from the previous section that a
24 Chapter 2
number of key elements are more or less essential to the design of these
vectors.25,26
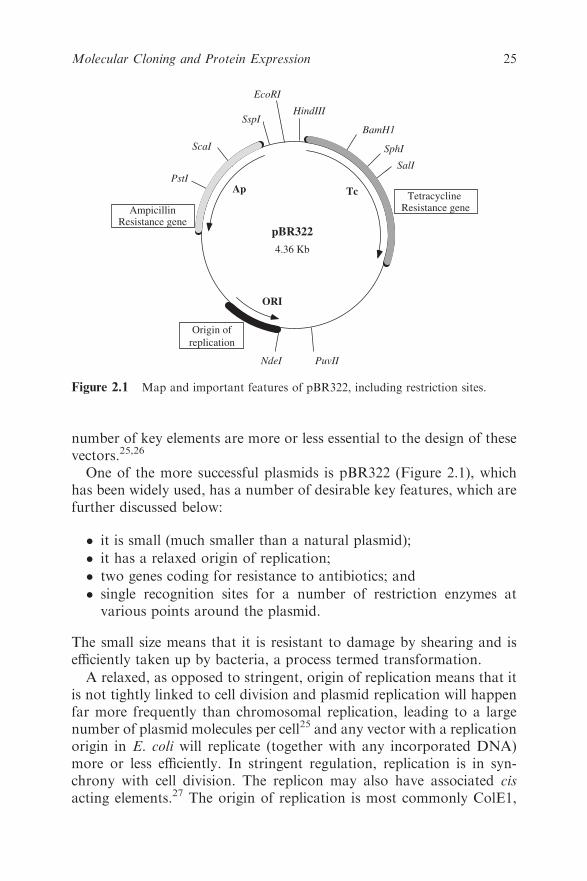
One of the more successful plasmids is pBR322 (Figure 2.1), which
has been widely used, has a number of desirable key features, which are
further discussed below:
� it is small (much smaller than a natural plasmid);
� it has a relaxed origin of replication;
� two genes coding for resistance to antibiotics; and
� single recognition sites for a number of restriction enzymes at
various points around the plasmid.
The small size means that it is resistant to damage by shearing and is
efficiently taken up by bacteria, a process termed transformation.
A relaxed, as opposed to stringent, origin of replication means that it
is not tightly linked to cell division and plasmid replication will happen
far more frequently than chromosomal replication, leading to a large
number of plasmid molecules per cell25 and any vector with a replication
origin in E. coli will replicate (together with any incorporated DNA)
more or less efficiently. In stringent regulation, replication is in syn-
chrony with cell division. The replicon may also have associated cis
acting elements.27 The origin of replication is most commonly ColE1,
HindIII
BamH1
SphI
SalI
PuvIINdeI
PstI
ScaI
SspI
EcoRI
Tc
ORI
Ap
pBR322
4.36 Kb
Tetracycline Resistance geneAmpicillin
Resistance gene
Origin of
replication
Figure 2.1 Map and important features of pBR322, including restriction sites.
25Molecular Cloning and Protein Expression

as in pBR322 (copy number 15–20) or pUC (copy number 500–700) or
p15A, as in pACYC184 (copy number 10–12). These multi-copy plas-
mids are stably replicated and maintained under selective conditions and
plasmid-free daughter cells are rare.28 Different replicon incompatibility
groups and drug resistance markers are required when multiple plasmids
are employed for the co-expression of gene products. Derivatives con-
taining ColE1 and p15A replicons are often combined in this context
since they are compatible plasmids,29 meaning that they may be stably
maintained in the same cell.30
One of the antibiotic resistance genes allows cells that contain the
plasmid to be selected: if cells are plated on medium containing an
appropriate antibiotic, only those that contain plasmid will grow to form
colonies. The other resistance gene can be used, as described below, for
detection of those plasmids that contain inserted DNA. The most com-
mon drug resistance markers in recombinant expression plasmids confer
resistance to ampicillin, kanamycin, chloramphenicol or tetracycline.
Plasmid-mediated resistance to ampicillin is accomplished by expression
of b-lactamase from the bla gene. This enzyme is secreted to the peri-
plasm, where it catalyses hydrolysis of the b-lactam ring. Ampicillin
present in the cultivation medium is especially susceptible to degradation,
either by secreted b-lactamase or acidic conditions in high-density cul-
tures. The latter effect can be alleviated by the use of analogues that are
less susceptible to degradation, such as carbenicillin or by kanamycin,
chloramphenicol or tetracycline, which interfere with protein synthesis by
binding to critical areas of the ribosome. Kanamycin is inactivated in the
periplasm by aminoglycoside phosphotransferases and chloramphenicol
by the cat gene product, chloramphenicol acetyl transferase. Various
genes confer resistance to tetracycline.31
Recognition sites for restriction enzymes are used to open or linearise
the circular plasmid. Linearising a plasmid allows a fragment of DNA to
be inserted and the circle closed. The variety of sites not only makes it
easier to find a restriction enzyme which is suitable for both the vector
and the foreign DNA to be inserted, but also, since some of the sites are
placed within an antibiotic resistance gene, the presence of an insert can
be detected by loss of resistance to that antibiotic. This is termed
insertional inactivation.
The protocol utilised for using a plasmid such as pBR322 to introduce
DNA encoding the protein of interest into the host cell is summarised
below.
First, a fragment of DNA encoding the protein of interest and digested
with BamH1 is isolated and purified or produced via polymerase chain
reaction (PCR). Plasmid pBR322 is also treated with BamH1 and both
26 Chapter 2
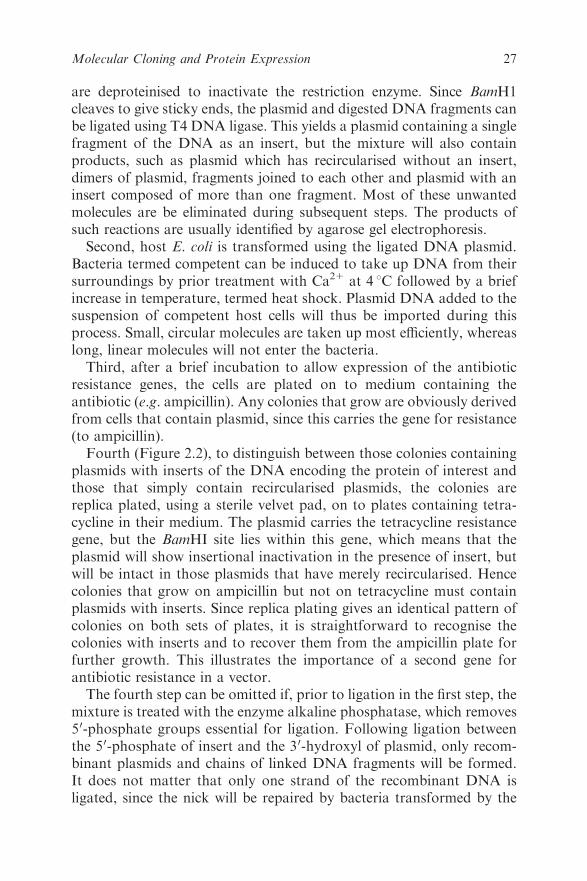
are deproteinised to inactivate the restriction enzyme. Since BamH1
cleaves to give sticky ends, the plasmid and digested DNA fragments can
be ligated using T4 DNA ligase. This yields a plasmid containing a single
fragment of the DNA as an insert, but the mixture will also contain
products, such as plasmid which has recircularised without an insert,
dimers of plasmid, fragments joined to each other and plasmid with an
insert composed of more than one fragment. Most of these unwanted
molecules are be eliminated during subsequent steps. The products of
such reactions are usually identified by agarose gel electrophoresis.
Second, host E. coli is transformed using the ligated DNA plasmid.
Bacteria termed competent can be induced to take up DNA from their
surroundings by prior treatment with Ca21 at 4 1C followed by a brief
increase in temperature, termed heat shock. Plasmid DNA added to the
suspension of competent host cells will thus be imported during this
process. Small, circular molecules are taken up most efficiently, whereas
long, linear molecules will not enter the bacteria.
Third, after a brief incubation to allow expression of the antibiotic
resistance genes, the cells are plated on to medium containing the
antibiotic (e.g. ampicillin). Any colonies that grow are obviously derived
from cells that contain plasmid, since this carries the gene for resistance
(to ampicillin).
Fourth (Figure 2.2), to distinguish between those colonies containing
plasmids with inserts of the DNA encoding the protein of interest and
those that simply contain recircularised plasmids, the colonies are
replica plated, using a sterile velvet pad, on to plates containing tetra-
cycline in their medium. The plasmid carries the tetracycline resistance
gene, but the BamHI site lies within this gene, which means that the
plasmid will show insertional inactivation in the presence of insert, but
will be intact in those plasmids that have merely recircularised. Hence
colonies that grow on ampicillin but not on tetracycline must contain
plasmids with inserts. Since replica plating gives an identical pattern of
colonies on both sets of plates, it is straightforward to recognise the
colonies with inserts and to recover them from the ampicillin plate for
further growth. This illustrates the importance of a second gene for
antibiotic resistance in a vector.
The fourth step can be omitted if, prior to ligation in the first step, the
mixture is treated with the enzyme alkaline phosphatase, which removes
50-phosphate groups essential for ligation. Following ligation between
the 50-phosphate of insert and the 30-hydroxyl of plasmid, only recom-
binant plasmids and chains of linked DNA fragments will be formed.
It does not matter that only one strand of the recombinant DNA is
ligated, since the nick will be repaired by bacteria transformed by the
27Molecular Cloning and Protein Expression
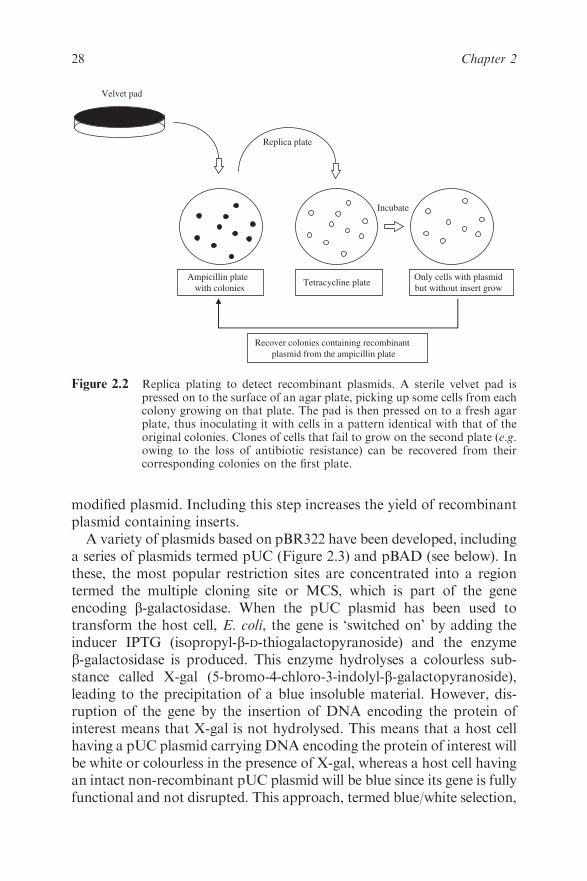
modified plasmid. Including this step increases the yield of recombinant
plasmid containing inserts.
A variety of plasmids based on pBR322 have been developed, including
a series of plasmids termed pUC (Figure 2.3) and pBAD (see below). In
these, the most popular restriction sites are concentrated into a region
termed the multiple cloning site or MCS, which is part of the gene
encoding b-galactosidase. When the pUC plasmid has been used to
transform the host cell, E. coli, the gene is ‘switched on’ by adding the
inducer IPTG (isopropyl-b-D-thiogalactopyranoside) and the enzyme
b-galactosidase is produced. This enzyme hydrolyses a colourless sub-
stance called X-gal (5-bromo-4-chloro-3-indolyl-b-galactopyranoside),
leading to the precipitation of a blue insoluble material. However, dis-
ruption of the gene by the insertion of DNA encoding the protein of
interest means that X-gal is not hydrolysed. This means that a host cell
having a pUC plasmid carrying DNA encoding the protein of interest will
be white or colourless in the presence of X-gal, whereas a host cell having
an intact non-recombinant pUC plasmid will be blue since its gene is fully
functional and not disrupted. This approach, termed blue/white selection,
Ampicillin plate
with coloniesTetracycline plate
Only cells with plasmid
but without insert grow
Incubate
Replica plate
Velvet pad
Recover colonies containing recombinant
plasmid from the ampicillin plate
Figure 2.2 Replica plating to detect recombinant plasmids. A sterile velvet pad ispressed on to the surface of an agar plate, picking up some cells from eachcolony growing on that plate. The pad is then pressed on to a fresh agarplate, thus inoculating it with cells in a pattern identical with that of theoriginal colonies. Clones of cells that fail to grow on the second plate (e.g.owing to the loss of antibiotic resistance) can be recovered from theircorresponding colonies on the first plate.
28 Chapter 2
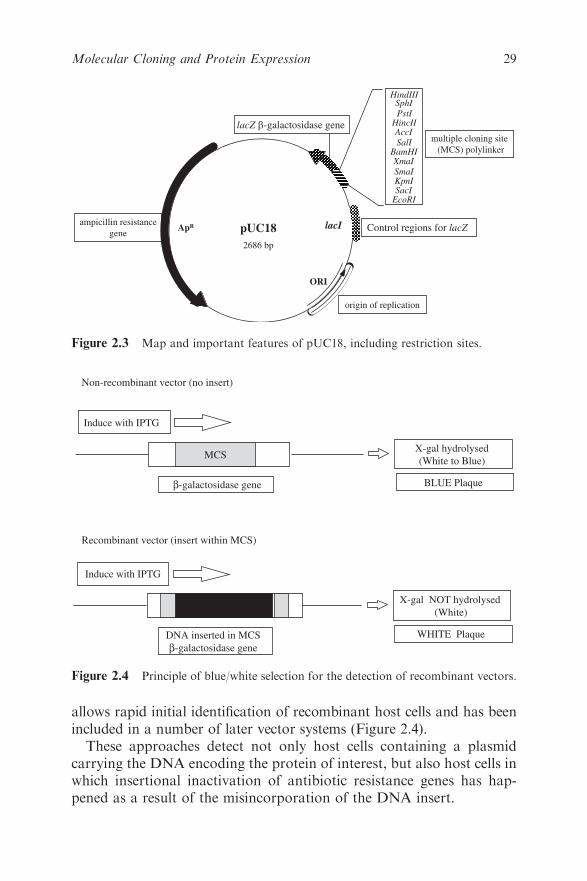
allows rapid initial identification of recombinant host cells and has been
included in a number of later vector systems (Figure 2.4).
These approaches detect not only host cells containing a plasmid
carrying the DNA encoding the protein of interest, but also host cells in
which insertional inactivation of antibiotic resistance genes has hap-
pened as a result of the misincorporation of the DNA insert.
EcoRI
KpnISmaI
XmaIBamHI
SalI
AccIHincII
PstISphI
HindIII
lacI
ORI
ApR pUC18
2686 bp
SacI
ampicillin resistance
gene
origin of replication
multiple cloning site
(MCS) polylinker
lacZ β-galactosidase gene
Control regions for lacZ
Figure 2.3 Map and important features of pUC18, including restriction sites.
X-gal hydrolysed
(White to Blue)
β-galactosidase gene
MCS
Induce with IPTG
BLUE Plaque
X-gal NOT hydrolysed
(White)
DNA inserted in MCS
β-galactosidase gene
Induce with IPTG
WHITE Plaque
Non-recombinant vector (no insert)
Recombinant vector (insert within MCS)
Figure 2.4 Principle of blue/white selection for the detection of recombinant vectors.
29Molecular Cloning and Protein Expression
2.4 EXPRESSION SYSTEMS
Fortunately, not only have plasmid vectors been developed which
contain promoter and ribosome-binding sites positioned just before one
or more restriction sites that allow the facile insertion of the DNA
encoding the protein of interest, they have also been made available
commercially. Indeed, a wide range of expression systems based on
different promoters is available.3,32 Table 2.1 shows some of the com-
monly used systems, including the T7-based pET expression system
(commercialised by Novagen) and one based on the araBAD promoter
(e.g. Invitrogen pBAD), which are discussed below.
2.4.1 The pET Expression System
This system, which includes hybrid promoters, multiple cloning sites for
the incorporation of different fusion partners and protease cleavage
sites, has been developed for a variety of expression applications.33,34
The pET plasmid, shown in Figure 2.5, is a 5.4 kb construct having the
following elements:
� lacI codes for the lac repressor protein� ampR codes for ampicillin resistance� ori col E1 origin of replication� lacO codes for the lac operon
ori
lacI
pET
ampR
PT7 lacO ATG MCS TT7
Figure 2.5 pET plasmid.
30 Chapter 2
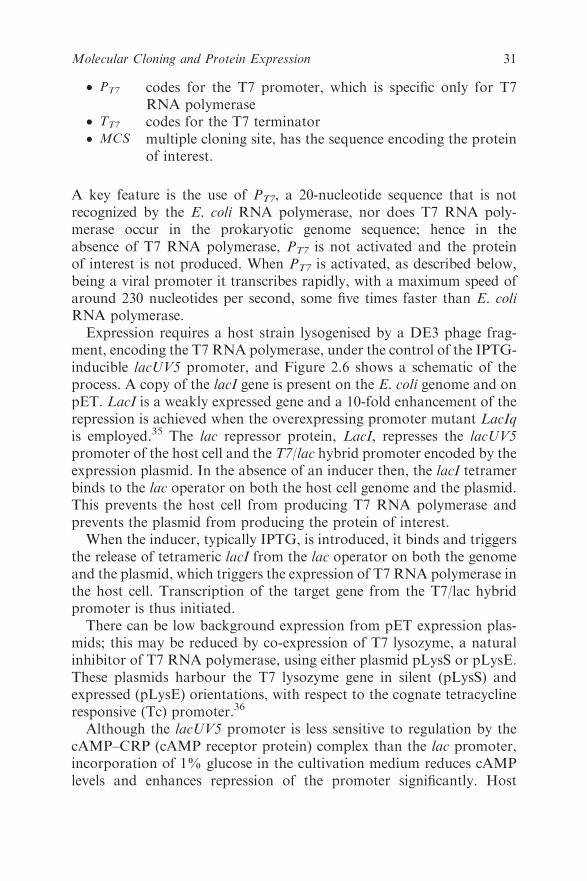
� PT7 codes for the T7 promoter, which is specific only for T7
RNA polymerase� TT7 codes for the T7 terminator� MCS multiple cloning site, has the sequence encoding the protein
of interest.
A key feature is the use of PT7, a 20-nucleotide sequence that is not
recognized by the E. coli RNA polymerase, nor does T7 RNA poly-
merase occur in the prokaryotic genome sequence; hence in the
absence of T7 RNA polymerase, PT7 is not activated and the protein
of interest is not produced. When PT7 is activated, as described below,
being a viral promoter it transcribes rapidly, with a maximum speed of
around 230 nucleotides per second, some five times faster than E. coli
RNA polymerase.
Expression requires a host strain lysogenised by a DE3 phage frag-
ment, encoding the T7 RNA polymerase, under the control of the IPTG-
inducible lacUV5 promoter, and Figure 2.6 shows a schematic of the
process. A copy of the lacI gene is present on the E. coli genome and on
pET. LacI is a weakly expressed gene and a 10-fold enhancement of the
repression is achieved when the overexpressing promoter mutant LacIq
is employed.35 The lac repressor protein, LacI, represses the lacUV5
promoter of the host cell and the T7/lac hybrid promoter encoded by the
expression plasmid. In the absence of an inducer then, the lacI tetramer
binds to the lac operator on both the host cell genome and the plasmid.
This prevents the host cell from producing T7 RNA polymerase and
prevents the plasmid from producing the protein of interest.
When the inducer, typically IPTG, is introduced, it binds and triggers
the release of tetrameric lacI from the lac operator on both the genome
and the plasmid, which triggers the expression of T7 RNA polymerase in
the host cell. Transcription of the target gene from the T7/lac hybrid
promoter is thus initiated.
There can be low background expression from pET expression plas-
mids; this may be reduced by co-expression of T7 lysozyme, a natural
inhibitor of T7 RNA polymerase, using either plasmid pLysS or pLysE.
These plasmids harbour the T7 lysozyme gene in silent (pLysS) and
expressed (pLysE) orientations, with respect to the cognate tetracycline
responsive (Tc) promoter.36
Although the lacUV5 promoter is less sensitive to regulation by the
cAMP–CRP (cAMP receptor protein) complex than the lac promoter,
incorporation of 1% glucose in the cultivation medium reduces cAMP
levels and enhances repression of the promoter significantly. Host
31Molecular Cloning and Protein Expression
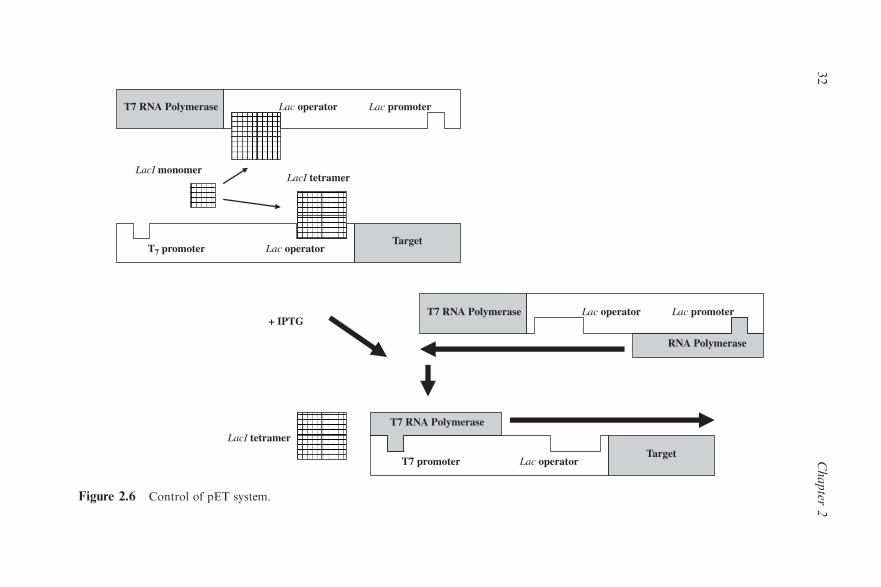
T7 RNA Polymerase
RNA Polymerase
T7 promoter Lac operatorTarget
LacI tetramer
Lac promoterLac operatorT7 RNA Polymerase+ IPTG
LacI monomer
T7 promoter Lac operatorTarget
LacI tetramer
Lac promoterLac operatorT7 RNA Polymerase
Figure 2.6 Control of pET system.
32
Chapter
2
strains deficient in the lacY gene, which encodes lactose permease,
improves control of target protein expression.37
2.4.2 The pBAD Expression System
Regulation of the arabinose operon in E. coli is directed by the product
of the araC gene,38 which controls the synthesis rate of the AraE, AraF
and AraG proteins, required for arabinose uptake, as well as the AraB,
AraA and AraD enzymes, required for its catabolism. That means that
the intrinsic state of the ara-specific promoters is off and AraC turns
them on, whereas the set state of the lac operon promoter is on and the
lac repressor turns it off. In addition, pBAD is catabolite repressed,
which means that growing the culture in the presence of glucose will
further repress expression.
While expression of a cloned gene from plasmids containing the
araBAD promoter can be modulated over several orders of magnitude
in cultures grown in the presence of sub-saturating concentrations of
arabinose,12 individual cells are either fully induced or uninduced.39
Cells having the natively controlled arabinose transport gene (araE) are
either induced or uninduced, the relative fraction of which is controlled
by the concentration of arabinose. The population-averaged variation in
expression from pBAD as a function of inducer concentration is pro-
portional to the percentage of cells that are fully induced (versus unin-
duced) rather than the level of expression in individual cells. This all-or-
none phenomenon, which can have undesirable effects on the expression
of heterologous genes, can be eliminated in E. coli by expression of araE
from arabinose-independent promoters. In these arabinose-transport
engineered cells, all cells in the population have approximately the
same induction level.40 Strains capable of transporting L-arabinose, but
not metabolising it, such as a recA, endA strain, are therefore most
suitable.
Expression plasmids based on the araBAD promoter are designed for
tight control of background expression and precise control of the
expression levels of the target protein.12 This contrasts with the all-or-
nothing induction achieved by most other bacterial expression systems.41
A pBAD plasmid, derived from pBR322 and shown in Figure 2.7, is a
4.1 kb construct having the following elements:
� araC ORF encoding araC protein� ampR codes for ampicillin resistance� ori col E1 origin of replication� pBAD araBAD promoter
33Molecular Cloning and Protein Expression
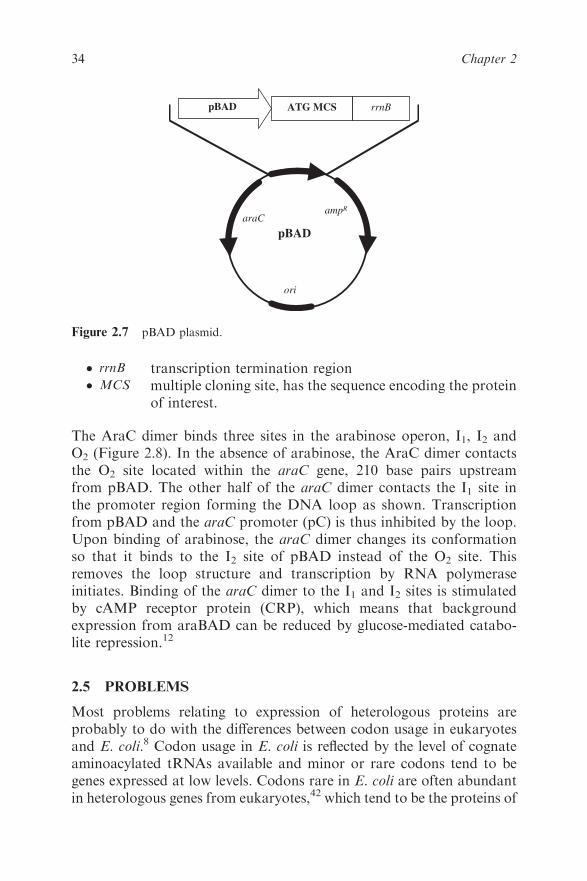
� rrnB transcription termination region� MCS multiple cloning site, has the sequence encoding the protein
of interest.
The AraC dimer binds three sites in the arabinose operon, I1, I2 and
O2 (Figure 2.8). In the absence of arabinose, the AraC dimer contacts
the O2 site located within the araC gene, 210 base pairs upstream
from pBAD. The other half of the araC dimer contacts the I1 site in
the promoter region forming the DNA loop as shown. Transcription
from pBAD and the araC promoter (pC) is thus inhibited by the loop.
Upon binding of arabinose, the araC dimer changes its conformation
so that it binds to the I2 site of pBAD instead of the O2 site. This
removes the loop structure and transcription by RNA polymerase
initiates. Binding of the araC dimer to the I1 and I2 sites is stimulated
by cAMP receptor protein (CRP), which means that background
expression from araBAD can be reduced by glucose-mediated catabo-
lite repression.12
2.5 PROBLEMS
Most problems relating to expression of heterologous proteins are
probably to do with the differences between codon usage in eukaryotes
and E. coli.8 Codon usage in E. coli is reflected by the level of cognate
aminoacylated tRNAs available and minor or rare codons tend to be
genes expressed at low levels. Codons rare in E. coli are often abundant
in heterologous genes from eukaryotes,42 which tend to be the proteins of
ori
araC
pBAD
ampR
pBAD ATG MCS rrnB
Figure 2.7 pBAD plasmid.
34 Chapter 2
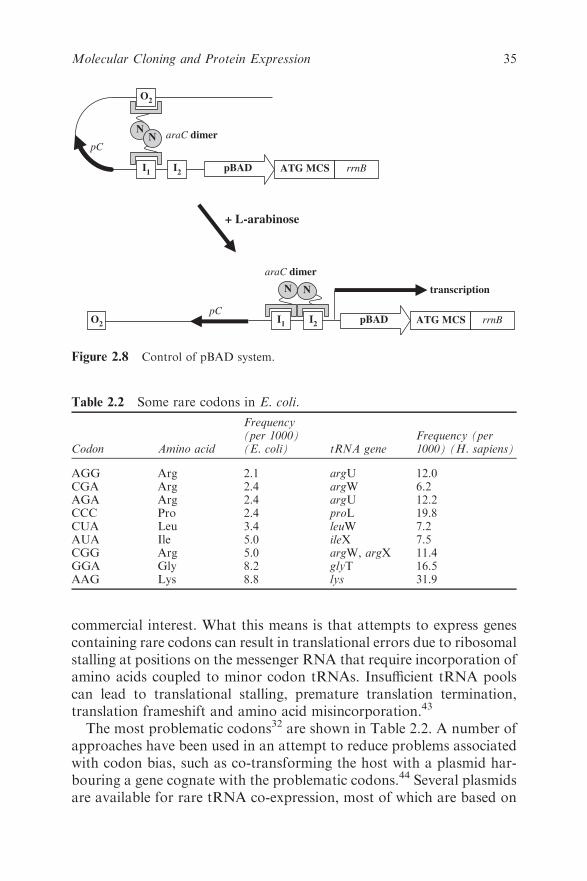
commercial interest. What this means is that attempts to express genes
containing rare codons can result in translational errors due to ribosomal
stalling at positions on the messenger RNA that require incorporation of
amino acids coupled to minor codon tRNAs. Insufficient tRNA pools
can lead to translational stalling, premature translation termination,
translation frameshift and amino acid misincorporation.43
The most problematic codons32 are shown in Table 2.2. A number of
approaches have been used in an attempt to reduce problems associated
with codon bias, such as co-transforming the host with a plasmid har-
bouring a gene cognate with the problematic codons.44 Several plasmids
are available for rare tRNA co-expression, most of which are based on
pC
pBAD ATG MCS rrnBI2
I1
O2
NN
pCpBAD ATG MCS rrnBI
2I
1O
2
NN
araC dimer
araC dimer
transcription
+ L-arabinose
Figure 2.8 Control of pBAD system.
Table 2.2 Some rare codons in E. coli.
Codon Amino acid
Frequency(per 1000)(E. coli) tRNA gene
Frequency (per1000) (H. sapiens)
AGG Arg 2.1 argU 12.0CGA Arg 2.4 argW 6.2AGA Arg 2.4 argU 12.2CCC Pro 2.4 proL 19.8CUA Leu 3.4 leuW 7.2AUA Ile 5.0 ileX 7.5CGG Arg 5.0 argW, argX 11.4GGA Gly 8.2 glyT 16.5AAG Lys 8.8 lys 31.9
35Molecular Cloning and Protein Expression
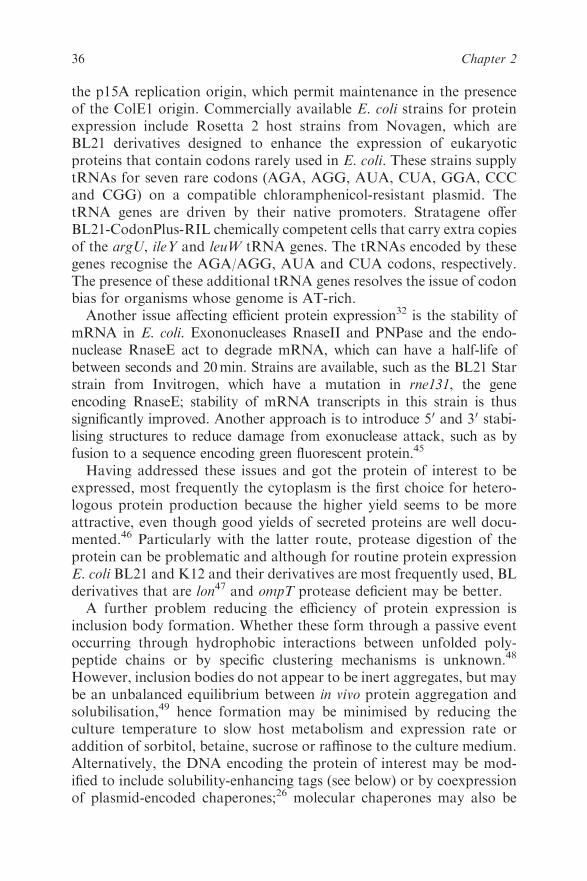
the p15A replication origin, which permit maintenance in the presence
of the ColE1 origin. Commercially available E. coli strains for protein
expression include Rosetta 2 host strains from Novagen, which are
BL21 derivatives designed to enhance the expression of eukaryotic
proteins that contain codons rarely used in E. coli. These strains supply
tRNAs for seven rare codons (AGA, AGG, AUA, CUA, GGA, CCC
and CGG) on a compatible chloramphenicol-resistant plasmid. The
tRNA genes are driven by their native promoters. Stratagene offer
BL21-CodonPlus-RIL chemically competent cells that carry extra copies
of the argU, ileY and leuW tRNA genes. The tRNAs encoded by these
genes recognise the AGA/AGG, AUA and CUA codons, respectively.
The presence of these additional tRNA genes resolves the issue of codon
bias for organisms whose genome is AT-rich.
Another issue affecting efficient protein expression32 is the stability of
mRNA in E. coli. Exononucleases RnaseII and PNPase and the endo-
nuclease RnaseE act to degrade mRNA, which can have a half-life of
between seconds and 20min. Strains are available, such as the BL21 Star
strain from Invitrogen, which have a mutation in rne131, the gene
encoding RnaseE; stability of mRNA transcripts in this strain is thus
significantly improved. Another approach is to introduce 50 and 30 stabi-
lising structures to reduce damage from exonuclease attack, such as by
fusion to a sequence encoding green fluorescent protein.45
Having addressed these issues and got the protein of interest to be
expressed, most frequently the cytoplasm is the first choice for hetero-
logous protein production because the higher yield seems to be more
attractive, even though good yields of secreted proteins are well docu-
mented.46 Particularly with the latter route, protease digestion of the
protein can be problematic and although for routine protein expression
E. coli BL21 and K12 and their derivatives are most frequently used, BL
derivatives that are lon47 and ompT protease deficient may be better.
A further problem reducing the efficiency of protein expression is
inclusion body formation. Whether these form through a passive event
occurring through hydrophobic interactions between unfolded poly-
peptide chains or by specific clustering mechanisms is unknown.48
However, inclusion bodies do not appear to be inert aggregates, but may
be an unbalanced equilibrium between in vivo protein aggregation and
solubilisation,49 hence formation may be minimised by reducing the
culture temperature to slow host metabolism and expression rate or
addition of sorbitol, betaine, sucrose or raffinose to the culture medium.
Alternatively, the DNA encoding the protein of interest may be mod-
ified to include solubility-enhancing tags (see below) or by coexpression
of plasmid-encoded chaperones;26 molecular chaperones may also be
36 Chapter 2
used as part of a refolding strategy.50 The idea here is that as newly
synthesised polypeptide is produced on the ribosome, it associates with a
trigger factor chaperone, which prevents hydrophobic patches on the
polypeptide from interacting.51 Once the trigger factor has been
removed, the folding proceeds to yield the protein in a natural state.
Other chaperones enhance protein degradation (DnaK and GroEL).
Overexpression of toxic proteins that are difficult or impossible to
produce in bacteria can be achieved using modified strains, such as
OverExpress C41 and C43 fromAvidis, which are based on E. coliDE3.52
Finally, E. coli accumulates lipopolysaccharide (LPS) or endotoxin,
which is pyrogenic in humans and other mammals; this is problematic if
the protein of interest is intended for therapeutic use and it must be
purified in a second step to become endotoxin free.53
2.6 FUSION PROTEINS
Recalling the comment that production of proteins requires the success
of three individual factors, expression, solubility and purification,1 it is
clear from what has been covered so far that protein expression,
although technically reasonably straightforward, does not easily yield
useful protein products – the protein may be inactive, precipitated,
incomplete, etc.
Production of the desired protein as a fusion product with another
protein has become commonplace. Initially it was unavoidable, a con-
sequence of the expression system used, but the approach has evolved
onwards from merely assisting with expression to facilitate protein
purification and subsequently discovering that some affinity tags also
increased solubility of the protein.54–58
Other unlooked for benefits of using a fusion protein partner include
the observation that expression levels associated with an N-terminal
fusion partner can be transferred to the partner, possibly as a result of
mRNA stabilisation.45 Fusion proteins have also been used to reduce
intracellular proteolysis.59
2.6.1 Solubility-enhancing Tags
One approach to investigate what impact a solubility-enhancing tag may
have on a protein of interest is to observe the fluorescence of E. coli cells
expressing GFP fused to a gene corresponding to the protein of interest;
this has been found to correlate well with the solubility of the protein
when expressed alone.60 This screening approach was used in a directed
evolution approach to produce soluble forms of three ‘insoluble’ proteins
37Molecular Cloning and Protein Expression
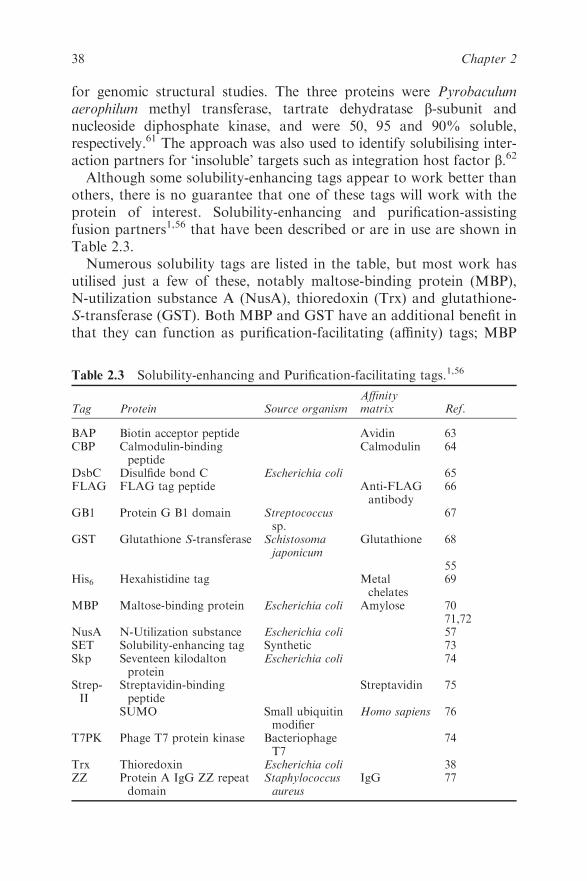
for genomic structural studies. The three proteins were Pyrobaculum
aerophilum methyl transferase, tartrate dehydratase b-subunit and
nucleoside diphosphate kinase, and were 50, 95 and 90% soluble,
respectively.61 The approach was also used to identify solubilising inter-
action partners for ‘insoluble’ targets such as integration host factor b.62
Although some solubility-enhancing tags appear to work better than
others, there is no guarantee that one of these tags will work with the
protein of interest. Solubility-enhancing and purification-assisting
fusion partners1,56 that have been described or are in use are shown in
Table 2.3.
Numerous solubility tags are listed in the table, but most work has
utilised just a few of these, notably maltose-binding protein (MBP),
N-utilization substance A (NusA), thioredoxin (Trx) and glutathione-
S-transferase (GST). Both MBP and GST have an additional benefit in
that they can function as purification-facilitating (affinity) tags; MBP
Table 2.3 Solubility-enhancing and Purification-facilitating tags.1,56
Tag Protein Source organismAffinitymatrix Ref.
BAP Biotin acceptor peptide Avidin 63CBP Calmodulin-binding
peptideCalmodulin 64
DsbC Disulfide bond C Escherichia coli 65FLAG FLAG tag peptide Anti-FLAG
antibody66
GB1 Protein G B1 domain Streptococcussp.
67
GST Glutathione S-transferase Schistosomajaponicum
Glutathione 68
55His6 Hexahistidine tag Metal
chelates69
MBP Maltose-binding protein Escherichia coli Amylose 7071,72
NusA N-Utilization substance Escherichia coli 57SET Solubility-enhancing tag Synthetic 73Skp Seventeen kilodalton
proteinEscherichia coli 74
Strep-II
Streptavidin-bindingpeptide
Streptavidin 75
SUMO Small ubiquitinmodifier
Homo sapiens 76
T7PK Phage T7 protein kinase BacteriophageT7
74
Trx Thioredoxin Escherichia coli 38ZZ Protein A IgG ZZ repeat
domainStaphylococcusaureus
IgG 77
38 Chapter 2
binds strongly to amylose resin70 and GST binds to glutathione resin.68
However GST is, at best, a poor solubility enhancer78,79 in E. coli, while
a significant body of evidence exists to show that N-terminal MBP
fusions can frequently produce soluble proteins when the unfused
partners are insoluble.79–82 Although it has no independent purification-
facilitating functionality, NusA protein from E. coli provides solubility
enhancement comparable to MBP83–85 and thioredoxin from E. coli has
been reported in several studies to be nearly as efficient as MBP in
promoting solubility,78,83 although other studies have shown it to be less
effective.76 MBP and NusA have been used to enhance the solubilisation
of ScFv antibodies in E. coli.86,87 Some maltodextrin-binding proteins
from other bacteria provide an even greater enhancement of solubili-
sation than MBP.54 The SUMO tag, a ubiquitin-related protein, has
been reported to enhance solubility and in some cases appears to be as
effective as MBP.76 A fragment of the bacteriophage T7 protein kinase
gene (T7PK) not only functions as a solubility enhancer, but also
appears to enhance overall levels of expression.74
As mentioned above, stress-induced proteins can serve to reduce
inclusion body formation and thereby enhance the overall yield of an
expressed protein. Two such proteins, which can be expressed in a cis
fashion as fusion proteins, are RpoA (DNA-directed RNA polymerase
a-subunit)88 and Tsf (an elongation factor).89 These are believed to
shield active surfaces of heterologous proteins associated with non-
specific protein–protein interactions that lead to the formation of
inclusion bodies. The proteins were fused to nine aggregation-prone
human proteins, leading to enhanced yields. They were also used for the
expression of cutinase from P. aeruginosa.
Even with the expression systems noted above, problems still remain.
Low expression yields and poor refolding efficiency of small recombi-
nant proteins expressed in E. coli hinder the large-scale purification of
such proteins for structural and biological investigations.67 MBP and
NusA are rather large partners; an N-terminal fragment of translation
initiation factor IF2, which has a molecular weight of 17.4 kDa, has
been used.58 The advantages of using a smaller partner include the
following:
� reduced energy demands on the host cell;
� diminished steric hindrance.
Recently, a His6-tagged N-terminal fragment (52 residues) of Sta-
phylococcal nuclease R (HR52) has been selected as a smaller efficient
fusion partner for the expression of small peptides.90 This system
39Molecular Cloning and Protein Expression
simplifies the purification protocol due to a one-step affinity purification
procedure and dramatically increases the final yield because of the
smaller size of the fusion partner. The use of HR52, which constitutes
the hydrophobic core of SNase R, has its limitations, because its high
hydrophobicity can interfere with the purification and refolding of
hydrophobic peptides.
SET (Solubility Enhancement Tags; Stratagene),73 having highly
acidic amino acid sequences, reduce folding interference with the protein
of interest. Their small size (o30 amino acids) means that in some cases
removal of the tag for structural studies may be unnecessary. Similarly,
two other small protein tags, GB1 and ZZ, have been used with some
success to enhance the expression and solubility of peptides and small
proteins.67,77,91 Using GB167 with a small cysteine-rich toxin, mutant
myotoxin a (MyoP20G), the highly expressed fusion protein was refol-
ded using an unfolding/refolding protocol, which could be monitored
using heteronuclear single quantum coherence (HSQC) NMR spectro-
scopy. The final product yielded well-resolved NMR spectra, with a
topology corresponding to the natural product. This system seems sui-
table for highly hydrophobic and cysteine-rich small proteins.
Even so, it is highly unlikely that there will be a single solubility-
enhancing tag that works in every situation and investigators will need
to keep a toolbox of solubility tags to hand, any one of which might
prove the best tool for a given task. The advent of recombinational
cloning and high-throughput expression techniques has made this a
much easier task and data produced over the next few years should give
us a better idea as to what tools to use in what circumstances; see below.
2.6.2 Purification-facilitating Tags
Purification-facilitating tags, or affinity tags, enable different proteins to
be purified using a common method and obviate the need for an
understanding of the dark arts associated with conventional chroma-
tographic purification.92 Additionally, affinity purification reduces the
number of unit operations and produces high yields, imbuing the
approach with a high degree of economic favourability. Some com-
monly use purification-enhancing tags are listed in Table 2.3.
His-tags are widely used and pET and pBAD vectors are available
having a His6-encoding sequence. A schematic for the expression and
purification of a His-tagged protein of interest is shown in Figure 2.9.
Purification is based on the use of metal ions complexed with a resin-
immobilised chelating agent; cellular extract containing the expressed
protein is applied to the column, the column is washed to remove
40 Chapter 2
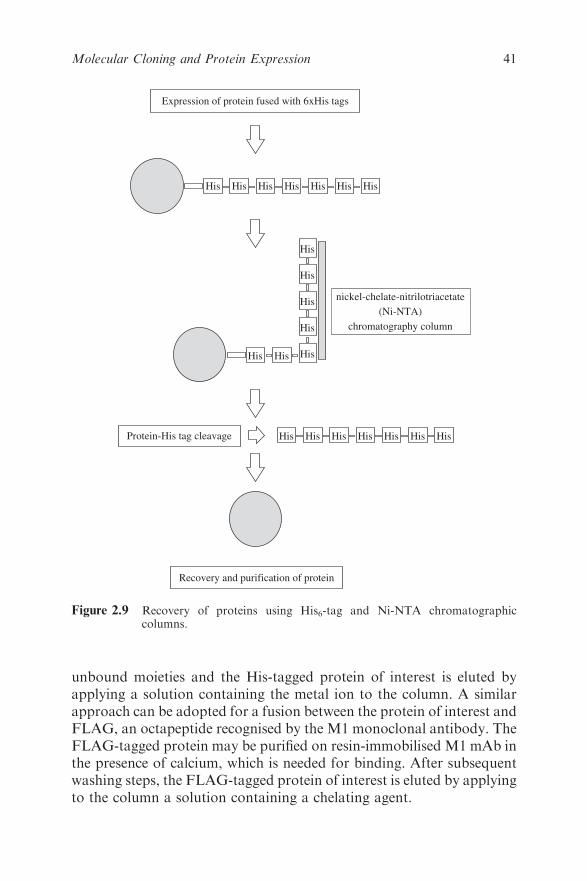
unbound moieties and the His-tagged protein of interest is eluted by
applying a solution containing the metal ion to the column. A similar
approach can be adopted for a fusion between the protein of interest and
FLAG, an octapeptide recognised by the M1 monoclonal antibody. The
FLAG-tagged protein may be purified on resin-immobilised M1 mAb in
the presence of calcium, which is needed for binding. After subsequent
washing steps, the FLAG-tagged protein of interest is eluted by applying
to the column a solution containing a chelating agent.
His His His His His His His
nickel-chelate-nitrilotriacetate
(Ni-NTA)
chromatography column
His His His
His
His
His
His
His His His His His His HisProtein-His tag cleavage
Expression of protein fused with 6xHis tags
Recovery and purification of protein
Figure 2.9 Recovery of proteins using His6-tag and Ni-NTA chromatographiccolumns.
41Molecular Cloning and Protein Expression
Disadvantages of processes that use affinity tagging to purify the
expressed protein include the cost of the affinity matrix that binds the
tag and the consequential need for a chromatographic step. Obviously
an approach that dispensed with the chromatographic step and utilised a
different method for separating the tagged protein from other proteins
would offer advantages. Annexin B1, a member of the annexin super-
family from Cysticercus cellulosae, can be expressed in a soluble form in
E. coli and purified by a Ca21-triggered precipitation step, which is fast
and easy to perform, followed by resolubilisation of purified protein.
Intein is a protein-intervening sequence that catalyses its efficient and
precise excision from a host protein in a process mediated by pH
changes or the addition of thiols and which has been engineered for
protein purification. Using an annexin B1–intein hybrid as a fusion
tag,93 the expressed B1-Int-protein can be precipitated using calcium
and recovered by centrifugation and the fusion partner subsequently
removed by thiol-induced cleavage of the intein. The efficacy of the
approach was demonstrated by expression and purification of human
IL2 and single-chain plasminogen activator, urokinase-type (scuPA).
A further disadvantage is that the affinity tag may have a deleterious
effect on the properties of the target protein, such as:
� a change in conformation;94
� lower yields;95
� inhibition of enzyme activity;96,97
� alteration in biological activity;98
� undesired flexibility in structural studies;99 and
� toxicity.100
It is therefore desirable to remove the tag. Clearly, a strategy for the
removal of the tag needs to be developed at the outset if the aim is to
produce a ‘native’ (i.e. tagless) protein for human use, when it is
necessary to remove not only the cleaved fusion partner but also both
enzyme(s) used to cleave it. One such approach is the TAGZyme system
(Qiagen), a system based on recombinant exoproteases such as DAPase,
which allow the efficient and precise removal of N-terminal His-tags
from proteins. One or more amino acid residues that the exoprotease is
not able to remove can be included between the His-tag and the protein
of interest to ensure that only the His-tag is removed. The DAPase has a
C-terminal His6-tag, which means that after treatment of the fusion
protein with the enzyme, the mixture can be reapplied to the column
containing the chelating agent and the cleaved protein of interest will not
now bind.
42 Chapter 2

Alternatively, it can be arranged that the fusion product contain a
linker sequence that can be cleaved, typically by an endoprotease, such
as enterokinase. Again, enterokinase-encoding regions can be included
in pBAD and other expression systems.
2.6.3 HT Approaches
As noted above, although one tag may be the ideal choice for a given
protein or even a given group of proteins, it does not follow that it will
function equally well with every protein. Hence it remains unknown
which to use for the protein of interest – there are no rules of thumb.
Fortunately, cloning technologies have been developed that have
made the generation of new expression vectors relatively easy,79,81
allowing parallel cloning into multiple vectors having different tags to
become an almost routine matter. This means that the suitability of a
range of solubility-enhancing tags can be assessed and compared in a
single experiment.79,80,101 Furthermore, the approach can be extended to
look at larger numbers, and more diverse types, of target proteins.79,83
One such technology, pooled ORF expression technology (POET),84 is
a high-throughput proteomics approach that combines recombinatorial
cloning of collections of sequenced ORFs with proteomic methods [two-
dimensional gel electrophoreses (2DGE) andMS] to predict which ORFs
in a pool will yield soluble, purified protein. The approach involves
pooling hundreds of ORFs and subcloning them into a protein expres-
sion vector having a purification-facilitating tag. This yields a pool of
expression plasmids, from which tagged expressed proteins are produced
from a single culture of host cells and easily purified away from host
proteins. Proteins in this mixture, which correspond to the original ORF
pool, are separated by 2DGE, and individual proteins are identified by
MS. Intensity of staining on 2DGE is roughly indicative of the likelihood
of expression as a soluble protein in high yield that can be easily purified.
Several commercial systems are also available, including Invitrogen’s
Gateway system, Novagen’s Radiance and Clontech’s In-Fusion. The
Gateway system not only allows exchange of ORFs between libraries,
synthesised genes, PCR products or indeed many other sources, via an
‘entry’ clone, but the clone itself can be used to develop expression
clones using a standardised procedure.102 Furthermore, the expression
clone may contain multiple ORFs in a fixed and known orthogonality.
This means that it can be used to produce, in at least a semi-automated
manner, permutations and combinations of ORFs, and such approaches
have been used to explore metabolomic features of proteins from a
particular pathway, for example. However, it may also be used to
43Molecular Cloning and Protein Expression
generate combinations of ORFs corresponding to proteins of interest
and fusion proteins, permitting the production of a range of expression
clones that can be used to produce fusion protein for simplified pur-
ification and subsequent analysis. In one study, 75 different ORFs were
transferred into expression vectors in combination with four different
fusion tags. The efficiency and usefulness of the exercise were evaluated
in respect of yield and solubility.103
A similar approach has been used for high-throughput expression and
screening of membrane proteins, a particular challenge hindering routine
structure determination. The approach was used for 49 E. coli integral
membrane proteins and 71% of these could be produced at sufficient levels
to allow milligram amounts of protein to be relatively easily purified.104
In another study, 36 prokaryotic P-type transporters, a wide ensemble
of modified constructs, were generated and tested for expression in
E. coli, membrane localization, detergent extraction and homogeneity.
The choice of promoter, the choice of source organism providing the
cloned gene and, most importantly, the position of the affinity tag had
large effects on successful production. Following the initial screening,
material from nine of the 36 targets was suitable for crystallization or
other structural studies.105
2.7 OTHER HOSTS
The focus in this chapter has been on the use of E. coli as the host system,
but the use of bacterial expression systems is somewhat limited for
eukaryotic proteins on account of the need for post-translational mod-
ifications to produce a correct glycosylation pattern. For such proteins,
eukaryotic systems may be a better choice. One such system is based on a
monkey COS cell line having a defective region of the SV40 genome
stably integrated into the COS cell genome. Inserting an expression
vector having the SV40 origin of replication and the protein of interest
into the COS cell initiates viral replication, leading to a high level of
expression of the protein. A disadvantage of this system is the lysis of the
COS cells; another is the limited insert capacity of the vector. Other
eukaryotic cloning vectors106 for expression of the protein of interest,
including Saccharomyces cerevisiae,107–109 Pichia pastoris,109,110, insect111
and mammalian107 cell lines, are available.
2.8 CELL-FREE SYSTEMS
This chapter has focused on approaches for expressing protein in a
suitable host cell and the problems attendant to this process have been
44 Chapter 2
rehearsed in some detail; an alternative approach is the use of cell-free
systems.112 These have been known for some time,113,114 using cell-free
extracts from E. coli, rabbit reticulocytes and wheat embryos. Although
in principle they offer high speed and accuracy, they have a number of
problems, the main one being a limited life span.115 A system based on
the wheat embryo system has been developed by the Centre for
Eukaryotic Structural Genomics, in cooperation with Ehime University
and CellFree Sciences.116 This automated platform for producing pro-
teins for NMR-based structural proteomics is able to carry out as many
as 384 small-scale screening reactions per week. A desktop robot is also
available, which, according to the manufacturers, performs transcrip-
tion, translation and batch affinity purification in around 35 h. It can run
on either a six-well format or a 24-well format to express up to six or 24
genes of interest. The robot produces 2.5–3.0mg of crude proteins per
run. Other systems are available, including Expressway Cell-Free
Expression Systems from Invitrogen, an E. coli-based in vitro system
that is able to produce up to milligram quantities of active recombinant
protein in a tube reaction format.
2.9 CONCLUSION
Molecular cloning techniques have evolved a long way from simple usage
to express proteins from heterologous DNA incorporated into pBR322;
now many expression systems and many hosts are available to ensure
that the ‘expression’ part of the ‘expression, solubility and purification1’
target is met. However, there is more to protein expression than merely
producing small amounts of it – a more recent challenge has been to
provide a reasonable quantity of it in a state that at least approximates to
the ‘natural’ state, for proteomic applications, for pharmaceutical
research and for commercial use. This has been met by the development
of solubility-enhancing and purification-facilitating tags on the one hand
and of high-throughput approaches on the other. This means that is now
possible quickly to screen for which of these tags might be most suitable
for expressing the protein of interest, potentially rendering the purifica-
tion of a protein of interest to an almost routine procedure. Molecular
cloning for protein expression is thus a key technique for the future
understanding and exploitation of proteomics.
REFERENCES
1. D. Esposito and D. K. Chatterjee, Curr. Opin. Biotechnol., 2006,
17, 353.
45Molecular Cloning and Protein Expression
2. R. J. Slater and D. R. Williams, in Molecular Biology and Bio-
technology, 4th edn, ed. J. M. Walker and R. Rapley, Royal
Society of Chemistry, Cambridge, 2000, p. 125.
3. G. Hannig and S. C. Makrides, Trends Biotechnol., 1998, 16, 54.
4. M. H. Caruthers, S. L. Beaucage, C. Becker, W. Efcavitch, F. F.
Fisher, G. Galluppi, R. oldman, P. Dettaseth, F. Martin,
M. Matteucci and Y. Stabinsley, in Genetic Engineering, ed. J. K.
Setlow and A. Hollaender, Plenum Press, New York, 1982, p. 119.
5. S. Narang, J. Biosci., 1984, 6, 739.
6. M. D. Edge, A. R. Green, G. R. Heathcliffe, P. A. Meacock,
W. Shuch, D. B. Scanlon, T. C. Atkinson, C. R. Newton and A. F.
Markham, Nature, 1981, 191, 756.
7. D. G. Yanasura and D. J. Henner, Methods Enzymol., 1990,
185, 54.
8. K. Terpe, Appl. Microbiol. Biotechnol., 2006, 72, 211.
9. C. M. Elvin, P. R. Thompson, M. E. Argall, P. Hendry, N. P.
Stamford, P. E. Lilley and N. E. Dixon, Gene, 1990, 87, 123.
10. B. Gronenborn, Mol. Gen. Genet., 1976, 148, 243.
11. J. Brosius, M. Erfle and J. Storella, J. Biol. Chem., 1985, 260, 3539.
12. L. M. Guzman, D. Belin, M. J. Carson and J. Beckwith, J. Bacteriol.,
1995, 177, 4121.
13. A. Haldimann, L. Daniels and B. Wanner, J. Bacteriol., 1998,
180, 1277.
14. A. Skerra, Gene, 1994, 151, 131.
15. F. W. Studier and B. A. Moffatt, J. Mol. Biol., 1986, 189, 113.
16. H. A. de Boer and A. S. Hui, Methods Enzymol., 1990, 185, 103.
17. H. P. Sørensen, B. S. Laursen, K. K. Mortensen and H. U.
Sperling-Petersen, Recent Res. Dev. Biophys. Biochem., 2002,
2, 243.
18. C. M. Stenstrom, H. Jin, L. L. Major, W. P. Tate and L. A.
Isaksson, Gene, 2001, 263, 273.
19. S. Ringquist, S. Shinedling, D. Barrick, L. Green, J. Binkley, G. D.
Stormo and L. Gold, Mol. Microbiol., 1992, 6, 1219.
20. B. S. Laursen, S. Steffensen, J. Hedegaard, J. M. Moreno, K. K.
Mortensen and H. U. Sperling-Petersen, Genes Cells, 2002, 7, 901.
21. P. O. Olins and S. H. Rangwala, Methods Enzymol., 1990, 185, 15.
22. P. O. Olins, C. S. Devine and S. H. Rangwala, in Expression
Systems and Processes for rDNA Products, ed. R. T. Hatch,
C. Goochee, A. Moreira and Y. Alroy, American Chemical
Society, Washington, DC, 1991, p. 17.
23. S. F. Newbury, N. H. Smith, E. C. Robinson, I. D. Hiles and C. F.
Higgins, Cell, 1987, 48, 297.
46 Chapter 2
24. E. S. Poole, C. M. Brown and W. P. Tate, EMBO J., 1995, 14, 151.
25. F. Baneyx, Curr. Opin. Biotechnol., 1999, 10, 411.
26. P. Jonasson, S. Liljeqvist, P. A. Nygren and S. Stahl, Biotechnol.
Appl. Biochem., 2002, 35, 91.
27. G. del Solar, R. Giraldo, M. J. Ruiz-Echevarria, M. Espinosa and
R. Diaz-Orejas, Microbiol. Mol. Biol. Rev., 1998, 62, 434.
28. D. Summers, Mol. Microbiol., 1998, 29, 1137.
29. M. P. Mayer, Gene, 1995, 163, 41.
30. K. G. Hardy, Plasmids, IRL Press, Oxford, 1987.
31. S. R. Connell, D. M. Tracz, K. H. Nierhaus and D. E. Taylor,
Antimicrob. Agents Chemother., 2003, 47, 3675.
32. H. P. Sørensen and K. K. Mortensen, J. Biotechnol., 2005,
115, 113.
33. J. W. Dubendorff and F. W. Studier, J. Mol. Biol., 1991, 219, 45.
34. F. W. Studier, A. H. Rosenberg, J. J. Dunn and J. W. Dubendorff,
Methods Enzymol., 1990, 185, 60.
35. M. P. Calos, Nature, 1978, 274, 762.
36. F. W. Studier, J. Mol. Biol., 1991, 219, 37.
37. A. Khlebnikov and J. D. Keasling, Biotechnol. Prog., 2002,
18, 672.
38. E. Englesberg, C. Squires and F. Meronk Jr, Proc. Natl. Acad. Sci.
USA, 1969, 62, 1100.
39. D. A. Siegele and J. C. Hu, Proc. Natl. Acad. Sci. USA, 1997,
94, 8168.
40. A. Khlebnikov, T. Skaug and J. D. Keasling, J. Ind. Microbiol.
Biotechnol., 2002, 29, 34.
41. R. M. Morgan-Kiss, C. Wadler and J. E. Cronan Jr, Proc. Natl.
Acad. Sci. USA, 2002, 99, 7373.
42. J. F. Kane, Curr. Opin. Biotechnol., 1995, 6, 494.
43. C. Kurland and J. Gallant, Curr. Opin. Biotechnol., 1996, 7, 489.
44. G. Dieci, L. Bottarelli, A. Ballabeni and S. Ottonello, Protein
Expr. Purif., 2000, 18, 346.
45. I. Arechaga, B. Miroux, M. J. Runswick and J. E. Walker, FEBS
Lett., 2003, 547, 97.
46. G. Georgiou and L. Segatori,Curr. Opin. Biotechnol., 2005, 16, 538.
47. T. A. Phillips, R. A. van Bogelen and F. C. Neidhardt, J. Bacteriol.,
1984, 159, 283.
48. A. Villaverde and M. M. Carrio, Biotechnol. Lett., 2003, 25, 1385.
49. M. M. Carrio, R. Cubarsi and A. Villaverde, FEBS Lett., 2000,
471, 7.
50. A. Mogk, M. P. Mayer and E. Deuerling, ChemBioChem., 2002,
3, 807.
47Molecular Cloning and Protein Expression
51. E. Deuerling, H. Patzelt, S. Vorderwulbecke, T. Rauch, G. Kramer,
E. Schaffitzel, A. Mogk, A. Schulze-Specking, H. Langen and
B. Bukau, Mol. Microbiol., 2003, 47, 1317.
52. B. Miroux and J. E. Walker, J. Mol. Biol., 1996, 260, 289.
53. D. Petsch and F. B. Anspach, J. Biotechnol., 2000, 76, 97.
54. R. B. Kapust and D. S. Waugh, Protein Sci., 1999, 8, 1668.
55. P. A. Nygren, S. Stahl and M. Uhlen, Trends Biotechnol., 1994,
12, 184.
56. K. Terpe, Appl. Microbiol. Biotechnol, 2003, 60, 523.
57. G. D. Davis, C. Elisee, D. M. Newham and R. G. Harrison,
Biotechnol. Bioeng., 1999, 65, 382.
58. H. P. Sørensen, H. U. Sperling-Petersen and K. K. Mortensen,
Protein Expr. Purif., 2003, 32, 252.
59. A. Jacquet, V. Daminet, M. Haumont, L. Garcia, S. Chaudoir,
A. Bollen and R. Biemans, Protein Expr. Purif., 1999, 17, 392.
60. G. S. Waldo, B. M. Standish, J. Berendzen and T. C. Terwilliger,
Nat. Biotechnol., 1999, 17, 691.
61. J. D. Pedelacq, E. Piltch, E. C. Liong, J. Berendzen, C. Y. Kim,
B. S. Rho, M. S. Park, T. C. Terwilliger and G. S. Waldo, Nat.
Biotechnol., 2002, 20, 927.
62. H. Wang and S. Chong, Proc. Natl. Acad. Sci. USA, 2003,
100, 478.
63. P. J. Schatz, Biotechnology, 1993, 11, 1138.
64. P. Vaillancourt, C. F. Zheng, D. Q. Hoang and L. Breister,
Methods Enzymol., 2000, 326, 340.
65. Z. Zhang, Z. H. Li, F. Wang, M. Fang, C. C. Yin, Z. Y. Zhou,
Q. Lin and H. L. Huang, Protein Expr. Purif., 2002, 26, 218.
66. A. Einhauer and A. Jungbauer, J. Biochem. Biophys. Methods,
2001, 49, 455.
67. Y. Cheng and D. J. Patel, Biochem. Biophys. Res. Commun., 2004,
317, 401.
68. D. B. Smith and K. S. Johnson, Gene, 1988, 67, 31.
69. V. Gaberc-Porekar and V. Menart, J. Biochem. Biophys. Methods,
2001, 49, 335.
70. C. di Guan, P. Li, P. D. Riggs and H. Inouye, Gene, 1988, 67, 21.
71. S. Nallamsetty and D. S. Waugh, Protein Expr. Purif., 2006,
45, 175.
72. J. D. Fox and D. S. Waugh, Methods Mol. Biol., 2003, 205, 99.
73. Y. B. Zhang, J. Howitt, S. McCorkle, P. Lawrence, K. Springer
and P. Freimuth, Protein Expr. Purif., 2004, 36, 207.
74. D. K. Chatterjee and D. Esposito, Protein Expr. Purif., 2006,
46, 122.
48 Chapter 2
75. S. Vossand A. Skerra, Protein Eng., 1997, 10, 975.
76. J. G. Marblestone, S. C. Edavettal, Y. Lim, P. Lim, X. Zuo and
T. R. Butt, Protein Sci., 2006, 15, 182.
77. Y. Zhao, Y. Benita, M. Lok, B. Kuipers, P. van der Ley,
W. Jiskoot, W. E. Hennink, D. J. Crommelin and R. S. Oosting,
Vaccine, 2005, 23, 5082.
78. M. Hammarstrom, N. Hellgren, S. van den Berg, H. Berglund and
T. Hard, Protein Sci., 2002, 11, 313.
79. M. R. Dyson, S. P. Shadbolt, K. J. Vincent, R. L. Perera and
J. McCafferty, BMC Biotechnol., 2004, 4, 32.
80. I. Kataeva, J. Chang, H. Xu, C. H. Luan, J. Zhou, V. N. Uversky,
D. Lin, P. Horanyi, Z. J. Liu, L. G. Ljungdahl, J. Rose, M. Luo
and B.-C. Wang, J. Proteome Res., 2005, 4, 1942.
81. D. Busso, B. Delagoutte-Busso and D. Moras, Anal. Biochem.,
2005, 343, 313.
82. S. Braud, M. Moutiez, P. Belin, N. Abello, P. Drevet, S. Zinn-
Justin, M. Courcon, C. Masson, J. Dassa, J. B. Charbonnier, J.-C.
Boulain, A. Menez, R. Genet and M. Gondry, J. Proteome Res.,
2005, 4, 2137.
83. A. Dummler, A. M. Lawrence and A. de Marco, Microb. Cell.
Fact., 2005, 4, 34.
84. A. Schrodel, J. Volz and A. de Marco, J. Biotechnol., 2005, 120, 2.
85. P. Turner, O. Holst and E. N. Karlsson, Protein Expr. Purif., 2005,
39, 54.
86. H. Bach, Y. Mazor, S. Shaky, A. Shoham-Lev, Y. Berdichevsky,
D. L. Gutnick and I. Benhar, J. Mol. Biol., 2001, 312, 79.
87. L. Zheng, U. Baumann and J. L. Reymond, J. Biochem. (Tokyo),
2003, 133, 577.
88. K.-Y. Ahn, J.-A. Song, K.-Y. Han, J.-S. Park, H.-S. Seo and
J. Lee, Enzyme Microb. Technol., 2007, 41, 859.
89. K.-Y. Han, J.-A. Song, K.-Y. Ahn, J.-S. Park, H.-S. Seo and J.
Lee, FEMS Microbiol. Lett., 2007, 274, 132.
90. Y. Cheng, D. Liu, Y. Feng and G. Jing, Protein Pept. Lett., 2003,
10, 175.
91. W. J. Bao, Y. G. Gao, Y. G. Chang, T. Y. Zhang, X. J. Lin, X. Z.
Yan and H. Y. Hu, Protein Expr. Purif., 2006, 47, 599.
92. J. Arnau, C. Lauritzen, G. E. Petersen and J. Pedersen, Protein
Expr. Purif., 2006, 48, 1.
93. F.-X. Ding, H.-L. Yan, Q. Mei, G. Xue, Y.-Z. Wang, Y.-J. Gao
and S.-H. Sun, Appl. Microbiol. Biotechnol., 2007, 77, 483.
94. A. Chant, C. M. Kraemer-Pecore, R. Watkin and G. G. Kneale,
Protein Expr. Purif., 2005, 39, 152.
49Molecular Cloning and Protein Expression

95. A. Goel, D. Colcher, J. S. Koo, B. J. Booth, G. Pavlinkova and
S. K. Batra, Biochim. Biophys. Acta, 2000, 1523, 13.
96. K. M Kim, E. C. Yi, D. Baker and K. Y. Zhang, Acta Crystallogr.,
Sect. D, 2001, 57, 759.
97. S. Cadel, C. Gouzy-Darmon, S. Petres, C. Piesse, V. L. Pham,
M. C. Beinfeld, P. Cohen and T. Foulon, Protein Expr. Purif.,
2004, 36, 19.
98. I. Fonda, M. Kenig, V. Gaberc-Porekar, P. Pristovaek and
V. Menart, Sci. World J., 2002, 15, 1312.
99. D. R. Smyth, M. K. Mrozkiewicz, W. J. McGrath, P. Listwan and
B. Kobe, Protein Sci., 2003, 12, 1313.
100. E. G. E. de Vries, M. N. de Hooge, J. A. Gietema and S. de Jong,
Clin. Cancer Res., 2003, 9, 912.
101. R. C. Stevens, Struct. Fold. Des., 2000, 8, R177.
102. F. Katzen, Expert Opin. Drug Discov., 2007, 2, 571.
103. U. Korf, T. Kohl, H. van der Zandt, R. Zahn, S. Schleeger,
B. Ueberle, S. Wandschneider, S. Bechtel, M. Schnolzer, H.
Ottleben, S. Wiemann and A. Poustka, Proteomics, 2005, 5, 3571.
104. S. Eshaghi, M. Hedren, M. Ignatushchenko A. Nasser, T. Ham-
marberg, A. Thornell and P. Nordlund, Protein. Sci., 2005, 14, 676.
105. O. Lewinson, A. T. Lee and D. C. Rees, J. Mol. Biol., 2008, 377, 62.
106. T. Brown, Gene Cloning and DNA Analysis, Blackwell Publishing
Ltd., Oxford, 2006.
107. L. Borsig, E. G. Berger and M. Malissard, Biochem. Biophys. Res.
Commun., 1997, 240, 586.
108. L. J. Byrne, K. J. O’Callaghan and M. F. Tuite, Methods Mol.
Biol., 2005, 308, 51.
109. B. Prinz, J. Schultchen, R. Rydzewski, C. Holz, M. Boettner,
U. Stahl and C. Lang, J. Struct. Funct. Genomics, 2004, 5, 29.
110. D. Daly and M. T. Hearn, J. Mol. Recognit., 2005, 18, 119.
111. T. A. Kost, J. P. Condreay and D. L. Jarvis,Nat. Biotechnol., 2005,
23, 567.
112. Y. Endo and T. Sawasaki, Curr. Opin. Biotechnol., 2006, 17, 373.
113. C.G. Kurland, Cell, 1982, 28, 201.
114. M. Y. Pavlov and M. Ehrenberg, Arch. Biochem. Biophys., 1996,
328, 9.
115. B. E. Roberts and B. M. Paterson, Proc. Natl. Acad. Sci. USA,
1973, 70, 2330.
116. D. A Vinarov and J. L. Markley, Expert Rev. Proteomics, 2005, 2, 49.
50 Chapter 2

CHAPTER 3
Molecular Diagnostics
LAURA J. TAFE, CLAUDINE L. BARTELS, JOEL A. LEFFERTS AND
GREGORY J. TSONGALIS
Department of Pathology, Dartmouth Medical School, Dartmouth
Hitchcock Medical Center and Norris Cotton Cancer Center, Lebanon, NH
03756, USA
3.1 INTRODUCTION
The transition of new technologies that were once thought of as
‘Research Use Only’ into the clinical laboratory as user developed assays
(UDA), analyte-specific reagents (ASR) or FDA-cleared diagnostic
assays has revolutionized the way that laboratory medicine is practiced.
Molecular diagnostic capabilities have spanned the entire spectrum of
what is, can and will be performed on a clinical basis in most hospital
laboratories. While the ability for clinical laboratories to detect human
genetic variation has historically been limited to a rather small number
of traditional genetic diseases where no clinical laboratory testing was
ever available, our current understanding of many disease processes at a
molecular level has expanded our testing capabilities to both human and
non-human applications. The identification of numerous new genes and
disease causing mutations, in addition to benign polymorphisms that
may influence a specific phenotype, has created a rapid demand for
molecular diagnostic testing.
Currently, there is a growing need for clinical laboratories to provide
high-quality nucleic acid-based tests within the realm of clinical
Molecular Biology and Biotechnology, 5th Edition
Edited by John M Walker and Ralph Rapleyr Royal Society of Chemistry 2009
Published by the Royal Society of Chemistry, www.rsc.org
51
relevance, including performance and turnaround time. This need was
initially driven by the completion of the Human Genome Project that
identified thousands of genes and millions of human single nucleotide
polymorphisms (SNPs) and culminated in disease associations. In
addition, the World Wide Web became an instant source of both
medical and scientific information for the populace. Popular television
programs have also incorporated the science of DNA into many of their
shows, making molecular (DNA) testing common knowledge in the
household. Because of this, an unprecedented demand has been placed
on the clinical laboratory to provide increased diagnostic testing with
unprecedented performance for rapid and accurate identification and
interrogation of genomic targets.
3.2 TECHNOLOGIES
Molecular technologies first entered the clinical laboratories in the early
1980s as manual, labor-intensive procedures that required a working
knowledge of chemistry and molecular biology and also an exceptional
skill set. While molecular diagnostics is often described as a discipline in
its infancy, the past 5 years have seen a rapid period of maturation in
this field. Testing capabilities have moved very quickly away from labor-
intense, highly complex and specialized procedures to more user-
friendly, semi-automated procedures.1 We have experienced this tran-
sition which began by testing for relatively high-volume infectious dis-
eases such as Chlamydia trachomatis, HPV, HIV-1, HCV, etc. Much of
this was championed by the availability of FDA-cleared kits and higher
throughput, semi-automated instruments such as the Abbott LCX and
Roche Cobas Amplicor systems.
However, in the early 1980s, the Southern blot was the method of
choice for a variety of clinical applications, even though the turnaround
time was in excess of 2–3 weeks. The commercial availability of
restriction endonucleases and various agarose matrices helped in making
this technique routine. The polymerase chain reaction (PCR) revolu-
tionized blotting technologies and detection limits by offering increased
sensitivity and the much needed shortened turnaround time for clinical
result availability. Since then, many modifications to the PCR have been
introduced, but none as significant as real-time capability.2–5 The
elimination of post-PCR detection systems and the ability to perform
the entire assay in a closed vessel had significant advantages for the
clinical laboratory. Various detection chemistries for real-time PCR
were rapidly introduced and many of the older detection methods (gel
electrophoresis, ASO blots, etc.) vanished from the laboratory.
52 Chapter 3

The real-time PCR has become a method of choice for most molecular
diagnostics laboratories. This modification of the traditional PCR
allows for the simultaneous amplification and detection of amplified
nucleic acid targets as it occurs. In routine clinical practice, the main
advantages of real-time PCR are the speed with which samples can be
analyzed, as there are no post-PCR processing steps required, and the
‘closed-tube’ nature of the technology. The analysis of results via
amplification curve and melt curve analysis is very simple and con-
tributes to it being a much faster method for analyzing PCR results.
However, DNA sequencing technologies, fragment sizing and LOH
studies would benefit from automated capillary electrophoresis instru-
mentation. Several forms of microarrays are currently available as post-
PCR detection mechanisms for multiplexed analysis of SNPs, gene
expression and pathogen detection. Today, molecular diagnostic labora-
tories are armed with various instruments and technologies to address the
increasing demand for clinical test results (Table 3.1).
3.3 THE INFECTIOUS DISEASE PARADIGM
Molecular infectious disease testing represents a paradigm in the
application of diagnostic testing. Clinical applications of molecular
Table 3.1 Current technologies being used in the Molecular Patho-
logy Laboratory at the Dartmouth Hitchcock Medical
Center.
Technology Platform/instrument
DNA/RNA extraction 1. Manual2. Spin column3. Qiagen EZ1 robot
Fluorescence in situ hybridization (FISH) 1. Hybrite oven2. Molecular imaging system
bDNA 1. Siemens System 340Hybrid capture 1. Digene HCII SystemReal-time PCR 1. Cepheid GeneXpert
2. ABI 75003. Cepheid Smartcycler4. Roche Taq48
Capillary electrophoresis 1. Beckman CEQ2. Beckman Vidiera
Traditional PCR 1. MJ Research2. DNA Engines
Microarray 1. Luminex2. Superarray3. Nanosphere
53Molecular Diagnostics

diagnostics to infectious diseases include those for qualitative testing,
quantitative testing and resistance genotyping.6–10 This paradigm spans
the spectrum of current molecular capabilities and has provided sig-
nificant insight to the nuances of molecular testing for other disciplines.
Molecular diagnostic testing for infectious disease applications con-
tinues to be the highest volume of testing being performed in clinical
laboratories (Table 3.2).
While accurate and timely diagnosis of infectious diseases is essential
for proper patient management, traditional testing methods for many
pathogens did not allow for rapid turnaround time. Prompt detection of
the microbial pathogen allows providers to institute adequate measures
to interrupt transmission to a susceptible hospital or community popu-
lation. The diagnosis of an infectious diseases has typically depended
upon isolation of the infective agent by a culture technique. Even though
this approach is adequate for the identification of the majority of com-
mon infections, it is less than desirable for the detection of organisms that
were difficult to grow in vitro, including long incubation times. These
issues along with performance characteristics of sensitivity and specificity
brought about a need for alternative techniques that would allow for
direct detection of infectious agents in clinical samples while maintaining
a rapid turnaround time and high performance.
Of particular importance to molecular infectious disease testing is the
type of specimen for which assays have been validated. Due to the
endogenous inhibitors found in some clinical specimens, there is an
Table 3.2 Molecular infectious disease tests that are currently FDA cleared
and being performed in clinical laboratories.
Bacteria Viruses
Bacillus anthracis Avian fluCandida albicans CytomegalovirusChlamydia trachomatis EnterovirusEnterococcus faecalis HBV (quantitative)Francisella tularensis Hepatitis C virus (qualitative and
quantitative)Gardnerella, Trichomonasand Candida spp.
HIV drug resistance
Group A streptococci HIV (quantitative)Group B streptococci HBV/HCV/HIV blood screening assayLegionella pneumophila Human papillomavirusMethicillin-resistant Staphylococcusaureus
Respiratory viral panel
Mycobacterium tuberculosis West Nile virusMycobacterium spp.Staphylococcus aureus
54 Chapter 3
inherent need to check for quality of the specimen and presence of
inhibitors. This can be performed by using a variety of control materials
that are added to the specimen before extraction and to the nucleic acid
after extraction. Proper control material for quantitative assays must
also be used for accurate determination of copy number.
The rapid demand for availability of more molecular infectious dis-
ease tests led the US Food and Drug Administration (FDA) to create a
regulatory category known as the analyte-specific reagent (ASR). This
allowed companies to market primer and probe sets without going
through a full FDA submission and hence increased the availability of
reagents for laboratories to perform testing. As more laboratories
desired to bring molecular testing in-house, the shortcomings of the
ASR were rapidly made known. As part of an ASR, the company is not
allowed to provide any instructions or recipe for use. Therefore, for
laboratories with no or minimal molecular experience, a vial of probe
and one of primer was difficult to deal with. Although there were many
commercially available reagents now available, the laboratories’ cap-
abilities to validate and use them properly did not meet the expectations
of the diagnostic community. Guidelines for proper validation of assays
are available from the Clinical and Laboratory Standards Institute.
Just as we have seen a rapid trend in reagent availability, the rapid
introduction of new technologies has also been responsible for pushing
the molecular infectious disease applications forward. In the early 1990s,
molecular techniques such as DNA probes and the PCR were introduced
into the clinical microbiology laboratory. Next generations of these
technologies, together with automated instrumentation are now used
routinely to detect and quantify an increasing number of organisms.
While real-time PCR and array platforms have made multiplex testing a
reality, automated sequencing instruments have also made resistance
genotyping routine in many clinical laboratories. The paradigm set forth
by our expanding knowledge base from the infectious disease applica-
tions has led to new developments in other clinical applications, as will be
discussed.
3.4 GENETICS
While clinical applications of molecular technologies have been developed
for numerous diseases, the race to identify genes and their mutation
spectra was evident early in the pre-human genome era. Current concepts
of molecular mechanisms of disease that include gene associations have
evolved from these early observations, as has our ability to detect routi-
nely various genetic abnormalities. The fact that these alterations can be
55Molecular Diagnostics

inherited through the germline or acquired has expanded our knowledge
of many disease mechanisms. Molecular genetics provides a means for
examining inheritance patterns at the level of nucleic acids and provides a
vehicle for dissecting complex pathophysiological processes into gene
defects. Many clinical laboratories are now offering molecular diagnostic
testing for some of the more common diseases (Table 3.3).
Currently, there is an enormous amount of information with respect
to numbers and characteristics of various genetic diseases and syn-
dromes. Genetic diseases can be categorized into three major groups:
(1) chromosomal disorders, (2) monogenic or single-gene disorders and
(3) polygenic or multifactorial disorders. Chromosomal disorders are due
to the loss, gain or abnormal arrangement of one or more chromosomes
which results in the presence of excessive or deficient amounts of genetic
material. Syndromes characterized by multiple birth defects and various
forms of hematopoietic malignancy are examples of chromosomal dis-
orders. These types of alterations usually involve large segments of DNA
containing numerous genes and can be classified into four groups:
1. aneuploidy: excess or loss of one or more chromosomes;
2. deletion: breakage and/or loss of a portion of a chromosome;
3. translocation: breakage of two chromosomes with transfer of
broken parts to the opposite chromosome;
4. isochromosome: splitting at the centromere during mitosis so that
one arm is lost and the other duplicated to form one chromosome
with identical arms.
Table 3.3 Genetic diseases and/or genes commonly
tested for using molecular diagnostic
methods
Alpha1-antitrypsin deficiencyAngelman syndromeApoECystic fibrosisDuchenne/Becker muscular dystrophyFactor II (prothrombin)Factor V LeidenFanconi’s anemiaFragile X syndromeGaucher diseaseHemochromatosisHuntington’s diseaseMethylene tetrahydrofolate reductase (MTHFR)Prader-Willi syndromeTay-Sachs disease
56 Chapter 3
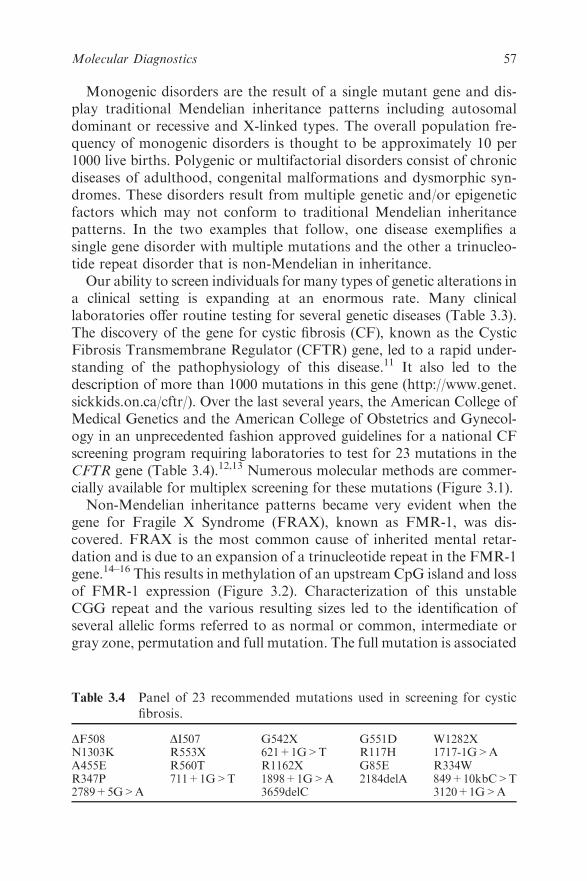
Monogenic disorders are the result of a single mutant gene and dis-
play traditional Mendelian inheritance patterns including autosomal
dominant or recessive and X-linked types. The overall population fre-
quency of monogenic disorders is thought to be approximately 10 per
1000 live births. Polygenic or multifactorial disorders consist of chronic
diseases of adulthood, congenital malformations and dysmorphic syn-
dromes. These disorders result from multiple genetic and/or epigenetic
factors which may not conform to traditional Mendelian inheritance
patterns. In the two examples that follow, one disease exemplifies a
single gene disorder with multiple mutations and the other a trinucleo-
tide repeat disorder that is non-Mendelian in inheritance.
Our ability to screen individuals for many types of genetic alterations in
a clinical setting is expanding at an enormous rate. Many clinical
laboratories offer routine testing for several genetic diseases (Table 3.3).
The discovery of the gene for cystic fibrosis (CF), known as the Cystic
Fibrosis Transmembrane Regulator (CFTR) gene, led to a rapid under-
standing of the pathophysiology of this disease.11 It also led to the
description of more than 1000 mutations in this gene (http://www.genet.
sickkids.on.ca/cftr/). Over the last several years, the American College of
Medical Genetics and the American College of Obstetrics and Gynecol-
ogy in an unprecedented fashion approved guidelines for a national CF
screening program requiring laboratories to test for 23 mutations in the
CFTR gene (Table 3.4).12,13 Numerous molecular methods are commer-
cially available for multiplex screening for these mutations (Figure 3.1).
Non-Mendelian inheritance patterns became very evident when the
gene for Fragile X Syndrome (FRAX), known as FMR-1, was dis-
covered. FRAX is the most common cause of inherited mental retar-
dation and is due to an expansion of a trinucleotide repeat in the FMR-1
gene.14–16 This results in methylation of an upstream CpG island and loss
of FMR-1 expression (Figure 3.2). Characterization of this unstable
CGG repeat and the various resulting sizes led to the identification of
several allelic forms referred to as normal or common, intermediate or
gray zone, permutation and full mutation. The full mutation is associated
Table 3.4 Panel of 23 recommended mutations used in screening for cystic
fibrosis.
DF508 DI507 G542X G551D W1282XN1303K R553X 621+1G>T R117H 1717-1G>AA455E R560T R1162X G85E R334WR347P 711+1G>T 1898+1G>A 2184delA 849+10kbC>T2789+5G>A 3659delC 3120+1G>A
57Molecular Diagnostics

A
T
C
G
A
A
C
C
F1 F2Q Q
F1 F2
Invader® Oligo Invader® OligoProbe Probe
FRET Cassette 1 FRET Cassette 2
Released 5´ Flap
Cleavage Site
Target 1 Target 2
Cleavage Site
Released 5´ Flap
Cleavage
Site
Cleavage
Site
Figure 3.1 Diagram of the Invader chemistry for CF mutation testing and the microfluidic card used.
58
Chapter
3
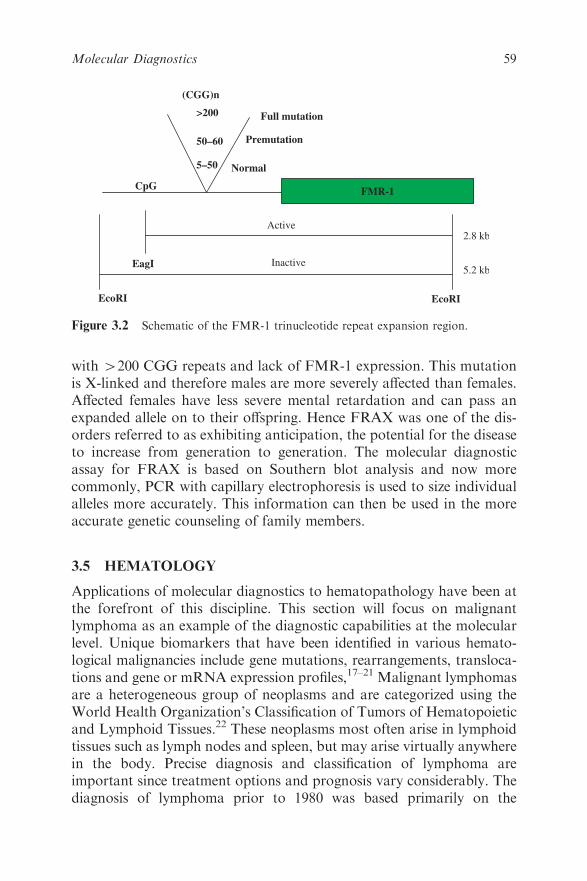
with 4200 CGG repeats and lack of FMR-1 expression. This mutation
is X-linked and therefore males are more severely affected than females.
Affected females have less severe mental retardation and can pass an
expanded allele on to their offspring. Hence FRAX was one of the dis-
orders referred to as exhibiting anticipation, the potential for the disease
to increase from generation to generation. The molecular diagnostic
assay for FRAX is based on Southern blot analysis and now more
commonly, PCR with capillary electrophoresis is used to size individual
alleles more accurately. This information can then be used in the more
accurate genetic counseling of family members.
3.5 HEMATOLOGY
Applications of molecular diagnostics to hematopathology have been at
the forefront of this discipline. This section will focus on malignant
lymphoma as an example of the diagnostic capabilities at the molecular
level. Unique biomarkers that have been identified in various hemato-
logical malignancies include gene mutations, rearrangements, transloca-
tions and gene or mRNA expression profiles,17–21 Malignant lymphomas
are a heterogeneous group of neoplasms and are categorized using the
World Health Organization’s Classification of Tumors of Hematopoietic
and Lymphoid Tissues.22 These neoplasms most often arise in lymphoid
tissues such as lymph nodes and spleen, but may arise virtually anywhere
in the body. Precise diagnosis and classification of lymphoma are
important since treatment options and prognosis vary considerably. The
diagnosis of lymphoma prior to 1980 was based primarily on the
FMR-1
(CGG)n
>200
50–60
5–50 Normal
Premutation
Full mutation
CpG
EcoRI EcoRI
EagI
Active
Inactive
2.8 kb
5.2 kb
Figure 3.2 Schematic of the FMR-1 trinucleotide repeat expansion region.
59Molecular Diagnostics
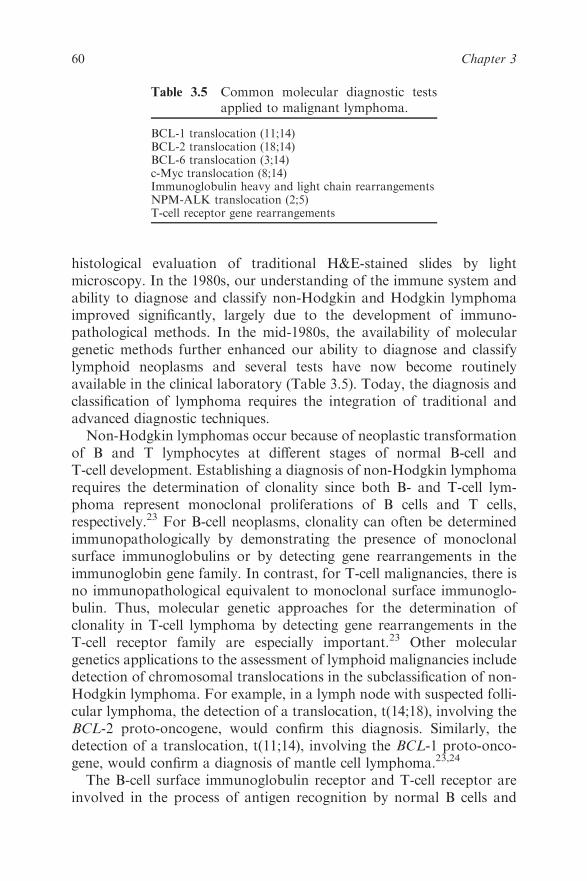
histological evaluation of traditional H&E-stained slides by light
microscopy. In the 1980s, our understanding of the immune system and
ability to diagnose and classify non-Hodgkin and Hodgkin lymphoma
improved significantly, largely due to the development of immuno-
pathological methods. In the mid-1980s, the availability of molecular
genetic methods further enhanced our ability to diagnose and classify
lymphoid neoplasms and several tests have now become routinely
available in the clinical laboratory (Table 3.5). Today, the diagnosis and
classification of lymphoma requires the integration of traditional and
advanced diagnostic techniques.
Non-Hodgkin lymphomas occur because of neoplastic transformation
of B and T lymphocytes at different stages of normal B-cell and
T-cell development. Establishing a diagnosis of non-Hodgkin lymphoma
requires the determination of clonality since both B- and T-cell lym-
phoma represent monoclonal proliferations of B cells and T cells,
respectively.23 For B-cell neoplasms, clonality can often be determined
immunopathologically by demonstrating the presence of monoclonal
surface immunoglobulins or by detecting gene rearrangements in the
immunoglobin gene family. In contrast, for T-cell malignancies, there is
no immunopathological equivalent to monoclonal surface immunoglo-
bulin. Thus, molecular genetic approaches for the determination of
clonality in T-cell lymphoma by detecting gene rearrangements in the
T-cell receptor family are especially important.23 Other molecular
genetics applications to the assessment of lymphoid malignancies include
detection of chromosomal translocations in the subclassification of non-
Hodgkin lymphoma. For example, in a lymph node with suspected folli-
cular lymphoma, the detection of a translocation, t(14;18), involving the
BCL-2 proto-oncogene, would confirm this diagnosis. Similarly, the
detection of a translocation, t(11;14), involving the BCL-1 proto-onco-
gene, would confirm a diagnosis of mantle cell lymphoma.23,24
The B-cell surface immunoglobulin receptor and T-cell receptor are
involved in the process of antigen recognition by normal B cells and
Table 3.5 Common molecular diagnostic tests
applied to malignant lymphoma.
BCL-1 translocation (11;14)BCL-2 translocation (18;14)BCL-6 translocation (3;14)c-Myc translocation (8;14)Immunoglobulin heavy and light chain rearrangementsNPM-ALK translocation (2;5)T-cell receptor gene rearrangements
60 Chapter 3
T cells, respectively. These receptors are structurally similar in that they
are heterodimer proteins linked by disulfide bonds and are composed of
both variable (V) and constant (C) regions. The variable regions of these
proteins are similarly involved in antigen recognition. The constant
region of the immunoglobulin heavy chain protein defines the different
immunoglobulin subclasses (IgG1, IgG2, IgG3, IgG4, IgA1, IgA2, IgM,
IgD and IgE). The genes that code for the B- and T-cell receptors are
also structurally similar and consist of a large number of exons or coding
sequences. These genes undergo a process of DNA recombination or
rearrangement leading eventually to transcription and translation and
the production of functional receptor proteins.
The germline configuration of these genes refers to non-rearranged
DNA. The exons which code for the variable regions of the immu-
noglobulin and T-cell receptors are referred to as variable (V) segments,
diversity (D) segments and junctional (J) segments, and those which
code for the constant regions are referred to as (C) segments. The pro-
cess of gene rearrangement first involves the selective apposition of one
D segment with one J segment by deletion of the intervening coding and
non-coding DNA sequences, resulting in a DJ rearrangement. A similar
process of rearrangement apposes a V segment, located in the 50 direc-
tion, to D and J to form a VDJ rearrangement. Transcription to mes-
senger RNA (mRNA) then occurs even though the rearranged VDJ
segments are not yet directly apposed to C segments, which are remotely
located in the 30 direction. Subsequent splicing of the mRNA with
deletion of non-coding sequences results in apposition of VDJ with C to
form a VDJC mRNA, which can then be translated into a surface
immunoglobulin or T-cell receptor protein (Figure 3.3).
To establish a diagnosis of B-cell or T-cell non-Hodgkin lymphoma,
the ability to prove that a neoplastic population of B cells or T cells is
monoclonal in origin is of central importance. A monoclonal or simply,
a clonal cell population refers to a population of cells which are all
derived from a single precursor cell and thus share similar character-
istics. By molecular genetic methods, clonality is defined by the identi-
fication of a clonal B-cell or T-cell gene rearrangement. Traditionally
this was performed by Southern blot transfer analysis. However, this
technique required a large amount of high molecular weight DNA, thus
eliminating the use of paraffin-embedded tissues. The PCR technique
has in most instances replaced the Southern blot for evaluating for the
presence or absence of B- and T-cell clonality. This methodology allows
for the evaluation of minute quantities of DNA by in vitro amplification.
Analogous to Southern blot methods, the application of PCR to detect
B- and T-cell clonality involves evaluation of gene rearrangements in
61Molecular Diagnostics

those segments of DNA which code for the variable regions of the
surface immunoglobulin and T-cell receptors.23–25
3.6 ONCOLOGY
Initial efforts in molecular diagnostics began with applications for
diagnosing hematopoietic malignancies; however, applications for direct
qualitative infectious disease testing far outpaced the oncology tests
being performed. In part this was due to the polygenic, multifactorial
complexity of the disease. It became evident very early that molecular
oncology testing would not be a ‘one target fits all’ type of algorithm as
in the identification of microbial pathogens. Interestingly, as this para-
digm of being able to perform qualitative, quantitative and genotype
infectious disease testing became standard practice, similar approaches
to oncology were beginning to surface. The need for viral load testing
emerged from the development of anti-retroviral therapeutics that
warranted monitoring of viral copy numbers. Soon thereafter, geno-
typing efforts emerged from the need to determine viral resistance or
subtypes that would better respond to therapeutics. Paralleling the
applications for infectious disease testing, molecular oncology is now at
a similar crossroads where applications for qualitative, quantitative and
genotype testing are warranted based on novel biomarkers and thera-
peutics. Hence a new testing paradigm has emerged through molecular
oncology testing.
VDJ REARRANGEMENT
DV J C
V J
V J
V J C
NH2 COOHVARIABLE CONSTANT
GERMLINE
DJ REARRANGEMENT
TRANSCRIPTION
AND SPLICING
TRANSLATION
5′
5′
5′
5′
3′
3′
3′
3′D
D
D C
C
Figure 3.3 Schematic diagram of the gene rearrangement process.
62 Chapter 3
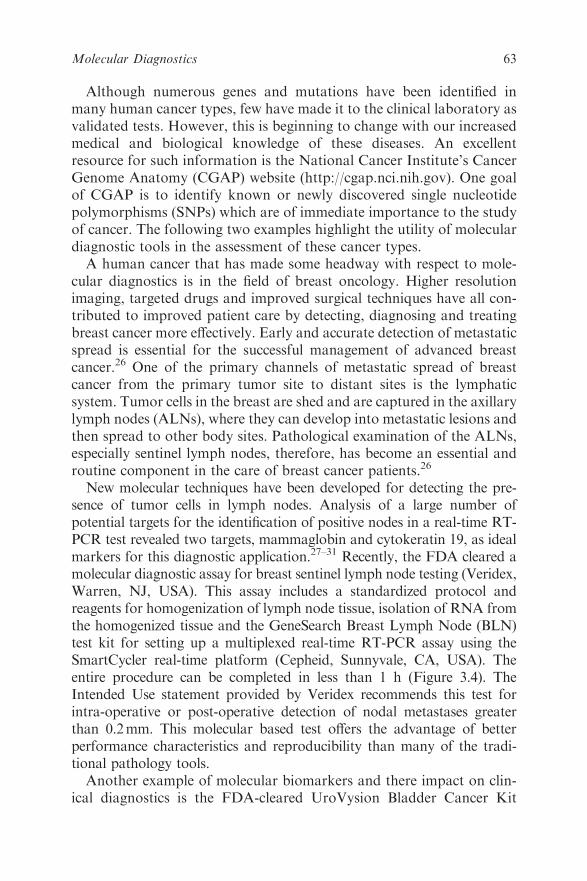
Although numerous genes and mutations have been identified in
many human cancer types, few have made it to the clinical laboratory as
validated tests. However, this is beginning to change with our increased
medical and biological knowledge of these diseases. An excellent
resource for such information is the National Cancer Institute’s Cancer
Genome Anatomy (CGAP) website (http://cgap.nci.nih.gov). One goal
of CGAP is to identify known or newly discovered single nucleotide
polymorphisms (SNPs) which are of immediate importance to the study
of cancer. The following two examples highlight the utility of molecular
diagnostic tools in the assessment of these cancer types.
A human cancer that has made some headway with respect to mole-
cular diagnostics is in the field of breast oncology. Higher resolution
imaging, targeted drugs and improved surgical techniques have all con-
tributed to improved patient care by detecting, diagnosing and treating
breast cancer more effectively. Early and accurate detection of metastatic
spread is essential for the successful management of advanced breast
cancer.26 One of the primary channels of metastatic spread of breast
cancer from the primary tumor site to distant sites is the lymphatic
system. Tumor cells in the breast are shed and are captured in the axillary
lymph nodes (ALNs), where they can develop into metastatic lesions and
then spread to other body sites. Pathological examination of the ALNs,
especially sentinel lymph nodes, therefore, has become an essential and
routine component in the care of breast cancer patients.26
New molecular techniques have been developed for detecting the pre-
sence of tumor cells in lymph nodes. Analysis of a large number of
potential targets for the identification of positive nodes in a real-time RT-
PCR test revealed two targets, mammaglobin and cytokeratin 19, as ideal
markers for this diagnostic application.27–31 Recently, the FDA cleared a
molecular diagnostic assay for breast sentinel lymph node testing (Veridex,
Warren, NJ, USA). This assay includes a standardized protocol and
reagents for homogenization of lymph node tissue, isolation of RNA from
the homogenized tissue and the GeneSearch Breast Lymph Node (BLN)
test kit for setting up a multiplexed real-time RT-PCR assay using the
SmartCycler real-time platform (Cepheid, Sunnyvale, CA, USA). The
entire procedure can be completed in less than 1 h (Figure 3.4). The
Intended Use statement provided by Veridex recommends this test for
intra-operative or post-operative detection of nodal metastases greater
than 0.2mm. This molecular based test offers the advantage of better
performance characteristics and reproducibility than many of the tradi-
tional pathology tools.
Another example of molecular biomarkers and there impact on clin-
ical diagnostics is the FDA-cleared UroVysion Bladder Cancer Kit
63Molecular Diagnostics
(Abbott Molecular, Des Plaines, IL, USA). The diagnosis of primary
and recurrent bladder cancer is a significant problem. Because this type
of cancer is a chronic disease, patients need to be constantly monitored
for recurrence of their disease. This assay is available for use, in con-
junction with urine cytology and cystoscopy evaluation, as an aid for
diagnosing and monitoring recurrence of urothelial carcinoma. The
assay uses multicolor fluorescence in situ hybridization (FISH) to detect
aneuploidy for chromosomes 3, 7 and 17 and loss of 9q21 locus (P16/
CDKN2A gene) in urine specimens, all abnormalities associated with
urothelial malignancy. The combination of FISH with routine cytology
evaluation is more sensitive than cytology alone at detecting urothelial
carcinoma.32–34
Building on such applications with the advances in technology that
are occurring will surely result in better management of the onco-
logy patient. Clearly, the advantages of molecular diagnostics in the
diagnosis and treatment of the cancer patient are only now becoming
known. A better understanding of tumor cell biology and the path-
ways involved in carcinogenesis have led to novel biomarkers and
therapeutics for human cancers. The diagnostic algorithms set in
place for qualitative, quantitative and genotype infectious disease
testing have shed light on these similar applications for oncology. In the
context of patient management, not only will molecular biomarkers be
responsible for the reclassification of many of these tumor types, they
will also be responsible for directing therapy. Novel small-molecule
therapeutics will require companion diagnostics to assess the feasi-
bility and eligibility of a patient for a particular targeted therapy.
As molecular technologies continue to improve, so will management
practices.
Figure 3.4 Real-time PCR amplification curve for the Breast GeneSearch assay.
64 Chapter 3

3.7 PHARMACOGENOMICS
A rapidly growing area for molecular diagnostics is in the field of
pharmacogenomics (PGX). The ability to select and dose therapeutic
drugs through the use of genetic testing is becoming a reality. Although
other factors will most certainly continue to play a role in drug selection
and dosing, information stored in DNA can now be used to predict how
an individual will respond to commonly prescribed drugs and novel
targeted therapies.35–38 The overall aim of PGX testing is to decrease
adverse responses to therapy and increase efficacy by ensuring the
appropriate selection and dose of therapy.39,40
Vogel was the first to use the term pharmacogenetics in 1959,41 yet
thousands of years earlier, in 510 BC, Pythagoras recognized that some
individuals developed hemolytic anemia with fava bean consumption.42
In 1914, Garrod expanded upon these early observations to state that
enzymes detoxify foreign agents so that they may be excreted harm-
lessly; however, some people lack these enzymes and experience adverse
effects. Hemolytic anemia due to fava bean consumption was later
determined to occur in glucose-6-phosphate dehydrogenase-deficient
individuals.
Over the years, the central dogma for assessing human diseases at a
molecular level, DNA-RNA-protein, became the model for mov-
ing forward the newly discovered knowledge concerning pharmaco-
geniomics. Many genetic variants or polymorphisms in genes coding for
drug-metabolizing enzymes, drug transporters and drug targets have
been found to alter response to therapeutics. Technologies widely used
in molecular diagnostic laboratories can be used to identify individuals
with these genetic variations. These variants, such as single nucleotide
polymorphisms (SNPs), can have no significant effect, change drug
metabolism by 410 000-fold or alter protein binding by 420-fold.
Many of these SNPs may be used to evaluate individual risk for adverse
drug reactions (ADRs), so that we may decrease ADRs, select optimal
therapy, increase patient compliance, develop safer and more effective
drugs, revive withdrawn drugs and reduce the time and cost of clinical
trials. ADRs account for more than 2 million annual hospital admis-
sions in the USA and lead to 100 000 deaths.39,40 Thus, the potential to
minimize ADRs and improve response to therapy through genetic
testing has heightened interest in the possibility of such routine clinical
testing.
Most of the enzymes involved in drug metabolism are members of
the cytochrome P450 (CYP) superfamily.43–45 CYP2D6, for example,
is a highly polymorphic enzyme which contains 497 amino acids.
65Molecular Diagnostics
The CYP2D6 gene is localized on chromosome 22q13.1 with two
neighboring pseudogenes, CYP2D7 and CYP2D8.46,47 More than 50
alleles of CYP2D6 have been described, of which alleles *3, *4, *5, *6,
*7, *8, *11, *12, *13, *14, *15, *16, *18, *19, *20, *21, *38, *40, *42 and
*44 were classified as non-functioning and *9, *10, *17, *36 and *41
were reported to have substrate-dependent decreased activity.48 These
cytochrome P450 enzymes are mainly located in the liver and gastro-
intestinal tract and include 430 isoforms.
The enzymes responsible for the majority of biotransformations and
those that exhibit significant genetic polymorphisms are the CYP3A,
CYP2D6, CYP2C19 and CYP2C9. Classification of these enzymes
includes nomenclature, CYP2D6*1, such that the name of the enzyme
(CYP) is followed by the family (CYP2), subfamily (CYP2D) and gene
(CYP2D6) associated with the biotransformation. Allelic variants are
indicated by a*, followed by a number (CYP2D6*1). Benign genetic
variants or polymorphisms in these genes can lead to the following
phenotypes: poor, intermediate, extensive and ultra-rapid metabolizers.
Poor metabolizers (PM) have no detectable enzymatic activity; inter-
mediate metabolizers (IM) have decreased enzymatic activity; extensive
metabolizers (EM) are considered normal and have at least one copy of
an active gene; ultra-rapid metabolizers (UM) contain duplicated or
amplified gene copies that result in increased drug metabolism. It should
also be noted that in addition to the genotype predicting a phenotype,
drug-metabolizing enzyme activity can be induced or inhibited by var-
ious drugs. Induction leads to the production of more enzyme within
three or more days of exposure to inducers.49 Enzyme inhibition by
commonly prescribed drugs can be an issue in polypharmacy (a patient
taking more than one prescribed medication) and is usually the result of
competition between two drugs for metabolism by the same enzyme.
One clinical application of PGX has recently come to fruition for
testing CYP polymorphisms associated with warfarin sensitivity. Oral
anticoagulation with the vitamin K antagonist warfarin reduces the rate
of thromboembolic events for patients in a variety of clinical settings.
Warfarin therapy, however, is challenging because there are wide var-
iations among patients in response to the drug and in dose require-
ment.50 Historically, to achieve and maintain an optimal warfarin dose,
the prothrombin time and the international normalized ratio (INR) are
monitored and doses are adjusted to maintain each patient’s INR within
a narrow therapeutic range. An INR of less than 2 is associated with an
increased risk of thromboembolism and an INR of 4 or more is asso-
ciated with an increased risk of bleeding. Polymorphisms in the gene
encoding the CYP2C9 enzyme are known to contribute to variability in
66 Chapter 3
sensitivity to warfarin.50,51 CYP2C9 is the enzyme primarily responsible
for the metabolic clearance of the S-enantiomer of warfarin. Patients
with certain common genetic variants of CYP2C9 require a lower dose
of warfarin and a longer time to reach a stable dose (www.warfar-
indosing.com). They are also at higher risk for over-anticoagulation and
serious bleeding.52 Vitamin K epoxide reductase (VKORC1) is the tar-
get of anticoagulants and its common genetic variants result in altered
sensitivity to warfarin. VKORC1 polymorphisms are associated with a
need for lower doses of warfarin during long-term therapy. On the basis
of these observations, the FDA approved a labeling change for warfarin
that describes the reported effects of VKORC1 and CYP2C9 on dose
requirements and calls for lower initiation doses for patients with certain
genetic variations in CYP2C9 and VKORC1 enzymes.53
Although the genes that code for drug-metabolizing enzymes have
received more attention in recent years as targets for PGX testing, the
genes that code for proteins used to transport drugs across membranes
also need to be considered when discussing PGX. These drug trans-
porter proteins move substrates across cell membranes, bringing them
into cells or removing them from cells. These proteins are essential in the
absorption, distribution and elimination of various endogenous and
exogenous substances, including pharmaceutical agents. Several groups
of drug transporters that may be significant in the field of pharmaco-
genomics exist, including multidrug resistance proteins (MDRs), mul-
tidrug resistance-related proteins (MRPs), organic anion transporters
(OATs), organic anion-transporting polypeptides (OATPs), organic
cation transporters (OCTs) and peptide transporters (PepTs).54–56
ABCB1 is one such transporter and is a member of the ATP-binding
cassette (ABC) superfamily of proteins. Also known as P-glycoprotein
(P-gp) or MDR1, it is a 170kDa glycosylated membrane protein
expressed in various locations including the liver, intestines, kidney, brain
and testis.57 ABCB1 serves to eliminate metabolites and a wide range of
hydrophobic foreign substances, including drugs, from cells by acting as
an efflux transporter.58 ABCB1 was first identified in cancer cells that had
developed a resistance to several anticancer drugs because of an over-
expression of the transporter. When expressed at normal levels in non-
cancerous cells, ABCB1 has been shown to transport other classes of
drugs out of cells, including cardiac drugs (digoxin), antibiotics, steroids,
HIV protease inhibitors and immunosuppressants (cyclosporin A).59
Genetic variations in the ABCB1 gene expressed in normal cells have been
shown to have a role in interindividual variability in drug response.60,61
Another aspect of PGX testing that needs top be taken into account is
the importance of drug targets, as most therapeutic drugs have targets
67Molecular Diagnostics
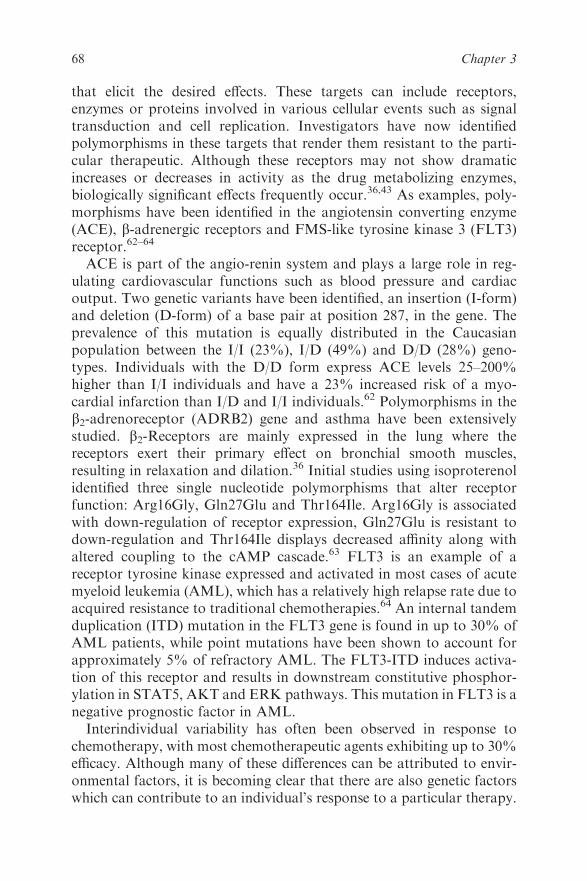
that elicit the desired effects. These targets can include receptors,
enzymes or proteins involved in various cellular events such as signal
transduction and cell replication. Investigators have now identified
polymorphisms in these targets that render them resistant to the parti-
cular therapeutic. Although these receptors may not show dramatic
increases or decreases in activity as the drug metabolizing enzymes,
biologically significant effects frequently occur.36,43 As examples, poly-
morphisms have been identified in the angiotensin converting enzyme
(ACE), b-adrenergic receptors and FMS-like tyrosine kinase 3 (FLT3)
receptor.62–64
ACE is part of the angio-renin system and plays a large role in reg-
ulating cardiovascular functions such as blood pressure and cardiac
output. Two genetic variants have been identified, an insertion (I-form)
and deletion (D-form) of a base pair at position 287, in the gene. The
prevalence of this mutation is equally distributed in the Caucasian
population between the I/I (23%), I/D (49%) and D/D (28%) geno-
types. Individuals with the D/D form express ACE levels 25–200%
higher than I/I individuals and have a 23% increased risk of a myo-
cardial infarction than I/D and I/I individuals.62 Polymorphisms in the
b2-adrenoreceptor (ADRB2) gene and asthma have been extensively
studied. b2-Receptors are mainly expressed in the lung where the
receptors exert their primary effect on bronchial smooth muscles,
resulting in relaxation and dilation.36 Initial studies using isoproterenol
identified three single nucleotide polymorphisms that alter receptor
function: Arg16Gly, Gln27Glu and Thr164Ile. Arg16Gly is associated
with down-regulation of receptor expression, Gln27Glu is resistant to
down-regulation and Thr164Ile displays decreased affinity along with
altered coupling to the cAMP cascade.63 FLT3 is an example of a
receptor tyrosine kinase expressed and activated in most cases of acute
myeloid leukemia (AML), which has a relatively high relapse rate due to
acquired resistance to traditional chemotherapies.64 An internal tandem
duplication (ITD) mutation in the FLT3 gene is found in up to 30% of
AML patients, while point mutations have been shown to account for
approximately 5% of refractory AML. The FLT3-ITD induces activa-
tion of this receptor and results in downstream constitutive phosphor-
ylation in STAT5, AKT and ERK pathways. This mutation in FLT3 is a
negative prognostic factor in AML.
Interindividual variability has often been observed in response to
chemotherapy, with most chemotherapeutic agents exhibiting up to 30%
efficacy. Although many of these differences can be attributed to envir-
onmental factors, it is becoming clear that there are also genetic factors
which can contribute to an individual’s response to a particular therapy.
68 Chapter 3
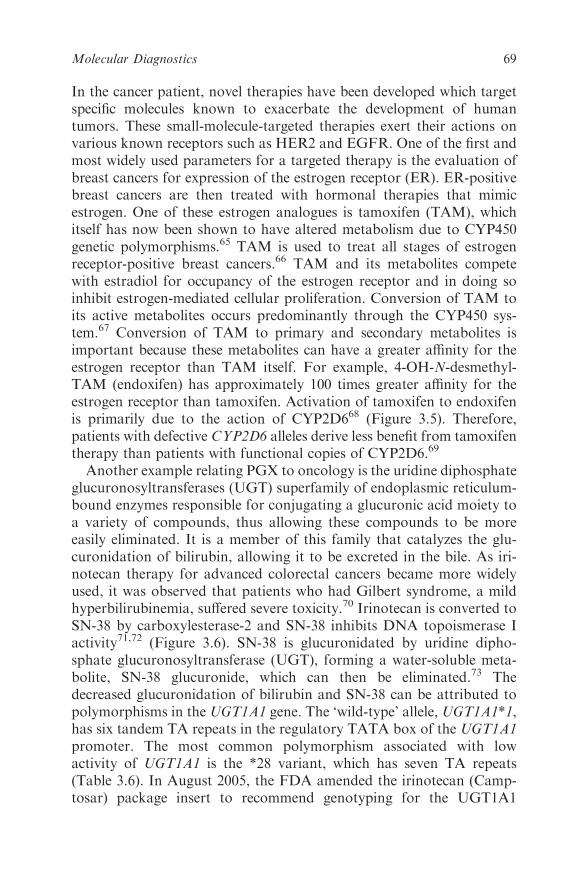
In the cancer patient, novel therapies have been developed which target
specific molecules known to exacerbate the development of human
tumors. These small-molecule-targeted therapies exert their actions on
various known receptors such as HER2 and EGFR. One of the first and
most widely used parameters for a targeted therapy is the evaluation of
breast cancers for expression of the estrogen receptor (ER). ER-positive
breast cancers are then treated with hormonal therapies that mimic
estrogen. One of these estrogen analogues is tamoxifen (TAM), which
itself has now been shown to have altered metabolism due to CYP450
genetic polymorphisms.65 TAM is used to treat all stages of estrogen
receptor-positive breast cancers.66 TAM and its metabolites compete
with estradiol for occupancy of the estrogen receptor and in doing so
inhibit estrogen-mediated cellular proliferation. Conversion of TAM to
its active metabolites occurs predominantly through the CYP450 sys-
tem.67 Conversion of TAM to primary and secondary metabolites is
important because these metabolites can have a greater affinity for the
estrogen receptor than TAM itself. For example, 4-OH-N-desmethyl-
TAM (endoxifen) has approximately 100 times greater affinity for the
estrogen receptor than tamoxifen. Activation of tamoxifen to endoxifen
is primarily due to the action of CYP2D668 (Figure 3.5). Therefore,
patients with defective CYP2D6 alleles derive less benefit from tamoxifen
therapy than patients with functional copies of CYP2D6.69
Another example relating PGX to oncology is the uridine diphosphate
glucuronosyltransferases (UGT) superfamily of endoplasmic reticulum-
bound enzymes responsible for conjugating a glucuronic acid moiety to
a variety of compounds, thus allowing these compounds to be more
easily eliminated. It is a member of this family that catalyzes the glu-
curonidation of bilirubin, allowing it to be excreted in the bile. As iri-
notecan therapy for advanced colorectal cancers became more widely
used, it was observed that patients who had Gilbert syndrome, a mild
hyperbilirubinemia, suffered severe toxicity.70 Irinotecan is converted to
SN-38 by carboxylesterase-2 and SN-38 inhibits DNA topoismerase I
activity71,72 (Figure 3.6). SN-38 is glucuronidated by uridine dipho-
sphate glucuronosyltransferase (UGT), forming a water-soluble meta-
bolite, SN-38 glucuronide, which can then be eliminated.73 The
decreased glucuronidation of bilirubin and SN-38 can be attributed to
polymorphisms in the UGT1A1 gene. The ‘wild-type’ allele, UGT1A1*1,
has six tandem TA repeats in the regulatory TATA box of the UGT1A1
promoter. The most common polymorphism associated with low
activity of UGT1A1 is the *28 variant, which has seven TA repeats
(Table 3.6). In August 2005, the FDA amended the irinotecan (Camp-
tosar) package insert to recommend genotyping for the UGT1A1
69Molecular Diagnostics

Figure 3.5 Schematic of tamoxifen metabolism.
CES
O
N
N
O
O
O
HO
O
OH
OH
HO
O
HOHO
N
N
O
O
O
HO
N O
ON
N
N
O
O
O
HO
H3C
H3C H
3C
CH3
CH3
CH3
UGT1A1
Irinotecan SN-38 SN-38G
Figure 3.6 Schematic diagram of irinotecan metabolism.
70 Chapter 3
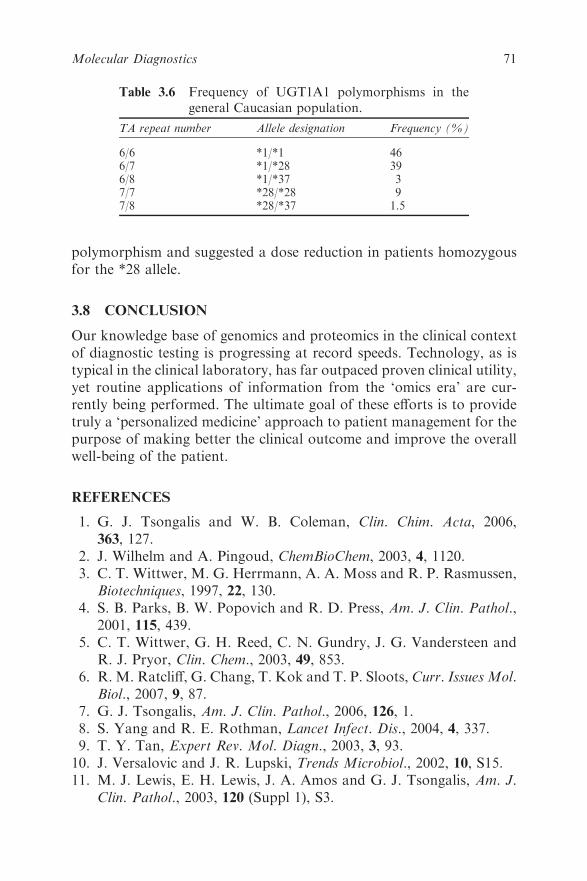
polymorphism and suggested a dose reduction in patients homozygous
for the *28 allele.
3.8 CONCLUSION
Our knowledge base of genomics and proteomics in the clinical context
of diagnostic testing is progressing at record speeds. Technology, as is
typical in the clinical laboratory, has far outpaced proven clinical utility,
yet routine applications of information from the ‘omics era’ are cur-
rently being performed. The ultimate goal of these efforts is to provide
truly a ‘personalized medicine’ approach to patient management for the
purpose of making better the clinical outcome and improve the overall
well-being of the patient.
REFERENCES
1. G. J. Tsongalis and W. B. Coleman, Clin. Chim. Acta, 2006,
363, 127.
2. J. Wilhelm and A. Pingoud, ChemBioChem, 2003, 4, 1120.
3. C. T. Wittwer, M. G. Herrmann, A. A. Moss and R. P. Rasmussen,
Biotechniques, 1997, 22, 130.
4. S. B. Parks, B. W. Popovich and R. D. Press, Am. J. Clin. Pathol.,
2001, 115, 439.
5. C. T. Wittwer, G. H. Reed, C. N. Gundry, J. G. Vandersteen and
R. J. Pryor, Clin. Chem., 2003, 49, 853.
6. R. M. Ratcliff, G. Chang, T. Kok and T. P. Sloots, Curr. Issues Mol.
Biol., 2007, 9, 87.
7. G. J. Tsongalis, Am. J. Clin. Pathol., 2006, 126, 1.
8. S. Yang and R. E. Rothman, Lancet Infect. Dis., 2004, 4, 337.
9. T. Y. Tan, Expert Rev. Mol. Diagn., 2003, 3, 93.
10. J. Versalovic and J. R. Lupski, Trends Microbiol., 2002, 10, S15.
11. M. J. Lewis, E. H. Lewis, J. A. Amos and G. J. Tsongalis, Am. J.
Clin. Pathol., 2003, 120 (Suppl 1), S3.
Table 3.6 Frequency of UGT1A1 polymorphisms in the
general Caucasian population.
TA repeat number Allele designation Frequency (%)
6/6 *1/*1 466/7 *1/*28 396/8 *1/*37 37/7 *28/*28 97/8 *28/*37 1.5
71Molecular Diagnostics
12. W. W. Grody, G. R. Cutting, K. W. Klinger, C. S. Richards, M. S.
Watson and R. J. Desnick, Genet. Med., 2001, 3, 149.
13. ACOG. Preconception and prenatal carrier screening for cystic
fibrosis: clinical laboratory guidelines. American College of Obste-
tricians and Gynecologists, Washington, D.C. 2001; 1–31.
14. S. Sherman, B. A. Pletcher and D. A. Driscoll, Genet. Med., 2005,
7, 584.
15. R. Willemsen, B. A. Oostra, G. J. Bassell and J. Dictenberg,MRDD
Res., 2004, 10, 60.
16. A. Terracciano, P. Chiurazzi and G. Neri, Am. J. Med. Genet., 2005,
137C, 32.
17. D. G. Gilliland, Semin. Hematol., 2002, 39, 6.
18. H. Kiyoi, M. Yanada and K. Ozekia, Int. J. Hematol., 2005, 82, 85.
19. J. M. Scandura, Curr. Oncol. Rep., 2005, 7, 323.
20. M. C. Stubbs and S. A. Armstrong, Curr. Drug Targets, 2007,
8, 703.
21. C. H. Lawrie, Br. J. Haematol., 2007, 137, 503.
22. E. S. Jaffe, N. L. Harris, H. Stein and J. W. Vardiman, World
Health Organization Pathology and Genetics of Tumours of the
Haematopoietic and Lymphoid Tissues, IARC Press, Lyon, 2001.
23. A. J. Bench, W. N. Erber, G. A. Follows and M. A. Scott, Int. J.
Lab. Hematol., 2007, 29, 229.
24. Y.-L. Kwong, Br. J. Haematol., 2007, 137, 273.
25. J. J. van Dongen, A. W. Langerak, M. Bruggemann, P. A. Evans,
M. Hummel, F. L. Lavender, E. Delabesse, F. Davi, E. Schuuring,
R. Garcıa-Sanz, J. H. van Krieken, J. Droese, D. Gonzalez,
C. Bastard, H. E. White, M. Spaargaren, M. Gonzalez, A. Parreira,
J. L. Smith, G. J. Morgan, M. Kneba and E. A. Macintyre,
Leukemia, 2003, 17, 2257.
26. P. L. Fitzgibbons, D. L. Page, D. Weaver, A. D. Thor, D. C. Allred,
G. M. Clark, S. G. Ruby, F. O’Malley, J. F. Simpson, J. L. Connolly,
D. F. Hayes, S. B. Edge, A. Lichter and S. J. Schnitt, Arch. Pathol.
Lab. Med., 2000, 124, 966.
27. J. Backus, T. Laughlin, Y. Wang, R. Belly, R. White, J. Baden,
C. Justus Min, A. Mannie, L. Tafra, D. Atkins and K. M. Verbanac,
J. Mol. Diagn., 2005, 7, 327.
28. E. Leygue, L. Snell, H. Dotzlaw, K. Hole, S. Troup, T. Hiller-
Hitchcock, L. C. Murphy and P. H. Watson, J. Pathol., 1999,
189, 28.
29. R. J. Ouellette, D. Richard and E. Maicas, Am. J. Clin. Pathol.,
2004, 121, 637.
72 Chapter 3

30. M. A. Watson, S. Dintzis, C. M. Darrow, L. E. Voss, J. DiPersio,
R. Jensen and T. P. Fleming, Cancer Res., 1999, 59, 3028.
31. B. K. Zehentner, D. Carter. Clin. Biochem., 2004, 37, 249.
32. K. C. Halling, W. King, I. A. Sokolova, R. G. Meyer, H. M.
Burkhardt, A. C. Halling, J. C. Cheville, T. J. Sebo, S. Ramakumar,
C. S. Stewart, S. Pankratz, D. J. O’Kane, S. A. Seelig, M. M. Lieber
and R. B. Jenkins, J. Urol., 2000, 164, 1768.
33. M. Skacel, M. Fahmy, J. A. Brainard, J. D. Pettay, C.V. Biscotti,
L. S. Liou, G. W. Procop, J. S. Jones, J. Ulchaker, C. D. Zippe and
R. R. Tubbs, J. Urol., 2003, 169, 2101.
34. M. Skacel, J. D. Pettay, E. K. Tsiftsakis, G. W. Procop, C. V.
Biscotti and R. R. Tubbs, Anal. Quant. Cytol. Histol., 2001, 23, 381.
35. R. M. Long, Clin. Pharmacol. Ther., 2007, 81, 450.
36. W. E. Evans and H. L. McLeod, N. Engl. J. Med., 2003, 348, 538.
37. J. Kircjjeiner, U. Fuhr and J. Brockmoller, Nat. Rev., 2005, 4, 639.
38. R. Weinshilboum and L. Wand, Nat. Rev. Drug Discov., 2004,
3, 739.
39. J. Lazarou, B. H. Pomeranz and P. N. Corey, JAMA, 1998,
279, 1200.
40. B. S. Shastry, Pharmacogenomics J., 2006, 6, 16.
41. F. Vogel, Ergeb. Inn. Med. Kinderheilkd., 1959, 12, 52.
42. D. Nebert, Clin. Genet., 1999, 56, 247.
43. S. J. Gardiner and E. J. Begg, Pharmacol. Rev., 2006, 58, 521.
44. M. Ingelman-Sundberg, Pharmacogenomics J., 2005, 5, 6.
45. M. Ingelman-Sundberg, Trends Pharmacol. Sci., 2004, 25, 193.
46. M. H. heim and U. A. Meyer, Genomics, 1992, 14, 49.
47. M. C. Ledesma and J. A. Agundez, Clin. Chem., 2005, 51, 939.
48. T. Andersson, D. A. Flockhart, D. B. Goldstein, S. M. Huang,
D. L. Kroetz, P. M. Milos, M. J. Ratain and K. Thummel, Clin.
Pharmacol. Ther., 2005, 78, 559.
49. H. K. Lee, L. D. Lewis, G. J. Tsongalis, M. McMullin, B. C. Schur,
S. H. Wong and K. T. Yeo, Clin. Chim. Acta, 2006, 367, 196.
50. M. R. McClain, G. E. Palomaki, M. Piper and J. E. Haddow, Genet.
Med., 2008, 10, 89.
51. M. S. Wen, M. Lee, J. J. Chen, H. P. Chuang, L. S. Lu, C. H. Chen,
T. H. Lee, C. T. Kuo, F. M. Sun, Y. J. Chang, P. L. Kuan, Y. F.
Chen, M. J. Charng, C. Y. Ray, J. Y. Wu and Y. T. Chen, Clin.
Pharmacol. Ther., 2008, 84, 83–89.
52. B. F. Gage and L. J. Lesko, J. Thromb. Thrombolysis, 2008, 25, 45.
53. A. H. Wu, P. Wang, A. Smith, C. Haller, K. Drake, M. Linder and
R. Valdes Jr., Pharmacogenomics, 2008, 9, 169.
73Molecular Diagnostics
54. A. C. Lockhart, R. G. Tirona and R. B. Kim, Mol. Cancer Ther.,
2003, 2, 685.
55. C. Marzolini, R. G. Tirona and R. B. Kim, Pharmacogenomics,
2004, 5, 273.
56. B. L. Urquhart, R. G. Tirona and R. B. Kim, J. Clin. Pharmacol.,
2007, 47, 566.
57. P. Borst, A. H. Schinkel, J. J. Smit, E. Wagenaar, L. Van Deemter,
A. J. Smith, E. W. Eijdems, F. Baas and G. J. Zaman, Pharmacol.
Ther., 1993, 60, 289.
58. S. V. Ambudkar, S. Dey and C. A. Hrycyna, Annu. Rev. Pharmacol.
Toxicol., 1999, 39, 361.
59. T. Sakaeda, T. Nakamura and K. Okumura, Biol. Pharm. Bull.,
2002, 25, 1391.
60. S. Hoffmeyer, O. Burk, O. Von Richter, H. P. Arnold, J. Brockmoller,
A. Johne, I. Cascorbi, T. Gerloff, I. Roots, M. Eichelbaum and
U. Brinkmann, Proc. Natl. Acad. Sci. USA, 2000, 97, 3473.
61. K. Jamroziak and T. Robak, Hematology, 2004, 9, 91.
62. N. J. SAamani, L. O’toole, K. Channer and K. L. Woods, Circula-
tion, 1996, 94, 708.
63. S. A. Green, G. Cole, M. Jacinto, M. Innis and S. B. Liggett, J. Biol.
Chem., 1993, 268, 23116.
64. D. B. Shankar, J. Li, P. Tapang, J. O. McCall, L. J. Pease, Y. Dai,
R. Q. Wei, D. H. Albert, J. J. Bouska, D. J. Osterling, J. Guo, P. A.
Marcotte, E. F. Johnson, N. Soni, K. Hartandi, M. R. Michaelides,
S. K. Davidsen, S. J. Priceman, J. C. Chang, K. Rhodes, N. Shah,
T. B. Moore, K. M. Sakamoto and K. B. Glaser, Blood, 2007, 109,
3400.
65. M. P. Goetz, J. M. Rae, V. J. Suman, S. L. Safgren, M. M. Ames,
D. W. Visscher, C. Reynolds, F. J. Couch, W. L. Lingle, D. A.
Flockhart, Z. Desta, E. A. Perez and J. N. Ingle, J. Clin. Oncol.,
2005, 23, 9312.
66. Early Breast Cancer Trialists’ Collaborative Group. Lancet, 1998,
351, 1451.
67. G. K. Poon, Q. Chen, Y. Teffera, J. S. Ngui, P. R. Griffin, M.P.
Braun, G. A. Doss, C. Freeden, R. A. Stearns, D. C. Evans, T.A.
Baillie and W. Tang, Drug Metab. Dispos., 1993, 21, 1119.
68. T. E. Klein, J. T. Chang, M. K. Cho, K. L. Easton, R. Fergerson,
M. Hewett, Z. Lin, Y. Liu, S. Liu, D. E. Oliver, D. L. Rubin,
F. Shafa, J. M. Stuart and R. B. Altman, Pharmacogenomics J.,
2001, 1, 167.
69. Y. Jin, Z. Desta, V. Stearns, B. Ward, H. Ho, K. H. Lee, T. Skaar,
A. M. Storniolo, L. Li, A. Araba, R. Blanchard, A. Nguyen,
74 Chapter 3

L. Ullmer, J. Hayden, S. Lemler, R. M. Weinshilboum, J. M. Rae,
D. F. Hayes and D. A. Flockhart, J. Natl. Cancer Inst., 2005, 97, 30.
70. E. Wasserman, A. Myara, F. Lokiec, F. Goldwasser, F. Trivin,
M. Mahjoubi, J. L. Misset and E. Cvitkovic, Ann. Oncol., 1997,
8, 1049.
71. R. Humerickhouse, K. Lohrbach, L. Li, W. F. Bosron and M. E.
Dolan, Cancer Res., 2000, 60, 1189.
72. J. T. Hartmann and H. P. Lipp, Drug Saf., 2006, 29, 209.
73. M. L. Maitland, K. Vasish and M. J. Ratain, Trends Pharmacol.
Sci., 2006, 27, 432.
75Molecular Diagnostics

CHAPTER 4
Molecular Microbial Diagnostics
KARL-HENNING KALLAND
Centre for Research in Virology, The Gade Institute, University of Bergen,
N-5009 Bergen, Norway
4.1 INTRODUCTION
The SARS (severe acquired respiratory syndrome) epidemic showed the
power of molecular microbial diagnostics. The World Health Organi-
zation (WHO) issued a global alert in March 2003 and 1 month later the
causative agent, a coronavirus, was molecularly cloned and sequenced.1
This facilitated the design of a polymerase chain reaction (PCR) assay
for the accurate detection of the SARS virus in patient materials. The
sequence information was made available online and allowed diagnostic
laboratories worldwide to establish their own SARS virus assays within
weeks. The molecular diagnostic tools were further used to trace the
origin of the epidemic back to Guangdong Province in China in
November 2002. The civet cat was identified as a likely viral reservoir.
Coronaviruses are ubiquitous RNA viruses and account for a signifi-
cant proportion of all upper respiratory tract infections of the common
cold type. Comparison of the nucleic acid sequences of the common cold
coronaviruses and the SARS virus provided clues to the increased
pathogenesis of the latter.
The HIV epidemic that appeared in 1983 provides another example of
the profound impact of molecular biology in the handling of emerging
diseases. Indeed, effective tools are necessary since the microbiological
Molecular Biology and Biotechnology, 5th Edition
Edited by John M Walker and Ralph Rapleyr Royal Society of Chemistry 2009
Published by the Royal Society of Chemistry, www.rsc.org
76

world develops so quickly that we can eyewitness microbiological evo-
lution within the course of our own lifetime. In fact, new infectious
agents and new types of infectious diseases have appeared almost every
year during the last 20 years (Table 4.1) and this is likely to continue.
Still the causative agent cannot be identified in about 40% of respiratory
diseases and more than half of all cases of encephalitis. It has been
established that 20% of all human cancers are due to defined infectious
agents, but indirect evidence suggests that infections may contribute to
about 30% of all cancers. The role of infectious agents in autoimmune
disease remains to be settled.
Table 4.1 Chronological examples of discovery of infectious agents.a
2005 Human retroviruses (HTLV3 and HTLV4)Human bocavirusMimivirusHuman coronavirus HKU1
2004 Simian foamy retroviruses2003 SARS coronavirus2001 Metapneumovirus1999 Nipah virus
West Nile virus in USA1997 Avian influenza virus in humans (H5N1)1996 nvCJD
Bat lyssaviruses (Australia, Scotland)1995 Human herpes virus 8 (Kaposi sarcoma virus)1994 Sabia virus
Hendra virus1993 Sin nombre virus (hantavirus pulmonary syndrome)1992 Vibrio cholerae O139
Bartonella henselae1991 Guanarito virus (Venezuelan haemorrhagic fever)
Hepatitis C virusEhrlichia chafeensisPhotorhabdus asymbioticaHepatitis E virusHuman herpes virus 6
1986 Cyclospora cayatenensisBovine spongiform encephalopathy
1985 Enterocytozoon bieneusi1983 HIV-1
Helicobacter pylori1982 Escherichia coli O157:H7
HTLV2Borrelia burgdorferi (Lyme disease)
1981 Toxic shock syndrome associated Staphylococcus aureus1980 Human T-lymphotropic virus (HTLV1)
aExamples of emerging infectious agents and the year of discovery. More comprehensive infor-mation can be found at http://www.hpa.org.uk/infections/topics_az/emerging_infections/list.htmand http://www3.niaid.nih.gov/research/topics/emerging/list.htm.
77Molecular Microbial Diagnostics
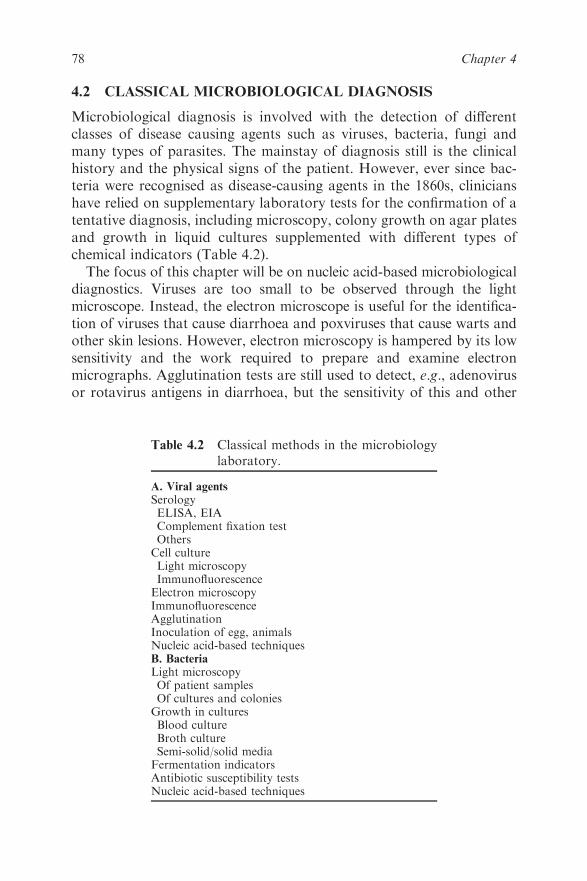
4.2 CLASSICAL MICROBIOLOGICAL DIAGNOSIS
Microbiological diagnosis is involved with the detection of different
classes of disease causing agents such as viruses, bacteria, fungi and
many types of parasites. The mainstay of diagnosis still is the clinical
history and the physical signs of the patient. However, ever since bac-
teria were recognised as disease-causing agents in the 1860s, clinicians
have relied on supplementary laboratory tests for the confirmation of a
tentative diagnosis, including microscopy, colony growth on agar plates
and growth in liquid cultures supplemented with different types of
chemical indicators (Table 4.2).
The focus of this chapter will be on nucleic acid-based microbiological
diagnostics. Viruses are too small to be observed through the light
microscope. Instead, the electron microscope is useful for the identifica-
tion of viruses that cause diarrhoea and poxviruses that cause warts and
other skin lesions. However, electron microscopy is hampered by its low
sensitivity and the work required to prepare and examine electron
micrographs. Agglutination tests are still used to detect, e.g., adenovirus
or rotavirus antigens in diarrhoea, but the sensitivity of this and other
Table 4.2 Classical methods in the microbiology
laboratory.
A. Viral agentsSerologyELISA, EIAComplement fixation testOthersCell cultureLight microscopyImmunofluorescenceElectron microscopyImmunofluorescenceAgglutinationInoculation of egg, animalsNucleic acid-based techniquesB. BacteriaLight microscopyOf patient samplesOf cultures and coloniesGrowth in culturesBlood cultureBroth cultureSemi-solid/solid mediaFermentation indicatorsAntibiotic susceptibility testsNucleic acid-based techniques
78 Chapter 4
immunological methods is too low in most other viral diseases. Inocu-
lation of a permissive cell culture by infected patient materials yields an
efficient biological amplification of the virus, but growth takes days and
different viruses require different cell types for efficient propagation, and
many viruses may not grow in cell cultures at all – again limiting the speed
and efficacy of diagnosis. Serological methods detect specific antibodies
made by the immune system of the patient as a response to the disease
causing agent or detect specific viral antigens. Serology still dominates
routine diagnostics in virology. ELISA and EIA techniques have vastly
improved the sensitivity, speed and accuracy of serology, but none of the
serological techniques can circumvent the fact that it often takes from
days to weeks following acute disease until detectable levels of antibodies
are present in the circulation. In some viral diseases, usually when the
incubation time is longer, such as in the case of rubella or parvovirus B19
infections, the appearance of specific antibodies coincides with the
appearance of clinical signs such as skin rashes. In these cases, serology is
an excellent and adequate diagnostic tool.
Nucleic acid amplification techniques, of which PCR represents the
prototype, have entirely changed the basis of virological diagnosis and
thereby the acute differential diagnosis of infectious diseases. The main
reason is the possibility of detecting the nucleic acid of the causative
agents directly, rapidly, specifically and with very high sensitivity.
Nucleic acid-based techniques present, however, a number of technical
challenges on their own. Due to extreme sensitivity, the amplification
techniques are susceptible to contamination and their dependence on
exact nucleic acid sequences may cause the tests to fail due to natural
sequence variability or new mutations in critical nucleic acid sequences
of the agent. The remainder of this chapter will be devoted to micro-
biological nucleic acid-based techniques, their principles, the applic-
ability and remaining challenges and trends.
4.3 SAMPLE COLLECTION AND NUCLEIC ACID
PURIFICATION
4.3.1 Sample Collection and Transport
Virtually all human secretions, fluids and tissue samples can be collected
and examined for nucleic acids of suspected infectious agents (Table 4.3).
In addition, laboratory cultures, bacterial colonies and infected cell cul-
tures are used for nucleic acid extraction and identification. The micro-
biological diagnostic laboratory provides kits for taking and shipping
patient samples. Some kits contain buffers that inactivate infectious
79Molecular Microbial Diagnostics

agents, inhibit nucleases and lyse membranes to facilitate subsequent
nucleic acid extraction. Whenever patient samples are collected and sent
without additives, speedy delivery to the laboratory must be ensured and
great care must be taken to label the sample appropriately and to avoid
contamination of the outside of the collecting vessel. Several companies
supply swab kits and buffer kits for stabilising samples during transport.2
Stool transport and recovery buffer has proved useful for, e.g., faecal
samples (S.T.A.R.; Roche Diagnostics, Indianapolis, IN, USA). The
swab extraction tube system (S.E.T.S.; Roche Diagnostics) is a simple kit
for rapidly and efficiently recovering specimens attached to and absorbed
into the fibres of a collection swab. IsoCode Stix (Schleicher and Schuell,
Keene, NH, USA) provides a method for stabilising blood samples that
are to be transported long distances for later testing by real-time PCR.2
4.3.2 Extraction of Nucleic Acids
Different nucleic acid extraction protocols are required for different
samples and different microbiological agents. RNA is more susceptible
than DNA to rapid degradation by nucleases and the best way to
counteract this problem is to dissolve the sample in a guanidinium
isothiocyanate-based lysis buffer as soon as possible. Viral nucleic acids
usually can be extracted in the same way as host cell nucleic acids are
extracted. Sometimes, e.g. for faecal samples, gentle vortexing followed
by a low-speed centrifugation can remove debris and viral particles will
remain in the supernatant. During subsequent ultracentrifugation, virus
particles can be pelleted and concentrated. The thick cell wall of Gram-
positive bacteria is more difficult to disrupt than the relatively thinner
cell wall of Gram-negative bacteria and need special procedures.3,4
Haem in blood, bile in stool and components of urine and additives
such as heparin may inhibit Taq polymerase and must be removed by
Table 4.3 Patients’ samples in clinical
microbiology.
SerumEDTA bloodPlasmaCerebrospinal fluid (CSF)SputumExpectorate, nasopharyngeal aspirateVesicle and ulcer fluidsUrineFaecesTissue biopsies and body fluids
80 Chapter 4
the purification procedure prior to the amplification step. Purified
nucleic acids should be eluted into a small volume of nuclease-free water
or 0.1mM EDTA. Ethanol or propan-2-ol precipitation may be used to
achieve smaller volumes, but must be completely removed by pipetting
and evaporation to avoid subsequent enzymatic inhibition.
4.3.3 Manual Extraction of Nucleic Acids
Several commercial manual extraction kits are available for use by
clinical laboratories (see Table 2 in ref. 2). These kits vary in the method,
cost and time required for extraction. Processing by manual methods
involves a higher risk of contamination and switching of patient sam-
ples. US Clinical Laboratory Improvement Amendments of 1988
(CLIA) regulations provide guidelines regarding manual extraction of
nucleic acids for diagnostic purposes (http://www.cms.hhs.gov/clia/).
4.3.4 Automated Extraction of Nucleic Acids
Automated extraction instruments are manufactured by a number of
different companies and, like manual methods, vary in method, cost and
time requirements for extraction. Additionally, these instruments vary in
the specimen capacity per run and size (see Table 3 in Ref. 2 and Table 1
in Ref. 5). Comparisons of manual and automated extraction methods
have found automated procedures to be equivalent and in some
instances superior to manual methods (see Ref. 2 and references cited
therein), although not always.6 Automated extraction systems have
certain inherent advantages over manual methods. Recovery of nucleic
acids from automated instruments is consistent and reproducible.
Automated extraction systems keep sample manipulation to a mini-
mum, reducing the risk of cross-contamination of samples. They are
most economical when instruments are fully loaded, although smaller
and more versatile instruments have now become available. Space and
cost of equipment and disposables also need to be considered.2
4.4 NUCLEIC ACID AMPLIFICATION TECHNIQUES
4.4.1 Polymerase Chain Reaction (PCR)
PCR represents the prototype of nucleic acid amplification techniques
and its principles are described in Chapter 5, Section 3, Figure 5.7.
Excellent reviews on its applicability in clinical microbiology have been
published.5,7,8 Due to its extreme sensitivity, nucleic acid amplification
has revolutionised the identification of infectious agents in patient
81Molecular Microbial Diagnostics
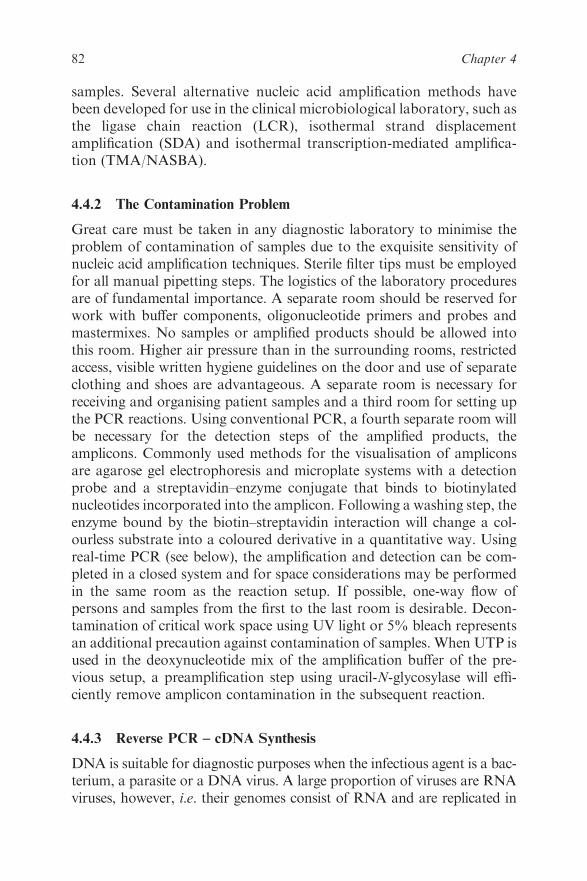
samples. Several alternative nucleic acid amplification methods have
been developed for use in the clinical microbiological laboratory, such as
the ligase chain reaction (LCR), isothermal strand displacement
amplification (SDA) and isothermal transcription-mediated amplifica-
tion (TMA/NASBA).
4.4.2 The Contamination Problem
Great care must be taken in any diagnostic laboratory to minimise the
problem of contamination of samples due to the exquisite sensitivity of
nucleic acid amplification techniques. Sterile filter tips must be employed
for all manual pipetting steps. The logistics of the laboratory procedures
are of fundamental importance. A separate room should be reserved for
work with buffer components, oligonucleotide primers and probes and
mastermixes. No samples or amplified products should be allowed into
this room. Higher air pressure than in the surrounding rooms, restricted
access, visible written hygiene guidelines on the door and use of separate
clothing and shoes are advantageous. A separate room is necessary for
receiving and organising patient samples and a third room for setting up
the PCR reactions. Using conventional PCR, a fourth separate room will
be necessary for the detection steps of the amplified products, the
amplicons. Commonly used methods for the visualisation of amplicons
are agarose gel electrophoresis and microplate systems with a detection
probe and a streptavidin–enzyme conjugate that binds to biotinylated
nucleotides incorporated into the amplicon. Following a washing step, the
enzyme bound by the biotin–streptavidin interaction will change a col-
ourless substrate into a coloured derivative in a quantitative way. Using
real-time PCR (see below), the amplification and detection can be com-
pleted in a closed system and for space considerations may be performed
in the same room as the reaction setup. If possible, one-way flow of
persons and samples from the first to the last room is desirable. Decon-
tamination of critical work space using UV light or 5% bleach represents
an additional precaution against contamination of samples. When UTP is
used in the deoxynucleotide mix of the amplification buffer of the pre-
vious setup, a preamplification step using uracil-N-glycosylase will effi-
ciently remove amplicon contamination in the subsequent reaction.
4.4.3 Reverse PCR – cDNA Synthesis
DNA is suitable for diagnostic purposes when the infectious agent is a bac-
terium, a parasite or a DNA virus. A large proportion of viruses are RNA
viruses, however, i.e. their genomes consist of RNA and are replicated in
82 Chapter 4
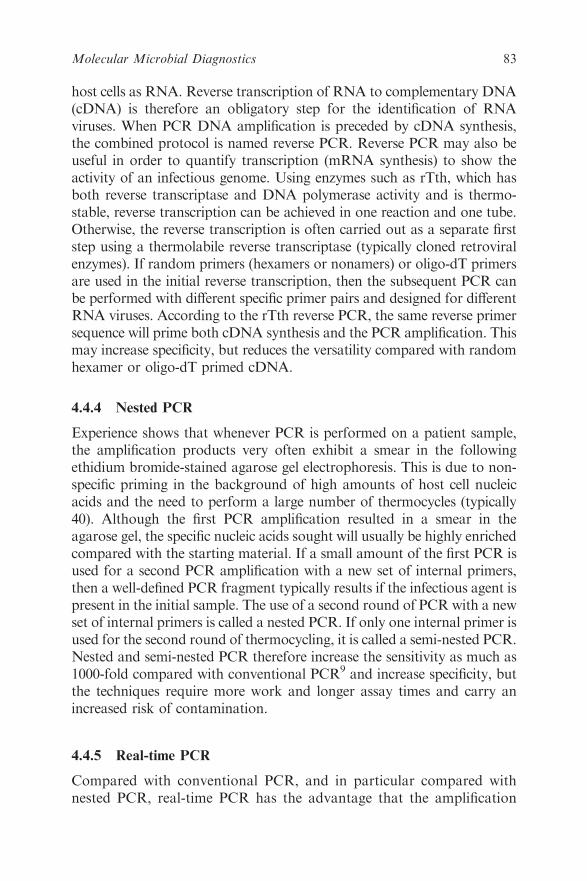
host cells as RNA. Reverse transcription of RNA to complementary DNA
(cDNA) is therefore an obligatory step for the identification of RNA
viruses. When PCR DNA amplification is preceded by cDNA synthesis,
the combined protocol is named reverse PCR. Reverse PCR may also be
useful in order to quantify transcription (mRNA synthesis) to show the
activity of an infectious genome. Using enzymes such as rTth, which has
both reverse transcriptase and DNA polymerase activity and is thermo-
stable, reverse transcription can be achieved in one reaction and one tube.
Otherwise, the reverse transcription is often carried out as a separate first
step using a thermolabile reverse transcriptase (typically cloned retroviral
enzymes). If random primers (hexamers or nonamers) or oligo-dT primers
are used in the initial reverse transcription, then the subsequent PCR can
be performed with different specific primer pairs and designed for different
RNA viruses. According to the rTth reverse PCR, the same reverse primer
sequence will prime both cDNA synthesis and the PCR amplification. This
may increase specificity, but reduces the versatility compared with random
hexamer or oligo-dT primed cDNA.
4.4.4 Nested PCR
Experience shows that whenever PCR is performed on a patient sample,
the amplification products very often exhibit a smear in the following
ethidium bromide-stained agarose gel electrophoresis. This is due to non-
specific priming in the background of high amounts of host cell nucleic
acids and the need to perform a large number of thermocycles (typically
40). Although the first PCR amplification resulted in a smear in the
agarose gel, the specific nucleic acids sought will usually be highly enriched
compared with the starting material. If a small amount of the first PCR is
used for a second PCR amplification with a new set of internal primers,
then a well-defined PCR fragment typically results if the infectious agent is
present in the initial sample. The use of a second round of PCR with a new
set of internal primers is called a nested PCR. If only one internal primer is
used for the second round of thermocycling, it is called a semi-nested PCR.
Nested and semi-nested PCR therefore increase the sensitivity as much as
1000-fold compared with conventional PCR9 and increase specificity, but
the techniques require more work and longer assay times and carry an
increased risk of contamination.
4.4.5 Real-time PCR
Compared with conventional PCR, and in particular compared with
nested PCR, real-time PCR has the advantage that the amplification
83Molecular Microbial Diagnostics
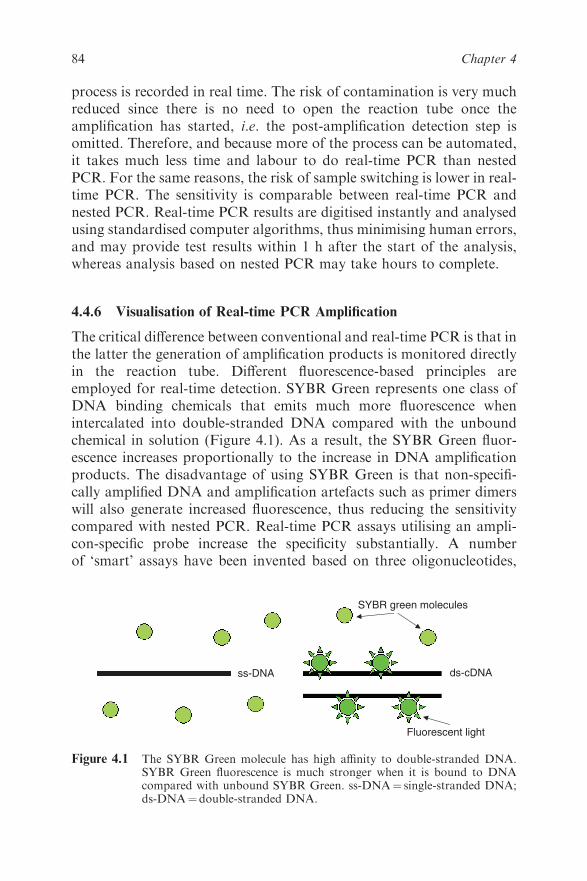
process is recorded in real time. The risk of contamination is very much
reduced since there is no need to open the reaction tube once the
amplification has started, i.e. the post-amplification detection step is
omitted. Therefore, and because more of the process can be automated,
it takes much less time and labour to do real-time PCR than nested
PCR. For the same reasons, the risk of sample switching is lower in real-
time PCR. The sensitivity is comparable between real-time PCR and
nested PCR. Real-time PCR results are digitised instantly and analysed
using standardised computer algorithms, thus minimising human errors,
and may provide test results within 1 h after the start of the analysis,
whereas analysis based on nested PCR may take hours to complete.
4.4.6 Visualisation of Real-time PCR Amplification
The critical difference between conventional and real-time PCR is that in
the latter the generation of amplification products is monitored directly
in the reaction tube. Different fluorescence-based principles are
employed for real-time detection. SYBR Green represents one class of
DNA binding chemicals that emits much more fluorescence when
intercalated into double-stranded DNA compared with the unbound
chemical in solution (Figure 4.1). As a result, the SYBR Green fluor-
escence increases proportionally to the increase in DNA amplification
products. The disadvantage of using SYBR Green is that non-specifi-
cally amplified DNA and amplification artefacts such as primer dimers
will also generate increased fluorescence, thus reducing the sensitivity
compared with nested PCR. Real-time PCR assays utilising an ampli-
con-specific probe increase the specificity substantially. A number
of ‘smart’ assays have been invented based on three oligonucleotides,
SYBR green molecules
Fluorescent light
ss-DNA ds-cDNA
Figure 4.1 The SYBR Green molecule has high affinity to double-stranded DNA.SYBR Green fluorescence is much stronger when it is bound to DNAcompared with unbound SYBR Green. ss-DNA¼ single-stranded DNA;ds-DNA¼ double-stranded DNA.
84 Chapter 4
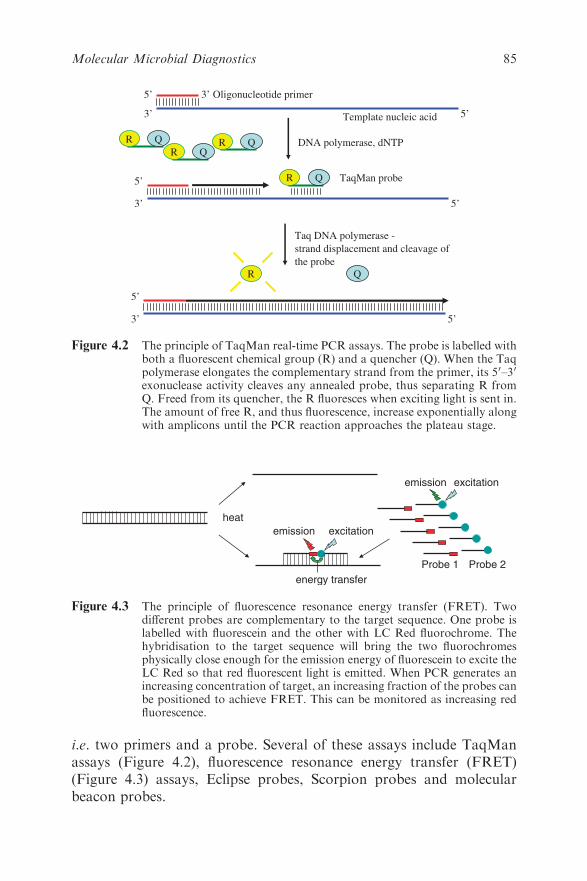
i.e. two primers and a probe. Several of these assays include TaqMan
assays (Figure 4.2), fluorescence resonance energy transfer (FRET)
(Figure 4.3) assays, Eclipse probes, Scorpion probes and molecular
beacon probes.
3’ 5’
5’
3’ 5’
5’
3’ Oligonucleotide primer
Template nucleic acid
DNA polymerase, dNTP
QR TaqMan probe
Taq DNA polymerase -
strand displacement and cleavage of
the probe
QRQR
QR
3’ 5’
5’
R Q
Figure 4.2 The principle of TaqMan real-time PCR assays. The probe is labelled withboth a fluorescent chemical group (R) and a quencher (Q). When the Taqpolymerase elongates the complementary strand from the primer, its 50–30
exonuclease activity cleaves any annealed probe, thus separating R fromQ. Freed from its quencher, the R fluoresces when exciting light is sent in.The amount of free R, and thus fluorescence, increase exponentially alongwith amplicons until the PCR reaction approaches the plateau stage.
heat
excitationemission
emission excitation
energy transfer
Probe 1 Probe 2
Figure 4.3 The principle of fluorescence resonance energy transfer (FRET). Twodifferent probes are complementary to the target sequence. One probe islabelled with fluorescein and the other with LC Red fluorochrome. Thehybridisation to the target sequence will bring the two fluorochromesphysically close enough for the emission energy of fluorescein to excite theLC Red so that red fluorescent light is emitted. When PCR generates anincreasing concentration of target, an increasing fraction of the probes canbe positioned to achieve FRET. This can be monitored as increasing redfluorescence.
85Molecular Microbial Diagnostics
4.4.7 Real-time PCR Equipment
Compared with conventional PCR, real-time qPCR puts extra demands
on the equipment. Lasers are needed to excite fluorophores and
recording devices are required to collect and digitise the fluorescent
signals. Several of the available thermocyclers are listed in Table 1 in
Ref. 2. The choice of thermocycler will depend on a large number of
variables. Should the thermocycler be downstream of a high-throughput
96-well-format? Or is there a need for individualisation of PCR reactions
that can be provided by the Smartcycler?
4.4.8 Real-time Quantitative PCR
The increasing fluorescence signal plotted on the y-axis and the
increasing thermocycle numbers along the x-axis generate a sigmoidal
curve. The threshold cycle is defined as the cycle number when the
fluorescent signal exceeds the detection threshold. During the following
4–8 cycles, the fluorescence typically approaches an exponential increase
before approaching a plateau phase.10 During the exponential phase, the
logarithm of the fluorescent signal along the y-axis and the cycle number
along the x-axis generate a straight line that can be used for quantifi-
cation. In this phase of the real-time PCR, the fractional threshold cycle
number (Ct) is inversely related to the logarithm of the number of
starting templates.11 Parallel PCR amplification of a dilution series of
known amounts of the same template therefore allows the construction
of a calibration curve from which the exact amount of starting template
can be calculated.7 It must then be assumed that the amplification effi-
ciency is equal for all samples and standards. One sign of acceptable
quantification is that the slope of the calibration curve is between �3.3
and �3.4. More exact guidelines to quantification and quality control
can be found in user bulletins to thermocycler software (e.g. ABI Prism
User Bulletin No. 2, http://www.appliedbiosystems.com/).
4.4.8.1 Absolute and Relative Quantifications
In order to achieve absolute quantification, a known amount of refer-
ence standard is required for the dilution series and calibration curve
generation. Synthetic oligonucleotides, purified PCR fragments or
plasmids or in vitro transcribed RNA can be quantified using absorption
readings at a wavelength of 260 nm (OD260). Dilution series of exactly
known amounts of target then allow absolute quantification. Relative
quantification, relating the amount of template to an accepted standard,
is often sufficient and this can be achieved using the calibration curve
86 Chapter 4
method or the comparative Ct method (see Ref. 7 and references cited
therein or ABI Prism User Bulletin No. 2).
4.4.9 Determination of ‘Viral Load’ in Clinical Microbiology
‘Viral load’ refers to the number of viral genomes in a defined volume of a
patient sample, typically in serum or plasma. Determination of viral load
is becoming increasingly important with increasing use of antiviral medi-
cation. Real-time quantification of viral load is one important criterion for
the start of antiviral medication against human immunodeficiency virus
(HIV), hepatitis C and hepatitis B viruses, against cytomegalovirus (CMV)
in immunocompromised patients and against Epstein–Barr virus (EBV) in
post-transplant patients. Efficient response to antiviral therapy can be
monitored as the viral load is reduced and quantification is of great value
to monitor possible development of viral resistance to the medication or
possible relapse after cessation of therapy. Commercial kits are widely
used for quantification of viral load in clinical microbiology. A known
amount of synthetic standard is typically included in each reaction to
establish a competitive PCR amplification. The resulting amounts of viral
and standard amplicons are compared with a standard dilution curve in
order to establish the viral load. It is important to be aware that different
manufacturers may have different standardisation units so that results
obtained using different kits may not be comparable. Progress has recently
been made to establish internationally accepted standard units for differ-
ent viruses, e.g. for hepatitis B virus,12 hepatitis C virus13 and parvovirus
B19.14 The WHO provides guidelines and established standards in
order to calibrate different methods to obtain comparable International
Units per millilitre (IUmL�1) (http://www.who.int/biologicals/reference_
preparations/distribution/en/index.html).
4.4.10 Internal Controls in Microbiological Real-time qPCR
Both negative and positive controls are important in nucleic acid-based
diagnosis in the microbiological laboratory.2 The negative control
consists of a parallel amplification reaction that does not contain the
specific target. The most difficult decision is the number of negative
controls and recommendations for a negative control for every fifth tube
to control efficiently for contamination may come in conflict with
available resources.2 Positive controls can be any target sequence in a
separate tube. The best positive control templates are included in the
same tube as the diagnostic assay and contain flanking sequences
complementary to the primers of the diagnostic assay but with a unique
87Molecular Microbial Diagnostics

sequence in the region recognised by the probe. Since real-time qPCR
assays are typically designed with amplicons shorter than 100 nucleo-
tides, it is easy to obtain the desired control template sequence by oli-
gonucleotide synthesis. A more difficult challenge is if the laboratory
wants to spike the patient sample with a control sequence to control for
the entire process from sample handling, via nucleic acid extraction
through PCR amplification. For RNA viruses, which represent the
greatest challenge, this can be achieved if a known amount of an in vitro-
synthesised RNA is spiked into the patient sample. Any exogenous
sequence will do if it can be detected separately from the sequence of the
infectious agent. However, the optimal control RNA will be transcribed
from a vector that can generate an RNA that contains more than 1500
nucleotides and includes a target sequence that can be amplified with the
same primers as the diagnostic assay but differs in the region recognised
by the probe. In all same-tube controls it is very important to titrate
carefully the amount of control target. Otherwise, the control may
compete out the diagnostic assay and lead to false negatives.
4.4.11 Multiplex Real-time PCR
Multiplex PCR refers to the use of more than one primer pair in one
reaction tube in order to amplify more than one target sequence or to
more than one primer/probe set in the case of real-time PCR. The
internal control assay described above is one example of multiplex PCR.
In microbiological diagnostics, the general aim of multiplex PCR is to
test simultaneously for different agents in the same reaction. This
requires the use of fluorophores and equipment with the ability to dis-
tinguish between the different assays. Non-specific amplification pro-
ducts seem to be the most limiting factor of multiplex PCR as the
number of oligonucleotide primers and probes increases. Several mul-
tiplex assays for the simultaneous detection of two or more different
agents are, however, well established. Examples include multiplex PCR
assays for herpes simplex virus 1 and 2 (HSV-1 and HSV-2) and assays
for influenza type A and B viruses.
4.4.12 Melting Curve Analysis
By taking advantage of melting curve analysis, it has been possible to
increase the number of agents detected in multiplex real-time PCR, in
particular to distinguish between closely related viruses such as HSV-1
and HSV-2 or influenza A and B. FRET probes (Figure 4.3) are useful
for this type of analysis. When one FRET probe is designed to be
88 Chapter 4
complementary to one viral subtype but contains one or very few mis-
matches to the other viral subtype, melting curve analysis is possible due
to different melting points (Tm) depending on the exact target sequence.
Melting curve analysis is performed following completion of the PCR.
The probe pair is allowed to anneal to the target amplicons and then the
temperature is increased while the fluorescence is continuously recorded.
The viral subtype with mismatch to the FRET probe will exhibit a
reduced fluorescence at a lower Tm than the viral subtype with perfect
homology to the FRET probe. If both subtypes are present in the same
mix, this may be visualised as a curve with two different peaks when the
fluorescence is plotted on the y-axis and temperature on the x-axis. A
number of multiplex real-time PCR assays have been published,
including simultaneous amplification and subtyping of HSV-1 and
HSV2 and VZV using FRET probes15,16 and the combination of influ-
enza A subtypes H1N1 and H3N2, influenza B and respiratory syncytial
virus (RSV) subtypes A and B.16,17
4.4.13 Genotyping
Viruses evolve much more rapidly than their host organisms. In parti-
cular, RNA viruses that are replicated by RNA polymerases which lack
50 proof reading, in contrast to DNA polymerases, are prone to point
mutation errors in the order of 10�4 per genome replication. Both DNA
viruses and RNA viruses may change rapidly when there are changes in
the selection pressure due to very short generation times and an enor-
mous number of progeny in each infection. As a consequence, most viral
species come in multiple serotypes and genotypes and we have the
dubious possibility to eyewitness viral evolution. In many cases it is
clinically relevant to distinguish between genotypes. Twelve different
main genotypes are currently described for hepatitis C virus. Both
prognosis and the recommended duration of PEG-interferon a-ribavirin
combination therapy vary between HCV genotypes. The prevalent
genotypes 1 and 4 usually require 48 weeks of combination therapy
whereas 12 weeks of therapy is often sufficient for genotypes 2 and 3.
Also, sustained viral response, meaning that HCV RNA cannot be
detected in serum 6 months following cessation of treatment, is achieved
in a higher proportion of cases for genotypes 2 and 3. More than 130
genotypes of human papillomaviruses (HPVs) are currently recorded.
Less than 90% sequence homology in regions of the L1, E6 and E7 genes
compared with any previously known HPV type is required to define a
new HPV type. HPVs are separated into high- and low-risk types
regarding their ability to cause cervical cancer. Genotyping can be
89Molecular Microbial Diagnostics
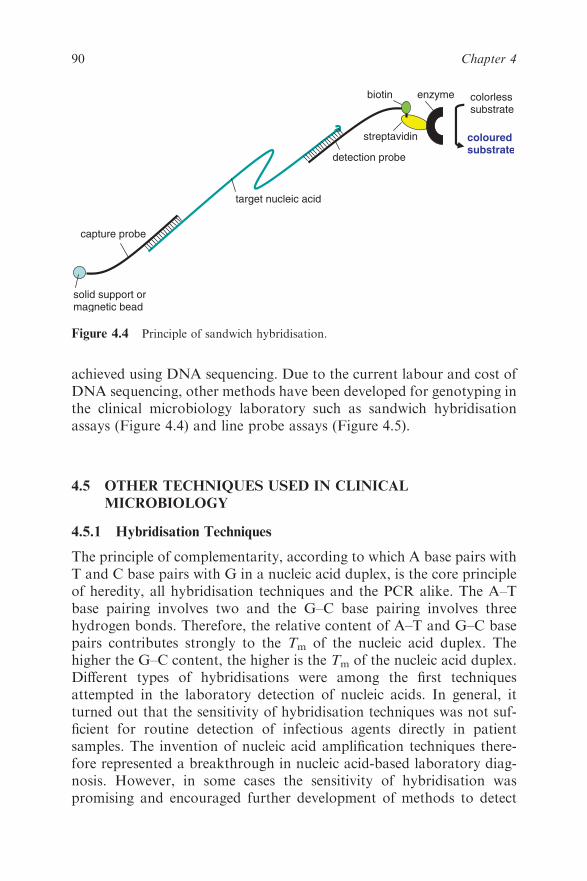
achieved using DNA sequencing. Due to the current labour and cost of
DNA sequencing, other methods have been developed for genotyping in
the clinical microbiology laboratory such as sandwich hybridisation
assays (Figure 4.4) and line probe assays (Figure 4.5).
4.5 OTHER TECHNIQUES USED IN CLINICAL
MICROBIOLOGY
4.5.1 Hybridisation Techniques
The principle of complementarity, according to which A base pairs with
T and C base pairs with G in a nucleic acid duplex, is the core principle
of heredity, all hybridisation techniques and the PCR alike. The A–T
base pairing involves two and the G–C base pairing involves three
hydrogen bonds. Therefore, the relative content of A–T and G–C base
pairs contributes strongly to the Tm of the nucleic acid duplex. The
higher the G–C content, the higher is the Tm of the nucleic acid duplex.
Different types of hybridisations were among the first techniques
attempted in the laboratory detection of nucleic acids. In general, it
turned out that the sensitivity of hybridisation techniques was not suf-
ficient for routine detection of infectious agents directly in patient
samples. The invention of nucleic acid amplification techniques there-
fore represented a breakthrough in nucleic acid-based laboratory diag-
nosis. However, in some cases the sensitivity of hybridisation was
promising and encouraged further development of methods to detect
solid support ormagnetic bead
biotin
streptavidin
colorlesssubstrate
colouredsubstrate
target nucleic acid
capture probe
detection probe
enzyme
Figure 4.4 Principle of sandwich hybridisation.
90 Chapter 4

nucleic acids, in particular for bacteria containing multicopy plasmids or
repeated genomic sequences.18–20
4.5.1.1 Sandwich Hybridisation
In the classical hybridisation techniques, the nucleic acid target was usually
fixed on a solid phase (nitrocellulose, nylon membrane, glass slide) and
detected by a labelled probe added in the hybridisation buffer to the solid
phase. These techniques, such as dot blots, colony blots, Southern blots,
Northern blots and in situ hybridisation, usually either lacked sufficient
sensitivity due to background hybridisation or were too laborious for the
biotin
streptavidin
colorless
substrate
colouredsubstrate
enzyme
capture probes
ACCTCATAGCTG
ATACGTCTT
ATCTGAT
TGCTCAT
AGG
TCAGAACTCAA
capture probes
Figure 4.5 Principle of the line probe assay. Different capture probe sequences arefixed in different bands in a membrane strip. The amplification productwill hybridise with the capture probe of complementary sequence. Utilis-ing biotin-labelled PCR primers, the position of the complementary cap-ture probe can be visualised as a coloured band following addition ofstreptavidin-bound enzyme that will change a non-coloured substrate to acoloured product that precipitates in the band.
91Molecular Microbial Diagnostics
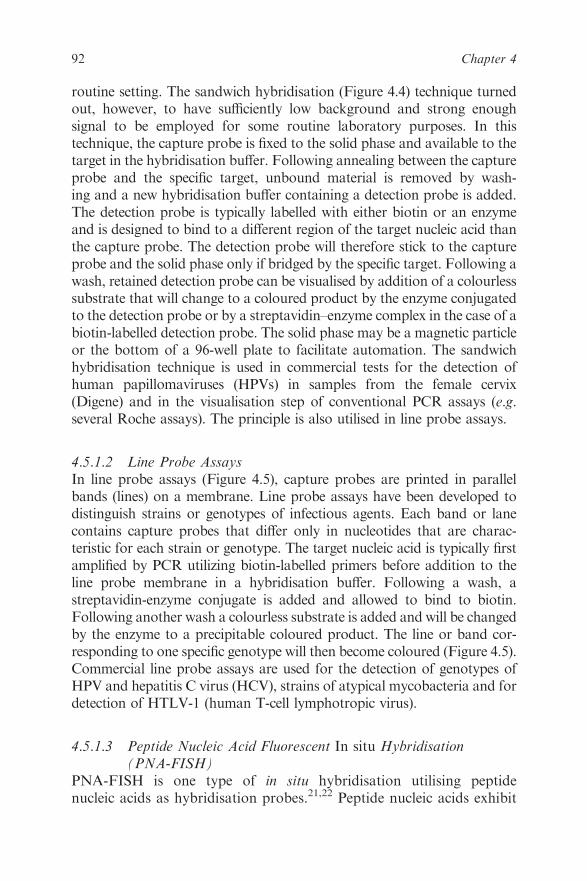
routine setting. The sandwich hybridisation (Figure 4.4) technique turned
out, however, to have sufficiently low background and strong enough
signal to be employed for some routine laboratory purposes. In this
technique, the capture probe is fixed to the solid phase and available to the
target in the hybridisation buffer. Following annealing between the capture
probe and the specific target, unbound material is removed by wash-
ing and a new hybridisation buffer containing a detection probe is added.
The detection probe is typically labelled with either biotin or an enzyme
and is designed to bind to a different region of the target nucleic acid than
the capture probe. The detection probe will therefore stick to the capture
probe and the solid phase only if bridged by the specific target. Following a
wash, retained detection probe can be visualised by addition of a colourless
substrate that will change to a coloured product by the enzyme conjugated
to the detection probe or by a streptavidin–enzyme complex in the case of a
biotin-labelled detection probe. The solid phase may be a magnetic particle
or the bottom of a 96-well plate to facilitate automation. The sandwich
hybridisation technique is used in commercial tests for the detection of
human papillomaviruses (HPVs) in samples from the female cervix
(Digene) and in the visualisation step of conventional PCR assays (e.g.
several Roche assays). The principle is also utilised in line probe assays.
4.5.1.2 Line Probe Assays
In line probe assays (Figure 4.5), capture probes are printed in parallel
bands (lines) on a membrane. Line probe assays have been developed to
distinguish strains or genotypes of infectious agents. Each band or lane
contains capture probes that differ only in nucleotides that are charac-
teristic for each strain or genotype. The target nucleic acid is typically first
amplified by PCR utilizing biotin-labelled primers before addition to the
line probe membrane in a hybridisation buffer. Following a wash, a
streptavidin-enzyme conjugate is added and allowed to bind to biotin.
Following another wash a colourless substrate is added and will be changed
by the enzyme to a precipitable coloured product. The line or band cor-
responding to one specific genotype will then become coloured (Figure 4.5).
Commercial line probe assays are used for the detection of genotypes of
HPV and hepatitis C virus (HCV), strains of atypical mycobacteria and for
detection of HTLV-1 (human T-cell lymphotropic virus).
4.5.1.3 Peptide Nucleic Acid Fluorescent In situ Hybridisation
(PNA-FISH)
PNA-FISH is one type of in situ hybridisation utilising peptide
nucleic acids as hybridisation probes.21,22 Peptide nucleic acids exhibit
92 Chapter 4
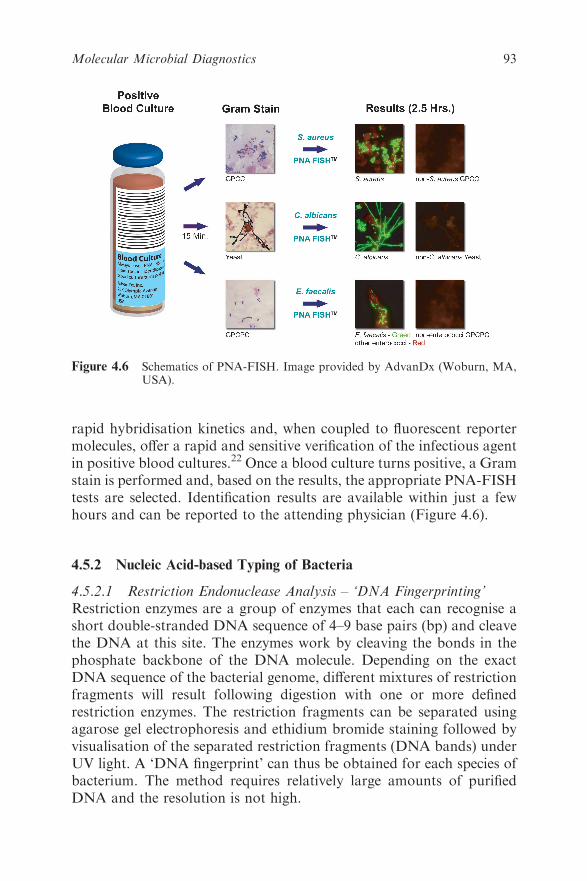
rapid hybridisation kinetics and, when coupled to fluorescent reporter
molecules, offer a rapid and sensitive verification of the infectious agent
in positive blood cultures.22 Once a blood culture turns positive, a Gram
stain is performed and, based on the results, the appropriate PNA-FISH
tests are selected. Identification results are available within just a few
hours and can be reported to the attending physician (Figure 4.6).
4.5.2 Nucleic Acid-based Typing of Bacteria
4.5.2.1 Restriction Endonuclease Analysis – ‘DNA Fingerprinting’
Restriction enzymes are a group of enzymes that each can recognise a
short double-stranded DNA sequence of 4–9 base pairs (bp) and cleave
the DNA at this site. The enzymes work by cleaving the bonds in the
phosphate backbone of the DNA molecule. Depending on the exact
DNA sequence of the bacterial genome, different mixtures of restriction
fragments will result following digestion with one or more defined
restriction enzymes. The restriction fragments can be separated using
agarose gel electrophoresis and ethidium bromide staining followed by
visualisation of the separated restriction fragments (DNA bands) under
UV light. A ‘DNA fingerprint’ can thus be obtained for each species of
bacterium. The method requires relatively large amounts of purified
DNA and the resolution is not high.
Figure 4.6 Schematics of PNA-FISH. Image provided by AdvanDx (Woburn, MA,USA).
93Molecular Microbial Diagnostics

4.5.2.2 Pulse Field Gel Electrophoresis (PFGE)
PFGE uses rare-cutting restriction enzymes to fragment the entire bac-
terial genome into large DNA fragments, which are subsequently
embedded in agarose plugs and placed in wells of the electrophoresis gel
where they become part of the gel. The large DNA fragments are sepa-
rated in the agarose gel by alternate pulses of perpendicularly oriented
electric fields. Following electrophoresis and ethidium bromide staining
of the gel, characteristic DNA fragment patterns can be visualised under
UV light (Figure 4.7). The principle of PFGE is that large DNA frag-
ments require more time to reverse direction in an electric field than do
small DNA fragments and thus are more retarded in the agarose gel. By
alternating the direction of the electric current during gel electrophoresis,
it is possible to resolve DNA fragments of 100–1000 kilobases. PFGE has
been used extensively for typing of bacterial species and is often con-
sidered to be the ‘gold standard’ of genomic typing methods. DNA
degradation may represent a problem.
4.5.2.3 Random Amplified Polymorphic DNA (RAPD)
In RAPD analysis, the target sequences to be amplified are unknown.
Typically, a 10-nucleotide primer of arbitrary sequence is designed, e.g. by
a computer program, and used for an initial PCR amplification. PCR
fragments will result only from regions of the DNAwhere forward (sense)
and reverse (antisense) primers are complementary to the target DNA
within a reasonable distance (up to 2000 nucleotides apart). This will
- -
+ +
Ethidium bromide
UV illumination
Kb
1.5
1.0
0.1
1 2 3 4 mw1 2 3 4 mw
Figure 4.7 Schematics of pulse field electrophoresis. Restriction enzyme-digestedDNA is loaded into wells and separated in the agarose gel by electric fieldsthat alternate between the poles every 90 s for 24 h. UV illuminationvisualises DNA with intercalating ethidium bromide. Different sampleshave been loaded in wells 1–4 and a size marker in the rightmost lane.
94 Chapter 4
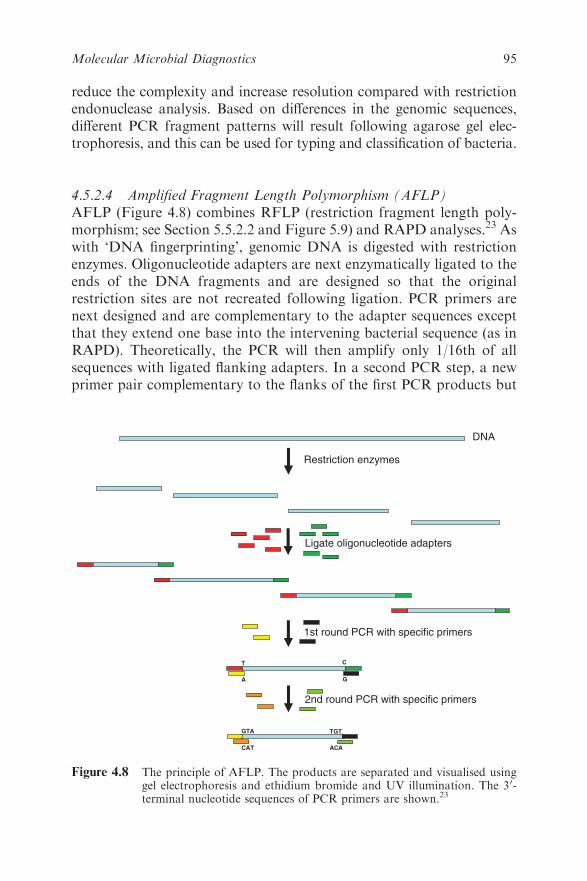
reduce the complexity and increase resolution compared with restriction
endonuclease analysis. Based on differences in the genomic sequences,
different PCR fragment patterns will result following agarose gel elec-
trophoresis, and this can be used for typing and classification of bacteria.
4.5.2.4 Amplified Fragment Length Polymorphism (AFLP)
AFLP (Figure 4.8) combines RFLP (restriction fragment length poly-
morphism; see Section 5.5.2.2 and Figure 5.9) and RAPD analyses.23 As
with ‘DNA fingerprinting’, genomic DNA is digested with restriction
enzymes. Oligonucleotide adapters are next enzymatically ligated to the
ends of the DNA fragments and are designed so that the original
restriction sites are not recreated following ligation. PCR primers are
next designed and are complementary to the adapter sequences except
that they extend one base into the intervening bacterial sequence (as in
RAPD). Theoretically, the PCR will then amplify only 1/16th of all
sequences with ligated flanking adapters. In a second PCR step, a new
primer pair complementary to the flanks of the first PCR products but
Restriction enzymes
Ligate oligonucleotide adapters
1st round PCR with specific primers
T
A G
C
2nd round PCR with specific primers
DNA
GTA
CAT
TGT
ACA
Figure 4.8 The principle of AFLP. The products are separated and visualised usinggel electrophoresis and ethidium bromide and UV illumination. The 30-terminal nucleotide sequences of PCR primers are shown.23
95Molecular Microbial Diagnostics
now extending 3 bp into the bacterial sequences is used to amplify a
small amount of the first PCR reaction, thus theoretically reducing the
sequence complexity by altogether 256-fold. The resulting fragments are
then separated electrophoretically and can be visualised, e.g. when one
of the primers of the second PCR round is fluorescently labelled.
4.5.2.5 Data Analysis of 16S Ribosomal RNA Gene Sequences –
‘Ribotyping’
The 16S ribosomal RNA (rRNA) gene is present in all bacteria, often
existing as a multigene family, and contains both conserved and variable
regions within its about 1500bp length. The 16S rRNA gene is for these
and other reasons the most commonly used single gene for typing of bacte-
ria.24Use of primers directed against the conserved regions may be used for
PCR amplification followed by DNA sequencing of the amplicon. The
sequences obtained may be compared with sequences in comprehensive
databases available on the Internet.24–26 Partial sequencing of the rRNA
gene is often, but not always, sufficient for the identification of well-
resolved bacterial species.27 Partial sequencing of one or more additional
genes may be necessary for the genetic classification and distinguishing of
species.28 It is an advantage that 16S rRNA genotyping can be done
directly from patient samples without prior cultivation.
4.5.2.6 Multilocus Sequence Typing (MLST)*
The MLST technique is well described.29 There are three elements to the
design of a new MLST system: the choice of the isolates to be used in the
initial evaluation, the choice of the genetic loci to be characterised and the
design of primers for gene amplification and nucleotide sequence determi-
nation. It is advisable to assemble a diverse isolate collection on the basis of
existing typing information or epidemiological data. This should comprise
around 100 isolates (95 is a good number if high-throughput sequen-
cing in 96-well microtitre plates is to be done) to ensure that the primers
developed will be applicable to as many isolates as possible and to establish
the levels of diversity present at each of the loci to be examined. Further-
more, the collection will ideally be representative of the bacterial popula-
tion, rather than comprising a subset, such as human disease isolates.
Housekeeping genes, flanked by genes of similar function, are good targets
for MLST and the availability of complete genome sequences has greatly
facilitated the identification of candidate loci. Experience with several
bacterial species has indicated that PCR fragments of housekeeping genes
*Reprinted from reference 29 with permission from Elsevier.
96 Chapter 4
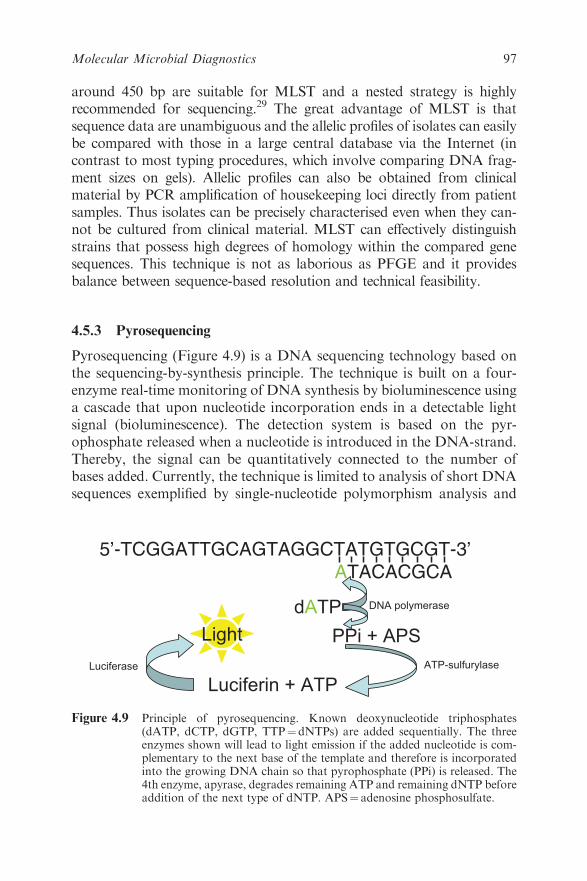
around 450 bp are suitable for MLST and a nested strategy is highly
recommended for sequencing.29 The great advantage of MLST is that
sequence data are unambiguous and the allelic profiles of isolates can easily
be compared with those in a large central database via the Internet (in
contrast to most typing procedures, which involve comparing DNA frag-
ment sizes on gels). Allelic profiles can also be obtained from clinical
material by PCR amplification of housekeeping loci directly from patient
samples. Thus isolates can be precisely characterised even when they can-
not be cultured from clinical material. MLST can effectively distinguish
strains that possess high degrees of homology within the compared gene
sequences. This technique is not as laborious as PFGE and it provides
balance between sequence-based resolution and technical feasibility.
4.5.3 Pyrosequencing
Pyrosequencing (Figure 4.9) is a DNA sequencing technology based on
the sequencing-by-synthesis principle. The technique is built on a four-
enzyme real-time monitoring of DNA synthesis by bioluminescence using
a cascade that upon nucleotide incorporation ends in a detectable light
signal (bioluminescence). The detection system is based on the pyr-
ophosphate released when a nucleotide is introduced in the DNA-strand.
Thereby, the signal can be quantitatively connected to the number of
bases added. Currently, the technique is limited to analysis of short DNA
sequences exemplified by single-nucleotide polymorphism analysis and
5’-TCGGATTGCAGTAGGCTATGTGCGT-3’
ATACACGCA
dATP
PPi + APS
ATP-sulfurylase
Luciferin + ATP
Light
Luciferase
DNA polymerase
Figure 4.9 Principle of pyrosequencing. Known deoxynucleotide triphosphates(dATP, dCTP, dGTP, TTP¼ dNTPs) are added sequentially. The threeenzymes shown will lead to light emission if the added nucleotide is com-plementary to the next base of the template and therefore is incorporatedinto the growing DNA chain so that pyrophosphate (PPi) is released. The4th enzyme, apyrase, degrades remaining ATP and remaining dNTP beforeaddition of the next type of dNTP. APS¼ adenosine phosphosulfate.
97Molecular Microbial Diagnostics

genotyping.30 The technology is promising for the identification of anti-
microbial resistance and bacterial strain identification.22
4.5.4 TaqMan Low-density Arrays (TLDAs)
The TaqMan low-density array (Figure 4.10) is a 384-well microfluidic
card manufactured by Applied Biosystems where up to 384 simulta-
neous real-time PCR reactions are possible without the need for liquid-
handling robots or multi-channel pipettors to load samples. Each card
Seal
Spin
Load Samples
Run
Prep & Load Time 5 -10 minutes
1 to 8 Samples
12 to 380 Targets (per
card) ~ 1ul reaction volume
1, 2, 3 or 4 Replicates
A.
B.
7900HT Fast Real-Time PCRSystem
Taqman® Gene Expression Assayspre-loaded into each well
Figure 4.10 (A) The TaqMan low-density array (TLDA). (B) About 100mL of mastermix and hexamer primed cDNA are loaded into each well and distributedinto the reaction wells by low-speed centrifugation and the card is sealedand thermocycled for about 40 cycles. Illuatration provided by courtesy ofApplied Biosystems.
98 Chapter 4
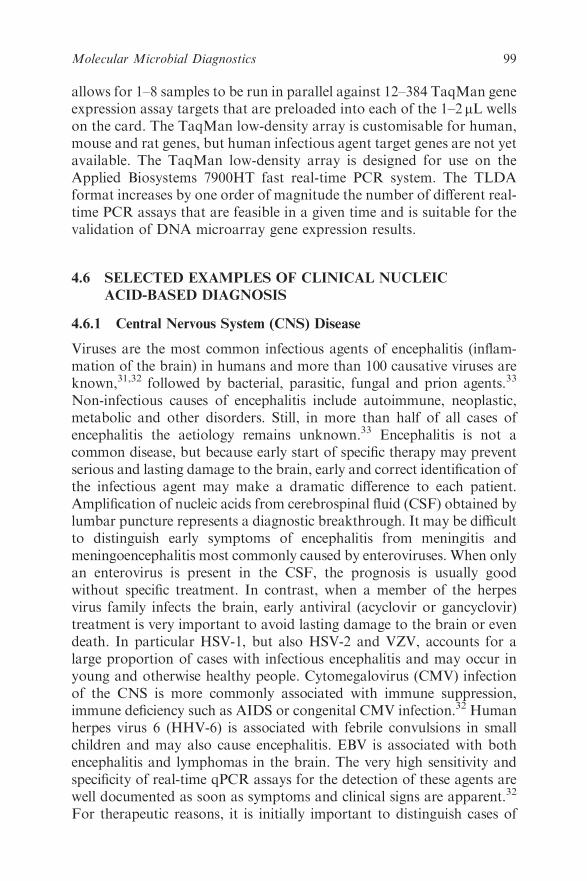
allows for 1–8 samples to be run in parallel against 12–384 TaqMan gene
expression assay targets that are preloaded into each of the 1–2mL wells
on the card. The TaqMan low-density array is customisable for human,
mouse and rat genes, but human infectious agent target genes are not yet
available. The TaqMan low-density array is designed for use on the
Applied Biosystems 7900HT fast real-time PCR system. The TLDA
format increases by one order of magnitude the number of different real-
time PCR assays that are feasible in a given time and is suitable for the
validation of DNA microarray gene expression results.
4.6 SELECTED EXAMPLES OF CLINICAL NUCLEIC
ACID-BASED DIAGNOSIS
4.6.1 Central Nervous System (CNS) Disease
Viruses are the most common infectious agents of encephalitis (inflam-
mation of the brain) in humans and more than 100 causative viruses are
known,31,32 followed by bacterial, parasitic, fungal and prion agents.33
Non-infectious causes of encephalitis include autoimmune, neoplastic,
metabolic and other disorders. Still, in more than half of all cases of
encephalitis the aetiology remains unknown.33 Encephalitis is not a
common disease, but because early start of specific therapy may prevent
serious and lasting damage to the brain, early and correct identification of
the infectious agent may make a dramatic difference to each patient.
Amplification of nucleic acids from cerebrospinal fluid (CSF) obtained by
lumbar puncture represents a diagnostic breakthrough. It may be difficult
to distinguish early symptoms of encephalitis from meningitis and
meningoencephalitis most commonly caused by enteroviruses. When only
an enterovirus is present in the CSF, the prognosis is usually good
without specific treatment. In contrast, when a member of the herpes
virus family infects the brain, early antiviral (acyclovir or gancyclovir)
treatment is very important to avoid lasting damage to the brain or even
death. In particular HSV-1, but also HSV-2 and VZV, accounts for a
large proportion of cases with infectious encephalitis and may occur in
young and otherwise healthy people. Cytomegalovirus (CMV) infection
of the CNS is more commonly associated with immune suppression,
immune deficiency such as AIDS or congenital CMV infection.32 Human
herpes virus 6 (HHV-6) is associated with febrile convulsions in small
children and may also cause encephalitis. EBV is associated with both
encephalitis and lymphomas in the brain. The very high sensitivity and
specificity of real-time qPCR assays for the detection of these agents are
well documented as soon as symptoms and clinical signs are apparent.32
For therapeutic reasons, it is initially important to distinguish cases of
99Molecular Microbial Diagnostics
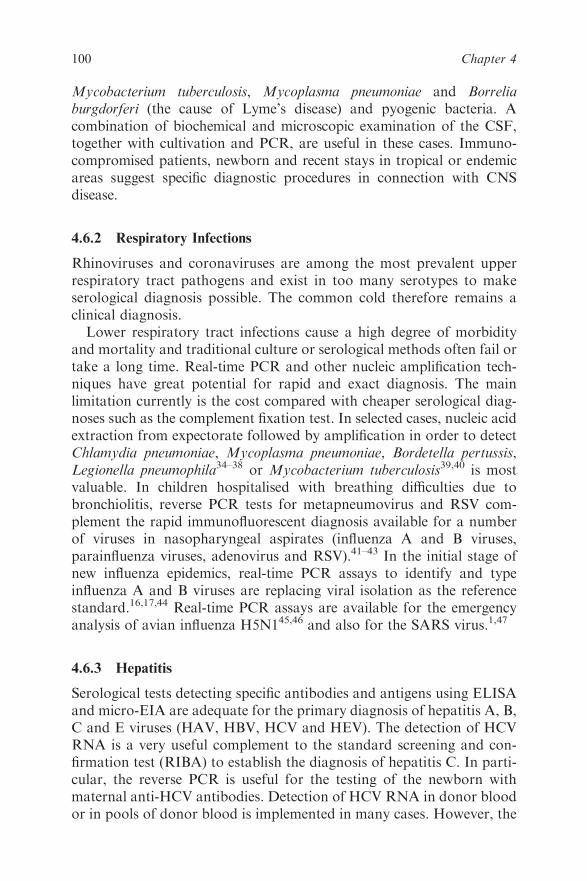
Mycobacterium tuberculosis, Mycoplasma pneumoniae and Borrelia
burgdorferi (the cause of Lyme’s disease) and pyogenic bacteria. A
combination of biochemical and microscopic examination of the CSF,
together with cultivation and PCR, are useful in these cases. Immuno-
compromised patients, newborn and recent stays in tropical or endemic
areas suggest specific diagnostic procedures in connection with CNS
disease.
4.6.2 Respiratory Infections
Rhinoviruses and coronaviruses are among the most prevalent upper
respiratory tract pathogens and exist in too many serotypes to make
serological diagnosis possible. The common cold therefore remains a
clinical diagnosis.
Lower respiratory tract infections cause a high degree of morbidity
and mortality and traditional culture or serological methods often fail or
take a long time. Real-time PCR and other nucleic amplification tech-
niques have great potential for rapid and exact diagnosis. The main
limitation currently is the cost compared with cheaper serological diag-
noses such as the complement fixation test. In selected cases, nucleic acid
extraction from expectorate followed by amplification in order to detect
Chlamydia pneumoniae, Mycoplasma pneumoniae, Bordetella pertussis,
Legionella pneumophila34–38 or Mycobacterium tuberculosis39,40 is most
valuable. In children hospitalised with breathing difficulties due to
bronchiolitis, reverse PCR tests for metapneumovirus and RSV com-
plement the rapid immunofluorescent diagnosis available for a number
of viruses in nasopharyngeal aspirates (influenza A and B viruses,
parainfluenza viruses, adenovirus and RSV).41–43 In the initial stage of
new influenza epidemics, real-time PCR assays to identify and type
influenza A and B viruses are replacing viral isolation as the reference
standard.16,17,44 Real-time PCR assays are available for the emergency
analysis of avian influenza H5N145,46 and also for the SARS virus.1,47
4.6.3 Hepatitis
Serological tests detecting specific antibodies and antigens using ELISA
and micro-EIA are adequate for the primary diagnosis of hepatitis A, B,
C and E viruses (HAV, HBV, HCV and HEV). The detection of HCV
RNA is a very useful complement to the standard screening and con-
firmation test (RIBA) to establish the diagnosis of hepatitis C. In parti-
cular, the reverse PCR is useful for the testing of the newborn with
maternal anti-HCV antibodies. Detection of HCV RNA in donor blood
or in pools of donor blood is implemented in many cases. However, the
100 Chapter 4
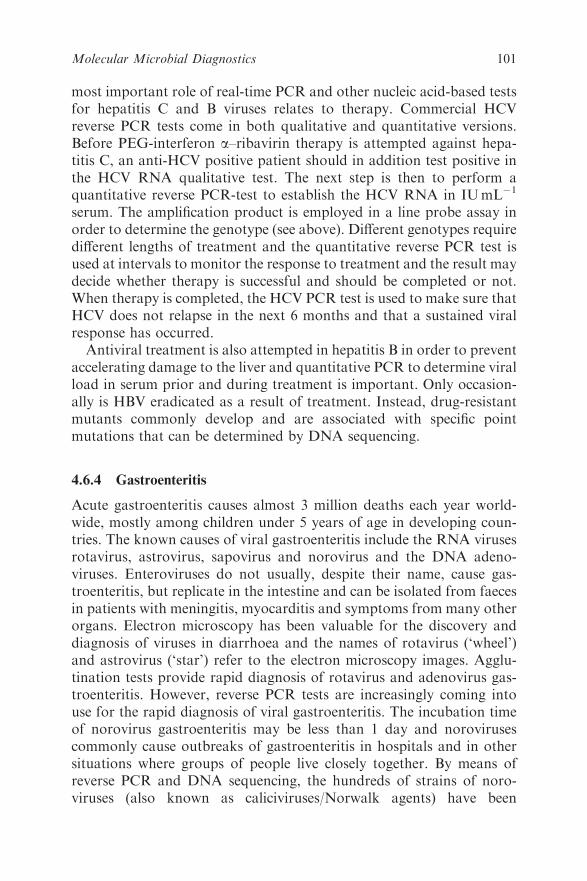
most important role of real-time PCR and other nucleic acid-based tests
for hepatitis C and B viruses relates to therapy. Commercial HCV
reverse PCR tests come in both qualitative and quantitative versions.
Before PEG-interferon a–ribavirin therapy is attempted against hepa-
titis C, an anti-HCV positive patient should in addition test positive in
the HCV RNA qualitative test. The next step is then to perform a
quantitative reverse PCR-test to establish the HCV RNA in IUmL�1
serum. The amplification product is employed in a line probe assay in
order to determine the genotype (see above). Different genotypes require
different lengths of treatment and the quantitative reverse PCR test is
used at intervals to monitor the response to treatment and the result may
decide whether therapy is successful and should be completed or not.
When therapy is completed, the HCV PCR test is used to make sure that
HCV does not relapse in the next 6 months and that a sustained viral
response has occurred.
Antiviral treatment is also attempted in hepatitis B in order to prevent
accelerating damage to the liver and quantitative PCR to determine viral
load in serum prior and during treatment is important. Only occasion-
ally is HBV eradicated as a result of treatment. Instead, drug-resistant
mutants commonly develop and are associated with specific point
mutations that can be determined by DNA sequencing.
4.6.4 Gastroenteritis
Acute gastroenteritis causes almost 3 million deaths each year world-
wide, mostly among children under 5 years of age in developing coun-
tries. The known causes of viral gastroenteritis include the RNA viruses
rotavirus, astrovirus, sapovirus and norovirus and the DNA adeno-
viruses. Enteroviruses do not usually, despite their name, cause gas-
troenteritis, but replicate in the intestine and can be isolated from faeces
in patients with meningitis, myocarditis and symptoms from many other
organs. Electron microscopy has been valuable for the discovery and
diagnosis of viruses in diarrhoea and the names of rotavirus (‘wheel’)
and astrovirus (‘star’) refer to the electron microscopy images. Agglu-
tination tests provide rapid diagnosis of rotavirus and adenovirus gas-
troenteritis. However, reverse PCR tests are increasingly coming into
use for the rapid diagnosis of viral gastroenteritis. The incubation time
of norovirus gastroenteritis may be less than 1 day and noroviruses
commonly cause outbreaks of gastroenteritis in hospitals and in other
situations where groups of people live closely together. By means of
reverse PCR and DNA sequencing, the hundreds of strains of noro-
viruses (also known as caliciviruses/Norwalk agents) have been
101Molecular Microbial Diagnostics
identified and classified into genogroups and genetic clusters.48 Reverse
PCR tests using nucleic acids extracted from diarrhoeal faecal specimens
have come into broad use to diagnose norovirus infection.49,50 The
genetic variability of viruses causing gastroenteritis represents a great
challenge to molecular diagnosis and new protocols take advantage of
new chemistry and computer analysis to design multiplex PCR protocols
directed at different strains of each virus and to cover several different
viruses in one reaction.49–52
4.6.5 Sexually Transmitted Diseases
4.6.5.1 Human Papillomaviruses (HPVs)
These are among the most commonly sexually transmitted infectious
agents. Molecular cloning and DNA sequencing have been crucial for the
identification and classification of the more than 130 HPV types pre-
sently discovered. The high-risk types, including the prevalent types 16
and 18, are the cause of cervical cancer. The low-risk types cause benign
papillomas and warts and include HPV type 6 and 11 that cause genital
warts or condylomas. The cloning and recombinant expression of HPV
L1 proteins in yeast and insect cells have provided successful vaccines
against HPV 16 and 18 and one vaccine additionally protects against
HPV 6 and 11. The cytological Pap smear remains the most important
screening test for pre-stages of cervical cancer and relies on microscopic
evaluation of abnormalities in cells taken from the surface of the cervix.
Atypical cervix cells are most often caused by HPVs and detection and
typing of HPV nucleic acids are becoming increasingly used. In parti-
cular, microscopic detection of cytological changes is followed up by
HPV nucleic acid isolation and typing.53 Several commercial nucleic
acid-based tests are on the market for this purpose. Comparison between
these tests is methodologically interesting since they comprise one
sandwich hybridisation assay (the Digene Hybrid Capture 2 assay), a
PCR-based assay (the Roche Amplicor HPV test) and a line probe assay
(the Innogenetics Inno-LiPa HPV genotyping test v2 and the Roche
Linear Array HPV genotyping test).54–56 The additional value of focus-
ing the diagnosis on the HPV oncogenes E6 and E7, and in particular of
monitoring their transcriptional activity, is under evaluation.57,58
4.6.5.2 Chlamydia Trachomatis and Genital Mycoplasmas
and Ureaplasmas
While the diagnosis of several of the classical sexually transmitted bac-
terial diseases still rely on clinical experience, serology (syphilis) and
cultivation (Neissera gonorrhoea), nucleic acid detection methods have
102 Chapter 4
revolutionised the diagnosis of genital Chlamydia trachomatis, one of the
most ubiquitously sexually transmitted agents and associated with deep
pelvic inflammation and female sterility. Efficient antibiotic treatment is
available if the diagnosis is made early. Different commercial kits are used
for sampling from the urethra or the cervix followed by different princi-
ples of nucleic acid amplification.59 Self-sampling using blind vaginal
swabs or urine samples may provide good alternatives to increase patient
compliance.60 Abbot’s ligase chain reaction (LCR) was discontinued.
Instead, Abbott has marketed a highly sensitive new test for the simul-
taneous detection of Chlamydia trachomatis and Neissera gonorrhoeae
designed for use on the Abbott m2000, an automated instrument using
magnetic particle and real-time PCR. The Probetec test (Beckton Dick-
inson) uses strand displacement amplification (SDA) and the Aptima
Combo 2 test (Gen-Probe) utilises isothermal transcription mediated
amplification (TMA) combined with magnetic target capture. The Cobas
Amplicor PCR test (Roche) is now superseded by the Roche Cobas
TaqMan48 real-time PCR test. These tests are streamlined with both
positive and negative controls. The availability of several different tests
provides advantages, e.g. in legal cases of sexual abuse or rape, when
confirmation of a positive test result with a second independent test is
highly recommended or necessary. A Chlamydia trachomatis variant that
contains a 377bp deletion in the cryptic plasmid was recently reported in
Sweden. This deletion includes the targets of Cobas Amplicor, Cobas
TaqMan48 and Abbott m2000 assays, but the mutant was readily
detected by the new real-time quantitative PCR assay LightMix 480HT
(TIB MOLBIOL) that targets a 136bp fragment of the omp1 gene (using
automatic DNA isolation with magnetic silica particles in the Roche
MagNa Pure LC system combined with the LightCycler thermocycler).61
There is now an increasing awareness that in addition to Chlamydia
trachomatis, several other organisms may be involved in postgonococcal
urethritis, including Mycoplasma genitalium, Mycoplasma hominis,
Ureaplasma urealyticum and Ureaplasma parvum, and that these
organisms, if left untreated, may contribute to infertility. In-house PCR
assays are now offered by many diagnostic laboratories for the specific
diagnosis of these agents in urine or semen.62,63
4.6.6 HIV Infection and AIDS
The screening (ELISA) and confirmation (Western blot) tests for HIV-1
and HIV-2 infections provide highly reliably laboratory diagnosis of this
serious infection. Nucleic acid-based amplification tests are therefore not
currently important to establish the diagnosis. The drug treatment of
103Molecular Microbial Diagnostics
HIV-1 infection and AIDS has experienced remarkable progress during
the last 10–15 years, in contrast with the frustrations encountered in HIV
vaccine development. However, the virus still cannot be eradicated from
the body and lifelong combination therapy using three different drugs is
necessary to suppress disease progression. So far, 24 drugs, belonging to
seven classes, have been approved for the treatment of HIV infection and
inhibit defined molecular stages of the HIV life cycle, including the
reverse transcriptase, the protease, the integrase and coreceptors (CCR5/
CXCR4).64 CD41 cell counts and HIV viral load in plasma must be
determined prior to the start of and monitored during therapy. When
therapy is effective, HIV RNA should disappear from the peripheral
blood. The Roche AMPLICOR version 1.5 conventional PCR assay has
been widely employed for monitoring, but the Cobas Ampliprep/Cobas
TaqMan system for automated nucleic acid extraction and reverse real-
time PCR detection of HIV is a newer alternative.65,66 If the HIV RNA
viral load increases during therapy, it is a sign either that the patient does
not take the medication properly or that resistant HIV strains have been
selected. Drug resistance is associated with characteristic point mutations
for each drug. DNA sequencing combined with algorithmic analysis of
databases can identify which point mutations are associated with what
drug resistance and be helpful in the choice of a different combination of
drugs that may continue to suppress the HIV infection.
4.6.7 Bacterial Antibiotic Resistance and Virulence Factor Genes
Detection of bacterial genes that confer antibiotic resistance is impor-
tant for the choice of correct treatment, to help decide which patients
need to be isolated and to trace epidemics. At the same time, it may be
necessary to identify virulence (disease-causing) genes. In the following,
some key examples have been selected.
4.6.7.1 Methicillin-resistant Staphylococcus aureus
Staphylococcus aureus has long been a notorious problem among hospi-
talised patients. Whenever bacteraemia (bacteria in the blood) is suspected,
the typical procedure is to identify the type of bacteria using automated
blood culture systems followed by microscopy of positive blood cultures.
When the microscopy shows Gram-positive cocci in clusters it is a main
goal to differentiate between S. aureus and coagulase-negative staphylo-
cocci and to verify methicillin-resistant S. aureus (MRSA). MRSA strains
are resistant against penicillin and all b-lactam antibiotics. A number of
different nucleic acid-based techniques have been used to identify themecA
gene (the methicillin resistance gene) from putative MRSA colonies and at
104 Chapter 4
the same time identify S. aureus based upon specific genes such as the nuc
or orfX genes.22,67,68 Since this verification may take more than 2 days, it is
common to start treatment of patients using glycopeptide antibiotics until
the results of the mecA test are available, and this represents a selection
pressure for the increasing vancomycin resistance. Glycopeptide-resistant
MRSA strains is an emerging problem.69 One important prophylactic
measure is to screen and identify asymptomatic carriers of the mecA gene
among hospital workers and patients. Colonies grown from nasal swab
samples are then analysed for mecA and S. aureus specific genes using
PCR, real-time PCR or several other nucleic acid-based techniques.22,67,68
More recently, serious MRSA infections have appeared outside hospitals;
these so-called community-associated MRSA strains harbour a set of
phage-carried PVL genes, in contrast to the hospital MRSA strains. It is
unclear why certain MRSA strains predominate in hospitals and others in
the community, but nucleic acid-based detection of PVL genes represents a
very important tool for epidemiology and surveillance.70–72 It has also
been shown that different MRSA strains differ in their virulence–gene
profiles and that this contributes to the complexity of defining the disease-
causing abilities of S. aureus.70
4.6.7.2 Vancomycin-resistant Enterococci
Enterococci infections represent a serious problem in hospitals. In the
same way as MRSA genes are identified in positive blood cultures,
colonies of enterococci may be tested for vanA, vanB and vanC genes
that confer resistance to glycopeptide antibiotics (vancomycin and teico-
planin) using different nucleic acid-based techniques.22,73,74 The identi-
fication of enterococcal virulence genes in combination with vancomycin
resistance may become increasingly important.75,76 Control screening
for vancomycin-resistant enterococci is based on perianal swabs from
which automated DNA extraction is followed by real-time PCR. This is,
however, more challenging than nasal swab screening for MRSA.22,77
The identification of the vanB gene in naturally occurring gut anaerobes
may be a source of confusion and calls for simultaneous detection
of vanB and enterococcal specific genes, similar to linking mecA to
S. aureus specific genes in order to avoid false positives.22,78,79
4.6.7.3 Antibiotic Resistance and Virulence in Gram-negative
Intestinal Bacteria
Extended-spectrum b-lactamase (ESBL)-producing Gram-negative
bacteria (such as Escherichia coli) are resistant against both penicillins
and cephalosporins.80 The responsible bacterial b-lactamases, including
105Molecular Microbial Diagnostics
TEM, SHV and CTX-M enzymes, can be typed by molecular techniques
in order to track epidemics and monitor outbreaks. PFGE is the current
‘gold standard’ for molecular typing, but multilocus sequence typing
(MLST) may offer advantages.81 Real-time PCR combined with pyr-
osequencing may increase speed and capacity for the identification of the
antibiotic resistance genes.82,83 Klebsiella pneumoniae and other bacteria
containing carbapenemases (KPC) is a further extension of the anti-
biotic resistance problem.80,84
Although E. coli is prevalent in the normal intestinal flora, some
strains are highly pathogenic and cause diarrhoea or systemic disease
due to acquisition of virulence genes encoded by plasmid, chromosome
or bacteriophage DNA. A large number of virulence factor genes
separate pathogenic E. coli strains into enterotoxigenic (ETEC), enter-
oinvasive (EIEC), enteropathogenic (EPEC), enterohaemorrhagic
(EHEC) and enteroaggregative (EAEC).85 The development of multi-
plex PCR and real-time PCR assays has been most useful for the survey
of such virulence factors.86–88
4.6.7.4 Mycobacterium tuberculosis and Atypical Mycobacteria
Nucleic acid amplification techniques supplement direct microscopy and
cultivation in the laboratory diagnosis of M. tuberculosis, in particular
since growth in special media may take weeks. A number of genetic
markers and DNA typing methods have been increasingly used to
control and monitor tuberculosis.89 Resistant and multiresistant
mycobacteria represent an increasing problem. Whereas traditional
susceptibility tests may take weeks to complete, DNA amplification
methods can detect characteristic mutations associated with isoniazid
resistance or rifampicin resistance within hours.2 Many alternative
methods have been employed for the detection of mycobacterial anti-
biotic resistance, such as DNA sequencing,90 heteroduplex analysis,91
PCR conformational polymorphism.92 line probe assays93 and mis-
match analysis,94 but these methods have several disadvantages. Pyr-
osequencing shows promise in the rapid identification of rifampicin,
isoniazid and ethambutol resistance.22,95,96
4.7 CONCLUSION AND FUTURE CHALLENGES
Nucleic acid-based methods have revolutionised the routine laboratory
diagnosis of infectious agents. In particular, the DNA amplification
techniques have contributed to this by providing sufficient sensitivity for
the direct examination of infected patient samples. As a result, the
106 Chapter 4
clinician faced with the patient can rely much more on the microbiology
laboratory in the acute differential diagnosis. Nucleic acid-based tech-
niques have contributed to much quicker and reliable diagnosis of the
individual patient, to the tracing and monitoring of epidemic outbreaks
and the discovery of emerging infectious agents. There are still many
problems, such as contamination during nucleic acid amplification and
the ongoing biological selection and evolution in the microbiological
world that without warning may cause a previously good test to fail. The
potential for improvement of nucleic acid-based laboratory diagnostics is
therefore vast. There is a need for backup tests directed to different
regions of the target nucleic acids. At present we are seeing only the
beginning of the automation and reduction of reaction volumes. PCR
reactions traditionally were performed in 5–50mL volumes, but now can
already be performed in nanolitre volumes. Nanotechnology and
microfluidics and electronics may become vital to saving the environment
and saving money. Costs already now severely restrict the repertoire of
new tests in the clinical microbiological laboratory – even in developed
countries. The relative role of DNA microarray hybridisation assays and
PCR amplification arrays lies in the future and we face great challenges
regarding logistics and quality control of diagnostic procedures. It is
therefore certain that nucleic acid-based techniques will continue to
revolutionise the way in which we diagnose and treat infections.
REFERENCES
1. C. Drosten, W. Preiser, S. Gunther, H. Schmitz and H. W. Doerr,
Trends Mol. Med., 2003, 9, 325.
2. M. J. Espy, J. R. Uhl, L. M. Sloan, S. P. Buckwalter, M. F. Jones,
E. A. Vetter, J. D. Yao, N. L. Wengenack, J. E. Rosenblatt, F. R.
Cockerill III and T. F. Smith, Clin. Microbiol. Rev., 2006, 19, 165.
3. K. Rantakokko-Jalava and J. Jalava, J. Clin.Microbiol., 2002, 40, 4211.
4. T. Schuurman, R. F. De Boer, A. M. Kooistra-Smid and A. A. Van
Zwet, J. Clin. Microbiol., 2004, 42, 734.
5. K. B. Barken, J. A. Haagensen and T. Tolker-Nielsen, Clin. Chim.
Acta, 2007, 384, 1.
6. T. Schuurman, A. Van Breda, R. De Boer,M. Kooistra-Smid,M. Beld,
P. Savelkoul and R. Boom, J. Clin. Microbiol., 2005, 43, 4616.
7. B. Kaltenboeck and C. Wang, Adv. Clin. Chem., 2005, 40, 219.
8. M. A. Espy, H. Sandin, C. Carr, C. J. Hanson, M. D. Ward and
R. H. Kraus Jr, Cytometry A, 2006, 69, 1132.
9. J. Ikewaki, E. Ohtsuka, R. Kawano, M. Ogata, H. Kikuchi and
M. Nasu, J. Clin. Microbiol., 2003, 41, 4382.
107Molecular Microbial Diagnostics
10. J. L. Vaerman, P. Saussoy and I. Ingargiola, J. Biol. Regul.
Homeost. Agents, 2004, 18, 212.
11. R. G. Rutledge and C. Cote, Nucleic Acids Res., 2003, 31, e93.
12. J. C. Servoss and L. S. Friedman, Clin. Liver Dis., 2004, 8, 267.
13. J. Saldanha, N. Lelie and A. Heath, Vox Sang., 1999, 76, 149.
14. J. Saldanha, N. Lelie,M.W. Yu andA. Heath,Vox Sang., 2002, 82, 24.
15. J. Burrows, A. Nitsche, B. Bayly, E. Walker, G. Higgins and
T. Kok, BMC Microbiol., 2002, 2, 12.
16. R. M. Ratcliff, G. Chang, T. Kok and T. P. Sloots, Curr. Issues Mol.
Biol., 2007, 9, 87.
17. B. Stone, J. Burrows, S. Schepetiuk, G. Higgins, A. Hampson,
R. Shaw and T. Kok, J Virol. Methods, 2004, 117, 103.
18. K. H. Kalland, L. S. Havarstein and H. Sommerfelt, Tidsskr. Nor.
Laegeforen., 1987, 107, 2510.
19. K. H. Kalland and G. Haukenes, Tidsskr. Nor. Laegeforen., 1999,
119, 802.
20. K. H. Kalland, H. Myrmel and S. A. Nordbo, Tidsskr. Nor.
Laegeforen., 2005, 125, 3110.
21. M. Sogaard, H. Stender and H. C. Schonheyder, J. Clin. Microbiol.,
2005, 43, 1947.
22. F. C. Tenover, Clin. Infect. Dis., 2007, 44, 418.
23. S. Bensch and M. Akesson, Mol. Ecol., 2005, 14, 2899.
24. J. M. Janda and S. L. Abbott, J. Clin. Microbiol., 2007, 45, 2761.
25. K. E. Simmon, A. C. Croft and C. A. Petti, J. Clin. Microbiol., 2006,
44, 4400.
26. D. J. Speers, Clin. Biochem. Rev., 2006, 27, 39.
27. G. E. Fox, J. D. Wisotzkey and P. Jurtshuk Jr, Int. J. Syst. Bac-
teriol., 1992, 42, 166.
28. B. Ghebremedhin, F. Layer, W. Konig and B. Konig, J. Clin.
Microbiol., 2008.
29. R. Urwin and M. C. Maiden, Trends Microbiol., 2003, 11, 479.
30. A. Ahmadian, M. Ehn and S. Hober, Clin. Chim. Acta, 2006, 363, 83.
31. R. J. Whitley and J. W. Gnann, Lancet, 2002, 359, 507.
32. R. L. Debiasi and K. L. Tyler, Clin. Microbiol. Rev., 2004, 17, 903.
33. C. A. Glaser, S. Honarmand, L. J. Anderson, D. P. Schnurr,
B. Forghani, C. K. Cossen, F. L. Schuster, L. J. Christie and J. H.
Tureen, Clin. Infect. Dis., 2006, 43, 1565.
34. S. Kumar and M. R. Hammerschlag, Clin. Infect. Dis., 2007,
44, 568.
35. M. Khanna, J. Fan, K. Pehler-Harrington, C. Waters, P. Douglass,
J. Stallock, S. Kehl and K. J. Henrickson, J. Clin. Microbiol., 2005,
43, 565.
108 Chapter 4
36. D. R. Murdoch, Clin. Infect. Dis., 2005, 41, 1445.
37. Y. R. Chan and A. Morris, Curr. Opin. Infect. Dis., 2007, 20, 157.
38. K. A. Beynon, S. A. Young, R. T. Laing, T. G. Harrison,
T. P. Anderson and D. R. Murdoch, Emerg. Infect. Dis., 2005,
11, 639.
39. J. C. Palomino, Curr. Opin. Pulm. Med., 2006, 12, 172.
40. D. Andresen, Paediatr. Respir. Rev., 2007, 8, 221.
41. I. Lee and T. D. Barton, Drugs, 2007, 67, 1411.
42. L. C. Jennings, T. P. Anderson, A. M. Werno, K. A. Beynon and
D. R. Murdoch, Pediatr. Infect. Dis. J., 2004, 23, 1003.
43. C. Deffrasnes, M. E. Hamelin and G. Boivin, Semin. Respir. Crit.
Care Med., 2007, 28, 213.
44. M. Petric, L. Comanor and C. A. Petti, J. Infect. Dis., 2006,
194(Suppl 2), S98.
45. M. D. Curran, J. S. Ellis, T. G. Wreghitt and M. C. Zambon,
J. Med. Microbiol., 2007, 56, 1263.
46. D. L. Suarez, A. Das and E. Ellis, Avian Dis., 2007, 51, 201.
47. J. K. Louie, J. K. Hacker, J. Mark, S. S. Gavali, S. Yagi,
A. Espinosa, D. P. Schnurr, C. K. Cossen, E. R. Isaacson, C. A.
Glaser, M. Fischer, A. L. Reingold and D. J. Vugia, Emerg. Infect.
Dis., 2004, 10, 1143.
48. R. Goodgame, Curr. Infect. Dis. Rep., 2007, 9, 102.
49. M. Hoehne and E. Schreier, BMC Infect. Dis., 2006, 6, 69.
50. W. Hymas, A. Atkinson, J. Stevenson and D. Hillyard, J. Virol.
Methods, 2007, 142, 10.
51. H. Yan, T. A. Nguyen, T. G. Phan, S. Okitsu, Y. Li and H. Ushijima,
Kansenshogaku Zasshi, 2004, 78, 699.
52. E. Royuela, A. Negredo and A. Sanchez-Fauquier, J. Virol.
Methods, 2006, 133, 14.
53. B. J. Morris and B. R. Rose, Clin. Chem. Lab. Med., 2007, 45, 577.
54. M. P. Stevens, S. M. Garland, E. Rudland, J. Tan, M. A. Quinn and
S. N. Tabrizi, J. Clin. Microbiol., 2007, 45, 2130.
55. L. Z. Mo, S. Monnier-Benoit, B. Kantelip, A. Petitjean, D. Rieth-
muller, J. L. Pretet and C. Mougin, J. Clin. Virol., 2008, 41, 104.
56. M. A. De Francesco, F. Gargiulo, C. Schreiber, G. Ciravolo,
F. Salinaro and N. Manca, J. Virol. Methods, 2008, 147, 10.
57. T. Molden, I. Kraus, H. Skomedal, T. Nordstrom and F. Karlsen,
J. Virol. Methods, 2007, 142, 204.
58. A. K. Lie, B. Risberg, B. Borge, B. Sandstad, J. Delabie, R. Rimala,
M. Onsrud and S. Thoresen, Gynecol. Oncol., 2005, 97, 908.
59. S. Skidmore, P. Horner and H. Mallinson, Sex. Transm. Infect.,
2006, 82, 272.
109Molecular Microbial Diagnostics
60. I. J. Bakken and S. A. Nordbo, Tidsskr. Nor. Laegeforen., 2007, 127,
3202.
61. M. Unemo, P. Olcen, I. Agne-Stadling, A. Feldt, M. Jurstrand,
B. Herrmann, K. Persson, P. Nilsson, T. Ripa and H. Fredlund,
Euro Surveill., 2007, 12, E5.
62. S. R. Lee, J. M. Chung and Y. G. Kim, J. Microbiol., 2007, 45, 453.
63. S. Yokoi, S. Maeda, Y. Kubota, M. Tamaki, K. Mizutani,
M. Yasuda, S. Ito, M. Nakano, H. Ehara and T. Deguchi, Clin.
Infect. Dis., 2007, 45, 866.
64. E. De Clercq, Nat. Rev. Drug Discov., 2007, 6, 1001.
65. A. R. Oliver, S. F. Pereira and D. A. Clark, J. Clin. Microbiol., 2007,
45, 3616.
66. W. Schumacher, E. Frick, M. Kauselmann, V. Maier-Hoyle, R. Van
Der Vliet and R. Babiel, J. Clin. Virol., 2007, 38, 304.
67. K. Levi and K. J. Towner, J. Clin. Microbiol., 2003, 41, 3890.
68. Y. Misawa, A. Yoshida, R. Saito, H. Yoshida, K. Okuzumi, N. Ito, M.
Okada, K. Moriya and K. Koike, J. Infect. Chemother., 2007, 13, 134.
69. P. C. Appelbaum, Int. J. Antimicrob. Agents, 2007, 30, 398.
70. B. A. Diep, H. A. Carleton, R. F. Chang, G. F. Sensabaugh and
F. Perdreau-Remington, J. Infect. Dis., 2006, 193, 1495.
71. J. A. Mcclure, J. M. Conly, V. Lau, S. Elsayed, T. Louie,
W. Hutchins and K. Zhang, J. Clin. Microbiol., 2006, 44, 1141.
72. R. R. Mcdonald, N. A. Antonishyn, T. Hansen, L. A. Snook,
E. Nagle, M. R. Mulvey, P. N. Levett and G. B. Horsman, J. Clin.
Microbiol., 2005, 43, 6147.
73. H. L. Young, S. A. Ballard, P. Roffey and M. L. Grayson,
J. Antimicrob. Chemother., 2007, 59, 809.
74. I. Klare, C. Konstabel, D. Badstubner, G. Werner and W. Witte,
Int. J. Food Microbiol., 2003, 88, 269.
75. L. J. Worth, M. A. Slavin, V. Vankerckhoven, H. Goossens, E. A.
Grabsch and K. A. Thursky, J. Hosp. Infect., 2008, 68, 137.
76. I. Klare, C. Konstabel, S. Mueller-Bertling, G. Werner, B. Strom-
menger, C. Kettlitz, S. Borgmann, B. Schulte, D. Jonas, A. Serr,
A. M. Fahr, U. Eigner and W. Witte, Eur. J. Clin. Microbiol. Infect.
Dis., 2005, 24, 815.
77. L. M. Sloan, J. R. Uhl, E. A. Vetter, C. D. Schleck, W. S. Harmsen,
J. Manahan, R. L. Thompson, J. E. Rosenblatt and F. R. Cockerill
III, J. Clin. Microbiol., 2004, 42, 2636.
78. S. A. Ballard, K. K. Pertile, M. Lim, P. D. Johnson and M. L.
Grayson, Antimicrob. Agents Chemother., 2005, 49, 1688.
79. S. A. Ballard, E. A. Grabsch, P. D. Johnson and M. L. Grayson,
Antimicrob. Agents Chemother., 2005, 49, 77.
110 Chapter 4
80. F. Perez, A. Endimiani, K. M. Hujer and R. A. Bonomo, Curr.
Opin. Pharmacol., 2007, 7, 459.
81. L. L. Nemoy, M. Kotetishvili, J. Tigno, A. Keefer-Norris,
A. D. Harris, E. N. Perencevich, J. A. Johnson, D. Torpey,
A. Sulakvelidze, J. G. Morris Jr and O. C. Stine, J. Clin. Microbiol.,
2005, 43, 1776.
82. C. I. Birkett, H. A. Ludlam, N. Woodford, D. F. Brown, N. M.
Brown, M. T. Roberts, N. Milner and M. D. Curran, J. Med.
Microbiol., 2007, 56, 52.
83. T. Naas, C. Oxacelay and P. Nordmann, Antimicrob. Agents Che-
mother., 2007, 51, 223.
84. L. M. Deshpande, R. N. Jones, T. R. Fritsche and H. S. Sader,
Microb. Drug Resist., 2006, 12, 223.
85. M. M. Levine, J. Infect. Dis., 1987, 155, 377.
86. L. T. Brandal, B. A. Lindstedt, L. Aas, T. L. Stavnes, J. Lassen and
G. Kapperud, J. Microbiol. Methods, 2007, 68, 331.
87. V. K. Sharma, Mol. Cell. Probes, 2006, 20, 298.
88. J. R. Yang, F. T. Wu, J. L. Tsai, J. J. Mu, L. F. Lin, K. L. Chen, S. H.
Kuo, C. S. Chiang and H. S. Wu, J. Clin. Microbiol., 2007, 45, 3620.
89. K. Kremer, C. Arnold, A. Cataldi, M. C. Gutierrez, W. H. Haas,
S. Panaiotov, R. A. Skuce, P. Supply, A. G. Van Der Zanden and
D. Van Soolingen, J. Clin. Microbiol., 2005, 43, 5628.
90. V. Kapur, L. L. Li, S. Iordanescu, M. R. Hamrick, A. Wanger,
B. N. Kreiswirth and J. M. Musser, J. Clin. Microbiol., 1994,
32, 1095.
91. D. L. Williams, L. Spring, T. P. Gillis, M. Salfinger and D. H.
Persing, Clin. Infect. Dis., 1998, 26, 446.
92. M. Bobadilla-Del-Valle, A. Ponce-De-Leon, C. Arenas-Huertero,
G. Vargas-Alarcon, M. Kato-Maeda, P. M. Small, P. Couary,
G. M. Ruiz-Palacios and J. Sifuentes-Osornio, Emerg. Infect. Dis.,
2001, 7, 1010.
93. R. Rossau, H. Traore, H. De Beenhouwer, W. Mijs, G. Jannes,
P. De Rijk and F. Portaels, Antimicrob. Agents Chemother., 1997,
41, 2093.
94. K. A. Nash, A. Gaytan and C. B. Inderlied, J. Infect. Dis., 1997,
176, 533.
95. J. R. Zhao, Y. J. Bai, Y. Wang, Q. H. Zhang, M. Luo and X. J. Yan,
Int. J. Tuberc. Lung Dis., 2005, 9, 328.
96. C. Arnold, L. Westland, G. Mowat, A. Underwood, J. Magee and
S. Gharbia, Clin. Microbiol. Infect., 2005, 11, 122.
111Molecular Microbial Diagnostics
CHAPTER 5
Genes and Genomes
DAVID B. WHITEHOUSE
School of Life Sciences, University of Hertfordshire, College Lane, Hatfield,
Hertfordshire AL10 9AB, UK
5.1 INTRODUCTION
Key scientific discoveries in the 20th century include the demonstration
that genes consist of DNA, the double helical structure of DNA and
the genetic code. Between them, these stimulated the development of
recombinant DNA technology or ‘molecular biology’, which is based on
the recognition that genes can be isolated, sequenced and analysed. In the
50 years between the elucidation of the DNA double helix in 1953 and
the completion of the human genome sequence, dramatic progress has
been made on several fronts for investigating genes and genomes, such as
molecular cloning, polymorphism detection, DNA sequencing, poly-
merase chain reaction and genome mapping. Some of these methodo-
logies will be addressed in this chapter.
5.1.1 Background
Genomic analysis has far-reaching consequences because it potentially
offers an unprecedented perspective into the nature of the genetic con-
tribution to species biology. Genomics and genetics pervade all areas of
basic biology, biotechnology and medicine, where in many cases there
Molecular Biology and Biotechnology, 5th Edition
Edited by John M Walker and Ralph Rapleyr Royal Society of Chemistry 2009
Published by the Royal Society of Chemistry, www.rsc.org
112
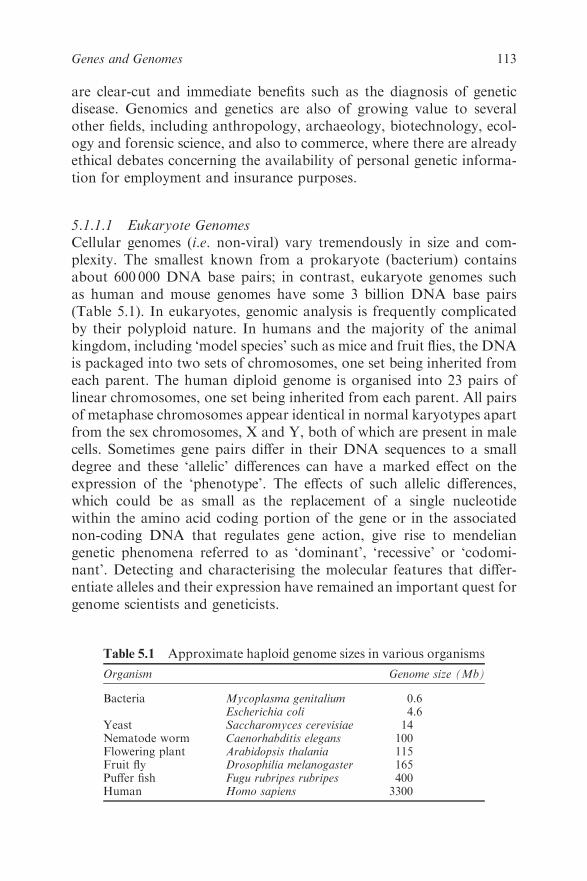
are clear-cut and immediate benefits such as the diagnosis of genetic
disease. Genomics and genetics are also of growing value to several
other fields, including anthropology, archaeology, biotechnology, ecol-
ogy and forensic science, and also to commerce, where there are already
ethical debates concerning the availability of personal genetic informa-
tion for employment and insurance purposes.
5.1.1.1 Eukaryote Genomes
Cellular genomes (i.e. non-viral) vary tremendously in size and com-
plexity. The smallest known from a prokaryote (bacterium) contains
about 600 000 DNA base pairs; in contrast, eukaryote genomes such
as human and mouse genomes have some 3 billion DNA base pairs
(Table 5.1). In eukaryotes, genomic analysis is frequently complicated
by their polyploid nature. In humans and the majority of the animal
kingdom, including ‘model species’ such as mice and fruit flies, the DNA
is packaged into two sets of chromosomes, one set being inherited from
each parent. The human diploid genome is organised into 23 pairs of
linear chromosomes, one set being inherited from each parent. All pairs
of metaphase chromosomes appear identical in normal karyotypes apart
from the sex chromosomes, X and Y, both of which are present in male
cells. Sometimes gene pairs differ in their DNA sequences to a small
degree and these ‘allelic’ differences can have a marked effect on the
expression of the ‘phenotype’. The effects of such allelic differences,
which could be as small as the replacement of a single nucleotide
within the amino acid coding portion of the gene or in the associated
non-coding DNA that regulates gene action, give rise to mendelian
genetic phenomena referred to as ‘dominant’, ‘recessive’ or ‘codomi-
nant’. Detecting and characterising the molecular features that differ-
entiate alleles and their expression have remained an important quest for
genome scientists and geneticists.
Table 5.1 Approximate haploid genome sizes in various organisms
Organism Genome size (Mb)
Bacteria Mycoplasma genitalium 0.6Escherichia coli 4.6
Yeast Saccharomyces cerevisiae 14Nematode worm Caenorhabditis elegans 100Flowering plant Arabidopsis thalania 115Fruit fly Drosophilia melanogaster 165Puffer fish Fugu rubripes rubripes 400Human Homo sapiens 3300
113Genes and Genomes
5.1.1.2 Gene Identification
In contrast to prokaryotes, gene identification in eukaryotes is further
complicated because most chromosomal DNA is non-coding. For
example, it has been estimated that less than 2% of human nuclear DNA
consists of the 20 000–25 000 or so genes that constitute our genomes.1
At first sight, this number of genes appears to be too low to underpin the
genetic blueprint for sophisticated organisms such as vertebrates.
However, it is clear that because of post-transcriptional processing, the
number of messenger RNA (mRNA) transcripts vastly exceeds the
actual number of genes. Further heterogeneity is introduced by post-
translational modification during protein synthesis and maturation.
Thus a relatively small number of genes appear to be capable of pro-
ducing several different sequences of mRNA (transcripts) through var-
ious mechanisms such as alternative promoter usage, splicing and
polyadenylation.2,3 The non-genic portion of the genome, i.e. the
remainder of the 6 000 000 000 DNA base pairs in the diploid human
genome, is often referred to as ‘junk DNA’ because its function is not yet
fully understood.
5.1.1.3 Genomic Analysis
In prokaryotes and viruses, genomic analysis is vastly simplified because
the genomes consist of comparatively small single chromosomes with a
considerably reduced complexity of gene organisation. Prokaryote genes
consist of uninterrupted arrays of amino acid coding sequences that
extend from the start site to the finish of the coding region with relatively
little intergenic non-coding DNA. In eukaryotes the position is more
complex: the DNA is arranged into several chromosomes and typical
genes are not continuous stretches of coding sequence but rather
are broken up into exons, which encode amino acids and non-coding
introns.
The first genome sequence to be completed was that of the virus-like
bacteriophage PhiX174 reported by Sanger and colleagues in 1977.4,5
PhiX174 consisted of approximately 5375 nucleotides and 11 genes with
no intergenic or intronic sequences. The publication of the PhiX174
sequence predated the publication of the full sequence of the human
genome by some 25 years. Sanger’s key discovery of the ‘chain termi-
nation’ DNA sequencing method enabled the nucleotide base order to
be read in comparatively long stretches of DNA. This is the basis for
modern DNA sequencing, which led to the development of the high-
throughput protocols that allowed the completion the draft human
genome sequence in 2001.6,7
114 Chapter 5
5.2 KEY DNA TECHNOLOGIES
Key technologies relevant to the analysis of genes and genomes include
the discovery of restriction endonucleases and cloning vectors, which led
to molecular cloning, DNA sequencing methods and, more recently, the
polymerase chain reaction.
5.2.1 Molecular Cloning Outline
Molecular cloning provides a convenient way of breaking very large
segments of DNA associated with genomes into smaller pieces that are
suited to detailed analysis. Cloning involves the amplification of specific
segments of DNA leading to the accumulation of large amounts of
identical DNA fragments that can be used for various purposes. Clas-
sical molecular cloning employs bespoke DNA cloning vectors, which
are often derived from circular DNAmolecules called bacterial plasmids
and bacteriophage; such recombinant vectors replicate efficiently in
specialised strains of bacterial host cells, resulting in the production of
multiple copies of the recombinant DNAmolecule that was inserted into
the vector.8 Before a DNA fragment can be inserted into a cloning
vector, it must be prepared so that the precise DNA sequences of its ends
are compatible with the ends of the vector molecule DNA sequence.
This is achieved using commercially available enzymes that cleave
double-stranded DNA at specific sequences; these are known as
restriction enzymes or restriction endonucleases. In Nature, restriction
enzymes constitute part of the bacterial defence system by digesting
double-stranded DNA from harmful bacteriophage and other foreign
DNA as it enters the cell. To date, more than 3500 restriction enzymes
have been identified, some of which are commercially available and used
for routine molecular biology applications.9 If both the vector and the
fragments of ‘foreign’ DNA are cut with the same restriction enzyme,
such as EcoRI, which cuts at the sequence 50GAATTC30, it is a rela-
tively straightforward procedure to join, or ligate, the two molecules
because their matching ends have small overhangs with complementary
base pairs (Figure 5.1). The resulting molecule is a recombinant vector
which is capable of growing in the host cell.
5.2.2 Cloning Vectors
Modern cloning vectors are engineered so that they contain ‘multiple
cloning sites’ or ‘polylinkers’. These are segments of DNA that consist
of several unique restriction enzyme recognition sites for the most widely
115Genes and Genomes
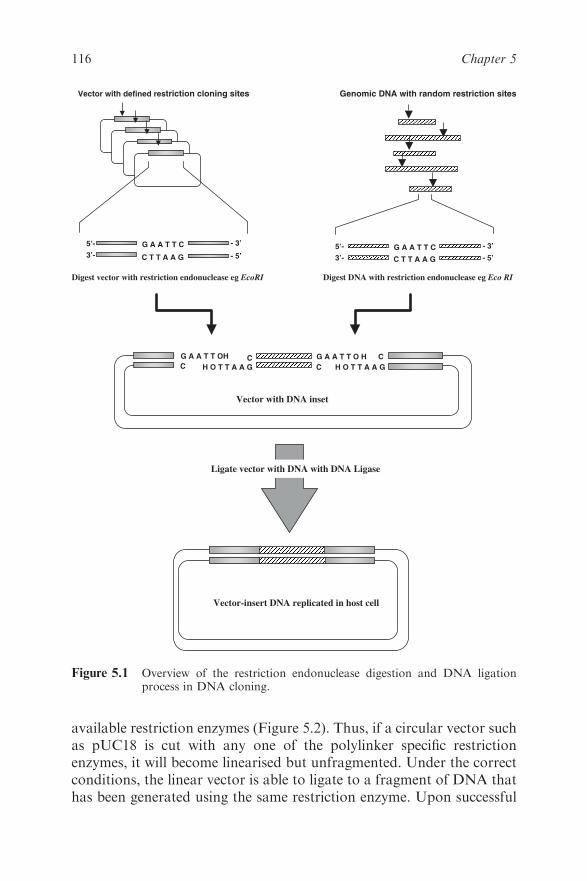
available restriction enzymes (Figure 5.2). Thus, if a circular vector such
as pUC18 is cut with any one of the polylinker specific restriction
enzymes, it will become linearised but unfragmented. Under the correct
conditions, the linear vector is able to ligate to a fragment of DNA that
has been generated using the same restriction enzyme. Upon successful
G A A T T C
C T T A A G
5’-
3’-
- 3’
- 5’
Digest vector with restriction endonuclease eg EcoRI
G A A T T C
C T T A A G
5’-
3’-
- 3’
- 5’
Digest DNA with restriction endonuclease eg Eco RI
Genomic DNA with random restriction sites
G A A T T OH G A A T T O H C
C C
Vector with DNA inset
Vector-insert DNA replicated in host cell
Ligate vector with DNA with DNA Ligase
C
H O T T A A G H O T T A A G
Vector with defined restriction cloning sites
Figure 5.1 Overview of the restriction endonuclease digestion and DNA ligationprocess in DNA cloning.
116 Chapter 5
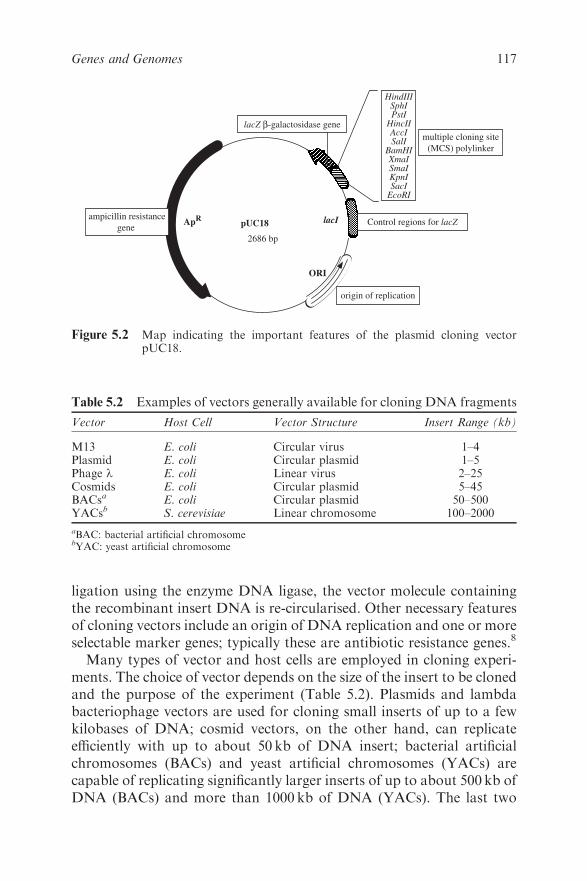
ligation using the enzyme DNA ligase, the vector molecule containing
the recombinant insert DNA is re-circularised. Other necessary features
of cloning vectors include an origin of DNA replication and one or more
selectable marker genes; typically these are antibiotic resistance genes.8
Many types of vector and host cells are employed in cloning experi-
ments. The choice of vector depends on the size of the insert to be cloned
and the purpose of the experiment (Table 5.2). Plasmids and lambda
bacteriophage vectors are used for cloning small inserts of up to a few
kilobases of DNA; cosmid vectors, on the other hand, can replicate
efficiently with up to about 50 kb of DNA insert; bacterial artificial
chromosomes (BACs) and yeast artificial chromosomes (YACs) are
capable of replicating significantly larger inserts of up to about 500 kb of
DNA (BACs) and more than 1000 kb of DNA (YACs). The last two
EcoRI
KpnISmaIXmaI
BamHISalIAccI
HincIIPstISphI
HindIII
lacI
ORI
ApRpUC18
2686 bp
SacI
ampicillin resistance
gene
origin of replication
multiple cloning site
(MCS) polylinker
lacZ β-galactosidase gene
Control regions for lacZ
Figure 5.2 Map indicating the important features of the plasmid cloning vectorpUC18.
Table 5.2 Examples of vectors generally available for cloning DNA fragments
Vector Host Cell Vector Structure Insert Range (kb)
M13 E. coli Circular virus 1–4Plasmid E. coli Circular plasmid 1–5Phage l E. coli Linear virus 2–25Cosmids E. coli Circular plasmid 5–45BACsa E. coli Circular plasmid 50–500YACsb S. cerevisiae Linear chromosome 100–2000
aBAC: bacterial artificial chromosomebYAC: yeast artificial chromosome
117Genes and Genomes
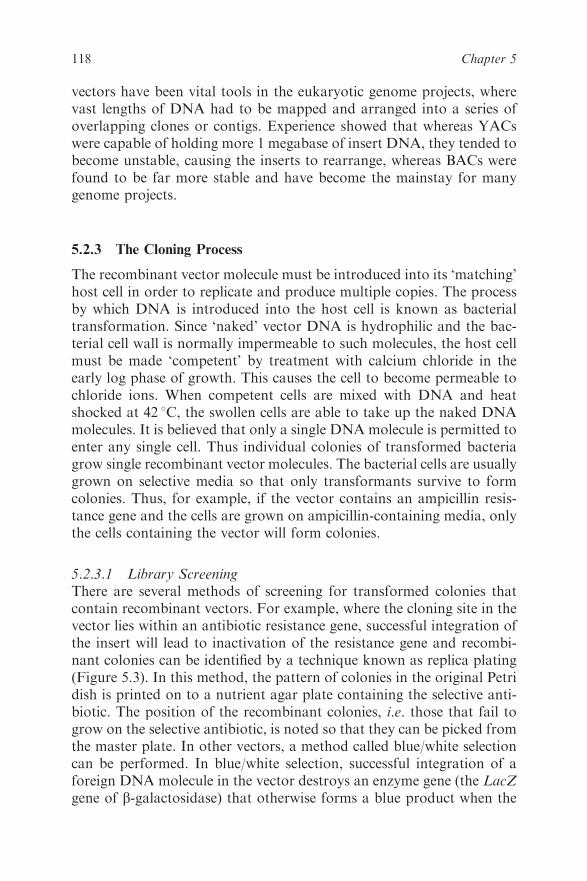
vectors have been vital tools in the eukaryotic genome projects, where
vast lengths of DNA had to be mapped and arranged into a series of
overlapping clones or contigs. Experience showed that whereas YACs
were capable of holding more 1 megabase of insert DNA, they tended to
become unstable, causing the inserts to rearrange, whereas BACs were
found to be far more stable and have become the mainstay for many
genome projects.
5.2.3 The Cloning Process
The recombinant vector molecule must be introduced into its ‘matching’
host cell in order to replicate and produce multiple copies. The process
by which DNA is introduced into the host cell is known as bacterial
transformation. Since ‘naked’ vector DNA is hydrophilic and the bac-
terial cell wall is normally impermeable to such molecules, the host cell
must be made ‘competent’ by treatment with calcium chloride in the
early log phase of growth. This causes the cell to become permeable to
chloride ions. When competent cells are mixed with DNA and heat
shocked at 42 1C, the swollen cells are able to take up the naked DNA
molecules. It is believed that only a single DNA molecule is permitted to
enter any single cell. Thus individual colonies of transformed bacteria
grow single recombinant vector molecules. The bacterial cells are usually
grown on selective media so that only transformants survive to form
colonies. Thus, for example, if the vector contains an ampicillin resis-
tance gene and the cells are grown on ampicillin-containing media, only
the cells containing the vector will form colonies.
5.2.3.1 Library Screening
There are several methods of screening for transformed colonies that
contain recombinant vectors. For example, where the cloning site in the
vector lies within an antibiotic resistance gene, successful integration of
the insert will lead to inactivation of the resistance gene and recombi-
nant colonies can be identified by a technique known as replica plating
(Figure 5.3). In this method, the pattern of colonies in the original Petri
dish is printed on to a nutrient agar plate containing the selective anti-
biotic. The position of the recombinant colonies, i.e. those that fail to
grow on the selective antibiotic, is noted so that they can be picked from
the master plate. In other vectors, a method called blue/white selection
can be performed. In blue/white selection, successful integration of a
foreign DNA molecule in the vector destroys an enzyme gene (the LacZ
gene of b-galactosidase) that otherwise forms a blue product when the
118 Chapter 5
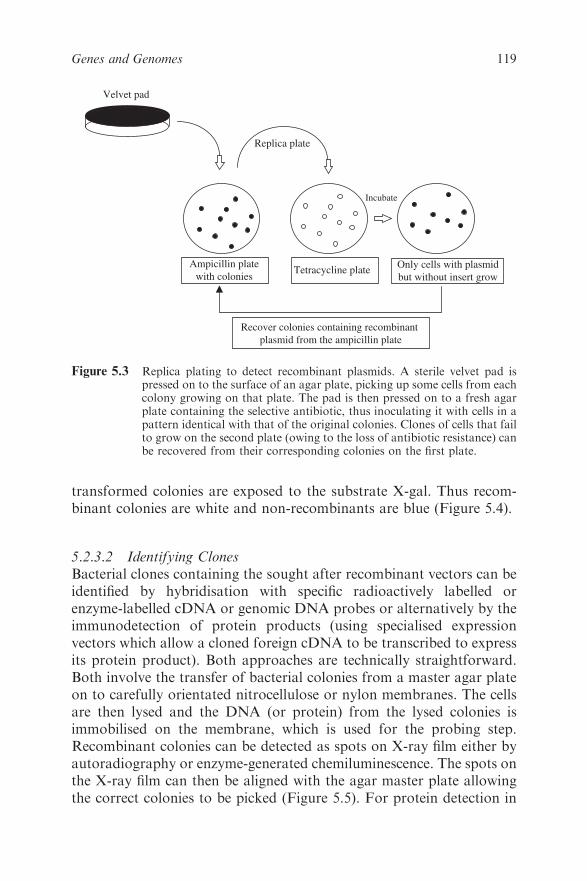
transformed colonies are exposed to the substrate X-gal. Thus recom-
binant colonies are white and non-recombinants are blue (Figure 5.4).
5.2.3.2 Identifying Clones
Bacterial clones containing the sought after recombinant vectors can be
identified by hybridisation with specific radioactively labelled or
enzyme-labelled cDNA or genomic DNA probes or alternatively by the
immunodetection of protein products (using specialised expression
vectors which allow a cloned foreign cDNA to be transcribed to express
its protein product). Both approaches are technically straightforward.
Both involve the transfer of bacterial colonies from a master agar plate
on to carefully orientated nitrocellulose or nylon membranes. The cells
are then lysed and the DNA (or protein) from the lysed colonies is
immobilised on the membrane, which is used for the probing step.
Recombinant colonies can be detected as spots on X-ray film either by
autoradiography or enzyme-generated chemiluminescence. The spots on
the X-ray film can then be aligned with the agar master plate allowing
the correct colonies to be picked (Figure 5.5). For protein detection in
Ampicillin plate
with coloniesTetracycline plate
Only cells with plasmid
but without insert grow
Incubate
Replica plate
Velvet pad
Recover colonies containing recombinant
plasmid from the ampicillin plate
Figure 5.3 Replica plating to detect recombinant plasmids. A sterile velvet pad ispressed on to the surface of an agar plate, picking up some cells from eachcolony growing on that plate. The pad is then pressed on to a fresh agarplate containing the selective antibiotic, thus inoculating it with cells in apattern identical with that of the original colonies. Clones of cells that failto grow on the second plate (owing to the loss of antibiotic resistance) canbe recovered from their corresponding colonies on the first plate.
119Genes and Genomes
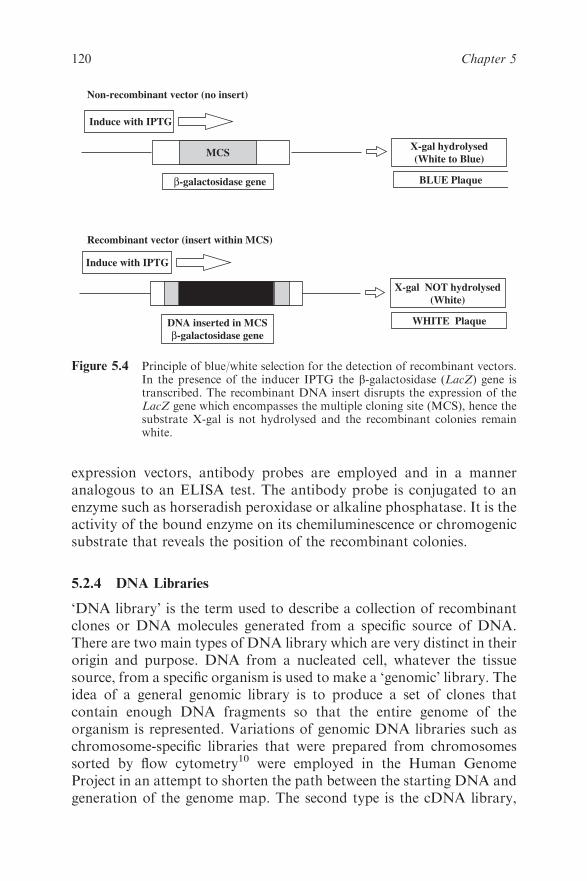
expression vectors, antibody probes are employed and in a manner
analogous to an ELISA test. The antibody probe is conjugated to an
enzyme such as horseradish peroxidase or alkaline phosphatase. It is the
activity of the bound enzyme on its chemiluminescence or chromogenic
substrate that reveals the position of the recombinant colonies.
5.2.4 DNA Libraries
‘DNA library’ is the term used to describe a collection of recombinant
clones or DNA molecules generated from a specific source of DNA.
There are two main types of DNA library which are very distinct in their
origin and purpose. DNA from a nucleated cell, whatever the tissue
source, from a specific organism is used to make a ‘genomic’ library. The
idea of a general genomic library is to produce a set of clones that
contain enough DNA fragments so that the entire genome of the
organism is represented. Variations of genomic DNA libraries such as
chromosome-specific libraries that were prepared from chromosomes
sorted by flow cytometry10 were employed in the Human Genome
Project in an attempt to shorten the path between the starting DNA and
generation of the genome map. The second type is the cDNA library,
X-gal hydrolysed
(White to Blue)
β-galactosidase gene
MCS
Induce with IPTG
BLUE Plaque
X-gal NOT hydrolysed
(White)
DNA inserted in MCS
β-galactosidase gene
Induce with IPTG
WHITE Plaque
Non-recombinant vector (no insert)
Recombinant vector (insert within MCS)
Figure 5.4 Principle of blue/white selection for the detection of recombinant vectors.In the presence of the inducer IPTG the b-galactosidase (LacZ) gene istranscribed. The recombinant DNA insert disrupts the expression of theLacZ gene which encompasses the multiple cloning site (MCS), hence thesubstrate X-gal is not hydrolysed and the recombinant colonies remainwhite.
120 Chapter 5
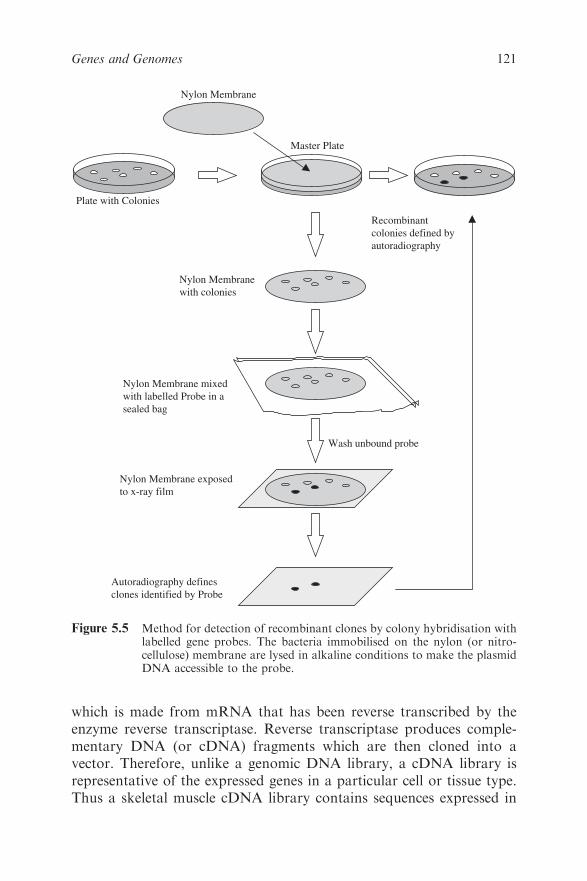
which is made from mRNA that has been reverse transcribed by the
enzyme reverse transcriptase. Reverse transcriptase produces comple-
mentary DNA (or cDNA) fragments which are then cloned into a
vector. Therefore, unlike a genomic DNA library, a cDNA library is
representative of the expressed genes in a particular cell or tissue type.
Thus a skeletal muscle cDNA library contains sequences expressed in
Nylon Membrane
Plate with Colonies
Master Plate
Nylon Membrane
with colonies
Nylon Membrane mixed
with labelled Probe in a
sealed bag
Autoradiography defines
clones identified by Probe
Nylon Membrane exposed
to x-ray film
Recombinant
colonies defined by
autoradiography
Wash unbound probe
Figure 5.5 Method for detection of recombinant clones by colony hybridisation withlabelled gene probes. The bacteria immobilised on the nylon (or nitro-cellulose) membrane are lysed in alkaline conditions to make the plasmidDNA accessible to the probe.
121Genes and Genomes
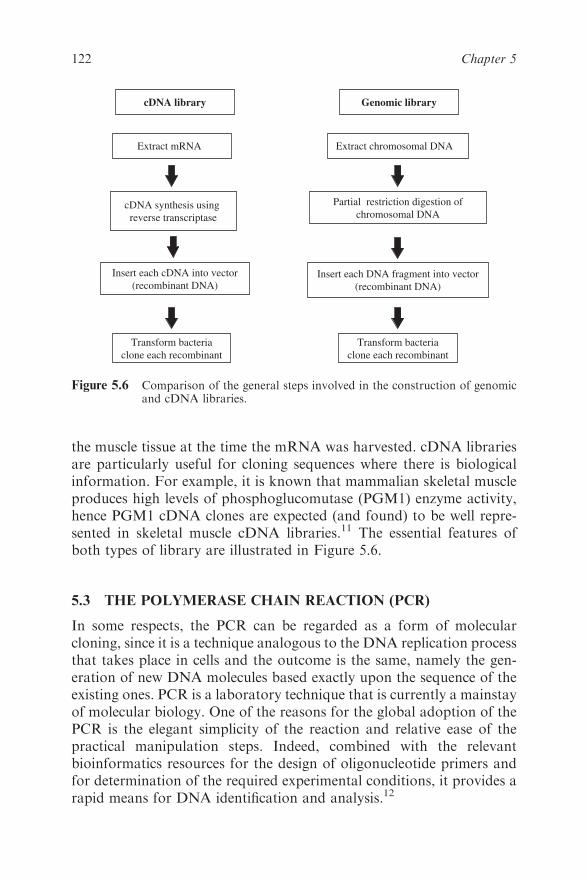
the muscle tissue at the time the mRNA was harvested. cDNA libraries
are particularly useful for cloning sequences where there is biological
information. For example, it is known that mammalian skeletal muscle
produces high levels of phosphoglucomutase (PGM1) enzyme activity,
hence PGM1 cDNA clones are expected (and found) to be well repre-
sented in skeletal muscle cDNA libraries.11 The essential features of
both types of library are illustrated in Figure 5.6.
5.3 THE POLYMERASE CHAIN REACTION (PCR)
In some respects, the PCR can be regarded as a form of molecular
cloning, since it is a technique analogous to the DNA replication process
that takes place in cells and the outcome is the same, namely the gen-
eration of new DNA molecules based exactly upon the sequence of the
existing ones. PCR is a laboratory technique that is currently a mainstay
of molecular biology. One of the reasons for the global adoption of the
PCR is the elegant simplicity of the reaction and relative ease of the
practical manipulation steps. Indeed, combined with the relevant
bioinformatics resources for the design of oligonucleotide primers and
for determination of the required experimental conditions, it provides a
rapid means for DNA identification and analysis.12
Genomic librarycDNA library
Extract chromosomal DNAExtract mRNA
cDNA synthesis using
reverse transcriptase
Insert each cDNA into vector
(recombinant DNA)Insert each DNA fragment into vector
(recombinant DNA)
Transform bacteria
clone each recombinant
Transform bacteria
clone each recombinant
Partial restriction digestion of
chromosomal DNA
Figure 5.6 Comparison of the general steps involved in the construction of genomicand cDNA libraries.
122 Chapter 5
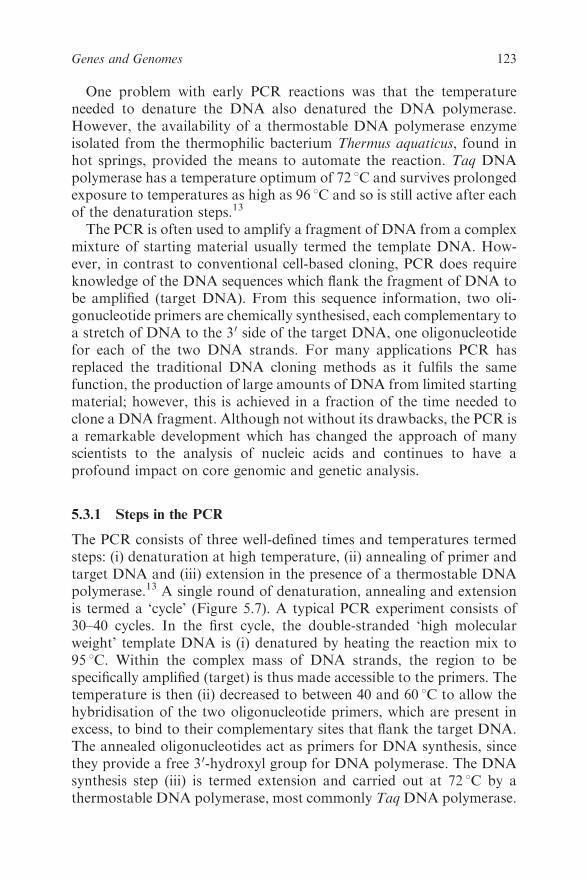
One problem with early PCR reactions was that the temperature
needed to denature the DNA also denatured the DNA polymerase.
However, the availability of a thermostable DNA polymerase enzyme
isolated from the thermophilic bacterium Thermus aquaticus, found in
hot springs, provided the means to automate the reaction. Taq DNA
polymerase has a temperature optimum of 72 1C and survives prolonged
exposure to temperatures as high as 96 1C and so is still active after each
of the denaturation steps.13
The PCR is often used to amplify a fragment of DNA from a complex
mixture of starting material usually termed the template DNA. How-
ever, in contrast to conventional cell-based cloning, PCR does require
knowledge of the DNA sequences which flank the fragment of DNA to
be amplified (target DNA). From this sequence information, two oli-
gonucleotide primers are chemically synthesised, each complementary to
a stretch of DNA to the 30 side of the target DNA, one oligonucleotide
for each of the two DNA strands. For many applications PCR has
replaced the traditional DNA cloning methods as it fulfils the same
function, the production of large amounts of DNA from limited starting
material; however, this is achieved in a fraction of the time needed to
clone a DNA fragment. Although not without its drawbacks, the PCR is
a remarkable development which has changed the approach of many
scientists to the analysis of nucleic acids and continues to have a
profound impact on core genomic and genetic analysis.
5.3.1 Steps in the PCR
The PCR consists of three well-defined times and temperatures termed
steps: (i) denaturation at high temperature, (ii) annealing of primer and
target DNA and (iii) extension in the presence of a thermostable DNA
polymerase.13 A single round of denaturation, annealing and extension
is termed a ‘cycle’ (Figure 5.7). A typical PCR experiment consists of
30–40 cycles. In the first cycle, the double-stranded ‘high molecular
weight’ template DNA is (i) denatured by heating the reaction mix to
95 1C. Within the complex mass of DNA strands, the region to be
specifically amplified (target) is thus made accessible to the primers. The
temperature is then (ii) decreased to between 40 and 60 1C to allow the
hybridisation of the two oligonucleotide primers, which are present in
excess, to bind to their complementary sites that flank the target DNA.
The annealed oligonucleotides act as primers for DNA synthesis, since
they provide a free 30-hydroxyl group for DNA polymerase. The DNA
synthesis step (iii) is termed extension and carried out at 72 1C by a
thermostable DNA polymerase, most commonly TaqDNA polymerase.
123Genes and Genomes
DNA synthesis proceeds from both of the primers until the new
strands have been extended along and beyond the target DNA to be
amplified. It is important to note that, since the new strands extend
beyond the target DNA, they will contain a region near their 30 ends
which is complementary to the other primer. Hence, if another round of
DNA synthesis is allowed to take place, not only the original strands will
be used as templates but also the new strands. The products obtained
from the new strands will have a precise length, delimited exactly by the
two regions complementary to the primers. As the system is taken
through successive cycles of denaturation, annealing and extension, all
the new strands will act as templates and so there will be an exponential
increase in the amount of DNA produced. The net effect is to amplify
selectively the target DNA and the primer regions flanking it, leading to
the production of millions of effectively identical copies.
For efficient annealing of the primers, the precise temperature at
which the annealing occurs is critical and each PCR system has to be
defined and optimised by the user. One useful technique for optimisation
of annealing temperature is called ‘Touchdown’ PCR, where a pro-
grammable thermocycler machine is used to decrease the temperature
incrementally until the optimum annealing is reached.14 Reactions that
are not optimised may give rise to other DNA products in addition to
the specific target or may not produce any amplified products at all.
Another approach to reducing spurious non-specific amplification
Denaturation
ds DNA denatured by heating > 94°C
AnnealingExtension
Oligo primers bind to target sequencesTaq polymerase extends target sequences
1 PCR Cycle
Figure 5.7 Schematic of one PCR cycle illustrating the three steps: denaturation,annealing and extension.
124 Chapter 5
during the early stages of the reaction is termed ‘Hot Start’ PCR. In this
method, the reaction components are heated to the melting temperature
before adding the polymerase. At one time Hot Start was achieved by
introducing a physical wax barrier between the Taq polymerase and the
remainder of the reaction components which melted at the denaturation
temperature, allowing the Taq polymerase access to the reaction mix.
More recently, modified polymerase enzyme systems have been devel-
oped that inhibit polymerisation at ambient temperature, either by the
binding ligands such as antibodies or by the presence of bound inhibi-
tors that dissociate only after a high-temperature activation step is
performed.15 Such modified polymerases are routinely used in PCR.
5.3.2 PCR Primer Design and Bioinformatics
The specificity of the PCR lies in the design of the two oligonucleotide
primers. These not only have to be complementary to sequences flanking
the target DNA but also must not be self-complementary or bind each
other to form dimers, since both prevent authentic DNA amplification.
They also have to be matched in their GC content and have similar
annealing temperatures and be incapable of amplifying unwanted
genomic sequences. Manual design of primers is time consuming and
often hit or miss, although equations such as the following are still used
to derive the annealing temperature (Ta) for each primer:
4ðGþ CÞ þ 2ðAþ TÞ ¼ Tm
where Tm is the melting temperature of the primer/target duplex and G,
C, A and T are the numbers of the respective bases in the primer. In
general, Ta is set 3–5 1C lower than Tm. On occasions, secondary or
primer dimer bands may be observed on the electrophoresis gel in
addition to the authentic PCR product. In such situations, Touchdown
or Hot start regimes may help. Alternatively, raising Ta closer to Tm can
enhance the specificity of the reaction.
The increasing use of bioinformatics resources such as Oligo, Gene-
runner and Primer Design Assistant16 in the design of primers makes the
design and the selection of reaction conditions much more straightfor-
ward. These computer-based resources allow the sequences to be
amplified, primer length, product size, GC content, etc., to be input and
following analysis, provide a choice of matched primer sequences.
Indeed, the initial selection and design of primers without the aid of
bioinformatics would now be unnecessarily time consuming. Finally,
before ordering or synthesising the primers, it is wise to submit proposed
125Genes and Genomes

sequences to a nucleotide sequence search program such as BLAST,17
which can be used to interrogate GenBank or other comprehensive
public DNA sequence databases to increase confidence that the reaction
will be specific for the intended target sequence.
5.3.3 Reverse Transcriptase PCR (RT-PCR)
RT-PCR is an extremely useful variation of the standard PCR which
permits the amplification of specific mRNA transcripts from very small
biological samples without the need for the rigorous extraction proce-
dures associated with mRNA purification for conventional cloning
purposes. Conveniently, the dNTPs, buffer, Taq polymerase, oligonu-
cleotide primers, reverse transcriptase (RT) and the RNA template are
added together to the reaction tube. The reaction is heated to 37 1C which
allows the RT to work and permits the production of a cDNA copy of
the RNA strands that anneal to one of the primers in the mix. Following
‘first strand synthesis’, a normal PCR is carried out to amplify the cDNA
product, resulting in ‘second strand synthesis’, and subsequently a
dsDNA product is amplified as usual. The choice of primer for the first
strand synthesis depends on the experiment. If amplification of all
mRNAs in the cell extract is required, then an oligo dT primer that would
anneal to all the polyA tails can be used. If a specific cDNA is sought,
then a coding region-specific primer can be used with success, otherwise a
random primer could be used. The method is fast, accurate and simple to
perform. It has many applications, such as the assessment of transcript
levels in different cells and tissues (when combined with Q-PCR; see
Section 5.3.4). When combined with allele-specific primers, it also allows
the amplification of cDNA from single chromosomes. RT-PCR is widely
used as a diagnostic tool in microbiology and virology.18–20
5.3.4 Quantitative or Real-time PCR
Another useful PCR development is quantitative PCR (Q-PCR) or real-
time PCR (confusingly also referred to as RT-PCR). Quantitative PCR
is suited to many applications because of the rapidity of the method
compared with conventional PCR, while simultaneously providing a
lower limit of detection and greater dynamic range. Another advantage
is that Q-PCR permits a rigorous analysis of PCR problems as they
arise. Early quantitative PCR methods involved the comparison of a
standard or control DNA template amplified with separate primers at
the same time as the specific target DNA.21 These types of quantification
rely on the reaction being exponential and so any factors affecting this
126 Chapter 5
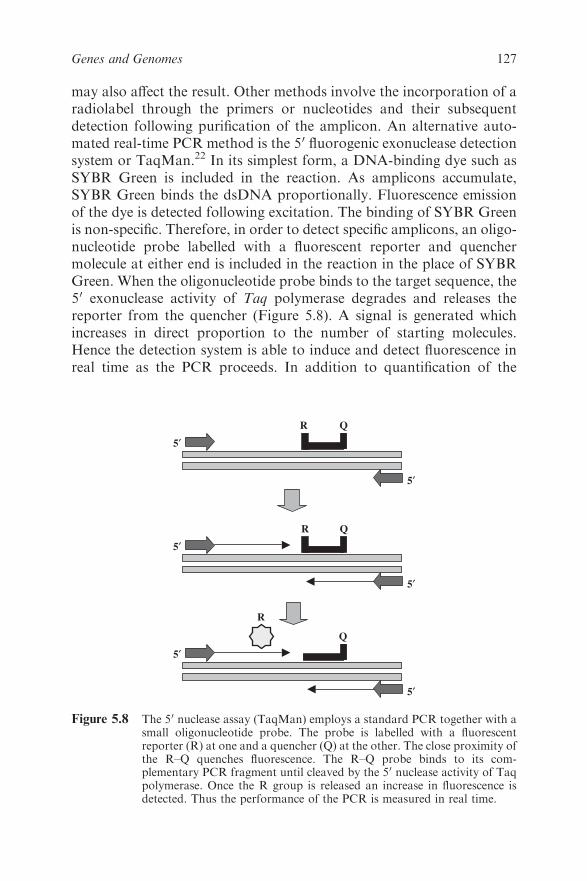
may also affect the result. Other methods involve the incorporation of a
radiolabel through the primers or nucleotides and their subsequent
detection following purification of the amplicon. An alternative auto-
mated real-time PCR method is the 50 fluorogenic exonuclease detection
system or TaqMan.22 In its simplest form, a DNA-binding dye such as
SYBR Green is included in the reaction. As amplicons accumulate,
SYBR Green binds the dsDNA proportionally. Fluorescence emission
of the dye is detected following excitation. The binding of SYBR Green
is non-specific. Therefore, in order to detect specific amplicons, an oligo-
nucleotide probe labelled with a fluorescent reporter and quencher
molecule at either end is included in the reaction in the place of SYBR
Green. When the oligonucleotide probe binds to the target sequence, the
50 exonuclease activity of Taq polymerase degrades and releases the
reporter from the quencher (Figure 5.8). A signal is generated which
increases in direct proportion to the number of starting molecules.
Hence the detection system is able to induce and detect fluorescence in
real time as the PCR proceeds. In addition to quantification of the
5′
5′
R
5′
5′
R
Q
5′
5′
Q
R Q
Figure 5.8 The 50 nuclease assay (TaqMan) employs a standard PCR together with asmall oligonucleotide probe. The probe is labelled with a fluorescentreporter (R) at one and a quencher (Q) at the other. The close proximity ofthe R–Q quenches fluorescence. The R–Q probe binds to its com-plementary PCR fragment until cleaved by the 50 nuclease activity of Taqpolymerase. Once the R group is released an increase in fluorescence isdetected. Thus the performance of the PCR is measured in real time.
127Genes and Genomes

reaction, real-time PCR may also be used for genotyping single
nucleotide polymorphisms and for accurate determination of amplicon
melting temperature using curve analysis. Other probe-based PCR
systems have been devised, such as the use of scorpion probes.23
5.4 DNA SEQUENCING
The determination of the order or sequence of nucleotide bases along a
length of DNA is one of the central techniques in molecular biology and
has played the key role in genome mapping and sequencing projects.
Two basic techniques have been developed for efficient DNA sequen-
cing, one based on an enzymatic method frequently termed Sanger
sequencing, after its developer, and a chemical method, Maxam and
Gilbert sequencing, named for the same reason.4,24 For large-scale
DNA analysis, Sanger sequencing and its variants are by far the most
effective methods and many commercial kits are available for its use.
However, there are certain occasions, such as the sequencing of short
oligonucleotides, where the Maxam and Gilbert method is still more
appropriate.25
One absolute requirement for Sanger sequencing is that the DNA to
be sequenced is in a single-stranded form. Traditionally this demanded
that the DNA fragment of interest be cloned into the specialised bac-
teriophage vector M13, which is naturally single stranded.26,27 Although
M13 is still widely used, the advent of the PCR has provided a rapid
means to amplify a region of any genome or cDNA for which primer
sequences are available and generate the corresponding nucleotide
sequence. This has led to an explosion in DNA sequence information
and has provided much impetus for polymorphism discovery by rese-
quencing regions of the genome from individuals.1
The Sanger method is simple and elegant and in many ways mimics the
natural ability of DNA polymerase to extend a growing nucleotide chain
based on an existing template. Initially the DNA to be sequenced is
allowed to hybridise with an oligonucleotide primer, which is com-
plementary to a sequence adjacent to the 30 side of DNA within a vector
such as M13 (or within an amplicon in the case of PCR). The oligonu-
cleotide will then act as a primer for synthesis of a second strand of DNA,
catalysed by DNA polymerase. Since the new strand is synthesised from its
50 end, virtually the first DNA to be made will be complementary to the
DNA to be sequenced. One of the deoxyribonucleoside triphosphates
(dNTPs) which must be provided for DNA synthesis is radioactively
labelled with 33P or 35S and so the newly synthesised strand will be
radiolabelled.
128 Chapter 5
5.4.1 Dideoxynucleotide Chain Terminators
The reaction mixture is then divided into four aliquots, representing the
four dNTPs, A, C, G and T. Using the adenine (A) tube as an example,
in addition to all of the dNTPs being present in the mix, an analogue of
dATP is added [20,30-dideoxyadenosine triphosphate (ddATP)], which is
similar to A except that it has no 30-hydroxyl group. Since a 50 to 30
phosphodiester linkage cannot be formed without a 30-hydroxyl group,
the presence of the ddATP will terminate the growing chain. The
situation for tube C is identical except that ddCTP is added; similarly,
the G and T tubes contain ddGTP and ddTTP, respectively.
Since the incorporation of a ddNTP rather than a dNTP is a random
event, the reaction will produce new molecules varying widely in length,
but all terminating at the same type of base. Thus four sets of DNA
sequence are generated, each terminating at a different type of base, but
all having a common 50 end (the primer). The four labelled and chain-
terminated samples are then denatured by heating and loaded next to
each other on a polyacrylamide gel for electrophoresis. Electrophoresis
is performed at approximately 70 1C in the presence of urea, to prevent
renaturation of the DNA, since even partial renaturation alters the rates
of migration of DNA fragments. Very thin, long electrophoresis gels are
used for maximum resolution over a wide range of fragment lengths.
After electrophoresis, the positions of radioactive DNA bands on the gel
are determined by autoradiography. Since every band in the lane from
the ddATP sample must contain molecules which terminate at adenine
and that those in the ddCTP terminate at cytosine, etc., it is possible to
read the sequence of the newly synthesised strand from the auto-
radiogram. Under ideal conditions, sequences of approximately 300
DNA bases can be read from one gel.
5.4.2 Sequencing Double-stranded DNA
It is also possible to undertake direct DNA sequencing from double-
stranded molecules such as plasmid cloning vectors and PCR amplicons.
The double-stranded DNA must be denatured prior to annealing with
primer. In the case of plasmids, an alkaline denaturation step is suffi-
cient. However, for PCR amplicons this is more problematic. Unlike
plasmids, amplicons are short and reanneal rapidly. Denaturants such as
formamide and dimethyl sulfoxide have been used to prevent the
reannealing of PCR strands following their separation. Another strategy
is to bias the amplification towards one strand by using a primer ratio of
100:1, which also overcomes this problem to a certain extent.
129Genes and Genomes
It is possible physically to separate and retain one PCR product
strand by incorporating a molecule such as biotin into one of the pri-
mers. Following PCR, the strand that contains the biotinylated primer
may be removed by affinity chromatography with streptavidin-coated
magnetic beads, leaving the complementary PCR strand. This magnetic
affinity purification provides single-stranded DNA derived from the
PCR amplicon and, although somewhat time consuming, it does provide
high-quality single-stranded DNA for sequencing.28
5.4.3 PCR Cycle Sequencing
One of the most useful methods of sequencing PCR amplicons is termed
PCR cycle sequencing. This is not strictly a PCR, since it involves linear
amplification with a single primer. Approximately 20 cycles of dena-
turation, annealing and extension take place. Radiolabelled or fluores-
cently labelled dideoxynucleotides are then introduced in the final stages
of the reaction to generate the chain-terminated extension products.
Automated direct PCR sequencing is increasingly being refined, allow-
ing greater lengths of DNA to be analysed in a single sequencing run.29
5.4.4 Automated DNA Sequencing
Advances in fluorescent labelling chemistry have led to the development of
high-throughput automated sequencing techniques. Essentially, most
systems involve the use of dideoxynucleotides labelled with different
fluorochromes (often referred to as dye terminators). The advantage of
this modification is that since a different label is incorporated with each
ddNTP, it is unnecessary to perform four separate reactions. Therefore,
the four chain-terminated products are run on the same track of a dena-
turing electrophoresis gel. Each product with its base-specific dye is excited
by a laser and the dye then emits light at its characteristic wavelength. A
diffraction grating separates the emissions which are detected by a charge-
coupled device (CCD) and the sequence is interpreted by a computer. The
advantages of the techniques include real-time detection of the sequence.
In addition, the lengths of sequence that may be analysed are in excess of
500bp. Capillary electrophoresis is increasingly being used for the detec-
tion of sequencing products. This is where liquid polymers in thin
capillary tubes are used, obviating the need to pour sequencing gels and
requiring little manual operation. This substantially reduces the electro-
phoresis run times and allows high throughput to be achieved. A number
of large-scale sequence facilities are now fully automated, allowing the
rapid acquisition of sequence data. Automated sequencing for genome
130 Chapter 5
projects is usually based on cycle sequencing using instruments such as the
ABI PRISM 3700 DNA Analyzer. This can be formatted to produce
simultaneous reads from 384-well cycle sequencing reaction plates. The
derived nt sequences are downloaded automatically to databases and
manipulated using a variety of bioinformatics resources.
5.4.5 Pyrosequencing
Rapid PCR sequencing has also been made possible by the use of pyro-
sequencing, which can be regarded as a second-generation sequencing
method without the need for cloning in E. coli or any host cell. In one
format of pyrosequencing, a PCR template is hybridised to an oligonu-
cleotide and incubated with DNA polymerase, ATP sulfurylase, luciferase
and apyrase. During the reaction, the first of the four dNTPs are added
and, if incorporated, release pyrophosphate (PPi), hence the name ‘pyro-
sequencing’. The ATP sulfurylase converts the PPi to ATP, which drives
the luciferase-mediated conversion of luciferin to oxyluciferin to generate
light. Apyrase degrades the resulting component dNTPs and ATP. This is
followed by another round of dNTP addition. A resulting pyrogram
provides an output of the sequence. The method provides short reads very
quickly and is especially useful for the determination of mutations or dis-
covery of single nucleotide polymorphisms (or SNPs; see Section 5.5.2.4).30
Another pyrosequencing format involves direct analysis of DNA fragments
and this system allows the rapid sequencing of entire genomes by the
‘shotgun’ approach. First genomic DNA is randomly sheared and ligated
to linker sequences that permit individual molecules captured on the sur-
face of a bead to be amplified while isolated within an emulsion droplet.31
A very large collection of such beads is arrayed in the 1.6 million wells of a
fibre-optic slide. The micro-array is presented sequentially with each of the
four dNTPs and the amount of incorporation is monitored by lumino-
metric detection as before. The second-generation Roche 454 Genome
Sequencer FLX is reportedly able to produce 100 Mb of sequence with
99.5% accuracy for individual reads averaging over 250 bases in length.
Once again, the derived sequences can be downloaded automatically to
databases and manipulated using a variety of bioinformatics resources.
5.5 GENOME ANALYSIS
5.5.1 Mapping and Identifying Genes
There are two main mapping approaches to identifying genes on chro-
mosomes: genetic mapping and physical mapping. Genetic mapping
131Genes and Genomes
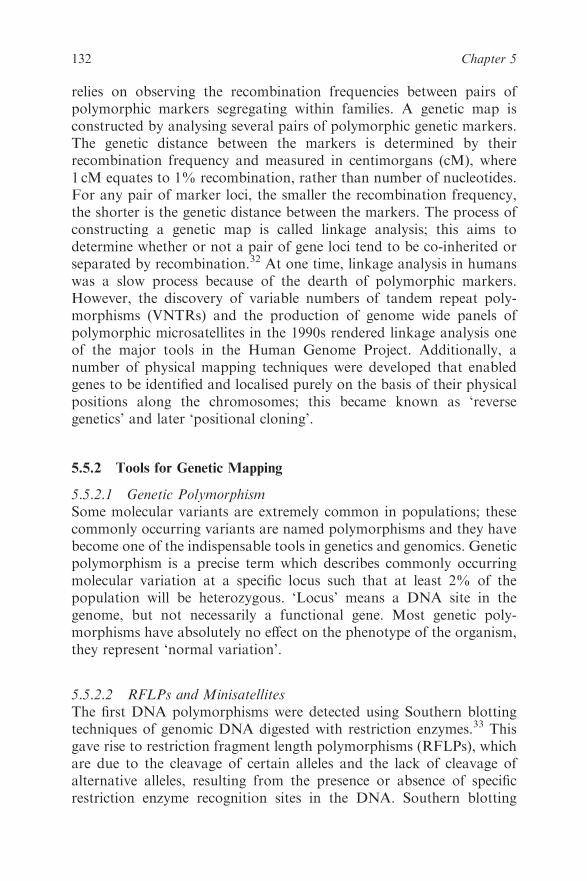
relies on observing the recombination frequencies between pairs of
polymorphic markers segregating within families. A genetic map is
constructed by analysing several pairs of polymorphic genetic markers.
The genetic distance between the markers is determined by their
recombination frequency and measured in centimorgans (cM), where
1 cM equates to 1% recombination, rather than number of nucleotides.
For any pair of marker loci, the smaller the recombination frequency,
the shorter is the genetic distance between the markers. The process of
constructing a genetic map is called linkage analysis; this aims to
determine whether or not a pair of gene loci tend to be co-inherited or
separated by recombination.32 At one time, linkage analysis in humans
was a slow process because of the dearth of polymorphic markers.
However, the discovery of variable numbers of tandem repeat poly-
morphisms (VNTRs) and the production of genome wide panels of
polymorphic microsatellites in the 1990s rendered linkage analysis one
of the major tools in the Human Genome Project. Additionally, a
number of physical mapping techniques were developed that enabled
genes to be identified and localised purely on the basis of their physical
positions along the chromosomes; this became known as ‘reverse
genetics’ and later ‘positional cloning’.
5.5.2 Tools for Genetic Mapping
5.5.2.1 Genetic Polymorphism
Some molecular variants are extremely common in populations; these
commonly occurring variants are named polymorphisms and they have
become one of the indispensable tools in genetics and genomics. Genetic
polymorphism is a precise term which describes commonly occurring
molecular variation at a specific locus such that at least 2% of the
population will be heterozygous. ‘Locus’ means a DNA site in the
genome, but not necessarily a functional gene. Most genetic poly-
morphisms have absolutely no effect on the phenotype of the organism,
they represent ‘normal variation’.
5.5.2.2 RFLPs and Minisatellites
The first DNA polymorphisms were detected using Southern blotting
techniques of genomic DNA digested with restriction enzymes.33 This
gave rise to restriction fragment length polymorphisms (RFLPs), which
are due to the cleavage of certain alleles and the lack of cleavage of
alternative alleles, resulting from the presence or absence of specific
restriction enzyme recognition sites in the DNA. Southern blotting
132 Chapter 5
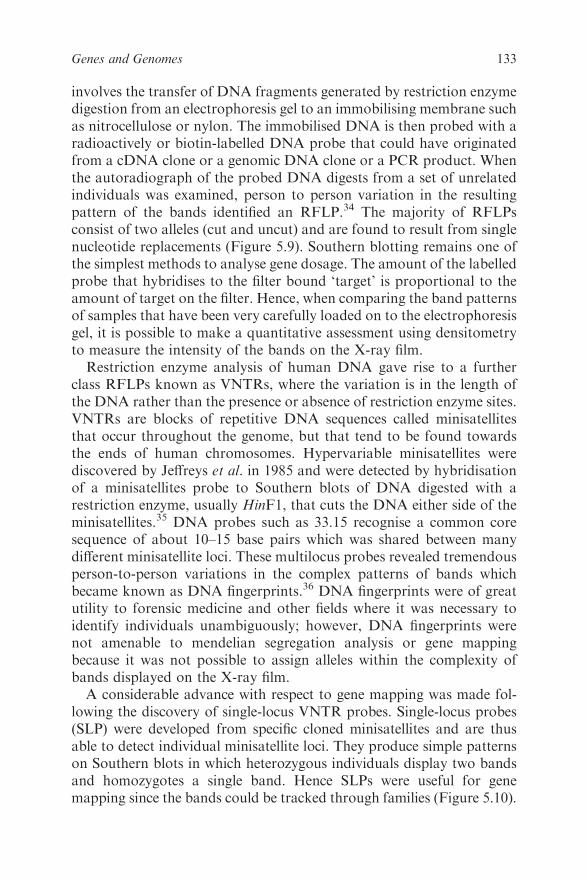
involves the transfer of DNA fragments generated by restriction enzyme
digestion from an electrophoresis gel to an immobilising membrane such
as nitrocellulose or nylon. The immobilised DNA is then probed with a
radioactively or biotin-labelled DNA probe that could have originated
from a cDNA clone or a genomic DNA clone or a PCR product. When
the autoradiograph of the probed DNA digests from a set of unrelated
individuals was examined, person to person variation in the resulting
pattern of the bands identified an RFLP.34 The majority of RFLPs
consist of two alleles (cut and uncut) and are found to result from single
nucleotide replacements (Figure 5.9). Southern blotting remains one of
the simplest methods to analyse gene dosage. The amount of the labelled
probe that hybridises to the filter bound ‘target’ is proportional to the
amount of target on the filter. Hence, when comparing the band patterns
of samples that have been very carefully loaded on to the electrophoresis
gel, it is possible to make a quantitative assessment using densitometry
to measure the intensity of the bands on the X-ray film.
Restriction enzyme analysis of human DNA gave rise to a further
class RFLPs known as VNTRs, where the variation is in the length of
the DNA rather than the presence or absence of restriction enzyme sites.
VNTRs are blocks of repetitive DNA sequences called minisatellites
that occur throughout the genome, but that tend to be found towards
the ends of human chromosomes. Hypervariable minisatellites were
discovered by Jeffreys et al. in 1985 and were detected by hybridisation
of a minisatellites probe to Southern blots of DNA digested with a
restriction enzyme, usually HinF1, that cuts the DNA either side of the
minisatellites.35 DNA probes such as 33.15 recognise a common core
sequence of about 10–15 base pairs which was shared between many
different minisatellite loci. These multilocus probes revealed tremendous
person-to-person variations in the complex patterns of bands which
became known as DNA fingerprints.36 DNA fingerprints were of great
utility to forensic medicine and other fields where it was necessary to
identify individuals unambiguously; however, DNA fingerprints were
not amenable to mendelian segregation analysis or gene mapping
because it was not possible to assign alleles within the complexity of
bands displayed on the X-ray film.
A considerable advance with respect to gene mapping was made fol-
lowing the discovery of single-locus VNTR probes. Single-locus probes
(SLP) were developed from specific cloned minisatellites and are thus
able to detect individual minisatellite loci. They produce simple patterns
on Southern blots in which heterozygous individuals display two bands
and homozygotes a single band. Hence SLPs were useful for gene
mapping since the bands could be tracked through families (Figure 5.10).
133Genes and Genomes
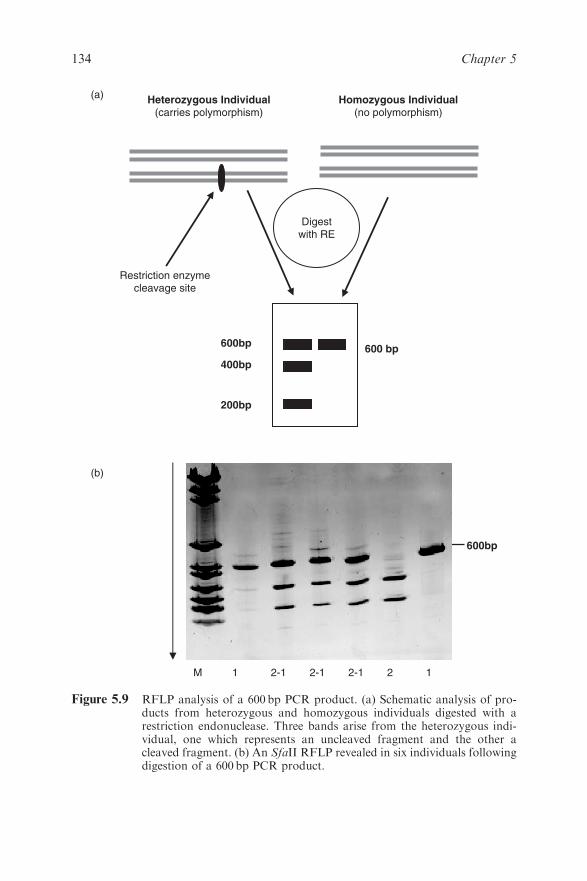
Heterozygous Individual(carries polymorphism)
Homozygous Individual(no polymorphism)
600 bp600bp
400bp
200bp
Digestwith RE
Restriction enzymecleavage site
M 1 2-1 2-1 2-1 2 1
(a)
(b)
600bp
Figure 5.9 RFLP analysis of a 600 bp PCR product. (a) Schematic analysis of pro-ducts from heterozygous and homozygous individuals digested with arestriction endonuclease. Three bands arise from the heterozygous indi-vidual, one which represents an uncleaved fragment and the other acleaved fragment. (b) An SfaII RFLP revealed in six individuals followingdigestion of a 600 bp PCR product.
134 Chapter 5
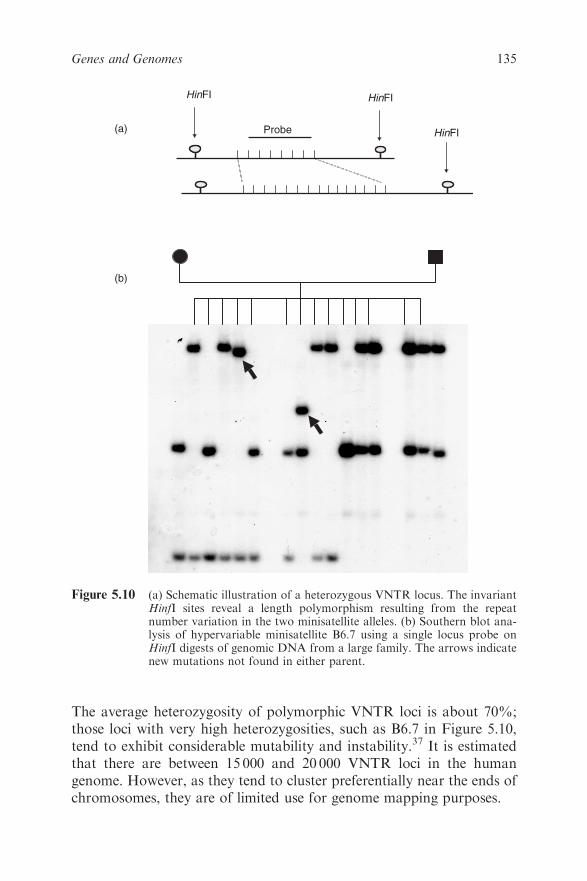
The average heterozygosity of polymorphic VNTR loci is about 70%;
those loci with very high heterozygosities, such as B6.7 in Figure 5.10,
tend to exhibit considerable mutability and instability.37 It is estimated
that there are between 15 000 and 20 000 VNTR loci in the human
genome. However, as they tend to cluster preferentially near the ends of
chromosomes, they are of limited use for genome mapping purposes.
HinFI HinFI
Probe HinFI(a)
(b)
Figure 5.10 (a) Schematic illustration of a heterozygous VNTR locus. The invariantHinfI sites reveal a length polymorphism resulting from the repeatnumber variation in the two minisatellite alleles. (b) Southern blot ana-lysis of hypervariable minisatellite B6.7 using a single locus probe onHinfI digests of genomic DNA from a large family. The arrows indicatenew mutations not found in either parent.
135Genes and Genomes
Interestingly, it has since been discovered that the repeat blocks in
many VNTR loci vary slightly within the sequences of the repeats, giving
rise to repeat types along the length of the two alleles. These variants are
detectable by PCR-based methods and they are the basis of the mini-
satellite variant repeats (MVR) system. This is a highly informative and
elegant means of producing individual genetic barcodes which could be
of tremendous use in forensic analysis of individuals in humans and
many other species.38
5.5.2.3 Microsatellites
Whereas minisatellites consisted of repeats of between 10 and 70, or
more, DNA base pairs per repeat block, microsatellites are tandem
repeats which have a much simpler structure, consisting of between two
and five base pairs per repeat; they are also relatively stable. In contrast
to minisatellites, microsatellites are amenable to PCR analysis because
the overall length of the tandem repeat is relatively small, seldom
exceeding more than a few hundred base pairs. Microsatellites have been
widely used for gene mapping. In general, tri- and tetranucleotide
repeats are preferred to dinucleotide repeat markers because they pro-
duce less confusing secondary bands (satellite bands) on electrophoresis
gels. Microsatellites have been the most widely used marker poly-
morphisms in the Human Genome Project, where they have been used
to build detailed linkage maps of all chromosomes; they also form the
basis of modern forensic DNA profiling. Although the microsatellite
blocks tend to be less polymorphic than the minisatellites in terms of
heterozygosity, they are found scattered more evenly throughout the
human genome rather than being concentrated in specific regions. The
human genome is estimated to contain over one million such loci.6
Large-scale gene mapping studies frequently involve the analysis of
numerous microsatellite loci by gel or capillary electrophoresis. This
type of approach can yield several hundred genotypes from a single
experiment. Capillary electrophoresis is amenable to automation such
that the products of a PCR reaction can be introduced robotically to the
electrophoretic instruments. In this case, the microsatellites are ampli-
fied using fluorophore-labelled PCR primers and the reaction products
are detected by laser-stimulated fluorescence as they pass by a detector
that records the electrophoresed DNA fragments. Automated techni-
ques such as capillary electrophoresis can be carried out with relatively
little technical support in comparison with the demands of gel electro-
phoresis. In practical terms, microsatellite analysis can be conducted
using instruments such as the Applied Biosystems Genescan 3100. The
136 Chapter 5

dye-labelled PCR products are loaded on to the instrument and elec-
trophoresed. Specialised software is then used to process and determine
the allele sizes of the products and thus the genotypes.
Interestingly, some triplet DNA repeat microsatellite sequences have
been found to play a key role in the aetiology of some human genetic
disorders, particularly those associated with certain inherited neurolo-
gical conditions such as Huntington disease (HD, OMIM 143100),
myotonic dystrophy (DM, OMIM 160900) and fragile X syndrome
(FMR1, OMIM 309550). In these cases, the onset and severity of the
disorders can be related to the increase in the number of trinucleotide
repeats from generation to generation. For example, in HD, an auto-
somal dominant disease that gives rise to progressive and neural cell
death, the onset of disease is associated with increases in the increasing
length of a CAG triplet repeat located within the Huntington gene on
human chromosome 4. The CAG triplet encodes the amino acid glu-
tamine, which gives rise to a polyglutamine tract within the Huntington
gene. It has been noted that in healthy individuals the number of CAG
repeats ranges between 10 and 36, whereas in HD patients the number
ranges between 37 and 100.39
The molecular mechanisms leading to microsatellite variation are not
completely understood, although microsatellite loci certainly exhibit
higher mutation rates compared with single nucleotide substitutions in
genes.40 It is generally accepted that replication slippage is the most
common mutational mechanism leading to the gain or loss of one or more
repeat units.41 Other mutational mechanisms such as those based on
unequal crossing over or duplication events have also been considered.42
The tendency to mutate might also depend on the chromosomal envir-
onment of a particular locus and whether or not it is transcribed.43,44
5.5.2.4 Single Nucleotide Polymorphisms (SNPs)
By far the most widespread type of genetic variants is the single
nucleotide polymorphism. Commonly referred to as SNPs (or Snips),
these variant sites are found scattered throughout the genomes of most
species. An SNP is caused by a single nucleotide replacement such as
GAATTC to GTATTC that occurs with a frequency of at least 1% in
the population. SNP is a new name for an old phenomenon. SNPs are
the cause of most RFLPs and indeed the type of mutation that was
indirectly detected in isozyme analysis by zone elctrophoresis before the
advent of DNA technology.45 Detailed studies of human DNA suggest
that SNPs are extremely abundant: a recent estimate is that there are 10
million SNPs in the human genome,46 which gives an average of one
137Genes and Genomes
SNP per 300 base pairs. In a recent mapping effort, more than 3 million
human SNPs have been analysed in more that 200 individuals.47 How-
ever, SNPs are not distributed evenly throughout the genome and the
frequency can vary up to 10-fold.48 Unsurprisingly, because of selection
pressure, SNPs are less abundant in the coding regions than non-coding
regions; other factors that affect their distribution are local recombi-
nation and mutation rates.49 The majority of SNPs are located in repeat
regions which are difficult to analyse; even so, SNPs are the best choice
of polymorphic markers that cover the whole genome. Thus it has been
estimated that there are 5.3 million common SNPs, each with a fre-
quency of 10–15%, accounting for the bulk of DNA differences. Such
SNPs present themselves on average once every 600 base pairs within the
human genome in non-coding DNA,50 hence the level of heterozygosity
in the human genome resulting from SNPs is extraordinarily high. Many
of the current the SNP detection methods can equally detect small
insertions and deletions in the DNA. Although SNPs have a use for
classical gene mapping by linkage analysis, they have attracted great
interest as tools for large-scale association studies with the purpose of
associating specific sequences and mutations with specific phenotypes.51
SNPs can be used simply as genetic markers to identify disease genes by
linkage or association analysis, or alternatively the SNPs themselves
may on rare occasions be the actual variants in DNA sequences that
cause the phenotype. SNPs within genes, especially coding regions that
lead to missense mutations, may well change the function, regulation or
expression of a protein.52 SNPs have also been discovered in the splice
sites of genes and these can result in variant protein products with dif-
ferent exon arrays.53 A number of SNPs have been discovered in the
controlling region of genes and some of these are reported to affect
expression and regulation of proteins.54,55 It should be emphasised that
most SNPs occur in non-coding sequences far away from functional
genes are therefore unlikely to have any functional significance, unless
by chance they were to affect the configuration of a significant motif
such as a remote locus control region.
SNP analysis is currently seen as the most likely approach to dis-
covering genes and mutations that contribute to disease. The US
National Center for Biotechnology Information (NCBI) curates and
maintains an SNP database (dbSNP) which contains sequence details of
several million SNPs, together with short insertions and deletions, from
a variety of species.
The structural simplicity of SNPs compared with microsatellite ren-
ders them ideal for full-scale automation and unambiguous scoring of
alleles. However, in contrast with the microsatellite loci, because most
138 Chapter 5
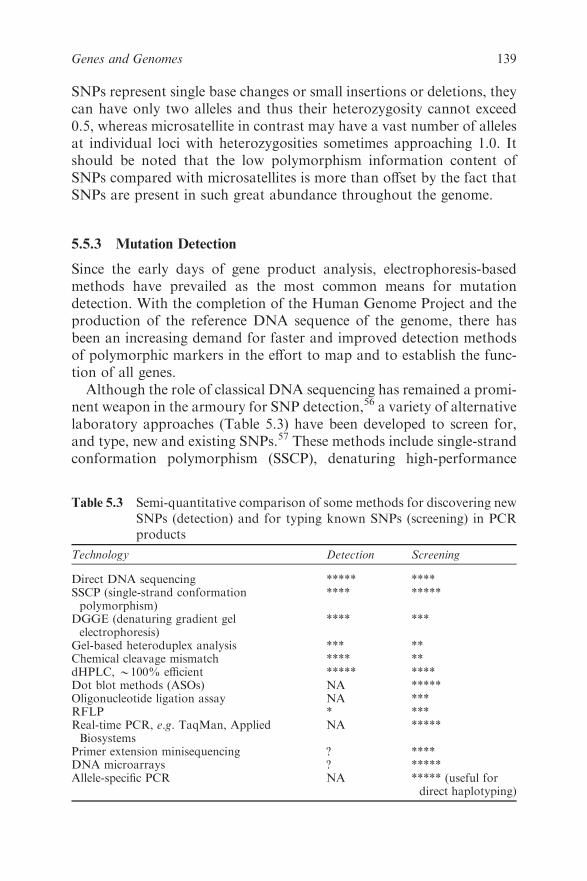
SNPs represent single base changes or small insertions or deletions, they
can have only two alleles and thus their heterozygosity cannot exceed
0.5, whereas microsatellite in contrast may have a vast number of alleles
at individual loci with heterozygosities sometimes approaching 1.0. It
should be noted that the low polymorphism information content of
SNPs compared with microsatellites is more than offset by the fact that
SNPs are present in such great abundance throughout the genome.
5.5.3 Mutation Detection
Since the early days of gene product analysis, electrophoresis-based
methods have prevailed as the most common means for mutation
detection. With the completion of the Human Genome Project and the
production of the reference DNA sequence of the genome, there has
been an increasing demand for faster and improved detection methods
of polymorphic markers in the effort to map and to establish the func-
tion of all genes.
Although the role of classical DNA sequencing has remained a promi-
nent weapon in the armoury for SNP detection,56 a variety of alternative
laboratory approaches (Table 5.3) have been developed to screen for,
and type, new and existing SNPs.57 These methods include single-strand
conformation polymorphism (SSCP), denaturing high-performance
Table 5.3 Semi-quantitative comparison of some methods for discovering new
SNPs (detection) and for typing known SNPs (screening) in PCR
products
Technology Detection Screening
Direct DNA sequencing ***** ****SSCP (single-strand conformationpolymorphism)
**** *****
DGGE (denaturing gradient gelelectrophoresis)
**** ***
Gel-based heteroduplex analysis *** **Chemical cleavage mismatch **** **dHPLC, B100% efficient ***** ****Dot blot methods (ASOs) NA *****Oligonucleotide ligation assay NA ***RFLP * ***Real-time PCR, e.g. TaqMan, AppliedBiosystems
NA *****
Primer extension minisequencing ? ****DNA microarrays ? *****Allele-specific PCR NA ***** (useful for
direct haplotyping)
139Genes and Genomes
liquid chromatography (dHPLC) and microarray technology, which
perhaps offers the greatest promise for the future.
5.5.3.1 Single-stranded Conformation Polymorphism (SSCP)
Originally described by Orita et al. in 1989,58 SSCP has been widely
applied in the field of human genetics, where it has been used both for
SNP detection and for SNP discovery,59 although it is generally pre-
ferred for the former application. The essence is to denature PCR pro-
ducts to make them single stranded and then to separate them by gel
electrophoresis under non-denaturing conditions. In the absence of
strong denaturants, a single-stranded fragment of DNA will adopt a
unique and specific three-dimensional conformation as it attempts to
fold into the most stable structure. The mutated form will adopt a dif-
ferent conformation to its wild-type counterpart. The differences in the
conformers can be assessed on electrophoresis gels, where a hetero-
zygous sample normally displays four bands, one for each denatured
strand, and homozygotes normally display two bands (Figure 5.11). For
mutation detection, the resolving power of the technique is improved by
scanning PCR fragments that are less than 300 base pairs in length.60
Provided that PCR-SSCP analysis is conducted under appropriate
conditions, for example by repeating each electrophoresis experiment at
two running temperatures or by varying the amount of mild denaturant
included in the gel (such as formamide), it has been shown to be an
efficient approach to discovering new mutations.61–63 Initially SSCPs
were detected using autoradiography of radiolabelled PCR products,
followed later by silver staining to visualise unlabelled DNA fragments.
A semi-automated method, PLACE-SSCP, has been developed in which
the products of the PCR are labelled with fluorescent dyes and analysed
by capillary electrophoresis under SSCP conditions.64 As with many
other mutation detection techniques, SSCP analysis is amenable to
multiplexed PCR formats where several PCR products labelled with
different fluorophores are analysed in the same electrophoretic lane.65
5.5.3.2 Denaturing High-performance Liquid Chromatography
(DHPLC)
DHPLC has been shown to be a fast and reliable method for SNP
detection and discovery.66–68 The technique is based on the analysis of
homoduplexes and heteroduplexes formed between reference and
mutant DNA molecules by iron-pair reversed-phase high-performance
liquid chromatography under partially denaturing conditions. For DNA
fragments of between about 100 and 1500 base pairs, DHPLC has been
140 Chapter 5
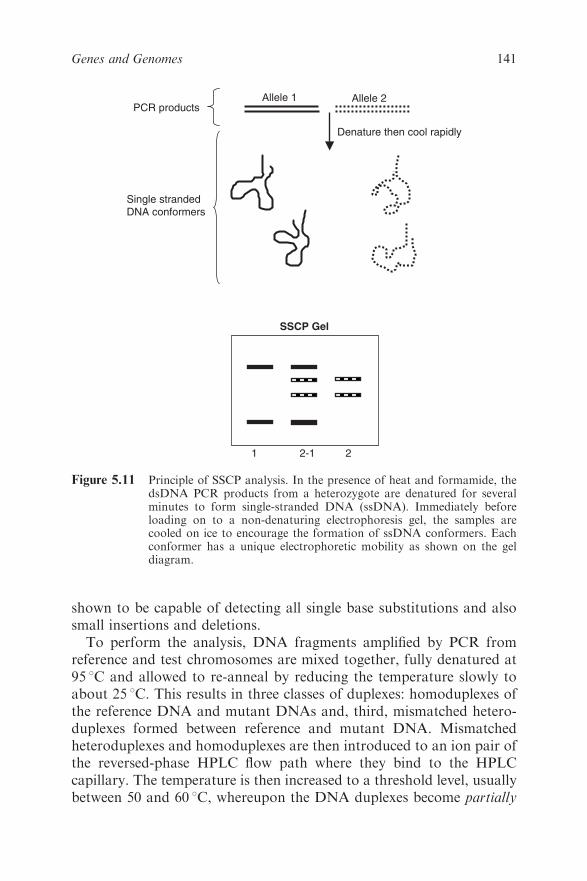
shown to be capable of detecting all single base substitutions and also
small insertions and deletions.
To perform the analysis, DNA fragments amplified by PCR from
reference and test chromosomes are mixed together, fully denatured at
95 1C and allowed to re-anneal by reducing the temperature slowly to
about 25 1C. This results in three classes of duplexes: homoduplexes of
the reference DNA and mutant DNAs and, third, mismatched hetero-
duplexes formed between reference and mutant DNA. Mismatched
heteroduplexes and homoduplexes are then introduced to an ion pair of
the reversed-phase HPLC flow path where they bind to the HPLC
capillary. The temperature is then increased to a threshold level, usually
between 50 and 60 1C, whereupon the DNA duplexes become partially
Allele 1
SSCP Gel
Denature then cool rapidly
Allele 2PCR products
Single strandedDNA conformers
1 2-1 2
Figure 5.11 Principle of SSCP analysis. In the presence of heat and formamide, thedsDNA PCR products from a heterozygote are denatured for severalminutes to form single-stranded DNA (ssDNA). Immediately beforeloading on to a non-denaturing electrophoresis gel, the samples arecooled on ice to encourage the formation of ssDNA conformers. Eachconformer has a unique electrophoretic mobility as shown on the geldiagram.
141Genes and Genomes
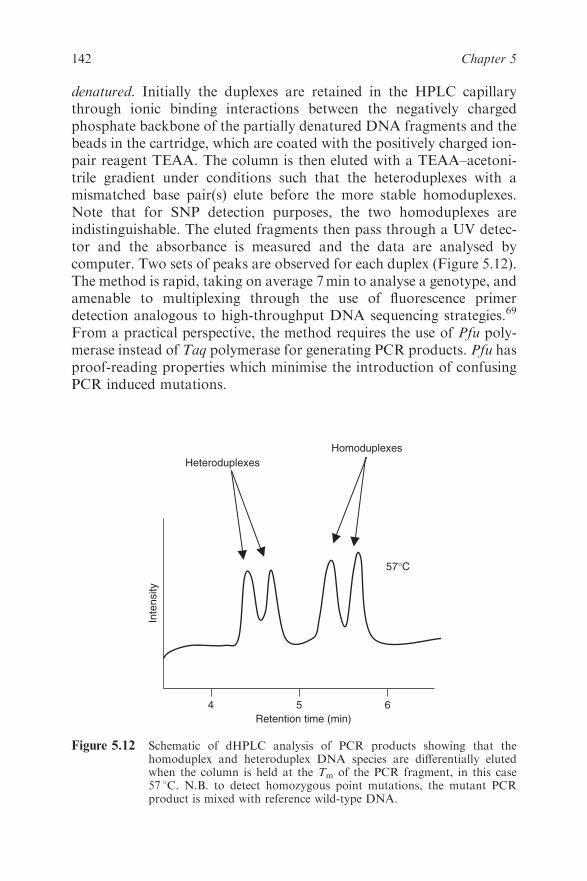
denatured. Initially the duplexes are retained in the HPLC capillary
through ionic binding interactions between the negatively charged
phosphate backbone of the partially denatured DNA fragments and the
beads in the cartridge, which are coated with the positively charged ion-
pair reagent TEAA. The column is then eluted with a TEAA–acetoni-
trile gradient under conditions such that the heteroduplexes with a
mismatched base pair(s) elute before the more stable homoduplexes.
Note that for SNP detection purposes, the two homoduplexes are
indistinguishable. The eluted fragments then pass through a UV detec-
tor and the absorbance is measured and the data are analysed by
computer. Two sets of peaks are observed for each duplex (Figure 5.12).
The method is rapid, taking on average 7min to analyse a genotype, and
amenable to multiplexing through the use of fluorescence primer
detection analogous to high-throughput DNA sequencing strategies.69
From a practical perspective, the method requires the use of Pfu poly-
merase instead of Taq polymerase for generating PCR products. Pfu has
proof-reading properties which minimise the introduction of confusing
PCR induced mutations.
Retention time (min)
4 6
Inte
nsity
57°C
Heteroduplexes
Homoduplexes
5
Figure 5.12 Schematic of dHPLC analysis of PCR products showing that thehomoduplex and heteroduplex DNA species are differentially elutedwhen the column is held at the Tm of the PCR fragment, in this case57 1C. N.B. to detect homozygous point mutations, the mutant PCRproduct is mixed with reference wild-type DNA.
142 Chapter 5
5.5.3.3 DNA Microarrays
The need for rapid, high-quality, comprehensive gene-related data for a
variety of purposes has stimulated the development of DNA micro-
arrays or biochips. These provide a radically different approach to large-
scale characterisation of genes and gene expression.70 DNA microarrays
are a departure from electrophoresis-based approaches and currently
represent the extreme end of miniaturisation. A microarray is an ordered
array of many thousands of DNA oligonucleotides, either single-
stranded oligonucleotides or double-stranded cDNAs, attached (either
by direct printing or in situ synthesis of short oligonucleotides) to a glass
or silicon ‘chip’ that is about the size of a microscope coverslip. The
bound DNA can then be hybridised with test DNA or RNA which has
been labelled with one or two fluorescent dyes depending on the
experimental design. Following an incubation step, the unhybridised
material is washed away and the result is recorded using a confocal laser
scanner. The data are collected and displayed automatically using
dedicated computer programs.
Initially microarrays were designed to measure mRNA transcripts
from thousands of genes in a single experiment.71 This enabled the
physiological state of cells and overall gene expression pattern to be
correlated. For example, transcriptional profiles have been obtained for
many types of human cancer and the accumulated data promise to lead
the way to a better understanding of neoplasia and new therapeutic
targets.72
DNA microarrays are not limited to gene expression studies. The first
genotyping biochips were devised to identify key mutations in highly
variable medically important genes and genomes such as the tumour sup-
pressor gene TP53 (OMIM 191170)73 and the human immunodeficiency
virus (HIV).74 In both cases, successful genotyping of clinical material is
achieved using the microarray approach. More recently, genotyping chips
capable of assigning SNP alleles on a ‘whole genome’ basis have been
devised, which have applications in a variety of post-genomic projects such
as the HapMap initiative to map all human variations in different popu-
lation groups. Three commercially available microarrays are available that
make it possible to analyse simultaneously many thousands of SNPs in an
individual’s DNA. Two microarrays from Affymetrix, with roughly
100 000 and 500 000 SNPs, respectively, and a microarray from Illumina,
with more than 300 000 SNPs, enable a large sample of the genetic var-
iation of an individual to be assessed in a single experiment.75 Such tools
should improve the opportunities for correlating common diseases with
genetic differences in statistically high-powered association studies. Com-
mercially available microarrays have now been developed to monitor SNP
143Genes and Genomes
profiles in economically or scientifically important non-humans such as
cattle and mice. However, the current estimate is that there are more than
10 million SNP sites in the human genome and considerable future
developments will probably be required to give the required coverage of
SNPs in all human populations sufficient for genome-wide association
studies.
5.6 GENOME PROJECTS BACKGROUND
The Human Genome Project was conceived in the mid-1980s, but was
officially launched in 1990. This led to an upsurge in DNA sequencing
activity and an avalanche of sequence data in a variety of species. By
1995, the first cellular (as opposed to viral) genome of a bacterium had
been completed and this was followed by a stream of sequenced gen-
omes, from prokaryotes initially and then eukaryotes. Two independent
drafts of the human genome euchromatic DNA sequence were published
simultaneously in 2001 as a result of a race between by the publicly
funded International Human Genome Project and the privately funded
initiative led by Celera Genomics.6,7 These groups estimated that the
human genome consists of between 30 500 and 35 5006 and between
26 000 and 38 0007 expressed genes. Today this is considered an over-
estimate, the actual number being closer to 20 000–25 000 genes, very
much lower than the pre-genome project estimates of 80 000–140 000
genes. Rapid and powerful advances in cloning and sequencing tech-
nologies and computational biology have transformed genome sequen-
cing initiatives from massive long-term endeavours to relatively quick
and much less expensive undertakings. By mid-2008, complete genome
sequences had been generated for 809 species, including 94 complex
eukaryotic genomes.76 There are currently more than 2500 genomes
under study and the number is set to grow as the precision and speed of
genome sequencing technologies improve and the cost is reduced.76 It is
estimated that the financial cost of the Human Genome Project, which
involved a huge international effort over more than 10 years, was US
$500 million, but it is predicted that the cost of resequencing any indi-
vidual’s entire DNA sequence could soon be just $1000. This would
bring human genomic analysis into the realms of personal medicine.
5.6.1 Mapping and Sequencing Strategies
The Human Genome Project aimed to produce four types of map:
physical, genetic, DNA sequence and gene. Physical and genetic maps
provide essential anchor points and frameworks to align DNA
144 Chapter 5
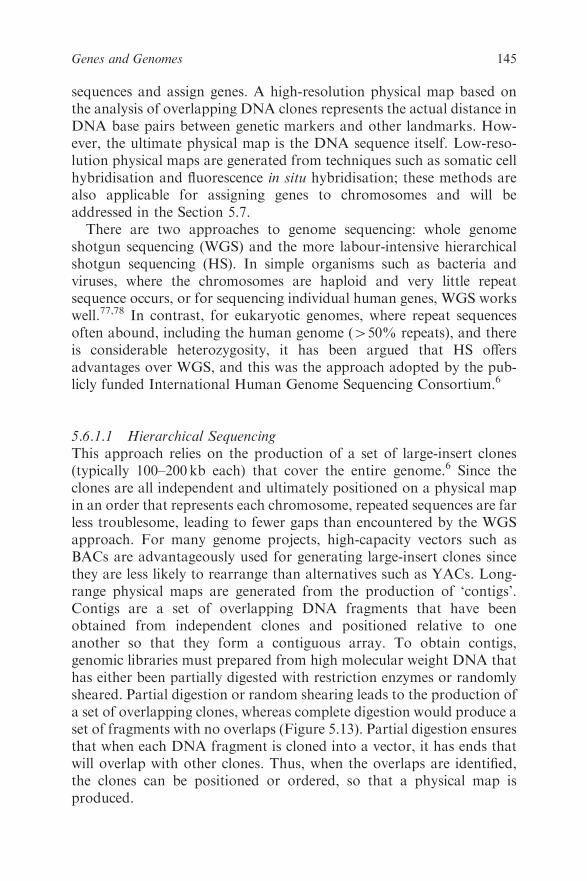
sequences and assign genes. A high-resolution physical map based on
the analysis of overlapping DNA clones represents the actual distance in
DNA base pairs between genetic markers and other landmarks. How-
ever, the ultimate physical map is the DNA sequence itself. Low-reso-
lution physical maps are generated from techniques such as somatic cell
hybridisation and fluorescence in situ hybridisation; these methods are
also applicable for assigning genes to chromosomes and will be
addressed in the Section 5.7.
There are two approaches to genome sequencing: whole genome
shotgun sequencing (WGS) and the more labour-intensive hierarchical
shotgun sequencing (HS). In simple organisms such as bacteria and
viruses, where the chromosomes are haploid and very little repeat
sequence occurs, or for sequencing individual human genes, WGS works
well.77,78 In contrast, for eukaryotic genomes, where repeat sequences
often abound, including the human genome (450% repeats), and there
is considerable heterozygosity, it has been argued that HS offers
advantages over WGS, and this was the approach adopted by the pub-
licly funded International Human Genome Sequencing Consortium.6
5.6.1.1 Hierarchical Sequencing
This approach relies on the production of a set of large-insert clones
(typically 100–200 kb each) that cover the entire genome.6 Since the
clones are all independent and ultimately positioned on a physical map
in an order that represents each chromosome, repeated sequences are far
less troublesome, leading to fewer gaps than encountered by the WGS
approach. For many genome projects, high-capacity vectors such as
BACs are advantageously used for generating large-insert clones since
they are less likely to rearrange than alternatives such as YACs. Long-
range physical maps are generated from the production of ‘contigs’.
Contigs are a set of overlapping DNA fragments that have been
obtained from independent clones and positioned relative to one
another so that they form a contiguous array. To obtain contigs,
genomic libraries must prepared from high molecular weight DNA that
has either been partially digested with restriction enzymes or randomly
sheared. Partial digestion or random shearing leads to the production of
a set of overlapping clones, whereas complete digestion would produce a
set of fragments with no overlaps (Figure 5.13). Partial digestion ensures
that when each DNA fragment is cloned into a vector, it has ends that
will overlap with other clones. Thus, when the overlaps are identified,
the clones can be positioned or ordered, so that a physical map is
produced.
145Genes and Genomes
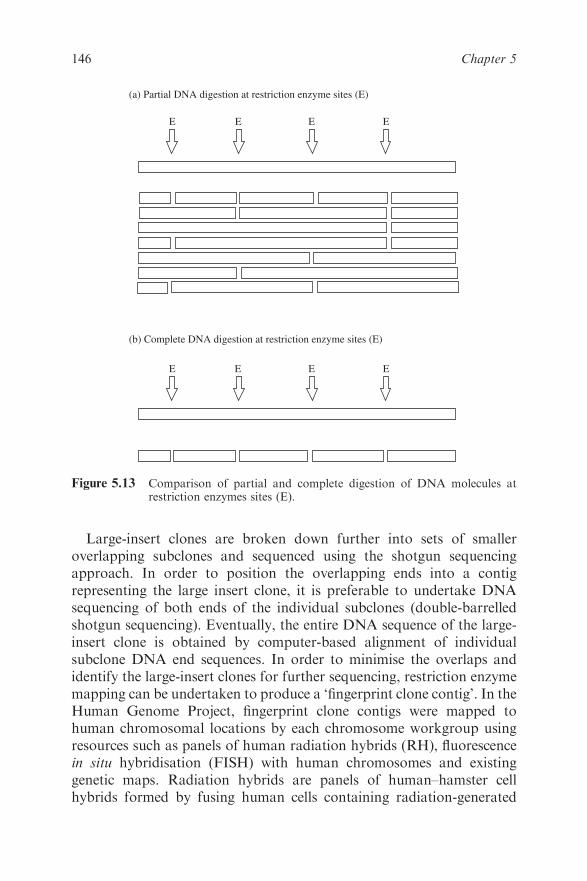
Large-insert clones are broken down further into sets of smaller
overlapping subclones and sequenced using the shotgun sequencing
approach. In order to position the overlapping ends into a contig
representing the large insert clone, it is preferable to undertake DNA
sequencing of both ends of the individual subclones (double-barrelled
shotgun sequencing). Eventually, the entire DNA sequence of the large-
insert clone is obtained by computer-based alignment of individual
subclone DNA end sequences. In order to minimise the overlaps and
identify the large-insert clones for further sequencing, restriction enzyme
mapping can be undertaken to produce a ‘fingerprint clone contig’. In the
Human Genome Project, fingerprint clone contigs were mapped to
human chromosomal locations by each chromosome workgroup using
resources such as panels of human radiation hybrids (RH), fluorescence
in situ hybridisation (FISH) with human chromosomes and existing
genetic maps. Radiation hybrids are panels of human–hamster cell
hybrids formed by fusing human cells containing radiation-generated
E E E E
E E E E
(a) Partial DNA digestion at restriction enzyme sites (E)
(b) Complete DNA digestion at restriction enzyme sites (E)
Figure 5.13 Comparison of partial and complete digestion of DNA molecules atrestriction enzymes sites (E).
146 Chapter 5
fragments of human chromosomes with hamster cells. Panels of radiation
hybrids that contain characterized fragments from all human chromo-
somes can be used for constructing genetic maps that are complementary
to both recombination maps and physical maps based on contigs.79
In order to define a common way for all research laboratories to order
clones and connect physical maps together, an arbitrary molecular
technique based on the PCR has been developed to generate sequence-
tagged sites (STS). These are small, unique sequences between 200 and
300 base pairs that are amplified by PCR.80 The uniqueness of the STS is
defined by the PCR primers that flank the STS. If the PCR results in
amplification, then the STS is present in the clone being tested. In this
way, defining STS markers that lie approximately 100 kb apart along a
contig map allows the ordering of those contigs. Thus, all groups
working with clones have publicly available defined landmarks with
which to order clones produced in their DNA libraries (Figure 5.14).
STSs may also be generated from polymorphic markers that may be
traced through families along with other DNA markers and located
on a genetic linkage map. These polymorphic STSs may thus serve as
markers on both a physical map and a genetic linkage map for each
chromosome and therefore provide a useful means for aligning the two
types of map.
ChromosomeGenomic BAC clone (150Kb)
Overlapping contigs
Physical map (5-10Kb)
Sequence tagged site (STS)
200-300bp PCR product
Cytogenetic map Physical BAC based map Sequence map
Figure 5.14 Schematic of the use of STS markers in the hierarchical physical mappinga human chromosome using BAC clones.
147Genes and Genomes
In addition to the human genome, the hierarchical sequencing
approach has been used to sequence several genomes, including those of
the yeast Saccharomyces cerevisiae and the nematode worm Cae-
norhabditis elegans.81,82 High-quality BAC clone-based physical genome
maps in one species can be of great value to genome projects in other
species where some conservation of genomic sequence and gene order
might be expected. For example, the outputs of the Human Genome
Project have provided anchors for ordering BAC clones generated in
several other species such as mouse, rat and cattle, allowing simplifica-
tion of clone alignments and physical map building in addition to the
generation of comparative maps in the respective species.83–85 The
International Human Genome Sequencing Consortium sequence was
reported as finished in 2004 (Build 35) and contains 2.85 billion
nucleotides interrupted by 341 gaps. It covers approximately 99% of the
euchromatic genome.86
5.6.1.2 Whole Genome Shotgun Sequencing (WGS)
In contrast to the hierarchical BAC by BAC approach, which relies on
the availability of genetic and physical maps for success, WGS is based
on the strategy of sequencing a vast number of random genomic clones
followed by intensive computer-based analysis of the DNA sequences
which identifies matching sequences in different clones. This permits the
assembly of a chromosomal DNA sequence, in principle without other
map resources. As with the HS approach, overlapping clones are
required, but since the clones are destined for direct sequence analysis,
only vectors that contain small to medium inserts are normally used.
Hence once the overlaps have been identified, the entire sequence is
assembled. WGS was the approach adopted by the privately funded
human genome initiative.7
Although WGS remains somewhat controversial for sequencing
complex genomes of ‘higher’ organisms because of the problems asso-
ciated with repeat sequences and heterozygosity, it is a widely used
approach. The number of complex genomes sequenced by this WGS is
increasing and includes the fruit fly Drosophila, mosquito (anopheles),
mouse, puffer fish, dog and grapevine.87–92 However, in some cases, such
as the silk worm genome project, the WGS method has resulted in many
seemingly irresolvable gaps in the genome and so the BAC-based hierar-
chical ordering of clones was used to close the gaps.93Advances in
computational analysis of WGS sequences suggest that the problems
caused by repeat sequences could be overcome, hence the approach can
be expected to gain more ground in future genome projects.94
148 Chapter 5
5.7 GENE DISCOVERY AND LOCALISATION
A major goal of all genome projects is to identify, map and characterise
the genes. These objectives are prerequisites for advances in bio-
technology, medicine and genetics.
5.7.1 Laboratory Approaches
Some well-established methods for mapping genes predated the DNA
era, including somatic cell hybridisation and family-based linkage ana-
lysis. Somatic cell hybridisation was a forerunner of the radiation hybrid
mapping panels that played a significant role in the Human Genome
Project for high-resolution gene mapping. Somatic cell mapping panels
are derived from human–rodent cell hybrids that are formed by fusing
human cells with rodent cells. The hybrids preferentially lose human
chromosomes at random, which allows the establishment of a panel of
clones that retain different human chromosomes. This permits the
assignment of a DNA probe, or an enzyme detected by its activity, to a
particular human chromosome.95 Both somatic cell hybrid analysis and
linkage analysis require knowledge of the gene to be mapped and
therefore cannot be used alone for gene discovery. However, both
approaches can be used to provide low-resolution localisation for a
gene: in the case of the somatic cell hybrids, to a particular chromosome,
and for linkage analysis, to a linkage group, which may be associated
with a chromosome in some instances.32 A limitation of linkage analysis
is that the gene being mapped and the marker genes must be hetero-
zygous in key parent individuals; this was frequently a stumbling block
before the availability of polymorphic DNA markers such as micro-
satellites and SNPs.
Several gene mapping and identification techniques have been devel-
oped for use with cloned DNA. A gene can be localised to a chromo-
some by fluorescence in situ hybridisation (FISH). FISH is carried out
on R-banded spreads of metaphase chromosomes using a labelled
genomic clone. The clone is hybridised to its complementary sequence
on a chromosome and its position revealed by fluorescence confocal
microscopy. By alternating the microscope between the hybridised and
banded display, it is possible to assign a gene to a particular chromo-
some band to a resolution of a few megabases.11
A high-resolution development of FISH, sometimes called Fibre
FISH, can be used to order cloned genes on DNA fibres prepared from
chromatin from interphase nuclei. The fibres are made to extend and
using the approach it is possible to hybridise three genomic clones
149Genes and Genomes
simultaneously enabling their relative positions and order to be deter-
mined.96 This is approach can resolve the order of clones that are only
about 2–7 kb apart.
Identifying genes de novo in cloned DNA presents a different type of
challenge. Several strategies have been developed with varying degrees
of success. In some species, expressed genes are associated with
upstream unmethylated GpC dinucleotide-rich sequences. This has
allowed the use of the restriction endonuclease HpaII to scan cloned
DNA for CpG dinucleotide-rich regions. Because this enzyme only
cleaves unmethylated cytosine of the CpG dinucleotide, cleavage at such
sites may indicate the presence of an expressed gene. Upon digestion
with HpaII, these regions form tiny fragments and are known as HpaII
tiny fragments (HTF) or CpG islands.97
Considerable progress in gene localisation and discovery has been
made with a PCR-based method known as EST mapping. An EST or
Expressed Sequence Tag is a small PCR product that has been generated
from a cDNA sequence, thus reflecting an expressed gene in the cell or
tissue from which the mRNA was prepared. Public domain ESTs are
available from the dbEST database.98 Release 053008 of dbEST contains
more than 50 million ESTs from a large number of species. EST mapping
used with large insert genomic clones leads to discovery and provides
information on genome organisation, including gene density and locali-
sation.99 ESTs in many species reflect genes of unknown function. For
example, a recent study of the brown planthopper, a serious pest of rice
plants, generated a library of more than 37 000 nuclear genome ESTs
some of which were unrelated to any gene sequences in the databases.
These and others could be used to search for genes of relevance to
understanding the biology of the pest species and identifying potential
target genes for developing novel insecticides against planthoppers.100,101
A further gene isolation system, which uses adapted vectors termed
exon trapping or exon amplification, may be used to identify exon
sequences. Exon trapping requires the use of a specialised expression
vector that will accept fragments of genomic DNA containing sequences
for splicing reactions to take place. Following transfection of a eukar-
yotic cell line, a transcript is produced that may be detected by using
specific primers in an RT-PCR. This indicates the nature of the foreign
DNA by virtue of the splicing sequences present.102
5.7.2 Bioinformatics Approaches
Parallel developments in bioinformatics and biocomputing have been
essential for the success of the genome projects. In the closing stages of
150 Chapter 5

the Human Genome Project, some institutions were generating up to
175 000 individual DNA sequence reads per day, information which
needed to analysed, submitted to databases, annotated and checked for
quality. A multiplicity of DNA and protein sequences from different
species is submitted daily by laboratories worldwide to databases such
as GenBank (USA, DNA sequences), EMBL-BANK (Europe, DNA
sequences), DDBJ (Japan, DNA sequences) and SwissProt (Europe,
protein sequences). All of these ever-expanding and annotated databases
are available to the public and the three major DNA sequence databases
share information on a daily basis. These massive primary sequence
databases have stimulated the emergence of a large number of specia-
lised genomic and protein databases dedicated to various subjects such
as a particular species group, biological features such as disease markers,
protein families, protein domains, etc. The Nucleic Acids Research
online Molecular Biology Database Collection is a public repository
that lists more than 1000 databases.103
Many algorithms such as BLAST17 have been developed to search
databases for matching sequences of nucleotides or amino acids and
there are now unparalleled opportunities for characterising genes and
for studying groups of related genes in silico. It has been estimated that
the majority of new cDNA and EST sequences will show similarity to
proteins of known function and that many of the sequences will show
similarity to each other. Further precision for identifying gene families is
afforded by automated approaches to access databases such as Pfam to
search for protein domains.104
Other computational approaches have been devised to predict fea-
tures of genes in otherwise anonymous genomic sequences. Grail is a
gene finder program which predicts exons, genes, promoter regions,
polyA tails and other features associated with expressed DNA. ‘Cloning’
genes using database resources and dedicated algorithms is now a reality
and biocomputing has become an applied science which enables inves-
tigators dealing with sequences held in data repositories to plot a course
that may seldom require the use of conventional laboratory equipment.
Organising and synthesising the exponentially expanding nucleotide
data delivered by the second-generation sequencing projects is perhaps
the major challenge for genomics.
In addition to the DNA and protein sequence databases, there has
been an accompanying development of catalogue databases. Two
examples from human genetics are OMIM (Online Mendelian Inheri-
tance in Man), which catalogues salient details and literature references
for more than 18 000 human genetic traits (the majority of which are
known at the sequence or molecular basis levels), and the Human
151Genes and Genomes
Genome Nomenclature Database (HGNC), which assigns names to all
known human genes and curates a searchable database. There are many
others serving various research communities and biological systems.
5.8 FUTURE DIRECTIONS
In medicine, a major challenge is to unravel the genetic basis of common
diseases, which at some stage during life may affect the majority
of individuals in all populations. The Human Genome Project has
produced the resources to tackle these multifactorial disorders such as
cardiovascular disease, cancer, diabetes, bipolar disorder, asthma,
multiple sclerosis, etc. These complex traits do not exhibit mendelian
inheritance patterns often observed with single gene disorders such as
cystic fibrosis. Instead, the action of several genes, each with a small
effect and environmental influences, can be expected to modify the risk
of disease. Various types of association studies are used in an attempt to
define the genes that underlie the propensity for some individuals to
develop such diseases. Population- and family-based association studies
such as whole genome association studies and affected sib pair analysis
make use of the gene maps, polymorphic marker resources and genome
technologies in the attempt to pinpoint small regions of chromosomes
associated with the disease phenotype. Chromosomal regions showing
positive association with disease can then be subjected to detailed ana-
lysis by efficient resequencing strategies1 and functional studies in the
attempt to identify the causative mutations.105 As the genome becomes
better understood, it is expected that more complex trait genes and
mutations will be identified, leading to an improved understanding of
molecular pathology and, it is hoped, new effective therapies.
Interestingly, except for a few promising cases,106 the optimistic pre-
dictions for gene therapy that were made more than 20 years ago have
not yet been fulfilled. Understanding the expression patterns of tran-
scription of disease predisposing genes (from microarray data, for
example) seems to offer more potential for therapeutic developments.
For instance, there have been considerable advances in the field of RNA
silencing or transcriptional inactivation, which fosters the belief that
small interfering RNA (siRNA) molecules could one day have a ther-
apeutic role in common diseases, including cancers, by ‘switching off’
deleterious gene expression.107
The genome projects and gene analysis in other species can be
expected to produce enormous scientific and economic benefits. The
information from the genome projects of model organisms such as
mouse, fruit fly, yeast and the nematode worm has been integrated with
152 Chapter 5
the human data to provide insights into evolution, refining maps, etc.
Animal and plant genome projects are of great importance to agriculture
and biotechnology. Transgenesis or genetic modification (GM) of food
organisms, both plant and animal, is likely to grow in importance,
particularly as world food supplies become more stretched. Genetically
modified crops, principally corn, soybean, rapeseed and cotton, have
already been produced with a range of GM characters such as herbicide
resistance, insect resistance, virus resistance, delayed fruit ripening
(tomato), altered oil content, etc. In the next decades, transgenic animals
that produce increased yields of meat, improved health, disease resis-
tance, optimised fat content and ability to thrive in different environ-
ments could be produced. Transgenics also holds great promise for the
low-cost production of pharmaceuticals such as therapeutic proteins
expressed in milk and plants. The growing effort of genome sequencing
and gene discovery promises to overcome the previously encumbering
difficulties associated with locating genes for species improvement, new
antibiotic targets, etc. However, before implementation of these new
GM strategies can occur, a full risk assessment is necessary to under-
stand the possible impacts on human health and the environment.
REFERENCES
1. S. Levy, G. Sutton, P. C. Ng, L. Feuk, A. L. Halpern, B. P.
Walenz, N. Axelrod, J. Huang, E. F. Kirkness, G. Denisov and
Y. Lin, et al., PLoS Biol. 2007, 5, e254.
2. P. Carninci, T. Kasukawa, S. Katayama, J. Gough, M. C. Frith,
N. Maeda, R. Oyama, T. Ravasi, B. Lenhard and C. Wells, et al.,
Science, 2005, 309, 1559.
3. P. Carninci, Trends Genet., 2006, 22, 501.
4. F. Sanger, S. Nicklen and A. R. Coulson, Proc. Natl. Acad. Sci.
USA, 1977, 74, 5463.
5. F. Sanger, G. M. Air, B. G. Barrell, N. L. Brown, A. R. Coulson,
J. C. Fiddes, C. A. Hutchison III, P. M. Slocombe and M. Smith,
Nature, 1977, 265, 687.
6. International Human Genome Sequencing Consortium, Nature,
2001, 409, 860.
7. J. C. Venter, M. D. Adams, E. W. Myers, P. W. Li, R. J. Mural,
G. G. Sutton, H. O. Smith, M. Yandell, C. A. Evans and R. A.
Holt, et al., Science, 2001, 291, 1304.
8. J. Sambrook and P. MacCallum, Molecular Cloning: a Laboratory
Manual, 3rd edn, Cold Spring Harbor Laboratory Press, Cold
Spring Harbor, NY, 2001.
153Genes and Genomes
9. R. J. Roberts, T. Vincze, J. Posfai and D. Macelis, Nucleic Acids
Res., 2007, 35, Database Issue, D3–D4.
10. K. E. Davies, B. D. Young, R. G. Elles, M. E. Hill and
R. Williamson, Nature, 1981, 293, 374.
11. D. B. Whitehouse, W. Putt, J. U. Lovegrove, K. Morrison,
M. Hollyoake, M. F. Fox, D. A. Hopkinson and Y. H. Edwards,
Proc. Natl. Acad. Sci. USA, 1992, 89, 411.
12. R. K. Saiki, S. Scharf, F. Faloona, K. B. Mullis, G. T. Horn, H. A.
Erlich and N. Arnheim, Science, 1985, 230, 1350.
13. R. K. Saiki, D. H. Gelfand, S. Stoffel, S. J. Scharf, R. Higuchi,
G. T. Horn, K. B. Mullis and H. A. Erlich, Science, 1988, 239, 487.
14. R. H. Don, P. T. Cox, B. J. Wainwright, K. Baker and J. S.
Mattick, Nucleic Acids Res., 1991, 19, 4008.
15. D. J. Sharkey, E. R. Scalice, K. G. Christy Jr, S. M. Atwood and
J. L. Daiss, Biotechnology, 1994, 12, 506.
16. S. H. Chen, C. Y. Lin, C. S. Cho, C. Z. Lo and C. A. Hsiung,
Nucleic Acids Res., 2003, 31, 3751.
17. S. F. Altschul, T. L. Madden, Al. A. Schaffer, J. Zhang, Z. Zhang,
W. Miller and D. J. Lipman, Nucleic Acids Res., 1997, 25, 3389.
18. J.-P. Lai, J.-H. Yang, S. D. Douglas, X. Wang, E. Riedel and
W.-Z. Ho, Clin. Diagn. La.b Immunol., 2003, 10, 1123.
19. S. Corbet, J. Bukh, A. Heinsen and A. Fomsgaard, J. Clin.
Microbiol., 2003, 41, 1091.
20. B. S. Coulson, J. R. Gentsch, B. K. Das, M. K. Bhan and R. I.
Glass, J. Clin. Microbiol., 1999, 37, 3187.
21. R. Higuchi, C. Fockler, G. Dollinger and R. Watson, Biotechnol-
ogy, 1993, 11, 1026.
22. P. M. Holland, R. D. Abramson, R. Watson and D. H. Gelfand,
Proc. Natl. Acad. Sci. USA, 1991, 88, 7276.
23. A. Solinas, L. J. Brown, C. McKeen, J. M. Mellor, J. Nicol,
N. Thelwell and T. Brown, Nucleic Acids Res., 2001, 29, E96.
24. A. M. Maxam and W. Gilbert, Proc. Natl. Acad. Sci. USA, 1977,
74, 560.
25. J. Kieleczawa, J. Biomol. Tech., 2005, 16, 220.
26. J. Messing, B. Gronenborn, B. Muller-Hill and P. Hans Hopsch-
neider, Proc. Natl. Acad. Sci. USA, 1977, 7, 3642.
27. B. Gronenborn and J. Messing, Nature, 1978, 272, 375.
28. R. E. March, W. Putt, M. Hollyoake, J. H. Ives, J. U. Lovegrove,
D. A. Hopkinson, Y. H. Edwards and D. B. Whitehouse, Proc.
Natl. Acad. Sci. USA, 1993, 90, 10730.
29. H. M. Pang and E. S. Yeung, Nucleic Acids Res., 2000, 28, E73.
154 Chapter 5
30. M. Ronaghi, S. Shokralla and B. Gharizadeh, Pharmacogenomics,
2007, 8, 1437.
31. D. Dressman, H. Yan, G. Traverso, K. W. Kinzler and
B. Vogelstein, Proc. Natl. Acad. Sci. USA, 2003, 100, 8817.
32. A. J. F. Griffiths, J. H. Miller, D. T. Suzuki, R. C. Lewontin and
W. M. Gelbart (Eds.), An Introduction to Genetic Analysis, Free-
man, New York, 1993.
33. E. M. Southern, Trends Biochem. Sci., 2000, 25, 585.
34. R. Leach, R. DeMars, S. Hasstedt and R. White, Proc. Natl. Acad.
Sc.i USA, 1986, 83, 3909.
35. A. J. Jeffreys, V. Wilson and S. L. Thein, Nature, 1985, 314, 67.
36. A. J. Jeffreys, V. Wilson and S. L. Thein, Nature, 1985, 316, 76.
37. K. Tamaki, C. A. May, Y. E. Dubrova and A. J. Jeffreys, Hum.
Mol. Genet., 1999, 8, 879.
38. K. Tamaki, C. H. Brenner and A. J. Jeffreys, Forensic Sci. Int.,
2000, 113, 55.
39. J. F. Gusella and M. E. MacDonald, Curr. Opin. Neurobiol., 1995,
5, 656.
40. Y. C. Li, A. B. Korol, T. Fahima, A. Beiles and E. Nevo, Mol.
Ecol., 2002, 11, 2453.
41. C. Schlotterer and D. Tautz, Nucleic Acids Res., 1992, 20, 211.
42. J. M. Hancock, in Microsatellites: Evolution and Applications,
D. Goldstein and C. Schlotterer (Eds.), Oxford University Press,
New York, 1999, pp. 1–9.
43. H. Ellegren, Nat. Genet., 2000, 24, 400.
44. J. D. Hawk, L. Stefanovic, J. C. Boyer, T. D. Petes and R. A.
Farber, Proc. Natl. Acad. Sci. USA, 2005, 102, 8639.
45. H. Harris and D. A. Hopkinson, Handbook of Enzyme Electro-
phoresis in Human Genetics (with Supplements), Oxford American
Publishing, New York, l976.
46. E. Lai, Genome Res., 2006, 11, 927.
47. International HapMap Consortium, Nature, 2007, 449, 851.
48. International SNP Map Working Group, Nature, 2001, 409, 928.
49. D. E. Reich, S. F. Schaffner, M. J. Daly, G. McVean, J. C.
Mullikin, J. M. Higgins, D. J. Richter, E. S. Lander and
D. Altshuler, Nat. Genet., 2002, 32, 135.
50. L. Kruglyak and D. A. Nickerson, Nat. Genet., 2001, 27, 234.
51. G. A. Thorisson and L. D. Stein, Nucleic Acids Res., 2003, 31, 124.
52. F. J. de Serres, Environ. Health Perspect., 2003, 111, 1851.
53. M. Krawczak, J. Reiss and D. N. Cooper, Hum. Genet., 1992,
90, 41.
155Genes and Genomes

54. E. M. El-Omar, M. Carrington, W. H. Chow, K. E. McColl, J. H.
Bream, H. A. Young, J. Herrera, J. Lissowska, C. C. Yuan and
N. Rothman, et al., Nature, 2000, 404, 398.
55. A. Ligers, N. Teleshova, T. Masterman, W. X. Huang and
J. Hillert, Genes Immun., 2001, 2, 45.
56. P. Taillon-Miller, E. E. Piernot and P.-Y. Kwok, Genome Res.,
1999, 9, 499.
57. P.-Y. Kwok (Ed.), Single Nucleotide Polymorphisms, Methods and
Protocols, Humana Press, Totowa, NJ, 2003.
58. M. Orita, H. Iwahana, H. Kanazawa, K. Hayashi and T. Sekiya,
Proc. Natl. Acad. Sci. USA, 1989, 86, 2766.
59. T. Tozaki, N.-H. Choi-Miura, M. Taniyama, M. Kurosawa and
M. Tomita, BMC Med. Genet., 2002, 3, 6.
60. K. Hayashi and D. W. Yandell, Hum. Mutat., 1993, 2, 338.
61. S. P. Yip, W. Putt, D. A. Hopkinson and D. B. Whitehouse, Ann.
Hum. Genet., 1999, 63, 129.
62. C. Mroske, J. Muci, J. Wang, K. Li, W. Song, J. Yan, J. Feng,
Q. Liu and S. S. Sommer, Anal. Biochem., 2007, 368, 250.
63. S. P. Yip, D. A. Hopkinson and D. B. Whitehouse, Biotechniques,
1999, 27, 20.
64. T. Tahira, A. Suzuki, Y. Kukita and K. Hayashi, Methods Mol.
Biol., 2003, 212, 37.
65. J. S. Ellison, Mol. Biotechnol., 1996, 5, 1.
66. D. Guzowski, A. Chandrasekaran, C. Gawel, J. Palma, J. Koenig,
X. P. Wang, M. Dosik, M. Kaplan, C. C. Chu and S. Chavan,
et al., J. Biomol. Tech., 2005, 16, 154.
67. D. Liu, Y. Zhang, Y. Du, G. Yang and X. Zhang,DNA Seq., 2007,
18, 220.
68. M. Shi, Y. Hou, J. Yan, R. Bai and X. Yu, J. Forensic Sci., 2007,
52, 235.
69. A. Premstaller, W. Xiao, H. Oberacher, M. O’Keefe, D. Stern,
T. Willis, C. G. Huber and P. J. Oefner, Genome Res., 2001, 11, 1944.
70. E. M. Southern, Trends Genet., 1996, 12, 110.
71. V. Trevino, F. Falciani and H. A. Barrera-Saldana, Mol. Med.,
2007, 13, 527.
72. D. R. Rhodes, S. Kalyana-Sundaram, V.Mahavisno, R. Varambally,
J. Yu, B. B. Briggs, T. R. Barrette, M. J. Anstet, C. Kincead-Beal and
P. Kulkarni, et al., Neoplasia, 2007, 9, 166.
73. S. A. Ahrendt, S. Halachmi, J. T. Chow, L. Wu, N. Halachmi,
S. C. Yang, S. Wehage, J. Jen and D. Sidransky, Proc. Natl. Acad.
Sci. USA, 1999, 96, 7382.
156 Chapter 5
74. R. Gonzalez, B. Masquelier, H. Fleury, B. Lacroix, A. Troesch,
G. Vernet and J. N. Telles, J. Clin. Microbiol., 2004, 42, 2907.
75. I. Pe’er, P. I. de Bakker, J. Maller, R. Yelensky, D. Altshuler and
M. J. Daly, Nat. Genet., 2006, 38, 605.
76. Genomes OnLine Database, http://www.genomesonline.org/
index.htm, 2008.
77. R. C. Gardner, A. J. Howarth, P. Hahn, M. Brown-Luedi, R. J.
Shepherd and J. Messing, Nucleic Acids Res., 1981, 9, 2871.
78. S. L. Chissoe, A. Bodenteich, Y. F. Wang, Y. P. Wang, D. Burian,
S. W. Clifton, J. Crabtree, A. Freeman, K. Iyer and L. Jian, et al.,
Genomics, 1995, 27, 67.
79. G. Gyapay, K. Schmitt, C. Fizames, H. Jones, N. Vega-Czarny,
D. Spillett, D. Muselet, J. F. Prud’homme, C. Dib and C. Auffray,
et al., Hum. Mol. Genet., 1996, 5, 339.
80. E. A. Stewart, K. B. McKusick, A. Aggarwal, E. Bajorek, S.
Brady, A. Chu, N. Fang, D. Hadley, M. Harris and S. Hussain, et
al., Genome Res., 1997, 7, 422.
81. H. W. Mewes, K. Albermann, M. Bahr, D. Frishman, A. Gleissner,
J. Hani, K. Heumann, K. Kleine, A. Maierl and S. G. Oliver, et al.,
Nature, 1997, 387 (6632 Suppl), 7.
82. C. elegans Sequencing Consortium, Science, 1998, 282, 2012.
83. S. G. Gregory, M. Sekhon, J. Schein, S. Zhao, K. Osoegawa, C. E.
Scott, R. S. Evans, P. W. Burridge, T. V. Cox and C. A. Fox, et al.,
Nature, 2002, 418, 743.
84. M. Krzywinski, J. Wallis, C. Gosele, I. Bosdet, R. Chiu, T. Graves,
O. Hummel, D. Layman, C. Mathewson and N. Wye, et al.,
Genome Res., 2004, 14, 766.
85. International Bovine BAC Mapping Consortium, Genome Biol.,
2007, 8, R165.
86. International Human Genome Sequencing Consortium, Nature.
2004, 431, 931.
87. M. D. Adams, S. E. Celniker, R. A. Holt, C. A. Evans, J. D.
Gocayne, P. G. Amanatides, S. E. Scherer, P. W. Li, R. A. Hoskins
and R. F. Galle, et al., Science, 2000, 287, 2185.
88. R. A. Holt, G. M. Subramanian, A. Halpern, G. G. Sutton,
R. Charlab, D. R. Nusskern, P. Wincker, A. G. Clark, J. M. C.
Ribeiro and R. Wides, et al., Science, 2002, 298, 129.
89. Mouse Genome Sequencing Consortium, Nature, 2002, 420, 520.
90. S. Aparicio, J. Chapman, E. Stupka, N. Putnam, J. M. Chia,
P. Dehal, A. Christoffels, S. Rash, S. Hoon and A. Smit, et al.,
Science, 2002, 297, 1301.
157Genes and Genomes
91. E. F. Kirkness, V. Bafna, A. L. Halpern, S. Levy, K. Remington,
D. B. Rusch, A. L. Delcher, M. Pop, W. Wang and C. M. Fraser,
et al., Science, 2003, 301, 1898.
92. R. Velasco, A. Zharkikh, M. Troggio, D. A. Cartwright,
A. Cestaro, D. Pruss, M. Pindo, L. M. Fitzgerald, S. Vezzulli and
J. Reid, et al., PLoS ONE, 2007, 2, e1326.
93. K. Yamamoto, J. Nohata, K. Kadono-Okuda, J. Narukawa,
M. Sasanuma, S. I. Sasanuma, H. Minami, M. Shimomura,
Y. Suetsugu and Y. Banno, et al., Genome Biol., 2008, 9, R21.
94. S. Istrail, G. G. Sutton, L. Florea, A. L. Halpern, C. M. Mobarry,
R. Lippert, B. Walenz, H. Shatkay, I. Dew and J. R. Miller, et al.,
Proc. Natl. Acad. Sci. USA, 2004, 101, 1916.
95. H. N. Bu-Ghanim, C. M. Casimir, S. Povey and A. W. Segal,
Genomics, 1990, 8, 56.
96. N. Hornigold, M. van Slegtenhorst, J. Nahmias, R. Ekong,
S. Rousseaux, C. Hermans, D. Halley, S. Povey and J. Wolfe,
Genomics, 1997, 41, 385.
97. C. A. Sargent, I. Dunham and R. D. Campbell, EMBO J., 1989,
8, 2305.
98. M. S. Boguski, T. M. Lowe and C. M. Tolstoshev, Nat. Genet.,
1993, 4, 332.
99. L. L. Qi, B. Echalier, S. Chao, G. R. Lazo, G. E. Butler, O. D.
Anderson, E. D. Akhunov, J. Dvorak, A. M. Linkiewicz, A.
Ratnasiri and J. Dubcovsky, et al., Genetics, 2004, 168, 701.
100. H. Noda, S. Kawai, Y. Koizumi, K.Matsui, Q. Zhang, S. Furukawa,
M. Shimomura and K. Mita, BMC Genomics, 2008, 9, 117.
101. D. R. Price, H. S. Wilkinson and J. A. Gatehouse, Insect Biochem.
Mol. Biol., 2007, 3, 1138.
102. G. M. Duyk, S. W. Kim, R. M. Myers and D. R. Cox, Proc. Natl.
Acad. Sci. USA, 1990, 87, 8995.
103. M. Y. Galperin, Nucleic Acids Res., 2008, 36 (Database Issue),
D2–D4.
104. R. D. Finn, J. Mistry, B. Schuster-Bockler, S. Griffiths-Jones,
V. Hollich, T. Lassmann, S. Moxon, M. Marshall, A. Khanna and
R. Durbin, et al., Nucleic Acids Res., 2006, 34 (Database Issue),
D247–D251.
105. W. Bodmer and C. Bonilla, Nat Genet., 2008, 40, 695.
106. J. W. Bainbridge, M. H. Tan and R. R. Ali, Gene Ther., 2006,
13, 119.
107. S. Walchli and M. Sioud, Front. Biosci., 2008, 13, 3488.
158 Chapter 5
CHAPTER 6
The Biotechnology and MolecularBiology of Yeast
BRENDAN P. G. CURRANa AND VIRGINIA C. BUGEJAb
a School of Biological and Chemical Sciences, Queen Mary, University of
London, Mile End Road, London E1 4NS, UK; b School of Life Sciences,
University of Hertfordshire, College Lane, Hatfield, Hertfordshire AL10
9AB, UK
6.1 INTRODUCTION
The yeast Saccharomyces cerevisiae plays a central role in both bio-
technology, the profitable exploitation of biological systems by humans,
and molecular biology, which can be described as studying and
manipulating biological systems at the molecular level. This is because it
is the most successfully exploited microorganism, with a record of
exploitation reaching back over 2000 years, and as the most molecu-
larly characterised eukaryotic organism it is currently providing an
unparalleled insight into cellular structure and function at the molecular
level.
Despite a complete ignorance of the underlying mechanisms, the
biotechnological exploitation of yeast began thousands of years ago
with the production of beer, wine and bread. Today we still use yeast to
make bread, wine and beer but can also manipulate molecules of DNA
to direct yeast cells to produce vast quantities of molecules with a
Molecular Biology and Biotechnology, 5th Edition
Edited by John M Walker and Ralph Rapleyr Royal Society of Chemistry 2009
Published by the Royal Society of Chemistry, www.rsc.org
159
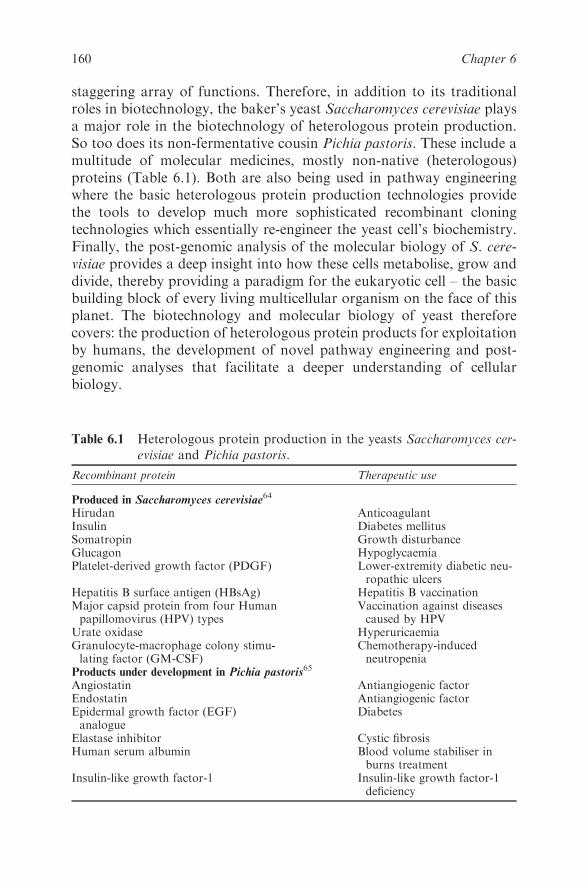
staggering array of functions. Therefore, in addition to its traditional
roles in biotechnology, the baker’s yeast Saccharomyces cerevisiae plays
a major role in the biotechnology of heterologous protein production.
So too does its non-fermentative cousin Pichia pastoris. These include a
multitude of molecular medicines, mostly non-native (heterologous)
proteins (Table 6.1). Both are also being used in pathway engineering
where the basic heterologous protein production technologies provide
the tools to develop much more sophisticated recombinant cloning
technologies which essentially re-engineer the yeast cell’s biochemistry.
Finally, the post-genomic analysis of the molecular biology of S. cere-
visiae provides a deep insight into how these cells metabolise, grow and
divide, thereby providing a paradigm for the eukaryotic cell – the basic
building block of every living multicellular organism on the face of this
planet. The biotechnology and molecular biology of yeast therefore
covers: the production of heterologous protein products for exploitation
by humans, the development of novel pathway engineering and post-
genomic analyses that facilitate a deeper understanding of cellular
biology.
Table 6.1 Heterologous protein production in the yeasts Saccharomyces cer-
evisiae and Pichia pastoris.
Recombinant protein Therapeutic use
Produced in Saccharomyces cerevisiae64
Hirudan AnticoagulantInsulin Diabetes mellitusSomatropin Growth disturbanceGlucagon HypoglycaemiaPlatelet-derived growth factor (PDGF) Lower-extremity diabetic neu-
ropathic ulcersHepatitis B surface antigen (HBsAg) Hepatitis B vaccinationMajor capsid protein from four Humanpapillomovirus (HPV) types
Vaccination against diseasescaused by HPV
Urate oxidase HyperuricaemiaGranulocyte-macrophage colony stimu-lating factor (GM-CSF)
Chemotherapy-inducedneutropenia
Products under development in Pichia pastoris65
Angiostatin Antiangiogenic factorEndostatin Antiangiogenic factorEpidermal growth factor (EGF)analogue
Diabetes
Elastase inhibitor Cystic fibrosisHuman serum albumin Blood volume stabiliser in
burns treatmentInsulin-like growth factor-1 Insulin-like growth factor-1
deficiency
160 Chapter 6
6.2 THE PRODUCTION OF HETEROLOGOUS
PROTEINS BY YEAST
Heterologous, or recombinant, proteins are produced when recombi-
nant DNA technology is used to ensure the expression of a gene product
in an organism in which it would not normally be made. It is very
challenging to assemble all of the genetic components required to ensure
that a specific DNA sequence is transcribed into an mRNA molecule,
which can subsequently be translated into a functional protein by a cell.
Moreover, due to the bewildering array of molecular processes (e.g.
glycosylation, acetylation, myristelation, etc.) that impact on protein
processing, the final protein structure is dependent upon the type of host
cell in which the expressed protein is synthesised. Thus, although gene
expression vector technology was originally developed in E. coli, the
production of recombinant proteins, especially if they are for human use,
often requires an appropriately engineered DNA molecule to be trans-
formed into a eukaryotic host cell. Therefore, shortly after the first
heterologous proteins was expressed in E. coli in 1977,1 the yeast
S. cerevisiae was developed as the first eukaryote host system. Many
other eukaryotes have been developed as host systems since then, and
one of these is another yeast called Pichia pastoris.
6.2.1 The Yeast Hosts
Yeasts are the simplest eukaryotes and they share many of the attributes
of bacteria: they are unicellular, grow rapidly, can be transformed with
DNA and can form colonies on a plate.
S. cerevisiae was developed as the first eukaryotic host cell to express
heterologous proteins, not only because it shared a number of useful
attributes with E. coli but also because it had a long, safe history of
use in commercial fermentation processes. This made it particularly
suitable for approval by regulatory bodies charged with the responsi-
bility of ensuring the safe production of medically important hetero-
logous proteins. Moreover, it also has its own autonomously replicating
plasmid, can carry out post-translational modifications of expressed
proteins and secretes a small number of proteins into the growth med-
ium. This, as we shall see, can be exploited both to produce glycosylated
proteins and to simplify the purification of heterologous proteins. It
has a very primitive glycosylation pathway, however, which makes it
unsuitable for many human proteins. That is one of the main reasons
why its cousin P. pastoris was developed as an alternative yeast host
cell. In addition, this yeast is a methylotroph, one of a small number of
161The Biotechnology and Molecular Biology of Yeast
yeast species that share a biochemical pathway allowing the cells to
utilise methanol as a sole carbon source. They grow to much higher
cell densities in fermenters due to the absence of toxic levels of ethanol
and, importantly, they have a glycosylation pathway which produces
more authentic patterns for human heterologous protein products than
S. cerevisiae.
6.2.2 Assembling and Transforming Appropriate DNA Constructs
into the Hosts
6.2.2.1 The DNA Constructs
In order for the yeast host cells to be able to express the foreign protein,
appropriate yeast expression vectors need to be engineered. These are
generally shuttle vectors, which consist of DNA sequences that will
ensure appropriate protein expression in the yeast host cells and a sec-
tion of bacterial DNA that allows the molecule to be assembled and
engineered in E. coli. Typical vectors can be seen in Figure 6.1. They
consist of a backbone of bacterial DNA including an origin of replica-
tion for E. coli, a selectable marker such as ampicillin resistance and a
number of appropriate restriction sites into which the various yeast-
specific DNA sequences can be inserted. These latter include a yeast
selectable marker, a strong yeast promoter and terminator to control
mRNA production, appropriate DNA sequences to direct translation
when the mRNA has been generated and a polycloning site for insertion
of the DNA sequence encoding the heterologous protein. The hetero-
logous DNA is inserted between the promoter and terminator. The
heterologous DNA is almost always a cDNA of the desired protein
coding sequence because yeast cannot normally recognise regulatory
sequences or excise introns in DNA sequences from higher eukaryotes
such as humans.
There are two main types of expression vectors used in S. cerevisiae
biotechnology. YEp (yeast episomal plasmid) vectors are based on
the ARS (autonomously replicating sequence) sequence from the
endogenous yeast 2 mm plasmid which contains genetic information for
its own replication and segregation (for a review, see Ref. 2). They are
capable of autonomous replication, are present at 20–200 copies per cell
and under selective conditions are found in 60–95% of the cell popu-
lation (Figure 6.1A). The addition of a centromeric sequence converts a
YEp into a yeast centromeric plasmid (YCp) (Figure 6.1B). YCps are
normally present at one copy per cell, can replicate without integration
162 Chapter 6
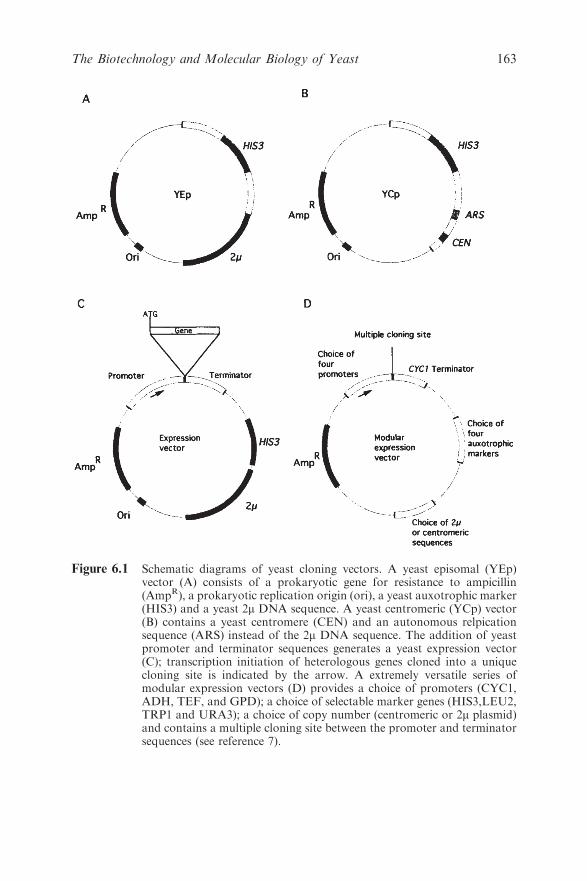
Figure 6.1 Schematic diagrams of yeast cloning vectors. A yeast episomal (YEp)vector (A) consists of a prokaryotic gene for resistance to ampicillin(AmpR), a prokaryotic replication origin (ori), a yeast auxotrophic marker(HIS3) and a yeast 2m DNA sequence. A yeast centromeric (YCp) vector(B) contains a yeast centromere (CEN) and an autonomous relpicationsequence (ARS) instead of the 2m DNA sequence. The addition of yeastpromoter and terminator sequences generates a yeast expression vector(C); transcription initiation of heterologous genes cloned into a uniquecloning site is indicated by the arrow. A extremely versatile series ofmodular expression vectors (D) provides a choice of promoters (CYC1,ADH, TEF, and GPD); a choice of selectable marker genes (HIS3,LEU2,TRP1 and URA3); a choice of copy number (centromeric or 2m plasmid)and contains a multiple cloning site between the promoter and terminatorsequences (see reference 7).
163The Biotechnology and Molecular Biology of Yeast
into a chromosome and are stably maintained during cell division even
in the absence of selection. An extremely versatile family of expression
vectors providing alternative selectable markers, a range of copy num-
bers and differing promoter strengths (see Figure 6.1d) has been pro-
duced by Mumberg et al.3
S. cerevisiae vectors are usually transformed as circular molecules into
the host cells. On the other hand, P. pastoris expression vectors are
designed to be cut and linearised before transformation. This allows the
constructs to integrate into the host chromosome and thereafter there is
no need for further selection in order to maintain the construct in the
host cells.
There are now a number of commercially available vectors for both
S. cerevisiae and P. pastoris.
6.2.2.2 Transformation and Selection
There are several procedures that achieve efficient transformation of
yeast. Exponentially growing cells can be enzymatically treated to
remove their cell walls and the resulting sphaeroplasts exposed to DNA
in the presence of calcium ions and polyethylene glycol, before being
embedded in hypertonic selective agar to facilitate cell wall regeneration
and subsequent colony formation. Frequencies of up to 106 transfor-
mants per mg DNA can be obtained using this technique.4,5
Intact yeast cells can be transformed by treating them with alkali
metal cations (usually lithium), in a procedure analogous to E. coli
transformation6 or by electroporation,7 which involves using a brief
voltage pulse to facilitate entry of DNA molecules into the cells.
Transformation efficiencies obtained using whole cells can be lower
than those obtained using the protoplasting method, but transformed
cells can be spread directly onto selective plates (rather than embedded
in agar) thus facilitating procedures that require the use of colony
screens. These are now the methods of choice both for S. cerevisiae and
P. pastoris.
Transformants are identified by selection. Unlike the dominant anti-
biotic resistance markers used in E. coli transformations, many yeast
selectable markers are genes which complement a specific auxotrophy
(e.g. Leu, His, Trp) and thus require the host cell to contain a recessive,
non-reverting mutation. The most widely used selectable markers and
their chromosomal counterparts are listed in Table 6.2. Further details
of these and other recessive selectable markers can be found on the
Internet.8 The most widely used dominant selectable marker systems are
also included in Table 6.2.
164 Chapter 6
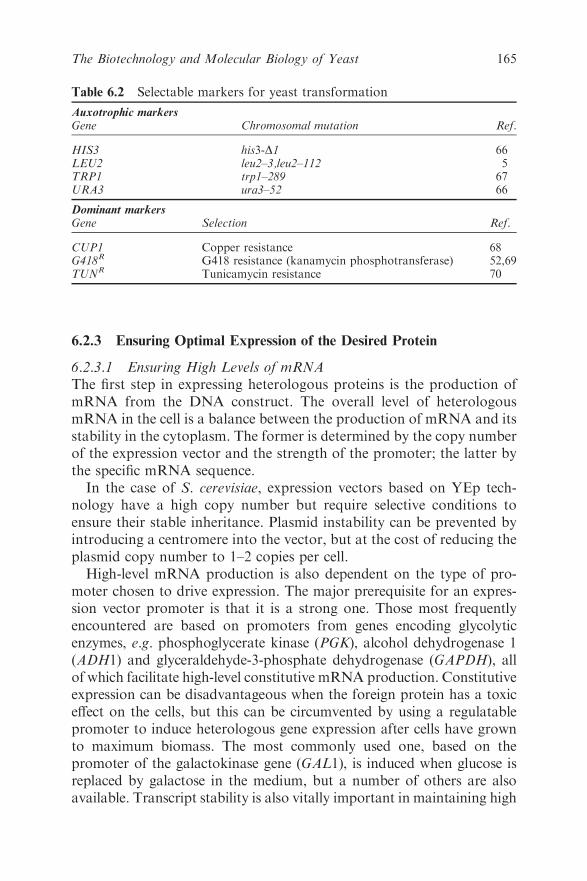
6.2.3 Ensuring Optimal Expression of the Desired Protein
6.2.3.1 Ensuring High Levels of mRNA
The first step in expressing heterologous proteins is the production of
mRNA from the DNA construct. The overall level of heterologous
mRNA in the cell is a balance between the production of mRNA and its
stability in the cytoplasm. The former is determined by the copy number
of the expression vector and the strength of the promoter; the latter by
the specific mRNA sequence.
In the case of S. cerevisiae, expression vectors based on YEp tech-
nology have a high copy number but require selective conditions to
ensure their stable inheritance. Plasmid instability can be prevented by
introducing a centromere into the vector, but at the cost of reducing the
plasmid copy number to 1–2 copies per cell.
High-level mRNA production is also dependent on the type of pro-
moter chosen to drive expression. The major prerequisite for an expres-
sion vector promoter is that it is a strong one. Those most frequently
encountered are based on promoters from genes encoding glycolytic
enzymes, e.g. phosphoglycerate kinase (PGK), alcohol dehydrogenase 1
(ADH1) and glyceraldehyde-3-phosphate dehydrogenase (GAPDH), all
of which facilitate high-level constitutive mRNA production. Constitutive
expression can be disadvantageous when the foreign protein has a toxic
effect on the cells, but this can be circumvented by using a regulatable
promoter to induce heterologous gene expression after cells have grown
to maximum biomass. The most commonly used one, based on the
promoter of the galactokinase gene (GAL1), is induced when glucose is
replaced by galactose in the medium, but a number of others are also
available. Transcript stability is also vitally important in maintaining high
Table 6.2 Selectable markers for yeast transformation
Auxotrophic markersGene Chromosomal mutation Ref.
HIS3 his3-D1 66LEU2 leu2–3,leu2–112 5TRP1 trp1–289 67URA3 ura3–52 66
Dominant markersGene Selection Ref.
CUP1 Copper resistance 68G418R G418 resistance (kanamycin phosphotransferase) 52,69TUNR Tunicamycin resistance 70
165The Biotechnology and Molecular Biology of Yeast

levels of mRNA in the cell. Despite the fact that ‘instability elements’
have been identified,9 mRNA half-lives cannot be accurately predicted
from primary structural information so they must be empirically deter-
mined; unstable transcripts curtail high-level expression. S. cerevisiae
often fails to recognise heterologous transcription termination signals
because its own genes lack typical eukaryotic terminator elements. This
can result in the production of abnormally long mRNA molecules which
are often unstable.10 As this can result in a dramatic drop in heterologous
protein yield,11 expression vectors frequently contain the 30 terminator
region from a yeast gene (e.g. CYC1, PGK or ADH1) to ensure efficient
mRNA termination (Figure 6.1d).
In the case of P. pastoris, the cells can be grown on either on methanol
using an alternative alcohol oxidase locus, in which case the hetero-
logous protein is continuously expressed, or on glucose, in which case
the heterologous gene is repressed until induced by methanol. The tight
level of regulation allows for extremely precise control of the expression
of the heterologous gene. This easily regulated promoter has practical
advantages over the more cumbersome galactose-inducible ones used to
regulate heterologous expression in S. cerevisiae.
6.2.3.2 Ensuring High Levels of Protein
A high level of stable heterologous mRNA does not necessarily guar-
antee a high level of protein production. The protein level depends on
the efficiency with which the mRNA is translated and the stability of the
protein after it has been produced.
The site of translation initiation in 95% of yeast mRNA molecules
corresponds to the first AUG codon at the 50 end of the message. It is
advisable to eliminate regions of dyad symmetry and upstream AUG
triplets in the heterologous mRNA leader sequence to ensure efficient
initiation of translation. The overall context of the sequence on either
side of the AUG codon (with the exception of an A nucleotide at the –3
position) and the leader length do not appear to affect the level of
translation (for a review, see Ref. 12).
Achieving high-level transcription and translation of a heterologous
gene in any expression system does not necessarily guarantee the
recovery of large amounts of heterologous gene product: Some proteins
are degraded during cell breakage and subsequent purification; others
are rapidly turned over in the cell. The powerful tools provided by a
detailed knowledge of yeast molecular biology can be exploited to
minimise this. Genes for proteolytic enzymes can be inactivated either
by mutation or the presence of protease inhibitors during extraction. A
166 Chapter 6
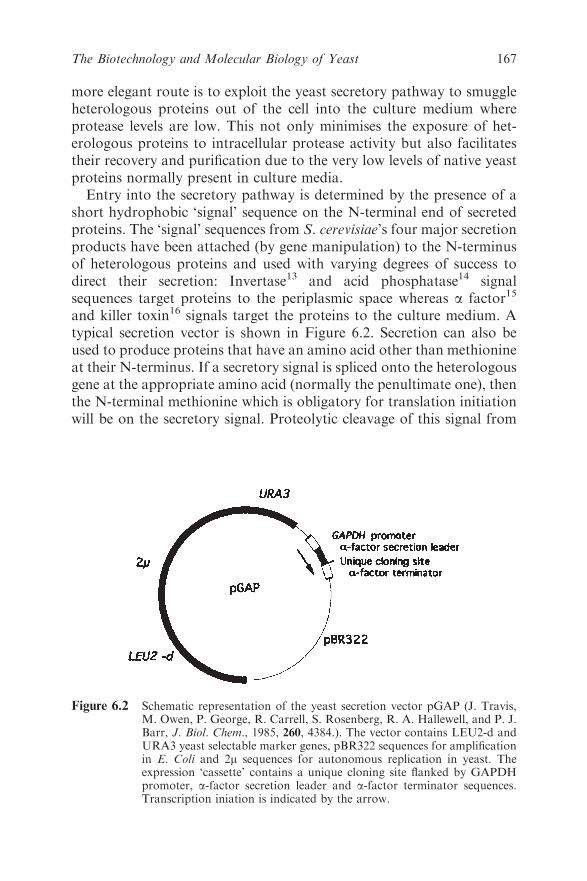
more elegant route is to exploit the yeast secretory pathway to smuggle
heterologous proteins out of the cell into the culture medium where
protease levels are low. This not only minimises the exposure of het-
erologous proteins to intracellular protease activity but also facilitates
their recovery and purification due to the very low levels of native yeast
proteins normally present in culture media.
Entry into the secretory pathway is determined by the presence of a
short hydrophobic ‘signal’ sequence on the N-terminal end of secreted
proteins. The ‘signal’ sequences from S. cerevisiae’s four major secretion
products have been attached (by gene manipulation) to the N-terminus
of heterologous proteins and used with varying degrees of success to
direct their secretion: Invertase13 and acid phosphatase14 signal
sequences target proteins to the periplasmic space whereas a factor15
and killer toxin16 signals target the proteins to the culture medium. A
typical secretion vector is shown in Figure 6.2. Secretion can also be
used to produce proteins that have an amino acid other than methionine
at their N-terminus. If a secretory signal is spliced onto the heterologous
gene at the appropriate amino acid (normally the penultimate one), then
the N-terminal methionine which is obligatory for translation initiation
will be on the secretory signal. Proteolytic cleavage of this signal from
Figure 6.2 Schematic representation of the yeast secretion vector pGAP (J. Travis,M. Owen, P. George, R. Carrell, S. Rosenberg, R. A. Hallewell, and P. J.Barr, J. Biol. Chem., 1985, 260, 4384.). The vector contains LEU2-d andURA3 yeast selectable marker genes, pBR322 sequences for amplificationin E. Coli and 2m sequences for autonomous replication in yeast. Theexpression ‘cassette’ contains a unique cloning site flanked by GAPDHpromoter, a-factor secretion leader and a-factor terminator sequences.Transcription iniation is indicated by the arrow.
167The Biotechnology and Molecular Biology of Yeast

the heterologous protein in the endoplasmic reticulum (ER) will gene-
rate an authentic N-terminal amino acid (Figure 6.3).
Heterologous proteins can also be secreted from P. pastoris and the
most widely used secretion signal sequences include the S. cerevisiae
a factor prepro sequence and the signal sequence from Pichia’s own acid
phosphatase gene.
6.2.3.3 Obtaining the Appropriate Protein Structure and Function
The objective of heterologous gene expression is the high-level pro-
duction of biologically active, authentic protein molecules. It is
therefore important to consider the nature of the final product
when choosing the expression system. The protein size, hydrophobicity,
normal cellular location, needed for post-translational modification(s)
and ultimate use, must be assessed before an appropriate expression
system is chosen.
The secretory pathway is often chosen for heterologous protein
production because apart from the fact that it enhances protein stability
and can generate proteins lacking an N-terminal methionine, secretion
facilitates the accurate folding of large proteins and contains the
machinery for post-translational modification. A direct comparison
Signal sequence Heterologous protein
MET
N-terminus
Processing
Secretion
Mature protein
Figure 6.3 Schematic diagram showing the secretion of a heterologous protein usinga signal sequence. Cleavage of the secretory signal in the endoplasmicreticulum removes the N-terminal methionine, thereby generating aheterologous protein with an authentic N-terminal amino acid.
168 Chapter 6
between the intracellular production and extracellular secretion of
prochymosin and human serum albumin resulted in the recovery of
small quantities of mostly insoluble, inactive protein when they were
produced intracellularly, but the recovery of soluble, correctly folded,
fully active protein when they were secreted.17,18
The biological activity and/or stability of heterologous proteins
can also be affected by the post-translational addition of carbo-
hydrate molecules to specific amino acid residues. Glycosylation in yeast
is of both the N-linked (via an asparagine amide) and O-linked (via a
serine or threonine hydroxyl) types, occurring at the sequences Asn–
X–Ser/Thr and Thr/Ser, respectively. Inner core N-linked glycosy-
lation occurs in the ER and outer core glycosylation in the Golgi
apparatus. However, it is important to note that the number and type
of outer core carbohydrates attached to glycosylated proteins in yeast
are different to those found on mammalian proteins. In many cases
these differences can be tolerated, but if the protein is being produced
for therapeutic purposes they may cause unacceptable immunogeni-
city problems. One approach to overcoming this problem is to remove
the glycosylation recognition site by site-directed mutagenesis. This
strategy was successfully used to produce urokinase type plasminogen
activator.19
Despite the advantages that secretion offers for the production of
heterologous proteins in yeast, higher overall levels of protein produc-
tion are often possible using intracellular expression. Some proteins
form insoluble complexes when expressed intracellularly in S. cerevisiae
but many others do not. Human superoxide dismutase was recovered as
a soluble active protein after expression in yeast. It was also efficiently
acetylated at the N-terminus to produce a protein identical with that
found in human tissue.20 Other proteins can be produced as denatured,
intracellular complexes which can be disaggregated and renatured after
harvesting. The first recombinant DNA product to reach the market was
a hepatitis B vaccine produced in this way.21
P. pastoris is regarded as a more efficient and more faithful glyco-
sylator of secreted proteins. Many proteins of therapeutic importance
have been successfully made using both intracellular and extracellular
production in Pichia. These include proteins involved in the preven-
tion and treatment of clots, peptide hormones and cytokines and
protein vaccines including a hepatitis B vaccine, which is already on the
market.
However, many proteins of interest require complex post-transla-
tional modification and yeast is a primitive eukaryote unable to effect
169The Biotechnology and Molecular Biology of Yeast
those molecular changes. However, as will be seen in the following
section, molecular biologists are currently developing a whole series of
yeast strains that have been genetically manipulated so that they have
modified and/or completely new biochemical pathways.
6.3 FROM RE-ENGINEERING GENOMES TO
CONSTRUCTING NOVEL SIGNAL AND
BIOCHEMICAL PATHWAYS
However, the contribution of yeast to biotechnology and molecular
biology extends far beyond the production of heterologous proteins. The
ease with which yeast cells can be genetically manipulated, coupled with
yeast’s homologous recombination system, makes it one of the most
versatile eukaryotic cloning systems, thereby facilitating the large-scale
manipulation of genetic material needed in order to produce re-engineered
mammals and even synthetic life forms. Moreover, as a simple unicellular
eukaryote, S. cerevisiae has many of the basic biochemical pathways
found in complex multicellular organisms including cell to cell signalling.
Therefore, in addition to use as a host cell for the manipulating extra-
large DNA molecules, the cell itself can be genetically modified so that it
can generate novel signal and biochemical pathways. These include
genetically engineering novel biological reporter systems that facilitate the
analysis of human hormone and brain receptors and the in vivo analysis
of protein–protein interactions from a huge variety of organisms, and re-
engineering numerous metabolic pathways for the production of novel
biochemical products, including ‘humanised’ glycosylation of hetero-
logous proteins.
6.3.1 Large-scale Manipulation of Mammalian and Bacterial DNA
Our detailed knowledge of yeast molecular biology, coupled with the
versatility of its genetic manipulation, led to the development of novel
and indeed extremely powerful cloning vectors.
6.3.1.1 Cloning Extra-large Segments of DNA
Yeast artificial chromosomes (YACs) are specialised vectors capable of
accommodating extremely large fragments of DNA (100–1000kb).22
Schematic diagrams of a YAC and its use as a cloning system are
shown in Figure 6.4. YACs contain a centromere, an autonomously
replicating sequence, two telomeres and two yeast selectable markers
separated by a unique restriction site. They also contain sequences
170 Chapter 6
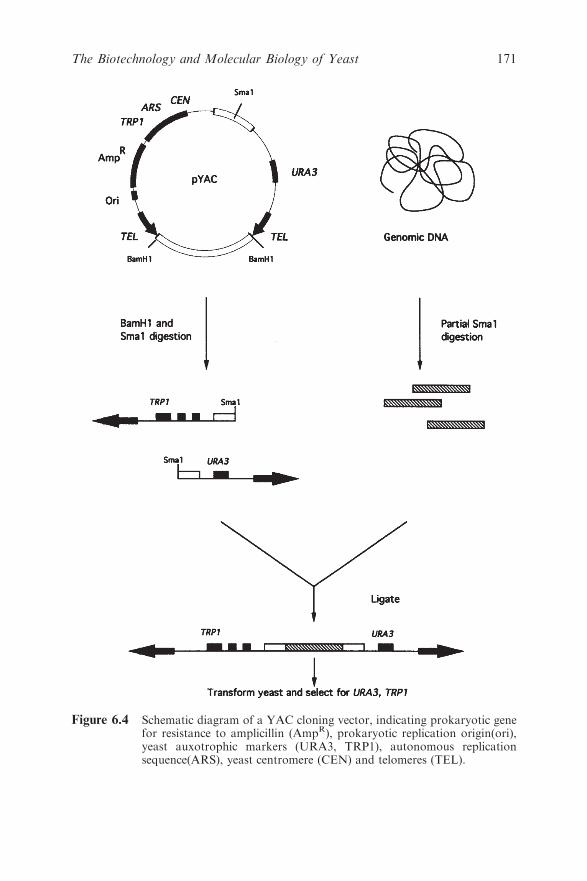
Figure 6.4 Schematic diagram of a YAC cloning vector, indicating prokaryotic genefor resistance to amplicillin (AmpR), prokaryotic replication origin(ori),yeast auxotrophic markers (URA3, TRP1), autonomous replicationsequence(ARS), yeast centromere (CEN) and telomeres (TEL).
171The Biotechnology and Molecular Biology of Yeast
for replication and selection in E. coli. YACs are linear molecules
when propagated in yeast but must be circularised by a short DNA
sequence between the tips of the telomeres for propagation in bacteria.
When used as a cloning vehicle, the YAC is cleaved with restriction
enzymes to generate two telomeric arms carrying different yeast select-
able markers. These arms are then ligated to suitably digested DNA
fragments, transformed into a yeast host and maintained as a mini-
chromosome.
YACs have become indispensable tools for mapping complex
genomes such as the human genome23 because they accommodate
much larger fragments of DNA than bacteriophage or cosmid cloning
systems, thus simplifying the ordering of the human genome library. The
complete library can be contained in approximately 10 000 clones, cut-
ting by a factor of five the number of clones required by other vector
systems.
6.3.1.2 Manipulating Mammals
Once a YAC has been successfully transformed into a yeast cell, the
highly efficient homologous recombination system of S. cerevisiae can be
exploited in vivo to manipulate extensively both YAC vector sequences
(retrofitting) and their inserts.24 For example, homologous recombina-
tion can be used to retrofit mammalian selectable markers into the
vector arms and/or introduce specific mutations into any genomic
sequence carried in a YAC, thus generating artificial chromosomes that
can be used in the production of transgenic mice (Figure 6.5). A linear
DNA fragment consisting of neomycin resistance and LYS2 genes
sandwiched between the 50 and 30 ends of theURA3 gene can be targeted
into the URA3 locus on the right arm of the YAC. Homologous
recombination at this locus, which can be selected for by selecting for
transformants on a lysine-deficient medium, generates a useful uracil
minus phenotype and introduces a mammalian selectable marker into
the construct.
Homologous recombination and the selectable/counter selectable nat-
ure of the uracil phenotype can then be used to introduce desired muta-
tions into the heterologous DNA carried in the YAC (Figure 6.6A,B): a
URA3 gene is inserted close to a suitably mutated site in a sub-clone of the
relevant section of the gene of interest. This is then cut from the plasmid
and used to transform yeast. Homologous recombination of the mutated
version of the gene into the DNA inserted into the YAC insert is selected
for by simply growing the yeast cells on medium lacking uracil. Removal
172 Chapter 6

Figure 6.5 Schematic diagram showing the integration of linear yeast DNA into ahomologous region of chromosomal DNA carried in a YAC. A linearfragment of DNA carrying the neomycin resistance gene (NeoR) and theLYS2 gene flanked by URA3 gene sequences is isolated from plasmidDNA and transformed into the YAC carrying yeast strain. Homologousrecombination events which result in the replacement of the wild-type(URA3) gene on the right arm of the YAC with this linear fragment areselected for by growth on lysine deficient medium.
173The Biotechnology and Molecular Biology of Yeast

Figure 6.6 Schematic diagram showing the introduction of a desired mutation into aheterologous gene X carried in a YAC. (A) The URA3 gene is insertedinto a suitably mutated subclone of gene X (the astrisk indicates amutation in the gene DNA sequence). Homologous recombination andco-selection with URA3 is then used to introduce this mutation into theYAC insert. (B) Homologous recombination using the mutated subclonewithout the URA3 gene and counterselecting on FOA medium is thenused to generate a specifically mutated version of gene X.
174 Chapter 6
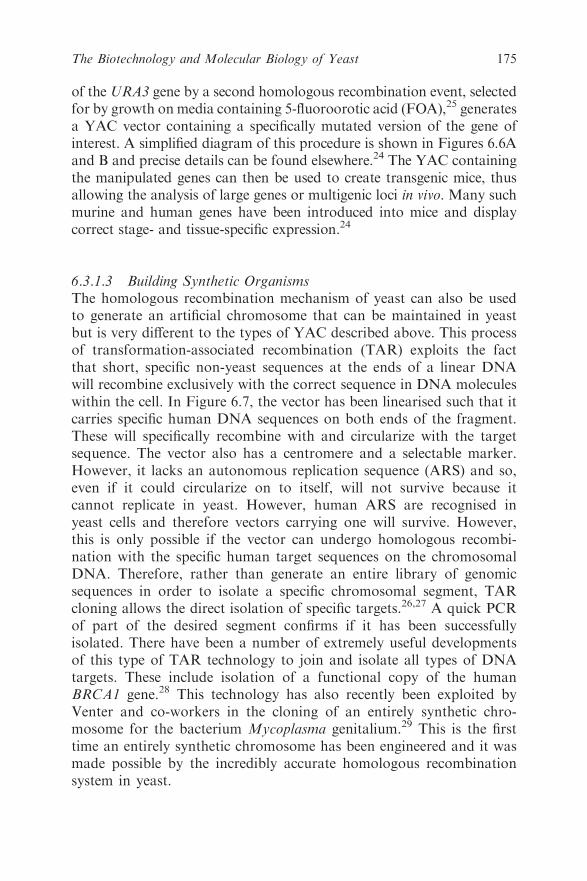
of the URA3 gene by a second homologous recombination event, selected
for by growth on media containing 5-fluoroorotic acid (FOA),25 generates
a YAC vector containing a specifically mutated version of the gene of
interest. A simplified diagram of this procedure is shown in Figures 6.6A
and B and precise details can be found elsewhere.24 The YAC containing
the manipulated genes can then be used to create transgenic mice, thus
allowing the analysis of large genes or multigenic loci in vivo. Many such
murine and human genes have been introduced into mice and display
correct stage- and tissue-specific expression.24
6.3.1.3 Building Synthetic Organisms
The homologous recombination mechanism of yeast can also be used
to generate an artificial chromosome that can be maintained in yeast
but is very different to the types of YAC described above. This process
of transformation-associated recombination (TAR) exploits the fact
that short, specific non-yeast sequences at the ends of a linear DNA
will recombine exclusively with the correct sequence in DNA molecules
within the cell. In Figure 6.7, the vector has been linearised such that it
carries specific human DNA sequences on both ends of the fragment.
These will specifically recombine with and circularize with the target
sequence. The vector also has a centromere and a selectable marker.
However, it lacks an autonomous replication sequence (ARS) and so,
even if it could circularize on to itself, will not survive because it
cannot replicate in yeast. However, human ARS are recognised in
yeast cells and therefore vectors carrying one will survive. However,
this is only possible if the vector can undergo homologous recombi-
nation with the specific human target sequences on the chromosomal
DNA. Therefore, rather than generate an entire library of genomic
sequences in order to isolate a specific chromosomal segment, TAR
cloning allows the direct isolation of specific targets.26,27 A quick PCR
of part of the desired segment confirms if it has been successfully
isolated. There have been a number of extremely useful developments
of this type of TAR technology to join and isolate all types of DNA
targets. These include isolation of a functional copy of the human
BRCA1 gene.28 This technology has also recently been exploited by
Venter and co-workers in the cloning of an entirely synthetic chro-
mosome for the bacterium Mycoplasma genitalium.29 This is the first
time an entirely synthetic chromosome has been engineered and it was
made possible by the incredibly accurate homologous recombination
system in yeast.
175The Biotechnology and Molecular Biology of Yeast

6.3.2 Novel Biological Reporter Systems
Our extensive understanding of the biochemistry and molecular biology
of yeast cells has resulted in the development of a number of imaginative
manipulations of promoter elements, transcription factors and signal
cascade proteins to transduce molecular interactions into easily score-
able yeast phenotypes.
6.3.2.1 A Yeast-based Reporter for Human Brain Receptor Activity
Yeast cells have been manipulated to provide a ‘readout’ of heterologous
G-protein-coupled receptor (GPCR) activity: The well-characterised
ARS
sequence
3’ end
Genomic DNA
Diagnostic
sequence
CEN
Selectable
marker TAR vector
5’ end
Figure 6.7 Isolation of a specific fragment of geonomic DNA by exploiting Trans-formation-Associated Recombination (TAR). Random segments ofgenomic DNA are co-transformed into yeast with a linearised vectorwhich lacks an autonomous replication sequence (ARS). The linearisedvector carries a centromere, selectable marker and two specific targetssequences. Site specific recombination creates an artificial chromosomeconsisting of the yeast vector and the targeted fragment of genomic DNA,which supplies an ARS thereby allowing re-circularised vectors carryingan insert to replicate in the yeast cell. A simple PCR reaction is then usedto confirm that the appropriate segment has been successfully recombinedinto the linear vector.
176 Chapter 6
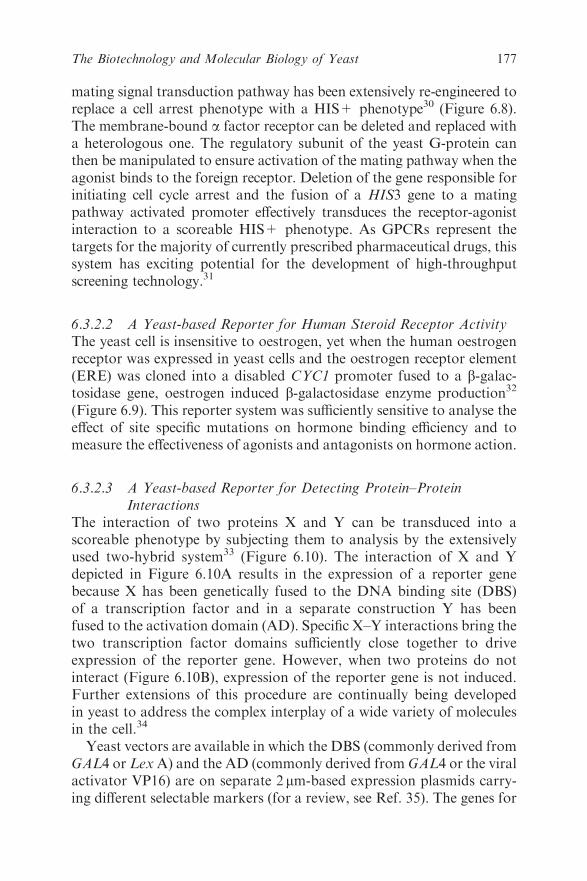
mating signal transduction pathway has been extensively re-engineered to
replace a cell arrest phenotype with a HIS+ phenotype30 (Figure 6.8).
The membrane-bound a factor receptor can be deleted and replaced with
a heterologous one. The regulatory subunit of the yeast G-protein can
then be manipulated to ensure activation of the mating pathway when the
agonist binds to the foreign receptor. Deletion of the gene responsible for
initiating cell cycle arrest and the fusion of a HIS3 gene to a mating
pathway activated promoter effectively transduces the receptor-agonist
interaction to a scoreable HIS+ phenotype. As GPCRs represent the
targets for the majority of currently prescribed pharmaceutical drugs, this
system has exciting potential for the development of high-throughput
screening technology.31
6.3.2.2 A Yeast-based Reporter for Human Steroid Receptor Activity
The yeast cell is insensitive to oestrogen, yet when the human oestrogen
receptor was expressed in yeast cells and the oestrogen receptor element
(ERE) was cloned into a disabled CYC1 promoter fused to a b-galac-
tosidase gene, oestrogen induced b-galactosidase enzyme production32
(Figure 6.9). This reporter system was sufficiently sensitive to analyse the
effect of site specific mutations on hormone binding efficiency and to
measure the effectiveness of agonists and antagonists on hormone action.
6.3.2.3 A Yeast-based Reporter for Detecting Protein–Protein
Interactions
The interaction of two proteins X and Y can be transduced into a
scoreable phenotype by subjecting them to analysis by the extensively
used two-hybrid system33 (Figure 6.10). The interaction of X and Y
depicted in Figure 6.10A results in the expression of a reporter gene
because X has been genetically fused to the DNA binding site (DBS)
of a transcription factor and in a separate construction Y has been
fused to the activation domain (AD). Specific X–Y interactions bring the
two transcription factor domains sufficiently close together to drive
expression of the reporter gene. However, when two proteins do not
interact (Figure 6.10B), expression of the reporter gene is not induced.
Further extensions of this procedure are continually being developed
in yeast to address the complex interplay of a wide variety of molecules
in the cell.34
Yeast vectors are available in which the DBS (commonly derived from
GAL4 or LexA) and the AD (commonly derived from GAL4 or the viral
activator VP16) are on separate 2 mm-based expression plasmids carry-
ing different selectable markers (for a review, see Ref. 35). The genes for
177The Biotechnology and Molecular Biology of Yeast
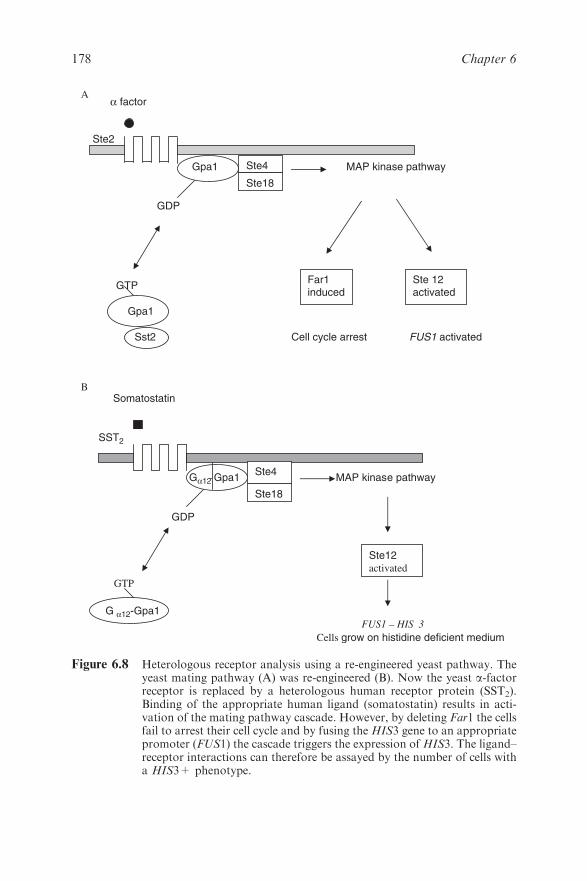
Aα factor
Ste2
Gpa1 MAP kinase pathway
GDP
GTP
Gpa1
Sst2 Cell cycle arrest FUS1 activated
B Somatostatin
SST2
Gα12-Gpa1 MAP kinase pathway
GDP
GTP
G α12-Gpa1
FUS1 – HIS 3
Cells grow on histidine deficient medium
Far1 induced
Ste4
Ste18
Ste4
Ste18
Ste12 activated
Ste 12 activated
Figure 6.8 Heterologous receptor analysis using a re-engineered yeast pathway. Theyeast mating pathway (A) was re-engineered (B). Now the yeast a-factorreceptor is replaced by a heterologous human receptor protein (SST2).Binding of the appropriate human ligand (somatostatin) results in acti-vation of the mating pathway cascade. However, by deleting Far1 the cellsfail to arrest their cell cycle and by fusing theHIS3 gene to an appropriatepromoter (FUS1) the cascade triggers the expression of HIS3. The ligand–receptor interactions can therefore be assayed by the number of cells witha HIS3+ phenotype.
178 Chapter 6

the proteins under analysis are inserted into these specific vectors and
the plasmids are co-transformed into a suitable yeast host. Expression
from a reporter gene (e.g. LacZ, HIS3, LEU2 or URA3) is used to test
for a proposed protein interaction; to establish the effect of site-directed
mutagenesis on previously characterised interacting proteins, or X may
be used as a bait to trap unknown interacting Ys from an expression
library fused to the AD. The two hybrid system has been successfully
applied to study a broad spectrum of protein–protein interactions from
a wide variety of different species.36
6.3.3 Novel Biochemical Products Include Humanised EPO
Not only does the homologous recombination system allow for exten-
sive re-engineering of YAC vectors and their inserts, it also provides a
mechanism for the targeted deletion of individual genes within the
genome of the yeast host cells. This allows scientists to modify existing
biochemical pathways by deleting native genes, and transforming in
B
URA 3 ERE ERE CYC1 LACZ
A
GPD promoter
hER cDNA(800bp)
PGK terminator
TRP1
YEpER
amp r
2� ori
Figure 6.9 Analysis of oestrogen receptor protein. In the presence of oestrogen thereceptor protein expressed from YEpER (A) binds to the oestrogenresponse elements in the promoter of the LACZ gene (B). The level of b-galactosidase activity can therefore be used to assay the effect of moleculesthat interfere with/accentuate the hormone–receptor interaction.
179The Biotechnology and Molecular Biology of Yeast
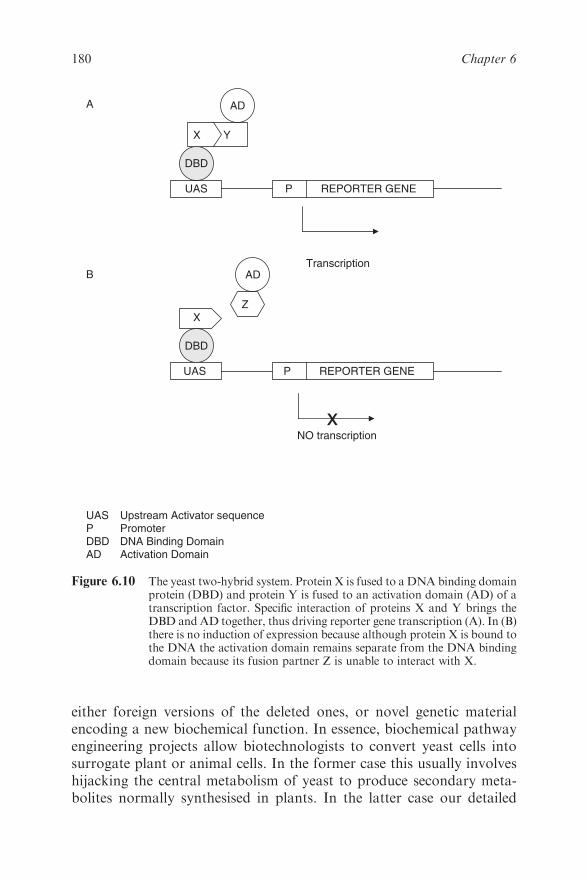
either foreign versions of the deleted ones, or novel genetic material
encoding a new biochemical function. In essence, biochemical pathway
engineering projects allow biotechnologists to convert yeast cells into
surrogate plant or animal cells. In the former case this usually involves
hijacking the central metabolism of yeast to produce secondary meta-
bolites normally synthesised in plants. In the latter case our detailed
x
A AD
X Y
DBD
UAS P REPORTER GENE
Transcription B
Z X
DBD
UAS P REPORTER GENE
NO transcription
UAS Upstream Activator sequenceP Promoter DBD DNA Binding Domain AD Activation Domain
AD
Figure 6.10 The yeast two-hybrid system. Protein X is fused to a DNA binding domainprotein (DBD) and protein Y is fused to an activation domain (AD) of atranscription factor. Specific interaction of proteins X and Y brings theDBD and AD together, thus driving reporter gene transcription (A). In (B)there is no induction of expression because although protein X is bound tothe DNA the activation domain remains separate from the DNA bindingdomain because its fusion partner Z is unable to interact with X.
180 Chapter 6
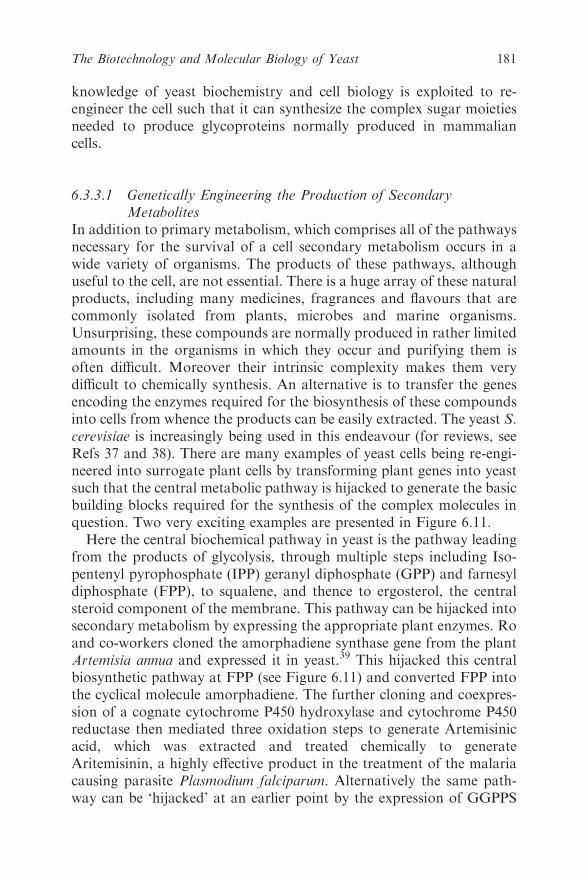
knowledge of yeast biochemistry and cell biology is exploited to re-
engineer the cell such that it can synthesize the complex sugar moieties
needed to produce glycoproteins normally produced in mammalian
cells.
6.3.3.1 Genetically Engineering the Production of Secondary
Metabolites
In addition to primary metabolism, which comprises all of the pathways
necessary for the survival of a cell secondary metabolism occurs in a
wide variety of organisms. The products of these pathways, although
useful to the cell, are not essential. There is a huge array of these natural
products, including many medicines, fragrances and flavours that are
commonly isolated from plants, microbes and marine organisms.
Unsurprising, these compounds are normally produced in rather limited
amounts in the organisms in which they occur and purifying them is
often difficult. Moreover their intrinsic complexity makes them very
difficult to chemically synthesis. An alternative is to transfer the genes
encoding the enzymes required for the biosynthesis of these compounds
into cells from whence the products can be easily extracted. The yeast S.
cerevisiae is increasingly being used in this endeavour (for reviews, see
Refs 37 and 38). There are many examples of yeast cells being re-engi-
neered into surrogate plant cells by transforming plant genes into yeast
such that the central metabolic pathway is hijacked to generate the basic
building blocks required for the synthesis of the complex molecules in
question. Two very exciting examples are presented in Figure 6.11.
Here the central biochemical pathway in yeast is the pathway leading
from the products of glycolysis, through multiple steps including Iso-
pentenyl pyrophosphate (IPP) geranyl diphosphate (GPP) and farnesyl
diphosphate (FPP), to squalene, and thence to ergosterol, the central
steroid component of the membrane. This pathway can be hijacked into
secondary metabolism by expressing the appropriate plant enzymes. Ro
and co-workers cloned the amorphadiene synthase gene from the plant
Artemisia annua and expressed it in yeast.39 This hijacked this central
biosynthetic pathway at FPP (see Figure 6.11) and converted FPP into
the cyclical molecule amorphadiene. The further cloning and coexpres-
sion of a cognate cytochrome P450 hydroxylase and cytochrome P450
reductase then mediated three oxidation steps to generate Artemisinic
acid, which was extracted and treated chemically to generate
Aritemisinin, a highly effective product in the treatment of the malaria
causing parasite Plasmodium falciparum. Alternatively the same path-
way can be ‘hijacked’ at an earlier point by the expression of GGPPS
181The Biotechnology and Molecular Biology of Yeast
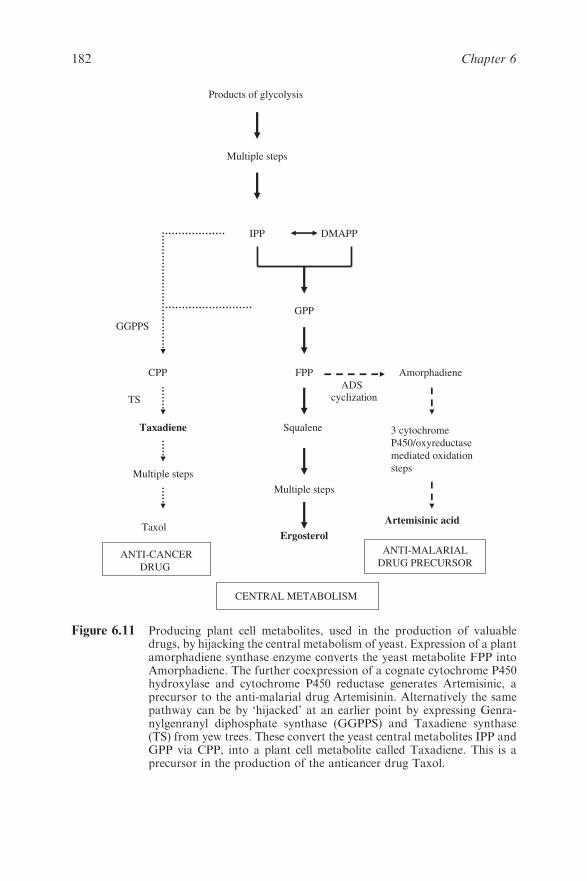
Products of glycolysis
Multiple steps
IPP DMAPP
GPP
GGPPS
CPP FPP Amorphadiene
ADS cyclization
Taxadiene Squalene
Multiple steps
Multiple steps
Artemisinic acid
Ergosterol
ANTI-MALARIAL
DRUG PRECURSOR
CENTRAL METABOLISM
3 cytochrome
P450/oxyreductase
mediated oxidation
steps
Taxol
TS
ANTI-CANCER
DRUG
Figure 6.11 Producing plant cell metabolites, used in the production of valuabledrugs, by hijacking the central metabolism of yeast. Expression of a plantamorphadiene synthase enzyme converts the yeast metabolite FPP intoAmorphadiene. The further coexpression of a cognate cytochrome P450hydroxylase and cytochrome P450 reductase generates Artemisinic, aprecursor to the anti-malarial drug Artemisinin. Alternatively the samepathway can be by ‘hijacked’ at an earlier point by expressing Genra-nylgenranyl diphosphate synthase (GGPPS) and Taxadiene synthase(TS) from yew trees. These convert the yeast central metabolites IPP andGPP via CPP, into a plant cell metabolite called Taxadiene. This is aprecursor in the production of the anticancer drug Taxol.
182 Chapter 6
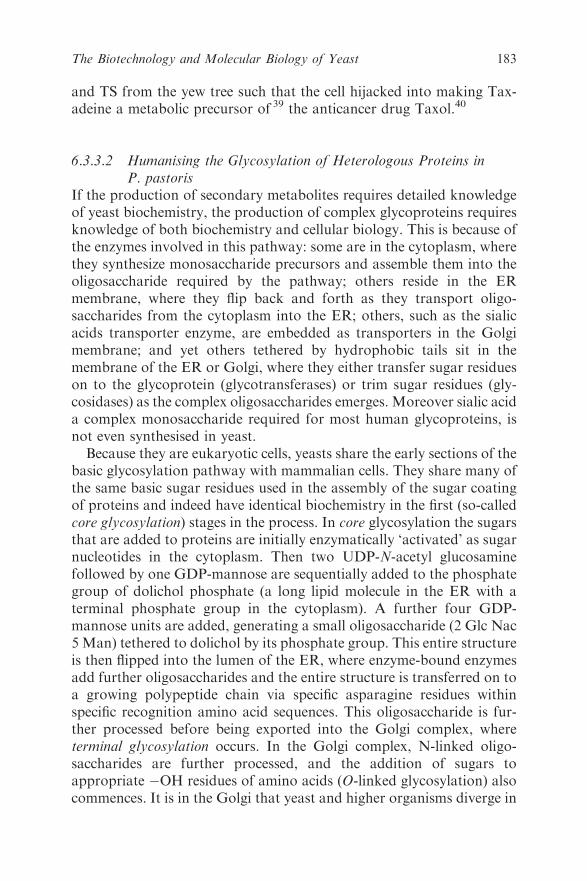
and TS from the yew tree such that the cell hijacked into making Tax-
adeine a metabolic precursor of 39 the anticancer drug Taxol.40
6.3.3.2 Humanising the Glycosylation of Heterologous Proteins in
P. pastoris
If the production of secondary metabolites requires detailed knowledge
of yeast biochemistry, the production of complex glycoproteins requires
knowledge of both biochemistry and cellular biology. This is because of
the enzymes involved in this pathway: some are in the cytoplasm, where
they synthesize monosaccharide precursors and assemble them into the
oligosaccharide required by the pathway; others reside in the ER
membrane, where they flip back and forth as they transport oligo-
saccharides from the cytoplasm into the ER; others, such as the sialic
acids transporter enzyme, are embedded as transporters in the Golgi
membrane; and yet others tethered by hydrophobic tails sit in the
membrane of the ER or Golgi, where they either transfer sugar residues
on to the glycoprotein (glycotransferases) or trim sugar residues (gly-
cosidases) as the complex oligosaccharides emerges. Moreover sialic acid
a complex monosaccharide required for most human glycoproteins, is
not even synthesised in yeast.
Because they are eukaryotic cells, yeasts share the early sections of the
basic glycosylation pathway with mammalian cells. They share many of
the same basic sugar residues used in the assembly of the sugar coating
of proteins and indeed have identical biochemistry in the first (so-called
core glycosylation) stages in the process. In core glycosylation the sugars
that are added to proteins are initially enzymatically ‘activated’ as sugar
nucleotides in the cytoplasm. Then two UDP-N-acetyl glucosamine
followed by one GDP-mannose are sequentially added to the phosphate
group of dolichol phosphate (a long lipid molecule in the ER with a
terminal phosphate group in the cytoplasm). A further four GDP-
mannose units are added, generating a small oligosaccharide (2 Glc Nac
5 Man) tethered to dolichol by its phosphate group. This entire structure
is then flipped into the lumen of the ER, where enzyme-bound enzymes
add further oligosaccharides and the entire structure is transferred on to
a growing polypeptide chain via specific asparagine residues within
specific recognition amino acid sequences. This oligosaccharide is fur-
ther processed before being exported into the Golgi complex, where
terminal glycosylation occurs. In the Golgi complex, N-linked oligo-
saccharides are further processed, and the addition of sugars to
appropriate �OH residues of amino acids (O-linked glycosylation) also
commences. It is in the Golgi that yeast and higher organisms diverge in
183The Biotechnology and Molecular Biology of Yeast
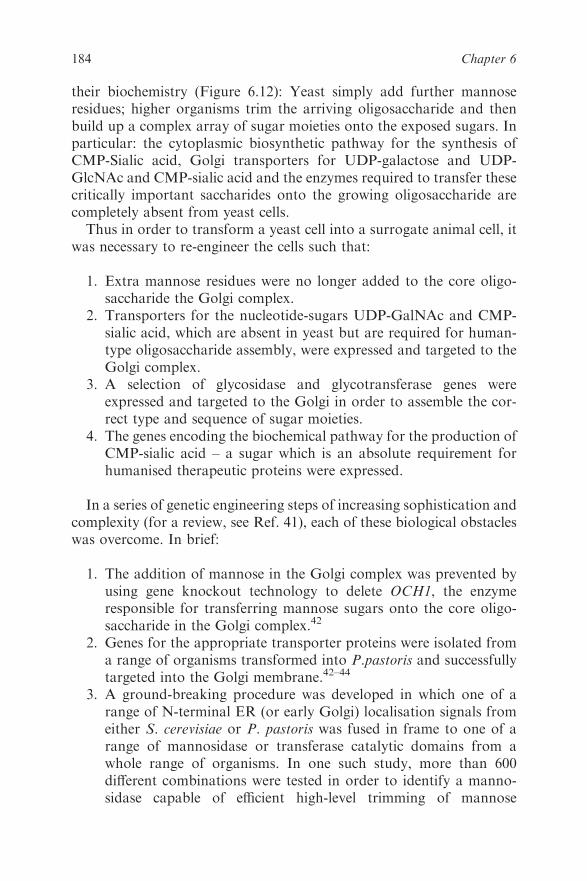
their biochemistry (Figure 6.12): Yeast simply add further mannose
residues; higher organisms trim the arriving oligosaccharide and then
build up a complex array of sugar moieties onto the exposed sugars. In
particular: the cytoplasmic biosynthetic pathway for the synthesis of
CMP-Sialic acid, Golgi transporters for UDP-galactose and UDP-
GlcNAc and CMP-sialic acid and the enzymes required to transfer these
critically important saccharides onto the growing oligosaccharide are
completely absent from yeast cells.
Thus in order to transform a yeast cell into a surrogate animal cell, it
was necessary to re-engineer the cells such that:
1. Extra mannose residues were no longer added to the core oligo-
saccharide the Golgi complex.
2. Transporters for the nucleotide-sugars UDP-GalNAc and CMP-
sialic acid, which are absent in yeast but are required for human-
type oligosaccharide assembly, were expressed and targeted to the
Golgi complex.
3. A selection of glycosidase and glycotransferase genes were
expressed and targeted to the Golgi in order to assemble the cor-
rect type and sequence of sugar moieties.
4. The genes encoding the biochemical pathway for the production of
CMP-sialic acid – a sugar which is an absolute requirement for
humanised therapeutic proteins were expressed.
In a series of genetic engineering steps of increasing sophistication and
complexity (for a review, see Ref. 41), each of these biological obstacles
was overcome. In brief:
1. The addition of mannose in the Golgi complex was prevented by
using gene knockout technology to delete OCH1, the enzyme
responsible for transferring mannose sugars onto the core oligo-
saccharide in the Golgi complex.42
2. Genes for the appropriate transporter proteins were isolated from
a range of organisms transformed into P.pastoris and successfully
targeted into the Golgi membrane.42–44
3. A ground-breaking procedure was developed in which one of a
range of N-terminal ER (or early Golgi) localisation signals from
either S. cerevisiae or P. pastoris was fused in frame to one of a
range of mannosidase or transferase catalytic domains from a
whole range of organisms. In one such study, more than 600
different combinations were tested in order to identify a manno-
sidase capable of efficient high-level trimming of mannose
184 Chapter 6
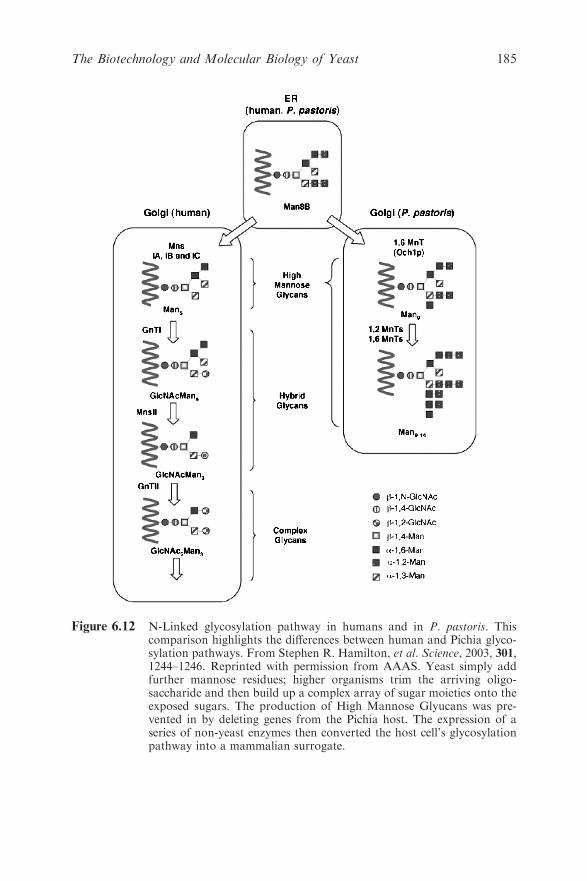
Figure 6.12 N-Linked glycosylation pathway in humans and in P. pastoris. Thiscomparison highlights the differences between human and Pichia glyco-sylation pathways. From Stephen R. Hamilton, et al. Science, 2003, 301,1244–1246. Reprinted with permission from AAAS. Yeast simply addfurther mannose residues; higher organisms trim the arriving oligo-saccharide and then build up a complex array of sugar moieties onto theexposed sugars. The production of High Mannose Glyucans was pre-vented in by deleting genes from the Pichia host. The expression of aseries of non-yeast enzymes then converted the host cell’s glycosylationpathway into a mammalian surrogate.
185The Biotechnology and Molecular Biology of Yeast
residues.42 In the same study, a transfer enzyme (GnT1) capable of
adding UDP-GlcNAc to oligosaccharides in the Golgi complex
was isolated by screening a series of 67 different protein fusions
engineered between fungal Golgi localisation signal peptides and
GnT1catalytic domains from a range of higher organisms.42 The
same group later developed a more complex glycosylation pathway
by adding a further two eukaryotic enzymes using the same
strategy of creating chimeric proteins consisting of fungal leader
sequences fused to catalytic domains.43
4. Finally, the same group expressed the genes for four human
enzymes which modify nucleotide-sugars UDP-GlcNAc into the
human specific CMP-sialic acid in the cytoplasm and then trans-
port it into the Golgi complex. They finally ensured the addition of
the terminal sialic acid residues on to the mature glycoprotein by
successfully targeting a sialyltransferase/yeast-leader chimeric
protein into the Golgi.44
This generated a yeast cell which has been genetically engineered by
the deletion of native genes and the addition of 14 new genes, with the
latter being generated using DNA sequences from nine different
organisms including three yeast species, the fruit fly, mouse, rat and
human, in order to generate a fully humanised glycosylation pattern of
heterologous human proteins. It has already been used to express EPO,
which has been shown to have the same biological effects as EPO of
human origin.44 This yeast has also been used to express human anti-
bodies with extremely accurate and reproducible glycosylation pat-
terns45 – much more consistent in fact than mammalian cell cultures,
which produce natural variability in the glycans on expressed proteins
due to multiple enzymes competing for the same transient glycan
structure. Not only do these yeast cells outshine mammalian cells in
terms of expressing human proteins with reproducible glycosylation
patterns but, because different yeast strains have been engineered with
different combinations of glycosylation enzymes, work can now begin to
study how these sugar moieties, which are major determinants in the
effector function of these complex molecules, mediate a whole range of
immune responses.
Finally, following the successful assembly of this complex humanised
N-linked glycosylation pathway, the less well characterised O-linked
glycosylation pathway is currently being re-engineered46 in S. cerevisiae.
Although this has just recently begun, giant strides have been made in
that direction already.
186 Chapter 6
6.4 YEAST AS A PARADIGM OF EUKARYOTIC
CELLULAR BIOLOGY
Most fundamental cellular functions are conserved from yeast to
humans. Therefore, not surprisingly, as the first eukaryotic organism to
have its entire genome sequenced (for a review, see Ref. 47), S. cerevisiae
is currently in the process of providing a unique insight into eukaryotic
cell biology. Shortly after the genome was sequenced, yeast geneticists
set about using homologous recombination to knock out each indivi-
dual reading frame to identify what each gene did. These gene knock-
outs provided unparalleled insight into basic eukaryotic cellular biology
– the most dramatic revelation being that many gene deletions could be
well tolerated in the haploid yeast cell revealing the robustness of bio-
logical systems. S. cerevisiae was thereafter used as the model eukaryote
in which to develop methods of globally monitoring cellular mRNAs,
proteins, metabolites and the myriad interactions of these cellular
molecules. Currently it is the organism in which all of this information is
being combined with decades of insight gleaned from the literature to
generate a holistic counterweight to this reductionism – systems biology.
6.4.1 Genomic Insights
Once the yeast genome sequence became available, it rapidly became
apparent that many human disease genes have homologues in this
simple eukaryotic cell. Comparative sequence analysis between
S. cerevisiae and human genes has already provided valuable insight
into human cellular metabolism. A variety of examples are given in
Table 6.3, of which perhaps the most dramatic to date is the analysis of
an autosomal recessively inherited disease, Rhizomelic chondrody-
splasia punctata, which presents with symptoms of severe growth and
mental retardation. Patients with this condition were found to carry
mutations leading to defects in peroxisome biogenesis which are func-
tionally equivalent to the yeast peroxisome targeting mutants (pex5 and
pex7).48,49 However, this serves as an excellent model for many other
human diseases, including cancer, neurodegenerative diseases such as
Alzheimer’s, Parkinson’s and CJD,50 and various metabolic disorders.
Moreover, yeast also facilitates fundamental studies of molecular
mechanisms such as apoptosis – a key to embryonic development.
However, more than simply facilitating homology searches, the
sequencing of the genome has paved the way to using the powerful
homologous recombination system in yeast to produce a bar-coded set
of yeast strains, each one carrying a precisely deleted single open reading
187The Biotechnology and Molecular Biology of Yeast
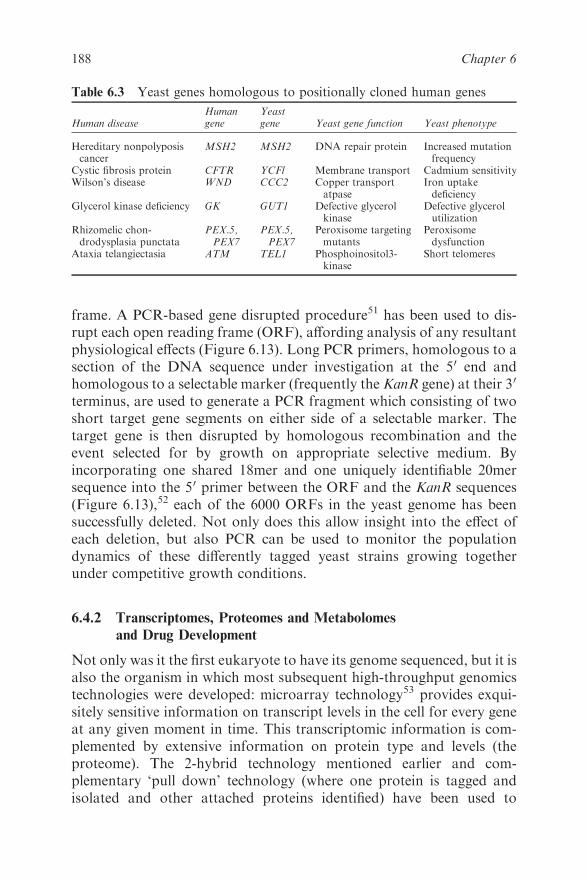
frame. A PCR-based gene disrupted procedure51 has been used to dis-
rupt each open reading frame (ORF), affording analysis of any resultant
physiological effects (Figure 6.13). Long PCR primers, homologous to a
section of the DNA sequence under investigation at the 50 end and
homologous to a selectable marker (frequently the KanR gene) at their 30
terminus, are used to generate a PCR fragment which consisting of two
short target gene segments on either side of a selectable marker. The
target gene is then disrupted by homologous recombination and the
event selected for by growth on appropriate selective medium. By
incorporating one shared 18mer and one uniquely identifiable 20mer
sequence into the 50 primer between the ORF and the KanR sequences
(Figure 6.13),52 each of the 6000 ORFs in the yeast genome has been
successfully deleted. Not only does this allow insight into the effect of
each deletion, but also PCR can be used to monitor the population
dynamics of these differently tagged yeast strains growing together
under competitive growth conditions.
6.4.2 Transcriptomes, Proteomes and Metabolomes
and Drug Development
Not only was it the first eukaryote to have its genome sequenced, but it is
also the organism in which most subsequent high-throughput genomics
technologies were developed: microarray technology53 provides exqui-
sitely sensitive information on transcript levels in the cell for every gene
at any given moment in time. This transcriptomic information is com-
plemented by extensive information on protein type and levels (the
proteome). The 2-hybrid technology mentioned earlier and com-
plementary ‘pull down’ technology (where one protein is tagged and
isolated and other attached proteins identified) have been used to
Table 6.3 Yeast genes homologous to positionally cloned human genes
Human diseaseHumangene
Yeastgene Yeast gene function Yeast phenotype
Hereditary nonpolyposiscancer
MSH2 MSH2 DNA repair protein Increased mutationfrequency
Cystic fibrosis protein CFTR YCFl Membrane transport Cadmium sensitivityWilson’s disease WND CCC2 Copper transport
atpaseIron uptakedeficiency
Glycerol kinase deficiency GK GUT1 Defective glycerolkinase
Defective glycerolutilization
Rhizomelic chon-drodysplasia punctata
PEX.5,PEX7
PEX.5,PEX7
Peroxisome targetingmutants
Peroxisomedysfunction
Ataxia telangiectasia ATM TEL1 Phosphoinositol3-kinase
Short telomeres
188 Chapter 6
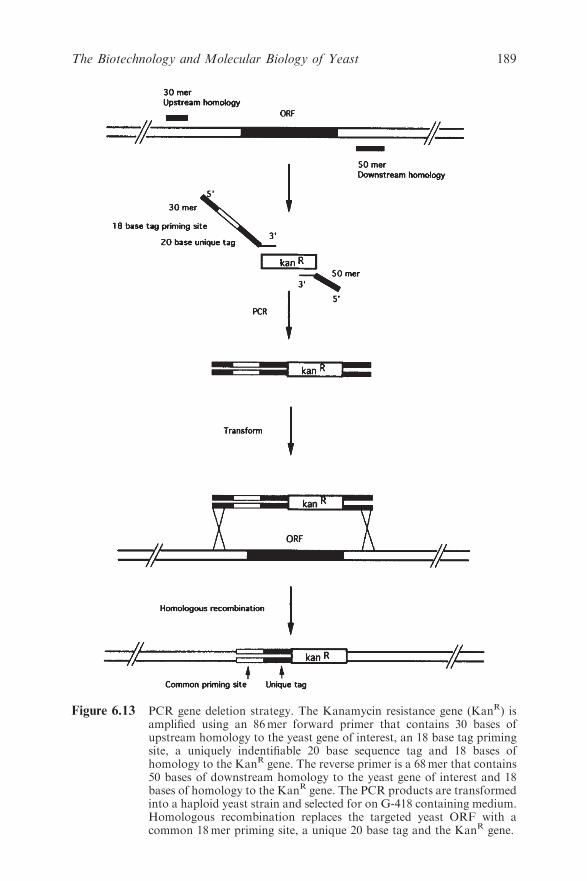
Figure 6.13 PCR gene deletion strategy. The Kanamycin resistance gene (KanR) isamplified using an 86mer forward primer that contains 30 bases ofupstream homology to the yeast gene of interest, an 18 base tag primingsite, a uniquely indentifiable 20 base sequence tag and 18 bases ofhomology to the KanR gene. The reverse primer is a 68mer that contains50 bases of downstream homology to the yeast gene of interest and 18bases of homology to the KanR gene. The PCR products are transformedinto a haploid yeast strain and selected for on G-418 containing medium.Homologous recombination replaces the targeted yeast ORF with acommon 18mer priming site, a unique 20 base tag and the KanR gene.
189The Biotechnology and Molecular Biology of Yeast
provide information on protein–protein54–56 interaction (the inter-
actome57). A catalogue of all cellular metabolites constitutes the meta-
bolome.58 All of these provide global insights which can be used to
ascertain how this eukaryotic cell responds to genetic and/or environ-
mental perturbation. By altering either (or both), biotechnologists can
now monitor eukaryotic cell responses to a variety of cellular insults and
novel therapeutic agents. This is the basis of a whole range of yeast-
based technologies for the identification of drug targets59,60 for use in
humans because they are composed of eukaryotic cells with so much in
common with yeast.
6.4.3 Systems Biology
The extraordinary research efforts which produced the current post-
genomic era have generated mind-numbing amounts of data about
individual cellular constituents. However, cells are dynamic entities and
the next challenge is to obtain insight into the dynamic fluxes within the
cell with a view to producing mathematical and computer models
of cells and eventually multicellular organisms. These goals are a long
way off, but yeast is once again leading the way. Systems biology is
currently being applied to many biological systems and consists of the
same core principles: a computer model of the system is designed using
all of the data available; the model is then used to predict how cells (or
groups of cells) will respond based on how the computer model
responds to altering a parameter in silico; if the model fails to predict
the outcome in the laboratory then any discrepancy creates new
information, which can then be used to inform and improve the model.
Hence the current objectives of systems biology are to develop biolo-
gically meaningful quantitative descriptions of living cells and to gen-
erate new computational tools to facilitate this. Once again yeast
researchers have been pioneers in this area. S. cerevisiae has been
intensively studied for decades and, with the additional data from post-
genomic high-throughput analyses, provides an ideal model organism
in which to undertake the reiterative process of model building, pre-
diction, perturbation, analysis and new model. Indeed, the first yeast
study on systems biology investigated the relatively simple and hugely
characterised galactose regulon,61 and it was here that the types of
challenges that lie ahead were revealed: despite 40 years of publications
in this area and all of the tools available to test the system, the best
model was still incorrect. This gives a foretaste of just how much
information will be needed in order to generate biologically-meaningful
190 Chapter 6

models of even the simplest modules in a cell. However, the same
paper61 revealed the power and exciting possibilities offered by of this
type of approach: the inconsistency between the prediction and biolo-
gical reality revealed a regulatory parameter that had heretofore been
unknown. Systems biology may well be in its infancy in yeast, but it
promises to provide unparalleled insight into basic cell functions62 and
of course how cells respond to changes in substrates, genetic changes
and environmental insults.
6.5 FUTURE PROSPECTS
Yeast biotechnological and molecular biology have had an extremely
successful and synergistic history. Its central importance in alcohol
production made yeast an organism of research value – the more one
knew, the better one could control it. This in turn made it the organism
of choice when a eukaryotic cell was needed in which to express het-
erologous protein. The technologies that arose subsequently provided
even more insight into its molecular biology, allowing us to re-engineer
it as surrogate animal and plant cells. At the same time, its homologous
recombination system allows it to be used to engineer entire chromo-
somes for synthetic biology. We know more about it than any other
eukaryotic cell and therefore it is set to lead us into the future as the
model organism for the development of systems biology.
The near future will see further developments in metabolic pathway
cloning, with a detailed systems analysis of metabolic flux63 facilitating
the optimisation of secondary metabolite production. At the same time,
glycosylation-specific strains will generate a whole new host of hetero-
logous proteins and allow glycobiologists to probe the exciting and
elusive world of glycan structure and function in complex organisms.
TAR cloning will facilitate the study of the organisation and evolution
of complex genomes and indeed is also set to allow the creation of novel
life forms with the ability to address global problems of energy limita-
tions and climate change.
In short, yeast biotechnology and molecular biology have just come of
age and the best is yet to come.
REFERENCES
1. K. Itakura, T. Hirose, R. Crea, A. D. Riggs, H. L. Heyneker,
F. Bolivar and W. H. Boyer, Science, 1977, 198, 1056.
2. A. B. Futcher, Yeast, 1988, 4, 27.
191The Biotechnology and Molecular Biology of Yeast

3. D. Mumberg, R. Muller and M. Funk, Gene, 1995, 156, 119.
4. A. Hinnen, J. B. Hicks and G. R. Fink, Proc. Natl. Acad. Sci. USA,
1978, 75, 1929.
5. J. D. Beggs, Nature, 1978, 275, 104.
6. H. Ito, Y. Fukada, K. Murata and A. Kimura, J. Bacteriol., 1983,
153, 163.
7. E. Meilhoc, J.-M. Masson and J. Teissie, Bio/Technology, 1990,
8, 223.
8. http://genome-www.stanford.edu/Saccharomyces/alleletable.html.
9. R. Parker and A. Jacobson, Proc. Natl. Acad. Sci. USA, 1990,
87, 2780.
10. K. S. Zaret and F. Sherman, J. Mol. Biol., 1984, 177, 107.
11. J. Mellor, M. J. Dobson, N. A. Roberts, A. J. Kingsman and S. M.
Kingsman, Gene, 1985, 33, 215.
12. T. F. Donahue and A. M. Cigan, Methods Enzymol., 1990, 185, 366.
13. D. T. Moir and D. R. Dumais, Gene, 1987, 56, 209.
14. A. Hinnen, B. Meyhack and R. Tsapis, in Gene Expression in Yeast,
Eds. M. Kornola, E. Vaisanen Kauppakirjapaino, Helsinki, 1983,
p.157.
15. A. J. Brake, J. P. Merryweather, D. G. Coit, U. A. Heberlein, F. R.
Masiarz, G. T. Mullenbach, M. S. Urdea, P. Valenzuela and P. J.
Barr, Proc. Natl. Acad. Sci. USA, 1984, 81, 4642.
16. N. Skiper, M. Sutherland, R. W. Davies, D. Kilburn, R. C. Miller,
A. Warren and R. Wong, Science, 1985, 230, 958.
17. R. A. Smith, M. J. Duncan and D. T. Moir, Science, 1985,
229, 1219.
18. T. Etcheverry, W. Forrester and R. Hitzeman, Bio/Technology,
1986, 4, 726.
19. L. M. Melnick, B. G. Turner, P. Puma, B. Price-Tillotson, K. A.
Salvato, D. R. Dumais, D. T. Moir, R. J. Broeze and G. C.
Avgerinos, J. Biol. Chem., 1990, 265, 801.
20. R. A. Hallewell, R. Mills, P. Tekamp-Olsen, R. Blacker,
S. Rosenberg, F. Otting, F. R. Masiarz and C. J. Scandella, Bio/
Technology, 1987, 5, 363.
21. D. E. Wampler, E. D. Lehman, J. Boger, W. J. McAleer and E. M.
Scolnick, Proc. Natl. Acad. Sci. USA, 1985, 82, 6830.
22. D. T. Burke, G. F. Carle and M. V. Olsen, Science, 1987,
236, 806.
23. P. Sudbery, in Human Molecular Genetics, Addison Wesley Long-
man, England, 1998, p. 209.
24. K. R. Peterson, C. H. Clegg, Q. Li and G. Stamatoyannopoulos,
Trends Genet., 1997, 13, 61.
192 Chapter 6

25. J. D. Boeke, F. LaCroute and G. R. Fink, Mol. Gen. Genet., 1984,
197, 345.
26. N. Kouprina and L. Vladimir, FEMS Microbiol. Rev., 2003,
27, 629.
27. N. Kouprina and L. Vladimir, Nat. Protocols, 2008, 3, 371.
28. L. A. Annab, N. Kouprina, G. Solomon, P. L. Cable, D. E. Hill,
J. C. Barrett, V. Larionov and C. A. Afshari, Gene, 2000, 250,
201.
29. D. G. Gibson, G. A. Benders, C. Andrews-Pfannkock, E. A.
Denisova, H. Baden-Tillson, J. Zaveri, T. B. Stockwell, A. Brownley,
D. W. Thomas, M. A. Algire, C. Merryman, L. Young, V. L.
Noskov, J. I. Glass, J. C. Venter, C. A. Hutchinson III and
O. Smith, Science, 2008, 319, 1215.
30. M. H. Pausch, Tibtech, 1997, 15, 487.
31. J. R. Broach and J. Thorner, Nature, 1996, 384, 14.
32. C. K. Wrenn and B. S. Katzenellenbogen, J. Biol. Chem., 1993,
268, 24089.
33. S. Fields and O. Song, Nature, 1989, 340, 245.
34. R. K. Brachmann and J. D. Boeke, Curr Opin. Biotechnol., 1997,
8, 561.
35. R. D. Gietz, B. Triggsraine, A. Robbins, K. C. Grahame and R. A.
Woods, Mol. Cell. Biochem., 1997, 172, 67.
36. K. H. Young, Biol. Reprod., 1998, 58, 302.
37. B. Huang, J. Guo, B. Yi, X. Yu, L. Sun and W. Chen, Biotechnol.
Lett., 2008, 9663.
38. J. A. Chemler, Y. Yan and M. A. G. Koffas,Microb. Cell Factories,
2006, 5, 20.
39. D.-K. Ro, E. M. Paradise, M. Ouellet, K. J. Fisher, K. L. Newman,
J. M. Ndungu, K. A. Ho, R. A. Eachus, T. S. Ham, J. Kirby, M. C.
Y. Chang, S. T. Withers, Y. Shiba, R. Sarpong and J. D. Keasling,
Nature, 2006, 440, 940.
40. J. M. DeJong, Y. Liu, A. P. Bollon, R. M. Long, S. Jennewein,
D. Williams and R. B. Croteau, Biotechnol. Bioeng., 2006, 93,
212.
41. S. R. Hamilton and T. U Gerngross, Curr. Opin. Biotechnol., 2007,
18, 387.
42. B. K. Choi, P. Bobrowicz, R. C. Davidson, S. R. Hamilton, D. H.
Kung, H. Li, R. G. Miele, J. H. Nett, S. Wildt and T. U. Gerngross,
Proc. Natl. Acad. Sci. USA, 2003, 100, 5022.
43. S. R. Hamilton, P. Bobrowicz, B. Bobrowicz, R. C. Davidson, H. Li,
T. Mitchell, J. H. Nett, S. Rausch, T. A. Stadheim, H. Wischnewski,
S. Wildt and T. U. Gerngross, Science, 2003, 301, 1244.
193The Biotechnology and Molecular Biology of Yeast
44. S. R. Hamilton, R. C. Davidson, N. Sethuraman, J. H. Nett,
Y. Jiang, S. Rios, P. Bobrowicz, T. A. Stadheim, H. Li, B. K. Choi,
D. Hopkins, H. Wischnewski, J. Roser, T. Mitchell, R. R. Straw-
bridge, J. Hoopes, S. Wildt and T. U. Gerngross, Science, 2006, 313,
1441.
45. H. Li, N. Sethuraman, T. A. Stadheim, D. Zha, B. Prinz,
N. Ballew, P. Bobrowicz, B. K. Choi, W. J. Cook and M. Cukan,
Nat. Biotechnol., 2006, 24, 210.
46. K. Amano, Y. Chiba, Y. Kasahara, Y. Kato, M. K. Kaneko,
A. Kuno, H. Ito, K. Kobayashi, J. Hirabayashi, Y. Jigami and
H. Narimatsu, Proc. Natl. Acad. Sci. USA, 2008, 105, 3232.
47. A. Goffeau, B. G. Barrell, H. Bussey, R. W. Davis, B. Dujon, H.
Feldmann, F. Galibert, J. D. Hoheisel, C. Jacq, M. Johnston, E. J.
Louis, H. W. Mewes, Y. Murakami, P. Philippsen, H. Tettelin and
S. G. Oliver, Science, 1996, 274, 546.
48. P. E. Purdue, J. W. Zhang, M. Skoneczny and P. B. Lazarow, Nat.
Genet., 1997, 15, 381.
49. A. M. Motley, et al., Nat. Genet., 1997, 15, 377.
50. M. W. Walberg, Arch Neurol., 2000, 57, 1129.
51. A. Baudin, O. Ozier-Kalogeropoulos, A. Denouel, F. Lacroute and
C. Cullin, Nucleic Acids Res., 1993, 21, 3329.
52. D. D. Shoemaker, D. A. Lashkari, D. Morris, M. Mittmann and
R. W. Davis, Nat. Genet, 1996, 14, 450.
53. J. L. DeRisi, V. R. Iyer and P. O. Brown, Science, 1997, 278, 680.
54. P. Uetz, L. Giot and G. Cagney, et al., Nature, 2000, 403, 623.
55. A. C. Gavin, M. Bosche and R. Krause, et al., Nature, 2002, 415, 41.
56. Y. Ho, A. Gruhler and A. Heilbut, et al., Nature, 2002, 415, 180.
57. A. H. Y. Tong, G. Lesage and G. D. Bader, et al., Science, 2004,
303, 808.
58. J. I. Castrillo, A. Hayes, S. Mohammed, S. J. Gaskelland and S. G.
Oliver, Phytochemistry, 2003, 62, 929.
59. N. Bharucha and A. Kumar, Comb. Chem. High Throughput
Screening, 2007, 10, 618.
60. A. B. Parsons, R. Geyer, T. R. Hughes and C. Boone, Prog. Cell
Cycle Res., 2003, 5, 159.
61. T. Ideker, V. Thorsson and J. A. Ranish, et al., Science, 2001,
292, 929.
62. R. Mustacchi, S. Hohmann and J. Nielsen, Yeast, 2006, 23, 227.
63. J. Nielsen and M. C. Jewett, FEMS Yeast Res, 2008, 8, 122.
64. G. Walsh, Nat. Biotechnol., 2006, 24, 769.
65. B. U. Gerngross, Nat. Biotechnol., 2004, 22, 1409.
194 Chapter 6

66. K. Struhl, D. T. Stinchcomb, S. Scherer and R. W. Davis, Proc.
Natl. Acad. Sci. USA, 1979, 76, 1035.
67. G. Tschumper and J. Carbon, Gene, 1980, 10, 157.
68. S. Fogel and J. Welch, Proc. Natl. Acad. Sci. USA, 1982, 79, 5342.
69. T. D. Webster and R. C. Dickson, Gene, 1983, 26, 243.
70. J. Rine, W. Hansen, E. Hardeman and R. W. Davis, Proc. Natl.
Acad. Sci. USA, 1983, 80, 6750.
195The Biotechnology and Molecular Biology of Yeast
CHAPTER 7
Metabolic Engineering
STEFAN KEMPA,a DIRK WALTHER,b OLIVER EBENHOEHa AND
WOLFRAM WECKWERTHa
aGoForSys, University of Potsdam, Institute of Biochemistry and Biology,
c/o Max-Planck-Institute for Molecular Plant Physiology, Am Muhlenberg 1,
14424 Potsdam, Germany; bMax-Planck-Institute for Molecular Plant
Physiology, Am Muhlenberg 1, 14424 Potsdam, Germany
7.1 INTRODUCTION
Making use of the metabolic properties of a living organism has a long
tradition in human civilisation, with applications in production of food
and fermentation of food for conservation, taste and salubriousness.
Since the introduction of recombinant DNA technology, metabolic
engineering has made great progress in the manipulation and optimi-
sation of new cellular processes in bacteria, yeast, filamentous fungi,
plants and mammalian cells.1
In the past, improvements in productivity and yield were achieved
mainly by classical breeding methods or mutagenesis combined with
large-scale phenotype screening. With increasing knowledge about
genomic structure and gene expression and the application of directed
genetic engineering, more targeted manipulation strategies came up for
modifying the properties of organisms.
However, the knowledge of the specific biochemical properties of
those organisms is ultimately required for successful establishment or
improvement of biotechnological applications. The regulatory processes
Molecular Biology and Biotechnology, 5th Edition
Edited by John M Walker and Ralph Rapleyr Royal Society of Chemistry 2009
Published by the Royal Society of Chemistry, www.rsc.org
196
controlling metabolism are complex and the degree of complexity
increases dramatically first from the transition from prokaryotes to
eukaryotes and also from single-cellular to multi-cellular organisms with
specialised organs. Interestingly, the metabolic complexity does not
increase to the same level as the regulatory complexity. The organisation
of the central metabolism is similar in a wide range of organisms. Thus,
the use of unicellular systems such as bacteria and yeast is one of the
major focuses of molecular engineering. The situation changes if the
production of proteins or complex chemical molecules is desired, which
involves a series of modification steps more pronounced in complex
eukaryotic systems. In the case of proteins, post-translational modi-
fications such as glycosylation and protein folding might be impaired in
simpler organisms. The same holds true for more complicated chemical
molecules such as alkaloids.
A complete new avenue to metabolic engineering was opened with the
onset of genome sequencing (see http://www.genomesonline.org/gold.
cgi and Figure 7.1). Further novel bioanalytical techniques evolved for
genome-wide molecular analyses and a new comprehensive description
of metabolic regulatory networks opens new perspectives for metabolic
engineering. The understanding of metabolic pathways and their reg-
ulation at a systems level raises the opportunity to identify targets for
manipulation which will have the strongest influence on desired meta-
bolic process. It helps also to evaluate the limits of the metabolic system
and to identify competing pathways which impair the efficiency of the
desired process (see Sections 7.2.2.2 and 7.2.2.3). Thus increased
knowledge in systems biology and recent technological developments
serve as a basis for modern bioengineering.
7.2 THEORETICAL APPROACHES FOR METABOLIC
NETWORKS
The initial phase of pathway manipulation requires an understanding of
the targeted metabolic network or, better, the complete picture of meta-
bolism in the targeted biological system. Structural analysis of metabolic
networks identifies entry points for metabolic engineering.2,3
A plethora of methods exists to address structural modelling, kinetic
modelling and control of metabolism, namely elementary flux modes
(EFM) and flux balance analysis (FBA), rate equation-driven modelling
using complex differential equations and kinetic constants and meta-
bolic control analysis (MCA). In the following sections we will introduce
briefly the basic principles of these techniques and present some
applications.
197Metabolic Engineering
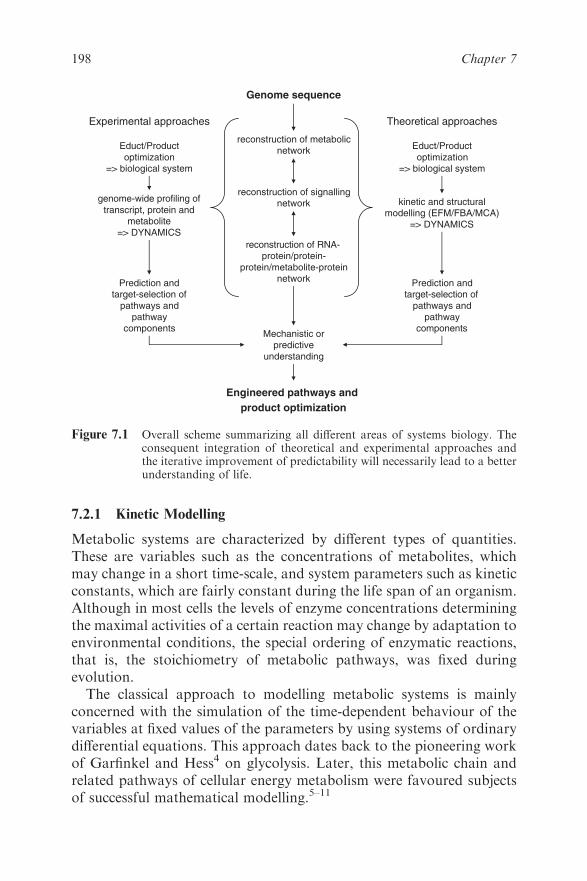
7.2.1 Kinetic Modelling
Metabolic systems are characterized by different types of quantities.
These are variables such as the concentrations of metabolites, which
may change in a short time-scale, and system parameters such as kinetic
constants, which are fairly constant during the life span of an organism.
Although in most cells the levels of enzyme concentrations determining
the maximal activities of a certain reaction may change by adaptation to
environmental conditions, the special ordering of enzymatic reactions,
that is, the stoichiometry of metabolic pathways, was fixed during
evolution.
The classical approach to modelling metabolic systems is mainly
concerned with the simulation of the time-dependent behaviour of the
variables at fixed values of the parameters by using systems of ordinary
differential equations. This approach dates back to the pioneering work
of Garfinkel and Hess4 on glycolysis. Later, this metabolic chain and
related pathways of cellular energy metabolism were favoured subjects
of successful mathematical modelling.5–11
Genome sequence
genome-wide profiling of
transcript, protein andmetabolite
=> DYNAMICS
reconstruction of metabolicnetwork
reconstruction of signallingnetwork
reconstruction of RNA-protein/protein-
protein/metabolite-proteinnetwork
kinetic and structuralmodelling (EFM/FBA/MCA)
=> DYNAMICS
Prediction andtarget-selection of
pathways andpathway
components
Prediction andtarget-selection of
pathways andpathway
components
Educt/Product
optimization=> biological system
Educt/Product
optimization=> biological system
Engineered pathways and
product optimization
Mechanistic orpredictive
understanding
Theoretical approachesExperimental approaches
Figure 7.1 Overall scheme summarizing all different areas of systems biology. Theconsequent integration of theoretical and experimental approaches andthe iterative improvement of predictability will necessarily lead to a betterunderstanding of life.
198 Chapter 7
In such an approach, the variables represent the concentrations of the
different chemical species and their temporal evolution is determined by
production and consumption rates describing the enzyme activities. In
its most general form, the system of ordinary differential equations can
be written as
d~x
dt¼ N �~vð~x;~pÞ ð1Þ
where x~ is the vector containing the concentrations of the various che-
mical species and the vector n~ contains expressions for the enzymatic
rates of all reactions, which in general depend on the concentrations x~and other parameters, comprised in p~, describing the enzyme’s kinetic
behaviour. The time derivative and the reaction rates are linked by the
so-called stoichiometry matrix N. An entry nij represents the stoichio-
metric coefficient of metabolite i in reaction j and is negative if i is
consumed by reaction j and positive if it is produced. This matrix is
determined by the topology of the metabolic system and therefore
remains constant independent of external influences or changes in the
kinetic parameters.
The investigation of a metabolic system with ordinary differential
equations is helpful to predict a system’s dynamic behaviour under
certain external conditions or parameter changes, which might repre-
sent, for example, the knock-down or knock-out of a gene or the tar-
geted inhibition of some specific enzymes. For the formulation of the
equation system (1), detailed knowledge on the enzymatic rates of every
participating reaction is necessary. Correct rate expressions reflect the
enzyme mechanisms including allosteric regulations, such as the inhi-
bition or activation due to the presence of other metabolites. The
experimental determination of enzymatic rate laws and their parameters
is a labour-intensive and time-consuming process and it is therefore not
surprising that our knowledge of these parameters is still rather limited.
However, for relatively small and well-studied systems, such as single
central pathways, the required information is often available, allowing
for the mathematical description of the enzymatic rates. Commonly
used rate laws are mass-action kinetics, describing the enzymatic rate as
a multilinear function in the substrate concentrations, and the well-
known Michaelis–Menten rate law, which reflects that enzymatic rates
saturate with high substrate concentrations as a result of limited free
enzyme.
We will outline the general approach by a simple illustrative example,
which was first studied by Higgins101 and Selkov.12 We consider the
199Metabolic Engineering
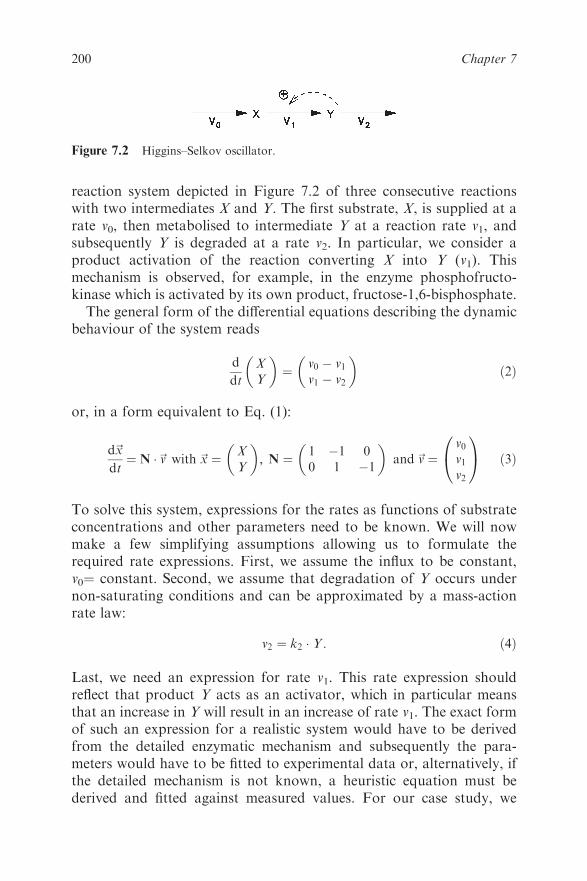
reaction system depicted in Figure 7.2 of three consecutive reactions
with two intermediates X and Y. The first substrate, X, is supplied at a
rate v0, then metabolised to intermediate Y at a reaction rate v1, and
subsequently Y is degraded at a rate v2. In particular, we consider a
product activation of the reaction converting X into Y (v1). This
mechanism is observed, for example, in the enzyme phosphofructo-
kinase which is activated by its own product, fructose-1,6-bisphosphate.
The general form of the differential equations describing the dynamic
behaviour of the system reads
d
dt
X
Y
� �
¼v0 � v1v1 � v2
� �
ð2Þ
or, in a form equivalent to Eq. (1):
d~x
dt¼ N �~v with ~x ¼
X
Y
� �
; N ¼1 �1 0
0 1 �1
� �
and ~v ¼v0v1v2
0
@
1
A ð3Þ
To solve this system, expressions for the rates as functions of substrate
concentrations and other parameters need to be known. We will now
make a few simplifying assumptions allowing us to formulate the
required rate expressions. First, we assume the influx to be constant,
v0¼ constant. Second, we assume that degradation of Y occurs under
non-saturating conditions and can be approximated by a mass-action
rate law:
v2 ¼ k2 � Y : ð4Þ
Last, we need an expression for rate v1. This rate expression should
reflect that product Y acts as an activator, which in particular means
that an increase in Y will result in an increase of rate v1. The exact form
of such an expression for a realistic system would have to be derived
from the detailed enzymatic mechanism and subsequently the para-
meters would have to be fitted to experimental data or, alternatively, if
the detailed mechanism is not known, a heuristic equation must be
derived and fitted against measured values. For our case study, we
Figure 7.2 Higgins–Selkov oscillator.
200 Chapter 7
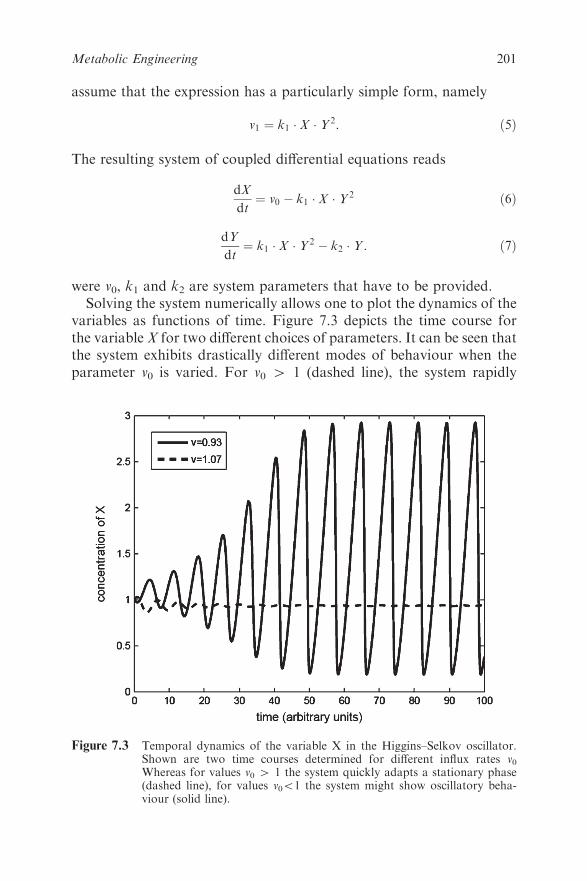
assume that the expression has a particularly simple form, namely
v1 ¼ k1 � X � Y2: ð5Þ
The resulting system of coupled differential equations reads
dX
dt¼ v0 � k1 � X � Y2 ð6Þ
dY
dt¼ k1 � X � Y2 � k2 � Y : ð7Þ
were v0, k1 and k2 are system parameters that have to be provided.
Solving the system numerically allows one to plot the dynamics of the
variables as functions of time. Figure 7.3 depicts the time course for
the variable X for two different choices of parameters. It can be seen that
the system exhibits drastically different modes of behaviour when the
parameter v0 is varied. For v0 4 1 (dashed line), the system rapidly
Figure 7.3 Temporal dynamics of the variable X in the Higgins–Selkov oscillator.Shown are two time courses determined for different influx rates v0Whereas for values v0 4 1 the system quickly adapts a stationary phase(dashed line), for values v0o1 the system might show oscillatory beha-viour (solid line).
201Metabolic Engineering

assumes a steady state and the concentrations remain constant. In
contrast, for v0o1 (solid line), the variables display an oscillatory
behaviour and, in fact, the system approaches a stable limit cycle.
In general, the phenomenon that small changes in some parameters
can result in a qualitative change of the system’s behaviour is termed
bifurcation and is commonly observed in larger systems. Such a beha-
viour is not understandable from pure observations alone, but an
underlying theory is required to explain how the same system may
exhibit fundamentally different modes of action. Model calculations can
help in identifying which key parameters are critical for the system’s
behaviour, a knowledge that is crucial to predict theoretically which
particular biotechnological modifications are most promising to yield
the desired effect.
7.2.2 Metabolic Control Analysis (MCA), Elementary Flux Modes
(EFM) and Flux-balance Analysis (FBA)
7.2.2.1 Metabolic Control Analysis (MCA)
Intuitively, to engineer a metabolic system with the goal of increasing
the yield of the desired compound (metabolite) or flux through a
metabolic pathway system, one would proceed by identifying and
manipulating so-called rate-limiting-steps, i.e. particular steps within
pathways that exert the most control on the system as a whole. How-
ever, despite the plausibility of this approach, most experimental
attempts to boost pathway fluxes by overexpressing single candidate
rate-limiting step enzymes have largely met with failure.13 Apparently,
the control of the system as a whole is much more distributed across the
system’s components than appreciated.
The study of how global yield parameters are distributed across sys-
tem components is the domain of sensitivity analysis. Sensitivity analysis
has found many applications across many engineering disciplines as well
as in economics. The application of the general concepts of sensitivity
analysis to metabolic pathway systems by Kacser et al.14 (1973) and
Heinrich and Rapoport15 (1974) laid the foundation of metabolic con-
trol analysis (MCA). MCA provides a rigorous mathematical frame-
work to study both qualitatively and quantitatively how the control of
metabolic fluxes and concentrations of intermediate compounds is dis-
tributed among the participating pathway enzymes, thereby allowing the
identification of enzymatic steps with the strongest effects on metabolite
levels and fluxes and also the mutual dependencies between them.13,16
Central to MCA are so-called control coefficients as unit-free relative
measures of the magnitude of change in system variables, such as fluxes,
202 Chapter 7
J, or metabolite concentrations, S, in response to local perturbations
(enzyme concentrations or rates). In their general form, control coeffi-
cients are defined as
CAi ¼
@A=A
@vi=vi¼
@ lnA
@ ln við8Þ
where A is the variable of interest (flux J or metabolite concentration S),
i refers to the enzymatic step being perturbed and vi is the associated
enzymatic rate at the steady state. Because enzymatic rates can be
considered to depend linearly on enzyme concentrations, E, and thus
v¼ k[E]), Eq. (8) can be re-stated as
CAi ¼
@ lnA
@ ln½Ei�ð9Þ
At steady state, it could be shown that the sum over all flux control
coefficients in a fully connected metabolic pathway system must add up
to one, and all concentration control coefficients add up to zero:
X
i
CJi ¼ 1 ð10Þ
for the flux control coefficient, and
X
i
CSj½ �i ¼ 0 ð11Þ
for the concentration control coefficient, where the summation is made
over all steps i and j denotes a particular metabolite of interest.
The interpretation of these so-called summation theorems has far-
reaching consequences as they capture global system properties. As the
sum over all control coefficients is constant, increases in one control
coefficient are necessarily accompanied by corresponding decreases of
control coefficients associated with other steps in the pathway system.
Thus, all control coefficients are tightly linked and control is shared
between all enzymes to different degrees. A strictly rate-limiting enzyme
would be signified by a flux-control coefficient of 1, while all other
enzymes have zero flux control coefficients. Although not impossible,
this is highly unlikely to occur in reality.
While the summation theorems deal with systemic properties and the
influence of individual enzymatic steps on the overall flux, a wealth of
203Metabolic Engineering
experimental data are available for more local enzyme characteristics
such as dependency of enzymatic rates on substrate concentrations or
temperature or other parameters and data on detailed enzymatic
mechanisms are available. In a general form, the dependence of the local
enzymatic rate, v, of enzyme i in the pathway on the parameter p (e.g.
temperature), is described by elasticity coefficients:
eip ¼
@vi=vi@p=p
¼@ ln vi@ ln p
ð12Þ
Every enzyme has as many elasticity coefficients as parameters influen-
cing it.
Control coefficients describe global properties, elasticity coefficients
capture properties of the isolated enzyme. As a particularly powerful
aspect of MCA, the connectivity theorems allow integration of the global
and local properties into a unified view:
X
i
CJi e
i½S� ¼ 0 ð13Þ
The sum of the products of the flux-control coefficient of all (i) steps
affected by S and its elasticity coefficients towards S is zero. And for the
concentration control coefficient:
X
i
C½A�i e
i½S� ¼ 0; A 6¼ S ð14Þ
(the reference metabolite, A, is different to the perturbed metabolite, S);
and
X
i
C½S�i e
i½S� ¼ �1 ð15Þ
if both reference and perturbed metabolite are the same. The con-
nectivity theorems describe how perturbations on metabolites of a
pathway propagate throughout the entire metabolic network.
Experimental approaches to measure individual control coefficients
require the introduction of small perturbations.16. The variable of
interest (flux or the concentration of a particular metabolite) is then
measured after a new steady state has been reached. Such perturbations
can be introduced, for example, by changing enzyme concentrations
(knock-down/-out) or by applying enzyme-specific inhibitors. A number
204 Chapter 7
of MCA-related software suites are also available, such as Gepasi and
SCAMP.17,18
7.2.2.2 Elementary Flux Mode (EFM) Analysis
Engineering metabolic systems to boost the yield of a desired metabolite
or to synthesize a certain compound, given a set of starting compounds,
naturally leads to the concept of metabolic pathways thought of as
molecular assembly lines connecting substrates to their products. To
achieve the desired outcome, the identified production pathway needs to
be targeted by bioengineering means, possibly alternative pathways
identified or other, competing pathways suppressed. Because many
known metabolic reaction routes are not linear reaction chains, but are
branched or even cyclical, and many metabolites participate in several
different metabolic reactions, especially so-called pool metabolites such
as water and ATP, an unambiguous pathway assignment form a given
metabolic map proves challenging and the term ‘pathway’ conceptually
difficult.
Elementary flux mode analysis (EFM) offers a rigorous definition of
pathways by defining them as minimal sets of enzymes that can operate
at the steady state with consideration of their directionality (irreversi-
bility of reactions).2,19,20 ‘Minimal’ means that deleting any one enzyme
in a given mode would lead to the interruption of the flux carried by this
mode. The combination of elementary modes – which can partly overlap
– reconstructs the entire metabolic network and describes all possible
fluxes and states (flux patterns) that the system can be in. Elementary
modes cannot be decomposed into smaller sub-networks as those sub-
paths would not be able to carry a steady-state flux. Elementary modes
connect via internal metabolites starting and end nodes that are con-
sidered external, i.e. metabolites whose concentrations are buffered and
are provided as a reservoir and can be considered sources or sinks, while
internal metabolites are compounds participating in the biochemical
reactions and their production and consumption are balanced at the
steady state. It is therefore obvious that any EFM analysis first starts by
defining external and internal metabolites, thus establishing the opera-
tional system boundaries. In addition, all directions need to be defined
(irreversible reaction steps). Under the appropriate definition, an ele-
mentary mode describes a flux that can be sustained even though all
other enzymes are rendered non-functional (e.g. knock-out mutants).
Hence potentially wasteful routes can be switched off without affecting
the yield of the desired product. Likewise, EFM provides an under-
standing of what consequences gene deletions or gene additions would
205Metabolic Engineering
have on the metabolic network of an organism. Furthermore, alter-
native, but perhaps sub-optimal, pathways leading to the same desired
product can be identified in cases where the best pathway (mode) may be
not easily amenable to biotechnological interventions. EFM has also
been used to identify maximum conversion yields.3,21 Software tools for
the analysis of EFM have also been developed and made available.22
7.2.2.3 Flux-balance Analysis (FBA)
The perhaps ultimate goal of systems biology can be formulated as given
the components of a system being able to describe mathematically and,
therefore, being able to simulate the behaviour of the system under
varying external conditions and to understand its emerging properties
such as stability and regulation. Attaining this goal would also provide
the ideal prerequisite for rational metabolic engineering approaches as the
metabolic system can then be simulated and theoretically optimized with
a desired objective (e.g. yield of a particular metabolite) in mind. The
technological advances achieved by the various ‘omics’ technologies have
put one aspect of this goal within reach. For many organisms, we have
already deciphered essentially all genes and therefore, in principle, all
encoded proteins and largely along with their functional annotations.
Therefore, the enzymatic potential of an organism – all possible metabolic
reactions – can be considered known. This knowledge is further aug-
mented by actual measurements of metabolite and protein levels and
functional characterisations of proteins. However, describing all possible
reactions in a mathematical framework using established metabolic
modelling techniques proved challenging as many required kinetic para-
meters reflecting the actual enzymatic mechanism remain undetermined.
Flux balance analysis (FBA) provides a framework that still allows a
description of the metabolic capabilities of an organism without the
need for detailed kinetic modelling (for reviews, see Refs 23–25). The
basic concept of FBA is to reduce all metabolic reactions and metabolic
exchange processes to a minimal description that allows the application
of conservation principles that must be fulfilled, in particular con-
servation of mass reflected by the stoichiometry the chemical reactions
and other processes that change the concentration of metabolites, and
then to infer the most likely distribution of metabolic fluxes according to
a reasonable optimisation criterion, such as biomass production. Based
on the reconstructed metabolic network for a particular organism
derived from its genome sequence and bioinformatics (gene predictions,
functional assignments based on homology) and experimental annota-
tion (e.g. EST sequences, proteomics measurements) and imposing mass
206 Chapter 7
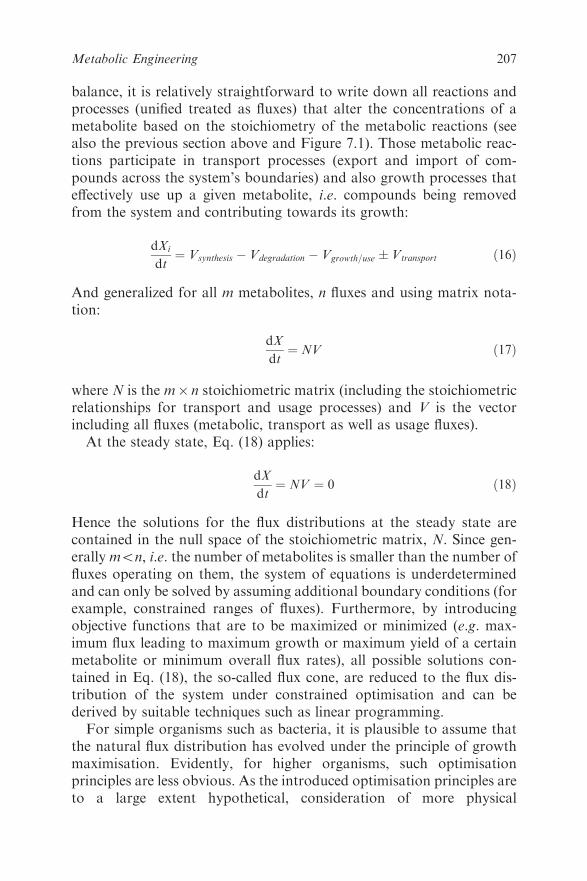
balance, it is relatively straightforward to write down all reactions and
processes (unified treated as fluxes) that alter the concentrations of a
metabolite based on the stoichiometry of the metabolic reactions (see
also the previous section above and Figure 7.1). Those metabolic reac-
tions participate in transport processes (export and import of com-
pounds across the system’s boundaries) and also growth processes that
effectively use up a given metabolite, i.e. compounds being removed
from the system and contributing towards its growth:
dXi
dt¼ Vsynthesis � Vdegradation � Vgrowth=use � Vtransport ð16Þ
And generalized for all m metabolites, n fluxes and using matrix nota-
tion:
dX
dt¼ NV ð17Þ
where N is the m� n stoichiometric matrix (including the stoichiometric
relationships for transport and usage processes) and V is the vector
including all fluxes (metabolic, transport as well as usage fluxes).
At the steady state, Eq. (18) applies:
dX
dt¼ NV ¼ 0 ð18Þ
Hence the solutions for the flux distributions at the steady state are
contained in the null space of the stoichiometric matrix, N. Since gen-
erally mon, i.e. the number of metabolites is smaller than the number of
fluxes operating on them, the system of equations is underdetermined
and can only be solved by assuming additional boundary conditions (for
example, constrained ranges of fluxes). Furthermore, by introducing
objective functions that are to be maximized or minimized (e.g. max-
imum flux leading to maximum growth or maximum yield of a certain
metabolite or minimum overall flux rates), all possible solutions con-
tained in Eq. (18), the so-called flux cone, are reduced to the flux dis-
tribution of the system under constrained optimisation and can be
derived by suitable techniques such as linear programming.
For simple organisms such as bacteria, it is plausible to assume that
the natural flux distribution has evolved under the principle of growth
maximisation. Evidently, for higher organisms, such optimisation
principles are less obvious. As the introduced optimisation principles are
to a large extent hypothetical, consideration of more physical
207Metabolic Engineering

constraints such as thermodynamic realisability based on Gibbs free
energy have been proposed recently.26
FBA also provides a powerful methodological framework to assess
biotechnological objective functions such as the yield maximisation of a
desired metabolite and furthermore to assess the effects of changes of the
underlying metabolic network, by deleting or adding certain enzymes,
and then to re-evaluate the metabolic capabilities of the system and to
determine to optimal distribution of fluxes.27
7.3 EXPERIMENTAL APPROACHES FOR METABOLIC
ENGINEERING
7.3.1 Tools for Metabolic Engineering
Engineering of metabolic pathways can be achieved by manipulating the
expression level, kinetic parameters or activation state of metabolic
enzymes.
Selection of wanted properties was for a long time the strategy to
achieve improvements in the targeted processes. The productivity was
monitored and strains or individuals with the best performance were
selected for propagation. Over time, this strategy was very effective and
led to organisms with very specific properties optimised for the desired
processes. These selection procedures might have changed metabolic
regulation at all levels. New techniques evolved for molecular analyses
and molecular biology, directing targeted manipulations by recombi-
nant DNA technologies. Using molecular biological techniques, mod-
ification of metabolism at all levels can be achieved. For example,
mutagenesis as an undirected approach or targeted mutagenesis of
genomes/genes is used to modify the desired properties of the organism.
The expression level of a metabolic enzyme can be changed by over-
expression of target genes or the use of antisense RNAi and its expression
can be terminated by gene insertion knock-outs or, if possible, replace-
ment. Regulatory sites and allosteric regulation substrate specificity can
be manipulated specifically by site-directed mutagenesis of the gene
coding sequence. Also, complete new pathways can be introduced by
expressing enzymes of foreign origin in the target organism.
For targeted manipulation of the metabolism of organisms, a deep
knowledge of metabolic regulation is crucial. This forced the develop-
ment of technologies to monitor the metabolism of the organisms.
Methods for metabolite measurement have been highly developed for
decades. However, most of those methods were targeted to a subset of
metabolites for identification of a specific compound class. The recent
208 Chapter 7

development of metabolomics techniques changed the view on meta-
bolism and serves as a cornerstone for systems biology.
7.3.2 Metabolomics
‘Omic’ technologies measure many variables simultaneously in a bio-
logical sample.28 These measurements represent snapshots of the system,
enabling a methodical search for correlations among the variables
(environmental parameters, metabolites, proteins, transcripts and oth-
ers) and thus describing the system.29 The systematic and especially the
time-dependent description of living systems requires a substantial
sample throughput in parallel with comprehensive analysis of as many
constituents as possible. In view of the chemical and physical diversity of
small biological molecules, the challenge remains to develop one or more
protocols to gather the whole ‘metabolome’ (all small molecules present
in a sample). No single technique is suitable for the analysis of the
different types of molecules, which is why a mixture of techniques has to
be used.28 In proteomics and transcriptomics, problems arise from the
sheer number of dynamically fluctuating transcripts and proteins and
also post-transcriptional and post-translational regulation and mod-
ification. In the field of metabolomics, the general estimation of the size
and the dynamic range of a species-specific metabolome is at a preli-
minary stage.
Metabolic fingerprinting and metabolomics with high sample
throughput but decreased dynamic range and deconvolution of indivi-
dual components achieve a global view on the in vivo dynamics of
metabolic networks. Here, the reader’s attention is directed to excellent
reviews covering this topic, including NMR, direct infusion mass spec-
trometry and infrared spectroscopy.30–35 A lower sample throughput
but unassailable identification and quantitation of individual com-
pounds in a complex sample are achieved by GC–MS and LC–MS
technology.
Owing to major steps forward in these technologies, it is possible to
match specific demands with specific instruments and novel develop-
ments in the performance of mass analysers. However, it is important to
know that each type of technology exhibits a bias towards certain
compound classes, mostly due to ionisation techniques, chromatography
and detector capabilities. GC–MS has evolved as an essential technique
for metabolomics owing to its comprehensiveness and sensitivity.29,36–46
The coupling of GC with time-of-flight (TOF) mass analysers is an
emerging technology. High scan rates provide accurate peak deconvo-
lution of complex samples.47–51 GC–TOF-MS capabilities provide an
209Metabolic Engineering
improvement over conventional GC–MS analysis with respect to the
analysis of ultra-complex samples, which is particularly important for the
metabolomics approach.29,40,44 Samples of ultra-complexity contain
hundreds of coeluting compounds varying in their abundance by several
orders of magnitude. Hence accurate mass spectral deconvolution and a
broad linear dynamic range represent an indispensable prerequisite for
high-quality spectra and peak shapes. Modern GC–TOF-MS applica-
tions and incorporated mass spectral deconvolution algorithms fulfil
these requirements.
Other promising technologies are CE–MS,52–56 particularly for the
analysis of polar and thermolabile compounds, and electrochemical
detection in parallel with LC–MS for the analysis of redox-active
compounds.57–59 The coupling of LC and MS is the most established
technique to address targeted identification and quantitation of specific
metabolites in complex mixtures.60–63 In contrast, for the non-targeted
analysis of all compounds in a complex sample,64–67 novel deconvolu-
tion algorithms have to be implemented taking into account the differ-
ences of data acquisition capacities of specific mass analysers, for
instance quadrupole time-of flight instruments or ion traps.64,66,68,69
7.3.3 Metabolomics in the Context of Metabolic Engineering
The metabolomics technology allows for genome-wide analysis of
metabolite dynamics and therefore permits a comparison of genome-
wide mathematical models of metabolism and their metabolite level
predictions (see Figure 7.1). Other examples are the combination of
metabolite concentration measurements –metabolomics – and FBA (see
above) to reveal constraints for structural modelling.26 Thus, a combi-
nation of modelling and experimental approaches for metabolic net-
works will constantly improve our knowledge about predictive behaviour
to identify the control points as targets for genetic manipulation.
Another aspect for the conclusive understanding of a metabolic net-
work in a sequenced species is genome annotation, thus the functional
assignment of the genes. Here, the application of metabolomics and
proteomics techniques help to improve genome annotation, as recently
demonstrated in Chlamydomonas reinhardtii.70 The high-throughput
character of metabolomics techniques allows the fast detection of
metabolites from all ranges of metabolism (see above). A projection of
these detected metabolites into a theoretical metabolic network of the
respective organism identifies gaps which need to be filled otherwise the
network would not function. Based on these discrepancies, one can go
back to the draft genome sequence and search for corresponding
210 Chapter 7
proteins or protein domains which fulfil the missing reactions.70 The
systematic development of this species-specific draft metabolic network
in combination with EFM and FBA techniques (see above) will then
allow the identification of key points in the network for targeted
manipulation, e.g. higher flux into lipids during oil plant seed filling
processes.71
A related consideration in metabolic engineering is the experimental
determination of fluxes of metabolites within the cell.72 This determi-
nation provides an unambiguous description of metabolism before and/
or after engineering interventions. The elucidation of metabolic fluxes is
important for a number of reasons. First, the set of fluxes through a cell’s
metabolic pathways is a key descriptor of its physiology and for evalu-
ating mechanisms for metabolic engineering.1,73 While gene transcripts,
protein levels and metabolite concentrations tend to vary in a seemingly
unpredictable fashion, metabolic fluxes might be more invariant though
capturing effectively a cell’s metabolic state. They provide a further
means for pinpointing the effect of engineering interventions (e.g. knock-
outs/-ins, up-/down-regulations) on cellular metabolism alluding to their
effectiveness and suggesting additional engineering strategies.
7.4 EXAMPLES IN METABOLIC ENGINEERING
7.4.1 Metabolic Engineering of Plants
It is very attractive to use the production apparatus of plants for the
synthesis of complicated chemical structures, especially if stereochemical
properties are considered. Also, the use of solar energy and inorganic
nutrients as a main requirement for plant growth might be a reason why
metabolic engineering of plants is employed in a broader range.
Alkaloids are a structurally diverse class of nitrogenous compounds
that are found in many plants and often exhibit physiological activity.
Throughout history, plants that produce alkaloids and their extracts
have been exploited for their medicinal and toxic properties. Modern
examples of widely used plant-derived alkaloids include analgesics
(morphine and codeine), stimulants (caffeine and nicotine) and che-
motherapeutics (vincristine, vinblastine, camptothecin derivatives and
paclitaxel). While most alkaloids are formed from amino acids such as
phenylalanine, tyrosine, tryptophan, ornithine and arginine, they can be
derived from a number of substrates (e.g. purines for caffeine). In plants,
over 12 000 alkaloid structures have already been elucidated,74 providing
drug companies with a diverse set of structures valuable for pharma-
cological screening.75
211Metabolic Engineering
Successful characterisation efforts focused on the following: nicotine
of Nicotiana; the tropane alkaloids of Hyoscyamus, Datura and Atropa;
the isoquinoline alkaloids of Coptis and Eschscholtzia californica; and
the terpenoid indole alkaloids of Catharanthus roseus. As more genes are
cloned, it becomes feasible to engineer plant systems for the production
of valuable secondary metabolites.
Most of the efforts, however, have not been focused on genetically
engineered cell cultures, tissue cultures or plants, but rather on non-
engineered cell lines studied under elicitation, with precursor feeding or
in optimized media. Although these classical methods have hastened
characterisation efforts, metabolic engineering offers the most promising
method for improved product composition and increased alkaloid yields
of plants and cultured cell systems. Chemical synthesis remains prohi-
bitively expensive due to the existence of multiple chiral centres, and the
length and incomplete characterisation of the pathways required for
alkaloid production make the use of alternative systems such as
microorganisms impossible (for a review, see Ref. 76).
Amino acids represent important targets for metabolic engineering for
a number of reasons. Some amino acids (such as proline, arginine,
methionine and glutamate) are directly or indirectly involved in the
regulation of plant responses to various environmental signals, including
light and mineral availability and also biotic and abiotic stresses. Other
amino acids (such as lysine, threonine, methionine and tryptophan)
contribute significantly to the nutritional quality of plant-based foods.
These ‘essential’ amino acids cannot be synthesized by humans and have
to be supplied in the diet. Although the regulation of amino acid
metabolism in higher plants may be analogous to that in microorgan-
isms, the multicellular and multiorgan nature of higher plants introduces
additional levels of complexity that render metabolic fluxes much more
difficult to predict and engineer. Understanding the regulation of
metabolic fluxes is also of particular importance because in many cases
metabolic engineering needs to be targeted to specific organs (for a
review, see Ref. 77).
Stress resistance of plants is also considered a topic of metabolic
engineering. Drought and salinity, for example, are major limitations on
crop productivity and quality globally. Increasing the resistance of crops
to these osmotic stresses was one of the first objectives of plant meta-
bolic engineering and remains a major goal today. One way in which
many plants and other organisms cope with osmotic stress is to syn-
thesize and accumulate compounds termed osmoprotectants (or com-
patible solutes). These are small, electrically neutral molecules that are
non-toxic at molar concentrations and stabilize proteins and membranes
212 Chapter 7
against the denaturing effect of high concentrations of salts and other
harmful substances.
In dry or saline environments, osmoprotectants can serve both to raise
the cellular osmotic pressure and to protect cell constituents. Their
protective effects also extend to temperature extremes and other
stresses. Chemically, osmoprotectants are of three types: betaines (fully
N-methylated amino acid derivatives) and related compounds such as
dimethyl sulfoniopropionate (DMSP) and choline-O-sulfate, certain
amino acids such as proline and ectoine and polyols and non-reducing
sugars such as trehalose and raffinose. To investigate the basic mechan-
isms of such abiotic stress responses, a plethora of plant mutants exists,
paving the way for metabolic engineering or stress-resistant plants.78
7.4.2 Acetate Metabolism and Recombinant Protein Synthesis in
E. coli – a Test Case for Metabolic Engineering
Single-cellular organisms are the most common used in biotechnological
processes, they are easy to cultivate and an increase in biomass can easily
be achieved. New pathways have been introduced and established
metabolic pathways modified; those studies will not be reviewed in
greater detail here.
Whereas on the one hand it is desirable to modify metabolic pathways
for the production of target compounds, it is also useful to modulate the
production of compounds which compete for internal recourses.
The culture of E. coli for the commercial production of recombinant
proteins has increased significantly in recent years.79 Acetate as a by-
product of fermentation is undesirable because it retards growth even at
concentrations as low as 0.5 gL�1,80 and it inhibits protein formation.
Moreover, acetate production represents a diversion of carbon that
might otherwise have generated biomass or protein product.81 There
have been a number of attempts to apply metabolic engineering to
reduce carbon flow to acetate-producing pathways.82–84 The reduction
of acetate production in E. coli led to a more than 10-fold increase in
recombinant protein production.85 This example demonstrates that
knowledge of the metabolic properties of the target organism is the key
for improving biotechnological processes.
7.4.3 Metabolic Flux Analysis and a Bioartificial Liver
In the light of the tremendous shortage of donor livers for transplan-
tation, the bioartificial liver (BAL) assist device provides a viable
alternative for treating patients with fulminant hepatic failure.86
213Metabolic Engineering
This device employs primary hepatocytes or hepatoma cell lines to
provide a whole complement of anabolic, catabolic, detoxifying and
secretory liver-specific functions.87,88
Since the cells in these systems are exposed to plasma during clinical
use,89 understanding the effect of plasma on their metabolic state is
essential to optimise effectively and rationally the BAL.
One method that can help gain a better insight into cellular functions
and metabolism is metabolic flux analysis (MFA), which is related to
FBA (see above). MFA relates experimental measurements of substrate
inputs and product outputs to a steady-state stoichiometric model to
determine intracellular flux distributions between metabolite pools. An
MFA model has previously been developed to investigate flux dis-
tributions in hepatocyte cultures.90
7.5 OMICS TECHNOLOGIES OPEN NEW PERSPECTIVES
FOR METABOLIC ENGINEERING
The complexity of genome organisation – structural diversity, gene
duplication and redundancy – inherently implies that molecular phe-
notypes are not a phenomenon that can be understood in the context of
single gene expression, but rather as the output of gene interaction
networks.91 Consequently, interaction networks are best determined by
multiparallel measurement of transcripts, proteins and metabolites.
These interactions can be viewed as correlation networks. However,
correlations per se contain no information on causality.92 Nevertheless,
correlation of gene and protein expression analysis and the resulting
metabolic phenotype correspond well with our understanding of caus-
ality, for instance the genotype–phenotype relationship.93 From the
statements above, it is evident that co-regulation and causal connectivity
can be best described if variables of different levels are analysed in an
integrative data matrix.
The comprehensive profiling of biological samples requires both sta-
tistical and novel data-mining tools to reveal significant correlations. It
is further enhanced by profound studies on theoretical metabolic net-
works (see above).94–96,2,14 Most of these approaches can be divided into
the following classes: (i) studies on network topology and properties
based on genome-predicted theoretical reaction pathways and/or reg-
ulatory gene networks (see Figure 7.1), (ii) measuring biochemical net-
works such as protein association, gene, protein and metabolite
correlation and co-regulation,97 and finally (iii) combining experimental
data with theoretical modelling (see Figure 7.1). System structures are
defined with reference to gene annotation or pathway, gene and protein
214 Chapter 7
databases. Comprehensive invasive investigations such as MS-based
protein–protein inter-association analyses are also used. The modelling
of metabolic pathways is complicated by inherently complex cellular and
regulatory structures and the gap of knowledge concerning genome
organisation.98 Not all possible pathways and enzymatic reactions are
currently known and it will take years to elucidate functions of unknown
and putative proteins in genomes. Consequently, the models are frag-
mentary. The presence and absence of pathways under various condi-
tions has to be considered as a major question.99,100
Many experimental and modelling approaches are conclusive for
accessible systems such as E. coli and yeast, but not easily applied in
more complex systems such as plants. The hope is that results from these
studies can help to elucidate gene functions in other species based on
sequence homology and conserved protein domain structures and finally
lead to a better understanding of metabolic network regulation as a
groundwork for pathway manipulation.32
7.6 ACKNOWLEDGEMENT
The section on MCA was written by also consulting the very clear and
concise description of MCA available at http://dbkgroup.org/mca_
home.htm.
REFERENCES
1. J. E. Bailey, Science, 1991, 252, 1668–1675.
2. S. Schuster, D. A. Fell and T. Dandekar, Nat. Biotechnol., 2000,
18, 326–332.
3. S. Schuster, S. Klamt, W. Weckwerth, F. Moldenhauer and
T. Pfeiffer, Bioprocess Biosyst. Eng., 2002, 24, 363–372.
4. D. Garfinkel and B. Hess, J. Biol. Chem., 1964, 239, 971.
5. T. A. Rapoport, R. Heinrich and S. M. Rapoport, Biochem. J.,
1976, 154, 449–469.
6. A. Werner and R. Heinrich, Biomed. Biochim. Acta, 1985, 44,
185–212.
7. A. Joshi and B. O. Palsson, J. Theor. Biol., 1989, 141, 515–528.
8. A. Joshi and B. O. Palsson, J. Theor. Biol., 1990, 42, 41–68.
9. M. Rizzi, M. Baltes, U. Theobald and M. Reuss, Biotechnol.
Bioeng., 1997, 55, 592–608.
10. P. J. Mulquiney, W. A. Bubb and P. W. Kuchel, Biochem. J., 1999,
342, 567–580.
215Metabolic Engineering

11. P. J. Mulquiney and P. W. Kuchel, Biochem. J., 1999, 342, 597–604.
12. E. E. Selkov, Eur. J. Biochem., 1968, 4, 79.
13. D. A. Fell, Biotechnol. Bioeng., 1998, 58, 121–124.
14. H. Kacser, J. A. Burns and D. A. Fell, Biochem. Soc. Trans., 1995,
23, 341–366.
15. R. Heinrich and T. A. Rapoport, Eur. J. Biochem., 1974, 42, 89–95.
16. D. A. Fell, Biochem. J., 1992, 286, 313–330.
17. H. M. Sauro and D. A. Fell, Math. Comput. Modell., 1991, 15,
15–28.
18. P. Mendes, Computer Appl. Biosci., 1993, 9, 563–571.
19. S. Schuster and C. Hilgetag, J. Phys. Chem., 1995, 99, 8017–8023.
20. S. Schuster and H. V. Westerhoff, Biosystems, 1999, 49, 1–15.
21. S. Schuster, T. Dandekar and D. A. Fell, Trends Biotechnol., 1999,
17, 53–60.
22. T. Pfeiffer, I. Sanchez-Valdenebro, J. C. Nuno, F. Montero and S.
Schuster, Bioinformatics, 1999, 15, 251–257.
23. A. Varma and B. O. Palsson, Appl. Environ. Microbiol., 1994, 60,
3724–3731.
24. K. J. Kauffman, P. Prakash and J. S. Edwards, Curr. Opin. Bio-
technol., 2003, 14, 491–496.
25. J. M. Lee, E. P. Gianchandani and J. A. Papin, Brief. Bioinf., 2006,
7, 140–150.
26. A. Hoppe, S. Hoffmann and H. G. Holzhutter, BMC Syst. Biol.
2007, 1, 23–28.
27. C. H. Schilling, J. S. Edwards, D. Letscher and B. O. Palsson,
Biotechnol. Bioeng., 2000, 71, 286–306.
28. W. Weckwerth, Annu. Rev. Plant Biol., 2003, 54, 669–689.
29. W. Weckwerth, K. Wenzel and O. Fiehn, Proteomics, 2004, 4, 78–83.
30. J. K. Nicholson, J. C. Lindon and E. Holmes, Xenobiotica, 1999,
29, 1181–1189.
31. J. K. Nicholson, J. Connelly, J. C. Lindon and E. Holmes, Nat.
Rev. Drug Discov., 2002, 1, 153–161.
32. J. O. Castrillo and S. G. Oliver, J. Biochem. Mol. Biol., 2004, 37,
93–106.
33. R. Goodacre, S. Vaidyanathan, W. B. Dunn, G. G. Harrigan and
D. B. Kell, Trends Biotechnol., 2004, 22, 245–252.
34. D. B. Kell, Curr. Opin. Microbiol., 2004, 7, 296–307.
35. W. B. Dunn and D. I. Ellis, Trends Anal. Chem., 2005, 24, 285–294.
36. H. Sauter, M. Lauer and H. Fritsch, Abstr. Pap. Am. Chem. Soc.,
1988, 195, 129–AGRO.
37. O. Fiehn, J. Kopka, P. Dormann, T. Altmann, R. N. Trethewey
and L. Willmitzer, Nat. Biotechnol., 2000, 18, 1157–1161.
216 Chapter 7
38. U. Roessner, C. Wagner, J. Kopka, R. N. Trethewey and L.
Willmitzer, Plant J., 2000, 23, 131–142.
39. U. Roessner, A. Luedemann, D. Brust, O. Fiehn, T. Linke,
L. Willmitzer and A. R. Fernie, Plant Cell, 2001, 13, 11–29.
40. W. Weckwerth, V. Tolstikov and O. Fiehn, in Proceedings of
the 49th ASMS Conference on Mass Spectrometry and Allied
Topics, American Society of Mass Spectrometry, Chicago, 2001,
pp. 1–2.
41. C. Wagner, M. Sefkow and J. Kopka, Phytochemistry, 2003,
62, 887–900.
42. C. D. Broeckling, D. V. Huhman, M. A. Farag, J. T. Smith, G. D.
May, P. Mendes, R. A. Dixon and L. W. Sumner, J. Exp. Bot.,
2005, 56, 323–336.
43. J. W. Webb, S. C. Gates, J. P. Comiskey and D. F. Weber, Abstr.
Pap. Am. Chem. Soc., 1986, 191, 70–ANYL.
44. W. Weckwerth, M. E. Loureiro, K. Wenzel and O. Fiehn, Proc.
Natl. Acad. Sci. USA, 2004, 101, 7809–7814.
45. P. Jonsson, J. Gullberg, A. Nordstrom, M. Kusano, M. Kowalc-
zyk, M. Sjostrom and T. Moritz, Anal. Chem., 2004, 76,
1738–1745.
46. O. Fiehn, J. Kopka, R. N. Trethewey and L. Willmitzer, Anal.
Chem., 2000, 72, 3573–3580.
47. J. T. Watson, G. A. Schultz, R. E. Tecklenburg and J. Allison,
J. Chromatogr., 1990, 518, 283–295.
48. T. Veriotti and R. Sacks, Anal. Chem., 2001, 73, 4395–4402.
49. S. E. Stein and D. R. Scott, J. Am. Soc. Mass Spectrom., 1994,
5, 859–866.
50. S. E. Stein, J. Am. Soc. Mass Spectrom., 1999, 10, 770–781.
51. C. S. Tong and K. C. Cheng, Chemom. Intell. Lab. Syst., 1999, 49,
135–150.
52. P. Schmitt-Kopplin and M. Frommberger, Electrophoresis, 2003,
24, 3837–3867.
53. T. Soga, Y. Ohashi, Y. Ueno, H. Naraoka, M. Tomita and
T. Nishioka, J. Proteome Res., 2003, 2, 488–494.
54. T. Soga, Y. Ueno, H. Naraoka, K. Matsuda, M. Tomita and
T. Nishioka, Anal. Chem., 2002, 74, 6224–6229.
55. T. Soga, Y. Ueno, H. Naraoka, Y. Ohashi, M. Tomita and
T. Nishioka, Anal. Chem., 2002, 74, 2233–2239.
56. S. Sato, T. Soga, T. Nishioka and M. Tomita, Plant J., 2004,
40, 151–163.
57. P. H. Gamache, D. F. Meyer, M. C. Granger and I. N. Acworth,
J. Am. Soc. Mass Spectrom., 2004, 15, 1717–1726.
217Metabolic Engineering
58. B. S. Kristal, K. E. Vigneau-Callahan and W. R. Matson, Anal.
Biochem., 1998, 263, 18–25.
59. K. Kaddurah-Daouk, Beecher, Kristal, Matson, Bogdanov, and
Asa, Pharmagenomics, January, 2006, 1, 46–52.
60. J. L. Josephs and M. Sanders, Rapid Commun. Mass Spectrom.,
2004, 18, 743–759.
61. D. V. Huhman and L. W. Sumner, Phytochemistry, 2002, 59,
347–360.
62. J. P. Shockcor, A. Nichols, H. Antti, R. S. Plumb, J. M. Castro-
Perez, H. Major and S. Preece, Drug Metab. Rev., 2003, 35, 1–1.
63. L. Yang, M. Amad, W. M. Winnik, A. E. Schoen, H. Schwein-
gruber, I. Mylchreest and P. J. Rudewicz, Rapid Commun. Mass
Spectrom., 2002, 16, 2060–2066.
64. V. V. Tolstikov, A. Lommen, K. Nakanishi, N. Tanaka and
O. Fiehn, Anal. Chem., 2003, 75, 6737–6740.
65. V. V. Tolstikov and O. Fiehn, Anal. Biochem., 2002, 301, 298–307.
66. E. von Roepenack-Lahaye, T. Degenkolb, M. Zerjeski, M. Franz,
U. Roth, L. Wessjohann, J. Schmidt, D. Scheel and S. Clemens,
Plant Physiol., 2004, 134, 548–559.
67. G. J. Dear, J. Ayrton, R. Plumb and I. J. Fraser, Rapid Commun.
Mass Spectrom., 1999, 13, 456–463.
68. A. L. Duran, J. Yang, L. J. Wang and L. W. Sumner, Bioinfor-
matics, 2003, 19, 2283–2293.
69. B. Kenney and J. P. Shockcor, Pharmagenomics, 2003, 3, 56–63.
70. P. May, S. Wienkoop, S. Kempa, B. Usadel, N. Christian,
J. Rupprecht, J. Weiss, L. Recuendo-Munoz, O. Ebenhoh,
W. Weckwerth, and D. Walther, Genetics, 2008, 179, 157–166.
71. J. Schwender, F. Goffman, J. B. Ohlrogge and Y. Shachar-Hill,
Nature, 2004, 432, 779–782.
72. J. Schwender, J. Ohlrogge and Y. Shachar-Hill, Curr. Opin. Plant
Biol., 2004, 7, 309–317.
73. G. Stephanopoulos and J. J. Vallino, Science, 1991, 252, 1675–1681.
74. A. El-Shazly, M. Abdel-All, A. Tei and M. Wink, Z. Naturforsch.,
Teil C, 1999, 54, 295–300.
75. R. Verpoorte, R. van der Heijden and J. Memelink, Transgenic
Res., 2000, 9, 323–343.
76. E. H. Hughes and J. V. Shanks, Metab. Eng., 2002, 4, 41–48.
77. G. Galili and R. Hofgen, Metab. Eng., 2002, 4, 3–11.
78. A. Grover, A. Pareek, S. L. Singla, D. Minhas, S. Katiyar,
S. Ghawana, H. Dubey, M. Agarwal, G. U. Rao and J. Rathee,
et al. Curr. Sci., 1998, 75, 689–696.
218 Chapter 7
79. M. Arbabi-Ghahroudi, J. Tanha and R. MacKenzie, Cancer
Metastasis Rev., 2005, 24, 501–519.
80. K. Nakano, M. Rischke, S. Sato and H. Markl, Appl. Microbiol.
Biot., 1997, 48, 597–601.
81. J. C. March, M. A. Eiteman and E. Altman, Appl. Environ.
Microbiol., 2002, 68, 5620–5624.
82. J. Delgado and J. C. Liao, Biotechnol. Prog., 1997, 13, 361–367.
83. K. Hosono, H. Kakuda and S. Ichihara, Biosci. Biotechnol. Bio-
chem., 1995, 59, 256–261.
84. K. Y. San, G. N. Bennett, A. A. Aristidou and C. H. Chou,
Recombinant DNA Technol., 1994, 721, 257–267.
85. M. S. Wong, S. Wu, T. B. Causey, G. N. Bennett and K. Y. San,
Metab. Eng., 2008, 10, 97–108.
86. J. H. Hoofnagle, R. L. Carithers, C. Shapiro and N. Ascher,
Hepatology (Baltimore, MD), 1995, 21, 240–252.
87. F. D. Watanabe, C. J. P. Mullon, W. R. Hewitt, N. Arkadopoulos,
E. Kahaku, S. Eguchi, T. Khalili, W. Arnaout, C. R. Shackleton
and J. Rozga, et al. Ann. Surg., 1997, 225, 484–491.
88. M. L. Yarmush, M. Toner, J. C. Y. Dunn, A. Rotem, A. Hubel
and R. G. Tompkins, Ann. N. Y. Acad. Sci., 1992, 665, 238–252.
89. S. L. Nyberg and S. P. Misra,Mayo Clin. Proc., 1998, 73, 765–771.
90. C. Chan, F. Berthiaume, K. Lee and M. L. Yarmush,Metab. Eng.,
2003, 5, 1–15.
91. A. Wagner, Nonlinearity, 1996, 9, 607–629.
92. A. Wagner, Biol. Philos., 1997, 14, 83–101.
93. M. Glinski and W. Weckwerth, Mass Spectrom. Rev., 2006, 25,
173–214.
94. J. A. Papin, N. D. Price, S. J. Wiback, D. A. Fell and B. O.
Palsson, Trends Biochem. Sci., 2003, 28, 250–258.
95. E. Ravasz and A. L. Barabasi, Phys. Rev., Feb., 2003, 67, Issue 2.
96. R. Steuer, J. Kurths, O. Fiehn and W. Weckwerth, Bioinformatics,
2003, 19, 1019–1026.
97. W. Weckwerth, Physiol. Plant., 2008, 132, 176–189.
98. W. Weckwerth and O. Fiehn, Curr. Opin. Biotechnol., 2002,
13, 156–160.
99. E. M. Marcotte, Nat. Biotechnol., 2001, 19, 626–627.
100. J. Ihmels, R. Levy and N. Barkai, Nat. Biotechnol., 2004, 22,
86–92.
101. J. Higgins, Ind. Eng. Chem., 1967, 59, 19–62.
219Metabolic Engineering
CHAPTER 8
Bionanotechnology
DAVID W. WRIGHT
Department of Chemistry, Vanderbilt University, Nashville TN 37235, USA
8.1 INTRODUCTION
Today, researchers find themselves involved in cross-disciplinary science
that a decade ago was simply inconceivable. Nowhere is this more
apparent than at the cusp of two rapidly developing fields, nanoscience
and biotechnology. But what is nanotechnology? The prefix nano means
a billionth (1� 10�9). Nanotechnology is the study and application of
unique structures having dimensions on the order of a billionth of a
meter that exhibit novel size-controlled electronic, optical or catalytic
properties. These structures can be metallic, semiconductor or magnetic
nanoparticles, nanowires or nanotubes. The underlying basis for such
nanoscale effects is that every property of a material has a characteristic
and critical length associated with it. The fundamental physics and
chemistry of a material will change when the dimensions of a solid
become comparable to one or more of these characteristic lengths, many
of which exist at the nanometer length scale.
One of the challenges of understanding nanotechnology is the voca-
bulary. The nanoscale is populated by a diverse group of players. If only
one length of a three-dimensional structure is of a nanodimension, the
structure is known as a quantum well. When a material exists on the
nanoscale along two sides, the structure is referred to as a nanowire. A
quantum dot has all three dimensions in the nanometer range. The
Molecular Biology and Biotechnology, 5th Edition
Edited by John M Walker and Ralph Rapleyr Royal Society of Chemistry 2009
Published by the Royal Society of Chemistry, www.rsc.org
220

assembly of these structures into hierarchical assemblies relies on both
physical (e.g. lithography, scanning probe microscopy, electrophoretic
strategies, ball milling or Langmuir–Blodgett films) and chemical
methods (e.g. interparticle electrostatic interactions, covalent coordi-
nation, template recognition with subsequent crosslinking or crystal
engineering).1 Although effective for the preparation of certain nano-
scale architectures, many of the physical methods are limited because
they tend to be slow, have a large infrastructural cost and do not
lend themselves to preparing designed nanostructures which span the
macroscopic dimension. In contrast, the advantages of chemical meth-
ods are that building blocks may be linked in a massively parallel
fashion. This is particularly useful for the rapid construction of two- or
three-dimensional structures. Unfortunately, current chemical meth-
odologies, especially when compared with the above physical methods,
are difficult to control. Increasingly, there has been interest in the use of
biomolecules to overcome this challenge.2
It is not surprising, then, to find that nanotechnology is interested in
the realm of biology, for they share the nanoscale (Figure 8.1). Consider
the tendon, whose function it is to attach muscle to bone. The principal
building block of the tendon is the assemblage of amino acids (B0.6 nm)
that form the gelatin-like protein collagen (B1 nm), that coils into a left-
handed triple helix (B2 nm). These individual helical proteins then
assemble into a fibrillar nanostructure in which collagen assembles
to form microfibrils (B3.5 nm), subfibrils (10–20 nm) and fibrils
(50–500 nm). These fibers then form clusters of mesoscopic fibers
called a fascicle (50–300mm) and, finally, the macroscopic tendon itself
(10–50 cm).3 A number of research groups are actively focusing on the
use of biomolecules to direct the formation of nanostructures and
extended nanoscale assemblies due to the inherent molecular recognition
of such molecules.
Figure 8.1 Many proteins have dimensions and molecular weights that place them inthe nano-regime.
221Bionanotechnology
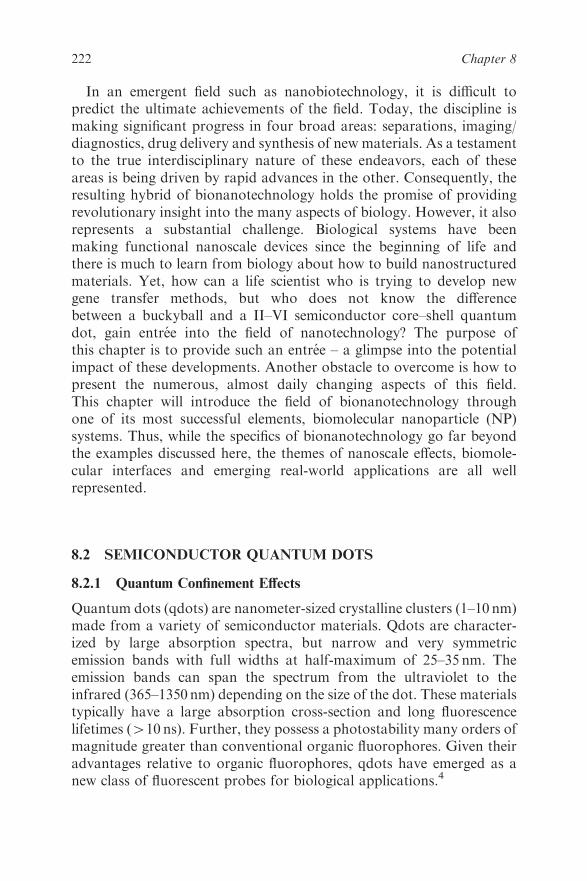
In an emergent field such as nanobiotechnology, it is difficult to
predict the ultimate achievements of the field. Today, the discipline is
making significant progress in four broad areas: separations, imaging/
diagnostics, drug delivery and synthesis of new materials. As a testament
to the true interdisciplinary nature of these endeavors, each of these
areas is being driven by rapid advances in the other. Consequently, the
resulting hybrid of bionanotechnology holds the promise of providing
revolutionary insight into the many aspects of biology. However, it also
represents a substantial challenge. Biological systems have been
making functional nanoscale devices since the beginning of life and
there is much to learn from biology about how to build nanostructured
materials. Yet, how can a life scientist who is trying to develop new
gene transfer methods, but who does not know the difference
between a buckyball and a II–VI semiconductor core–shell quantum
dot, gain entree into the field of nanotechnology? The purpose of
this chapter is to provide such an entree – a glimpse into the potential
impact of these developments. Another obstacle to overcome is how to
present the numerous, almost daily changing aspects of this field.
This chapter will introduce the field of bionanotechnology through
one of its most successful elements, biomolecular nanoparticle (NP)
systems. Thus, while the specifics of bionanotechnology go far beyond
the examples discussed here, the themes of nanoscale effects, biomole-
cular interfaces and emerging real-world applications are all well
represented.
8.2 SEMICONDUCTOR QUANTUM DOTS
8.2.1 Quantum Confinement Effects
Quantum dots (qdots) are nanometer-sized crystalline clusters (1–10 nm)
made from a variety of semiconductor materials. Qdots are character-
ized by large absorption spectra, but narrow and very symmetric
emission bands with full widths at half-maximum of 25–35 nm. The
emission bands can span the spectrum from the ultraviolet to the
infrared (365–1350nm) depending on the size of the dot. These materials
typically have a large absorption cross-section and long fluorescence
lifetimes (410 ns). Further, they possess a photostability many orders of
magnitude greater than conventional organic fluorophores. Given their
advantages relative to organic fluorophores, qdots have emerged as a
new class of fluorescent probes for biological applications.4
222 Chapter 8
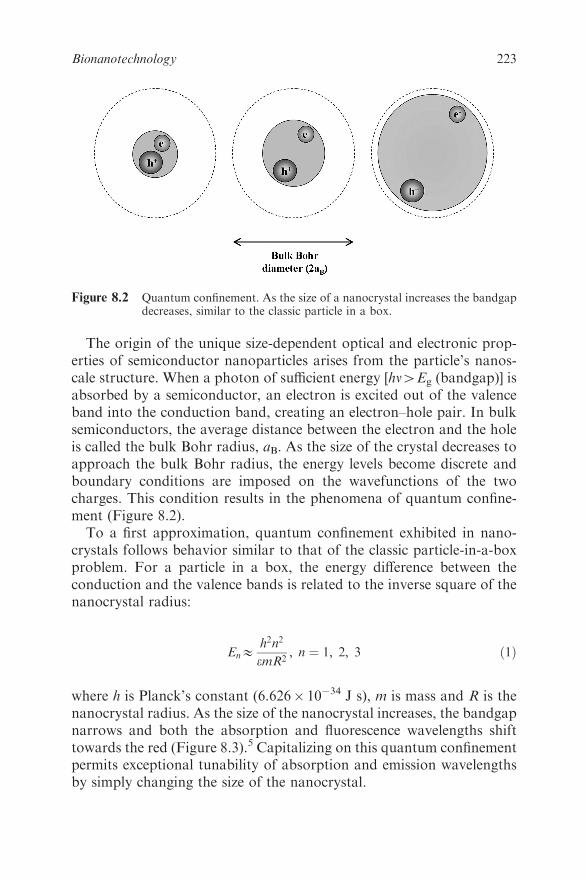
The origin of the unique size-dependent optical and electronic prop-
erties of semiconductor nanoparticles arises from the particle’s nanos-
cale structure. When a photon of sufficient energy [hn4Eg (bandgap)] is
absorbed by a semiconductor, an electron is excited out of the valence
band into the conduction band, creating an electron–hole pair. In bulk
semiconductors, the average distance between the electron and the hole
is called the bulk Bohr radius, aB. As the size of the crystal decreases to
approach the bulk Bohr radius, the energy levels become discrete and
boundary conditions are imposed on the wavefunctions of the two
charges. This condition results in the phenomena of quantum confine-
ment (Figure 8.2).
To a first approximation, quantum confinement exhibited in nano-
crystals follows behavior similar to that of the classic particle-in-a-box
problem. For a particle in a box, the energy difference between the
conduction and the valence bands is related to the inverse square of the
nanocrystal radius:
EnEh2n2
emR2; n ¼ 1; 2; 3 ð1Þ
where h is Planck’s constant (6.626� 10�34 J s), m is mass and R is the
nanocrystal radius. As the size of the nanocrystal increases, the bandgap
narrows and both the absorption and fluorescence wavelengths shift
towards the red (Figure 8.3).5 Capitalizing on this quantum confinement
permits exceptional tunability of absorption and emission wavelengths
by simply changing the size of the nanocrystal.
Figure 8.2 Quantum confinement. As the size of a nanocrystal increases the bandgapdecreases, similar to the classic particle in a box.
223Bionanotechnology
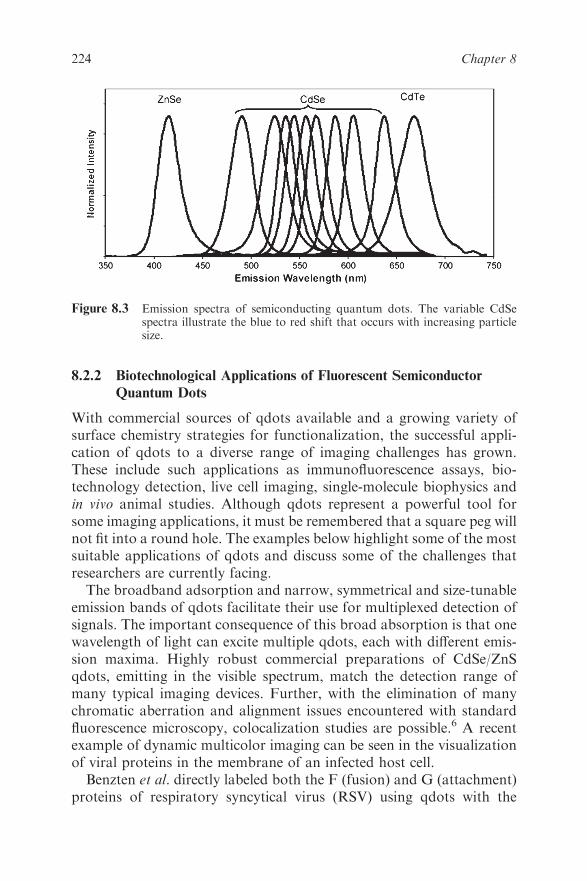
8.2.2 Biotechnological Applications of Fluorescent Semiconductor
Quantum Dots
With commercial sources of qdots available and a growing variety of
surface chemistry strategies for functionalization, the successful appli-
cation of qdots to a diverse range of imaging challenges has grown.
These include such applications as immunofluorescence assays, bio-
technology detection, live cell imaging, single-molecule biophysics and
in vivo animal studies. Although qdots represent a powerful tool for
some imaging applications, it must be remembered that a square peg will
not fit into a round hole. The examples below highlight some of the most
suitable applications of qdots and discuss some of the challenges that
researchers are currently facing.
The broadband adsorption and narrow, symmetrical and size-tunable
emission bands of qdots facilitate their use for multiplexed detection of
signals. The important consequence of this broad absorption is that one
wavelength of light can excite multiple qdots, each with different emis-
sion maxima. Highly robust commercial preparations of CdSe/ZnS
qdots, emitting in the visible spectrum, match the detection range of
many typical imaging devices. Further, with the elimination of many
chromatic aberration and alignment issues encountered with standard
fluorescence microscopy, colocalization studies are possible.6 A recent
example of dynamic multicolor imaging can be seen in the visualization
of viral proteins in the membrane of an infected host cell.
Benzten et al. directly labeled both the F (fusion) and G (attachment)
proteins of respiratory syncytical virus (RSV) using qdots with the
Figure 8.3 Emission spectra of semiconducting quantum dots. The variable CdSespectra illustrate the blue to red shift that occurs with increasing particlesize.
224 Chapter 8
primary antibody attached covalently to the surface. Using confocal
laser scanning microscopy, the F and G proteins were co-localized on
the surface of the infected cells. The sensitivity of detection of the F
protein with the qdots as a function of plaque-forming units (PFUs)
showed a linear response at 18 h over a range of 35–110 PFU per
well (multiplicity of infection 0.0032). After longer periods of time
(360–42 h), lower rates of infection could be detected as a result of the
inherent viral replication in culture. In terms of absolute sensitivity, the
F and G proteins could be detected as early as 1 h post-infection, on a
par with the most sensitive RT-PCR methods.7
There are several potential applications arising from the increased
photostability of qdots relative to organic dyes. High fluorescence pho-
tostability allows for the repeated imaging of immunostained samples that
will maintain their crisp, high-resolution three-dimensional definition. For
example, pathology samples or culture assays can be readily reviewed
without worry about loss of signal that is a limiting factor with organic
dyes. The photostability is also a clear advantage in live cell imaging
experiments, where cells or single molecules need to be monitored over
hours or days. Dubertret et al. demonstrated cell lineage tracing by
injecting qdots in a single Xenopus frog cell during an early embryonic
stage and followed their fate during subsequent development over days.8
Similarly, the lateral dynamics of qdot-labeled glycine receptors has been
monitored in neuronal membranes as a function of time.9
Qdots have also been surprisingly successful for in vivo animal ima-
ging in a number of species. These deep tissue studies have imaged
lymph nodes, vascular markers, blood vessels and grafted tumors.6 The
utilization of a polyethylene glycol (PEG) co-ligand is a common
approach in all of these studies to enhance circulation time and reduce
non-specific binding. With the advent of NIR CdTe/CdSe qdots, lymph
nodes were imaged 1 cm deep in tissue.10 As synthetic advances in the
production and functionalization of both NIR and IR qdots improve,
the properties of these probes combined with time-gated microscopy
methods, to reduce background autofluorescence, may result in detec-
tion sensitivities that rival those of radiolabeled probes.
Although the above examples highlight the promise of qdot applica-
tions as biological probes, it is important also to mention some of their
challenges. Foremost, is the difficulty of targeting these probes to the
cytoplasm. Despite some interesting attempts using membrane translo-
cating peptides, electroporation or transfection reagents, qdots tend to
accumulate in vesicles or appear non-homogeneously distributed in the
cytoplasm.11,12 Currently, there has been no real success in overcoming
this technique for the convenient imaging of cytosolic targets.
225Bionanotechnology
Another application that has not met with complete success due to the
inherent properties of qdots is the development of FRET sensors. The
narrow and tunable emission characteristics of qdots can be exploited to
customize donor emission in fluorescence (Foster) resonance energy
transfer (FRET) assays between qdot donors and fluorescent organic dye
acceptors.13 Such assays convey only qualitative information about
molecular associations in ensemble measurements. Unfortunately, there
are several hurdles to be cleared before more quantitative measurements
can be made by FRET. The first challenge is that minor variations in the
surface defects of individual qdots can introduce significant spectral
heterogeneity.14 The second challenge is the environment-dependent
intermittency of qdot fluorescence – the so-called blinking phenomenon.
Qdot blinking is associated with charge trapping and untrapping at
surface defect sites resulting in bright and dark states.15 Such blinking
results in the random loss of distance information on all time scales and
can impact the energy transfer efficiency. With improvements in synthetic
strategies to eliminate blinking and improve spectral homogeneity, qdots
may eventually become effective FRET nanoscale biosensors.
8.3 MAGNETIC NANOPARTICLES
8.3.1 Nanoscaling Laws and Magnetism
Biological examples of magnetic nanoparticles were first discovered in
magnetotactic bacteria. These unique iron oxide magnetites are used by
these organisms to orient themselves into an optimal environment.
Magnetic nanoparticles have also been found in the nasal capsules of
salmon. These particles are believed to respond to the geomagnetic field
of the Earth, providing the salmon with assistance in reaching their
spawning grounds. Similar nanostructures have also been found in the
brains of homing pigeons, sea turtles and even humans.16
Scientists have developed artificial magnetic nanoparticles through
chemical synthesis. Recent advances have provided new types of mag-
netic nanoparticles with precisely tuned compositions, shapes and size.
As with many nanostructures, a number of interesting phenomena have
been observed in these particles that are distinct from their bulk prop-
erties. In the bulk, the fundamental magnetic properties of coercivity
(Hc) and susceptibility (w) are determined principally by the parameters
of composition, crystallographic structure, magnetic anisotropy and
vacancies and defects. Yet, when magnetic materials are reduced in size
to the nanoscale regime, these fundamental properties are no longer
226 Chapter 8

permanent. Furthermore, the size, shape and compositional structure
become important determinants of the magnetic properties.17
One of the interesting size-dependent phenomena of magnetism on the
nanoscale is the observed changes in magnetic coercivity. Whereas bulk
magnets contain multiple magnetic domain structures, nanoparticles
possess single domain magnetic structures below a specific critical size
(Dc). Below this size, all of the magnetic spins in the nanoparticles align
unidirectionally (Figure 8.4). The magnetic coercivity has been shown to
increase as the size of the nanoparticles increases with the relationship
Hc ¼2Ku
ms
1� 5kT
KuV
� �12
" #
ð2Þ
where ms is the saturation magnetization.18
The saturation magnetization of the particles themselves is also
strongly dependent on the size. In bulk materials, the intrinsically dis-
ordered magnetic spin layers near the surface are negligible, since the
surface layer is minimal compared with the entire volume of the magnet.
Yet, on the nanoscale, the disordered surface effects can be dramatic as
they now represent a significantly larger fraction of the total volume.
Figure 8.4 Size-dependent magnetic domain structures. Spin alignment occurs insingle domain particles having sizes below a critical size (Dc). Reproducedby permission of The Royal Society of Chemistry.
227Bionanotechnology
This size effect follows the relationship described as
ms ¼ Ms r�d
r
� �3
ð3Þ
where r is the size, Ms is the saturation magnetization of bulk material
and d is the thickness of the disordered surface layer.19
This effect can be seen in the case of magnetism-engineered iron oxide
(MEIO), Fe3O4 nanoparticles. As the size of the MEIO nanoparticles
increases over a range 4–12 nm, the mass magnetization values increase
linearly as a plot of ms1/3 versus r�1. Such size-dependent properties
directly affect their magnetic resonance (MR) signal enhancement
capabilities for molecular imaging methodologies.20
The crystallinity of the magnetic nanoparticles plays an important
role in determining its magnetic coercivity.21 This is not surprising when
one considers how the degree of crystallinity and the organization that
the crystal lattice must impart on the interactions of spin within the
nanoparticles. This can be seen in magnetic nanoalloys with anisotropic
crystalline structures.22 Co–Pt core–shell nanoparticles composed of an
isotropically structured face-centered cubic (fcc) Co core and a non-
magnetic Pt shell displays superparamagnetic behavior with zero coer-
civity at room temperature. When the particle is annealed, the resulting
CoPt nanoalloy adopts a crystalline face-centered tetragonal (fct)
structure with room temperature ferromagnetic behavior and a coer-
civity value of 5300 Oe.
The use of magnetic dopants to modify the composition of nano-
particles can provide access to tunable magnetization.23 MEIO particles,
Fe3O4, have a ferrimagnetic spin structure. In the fcc-packed oxygen
lattice, Fe21 and Fe31 ions occupying octahedral (Oh) sites have spin that
aligns parallel to an external magnetic field (Figure 8.5), whereas Fe31
ions occupying tetrahedral (Td) sites have spins that align antiparallel
to the field. Since high-spin Fe31 and Fe21 have a d5 and d6 electron
count, respectively, the total magnetic moment per unit (Fe31)Td
(Fe21Fe31)OhO4 is approximately 4mB. Incorporation of an M21 (M¼Mn, Co, Ni) magnetic dopant with electronic configurations of d5, d4 and
d3, respectively, at the Oh Fe21 site result in a predictable change in the
net magnetization to 5, 3 and 2mB, respectively (Figure 8.6).
8.3.2 Biotechnological Applications of Magnetic Nanoparticles
Magnetic particles have shown considerable promise as probes for
magnetic resonance imaging, as they provide strong contrast effects to
228 Chapter 8

surrounding tissues. These effects can be understood in terms of their
influence on the spin–spin relaxation times (T2) of surrounding water
molecules. Conventional iron oxide contrast agents such as the super-
paramagnetic iron oxides or the cross-linked iron oxides are of limited
utility due to their poor magnetic contrast effects. New nanoparticles
systems such as MEIO nanoparticles have high and tunable mass
magnetization values capable of enhancing T2 relaxation times.
The importance of nanoscaling laws in designing optimal MEIO
systems can be seen in the size dependence of the relaxivity coefficient
(r2), a direct indication of contrast enhancement. In 4 nm MEIO parti-
cles, the relaxivity coefficient is 78mM�1 s�1, but increases to 106, 130
and 218mM�1 s�1 for 6, 9 and 12 nm nanoparticles, respectively.20
Using dopants, the efficacy of these particles can also be tuned by
Figure 8.5 Ferrimagnetic spin structure of fcc-packed Fe3O4 lattices. Reprinted withpermission from Jun et al., J. Am. Chem. Soc., 2008, 41, 179. Copyright2008 American Chemical Society.
Figure 8.6 Approximate magnetization values metal-doped MEIO nanoparticles.Reprinted from Nature, 2007, 13, 95, with permission from MacmillanPublishers Ltd.
229Bionanotechnology
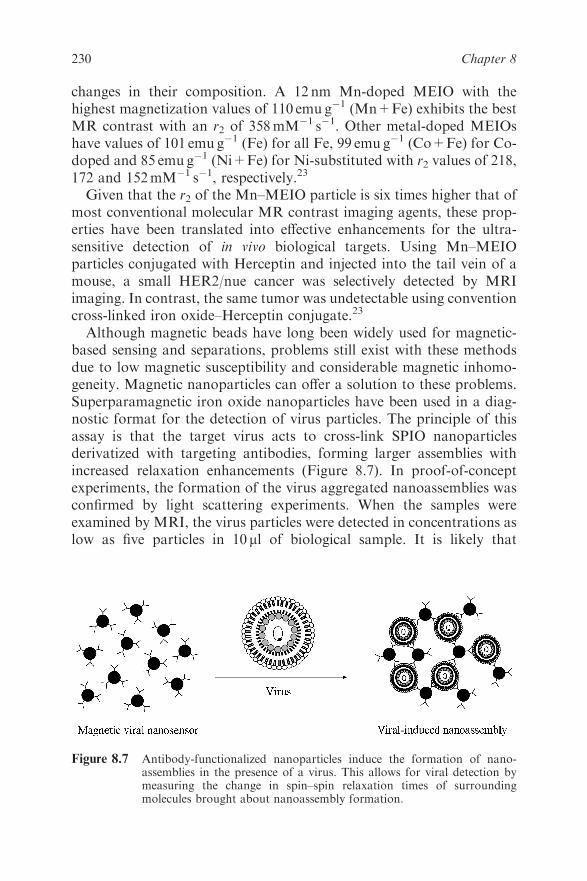
changes in their composition. A 12 nm Mn-doped MEIO with the
highest magnetization values of 110 emu g�1 (Mn+Fe) exhibits the best
MR contrast with an r2 of 358mM�1 s�1. Other metal-doped MEIOs
have values of 101 emu g�1 (Fe) for all Fe, 99 emu g�1 (Co+Fe) for Co-
doped and 85 emu g�1 (Ni+Fe) for Ni-substituted with r2 values of 218,
172 and 152mM�1 s�1, respectively.23
Given that the r2 of the Mn–MEIO particle is six times higher that of
most conventional molecular MR contrast imaging agents, these prop-
erties have been translated into effective enhancements for the ultra-
sensitive detection of in vivo biological targets. Using Mn–MEIO
particles conjugated with Herceptin and injected into the tail vein of a
mouse, a small HER2/nue cancer was selectively detected by MRI
imaging. In contrast, the same tumor was undetectable using convention
cross-linked iron oxide–Herceptin conjugate.23
Although magnetic beads have long been widely used for magnetic-
based sensing and separations, problems still exist with these methods
due to low magnetic susceptibility and considerable magnetic inhomo-
geneity. Magnetic nanoparticles can offer a solution to these problems.
Superparamagnetic iron oxide nanoparticles have been used in a diag-
nostic format for the detection of virus particles. The principle of this
assay is that the target virus acts to cross-link SPIO nanoparticles
derivatized with targeting antibodies, forming larger assemblies with
increased relaxation enhancements (Figure 8.7). In proof-of-concept
experiments, the formation of the virus aggregated nanoassemblies was
confirmed by light scattering experiments. When the samples were
examined by MRI, the virus particles were detected in concentrations as
low as five particles in 10ml of biological sample. It is likely that
Figure 8.7 Antibody-functionalized nanoparticles induce the formation of nano-assemblies in the presence of a virus. This allows for viral detection bymeasuring the change in spin–spin relaxation times of surroundingmolecules brought about nanoassembly formation.
230 Chapter 8
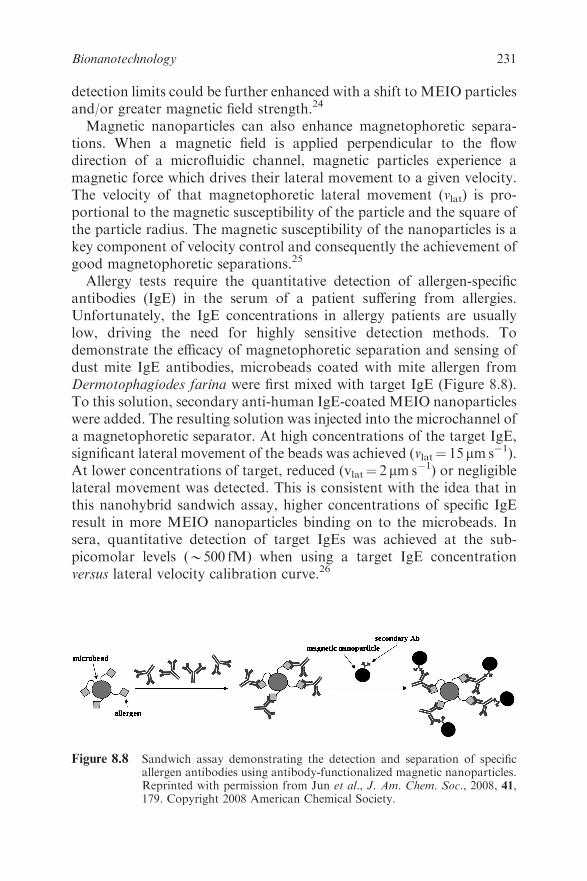
detection limits could be further enhanced with a shift to MEIO particles
and/or greater magnetic field strength.24
Magnetic nanoparticles can also enhance magnetophoretic separa-
tions. When a magnetic field is applied perpendicular to the flow
direction of a microfluidic channel, magnetic particles experience a
magnetic force which drives their lateral movement to a given velocity.
The velocity of that magnetophoretic lateral movement (vlat) is pro-
portional to the magnetic susceptibility of the particle and the square of
the particle radius. The magnetic susceptibility of the nanoparticles is a
key component of velocity control and consequently the achievement of
good magnetophoretic separations.25
Allergy tests require the quantitative detection of allergen-specific
antibodies (IgE) in the serum of a patient suffering from allergies.
Unfortunately, the IgE concentrations in allergy patients are usually
low, driving the need for highly sensitive detection methods. To
demonstrate the efficacy of magnetophoretic separation and sensing of
dust mite IgE antibodies, microbeads coated with mite allergen from
Dermotophagiodes farina were first mixed with target IgE (Figure 8.8).
To this solution, secondary anti-human IgE-coated MEIO nanoparticles
were added. The resulting solution was injected into the microchannel of
a magnetophoretic separator. At high concentrations of the target IgE,
significant lateral movement of the beads was achieved (vlat¼ 15mms�1).
At lower concentrations of target, reduced (vlat¼ 2 mms�1) or negligible
lateral movement was detected. This is consistent with the idea that in
this nanohybrid sandwich assay, higher concentrations of specific IgE
result in more MEIO nanoparticles binding on to the microbeads. In
sera, quantitative detection of target IgEs was achieved at the sub-
picomolar levels (B500 fM) when using a target IgE concentration
versus lateral velocity calibration curve.26
Figure 8.8 Sandwich assay demonstrating the detection and separation of specificallergen antibodies using antibody-functionalized magnetic nanoparticles.Reprinted with permission from Jun et al., J. Am. Chem. Soc., 2008, 41,179. Copyright 2008 American Chemical Society.
231Bionanotechnology

Researchers are beginning to achieve a better understanding of the
nanoscaling laws for magnetism. From these studies, it is apparent that
size, shape and composition have a tremendous impact on magnetic
parameters such as coercivity and magnetization values. Using these
tunable properties, magnetic particles have begun to find their way into
a variety of biotechnology applications. Research and discovery will
lead to continued improvements in MRI, biosensing and magnetic
separations and new advances in next-generation drug delivery and
hyperthermia treatments.
8.4 ZEROVALENT NOBLE METAL NANOPARTICLES
8.4.1 Nanoscale Properties of Zerovalent Nobel Metal Nanoparticles
For centuries before the terms nanotechnology and nanoparticles were
coined, zerovalent noble metal nanoparticles had been known and stu-
died. Many of the beautiful colors of medieval stained-glass windows are
the result of small metal oxide nanoparticles in the glass. Particles of
different size scatter different wavelengths of light, imparting the dif-
ferent colors to the glass.27 The photoreduction of silver salts to small
colloidal particles has long been a part of the process of image formation
in photography.28 With the growth of bionanotechnology, noble metal
nanoparticles have been found to be indispensable building blocks in a
variety of systems, ranging from scaffolds for antigen mimics, electron
transfer mediators in enzyme-based biosensors to integral components
in DNA detection.
AuNPs and AgNPs demonstrate a variety of interesting nanoscale
size- and shape-dependent tailoring of their physical and chemical
properties making them highly tunable components in catalytic, sensor
and biological imaging applications. There has been considerable
interest in resonant Rayleigh scattering from AuNPs and AgNPs. Spe-
cifically, light scattering from silver nanoparticles made by lithographic
or colloidal techniques has been used extensively for biological and
chemical analysis.29 The utility of these plasmon-resonant particles
(PRPs) stems from the sensitivity of the localized surface plasmon
resonance (LSPR) to local chemical environment and refractive index.
These surface plasmon waves are surface electromagnetic waves that
propagate parallel along a metal/dielectric interface. Since the wave is on
the boundary of the metal and the external medium (air or water for
example), these oscillations are very sensitive to any change of this
boundary, such as the adsorption of molecules to the metal surface.
232 Chapter 8

Light scattering from PRPs is 106 times more intense than fluorescence
emitted from commercially available fluorophores and PRPs do not
suffer from photodegradation.30 Moreover, intense scattering facilitates
the detection of particles, typically of 30�100 nm diameter, using
commercially available optical microscopes, which adds to the popu-
larity of this field.
In discussing shape- and size-dependent optical properties of metal
nanoparticles, it is important to note that nanoparticle extinction has
both light absorption and scattering components, which are size and
shape dependent and may or may not have the same wavelength
dependence.31 Theoretical experiments by Schatz and co-workers32
show the same wavelength dependence for both extinction and scatter-
ing for small spherical gold nanoparticles (30 nm diameter). For larger
diameter nanoparticles (e.g. 100 nm), scattering is enhanced, relative to
absorption in the red region of the spectrum.
Size and shape dependence on light scattering for AgNPs has been
reported. In general, as silver nanoparticles increase in size, their scat-
tering spectra are red shifted.33 Moreover, changes to the shape of
AgNPs has a significant effect on their observed light scattering spec-
trum. Silver spheres have a maximum scattering peak at B400 nm and
pentagons at B500 nm, and triangles have a peak maximum further red
shifted to 750 nm, all of which are size dependent. In addition, the
observed light scattering spectra for triangular-shaped particles are blue
shifted as the corners of the triangles go from sharp and well-defined to
truncated or rounded.33,34 With these tunable properties, AuNPs and
AgNPs are highly functional components of optical labeling schemes for
a wide array of biological systems.
On the nanoscale, noble metal nanoparticles have unique electrical
properties that can be used in biosensing applications.35 The ability
of AuNPs to store charge as nanoscale capacitors was originally
demonstrated by Murray’s group by observing quantized double-layer
(QDL) charging peaks for monodisperse AuNPs referred to as gold
monolayer protected clusters (MPCs).36 QDL charging results from a
single electron transfer into or out of the AuNP metallic core through
the thiol shell. QDL peaks can be observed for monodisperse MPCs
when this single electron transfer causes a change in the MPC potential.
Improvements in techniques for obtaining monodisperse MPCs have
enhanced the ability to observe sequential QDL peaks, especially for
hexanethiol gold MPCs.37 It is very likely that this same quantitated
behavior can be explained, in concept, by a similar ‘particle-in-a-box’
model as has been done for semiconductor quantum dots.
233Bionanotechnology
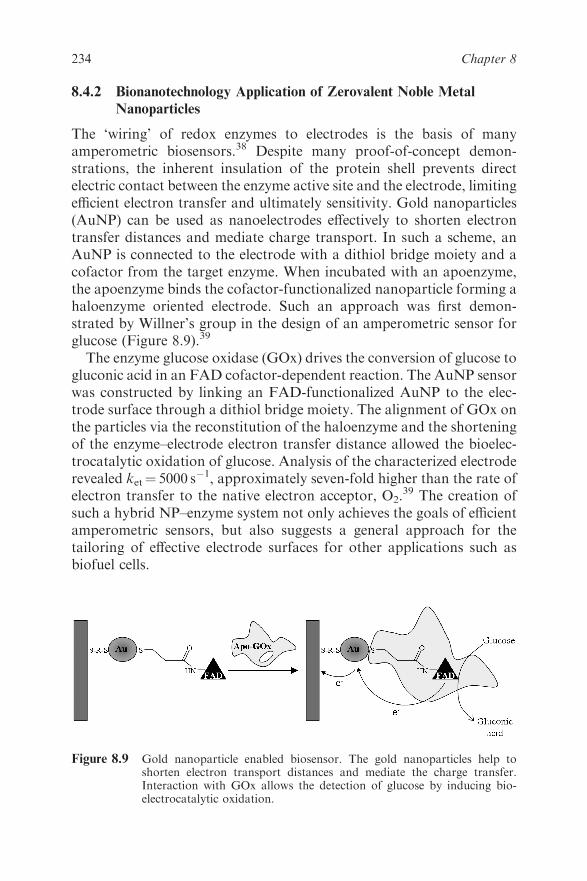
8.4.2 Bionanotechnology Application of Zerovalent Noble Metal
Nanoparticles
The ‘wiring’ of redox enzymes to electrodes is the basis of many
amperometric biosensors.38 Despite many proof-of-concept demon-
strations, the inherent insulation of the protein shell prevents direct
electric contact between the enzyme active site and the electrode, limiting
efficient electron transfer and ultimately sensitivity. Gold nanoparticles
(AuNP) can be used as nanoelectrodes effectively to shorten electron
transfer distances and mediate charge transport. In such a scheme, an
AuNP is connected to the electrode with a dithiol bridge moiety and a
cofactor from the target enzyme. When incubated with an apoenzyme,
the apoenzyme binds the cofactor-functionalized nanoparticle forming a
haloenzyme oriented electrode. Such an approach was first demon-
strated by Willner’s group in the design of an amperometric sensor for
glucose (Figure 8.9).39
The enzyme glucose oxidase (GOx) drives the conversion of glucose to
gluconic acid in an FAD cofactor-dependent reaction. The AuNP sensor
was constructed by linking an FAD-functionalized AuNP to the elec-
trode surface through a dithiol bridge moiety. The alignment of GOx on
the particles via the reconstitution of the haloenzyme and the shortening
of the enzyme–electrode electron transfer distance allowed the bioelec-
trocatalytic oxidation of glucose. Analysis of the characterized electrode
revealed ket¼ 5000 s�1, approximately seven-fold higher than the rate of
electron transfer to the native electron acceptor, O2.39 The creation of
such a hybrid NP–enzyme system not only achieves the goals of efficient
amperometric sensors, but also suggests a general approach for the
tailoring of effective electrode surfaces for other applications such as
biofuel cells.
Figure 8.9 Gold nanoparticle enabled biosensor. The gold nanoparticles help toshorten electron transport distances and mediate the charge transfer.Interaction with GOx allows the detection of glucose by inducing bio-electrocatalytic oxidation.
234 Chapter 8
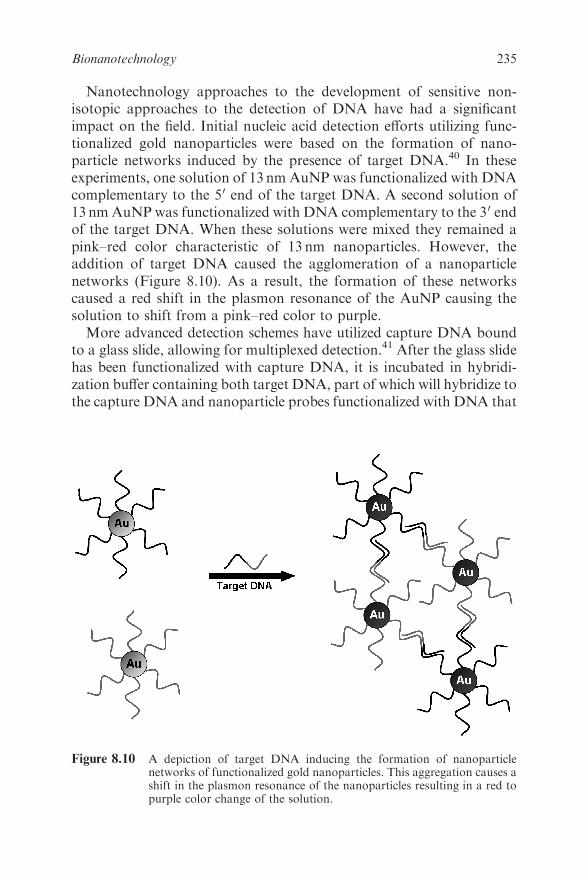
Nanotechnology approaches to the development of sensitive non-
isotopic approaches to the detection of DNA have had a significant
impact on the field. Initial nucleic acid detection efforts utilizing func-
tionalized gold nanoparticles were based on the formation of nano-
particle networks induced by the presence of target DNA.40 In these
experiments, one solution of 13 nm AuNP was functionalized with DNA
complementary to the 50 end of the target DNA. A second solution of
13 nm AuNP was functionalized with DNA complementary to the 30 end
of the target DNA. When these solutions were mixed they remained a
pink–red color characteristic of 13 nm nanoparticles. However, the
addition of target DNA caused the agglomeration of a nanoparticle
networks (Figure 8.10). As a result, the formation of these networks
caused a red shift in the plasmon resonance of the AuNP causing the
solution to shift from a pink–red color to purple.
More advanced detection schemes have utilized capture DNA bound
to a glass slide, allowing for multiplexed detection.41 After the glass slide
has been functionalized with capture DNA, it is incubated in hybridi-
zation buffer containing both target DNA, part of which will hybridize to
the capture DNA and nanoparticle probes functionalized with DNA that
Figure 8.10 A depiction of target DNA inducing the formation of nanoparticlenetworks of functionalized gold nanoparticles. This aggregation causes ashift in the plasmon resonance of the nanoparticles resulting in a red topurple color change of the solution.
235Bionanotechnology

will hybridize to a different part of the target DNA. In the presence of
target DNA, a ‘sandwich’ is formed between target DNA (the middle)
and capture DNA and nanoparticles (the ends) (Figure 8.11a). To
amplify the signal, the slide can subsequently be exposed to silver ions
and hydroquinone, resulting in the reduction of the silver by hydro-
quinone at the surface of the gold nanoparticles. If the ‘sandwich’ is not
formed, the glass will remain transparent; however, if it has been formed,
it will be opaque so the slide can simply be imaged on a flatbed scanner.
This detection scheme was later adapted to utilize electrical detection
(Figure 8.11b).42 In this scheme, capture DNA was bound to a silica
wafer between two microelectrodes fixed on the surface of the wafer.
Formation of the ‘sandwich’ and silver enhancement creates a bridge
between the two electrodes resulting in a change in resistance which can
be measured with a multimeter.
8.5 MAKING NANOSCALE STRUCTURES USING
BIOTECHNOLOGY
Biological processes produce an expansive array of complex materials
including laminate composites and ceramics such as bone, teeth and
Figure 8.11 (a) Schematic of the ‘sandwich’ formed between the functionalized glasssurface and the functionalized gold nanoparticles in the presence oftarget DNA. This ‘sandwich’ formation can then be visually enhancedthrough the reduction of Ag(I) by hydroquinone mediated by the surfaceof the gold nanoparticles. (b) Electrical detection of target-induced‘sandwich’ formation. Following sandwich formation and silverenhancement, a bridge is formed between the two electrodes. This bridgecreates a change in resistance which in turn is measured to determine thepresence of target DNA.
236 Chapter 8
shells; magnetic materials, such as the forms of magnetite found in
magnetobacteria and the brains of homing pigeons; novel silver
nanoclusters produced as a result of heavy metal detoxification
mechanisms by the bacteria Pseudomonas stutzeri; and arrays of pre-
cisely fabricated diffracting architectures resulting in the multitude of
intense colors observed in insects and birds. An essential ingredient to
understanding these biomaterials is an examination of the molecular
interactions at inorganic–organic interfaces which result in the con-
trolled nucleation and growth of these novel materials. The biomaterials
often represent unique crystal forms extending over several size domains
and are synthesized in aqueous solutions at room temperature and
standard pressure.16 In recent years, researchers have begun to mimic
mechanisms ascribed to natural production and stabilization of nano-
scale materials.
Diatoms are unicellular, eukaryotic algae that form a diverse array of
nanopatterned silica structures43 on the scale of 16 gigatons per year.
Silaffins are highly post-translationally modified peptides derived from
the Sil1 protein of the diatom Cylindrotheca fusiformis that have been
implicated in the biosilicification process.44 Within the native peptide, all
of the lysines have been modified to long-chain polyamine moieties and
the serines have been post-translationally phosphorylated. Silaffins from
a variety of diatoms, and also other long-chain polyamines, have been
shown to promote silica condensation from a solution of monosilicic
acid.45 The post-translationally modified silaffins self-assemble into
supramolecular structures, providing a template for silicic acid poly-
condensation. Whereas silaffins effectively precipitate silica nanospheres
under mildly acidic conditions, the non-modified R5 peptide (H2N–
SSKKSGSYSGSKGSKRRIL–CO2H) is capable of precipitating silica
at neutral pH. A synthetic site-directed mutagenesis study of the full-
length non-post-translationally modified R5 peptide suggests that the C-
terminus RRIL motif serves as an organizing element that permits the
formation of a supramolecular assembly of peptides creating a locally
high concentration of primary amine side-chain residues that drives
in vitro silica precipitation.46
Recent work with a variety of polyamines such as poly-L-lysine,
pentapropylenehexamine and polyallylamine hydrochloride have shown
that they too can act to form silica nanospheres, most likely in an
aggregation-dependent manner.47 This biomimetic approach has been
extremely successful in the synthesis of bio-like metal oxides in the
laboratory. Dendrimers represent unique unimolecular polymer tem-
plates whose functionality can be tuned through the judicious choice of
branching elements and terminal groups. They have been used not only
237Bionanotechnology
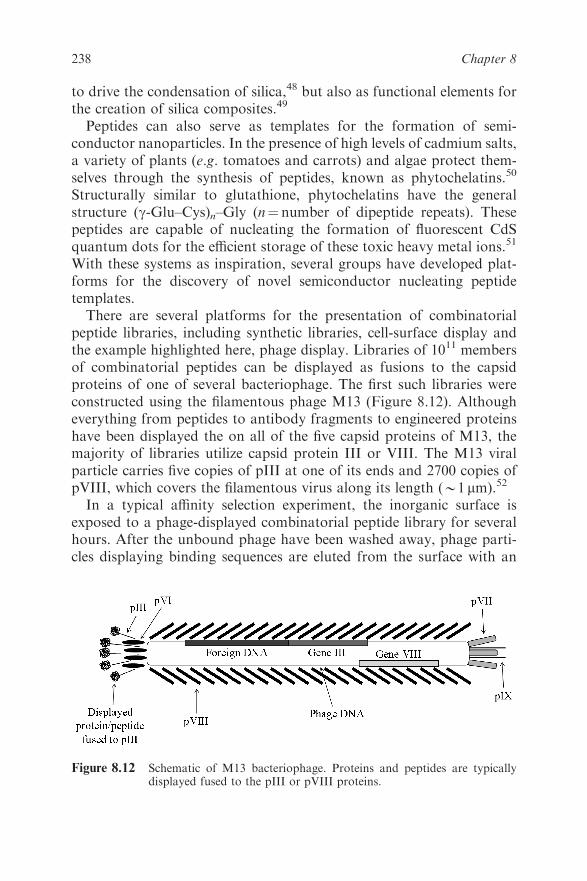
to drive the condensation of silica,48 but also as functional elements for
the creation of silica composites.49
Peptides can also serve as templates for the formation of semi-
conductor nanoparticles. In the presence of high levels of cadmium salts,
a variety of plants (e.g. tomatoes and carrots) and algae protect them-
selves through the synthesis of peptides, known as phytochelatins.50
Structurally similar to glutathione, phytochelatins have the general
structure (g-Glu–Cys)n–Gly (n¼ number of dipeptide repeats). These
peptides are capable of nucleating the formation of fluorescent CdS
quantum dots for the efficient storage of these toxic heavy metal ions.51
With these systems as inspiration, several groups have developed plat-
forms for the discovery of novel semiconductor nucleating peptide
templates.
There are several platforms for the presentation of combinatorial
peptide libraries, including synthetic libraries, cell-surface display and
the example highlighted here, phage display. Libraries of 1011 members
of combinatorial peptides can be displayed as fusions to the capsid
proteins of one of several bacteriophage. The first such libraries were
constructed using the filamentous phage M13 (Figure 8.12). Although
everything from peptides to antibody fragments to engineered proteins
have been displayed the on all of the five capsid proteins of M13, the
majority of libraries utilize capsid protein III or VIII. The M13 viral
particle carries five copies of pIII at one of its ends and 2700 copies of
pVIII, which covers the filamentous virus along its length (B1 mm).52
In a typical affinity selection experiment, the inorganic surface is
exposed to a phage-displayed combinatorial peptide library for several
hours. After the unbound phage have been washed away, phage parti-
cles displaying binding sequences are eluted from the surface with an
Figure 8.12 Schematic of M13 bacteriophage. Proteins and peptides are typicallydisplayed fused to the pIII or pVIII proteins.
238 Chapter 8
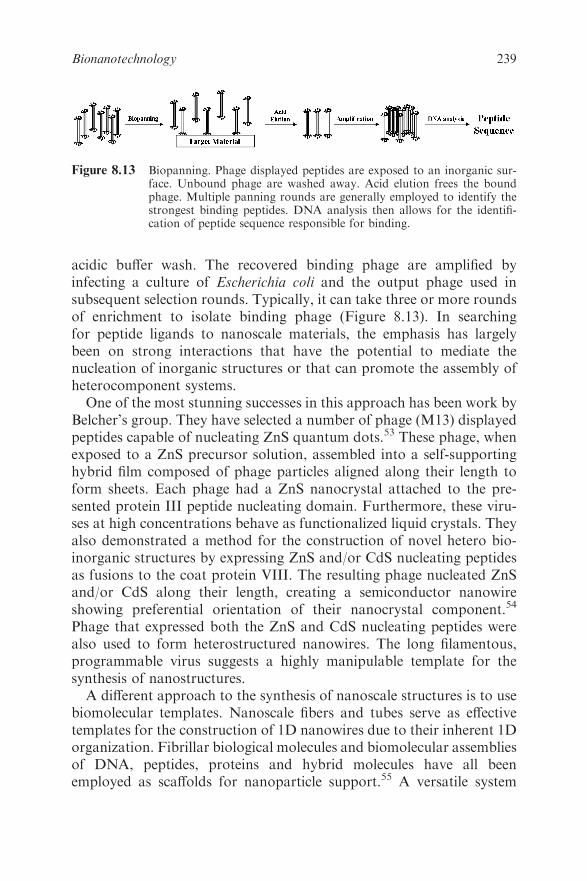
acidic buffer wash. The recovered binding phage are amplified by
infecting a culture of Escherichia coli and the output phage used in
subsequent selection rounds. Typically, it can take three or more rounds
of enrichment to isolate binding phage (Figure 8.13). In searching
for peptide ligands to nanoscale materials, the emphasis has largely
been on strong interactions that have the potential to mediate the
nucleation of inorganic structures or that can promote the assembly of
heterocomponent systems.
One of the most stunning successes in this approach has been work by
Belcher’s group. They have selected a number of phage (M13) displayed
peptides capable of nucleating ZnS quantum dots.53 These phage, when
exposed to a ZnS precursor solution, assembled into a self-supporting
hybrid film composed of phage particles aligned along their length to
form sheets. Each phage had a ZnS nanocrystal attached to the pre-
sented protein III peptide nucleating domain. Furthermore, these viru-
ses at high concentrations behave as functionalized liquid crystals. They
also demonstrated a method for the construction of novel hetero bio-
inorganic structures by expressing ZnS and/or CdS nucleating peptides
as fusions to the coat protein VIII. The resulting phage nucleated ZnS
and/or CdS along their length, creating a semiconductor nanowire
showing preferential orientation of their nanocrystal component.54
Phage that expressed both the ZnS and CdS nucleating peptides were
also used to form heterostructured nanowires. The long filamentous,
programmable virus suggests a highly manipulable template for the
synthesis of nanostructures.
A different approach to the synthesis of nanoscale structures is to use
biomolecular templates. Nanoscale fibers and tubes serve as effective
templates for the construction of 1D nanowires due to their inherent 1D
organization. Fibrillar biological molecules and biomolecular assemblies
of DNA, peptides, proteins and hybrid molecules have all been
employed as scaffolds for nanoparticle support.55 A versatile system
Figure 8.13 Biopanning. Phage displayed peptides are exposed to an inorganic sur-face. Unbound phage are washed away. Acid elution frees the boundphage. Multiple panning rounds are generally employed to identify thestrongest binding peptides. DNA analysis then allows for the identifi-cation of peptide sequence responsible for binding.
239Bionanotechnology
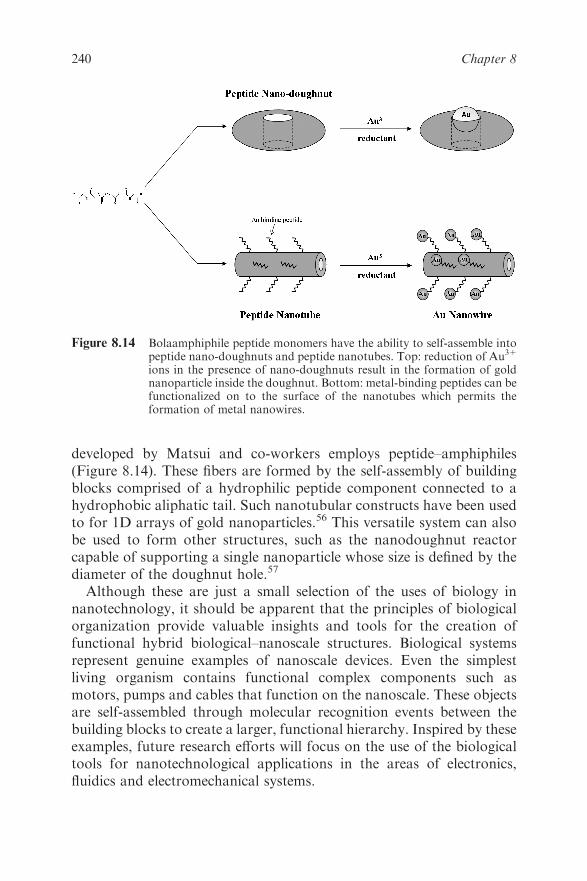
developed by Matsui and co-workers employs peptide–amphiphiles
(Figure 8.14). These fibers are formed by the self-assembly of building
blocks comprised of a hydrophilic peptide component connected to a
hydrophobic aliphatic tail. Such nanotubular constructs have been used
to for 1D arrays of gold nanoparticles.56 This versatile system can also
be used to form other structures, such as the nanodoughnut reactor
capable of supporting a single nanoparticle whose size is defined by the
diameter of the doughnut hole.57
Although these are just a small selection of the uses of biology in
nanotechnology, it should be apparent that the principles of biological
organization provide valuable insights and tools for the creation of
functional hybrid biological–nanoscale structures. Biological systems
represent genuine examples of nanoscale devices. Even the simplest
living organism contains functional complex components such as
motors, pumps and cables that function on the nanoscale. These objects
are self-assembled through molecular recognition events between the
building blocks to create a larger, functional hierarchy. Inspired by these
examples, future research efforts will focus on the use of the biological
tools for nanotechnological applications in the areas of electronics,
fluidics and electromechanical systems.
Figure 8.14 Bolaamphiphile peptide monomers have the ability to self-assemble intopeptide nano-doughnuts and peptide nanotubes. Top: reduction of Au31
ions in the presence of nano-doughnuts result in the formation of goldnanoparticle inside the doughnut. Bottom: metal-binding peptides can befunctionalized on to the surface of the nanotubes which permits theformation of metal nanowires.
240 Chapter 8

8.6 CONCLUSIONS
Once the concepts of the behavior of a material being dependent on a
specific length scale and that biology operates on that length scale are
linked, that a field such as bionanotechnolgy should arise seems obvious.
In the past decade, there have been tremendous advances in both our
understanding of the fundamental nanoscaling laws of materials and in
their practical application. There is little doubt that the horizon of
bionanotechnology stretches far beyond the borders outlined in this
introduction to some of the most exciting future challenges facing
researchers today. The development of nanotechnologically enabled
biosensors for multiplex analysis will find critical applications in clinical
diagnostics, homeland security, environmental control and forensic
applications. Metallic or semiconductor circuitry constructed on bio-
molecular templates is expected to provide the new logic elements for
miniaturized computers. Biomolecular hybrid nanoparticles will become
improved carriers for drugs, imaging agents for single cellular events and
ordered biomolecular structures acting as nanoscale information storage
and processing systems. While these prospects suggest a rich and
exciting field for years to come, their achievement will only be accom-
plished through the continued interdisciplinary research of chemists,
physicists and life scientists.
REFERENCES
1. A. P. Alivisatos, P. F. Barbara, A. W. Castleman, J. Chang, D. A.
Dixon, M. L. Klein, G. L. McLendon, J. S. Miller, M. A. Ratner, P. J.
Rossky, S. I. Stupp andM. E. Thompson, Adv. Mater., 1998, 10, 1297.
2. N. C. Seedman and A. M. Belcher, Proc. Natl. Acad. Sci. USA,
2002, 99, 6451.
3. C. P. Poole Jr and F. J. Owens, Introduction to Nanotechnology,
Wiley-Interscience, Hoboken, NJ, 2003.
4. M. R. Warnement, I. D. Tomlinson and S. J. Rosenthal, Curr.
Nanosci., 2007, 3, 273–284.
5. T. Kippeny, L. Swafford and S. J. Rosenthal, J. Chem. Educ., 2002,
79, 1094.
6. F. Pinaud, 8. Michaler, L. A. Bentolila, J. Tsay, J. J. Doose, G. Iyer
and S. Weiss, Biomaterials, 2006, 27, 1679–1687.
7. E. L. Bentzen, F. House, T. J. Utley, J. E. Crowe Jr and D. W.
Wright, NanoLetters, 2005, 5, 591.
8. B. Dubertret, P. Skourides, D. J. Norris, V. Noireaux, A. H.
Brivanlou and A. Libchaber, Science, 2002, 298, 1759.
241Bionanotechnology
9. M. Dahan, S. Levi, C. Luccardini, P. Rostaing, B. Riveau and
A. Triller, Science, 2003, 302, 442.
10. S. Kim, Y. T. Lim, E. G. Soltesz, A. M. De Grand, J. Lee and
A. Nakayama, Nat. Biotechnol., 2004, 22, 93.
11. A. Hoshino, K. Fujioka, T. Oku, S. Nakamura, M. Suga and
Y. Tamaguchi, Microbiol. Immunol., 2004, 48, 985.
12. A. M. Drefus, W. C. W. Chan and S. N. Bhatia, Adv. Mater., 2004,
16, 961.
13. I. L. Medintz, A. R. Clapp, H. Mattoussi, E. R. Goldman, B. Fisher
and J. M. Mauro, Nat. Mater., 2003, 2, 630.
14. T. D. Lacoste, 8. Michalet, F. Pinaud, D. S. Chemla, A. P. Alivisatos
and S. Weiss, Proc. Natl. Acad. Sci. USA, 2000, 97, 9461.
15. M. Kuno, D. P. Fromm, H. F. Hamann, A. Gallagher and D. J.
Nesbitt, J. Chem. Phys., 2000, 112, 3117.
16. J. M. Slocik, M. R. Knecht and D. W. Wright, in The Encyclopedia
of Nanoscience and Nanotechnology, ed. H. S. Nalwa, American
Scientific Publishers, Stevenson Ranch, CA, 2003, p. 239.
17. Y. W. Jun, J. W. Seo and J. Cheon, Acc. Chem. Res., 2008, 41, 179.
18. D. Jales, Introduction to Magnetism and Magnetic Materials, CRC
Press, Boca Raton, FL, 1998.
19. M. P. Morales, S. Veintemillas-Verdaguer, M. I. Montero and C. J.
Serna, Chem. Mater., 1999, 11, 3058.
20. Y. Jun, Y.-M. Huh, J.-S. Choi, J.-H. Lee, H.-T. Song, S. J. Kim,
S. Yoon, K.-S. Kim, J.-S. Shin, J.-S. Suh and J. Cheon, J. Am.
Chem. Soc., 2005, 127, 5732.
21. S. Sun, C. B. Murray, D. Weller, L. Folks and A. Moser, Science,
2000, 287, 1989.
22. J.-I. Park, M. G. Kim, Y. Jun, J. S. Lee, W.-R. Lee and J. Cheon,
J. Am. Chem. Soc., 2004, 126, 9072–9078.
23. J.-H. Lee, Y.-M. Huh, Y. Jun, J.-W. Seo, J.-T. Jang, H.-T. Song,
S. J. Kim, E.-J. Cho, H.-G. Yoon, J.-S. Suh and J. Cheon, Nat.
Med., 2007, 13, 95–99.
24. E. L. Bentzen, D. W. Wright and J. E. Crowe, Future Virology,
2006, 1, 769–781.
25. M. A. Hayes, N. A. Polson, A. N. Phayre and A. A. Garcia, Anal.
Chem., 2001, 73, 5896.
26. Y. K. Hahn, Z. Jin, H. Kang, E. Oh, M.-K. Han, H.-S. Kim, J.-T.
Jang, J.-H. Lee, J. Cheon, S.-H. Kim, H. S. Park and J.-K. Park,
Anal. Chem., 2007, 79, 2214.
27. M. Quinten, Appl. Phys. B, 2001, 73, 317.
28. T. Tani, J. Dispers. Sci. Technol., 2004, 25, 375.
29. C. J. Orendorf, T. K. Sau and C. J. Murphy, Small, 2006, 5, 636.
242 Chapter 8
30. S. Schultz, D. R. Smith, J. J. Mock and D. A. Schultz, Proc. Natl.
Acad. Sci. USA, 2000, 97, 996–1001.
31. M. A. El-Sayed, Acc. Chem. Res., 2001, 34, 257–264.
32. K. L. Kelly, T. R. Jensen, A. A. Lazarides and G. C. Schatz, in
Metal Nanoparticles: Synthesis Characterization and Applications,
D. Feldheim and C. Foss (ed.), Marcel Dekker, New York, 2002, p.
89.
33. J. J. Mock, M. Barbic, D. R. Smith, D. A. Schultz and S. Schultz,
J. Chem. Phys., 2002, 116, 6755.
34. R. Jin, Y. Cao, C. A. Mirkin, K. L. Kelly, G. C. Schatz and
J. G. Zheng, Science, 2001, 294, 1901–1903.
35. A. Merkoci, FEBS J., 2007, 274, 310.
36. J. F. Hicks, D. T. Miles and R. W. Murray, J. Am. Chem. Soc.,
2002, 124, 13322.
37. R. R. Peterson and D. C. Cliffel, Langmuir, 2006, 22, 10307.
38. I. Willner, B. Basner and B. Willner, FEBS J., 2007, 274, 302.
39. Y. Xiao, F. Patolsky, E. Katz, J. F. Hainfeld and I. Willner, Science,
2003, 299, 1877.
40. J. J. Storhoff, R. Elghanian, R. C. Mucic, C. A. Mirkin and R. L.
Letsinger, J. Am. Chem. Soc., 1998, 120, 1959.
41. T. A. Taton, C. A. Mirkin and R. L. Letsinger, Science, 2000, 289,
1757.
42. S.-J. Park, T. A. Taton and C. A. Mirkin, Science, 2002, 295,
1503–1506.
43. F. E. Round, R. M. Crawford and D. G. Mann, The Diatoms:
Biology and Morphology of the Genera, Cambridge University Press,
Cambridge, 1990.
44. N. Kroger, R. Deutzmann and M. Sumper, Science, 1999, 286, 1129.
45. N. Kroger, R. Deutzmann and M. Sumper, J. Biol. Chem., 2001,
276, 26066.
46. M. R. Knecht and D. W. Wright, Chem Commun., 2003, 3038.
47. L. F. Deravi, J. D. Swartz and D. W. Wright, The Biomimetic
Synthesis of Metal Oxide Nanomaterials, Nanomaterials for the Life
Sciences; Vol 2. Ed. Challa Kumar: Wiley-VCH Verlag GmbH &
Co. KgaA, In Press, Pages 1–59.
48. M. R. Knecht and D. W. Wright, Langmuir, 2004, 20, 4728.
49. M. R. Knecht and D. W. Wright, Chem. Mater., 2004, 16, 4890.
50. J. M. Whitling, G. Spreitzer and D. W. Wright, Adv. Mater., 2000,
12, 1377.
51. C. T. Dameron, R. N. Reese, R. K. Mehra, A. R. Kortan, P. J.
Carroll, M. L. Steigerwald, L. E. Brus and D. R. Winge, Nature,
1989, 338, 596.
243Bionanotechnology

52. U. Kriplani and B. K. Kay, Curr. Opin. Biotechnol., 2005, 16, 470.
53. S.-W. Lee, C. Mao, C. E. Flynn and A. M. Belcher, Science, 2002,
296, 892.
54. C. E. Flynn, C. Mao, A. Hayhurst, J. L. Williams, G. Georgiou,
B. Iverson and A. M. Belcher, J. Mater. Chem., 2003, 13, 2414.
55. E. Gazit, FEBS J., 2007, 274, 317.
56. R. Djalali, Y. Chen and H. Matsui, J. Am. Chem. Soc., 2002, 124,
13660.
57. R. Djalali, J. Samson and H. Matsui, J. Am. Chem. Soc., 2004, 126,
7935.
244 Chapter 8
CHAPTER 9
Molecular Engineering of Antibodies
JAMES D. MARKS
Department of Anesthesia and Pharmaceutical Chemistry, University of
California, San Francisco, San Francisco General Hospital, 1001 Potrero
Avenue, San Francisco CA 94110, USA
9.1 INTRODUCTION
Antibodies are one of the effector molecules of the vertebrate humoral
immune system. They are generated in vivo in response to the presence of
foreign pathogens or molecules (antigens), bind specifically to the antigen
and result in its neutralization and elimination. One of the characteristics
of antibodies is that they can bind with high affinity and specificity to
only the target antigen and not to any of the tens of thousands of other
proteins and potential antigens in the circulation. This specific and high
affinity binding led to the appreciation that antibodies could be the so-
called ‘magic bullets’ proposed by Ehrlich at the turn of the 20th century:
molecules that could selectively target a disease-causing organism and
deliver a toxic payload, killing only the organism targeted.
As will be described below, antibodies in the serum of immunized ani-
mals were some of the first therapeutics used for infectious diseases, at a
time before antibiotics had been discovered. Yet it took more than 100
years from this initial use of serum therapy for antibodies to begin to be
approved by the US Food and Drug Administration (FDA) for the treat-
ment of human diseases. The first such antibodies entered clinical practice
in the 1990s and today there are currently 21 therapeutic antibodies
Molecular Biology and Biotechnology, 5th Edition
Edited by John M Walker and Ralph Rapleyr Royal Society of Chemistry 2009
Published by the Royal Society of Chemistry, www.rsc.org
245
approved by the FDA which had sales of more than $15 billion in 2006.
Most of these antibodies have been approved for clinical use within the last
10 years and it is estimated that there are at least 100 antibodies in the
different phases of human clinical trials for a wide range of diseases,
including cancer, inflammatory diseases and infectious diseases.1–3
The era of antibodies as therapeutics became possible with the advent of
hybridoma technology in 1975, a technological breakthrough that resulted
in the ability to clone single B-cells and the single antibody made by that B-
cell (Figure 9.1).4 Such monoclonal antibodies (mAbs), unlike the hun-
dreds to thousands of antibodies in serum, recognized only a single antigen
and could be made in virtually unlimited quantities. Unfortunately, the
technology was developed to make mAbs from the B-cells of immunized
mice and it has proven technically challenging to apply the technology to
generate human mAbs.5 As it turns out, when murine mAbs are admi-
nistered to humans, they elicit an immune response, called the human anti-
mouse antibody response (HAMA) that either results in unacceptable
systemic reactions or results in rapid clearance of the mAb from the
bloodstream.6,7While many mAbs from hybridomas entered clinical trials,
few were approved by the FDA due to the limitations described above.
With the advent of molecular cloning and protein engineering techno-
logies in the late 1980s, it has proven possible to engineer murine mAbs to
have sequences more similar to human mAbs, so called chimeric8–10 and
humanized antibodies. Such antibodies have proven significantly less
immunogenic than murine mAbs and many of these are now approved for
clinical use. More recently, it has proven possible to make mAbs that are
fully human in sequence using antibody gene diversity libraries and display
technologies (see Refs 11 and 12 for reviews), and also mice that are
transgenic for the human immunoglobulin loci.13
In the following sections, we will review the increasing importance of
antibodies as a therapeutic class and review antibody structure, gen-
eration and function. We will use this information as background to
describe the molecular engineering techniques of chimerization and
humanization that have yielded the first widely successful therapeutic
antibodies. We will then describe how the more recent techniques using
diversity libraries and display technologies can be used to generate full
human antibodies and to evolve antibody affinity to values not typically
generated by the humoral immune system.
9.2 ANTIBODIES AS THERAPEUTICS
Antibody therapy began approximately a century ago with the discovery
that serum from animals immunized with toxins, e.g. diphtheria toxin or
246 Chapter 9
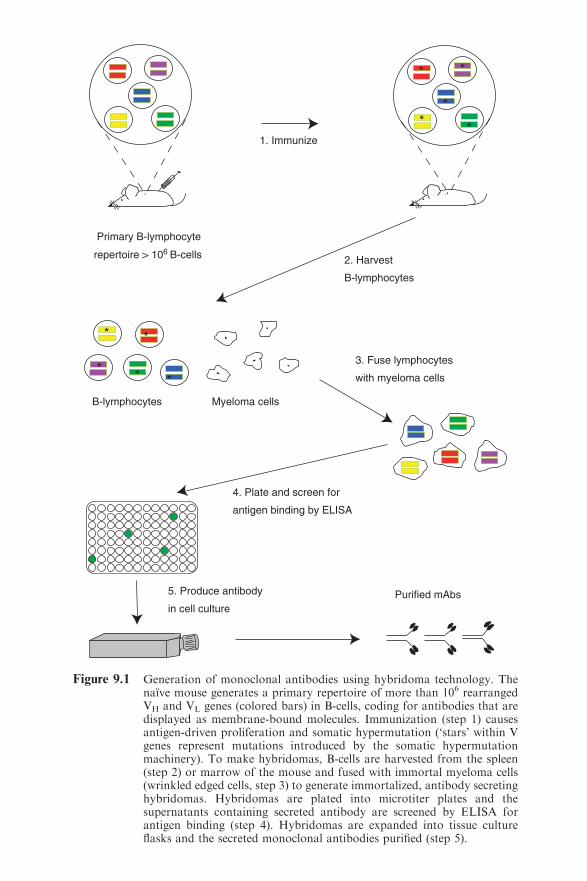
B-lymphocytes Myeloma cells
Primary B-lymphocyte
repertoire > 106 B-cells
1. Immunize
2. Harvest
B-lymphocytes
3. Fuse lymphocytes
with myeloma cells
4. Plate and screen for
antigen binding by ELISA
5. Produce antibody
in cell culture
Purified mAbs
Figure 9.1 Generation of monoclonal antibodies using hybridoma technology. Thenaıve mouse generates a primary repertoire of more than 106 rearrangedVH and VL genes (colored bars) in B-cells, coding for antibodies that aredisplayed as membrane-bound molecules. Immunization (step 1) causesantigen-driven proliferation and somatic hypermutation (‘stars’ within Vgenes represent mutations introduced by the somatic hypermutationmachinery). To make hybridomas, B-cells are harvested from the spleen(step 2) or marrow of the mouse and fused with immortal myeloma cells(wrinkled edged cells, step 3) to generate immortalized, antibody secretinghybridomas. Hybridomas are plated into microtiter plates and thesupernatants containing secreted antibody are screened by ELISA forantigen binding (step 4). Hybridomas are expanded into tissue cultureflasks and the secreted monoclonal antibodies purified (step 5).

viruses, was an effective therapy for the disease caused by the same agent
in humans. While capable of potent antigen neutralization, such sera
contain hundreds to thousands of different antibodies with only
approximately 1% of the antibodies binding to the immunizing antigen.
In the 1880s, von Behring developed an antitoxin that neutralized the
toxin that the Diphtheria bacillus released into the body and was
awarded the first Nobel Prize in Medicine in 1901 for his role in the
discovery and development of serum therapy for diphtheria.
Following the initial successes in the late 1800s, sera from humans or
animals containing antibodies were widely used for prophylaxis and
therapy of viral and bacterial diseases.14,15 Serum therapy of most bac-
terial infections was abandoned in the 1940s, however, after antibiotics
became widely available.14 Polyclonal antibody preparations have con-
tinued to be used for some toxin-mediated infectious diseases and veno-
mous bites.16 Serum immunoglobulin has also continued to be used for
viral diseases where there are few treatments available, although immu-
noglobulin is largely used for pre- or post-exposure prophylaxis.17,18
Although serum polyclonal antibody preparations have been clini-
cally effective in many cases, they have problems related to toxicity,
including a significant risk of allergic reactions including anaphylactic
shock and serum sickness.19 Other limitations of polyclonal antibodies
include lot to lot variations in potency and side-effects and uncertainty
in dosing due to these effects.16 In addition, the active antigen-specific
antibodies in a polyclonal preparation typically represent a relatively
small proportion of the total antibodies (1%); the rest of the anti-
bodies are not only ineffective but could even be toxic or immuno-
genic. However, until the 1970s it was not possible to produce
large amounts of antibodies with the desired specificity from a single
antibody-producing B-cell.
Development of hybridoma technology made it possible to clone
single B-cells and the single antibody made by that B-cell (Figure 9.1).4
Molecular cloning techniques then made it possible to replace geneti-
cally the mouse constant regions of the mouse antibody with human
constant regions yielding chimeric antibodies, antibodies that are
approximately 90% human in sequence (Figure 9.2) (refs. 8–10). Chi-
meric antibodies are far less immunogenic than murine antibodies.
Therapeutic antibodies were ushered into a ‘take-off ’ phase by the 1997
launch of the chimeric antibody Rituxan (rituximab) for non-Hodgkin’s
lymphoma (NHL). Rituxan represented the first mAb product to suc-
ceed commercially in a high-revenue/high-growth market (oncology)
and to provide significant enhancements in the efficacy of treatment
versus existing non-mAb therapies. As a result, Rituxan rapidly became
248 Chapter 9
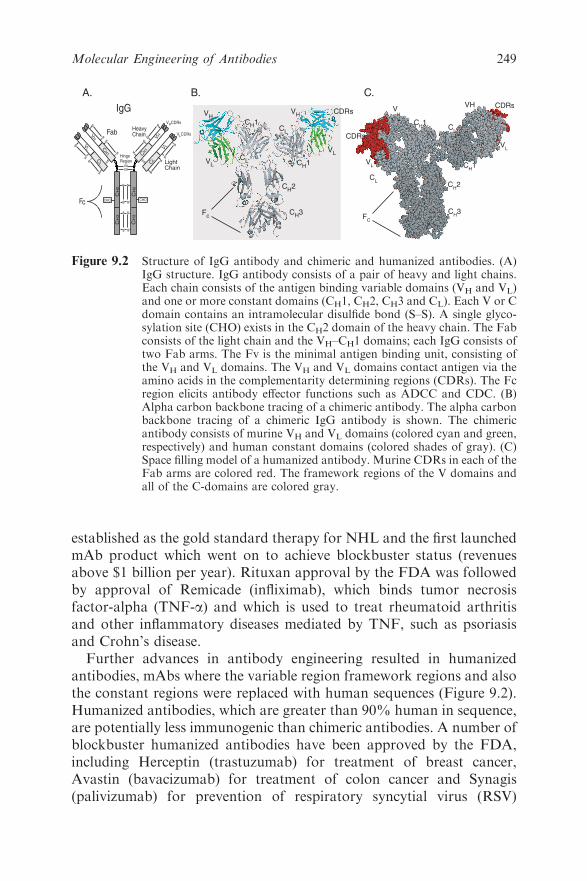
established as the gold standard therapy for NHL and the first launched
mAb product which went on to achieve blockbuster status (revenues
above $1 billion per year). Rituxan approval by the FDA was followed
by approval of Remicade (infliximab), which binds tumor necrosis
factor-alpha (TNF-a) and which is used to treat rheumatoid arthritis
and other inflammatory diseases mediated by TNF, such as psoriasis
and Crohn’s disease.
Further advances in antibody engineering resulted in humanized
antibodies, mAbs where the variable region framework regions and also
the constant regions were replaced with human sequences (Figure 9.2).
Humanized antibodies, which are greater than 90% human in sequence,
are potentially less immunogenic than chimeric antibodies. A number of
blockbuster humanized antibodies have been approved by the FDA,
including Herceptin (trastuzumab) for treatment of breast cancer,
Avastin (bavacizumab) for treatment of colon cancer and Synagis
(palivizumab) for prevention of respiratory syncytial virus (RSV)
Figure 9.2 Structure of IgG antibody and chimeric and humanized antibodies. (A)IgG structure. IgG antibody consists of a pair of heavy and light chains.Each chain consists of the antigen binding variable domains (VH and VL)and one or more constant domains (CH1, CH2, CH3 and CL). Each V or Cdomain contains an intramolecular disulfide bond (S–S). A single glyco-sylation site (CHO) exists in the CH2 domain of the heavy chain. The Fabconsists of the light chain and the VH–CH1 domains; each IgG consists oftwo Fab arms. The Fv is the minimal antigen binding unit, consisting ofthe VH and VL domains. The VH and VL domains contact antigen via theamino acids in the complementarity determining regions (CDRs). The Fcregion elicits antibody effector functions such as ADCC and CDC. (B)Alpha carbon backbone tracing of a chimeric antibody. The alpha carbonbackbone tracing of a chimeric IgG antibody is shown. The chimericantibody consists of murine VH and VL domains (colored cyan and green,respectively) and human constant domains (colored shades of gray). (C)Space filling model of a humanized antibody. Murine CDRs in each of theFab arms are colored red. The framework regions of the V domains andall of the C-domains are colored gray.
249Molecular Engineering of Antibodies

infection. Recently Humira (adalimumab), the first fully human anti-
body produced via phage display technology, was licensed by the FDA.
It, too, has achieved blockbuster status. Currently, more than 100mAbs
are in various stages of clinical trials to treat a range of human diseases,
including cancers and inflammatory and infectious diseases.2,3 These
antibodies are primarily humanized and fully human antibodies gener-
ated and optimized using antibody engineering technologies.3 More-
over, a number of engineering strategies have been deployed to enhance
antibody potency and the resulting antibody-based drugs
have entered clinical trials. These include antibody–drug conjugates,20
antibody–toxin fusion proteins21 and antibody where the Fc portion
of the antibody has been engineered to elicit more effectively antibody-
dependent cellular cytotoxicity (ADCC) or complement dependent
cytotoxicity (CDC).22 The engineering techniques used to generate
therapeutic antibodies will be discussed in the following sections, after a
review of antibody structure and function.
9.3 ANTIBODY STRUCTURE AND FUNCTION
Antibodies are Y-shaped dichain glycoproteins of molecular mass
approximately 150 kDa (Figure 9.2). They consist of two heavy chains
and two light chains, with each chain consisting of two or more domains
that share the immunoglobulin fold. Each domain is a pleated beta sheet
with an intramolecular disulfide bond. The light chain consists of two
domains, a light chain variable domain (VL) and a light chain constant
domain (CL). There are two types of light chains, kappa and lambda. In
humans, approximately two-thirds of light chains are kappa and one-
third are lambda. The heavy chain consists of four to five domains,
depending on the antibody isotype, and includes a heavy chain variable
domain (VH) and three to four constant domains (CH1, CH2, CH3 and
CH4). There are a number of different isotypes of antibodies, which
include IgG, IgD, IgA, IgM and IgE. The major isotype present in
the circulation is IgG, which is also the isotype most frequently used
for therapeutic antibodies. The light chains are disulfide linked to the
VH–CH1 domains to make the antigen binding fragment (Fab). The two
Fabs are linked via the hinge region to the Fc domain, which consists of
CH2–CH3 or CH2–CH4 domains. The Fc region is involved in the elicita-
tion of antibody effector functions including the ability of antibody to
mediate cellular killing by immune effector cells [antibody-dependent
cellular cytotoxicity (ADCC)] or complement [antibody-dependent
cellular cytotoxicity (CDC)].
250 Chapter 9

The smallest antibody fragment capable of binding antigen is the
fragment variable or Fv. The Fv consists of the VH and VL domains
(Figure 9.2). Within each of the V domains are three complementarity-
determining regions (CDRs), which form loops that comprise the anti-
gen binding region of the V domains. CDRs were first identified by
Kabat and Wu as regions with the greatest sequence diversity when
different V domains were compared to each other and are also called the
hypervariable regions.23 The six CDRs contribute the majority of the
amino acid side-chains that make direct contact with antigen.24,25 Each
CDR is flanked by regions of more conserved sequence that make up the
variable region framework regions.26,27 The frameworks fold into the
b-strands that comprise the two b-sheets of each V domain and which
support the CDRs.
9.4 CHIMERIC ANTIBODIES
As described in Section 9.2, the development of chimeric antibodies was
a significant leap forward for the therapeutic antibody field.8,28,29 To
reduce the immunogenicity of murine antibodies, the murine variable
regions were grafted on to human kappa light chain and gamma heavy
chain constant regions (Figure 9.2B). This is relatively straightforward
as the V regions and C regions are contiguous pieces of DNA and each
domain folds independently.
For chimerization, the DNA encoding the antibody heavy (VH) and
light (VL) chain variable region genes must be cloned from the hybri-
doma cell. Prior to the development of the polymerase chain reaction
(PCR), this required cDNA cloning of the variable region genes. With
the advent of PCR, 50 PCR primers were initially designed based on
N-terminal protein sequencing of the variable regions from the heavy
and light chain.30Design of the 30 primer was more straightforward, as it
could be based in the constant regions. A major breakthrough was the
development of partially degenerate universal V region primers based on
sequence databases that could be used to amplify and directionally clone
most murine variable regions without the need for protein sequen-
cing31,32 (Figure 9.3). Additional groups have designed sets of universal
V gene primers containing internal or appended restriction sites suitable
for amplification of murine,33–38 human,39–43 chicken44 and rabbit45 V
genes. Once the VH and VL genes have been cloned, they can be directly
forced into cloning vectors by incorporating restriction sites into the pri-
mers.40,46 Alternatively, PCR can be used to combine VH and VL genes
directly with linker DNA using splicing by overlap extension to generate
antigen binding antibody fragment constructs such as those encoding
251Molecular Engineering of Antibodies

IgM, IgG constant region primer
heavy chain mRNA
1. First strand cDNA synthesis
κ, λ constant region primer
VH forward primers
1st strand VH cDNA
VH back primers
2. PCR amplification of VH and VL genes
1st strand VL cDNA
AAAAA CH1 VH CH3 CH2 AAAAA CL VL
light chain mRNA
CH1 VH CH3 CH2 CL VL
VL forward primers
VL back primers
OR
VH gene(s)
3a. Clone VH and VL separately
VL gene(s)
VH gene linker
scFv gene or gene repertoire
VL gene
linker DNA
VH gene VL gene
Cloning vectors
3b. PCR splice VH and VL into scFv gene
Figure 9.3 PCR cloning of antibody V genes. (1) mRNA is isolated from hybridomacells, peripheral blood lymphocytes, spleen or bone marrow and antibodygenes are reverse transcribed (by using reverse transcriptase) using IgG,IgM, k or l constant-region specific primers, creating first strand cDNA.(2) The VH and VL variable region genes are amplified using PCR anduniversal primer mixtures specific for the 50 (back primers) and 30 (forwardprimers) ends of the heavy and light chain V genes. (3a) Amplified VH andVL gene DNA is purified and cloned into cloning vectors for DNAsequencing. By incorporating restriction sites into the primers, it is pos-sible to directionally clone the V genes. (3b) Alternatively, the amplifiedVH and VL genes can be combined with a short ‘linker DNA’ whichoverlaps the 30 and 50 ends of the VH and VL genes, respectively, and PCRamplified to yield one continuous DNA fragment. The linker DNAencodes a flexible peptide that links the VH and VL gene to generate ssingle-chain Fv (scFv) gene. A final PCR reaction (not shown) addsflanking restriction sites to the assembled scFv gene for cloning intobacterial secretion vectors or display vectors.
252 Chapter 9
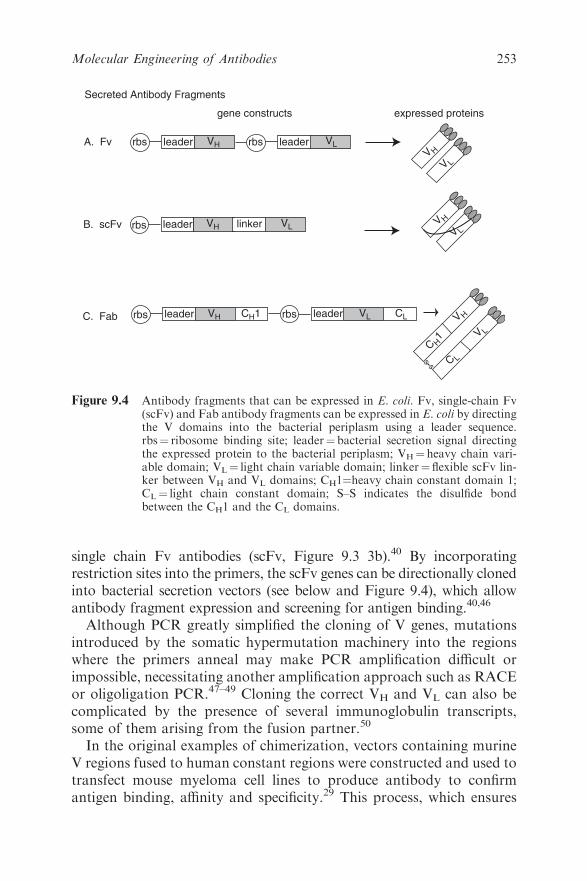
single chain Fv antibodies (scFv, Figure 9.3 3b).40 By incorporating
restriction sites into the primers, the scFv genes can be directionally cloned
into bacterial secretion vectors (see below and Figure 9.4), which allow
antibody fragment expression and screening for antigen binding.40,46
Although PCR greatly simplified the cloning of V genes, mutations
introduced by the somatic hypermutation machinery into the regions
where the primers anneal may make PCR amplification difficult or
impossible, necessitating another amplification approach such as RACE
or oligoligation PCR.47–49 Cloning the correct VH and VL can also be
complicated by the presence of several immunoglobulin transcripts,
some of them arising from the fusion partner.50
In the original examples of chimerization, vectors containing murine
V regions fused to human constant regions were constructed and used to
transfect mouse myeloma cell lines to produce antibody to confirm
antigen binding, affinity and specificity.29 This process, which ensures
rbs leader VH VL linker
rbs leader VH VL leader rbs A. Fv
B. scFv
C. Fab
V H
V L
V H
V L
rbs leader VH rbs CH1 VL leader CL
Secreted Antibody Fragments
V H
C H1 V L
C L s s
gene constructs expressed proteins
Figure 9.4 Antibody fragments that can be expressed in E. coli. Fv, single-chain Fv(scFv) and Fab antibody fragments can be expressed in E. coli by directingthe V domains into the bacterial periplasm using a leader sequence.rbs¼ ribosome binding site; leader¼ bacterial secretion signal directingthe expressed protein to the bacterial periplasm; VH¼ heavy chain vari-able domain; VL¼ light chain variable domain; linker¼ flexible scFv lin-ker between VH and VL domains; CH1¼heavy chain constant domain 1;CL¼ light chain constant domain; S–S indicates the disulfide bondbetween the CH1 and the CL domains.
253Molecular Engineering of Antibodies
that the correct VH and VL genes have been cloned from the hybridoma,
takes several months if one constructs stable mammalian cell lines, for
example in myeloma cells. An alternative would be to express the chi-
meric antibody transiently in mammalian cells such as COS-7 cells,
cutting the time from cloning to screening for antigen binding to several
weeks. Commercially, full-length IgG (chimeric, humanized or human)
are typically expressed in Chinese hamster ovary (CHO) cells at yields
greater than 1 g l�1.
A major step forward in antibody engineering occurred with the
discovery that antibody fragments could be expressed in bacteria, such
as E. coli (Figure 9.4). Due to the rapid growth of bacteria, time from V
gene cloning to screening of antibody fragments for binding can as short
as several days. It is now common practice after cloning V genes from
hybridomas to express them as antibody fragments in bacteria to verify
antigen binding prior to construction of chimeric IgG or prior to
humanization (see below). Initial attempts to express full-length anti-
body in the cytoplasm of E. coli resulted in very low yields of insoluble
protein that required solubilization and refolding.51,52 A significant
breakthrough occurred when it was discovered that antigen binding
fragments of antibodies could be produced in properly folded soluble
form if expression of the antibody fragment was directed into the
periplasmic space. Secretion into the periplasm was directed by attach-
ing signal sequences such as pelB to the N-terminus of the antibody
fragment genes (Figure 9.4). The oxidizing environment of the periplasm
results in proper folding and intramolecular disulfide bond formation.
Both the Fab and the Fv antigen binding fragments can be expressed in
E. coli where they can be harvested from the bacterial periplasm.53,54
Fvs, however, are not particularly stable; the VH and VL domains are
not covalently linked and they tend to dissociate at typically expressed
concentrations.55,56 Fvs can be stabilized by physically linking the VH
and VL domains together with a flexible peptide linker to create the
single chain Fv antibody fragments (scFv).57,58 Alternatively, cysteines
can be engineered into both the VH and VL domains, resulting in di-
sulfide bond formation when the V domains pair, a so-called disulfide
linked Fv.59
As described in Section 9.2, a number of chimeric antibodies have been
approved by the FDA and entered clinical practice, including rituximab
and infliximab. Chimerization reduces the immunogenicity of murine
mAbs and allows multiple and repeated dosing.60,61 Replacing the
murine Fc with a human Fc also results in more efficient effector func-
tions such as ADCC and CDC as the human Fc interacts with human Fc
receptors with higher affinity than the murine Fc. Similarly, chimeric
254 Chapter 9
antibodies have a longer half-life in humans than murine antibodies, due
to more efficient interaction of the human Fc with FcRn. Despite their
successes, however, chimeric antibodies can still be immunogenic. A
human anti-chimeric antibody (HACA) response is frequently observed
and in some cases can be severe and require discontinuation of the
antibody or result in its ineffectiveness.60,61 As a result, techniques to
generate more fully human antibodies were developed.
9.5 ANTIBODY HUMANIZATION
As illustrated in Figure 9.2, the VH and VL CDRs comprise the antigen
binding site and contain the majority of amino acids that make direct
contact with antigen. Jones et al. hypothesized that the CDRs from a
murine antibody could be ‘grafted’ on to human frameworks to make a
so called ‘humanized’ antibody.62 Grafting the CDRs from the VH
domain of a murine antibody to an hapten antigen on to human fra-
meworks resulted in an antibody that bound the hapten with compar-
able affinity when combined with the murine light chain variable
domain.62 Such CDR grafting has been applied to an anti-lymphocyte
mAb and to an antibody to respiratory syncytial virus (RSV), but is not
always successful due to the critical role that framework residues may
play in both supporting the proper conformation of the CDRs and
contributing antigen contacting amino acids.63,64
With the determination of a large number of antibody X-ray crystal-
lographic structures, many now take a more directed approach to
humanization.65 After the murine VH and VL genes have been sequenced,
human frameworks are selected that are the most homologous to the
murine V genes. This is straightforward given the large number of anti-
body sequence databases, including those of Kabat (http://www.bioinf.
org.uk/abs/seqtest.html) and IMGT (http://imgt.cines.fr/). Modeling the
human frameworks and mouse CDRs on to a homologous antibody
structure allows the identification of murine residues that may either
contact antigen or directly or indirectly influence the conformation of the
CDRs. Finally, amino acids in the human frameworks that are ‘rare’ or
‘unusual’ are replaced with residues more typical of those positions.
Approaches such as this tend to retain more murine residues in the frame-
work regions than with CDR grafting and have been used to humanize
antibodies to the interleukin receptor and interferon-gamma.65,66
A number of variations to the above approach have been developed.
These include replacing murine CDR residues that are outside the
antigen binding loops with human residues, as done by Presta and
colleagues,67,68 the use of human germline V genes as the acceptor
255Molecular Engineering of Antibodies
frameworks and grafting the murine CDRs into human frameworks
with the most homologous CDRs, as opposed to most homologous V
genes or frameworks (superhumanization).69 Alternatively, library
approaches, as described below, can be used to humanize murine anti-
bodies.70,71 In these approaches, one of the murine V domains, for
example the VH domain, is paired with a library of human light chains
and a chimeric antibody containing murine VH and human VL is
selected. The murine VH is then replaced with a library of human VHs
paired to the new human VL and a fully human antibody is selected.
With any of these methodologies, it can be anticipated that the binding
constants of the humanized antibodies may be less than those of the
parental antibodies. If so, additional constructs can be generated and
evaluated or library approaches can be used to return affinity to that of
the parental antibody (see below).
More than half of the antibody therapeutics licensed by the FDA are
humanized antibodies. These include such ‘blockbuster’ antibodies as
Herceptin (trastuzmab) for the treatment of breast cancer, Avastin
(bavacizumab) for treatment of colon cancer and Synagis (palivizumab)
for prevention of respiratory syncytial virus (RSV) infection. Human-
ized antibodies are clearly less immunogenic than murine antibodies.
They also appear to be less immunogenic in some instances than chi-
meric antibodies. Humanized antibodies are not completely free of
immunogenicity and anti-humanized antibody responses (HAHA) can
be detected in some patients. Such responses may be related to the
number of non-human amino acids retained in the humanized anti-
bodies, in addition to the dose, the immunocompetence of the individual
and the specific target of the antibody.
9.6 ANTIBODIES FROM DIVERSITY LIBRARIES AND
DISPLAY TECHNOLOGIES
The pharmaceutical industry discovers small molecule drugs by
screening very large compound libraries to obtain lead ‘hits’ with affi-
nities in the micromolar range. The tools of medicinal chemistry are then
applied to these leads to improve their binding to the drug target,
resulting in a new drug entity. In the late 1980s, advances in molecular
biology made it possible to apply the same type of strategy to the dis-
covery of fully human antibodies. Libraries of millions to billions of
different antibodies could be generated and methods were developed
that allowed the isolation of rare lead antibodies binding to a specific
target antigen. As with the medicinal chemists, similar methods could be
applied to diversify the structure of lead antibodies and allow the
256 Chapter 9
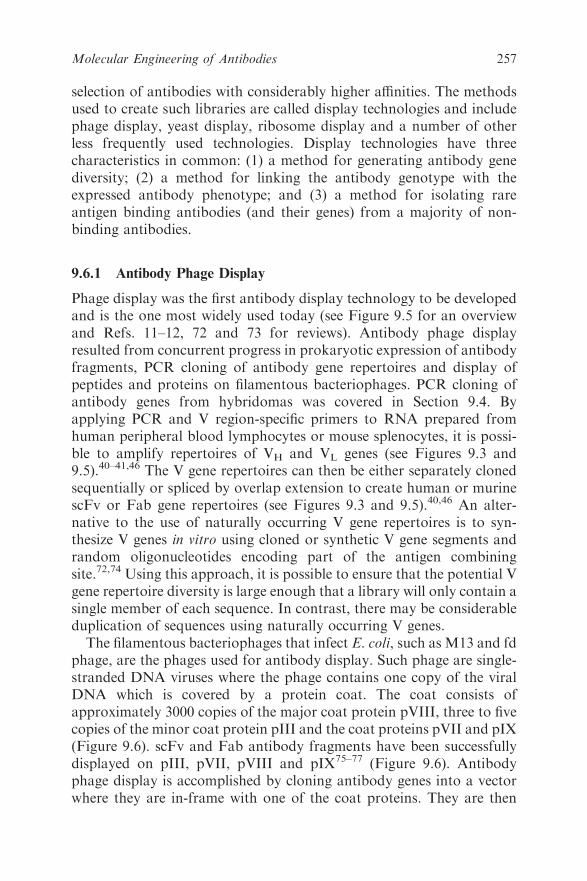
selection of antibodies with considerably higher affinities. The methods
used to create such libraries are called display technologies and include
phage display, yeast display, ribosome display and a number of other
less frequently used technologies. Display technologies have three
characteristics in common: (1) a method for generating antibody gene
diversity; (2) a method for linking the antibody genotype with the
expressed antibody phenotype; and (3) a method for isolating rare
antigen binding antibodies (and their genes) from a majority of non-
binding antibodies.
9.6.1 Antibody Phage Display
Phage display was the first antibody display technology to be developed
and is the one most widely used today (see Figure 9.5 for an overview
and Refs. 11–12, 72 and 73 for reviews). Antibody phage display
resulted from concurrent progress in prokaryotic expression of antibody
fragments, PCR cloning of antibody gene repertoires and display of
peptides and proteins on filamentous bacteriophages. PCR cloning of
antibody genes from hybridomas was covered in Section 9.4. By
applying PCR and V region-specific primers to RNA prepared from
human peripheral blood lymphocytes or mouse splenocytes, it is possi-
ble to amplify repertoires of VH and VL genes (see Figures 9.3 and
9.5).40–41,46 The V gene repertoires can then be either separately cloned
sequentially or spliced by overlap extension to create human or murine
scFv or Fab gene repertoires (see Figures 9.3 and 9.5).40,46 An alter-
native to the use of naturally occurring V gene repertoires is to syn-
thesize V genes in vitro using cloned or synthetic V gene segments and
random oligonucleotides encoding part of the antigen combining
site.72,74 Using this approach, it is possible to ensure that the potential V
gene repertoire diversity is large enough that a library will only contain a
single member of each sequence. In contrast, there may be considerable
duplication of sequences using naturally occurring V genes.
The filamentous bacteriophages that infect E. coli, such as M13 and fd
phage, are the phages used for antibody display. Such phage are single-
stranded DNA viruses where the phage contains one copy of the viral
DNA which is covered by a protein coat. The coat consists of
approximately 3000 copies of the major coat protein pVIII, three to five
copies of the minor coat protein pIII and the coat proteins pVII and pIX
(Figure 9.6). scFv and Fab antibody fragments have been successfully
displayed on pIII, pVII, pVIII and pIX75–77 (Figure 9.6). Antibody
phage display is accomplished by cloning antibody genes into a vector
where they are in-frame with one of the coat proteins. They are then
257Molecular Engineering of Antibodies
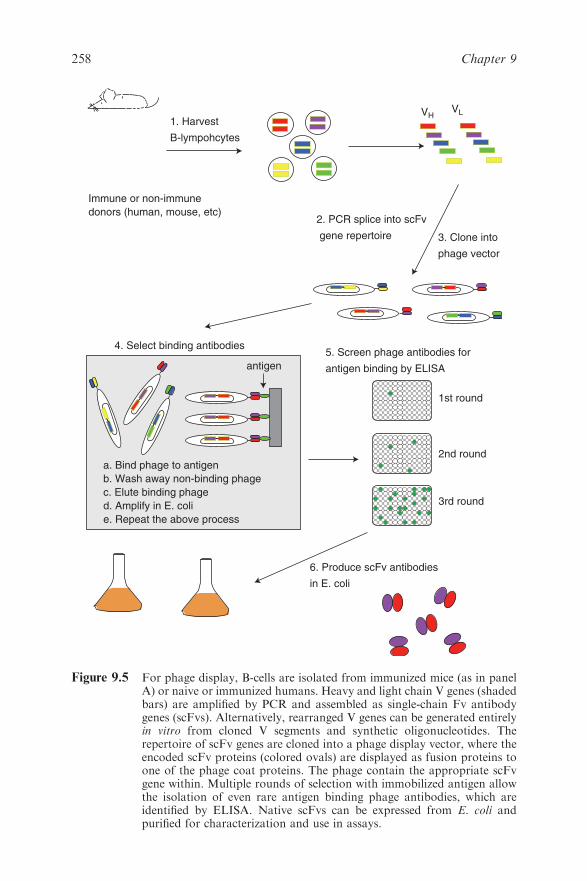
6. Produce scFv antibodies
in E. coli
antigen binding by ELISA
5. Screen phage antibodies for
3rd round
2nd round
1st round
4. Select binding antibodies
phage vector
3. Clone into gene repertoire
2. PCR splice into scFv
Immune or non-immune
donors (human, mouse, etc)
1. Harvest
B-lympohcytes
VLVH
antigen
e. Repeat the above process
d. Amplify in E. coli
c. Elute binding phage
b. Wash away non-binding phage
a. Bind phage to antigen
Figure 9.5 For phage display, B-cells are isolated from immunized mice (as in panelA) or naive or immunized humans. Heavy and light chain V genes (shadedbars) are amplified by PCR and assembled as single-chain Fv antibodygenes (scFvs). Alternatively, rearranged V genes can be generated entirelyin vitro from cloned V segments and synthetic oligonucleotides. Therepertoire of scFv genes are cloned into a phage display vector, where theencoded scFv proteins (colored ovals) are displayed as fusion proteins toone of the phage coat proteins. The phage contain the appropriate scFvgene within. Multiple rounds of selection with immobilized antigen allowthe isolation of even rare antigen binding phage antibodies, which areidentified by ELISA. Native scFvs can be expressed from E. coli andpurified for characterization and use in assays.
258 Chapter 9
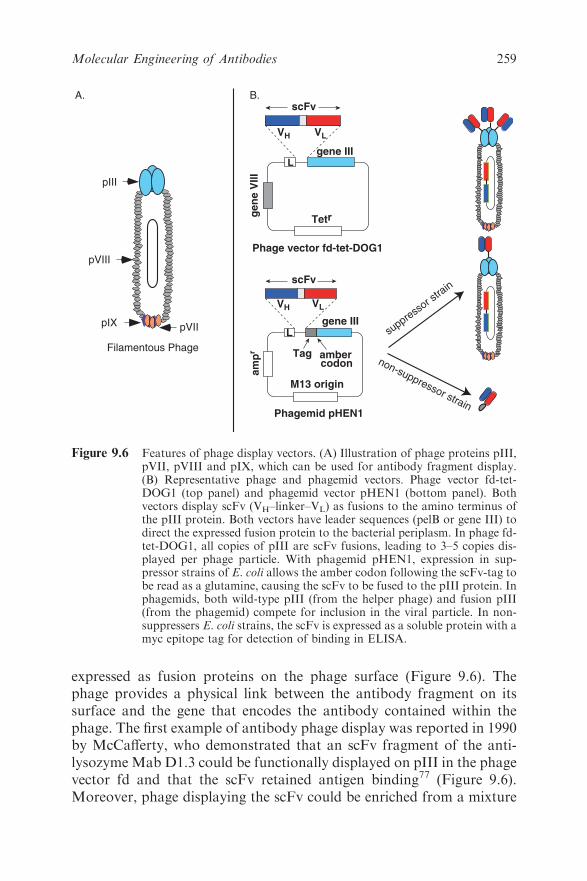
expressed as fusion proteins on the phage surface (Figure 9.6). The
phage provides a physical link between the antibody fragment on its
surface and the gene that encodes the antibody contained within the
phage. The first example of antibody phage display was reported in 1990
by McCafferty, who demonstrated that an scFv fragment of the anti-
lysozymeMab D1.3 could be functionally displayed on pIII in the phage
vector fd and that the scFv retained antigen binding77 (Figure 9.6).
Moreover, phage displaying the scFv could be enriched from a mixture
A.
pVIII
pIII
Filamentous Phage
scFv
VH
L
VL
gene III
Phage vector fd-tet-DOG1g
en
e V
III
Tetr
B.
scFv
VH
L
VL
gene III
Phagemid pHEN1
am
pr Tag
M13 origin
ambercodon
pIX pVII suppre
ssor s
train
non-suppressor strain
Figure 9.6 Features of phage display vectors. (A) Illustration of phage proteins pIII,pVII, pVIII and pIX, which can be used for antibody fragment display.(B) Representative phage and phagemid vectors. Phage vector fd-tet-DOG1 (top panel) and phagemid vector pHEN1 (bottom panel). Bothvectors display scFv (VH–linker–VL) as fusions to the amino terminus ofthe pIII protein. Both vectors have leader sequences (pelB or gene III) todirect the expressed fusion protein to the bacterial periplasm. In phage fd-tet-DOG1, all copies of pIII are scFv fusions, leading to 3–5 copies dis-played per phage particle. With phagemid pHEN1, expression in sup-pressor strains of E. coli allows the amber codon following the scFv-tag tobe read as a glutamine, causing the scFv to be fused to the pIII protein. Inphagemids, both wild-type pIII (from the helper phage) and fusion pIII(from the phagemid) compete for inclusion in the viral particle. In non-suppressers E. coli strains, the scFv is expressed as a soluble protein with amyc epitope tag for detection of binding in ELISA.
259Molecular Engineering of Antibodies
with wild-type phage by affinity chromatography on a lysozyme column.
Enrichment factors of 103 for one round of selection and 106 for two
rounds of selection were achieved.
A large number of vector systems have subsequently been described
for the display of antibody fragments (Figure 9.6). The vectors differ
primarily with respect to the type of antibody fragment displayed,
Fab76,78,79 or scFv.40,46,77 the fusion partner pIII37,79 or pVIII76,80 and
whether the vector is a phage46,77 or phagemid.37,40,78,79 The most widely
used vectors by far are those that display scFv or Fab antibody frag-
ments as pIII fusions in phagemid vectors (Figure 9.6). pIII display
appears to be more robust than display on the other phage proteins;
phagemids result in much higher transformation efficiencies, leading to
larger antibody library sizes. Use of a phagemid vector results in
‘monovalent’ antibody fragment display compared with display in true
phage vectors such as fd (Figure 9.6). This is because phagemid vectors
do not contain the genes for phage proteins other than pIII. The other
genes, and regulatory DNA, are provided in trans by infecting E. coli
with helper phage. Wild-type pIII from the helper phage competes with
the antibody fragment–pIII fusion for incorporation into the phage coat.
scFv or Fab gene repertoires can be cloned into phage or phagemid
display vectors to create what are called ‘libraries’ of phage, each with a
different antibody fragment on its surface and the gene for the antibody
fragment inside (see Figure 9.5). Given the high transformation of
E. coli, it is possible to create libraries containing millions to billions of
different antibodies (Figure 9.5). Rare antibodies binding specific anti-
gens can be isolated from non-binding antibodies by a range of different
types of affinity chromatography. For example, antigen can be adsorbed
on a plastic plate and then phage incubated with immobilized antigen,
non-binding phage removed by washing and bound phage eluted.
A single round of selection will result in a 20–1000-fold enrichment for
binding phage.77 Eluted phage are used to infect E. coli, which produce
more phage for the next round of selection. Repetition of the selection
process makes it possible to isolate binding phage present at frequencies
of less than one in a billion.
Adsorption of protein antigens on plastic may lead to partial or
complete antigen denaturation. The problem of antigen denaturation
can be overcome by selecting a soluble antigen in solution. The antigen
can be chemically tagged, for example by biotinylation, and captured
along with bound phage using avidin or streptavidin magnetic beads.
Alternatively, the antigen can be genetically tagged with a hexahistidine
tag with capture on Ni-NTA agarose or expressed as GST or maltose
binding protein fusions with capture on either glutathione or maltose
260 Chapter 9

columns. Selections can be performed on more complex mixtures of
antigen, including intact cells, provided that measures are taken to
prevent enrichment of phage antibodies which bind to non-relevant cell
surface antigens. Cell surface antigen specific antibodies have been iso-
lated by selecting phage antibody libraries on adult erythrocytes,81 fetal
erythrocytes,82 lymphocytes,83 melanoma cells84 and breast tumor
cells.85 It has also proven possible to select directly phage antibodies that
trigger receptor-mediated endocytosis.85 Such antibodies can be used for
the targeted delivery of therapeutics to the cytosol.
9.6.1.1 Bypassing Hybridoma Technology Using Phage Display
Phage display can be used to bypass hybridoma technology to make scFv
or Fab antibodies from immunized mice, rabbits, chickens or humans or
from humans who have mounted an immune response as a result of
infection or a disease process. Immune lymphocytes are harvested from
peripheral blood lymphocytes, spleen or bone marrow and RNA pre-
pared. scFv or Fab gene repertoires are prepared using PCR as described
above and used to construct phage antibody libraries from which antigen
specific antibodies are isolated using affinity chromatography.
In the first example, an scFv phage antibody library was created from
the V genes of a mouse immunized with the hapten phenyloxazolone.46
An scFv phage antibody library was created from murine V genes and
binding phage antibodies were isolated by selection on an antigen col-
umn. After two rounds of selection, more than 20 unique scFvs were
isolated. The Kd of the highest affinity phage antibodies (1.0� 10�8M)
were comparable to the affinities of IgG from hybridomas constructed
from mice immunized with the same hapten. Similar panels of scFv have
been obtained using phage display and mice immunized with EGF
receptor86 and botulinum neurotoxin type A.33 This approach has also
been used to produce monoclonal chicken44 and rabbit45 antibody
fragments using species specific primers.
Antigen specific antibodies can also be isolated from phage antibody
libraries constructed from the V genes of immunized humans or from
humans mounting an immune response to an infection or disease pro-
cess. Since hybridoma technology has not worked well to generate
human hybridomas, this approach is especially useful for the generation
of human antibodies where an immune response can be induced or is
mounted. Human monoclonal antibody fragments have been isolated
from immunized volunteers or infected patients against tetanus toxin,78
botulinum neurotoxin,87HIV-1,88 hepatitis B,89 hepatitis C,90 respiratory
syncytial virus91 and hemophilus influenza.92 Autoimmune antibodies
have been isolated from patients with SLE93 and myasthenia gravis,94
261Molecular Engineering of Antibodies
and also other autoimmune diseases. There has been success in isolating
antibodies to self-antigens, including tumor antigens, from libraries
constructed from patients with disease95 or after vaccination with tumor
antigen.84
9.6.1.2 Bypassing Immunization using Phage Display
In many instances, it is not feasible or ethical to immunize humans with
antigens to which one desires to produce human antibodies. In addition,
many antigens are evolutionarily conserved and not immunogenic.
Fortunately, phage display technology offers a route to produce human
antibodies directly without immunization. Very large and diverse scFv
or Fab phage antibody libraries are constructed from which it is theo-
retically possible to generate panels of antigens to virtually any antigen.
In the first example, a human scFv gene repertoire was cloned into the
phagemid pHEN-1 to create a non-immune phage antibody library of
3.0� 107 members.40 From this single non-immune library, scFvs were
isolated against more than 20 different antigens, including a hapten,
three different polysaccharides and 16 different proteins. The scFvs were
highly specific for the antigen used for selection and had affinities typical
of the primary immune response with dissociation equilibrium constants
ranging from 1 mM to 15 nM. Larger or more diverse phage antibody
libraries theoretically provide higher affinity antibodies against a greater
number of epitopes on all antigens used for selection.96 At least five
published examples of such very large libraries exist, with sizes ranging
between 109 and 1011. For example, we have constructed a 6.7� 109
member scFv phage antibody library from the V genes of healthy
humans.97 An average of nine scFvs with Kd as high as 3.7� 10�10 M
were isolated to 10 different protein antigens. Antibodies from non-
immune libraries have been used for Western blotting, epitope mapping,
cell agglutination assays, cell staining and FACS. A number have also
entered human clinical trials for the treatment of a range of different
diseases. The non-immune libraries described above represent the cur-
rent state of the art in antibody engineering; the ability to generate high-
affinity human monoclonal scFv or Fab antibody fragments to any
antigen within weeks and without immunization.
9.6.2 Alternative Display Technologies
Although a number of alternative display technologies have been devel-
oped, the two most widely used are yeast display and ribosome display.
For yeast display, scFv antibody gene repertoires are fused to the
262 Chapter 9
Saccharomyces cell surface protein AgaII.98 Antigen specific scFvs are
isolated by subjecting the yeast antibody library to fluorescent activated
cell sorting (FACS) using flow cytometry. Yeast display has been used to
generate lead antibodies from both immune and non-immune antibody
libraries.99,100 Its major use, however, has been to increase the affinity of
antibodies (antibody affinity maturation, see Section 9.7 below).101,102 In
the most impressive example of affinity maturation using yeast display,
the affinity of an scFv was increased more than 1000-fold to 48 fM.101
Potential advantages of yeast compared with phage display include the
ability to select more efficiently higher affinity antibodies using flow
cytometry and the ability to measure antibody fragment affinity with the
antibody in the display format. This obviates the need for antibody
fragment expression and purification. Potential disadvantages of yeast
display include the lower transformation efficiencies of yeast compared
with bacteria.
In ribosome display, scFv antibody gene repertoires encoded by
mRNA are translated in vitro in cell-free systems such that the mRNA
remaining attached to the ribosome along with the scFv.103 The ribo-
some provides the physical link between genotype and phenotype, tak-
ing the place of the phage. Antigen binding scFvs are selected on antigen
and the mRNA encoding the scFv genes amplified by RT-PCR. Tran-
scription and translation of the scFv DNA provide the display library
for the next round of selection. The major advantage of ribosome dis-
play is that no cloning is required, resulting in libraries much greater in
size than those created by cloning. Ribosome display has been suc-
cessfully applied to generate scFvs from immune104 and non-immune105
libraries and for affinity maturation of existing antibodies.105
9.7 ENGINEERING ANTIBODY AFFINITY
Display technologies have been widely used to increase antibody affinity
to values not typically achievable using hybridoma technology.106,107
Mutations are introduced into the DNA of an antigen specific antibody
fragment either randomly using, for example, error prone PCR108 or
specifically using spiked oligonucleotides.109 The mutated antibody
fragment DNA is then used to create a display library either in phage or
yeast or by using ribosome display. Higher affinity antibody fragments
are selected from lower affinity ones by a variety of different affinity
chromatography approaches, including flow cytometry for yeast dis-
played libraries. For example, we reported increasing the affinity of an
HER2 scFv using phage display by more than 1000-fold from 16 nM to
13 pM.109 Others have reported comparable levels of affinity maturation
263Molecular Engineering of Antibodies
to values down to low picomolar to femtomolar affinities using either
phage or yeast display.101,110 These in vitro affinity maturation
approaches have now become routine in the biotechnology field.
9.8 ENHANCING ANTIBODY POTENCY
Although antibodies are an effective class of therapeutics, there is cer-
tainly room for increasing their potency. This is especially true in the
field of cancer therapy. The response rate of antibodies, either as single
drugs or in combination with chemotherapy, ranges from 10 to 50%.
Existing antibody oncologics work by interrupting essential signaling
pathways, such as the epidermal growth factor receptor signaling family,
and/or by eliciting ADCC, CDC or apoptosis. There are a number of
approaches under investigation to enhance antibody potency by either
conjugating antibodies to toxic compounds or by engineering the Fc
portion of the antibody to increase ADCC or CDC.
The concept of enhancing antibody potency via delivery of a toxic
payload dates to the time of Ehrlich, at the turn of the 20th century.
Ehrlich conceptualized magic bullets, molecules that could selectively
target a disease-causing organism and deliver a toxic payload. One of
the first examples of such antibody delivery of toxic payloads are
immunotoxins, antibodies or antibody fragments fused to toxins.111
Toxins that have been utilized, such as Pseudomonas exotoxin, are
highly toxic, with just a few molecules being capable of cell killing.
Therapeutic development of immunotoxins has required overcoming a
number of obstacles, including immunogenicity of bacterial and plant
toxins when administered to humans, the high toxicity of the toxins used
for immunotoxin construction and the development of methods to fuse
toxins to antibodies or antibody fragments.112 scFv antibody fragments
are natural fusion partners for toxins allowing the immunotoxin to be
encoded in a single gene and expressed as a single polypetide chain.113
Although immunogenicity still remains an issue, immunotoxins are now
in clinical trials for cancer and may be especially efficacious against
hematological malignancies.114 An alternative approach is to fuse potent
chemotherapeutic drugs directly to antibodies rather than toxins. Such
antibody–drug conjugates also show dramatic therapeutic affects in
preclinical models and are currently in human clinical trials as cancer
therapies.115
An alternative way to increase the potency of antibodies is to enhance
their inherent cell killing activities that occur via the Fc portion of the
antibody and Fc receptors. This interaction is responsible for antibody-
dependent cellular cytotoxicity (ADCC) and complement-dependent
264 Chapter 9

cellular cytotoxicity (CDC).116,117 The Fc binds to both activating
and inhibitory Fc receptors and, depending on the affinity of the specific
interactions, cell killing occurs. Recently, it has proven possible to engi-
neer the Fc to bind activating Fc receptors more efficiently compared
with inhibitory Fc receptors.22 Such engineered Fcs show enhanced
ADCC in preclinical models of cancer and will be evaluated for
enhanced efficacy in human clinical trials.
9.9 CONCLUSION
The field of antibody engineering effectively began with the engineering
of the first chimeric antibodies back in 1984. In the ensuing 25 years, we
have seen the development of humanized antibodies and also library
approaches to generate directly fully human antibodies to virtually any
antigen, including those that are evolutionarily conserved. Library
techniques have also developed to the point where it is possible to tune
the antibody binding site to virtually any affinity for antigen. At the
same time, these bench-side scientific achievements have translated
into a novel therapeutic pipeline, biological antibodies. There are now
21 therapeutic antibodies approved by the FDA and in clinical use, with
at least 100 more in the various stages of clinical trials. While once the
purview of biotechnology companies, essentially every major pharma-
ceutical company now has a significant effort in the field of therapeutic
antibodies. Antibodies, as protein therapeutics, are capable of inter-
rupting protein–protein interactions, something difficult to achieve with
traditional small-molecule drugs. It is therefore reasonable to expect
that antibodies will continue to be an important and evolving novel class
of therapeutics. We are now seeing the next generation of engineered
antibodies entering clinical trials. These antibodies are ‘armed’ to be
more potent by conjugation to toxins or toxic drugs or by increased
effector functions resulting from engineering of the antibody Fc. It is
reasonable to expect that these advances, and others, will result in
antibodies with even greater therapeutic efficacy.
REFERENCES
1. A. Casadevall, E. Dadachova and L. A. Pirofski, Nat. Rev.
Microbiol., 2004, 2, 695.
2. J. M. Reichert, C. J. Rosensweig, L. B. Faden and M. C. Dewitz,
Nat. Biotechnol., 2005, 23, 1073.
3. J. M. Reichert and V. E. Valge-Archer, Nat. Rev. Drug Discov.,
2007, 6, 349.
265Molecular Engineering of Antibodies
4. G. Kohler and C. Milstein, Nature, 1975, 256, 495.
5. K. James and G. T. Bell, J. Immunol. Methods, 1987, 100, 5.
6. G. J. Jaffers, T. C. Fuller, A. B. Cosimi, P. S. Russel, H. J. Winn
and R. B. Colvin, Transplantation, 1986, 41, 572.
7. C. H. J. Lamers, J. W. Gratama, S. O. Warnaar, G. Stoter and R.
L. H. Bolhuis, Int. J. Cancer, 1995, 60, 450.
8. M. S. Neuberger, G. T. Williams, E. B. Mitchell, S. S. Jouhal, J. G.
Flanagan and T. H. Rabbitts, Nature, 1985, 314, 268.
9. J. Sharon, M. L. Gefter, T. Manser, S. L. Morrison, V. T. Oi and
M. Ptashne, Nature, 1984, 309, 364.
10. S. Takeda, T. Naito, K. Hama, T. Noma and T. Honjo, Nature,
1985, 314, 452.
11. A. R. Bradbury and J. D. Marks, J. Immunol. Methods, 2004,
290, 29.
12. J. D. Marks, H. R. Hoogenboom, A. D. Griffiths and G. Winter,
J. Biol. Chem., 1992, 267, 16007.
13. M. J. Mendez, L. L. Green, J. R. Corvalan, X. C. Jia, C. E.
Maynard-Currie, X. D. Yang, M. L. Gallo, D. M. Louie, D. V.
Lee, K. L. Erickson, J. Luna, C. M. Roy, H. Abderrahim,
F. Kirschenbaum, M. Noguchi, D. H. Smith, A. Fukushima, J. F.
Hales, S. Klapholz, M. H. Finer, C. G. Davis, K. M. Zsebo and
A. Jakobovits, Nat. Genet., 1997, 15, 146.
14. A. Casadevall and M. D. Scharff, Antimicrob. Agents Chemother.,
1994, 38, 1695.
15. A. Casadevall and M. D. Scharff, Clin. Infect. Dis., 1995, 21, 150.
16. A. Casadevall, Clin. Immunol., 1999, 93, 5.
17. J. Bayry, S. Lacroix-Desmazes, M. D. Kazatchkine and S. V.
Kaveri, Trends Pharmacol. Sci., 2004, 25, 306.
18. L. A. Sawyer, Antiviral Res., 2000, 47, 57.
19. R. E. Black and R. A. Gunn, Am. J. Med., 1980, 69, 567.
20. A. M. Wu and P. D. Senter, Nat. Biotechnol., 2005, 23, 1137.
21. I. Pastan, R. Hassan, D. J. Fitzgerald and R. J. Kreitman, Nat.
Rev. Cancer, 2006, 6, 559.
22. G. A. Lazar, W. Dang, S. Karki, O. Vafa, J. S. Peng, L. Hyun,
C. Chan, H. S. Chung, A. Eivazi, S. C. Yoder, J. Vielmetter, D. F.
Carmichael, R. J. Hayes and B. I. Dahiyat, Proc. Natl. Acad. Sci.
USA, 2006, 103, 4005.
23. E. A. Kabat and T. T. Wu, Ann. N. Y. Acad. Sci., 1971, 190, 382.
24. I. M. Tomlinson, J. P. Cox, E. Gherardi, A. M. Lesk and
C. Chothia, EMBO J., 1995, 14, 4628.
25. I. M. Tomlinson, G. Walter, J. D. Marks, M. B. Llewelyn and
G. Winter, J. Mol. Biol., 1992, 227, 776.
266 Chapter 9
26. C. Chothia and A. M. Lesk, J. Mol. Biol., 1987, 196, 901.
27. C. Chothia, A. M. Lesk, E. Gherardi, I. M. Tomlinson, G. Walter,
J. D. Marks, M. Llewelyn and G. Winter, J. Mol. Biol., 1992, 227,
799.
28. G. L. Boulianne, N. Hozumi and M. J. Shulman, Nature, 1984,
312, 643.
29. S. L. Morrison, M. J. Johnson, L. A. Herzenberg and V. T. Oi,
Proc. Natl. Acad. Sci. USA, 1984, 81, 6851.
30. J. W. Larrick, Y. L. Chiang, R. Sheng-Dong, G. Senck and
P. Casali, in Generation of Specific Human Monoclonal Antibodies
by In vitro Expansion of Human B Cells: a Novel Recombinant DNA
Approach, C. A. K. Borrebaeck ed., Elsevier, Amsterdam, 1988.
31. J. W. Larrick, L. Danielsson, C. A. Brenner, M. Abrahamson, K.
E. Fry and C. A. Borrebaeck, Biochem. Biophys. Res. Commun.,
1989, 160, 1250.
32. R. Orlandi, D. H. Gussow, P. T. Jones and G. Winter, Proc. Natl.
Acad. Sci. USA, 1989, 86, 3833.
33. P. Amersdorfer, C. Wong, S. Chen, T. Smith, S. Desphande,
R. Sheridan, R. Finnern and J. D. Marks, Infect. Immun., 1997,
65, 3743.
34. S. A. Iverson, L. Sastry, W. D. Huse, J. A. Sorge, S. J. Benkovic
and R. A. Lerner, Cold Spring Harbor Symp. Quant. Biol., 1989, 1,
273.
35. C. A. Kettleborough, J. Saldanha, K. H. Ansell and M. M. Bendig,
Eur. J. Immunol., 1993, 23, 206.
36. R. D. LeBoeuf, F. S. Galin, S. K. Hollinger, S. C. Peiper and J. E.
Blalock, Gene, 1989, 82, 371.
37. H. Orum, P. S. Andersen, A. Oster, L. K. Johansen, E. Riise,
M. Bjornvad, I. Svendsen and J. Enberg, Nucleic Acids Res., 1993,
21, 4491.
38. L. Sastry, M. M. Alting, W. D. Huse, J. M. Short, J. A. Sorge, B.
N. Hay, K. D. Janda, S. J. Benkovic and R. A. Lerner, Proc. Natl.
Acad. Sci. USA, 1989, 86, 5728.
39. D. R. Burton, C. F. Barbas, M. A. A. Persson, S. Koenig, R. M.
Chanock and R. A. Lerner, Proc. Natl. Acad. Sci. USA, 1991,
88, 10134.
40. J. D. Marks, H. R. Hoogenboom, T. P. Bonnert, J. McCafferty,
A. D. Griffiths and G. Winter, J. Mol. Biol., 1991, 222, 581.
41. J. D. Marks, M. Tristrem, A. Karpas and G. Winter, Eur. J.
Immunol., 1991, 21, 985.
42. M. A. Persson, R. H. Caothien and D. R. Burton, Proc. Natl.
Acad. Sci. USA, 1991, 88, 2432.
267Molecular Engineering of Antibodies

43. D. Sblattero and A. Bradbury, Nat. Biotechnol., 2000, 18, 75.
44. E. Davies, J. Smith, C. Birkett, J. Manser, D. Anderson-Dear and
J. Young, J. Immunol. Methods, 1995, 186, 125.
45. I. Lang, C. R. Barbas and R. Schleef, Gene, 1996, 172, 295.
46. T. Clackson, H. R. Hoogenboom, A. D. Griffiths and G. Winter,
Nature, 1991, 352, 624.
47. J. B. Edwards, J. Delort and J. Mallet, Nucleic Acids Res., 1991,
19, 5227.
48. A. Heinrichs, C. Milstein and E. Gherardi, J. Immunol. Methods,
1995, 178, 241.
49. F. Ruberti, A. Cattaneo and A. Bradbury, J. Immunol. Methods,
1994, 173, 33.
50. S. M. Kipriyanov, O. A. Kupriyanova and G. Moldenhauer,
J. Immunol. Methods, 1996, 13, 51.
51. M. A. Boss, J. H. Kenten, C. R. Wood and J. S. Emtage, Nucleic
Acids Res., 1984, 12, 3791.
52. S. Cabilly, A. D. Riggs, H. Pande, J. E. Shively, W. E. Holmes,
M. Rey, L. J. Perry, R. Wetzel and H. L. Heyneker, Proc. Natl.
Acad. Sci. USA, 1984, 81, 3273.
53. M. Better, C. P. Chang, R. R. Robinson and A. H. Horwitz,
Science, 1988, 240, 1041.
54. A. Skerra and A. Pluckthun, Science, 1988, 240, 1038.
55. R. Glockshuber, M. Malia, I. Pfitzinger and A. Pluckthun,
Biochemistry, 1990, 29, 1362.
56. C. Horne, M. Klein, I. Polidoulis and K. J. Dorrington, J.
Immunol., 1982, 129, 660.
57. R. E. Bird, K. D. Hardman, J. W. Jacobson, S. Johnson, B. M.
Kaufman, S. M. Lee, T. Lee, S. H. Pope, G. S. Riordan and
M. Whitlow, Science, 1988, 242, 423.
58. J. S. Huston, D. Levinson, H. M. Mudgett, M. S. Tai, J. Novotny,
M. N. Margolies, R. J. Ridge, R. E. Bruccoleri, E. Haber, R. Crea
and H. Oppermann, Proc. Natl. Acad. Sci. USA, 1988, 85, 5879.
59. Y. Reiter, U. Brinkmann, S. Jung, I. Pastan and B. Lee, Protein
Eng., 1995, 8, 1323.
60. M. B. Khazaeli, R. M. Conry and A. F. LoBuglio, J. Immunother.
Emphasis Tumor Immunol., 1994, 15, 42.
61. K. Kuus-Reichel, L. S. Grauer, L. M. Karavodin, C. Knott,
M. Krusemeier and N. E. Kay, Clin. Diagn. Lab. Immunol., 1994,
1, 365.
62. P. T. Jones, P. H. Dear, J. Foote, M. S. Neuberger and G. Winter,
Nature, 1986, 321, 522.
268 Chapter 9
63. L. Riechmann, M. Clark, H. Waldmann and G. Winter, Nature,
1988, 332, 323.
64. P. R. Tempest, P. Bremner, M. Lambert, G. Taylor, J. M. Furze,
F. J. Carr and W. J. Harris, Biotechnology (N.Y.), 1991, 9, 266.
65. C. Queen, W. P. Schneider, H. E. Selick, P. W. Payne, N. F.
Landolfi, J. F. Duncan, N. M. Avdalovic, M. Levitt, R. P. Jun-
ghans and T. A. Waldmann, Proc. Natl. Acad. Sci. USA, 1989, 86,
10029.
66. A. B. Thakur and N. F. Landolfi, Mol. Immunol., 1999, 36, 1107.
67. P. Carter, L. Presta, C. M. Gorman, J. B. Ridgway, D. Henner,
W. L. Wong, A. M. Rowland, C. Kotts, M. E. Carver and H. M.
Shepard, Proc. Natl. Acad. Sci. USA, 1992, 89, 4285.
68. L. G. Presta, H. Chen, S. J. O’Connor, V. Chisholm, Y. G. Meng,
L. Krummen, M. Winkler and N. Ferrara, Cancer Res., 1997,
57, 4593.
69. P. Tan, D. A. Mitchell, T. N. Buss, M. A. Holmes, C. Anasetti and
J. Foote, J. Immunol., 2002, 169, 1119.
70. M. Figini, J. D. Marks, G. Winter and A. D. Griffiths, J. Mol.
Biol., 1994, 239, 68.
71. L. S. Jespers, A. Roberts, S. M. Mahler, G. Winter and H. R.
Hoogenboom, Biotechnology (N.Y.), 1994, 12, 899.
72. H. R. Hoogenboom, J. D. Marks, A. D. Griffiths and G. Winter,
Immunol. Rev., 1992, 130, 41.
73. C. Marks and J. D. Marks, N. Engl. J. Med., 1996, 335, 730.
74. A. Nissim, H. R. Hoogenboom, I. M. Tomlinson, G. Flynn,
C. Midgley, D. Lane and G. Winter, EMBO J., 1994, 13, 692.
75. C. Gao, S. Mao, C. H. Lo, P. Wirsching, R. A. Lerner and K. D.
Janda, Proc. Natl. Acad. Sci. USA, 1999, 96, 6025.
76. A. S. Kang, C. F. Barbas, K. D. Janda, S. J. Benkovic and R. A.
Lerner, Proc. Natl. Acad. Sci. USA, 1991, 88, 4363.
77. J. McCafferty, A. D. Griffiths, G. Winter and D. J. Chiswell,
Nature, 1990, 348, 552.
78. C. F. Barbas, A. S. Kang, R. A. Lerner and S. J. Benkovic, Proc.
Natl. Acad. Sci. USA, 1991, 88, 7978.
79. H. R. Hoogenboom, A. D. Griffiths, K. S. Johnson, D. J. Chiswell,
P. Hudson and G. Winter, Nucleic Acids Res., 1991, 19, 4133.
80. W. Huse, T. Stinchcombe, S. Glaser, L. M. Starr, M. K. Hellstrom,
I. Hellstrom and D. Yelton, J. Immunol., 1992, 149, 3914.
81. J. D. Marks, W. H. Ouwehand, J. M. Bye, R. Finnern, B. D.
Gorick, D. Voak, S. Thorpe, N. C. Hughes-Jones and G. Winter,
Bio/Technology, 1993, 11, 1145.
269Molecular Engineering of Antibodies
82. M. A. Huie, M. C. Cheung, M. O. Muench, B. Becerril, Y. W. Kan
and J. D. Marks, Proc. Natl. Acad. Sci. USA, 2001, 98, 2682.
83. J. de Kruif, L. Terstappen, E. Boel and T. Logtenberg, Proc. Natl.
Acad. Sci. USA, 1995, 92, 3938.
84. X. Cai and A. Garen, Proc. Natl. Acad. Sci. USA, 1995, 92, 6537.
85. M. A. Poul, B. Becerril, U. B. Nielsen, P. Morisson and J. D.
Marks, J. Mol. Biol., 2000, 301, 1149.
86. C. Kettleborough, K. Ansell, R. Allen, E. Rosell-Vives, D. Gussow
and M. Bendig, Eur. J. Immunol., 1994, 24, 952.
87. P. Amersdorfer, C. Wong, T. Smith, S. Chen, S. Deshpande,
R. Sheridan and J. D. Marks, Vaccine, 2002, 20, 1640.
88. C. F. Barbas, T. A. Collet, W. Amberg, P. Roben, J. M. Binley,
D. Hoekstra, D. Cababa, T. M. Jones, A. Williamson, G. R.
Pilkington, N. L. Haigwood, E. Cabezas, A. C. Satterthwait, I.
Sanz and D. R. Burton, J. Mol. Biol., 1993, 230, 812.
89. S. L. Zebedee, C. F. Barbas, Y.-L. Hom, R. H. Cathoien, R. Graff,
J. DeGraw, J. Pyatt, R. LaPolla, D. R. Burton and R. A. Lerner,
et al., Proc. Natl. Acad. Sci. USA, 1992, 89, 3175.
90. S. Chan, J. Bye, P. Jackson and J. Allain, J. Gen. Virol., 1996,
10, 2531.
91. C. Barbas, J. Crowe, D. Cababa, T. Jones, S. Zebedee, B. Murphy,
R. Chanock and D. Burton, Proc. Natl. Acad. Sci. USA, 1992,
89, 10164.
92. D. Reason, T. Wagner and A. Lucas, Infect. Immun., 1997, 65, 261.
93. S. Barbas, H. Ditzel, E. Salonen, W. Yang, G. Silverman and
D. Burton, Proc. Natl. Acad. Sci. USA, 1995, 92, 2529.
94. Y. Graus, M. de Baets, P. Parren, S. Berrih-Aknin, J. Wokke,
V. Breda, P. Vriesman and D. Burton, J. Immunol., 1997, 158,
1919.
95. M. A. Clark, N. J. Hawkins, A. Papaioannou, R. J. Fiddes and
R. L. Ward, Clin. Exp. Immunol., 1997, 109, 166.
96. A. S. Perelson and G. F. Oster, J. Theor. Biol., 1979, 81, 645.
97. M. D. Sheets, P. Amersdorfer, R. Finnern, P. Sargent, E. Lind-
quist, R. Schier, G. Hemingsen, C. Wong, J. C. Gerhart and J. D.
Marks, Proc. Natl. Acad. Sci. USA, 1998, 95, 6157.
98. E. T. Boder and K. D. Wittrup, Nat. Biotechnol., 1997, 15, 553.
99. D. R. Bowley, A. F. Labrijn, M. B. Zwick and D. R. Burton,
Protein Eng. Des. Sel., 2007, 20, 81.
100. M. J. Feldhaus, R. W. Siegel, L. K. Opresko, J. R. Coleman, J. M.
Feldhaus, Y. A. Yeung, J. R. Cochran, P. Heinzelman, D. Colby,
J. Swers, C. Graff, H. S. Wiley and K. D. Wittrup, Nat. Bio-
technol., 2003, 21, 163.
270 Chapter 9
101. E. T. Boder, K. S. Midelfort and K. D. Wittrup, Proc. Natl. Acad.
Sci. USA, 2000, 97, 10701.
102. A. Razai, C. Garcia-Rodriguez, J. Lou, I. N. Geren, C. M. Forsyth,
Y. Robles, R. Tsai, T. J. Smith, L. A. Smith, R. W. Siegel,
M. Feldhaus and J. D. Marks, J. Mol. Biol., 2005, 351, 158.
103. C. Schaffitzel, J. Hanes, L. Jermutus and A. Pluckthun, J. Immunol.
Methods, 1999, 231, 119.
104. J. Hanes, L. Jermutus, S. Weber-Bornhauser, H. R. Bosshard and
A. Pluckthun, Proc. Natl. Acad. Sci. USA, 1998, 95, 14130.
105. J. Hanes, C. Schaffitzel, A. Knappik and A. Pluckthun, Nat.
Biotechnol., 2000, 18, 1287.
106. J. Foote and H. N. Eisen, Proc. Natl. Acad. Sci. USA, 1995,
92, 1254.
107. J. Foote and C. Milstein, Nature, 1991, 352, 530.
108. R. E. Hawkins, S. J. Russell and G. Winter, J. Mol. Biol., 1992,
226, 889.
109. R. Schier, A. McCall, G. P. Adams, K. Marshall, M. Yim,
H. Merritt, R. S. Crawford, W. L. M. C. Marks and J. D. Marks,
J. Mol. Biol., 1996, 263, 551.
110. W.-P. Yang, K. Green, S. Pinz-Sweeney, A. T. Briones, D. R.
Burton and C. F. Barbas, J. Mol. Biol., 1995, 254, 392.
111. I. Pastan, M. C. Willingham and D. J. FitzGerald, Cell, 1986,
47, 641.
112. I. Pastan, R. Hassan, D. J. FitzGerald and R. J. Kreitman, Annu.
Rev. Med., 2007, 58, 221.
113. V. K. Chaudhary, J. K. Batra, M. G. Gallo, M. C. Willingham,
D. J. FitzGerald and I. Pastan, Proc. Natl. Acad. Sci. USA, 1990,
87, 1066.
114. R. J. Kreitman and I. Pastan, Curr. Drug Targets, 2006, 7, 1301.
115. D. Schrama, R. A. Reisfeld and J. C. Becker, Nat. Rev. Drug
Discov., 2006, 5, 147.
116. F. Nimmerjahn and J. V. Ravetch,Nat. Rev. Immunol., 2008, 8, 34.
117. F. Nimmerjahn and J. V. Ravetch, Curr. Opin. Immunol., 2007,
19, 239.
271Molecular Engineering of Antibodies
CHAPTER 10
Plant Biotechnology
MICHAEL G. K. JONES
School of Biological Sciences and Biotechnology, Murdoch University, Perth,
Western Australia, Australia
10.1 INTRODUCTION
The last decade has been a period of remarkable change which has taken
plant biotechnology from study of the science itself to large-scale com-
mercial applications. This is true for almost every aspect of plant bio-
technology, both applying basic knowledge of molecular biology and
gene organisation such as development of molecular markers to speed
up plant breeding practices and using knowledge of genes and how to
control expression of those genes to generate and commercialise trans-
genic crops. In general, the application of plant biotechnology can be
divided into two categories: those directed towards the same goals as
conventional plant breeding (e.g. improved yield, quality, resistance to
pests and diseases, tolerance to abiotic stresses) and completely novel
applications (such as the use of plants as bioreactors to generate phar-
maceuticals, vaccines or biodegradable plastics). The emphasis of this
chapter therefore reflects these changes and is focused more on the
application of plant biotechnology rather than the detailed molecular
biology which underlies those applications.
Molecular Biology and Biotechnology, 5th Edition
Edited by John M Walker and Ralph Rapleyr Royal Society of Chemistry 2009
Published by the Royal Society of Chemistry, www.rsc.org
272
10.2 APPLICATIONS OF MOLECULAR BIOLOGY TO SPEED
UP THE PROCESSES OF CROP IMPROVEMENT
Plant breeding is based on the principles of Mendelian genetics. In the
past, plant breeding was something of an art and selection of superior
genotypes of a particular crop depended to a great extent on subjective
decisions made by the breeder. With increasing knowledge of the genes
underlying useful traits, plant breeding has become a more directed and
scientific activity. This is in part a result of the generation of molecular
maps of crop genomes, extensive sequencing of expressed sequences
[expressed sequenced tags (ESTs)] and of genomic sequences and of
study of genome organisation, repetitive and non-coding sequences and
the ability to identify polymorphisms at particular loci which can be
exploited as molecular markers if they are closely linked to a useful trait.
10.2.1 Molecular Maps of Crop Plants
Arabidopsis thaliana had been used as a model plant for mutagenic and
genetic studies in the 1970s. The advantages of this species as a model
for molecular studies became apparent in the 1980s because of its small
nuclear genome size, low repetitive DNA content, short life-cycle, large
seed production and later its amenability to transformation. As a result,
through international collaborations, a genomic sequencing programme
was established and the complete DNA sequence of the Arabidopsis
genome was completed in 2000.1
The rice genome is only about four times the size of the Arabidopsis
genome and, as a model cereal and important food crop, sequencing of
this genome is also well advanced. Massive sequencing efforts of ESTs of
wheat, barley, soybean, rice, Medicago truncatula and other crops are
also in progress, mainly driven by major life sciences companies.
Much interesting information on genome organisation has resulted
from this work, including knowledge of location of genes, gene clus-
tering and repetitive and non-coding sequences.2 For cereals, gene
arrangements show ‘synteny’ in that major blocks of genes are arranged
in similar sequences in rice, maize, barley, wheat, etc. The major dif-
ferences in genome size is the result of different amounts of repetitive/
non-coding sequences and, for wheat, the fact that it is hexaploid and
contains three sets of progenitor genomes.
For Arabidopsis, it emerges that there are about 22 000 genes required
to contain all the information for this organism. For other plants, we
might expect the number of genes present to be between this figure and
about 50 000 genes.
273Plant Biotechnology
Research on mapping genome organisation, sequences and synteny has
led to many practical applications, some of which are discussed below.
10.2.2 Molecular Markers
A genetic marker is any character that can be measured in an organism
which provides information on the genotype (i.e. genetic make-up) of that
organism. A genetic marker may be a recognizable phenotypic trait (e.g.
height, colour, response to pathogens), a biochemical trait (e.g. an iso-
zyme) or a molecular trait (i.e.DNA based). Whereas phenotypic markers
depend on expression of genes and are limited to those genes expressed at a
particular time or under particular developmental or environmental condi-
tions, DNA-based markers provide an almost unlimited supply of markers
that identify specific sequences across the genome.3 Their advantages are:
(i) Single base changes in DNA can be identified, providing many
potential marker sites across a genome.
(ii) They are independent of developmental stage, environment or
expression.
(iii) Markers can be found in non-coding or repetitive sequences.
(iv) Most DNA marker sequences are selectively neutral.
Thus, for example, because about 80% of the wheat genome is non-
coding DNA, only molecular markers can be used to identify poly-
morphisms and to map ‘loci’ in these regions of the genome.
10.2.3 Types of Molecular Markers
There are many potential approaches to identify molecular markers.
Most are based on using the polymerase chain reaction (PCR) to
amplify specific DNA sequences.3–5 They include:
(i) RFLPs (restriction fragment length polymorphisms);
(ii) RAPD-PCR (random amplified polymorphic DNA);
(iii) microsatellites or simple sequence repeats (SSRs);
(iv) AFLP (amplified fragment length polymorphisms).
RFLPs rely on the combination of a probe and restriction enzymes to
identify polymorphic DNA sequences using Southern blotting. This
approach requires either radioactive or non-radioactive detection
methods to identify polymorphic DNA bands and is therefore more time
consuming than PCR-based methods.
274 Chapter 10

RAPD-PCR does not require sequence information and involves
amplifying random pieces of DNA in which PCR is primed by a single
10 base primer at low stringency, such that random sequences of DNA
are amplified based on homologous sequences to the primer being pre-
sent in the target DNA. It is a useful initial approach to identify poly-
morphisms, but is not regarded as reproducible enough between
laboratories.
Microsatellites or SSRs are groups of repetitive DNA sequences that
are present in a significant proportion of plant genomes. They consist of
tandemly repeated mono-, di-, tri-, tetra- or pentanucleotide units. The
number of repeats varies in different individuals and so the different
repeats can be regarded as ‘polymorphic’ alleles at that ‘locus’. To reveal
polymorphic microsatellite sequences, it is necessary to sequence the
conserved flanking DNA and to design PCR primers that will amplify
the repeat sequences. (Because of the repetitive nature of the amplified
sequences, typically the main amplified PCR band and additional
‘stutter’ bands are generated.) For example, at microsatellite locus
Hspl76 of soybean, there is an AT repeat with 13 different numbers
of bases in the repeated units in different soybean accessions.4,5
Microsatellites provide reliable, reproducible molecular markers.
AFLP is also a PCR-based technique, in which selective pre-amplifi-
cation and amplification steps are carried out to amplify a subset of
fragments of the genome, depending on the linkers added and primers
used. Many potentially polymorphic fragments are generated by this
approach. Polymorphic bands between parents can be identified and
linked to useful traits.
Both microsatellite and AFLP markers can be analysed using auto-
radiography or a DNA sequencer, using fluorescent tags. The latter
allows multiplexing such that three different coloured tags plus a size
marker can be run in each lane. A single multiplexed AFLP gel can
generate 100 polymorphic bands.
10.2.4 Marker-assisted Selection
Using one of the above approaches to identify molecular markers, in
combination with an appropriate mapping population of plants plus or
minus the trait of interest, many markers have been identified which are
closely linked to genes for agronomic traits of interest.3–7 These include
markers for genes for:
(i) pest and disease resistance (against viruses, fungi, bacteria,
nematodes, insects);
275Plant Biotechnology
(ii) quality traits (e.g. malting quality barley, bread or noodle
wheats, alkaloid levels, etc.);
(iii) abiotic stresses (e.g. tolerance to salinity or toxic elements such as
boron or aluminium);
(iv) developmental traits (e.g. flowering time, vegetative period).
If the molecular marker is in the target gene itself, it has been called a
‘perfect’ marker. Clearly, the closer the molecular marker is linked to the
target gene, the better. The overall process of developing a marker thus
involves setting up appropriate mapping populations, looking for
polymorphic DNA sequences closely linked to the trait of interest,
conversion of the polymorphism to a routine marker (usually PCR
based), validation and implementation.
Quantitative trait loci (QTLs) are the genes which control quantitative
traits such as yield for which the final character is controlled by several
genes.6 To identify and map QTLs, a defined mapping population is
required which is screened for polymorphisms by RFLPs, AFLPs and
SSRs which can be mapped. Statistical approaches are then used to
identify associations between the traits of interest and specific markers.
Although the location of QTLs is usually not known exactly, the asso-
ciation of a genotype at a marker/locus and a contribution to the trait
indicates that there is a QTL near that marker.
The promise of molecular marker-assisted selection for crop
improvement is in the following: increased speed and accuracy of selec-
tion; stacking genes, including minor genes; following genes in backcross
populations; and reduced costs of field-based selection. Thus, rather than
growing breeding lines in the field and challenging or testing for impor-
tant traits over the growing season, it is possible to extract DNA from
50mg of a seedling leaflet and test for the presence or absence of a range
of traits in that DNA sample in one day. Plants lacking the required traits
can then be removed early in the breeding programme.7 With the avail-
ability of more validated molecular markers, marker-assisted selection
therefore becomes a highly cost-effective and efficient process.
10.2.5 Examples of Marker-assisted Selection
There are now many examples of the use of molecular markers for
selection in plant breeding.3 Examples include (i) the microsatellite locus
HSP176 of soybean (Section 10.2.3), which is closely linked to a
gene (Rsv) conferring resistance to soybean mosaic virus, (ii) a perfect
marker for noodle quality starch in wheat7 and (iii) a marker for early
flowering in lupins.
276 Chapter 10
Western Australia exports specialty wheat to the Asian market to
make white alkaline salted noodles. This segment of the export trade is
worth $250 million per annum. White noodles require specific swelling
properties of starch. Noodle quality wheats all have two rather than
three copies of granule bound starch synthase (GBSS), the enzyme
which synthesizes amylose, the linear polymer of starch. This reduces the
ratio of amylose to amylopectin by 1.5–2%, increasing the flour swelling
volume. A ‘perfect’ PCR molecular marker was developed which iden-
tified presence or absence of the GBSS gene on chromosome 4A, i.e.
‘bad’ or ‘good’ noodle starch. This molecular marker test is now used as
a primary screen for all noodle wheat breeding lines in Western Aus-
tralia and has resulted in the accelerated production of a series of new
noodle quality wheat varieties.7
Narrow-leafed lupin is the major grain legume grown in Australia.
Early flowering is required for the crop to complete its life-cycle before
the rain limits growth in areas of Mediterranean climate where it is
grown. Using fluorescent AFLPs, a marker linked to early flowering of
lupins was identified (using a DNA sequencer). The AFLP was then run
as a radioactive version, the polymorphic band isolated, cloned and
sequenced and a co-dominant PCR-based marker developed for routine
implementation.
10.2.6 Molecular Diagnostics
The same principles as used in developing molecular markers can be
applied for a range of molecular diagnostic purposes in plants,
including:
(i) identification of plant pathogens (viruses, fungi, nematodes,
bacteria, insects);
(ii) studying population structure/variations in pathogens;
(iii) identifying the presence and quantifying the presence of trans-
genes in transgenic foods;
(iv) following possible pollen transfer of transgenes.
All that is needed is to identify specific nucleic acid (RNA or DNA)
sequences unique to the target organism and then to develop a
reliable extraction/PCR analysis system such that a DNA fragment is
only amplified if the target organism or target sequence is present in a
sample. The methods and scale by which such analyses (and also mar-
ker-assisted selection) can be carried out are advancing rapidly. Analysis
277Plant Biotechnology
can be by:
(i) PCR and gel electrophoresis;
(ii) real-time fluorescent PCR (e.g. using an ABI TaqMan 7700) to
quantify the original amount of target sequence without gel
electrophoresis;
(iii) matrix-assisted laser desorption/ionisation time-of-flight mass
spectrometry (MALDI-TOF MS);
(iv) use of DNA chips and hybridisation of labelled samples to
bound DNA sequences.
The last two methods (MALDI-TOF MS and chip technology),
including microarrays (Section 10.2.8), promise to speed up all DNA
fragment analysis applications by an order of magnitude over current
gel-based DNA separation technologies.
Typical examples of applications of molecular diagnostics are the
following. (1) Routine analysis of farmers’ seed samples (such as lupin)
for the presence of seed-borne cucumber mosaic virus (CMV).8 This can
done by RT-PCR (to detect viral RNA, sensitivity o1 infected seed per
1000 seeds) or by real-time fluorescent PCR. Farmers must buy clean
seed if infection levels of CMV are above 0.5%. (2) Routine analysis of
farmers’ lupin seed for the fungal disease anthracnose, caused by Col-
letotrichum acutatum. A PCR test, based on repeated ribosomal DNA
sequences specific to the fungal pathogen, allows infection levels of one
seed in 10 000 to be detected. In this case, only clean anthracnose-free
seed can be sown.
10.2.7 DNA Fingerprinting, Variety Identification
The same processes of DNA fragment production and analysis can
be applied to DNA fingerprint plants. The main use is in variety iden-
tification and quality control, but the techniques can equally be applied
to study plant populations, taxonomy, conservation biology and reha-
bilitation of mine sites or cleared forests. For rehabilitation studies,
DNA fingerprinting data can be used to ensure that an appropriate
range of genotypes of species removed is used to rehabilitate cleared
land.9 With the advent of end-point levies on delivered bulk grains
rather than on royalties from seed sales (in some countries), there
is a need for rapid and accurate identification of crop varieties at
the receiving depots. This can be achieved by rapid analysis of DNA
fingerprints of specific crop varieties.
278 Chapter 10
10.2.8 DNA Microarrays
DNA microarrays can be set up robotically by depositing specific
fragments of DNA at indexed locations on microscope slides.10 With
current technology, cDNAs, EST clones or open reading frames (ORFs)
from sequenced genomes can be set up in microarrays of 10 000 spots
per 3.24 cm2, thus the whole genome of Arabidopsis could be displayed
on one microscope slide. Fluorescently labelled mRNA probes are
hybridised on to the array and specific hybridising sequences are iden-
tified by their fluorescent signals. Microarray technology can be used to
study gene expression patterns, expression fingerprints, DNA poly-
morphisms and, in theory, as a breeding tool to evaluate new genetic
materials, for a specific trait (e.g. drought tolerance), together with
phenotypic tests.11
10.2.9 Bioinformatics
The generation of massive amounts of molecular information on plant
genomes and their products from large-scale sequencing programmes,
DNA fingerprinting and fragment analyses, mapping, molecular diag-
nostics, marker-assisted selection and DNA microarrays requires
a concomitant increase in the ability to handle and analyse such data.
The handling and interpretation of molecular data are generally
referred to as bioinformatics and marries requirements of computing
power, data handling and appropriate software. Depending on the
level of analysis, the area can be divided into ‘genomics’ (DNA level),
‘proteomics’ (protein expression level) and ‘metabolomics’ (metabolic
level). In many cases, it is useful to ‘mine’ DNA or other databases to
look for new or useful genes or sequences, using specific software,
programs and algorithms.
10.3 TRANSGENIC TECHNOLOGIES
It is now possible to generate transgenic plants from every major crop
plant species. Some are easier to transform than others, but if there are
sufficient economic reasons to fund research and development, then, for
almost any crop, transgenic plants can be produced. Detailed proce-
dures to generate transgenic plants have been described in the literature,
with many incremental improvements in efficiencies of transformation
or applications to new genotypes. Two approaches have survived the
279Plant Biotechnology
test of time: transformation using Agrobacterium tumefaciens as a vector
and particle bombardment.
10.3.1 Agrobacterium-mediated Transformation
The use of A. tumefaciens (or A. rhizogenes) as a gene vector is the
method of choice for plant transformation. The development of dis-
armed binary vectors, in which the virulence (vir) genes are separated
from the genes to be transferred (‘T-DNA’), with the latter on a small
easily manipulated plasmid, made the processes of recombinant DNA
manipulations more routine. The process of transfer of gene(s) of
interest and selectable marker genes have been extensively reviewed,12
and will not be covered further here. However, one topic that deserves
further discussion is that of the selectable marker genes used to identify
and extract transgenic cells from the non-transgenic cells and new
reporter genes used to monitor gene expression.
10.3.2 Selectable Marker and Reporter Genes
The neomycin phosphotransferase (nptll) gene is still the most widely
used selectable marker gene and has been used extensively to generate
many transgenic dicotyledonous plants and also some mono-
cotyledonous plants. It confers tolerance to aminoglycoside antibiotics
(kanamycin, geneticin, puromycin). For various reasons (including
intellectual property considerations, fear of transfer of kanamycin tol-
erance to gut bacteria, etc.), it would be useful to have alternative
selectable marker genes. Some alternatives include hpt (hygromycin
tolerance), bar or pat (phosphinothricin/Basta tolerance),13 aroA (EPSP
synthase/glyphosate tolerance),14 modified als (chlorsulfuron toler-
ance),15 bromoxynil tolerance and carbon utilising genes mannose
phosphate isomerase (mannose utilisation) and xylose isomerase (xylose
utilisation).16
To study specificity of expression, widely used reporter genes include
those encoding b-glucuronidase (gus), luciferase (luc) and more recently
green fluorescent protein (gfp) from the jellyfish Aequoria victoriae.
There are now engineered variants of the latter for improved plant
expression (cryptic intron removed) or altered colours of fluorescence
(e.g. blue, red, yellow). An advantage of gfp is that no substrate is
required and so in vitro expression can be followed in the same cells or
tissues over long periods (weeks/months) and high-resolution studies in
live cells can be undertaken using confocal scanning laser microscopy.17
280 Chapter 10
10.3.3 Particle Bombardment
Many different strategies have been tried to introduce naked DNA into
plant cells (including microinjection, DNA pollination, silicon
whiskers, electroporation of cells or tissues, electroporation or chemi-
cally induced introduction of DNA into protoplasts), but the major
alternative to Agrobacterium transformation is particle bombardment.
This approach now normally involves coating 1 mm diameter particles of
tungsten or gold with DNA, putting them on a support, accelerating
them to high speed using a pulse of high pressure helium into an evac-
uated chamber containing the target tissues. Particles can penetrate up
to about six cell layers and the DNA released from the particles in
surviving cells may be expressed transiently and, in a small proportion of
cases, it becomes integrated into the nuclear genome of that cell. With
appropriate tissue culture and selection, transgenic plants can be
regenerated.
Particle bombardment is usually limited to the generation of trans-
genic cereals and its use has decreased since Agrobacterium transfor-
mation now works for cereals such as rice and barley18 It is still used
widely for maize and wheat transformation, although there is one report
of wheat transformation using Agrobacterium as a vector.19
10.4 APPLICATIONS OF TRANSGENIC TECHNOLOGIES
The application of transgenic technologies in plant biotechnology has
the potential to exceed the technical advances that have taken place in
previous ‘revolutions’ in production agriculture. It has only taken 4
years of commercial growth of transgenic crops in North America for
52% of the soybean, 30% of the maize and 9% of both cotton and
canola grown in 1999 to be transgenic, with increasing production of a
wide range of other transgenic crops such as rice, wheat, barley, sor-
ghum, sugar cane, sugar beet, tomato, potato, sunflower, peanut,
papaya, tree species and horticultural crops such as carnations. Major
companies involved in commercialisation of transgenic crops and their
alliances are given in Table 10.1.20
Of the 69.5 million acres of transgenic crops grown (27.8 million
hectares) in 1998, 74% were in the USA, 15% in Argentina, 10% in
Canada and 1% in Australia. The transgenic traits grown commercially
were dominated by herbicide tolerance (71%) and insect resistance
(28%), with only 1% for the other traits.20
However, the transgenic plants currently being commercialised are the
first generation of transgenic crops and three generations of transgenic
281Plant Biotechnology

Table 10.1 Major companies involved in commercialisation of transgenic
crops and their alliances (modified from ref. 20).
Company Partner Technology basis of collaboration
AgroEvo Gene Logic Genomics for crops/crop protectionKimeragen Gene modification technologyLynx Therapeutics Genetics for crops/crop protection
American Acacia Biosciences Compounds for agrochemicalsCyanamid AgriPro Seeds Herbicide-tolerant wheat
Zeneca Seeds Transgenic canola
BASF Metanomics Functional plant genomicsSunGene Testing genes in crops
Bayer Exelixis Pharmaceuticals Screening targets for agrochemicalsLion Bioscience Genomics for crop protection
productsOxford Asymmetry Compounds for agrochemicalsParadigm Genetics Screening targets for herbicides
Dow Chemical Biosource Technologies Functional genomics for crop traitsDemegen Technology to increase protein
contentOxford Asymmetry Compounds for agrochemicalsPerformance Plants Gene technology to increase yield/
contentProteome Systems Protein production in plantsRibozyme Pharmaceuticals Technology to modify oil/starch
contentSemBiosys Genetics Commercialise proteins produced in
plants
DuPont CuraGen Genomics for crop protectionproducts
3-D Pharmaceuticals Compounds for agrochemical targetLynx Therapeutics Genetics for crops/crop protectionPioneer Hybrid Crop breeding/varieties
FMC Xenova Compounds for agrochemicalsMonsanto ArQule Compound libraries for agrochemicals
GeneTrace Genomics for cropsIncyte Pharmaceuticals Plant, bacterial, fungal genomicsMendel Biotechnology Functional genomics in plantsCereon Genomics Plant genomics
Novartis Chiron Compounds for agrochemicalsCombiChem Compounds for agrochemicalsDiversa Plant genetics for transgenic crops
Rhone-Poulenc Agritope Genomics joint venture for plant traitsCelera AgGen Corn genomicsMycogen/Dow Genetic traits in crops, marketingRhoBio Genetics for disease resistance
Zeneca Alanex Compound libraries for agrochemicalsIncyte Pharmaceuticals Plant genomicsRosetta Inpharmatics Compounds for crop protection
products
282 Chapter 10
crops can be envisaged:
� First generation – production traits (e.g. herbicide tolerance, insect/
disease resistance).
� Second generation – stacked genes for multiple traits (e.g. combi-
nations of disease resistance genes plus quality traits).
� Third generation – varieties tailored for specific end uses (e.g. food,
fibre, fuel, lubricants, plastics, pharmaceuticals and raw materials
for industrial processes).
Already, the production of second-generation transgenic crops is in
progress and some specific examples of applications are given in the
following sections. However, to achieve the potential benefits of trans-
genic plant biotechnology, there are many additional factors to consider,
which include regulation of biotechnology, intellectual property, food
safety, public acceptance, allergenicity, labelling, choice, the environ-
ment, segregation of transgenic products and international trade.
The emphasis here is on application and potential benefits of trans-
genic technologies. As in any developing technologies, the aim is to
maximize the benefits and minimize the risks.
10.5 ENGINEERING CROP RESISTANCE TO HERBICIDES
Herbicides are the method of choice to control weeds in most broadscale
agricultural systems. They play a major role in maximising crop yields
by reducing competition from weeds for space, light, water and nutrients
and help control erosion by enabling weed control where crops are
drilled directly without ploughing. Weeds can also act as a reservoir for
crop pathogens.
Because herbicide resistance genes are also effective selectable marker
genes in culture, herbicide-tolerant crop varieties were the first major
transgenic trait to be produced and commercialised and herbicide tol-
erant varieties are still the most widely grown transgenic crops.
Based either on expression of a herbicide insensitive gene, degradation
of the herbicide or overexpression of the herbicide target gene product,
engineered resistance is now available to a range of herbicides,20,21
including: glyphosate (‘Roundup Ready’, ‘Touchdown’), glufosinate
(‘Liberty Link’), imidazalonones (IMI), protoporphyrinogen oxidase
inhibitors (‘Acuron’), bromoxynil, triazines, 2,4-D, chlorsulfuron/sul-
fonylureas and isoxazoles.
There is now good evidence that far from increasing the application of
herbicides, the control that transgenic herbicide resistant crops provide
283Plant Biotechnology
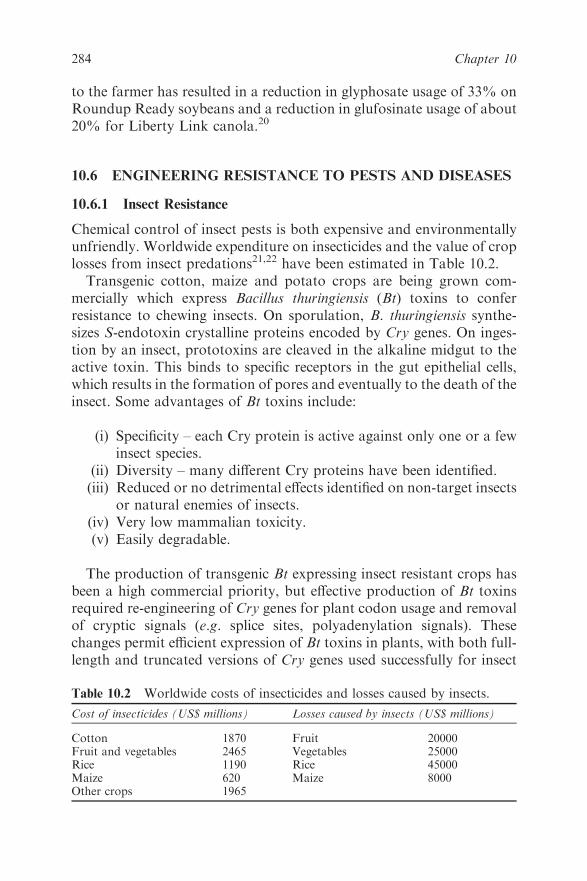
to the farmer has resulted in a reduction in glyphosate usage of 33% on
Roundup Ready soybeans and a reduction in glufosinate usage of about
20% for Liberty Link canola.20
10.6 ENGINEERING RESISTANCE TO PESTS AND DISEASES
10.6.1 Insect Resistance
Chemical control of insect pests is both expensive and environmentally
unfriendly. Worldwide expenditure on insecticides and the value of crop
losses from insect predations21,22 have been estimated in Table 10.2.
Transgenic cotton, maize and potato crops are being grown com-
mercially which express Bacillus thuringiensis (Bt) toxins to confer
resistance to chewing insects. On sporulation, B. thuringiensis synthe-
sizes S-endotoxin crystalline proteins encoded by Cry genes. On inges-
tion by an insect, prototoxins are cleaved in the alkaline midgut to the
active toxin. This binds to specific receptors in the gut epithelial cells,
which results in the formation of pores and eventually to the death of the
insect. Some advantages of Bt toxins include:
(i) Specificity – each Cry protein is active against only one or a few
insect species.
(ii) Diversity – many different Cry proteins have been identified.
(iii) Reduced or no detrimental effects identified on non-target insects
or natural enemies of insects.
(iv) Very low mammalian toxicity.
(v) Easily degradable.
The production of transgenic Bt expressing insect resistant crops has
been a high commercial priority, but effective production of Bt toxins
required re-engineering of Cry genes for plant codon usage and removal
of cryptic signals (e.g. splice sites, polyadenylation signals). These
changes permit efficient expression of Bt toxins in plants, with both full-
length and truncated versions of Cry genes used successfully for insect
Table 10.2 Worldwide costs of insecticides and losses caused by insects.
Cost of insecticides (US$ millions) Losses caused by insects (US$ millions)
Cotton 1870 Fruit 20000Fruit and vegetables 2465 Vegetables 25000Rice 1190 Rice 45000Maize 620 Maize 8000Other crops 1965
284 Chapter 10
resistance. Now, more than 40 different genes containing insect resis-
tance have been incorporated into transgenic crops with several com-
mercialised in different countries such as the USA and Australia.23
Given the usefulness of Bt toxins for insect control, various man-
agement strategies must be adopted to delay development of insect
resistance to Bt. These include:
(i) setting aside areas of non-Bt cotton as refuges to reduce the
selection pressure towards insect resistance;
(ii) deploying different insect resistance genes (e.g. protease
inhibitors);
(iii) using multiple Bt toxins which target different receptors;
(iv) use of spray inducible promoters to control expression of Bt
genes;
(v) use of tissue-specific promoters such that insects can feed
unharmed on economically less important parts of the plant.
It is mandatory to set aside non-transgenic refuges when growing Bt
cotton, maize and potatoes. Even with additional costs associated with
this and other agronomic management practices, the growth of Bt cot-
ton gives higher returns to farmers, environmental benefits (50–80% less
chemicals used, spraying reduced from 10–12 per year to 4–5 per year)
and less occupational exposure of farm workers to sprays.24
There are other approaches under development for transgenic insect
resistance,23 including those based on: protease inhibitors, a amylase
inhibitors, lectins, chitinases, cholesterol oxidase, cloned insect viruses,
tryptophan decarboxylase, anti-chymotrypsin, anti-elastase, bovine
pancreatic trypsin inhibitor and spleen inhibitor.
10.6.2 Engineered Resistance to Plant Viruses
Viruses cause significant losses in most major food and fibre crops
worldwide. A range of strategies can be used to control virus infection,
including chemical treatments to kill virus vectors, identification
and introduction of natural resistance genes from related species
and use of diagnostics and indexing to ensure propagation of virus-free
starting material (seeds, tubers, etc.). However, the major development
has been the exploitation of pathogen-derived resistance, i.e. the use
of virus-derived sequences expressed in transgenic plants to confer
resistance to plant viruses.25 This approach is based on earlier obser-
vations that inoculation or infection of a plant initially with a mild strain
of a virus confers protection against subsequent inoculation with a
285Plant Biotechnology

virulent strain of the same or a closely related virus.25 Pathogen-derived
resistance thus involves transformation of plants with virus-derived
sequences; host resistance appears to result from two different
mechanisms: (i) protection thought to be mediated by expression of
native or modified viral proteins (e.g. coat protein, replicase, defective
replicase) and (ii) protection mediated at the transcriptional level
(‘RNA-mediated resistance’) which requires transcription of RNA
either from full or partial sequences derived from the target virus
(including genes for coat protein, replicase, defective replicase, protease,
movement protein, etc.).
The molecular events which underlie pathogen-derived resistance are
the subject of intensive research.26 The bases of RNA-mediated virus
resistance and post-transcriptional gene silencing are probably similar
and reflect fundamental activities in plant cells to detect, inactivate and
eliminate foreign DNA or RNA.27 For example, endogenous plant
genes inserted into viruses such as PVX can silence expression of the
endogenous plant gene.28 It is probable that low molecular weight
double-stranded RNA sequences homologous to the gene message to be
silenced or degraded travel systemically through the plant from the site
of induction, to ensure that viruses with homologous sequences are
degraded when they arrive elsewhere in the plant.29 Understanding the
basis of resistance is needed to ensure practical applications of trans-
genic virus resistance are stable and have the least environmental risks
when deployed on a wide scale.
Most of the major crops have been transformed with genes from
major viral pathogens based on the concept of pathogen-derived resis-
tance. For example, by expression of viral replicase derived sequences,
host resistance has to be obtained to 13 genera of viruses representing 11
plant virus taxa.30
Major crops transformed for virus resistance include potato, tomato,
canola, soybean, sugar beet, rice, barley, sugar cane, papaya, melons/
cucurbits, peanut, horticultural and tree species. Effective resistance
against a wide range of viruses has been achieved,21 including PVX,
PVY, PLRV, CMV, BYMV, PRSV, ACMV, CPMV, TYLCV, PPV,
PMMV, TMV, PEBV, CymRSV, BYDV, RTV and BBTV.
A good practical application of this technology is that of effective
protection of transgenic papaya (Carica papaya) against papaya ring-
spot virus (PRSV).31 In Hawaii, PRSV has devastated papaya produc-
tion. Resistance to PRSV (mediated via viral coat protein constructs)
has held up under field conditions in Hawaii and these results suggest
that long-term protection of perennial crops, such as papaya, will be
possible using pathogen-derived resistance.
286 Chapter 10
10.6.3 Resistance to Fungal Pathogens
Plants react to attack by fungal and other pathogens by activating a
series of defence mechanisms, both locally and throughout the plant.32
The responses may be non-specific induction of defence reactions to
pathogens or specific responses based on the race of the pathogen and
the genotype of the host plant. Local resistance may appear as a
hypersensitive response in which a local necrotic lesion restricts the
growth and spread of a pathogen. Systemic resistance, which may take
several hours or days to develop, provides resistance to pathogens in
parts of the plant remote form the initial site of infection and longer
term resistance to secondary challenge by the initial pathogen and also
to unrelated pathogens.
The hypersensitive response is characterised by rapid reactions to
invasion by a potential pathogen, through recognition of pathogen or
cell wall derived elicitors.33 It involves:
(i) opening of specific ion channels;
(ii) membrane potential changes;
(iii) oxidative burst (generation of reactive oxygen species);
(iv) synthesis of peroxidase;
(v) production of secondary metabolites (phenylpropanoids and
phytoalexins);
(vi) synthesis of pathogenesis-related (PR) proteins (e.g. b-l,3-glu-
canases, chitinases);
(vii) cell wall changes (e.g. suberin, lignin).
It results in death of host cells, formation of a necrotic lesion and
restriction or death of the pathogen.
Transduction of a signal following pathogen recognition can be both
local and systemic and involves a number of different pathways.34,35 The
synthesis and accumulation of salicylic acid appears to be necessary for
both local and systemic induction of defence responses and salicylic acid
(or methyl salicylate) is a major signalling molecule. However, other
compounds can activate plant defence genes32 (e.g. 2,6-dichloro-
isonicotinic acid, benzothiadiazole, ethylene, abscisic acid, jasmonic acid
and systemin). Systemic signals may lead to induction of systemic
acquired resistance.
For salicylic acid signalling, salicylic acid moves in the phloem and its
presence may be required to establish and maintain systemic acquired
resistance. Its arrival in tissues leads to expression of plant defence-
related genes in sites distant from the initial challenge, such as PR
287Plant Biotechnology
proteins and production of hydrogen peroxide and reactive oxygen
species, cross-linking of cell wall proteins and lignin synthesis.
There are a series of other defence systems that plants use to combat
pathogens and these include natural resistance genes and antifungal
proteins.
10.6.4 Natural Resistance Genes
The hypersensitive response often results from a specific interaction
between a biotrophic pathogen and its host plant. This is known as a
‘gene-for-gene’ interaction between pathogen and host, in which an
avirulence gene product from the pathogen is recognised by a resistance
gene in the host plant. This recognition leads to induction of hyper-
sensitive defence responses.36
Avirulence (Avr) genes encode a variety of polypeptides, some of
which may be required for pathogenicity but have then become aviru-
lence factors once they have been detected by the plant. The best
characterised Avr genes are Avr4 and Avr9 of the fungal pathogen
Cladosporium fulvum.37 These encode pre-proteins which are
processed to mature, extracellular cysteine-rich peptides of 86 and 28
amino acids, respectively. These peptides induce a hypersensitive
response in plants which contain the matching resistance genes Cf-4 and
Cf-9, respectively.
A series of plant resistance (R) genes active against a range of
pathogens have been cloned and characterised. The R genes Cf-4 and
Cf-9 encode transmembrane glycoproteins, in which the extracellular
portion has characteristic leucine-rich repeats (LRR), a transmembrane
domain and a C-terminal cytoplasmic domain. The Avr gene products
are recognised by the LRR receptor regions, which results in signal
transduction, gene activation and the hypersensitive response.
With the characterisation of R-genes against fungal, bacterial, viral
and nematode pathogens, common patterns have emerged.36 Depending
on the site of recognition of the elicitor, the R gene products may either
span the plasma membrane and detect the elicitor extracellularly or be
located in the cytoplasm for intracellular elicitor recognition. Intracel-
lular recognition would be expected for virus infection, but pathogens
growing extracellularly appear to be recognised by the presence of
extracellular elicitors or signal molecules from the pathogens that cross
the host plasma membrane.
Five classes of R-genes have been proposed (Table 10.3 and Figure
10.1), in which common features occur – leucine-rich repeats (LRR),
nucleotide binding site (NBS), leucine zippers (LZ), toll and interleukin-
288 Chapter 10
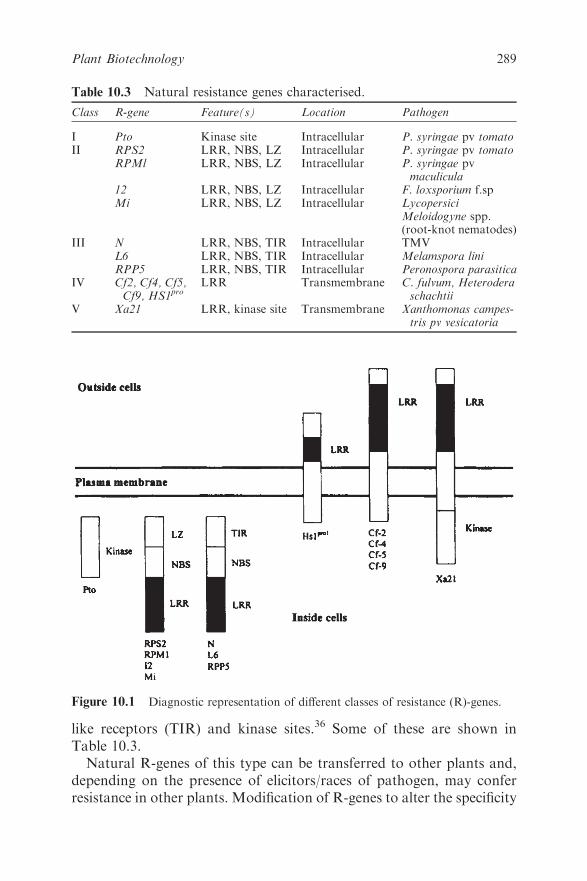
like receptors (TIR) and kinase sites.36 Some of these are shown in
Table 10.3.
Natural R-genes of this type can be transferred to other plants and,
depending on the presence of elicitors/races of pathogen, may confer
resistance in other plants. Modification of R-genes to alter the specificity
Table 10.3 Natural resistance genes characterised.
Class R-gene Feature(s) Location Pathogen
I Pto Kinase site Intracellular P. syringae pv tomatoII RPS2 LRR, NBS, LZ Intracellular P. syringae pv tomato
RPMl LRR, NBS, LZ Intracellular P. syringae pvmaculicula
12 LRR, NBS, LZ Intracellular F. loxsporium f.spMi LRR, NBS, LZ Intracellular Lycopersici
Meloidogyne spp.(root-knot nematodes)
III N LRR, NBS, TIR Intracellular TMVL6 LRR, NBS, TIR Intracellular Melamspora liniRPP5 LRR, NBS, TIR Intracellular Peronospora parasitica
IV Cf2, Cf4, Cf5,Cf9, HS1pro
LRR Transmembrane C. fulvum, Heteroderaschachtii
V Xa21 LRR, kinase site Transmembrane Xanthomonas campes-tris pv vesicatoria
Figure 10.1 Diagnostic representation of different classes of resistance (R)-genes.
289Plant Biotechnology
of recognition of elicitors could also be achieved and various schemes
have been developed to convert the specific recognition (e.g. of the avr9/
Cf9 system) to a general defence response switched on by damage caused
by non-specific pathogens.38
As indicated above, most of the R-genes identified so far have com-
mon sequence and structural motifs. It is possible to align published
sequences and synthesize PCR primers complementary to the conserved
sequences and to amplify classes of ‘resistance gene analogues’
(RGAs).39 RGAs can be mapped and exist in local clusters of related
sequences in the genome. This approach can aid identification of natural
resistance genes and mapping of RGAs can also provide molecular
markers closely linked to known resistance genes.
However, not all R-genes operate via a gene-for-gene mechanism. The
HM1 R-gene encodes a reductase which inactivates toxins produced by
the fungal pathogen Cochliobulus carbonum and the mlo gene for pow-
dery mildew resistance encodes a negative regulator of cell death.40
10.6.5 Engineering Resistance to Fungal Pathogens
The strategy used to engineer resistance to fungal pathogens often
depends on the nature of the host–pathogen interaction. As indicated in
the previous section, for biotrophic fungal pathogens, a specific R-gene
approach can be used since there is often a gene-for-gene interaction
between pathogen and host and natural or modified R-genes may be
transferred to other genotypes of the same species or to other species,
which may confer resistance to the race of pathogen which they recog-
nised in the host plant. However, for necrotrophic fungal pathogens,
which kill tissues in advance of hyphal invasion, other approaches are
required. These include induction of systemic acquired resistance, pro-
duction of a range of antifungal proteins,41 or introduction of genes
which can degrade fungal toxins. Examples include:
(i) genes for toxin inactivation (e.g. HM1);
(ii) genes encoding anti-fungal proteins (e.g. plant defensins such as
radish anti-fungal protein, thionins such as macadamia nut
antifungal protein);
(iii) genes encoding PR proteins (e.g. chitinases, b,3-glucanases);
(iv) genes that will activate the systemic acquired resistance response;
(v) artificially induced hypersensitive reaction.
In general, the approaches which involve transformation of plants
with genes for anti-fungal proteins do not give complete resistance to
290 Chapter 10
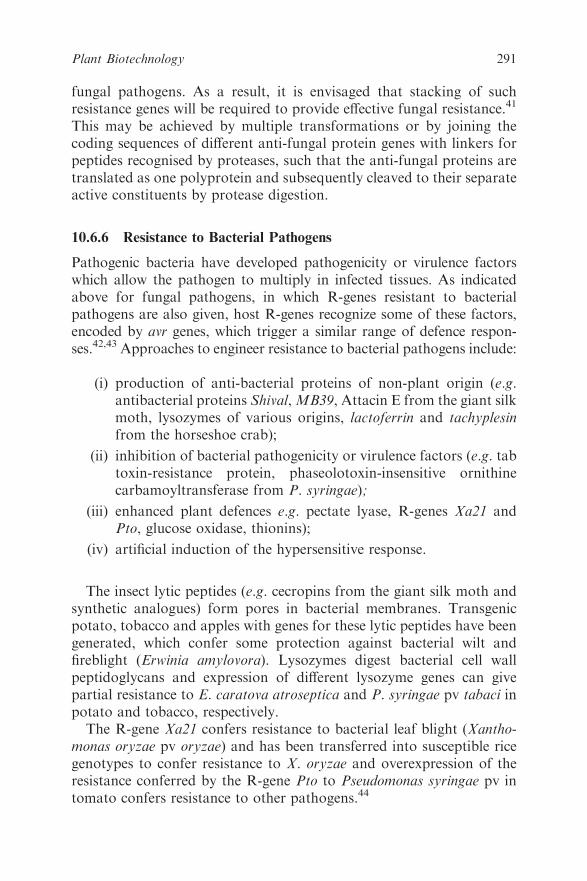
fungal pathogens. As a result, it is envisaged that stacking of such
resistance genes will be required to provide effective fungal resistance.41
This may be achieved by multiple transformations or by joining the
coding sequences of different anti-fungal protein genes with linkers for
peptides recognised by proteases, such that the anti-fungal proteins are
translated as one polyprotein and subsequently cleaved to their separate
active constituents by protease digestion.
10.6.6 Resistance to Bacterial Pathogens
Pathogenic bacteria have developed pathogenicity or virulence factors
which allow the pathogen to multiply in infected tissues. As indicated
above for fungal pathogens, in which R-genes resistant to bacterial
pathogens are also given, host R-genes recognize some of these factors,
encoded by avr genes, which trigger a similar range of defence respon-
ses.42,43 Approaches to engineer resistance to bacterial pathogens include:
(i) production of anti-bacterial proteins of non-plant origin (e.g.
antibacterial proteins Shival,MB39, Attacin E from the giant silk
moth, lysozymes of various origins, lactoferrin and tachyplesin
from the horseshoe crab);
(ii) inhibition of bacterial pathogenicity or virulence factors (e.g. tab
toxin-resistance protein, phaseolotoxin-insensitive ornithine
carbamoyltransferase from P. syringae);
(iii) enhanced plant defences e.g. pectate lyase, R-genes Xa21 and
Pto, glucose oxidase, thionins);
(iv) artificial induction of the hypersensitive response.
The insect lytic peptides (e.g. cecropins from the giant silk moth and
synthetic analogues) form pores in bacterial membranes. Transgenic
potato, tobacco and apples with genes for these lytic peptides have been
generated, which confer some protection against bacterial wilt and
fireblight (Erwinia amylovora). Lysozymes digest bacterial cell wall
peptidoglycans and expression of different lysozyme genes can give
partial resistance to E. caratova atroseptica and P. syringae pv tabaci in
potato and tobacco, respectively.
The R-gene Xa21 confers resistance to bacterial leaf blight (Xantho-
monas oryzae pv oryzae) and has been transferred into susceptible rice
genotypes to confer resistance to X. oryzae and overexpression of the
resistance conferred by the R-gene Pto to Pseudomonas syringae pv in
tomato confers resistance to other pathogens.44
291Plant Biotechnology
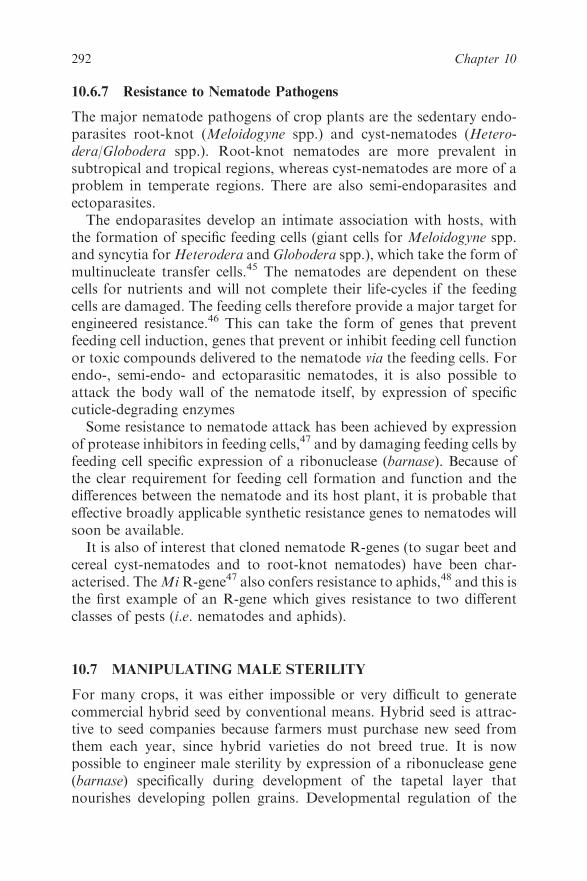
10.6.7 Resistance to Nematode Pathogens
The major nematode pathogens of crop plants are the sedentary endo-
parasites root-knot (Meloidogyne spp.) and cyst-nematodes (Hetero-
dera/Globodera spp.). Root-knot nematodes are more prevalent in
subtropical and tropical regions, whereas cyst-nematodes are more of a
problem in temperate regions. There are also semi-endoparasites and
ectoparasites.
The endoparasites develop an intimate association with hosts, with
the formation of specific feeding cells (giant cells for Meloidogyne spp.
and syncytia forHeterodera and Globodera spp.), which take the form of
multinucleate transfer cells.45 The nematodes are dependent on these
cells for nutrients and will not complete their life-cycles if the feeding
cells are damaged. The feeding cells therefore provide a major target for
engineered resistance.46 This can take the form of genes that prevent
feeding cell induction, genes that prevent or inhibit feeding cell function
or toxic compounds delivered to the nematode via the feeding cells. For
endo-, semi-endo- and ectoparasitic nematodes, it is also possible to
attack the body wall of the nematode itself, by expression of specific
cuticle-degrading enzymes
Some resistance to nematode attack has been achieved by expression
of protease inhibitors in feeding cells,47 and by damaging feeding cells by
feeding cell specific expression of a ribonuclease (barnase). Because of
the clear requirement for feeding cell formation and function and the
differences between the nematode and its host plant, it is probable that
effective broadly applicable synthetic resistance genes to nematodes will
soon be available.
It is also of interest that cloned nematode R-genes (to sugar beet and
cereal cyst-nematodes and to root-knot nematodes) have been char-
acterised. TheMiR-gene47 also confers resistance to aphids,48 and this is
the first example of an R-gene which gives resistance to two different
classes of pests (i.e. nematodes and aphids).
10.7 MANIPULATING MALE STERILITY
For many crops, it was either impossible or very difficult to generate
commercial hybrid seed by conventional means. Hybrid seed is attrac-
tive to seed companies because farmers must purchase new seed from
them each year, since hybrid varieties do not breed true. It is now
possible to engineer male sterility by expression of a ribonuclease gene
(barnase) specifically during development of the tapetal layer that
nourishes developing pollen grains. Developmental regulation of the
292 Chapter 10
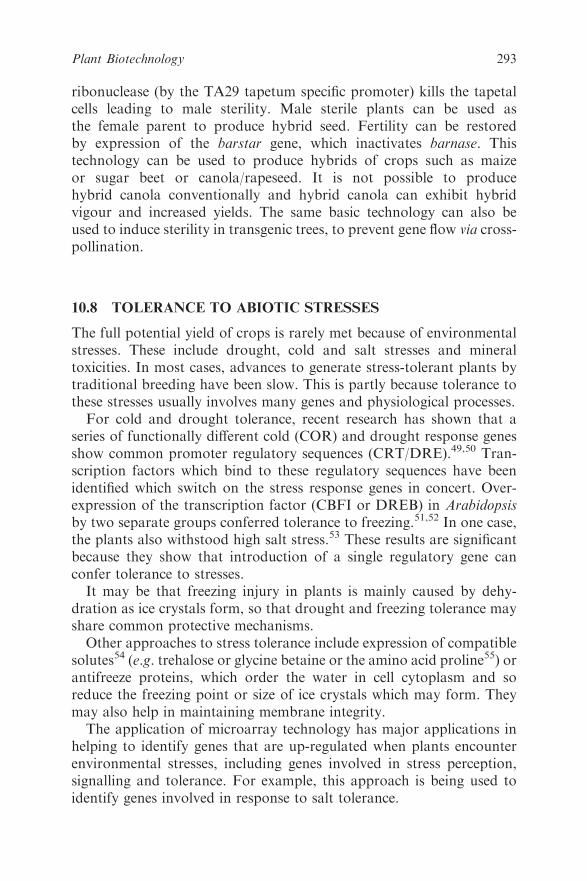
ribonuclease (by the TA29 tapetum specific promoter) kills the tapetal
cells leading to male sterility. Male sterile plants can be used as
the female parent to produce hybrid seed. Fertility can be restored
by expression of the barstar gene, which inactivates barnase. This
technology can be used to produce hybrids of crops such as maize
or sugar beet or canola/rapeseed. It is not possible to produce
hybrid canola conventionally and hybrid canola can exhibit hybrid
vigour and increased yields. The same basic technology can also be
used to induce sterility in transgenic trees, to prevent gene flow via cross-
pollination.
10.8 TOLERANCE TO ABIOTIC STRESSES
The full potential yield of crops is rarely met because of environmental
stresses. These include drought, cold and salt stresses and mineral
toxicities. In most cases, advances to generate stress-tolerant plants by
traditional breeding have been slow. This is partly because tolerance to
these stresses usually involves many genes and physiological processes.
For cold and drought tolerance, recent research has shown that a
series of functionally different cold (COR) and drought response genes
show common promoter regulatory sequences (CRT/DRE).49,50 Tran-
scription factors which bind to these regulatory sequences have been
identified which switch on the stress response genes in concert. Over-
expression of the transcription factor (CBFI or DREB) in Arabidopsis
by two separate groups conferred tolerance to freezing.51,52 In one case,
the plants also withstood high salt stress.53 These results are significant
because they show that introduction of a single regulatory gene can
confer tolerance to stresses.
It may be that freezing injury in plants is mainly caused by dehy-
dration as ice crystals form, so that drought and freezing tolerance may
share common protective mechanisms.
Other approaches to stress tolerance include expression of compatible
solutes54 (e.g. trehalose or glycine betaine or the amino acid proline55) or
antifreeze proteins, which order the water in cell cytoplasm and so
reduce the freezing point or size of ice crystals which may form. They
may also help in maintaining membrane integrity.
The application of microarray technology has major applications in
helping to identify genes that are up-regulated when plants encounter
environmental stresses, including genes involved in stress perception,
signalling and tolerance. For example, this approach is being used to
identify genes involved in response to salt tolerance.
293Plant Biotechnology
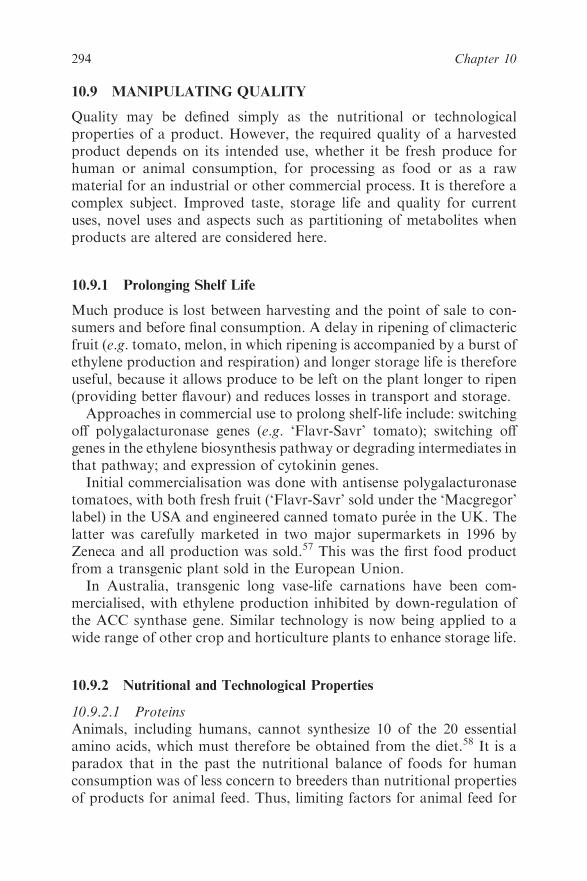
10.9 MANIPULATING QUALITY
Quality may be defined simply as the nutritional or technological
properties of a product. However, the required quality of a harvested
product depends on its intended use, whether it be fresh produce for
human or animal consumption, for processing as food or as a raw
material for an industrial or other commercial process. It is therefore a
complex subject. Improved taste, storage life and quality for current
uses, novel uses and aspects such as partitioning of metabolites when
products are altered are considered here.
10.9.1 Prolonging Shelf Life
Much produce is lost between harvesting and the point of sale to con-
sumers and before final consumption. A delay in ripening of climacteric
fruit (e.g. tomato, melon, in which ripening is accompanied by a burst of
ethylene production and respiration) and longer storage life is therefore
useful, because it allows produce to be left on the plant longer to ripen
(providing better flavour) and reduces losses in transport and storage.
Approaches in commercial use to prolong shelf-life include: switching
off polygalacturonase genes (e.g. ‘Flavr-Savr’ tomato); switching off
genes in the ethylene biosynthesis pathway or degrading intermediates in
that pathway; and expression of cytokinin genes.
Initial commercialisation was done with antisense polygalacturonase
tomatoes, with both fresh fruit (‘Flavr-Savr’ sold under the ‘Macgregor’
label) in the USA and engineered canned tomato puree in the UK. The
latter was carefully marketed in two major supermarkets in 1996 by
Zeneca and all production was sold.57 This was the first food product
from a transgenic plant sold in the European Union.
In Australia, transgenic long vase-life carnations have been com-
mercialised, with ethylene production inhibited by down-regulation of
the ACC synthase gene. Similar technology is now being applied to a
wide range of other crop and horticulture plants to enhance storage life.
10.9.2 Nutritional and Technological Properties
10.9.2.1 Proteins
Animals, including humans, cannot synthesize 10 of the 20 essential
amino acids, which must therefore be obtained from the diet.58 It is a
paradox that in the past the nutritional balance of foods for human
consumption was of less concern to breeders than nutritional properties
of products for animal feed. Thus, limiting factors for animal feed for
294 Chapter 10
grains such as barley, maize and wheat were the levels of the amino acids
lysine, threonine and tryptophan, whereas sulfur-containing amino acids
(methionine and cysteine) were limiting in grain legumes and pulses. It is
now possible to overexpress genes encoding proteins with high pro-
portions of limiting amino acids, either from natural sources or as
synthetic proteins.
One example is the synthesis of enhanced levels of the sulfur-rich
amino acid methionine in grain legumes (e.g. lupin), by transfer of a
sulfur-rich sunflower seed albumin into lupins. Feeding trials of sulfur-
enriched lupins gave increased live weight gain, showing that effective
improvements in nutritive value of grain crops are achievable by genetic
engineering.59
The use of plants to produce speciality proteins is considered in
Section 10.10.
The breadmaking quality of wheat results from the viscoelastic prop-
erties of the storage proteins. Wheat gluten is a complex mixture of more
than 50 proteins, mainly prolamins. The most important of these are high
molecular weight subunits of glutenin, because these determine much of
the elastic properties of gluten for wheat doughs to make bread, pasta and
other foods. High molecular weight glutenin genes have now been
transferred to a number of wheat varieties, with modification to dough
elasticity.60,61 This work shows that the technological properties of wheat
storage proteins can be modified usefully by genetic engineering.
10.9.2.2 Oils
Plant oils are normally stored as triacylglycerols, with fatty acids and
glycerol separated in downstream processing. Oil crops are second in
importance to cereals as food sources for humans and provide many
industrial products. The major oil products are derived from: soybean
(18Mt), oilpalm (15Mt), canola/rapeseed (10Mt), sunflower (8Mt) and
other sources (20Mt), with a total value of US$45 billion per annum.62
This value is expected to increase to US$70 billion by about 2010.
Rapeseed (or canola) has been a model oil crop, in great part because
it is closely related to Arabidopsis and information from the study of
Arabidopsis can be applied directly to rapeseed. Identification and iso-
lation of genes involved in pathways of oil synthesis have led to a range
of transgenic rapeseed varieties with modified oils. The term ‘designer
oils’ has been coined to indicate that chain length, degree of saturation
and position of double bonds can be manipulated. Field trials and
commercial release of many new oil quality lines are in progress and are
shown in Table 10.4.62
295Plant Biotechnology

The percentage content of a specific oil can probably be raised up to at
least 90% of the oil product. With depletion of world hydrocarbon
reserves, in the future it is probable that plant oils (e.g. biodiesel) will
compete in terms of price and quality with oil, coal and gas and will
become the major large-scale source of renewable industrial hydrocarbons.
Oilseed meal, which is high in protein, is also a valuable commodity
used to supplement animal and fish feeds and its protein can be used for
human consumption in products such as soy milk and textured vege-
table meat substitutes.
Although most advances in biotechnology of oils have come from
rapeseed/canola improvement, the same principles can be applied to
other oil crops, although this is technically more difficult to achieve, for
example, with oilpalms.
10.9.2.3 Manipulation of Starch
Starch constitutes 50–80% of the dry weight of starch-storing organs
(e.g. potato tubers, cereal endosperm). It occurs in granules as amylose,
a linear al–4 glucan polymer (15–35%) and amylopectin, a linear a1–4
glucan chains connected with a1–6 branches (65–85%). Transgenic
expression of enzymes in sucrose metabolism have shown that it is
possible, for example in potato, to modify tuber size, number, yield and
starch content.63
There has been increased commercial interest in amylose-free (waxy)
or high-amylopectin starches, because they make processing easier and
because of their gel stability and clarity.64 Amylose-free ‘waxy’ mutants
have been found for many species (e.g. maize, rice, barley, wheat,
potato, pea) and this correlates with loss of granule-bound starch
Table 10.4 Transgenic rapeseed varieties under development
Seed product Industrial product
40% stearic (18:0) Margarine, cocoa butter40% lauric (12:0) Detergents60% lauric (12:0) Detergents80% oleic (18:1 A9) Food, lubricants, inksPetroselinic (18:1 A6) Polymers, detergentsJojoba wax (C20, C22) Cosmetics, lubricants40% myristate (14:0) Detergents, soaps, personal care90% erucic (22:1) Polymers, cosmetics, inks, pharmaceuticalsRicinoleic (18:1–OH) Lubricants, plasticisers, cosmetics, pharmaceuticalsPolyhydroxybutyrate Biodegradable plasticsPhytase Animal feedsIndustrial enzymes Fermentation, paper manufacture, food processingNovel peptides Pharmaceuticals
296 Chapter 10

synthase (GBSS) enzyme activity. Waxy starches can also be generated
using antisense technology by switching off GBSS gene expression and
its relative accumulation and form can be manipulated (e.g. in potato
tubers). Applications include: generating noodle quality wheat starch
(lacking GBSS on chromosome 4A); reduced amylose or waxy wheat
starch (e.g. two or all three GBSS loci – 4A, 7A, 7D – inactive); and
generating starches with novel structures.
Modified starches have novel properties that can be used to develop
new applications in the food processing industry.
10.9.2.4 Fructans
Sugar beet normally stores sucrose, but by expression of a 1-sucrose–
sucrose fructosyl transferase (1-ISST) gene in sugar beet transgenic
plants now store fructans. The significance of this work is that humans
cannot digest fructans, so that they can be used as low-calorie food
ingredients. Low molecular weight fructans (up to five monosaccharide
units) taste like sugar and can be used as low-calorie sweeteners, whereas
long-chain fructans form emulsions which can be used to replace fats in
foods such as creams and spreads.65,66
10.9.3 Manipulation of Metabolic Partitioning
The flow of metabolites through metabolic and biosynthetic pathways is
regulated to respond to developmental and environmental conditions.
The distribution of metabolites (partitioning) controls the flux of carbon
compounds towards the synthesis of sugars, starch and oils in storage
organs and may change to meet developmental states, environmental
constraints or in the activation of the diverse array of defence responses
when a plant is attacked by pathogens. Metabolic fluxes can be
manipulated and an understanding of the control of partitioning
between metabolic pathways is required for metabolic engineering – this
knowledge can be used to increase the production or yield of commer-
cially important metabolites and products.67,68 Strategies to modify
partitioning include:
(i) changing levels of signalling metabolites and hormones;
(ii) removal of end products to change reaction equilibria;
(iii) expression of heterologous enzymes to bypass endogenous reg-
ulatory mechanisms;
(iv) expression of transcriptional regulators that control pathways;
(v) switching off gene expression by sense/antisense suppression.
297Plant Biotechnology
Most commercial applications of metabolic partitioning involve
altered starch and oil biosynthesis, reducing lignin content or synthesis
of biodegradable plastic (polyhydroxybutyrate, PHB), but this aspect is
also relevant to all uses of plants as bioreactors to produce more of
current or novel compounds efficiently.
10.10 PRODUCTION OF PLANT POLYMERS AND
BIODEGRADABLE PLASTICS
Plastics are important materials in everyday use. They are polymers that
can be moulded using heat and pressure. However, they present serious
problems of disposal, persistence and environmental pollution and it
would be preferable if biodegradable plastics could be generated from
agricultural products, which could be degraded biologically to carbon
dioxide and water.69 Potential sources of biological polymers include
starch, cellulose, pectins, proteins and PHB. Various native starches
from wheat, rice, maize and potato have been used to make plastics and
a range of shaped products have been manufactured.70 However, pro-
duction of PHB or related polyhydroxyalkanoates in plants provides the
most attractive sources of biodegradable plastics at low cost. These
crops will enhance the value of production and benefit land use and
waste disposal.
A combination of microbiology, polymer chemistry and plant bio-
technology is likely to provide new crops providing valuable non-food
products. For example, there is the prospect of growing ‘easy-care’
polyester cotton, in which PHB is deposited in the hollow central lumen
of the cotton fibre. Less than 1% of PHBs can improve the insulating
property of the cotton fibre by 8–9%.71
10.11 PLANTS AS BIOREACTORS: BIOPHARMING AND
NEUTRACEUTICALS
Plant products have long been used in medicine, and now plant bio-
technology is entering the medical field in a spectacular way, with the
creation of plants which produce proteins of pharmaceutical value or
subunit vaccines.
10.11.1 Edible Vaccines
Traditionally, attenuated strains of pathogenic organisms have been
injected or delivered orally to invoke an immune response. Now it is
possible to clone genes encoding immunogenic subunits of pathogen
298 Chapter 10
proteins and to express these either in transgenic plants or in plant
viruses. Transgenic plants have a permanent capacity to express the
vaccine, whereas engineered viruses permit transient production of large
quantities of immunogenic protein.72 The aim of this work is that by
eating fresh fruit (e.g. banana) containing an antigen, individuals can
develop immunity to the pathogenic organism via the gut immune sys-
tem. In some cases human trials are in progress to test the efficiency of
this approach for the following diseases and applications: hepatitis B;
cholera; E. coli heat-labile enterotoxin; Norwalk virus; rhinovirus; HIV;
rabies; antimalarial parasites; immunocontraception (ZP3 zona pellu-
cida protein); and inhibition of late-onset diabetes.73
The same approach is being used to engineer plant vaccines for
domestic animals and livestock (e.g. parvoviruses such as feline pan-
leukopenia virus, canine virus, mink enteritis virus);74 swine fever, foot
and mouth disease and rabies.75
10.11.2 Production of Antibodies in Plants
The ‘biopharming’ approach indicated above can also be used to pro-
duce either large quantities of antibodies in plants as bioreactors or to
deliver pharmacologically active antibodies in food. A good example of
the latter is the synthesis in plants of antibodies against the bacterium
(Streptococcus mutatis) that causes dental caries in teeth. Extracted
antibodies confer protection in human trials.76 Expressed in an apple,
this transgenic apple a day would also keep the dentist away!
10.11.3 Plant Neutraceuticals
The concept of using plants as bio-factories to produce pharmaceuticals
also extends to the potential production of a wide range of other pro-
ducts. These may be in the health care area (e.g. dermatology, cardiol-
ogy, human metabolism, endocrinology, respiration, transplantation
and oncology),77 or production of compounds that improve human diet
or health (the formation of a new ‘wellness complex’ by food). For
example, Prodi Gene and Stauffer seeds are growing maize that pro-
duces avidin for use in health diagnostic kits,78 and Brazzein, a low-
calorie natural sweetener.77 Other neutraceuticals include over-
production of vitamin A in rice or phytosterols to reduce cholesterol in
humans. Clearly, identity preservation and separate storage/transport
and handling will be required for such products, as for most high-value
transgenic crops.
299Plant Biotechnology
10.12 PLANT BIOTECHNOLOGY IN FORESTRY
Forests are both economically and environmentally important. The
demand for wood products, such as timber for construction, paper, pulp
and energy, is increasing and expanded plantation forestry will be
required to meet the global demand. The time lines for tree breeding
have made progress in improving forest productivity slow. Now, the full
range of biotechnological technologies is being applied to tree
improvement. These include clonal micropropagation of superior trees,
hybridisation, molecular markers and marker-assisted selection and
transformation.
A range of tree species has been transformed using both Agro-
bacterium and particle bombardment approaches:79 poplar, European
larch, hybrid larch, Norway spruce, Scots pine, white spruce, black
spruce, eastern larch, radiata pine, Tasmanian bluegum and a range of
Eucalyptus species. The targets for tree improvement involve improved
growth rate, wood characteristics, pulp quality, pest and disease resis-
tance and tolerance to abiotic stresses.
A major target is to engineer reduced lignin content, since lignin
represents about 25% of the wood biomass and lignins reduce the effi-
ciency of pulp and paper production. High energy usage and production
of chemical pollutants also result from delignification processes. This
has been achieved by down-regulation of key enzymes in the lignin
biosynthetic pathway [e.g. cinnamyl alcohol dehydrogenase (CAD); O-
methyl transferase (OMT)].
Transgenic trees have also been generated with modified form, quality
and performance using auxin biosynthetic genes, rol c genes and per-
oxidase,79 and also with herbicide resistance and Bt insect resistance.
Environmental considerations are particularly important for growth of
transgenic trees. In order to reduce gene flow via pollen to native species,
engineered sterility of transgenics is desirable.
10.13 INTELLECTUAL PROPERTY
Because of patenting of novel genes, promoters, generic technology and
applications, the commercialisation of plant biotechnology can be a
complex issue. The costs associated with establishing, contesting,
defending and monitoring patents are a major reason why large life
sciences companies rather than public organisations (universities and
government-funded research institutes) are exploiting the new techno-
logies. This trend will undoubtedly continue and the major companies
listed in Table 10.1, such as Monsanto, DuPont-Pioneer and Novartis,
300 Chapter 10
will increase their hold on commercialisation. Plant breeding is already
essentially in the private domain in Europe and is rapidly moving that
way in North America and Australia.
Although intellectual property and patents must now be considered
from the start of any scientific work in molecular biology that is
intended to be commercialised and freedom to operate from gene to the
sale of seeds established, there is another level to consider, that is, the
ownership of germplasm. Breeding materials from many crops often
originate in centres of origin which are frequently in developing coun-
tries, in which germplasm may be held by international research centres.
The countries where the germplasm originated may well require some
equity or payment for use of their germplasm and accusations of ‘bio-
piracy’ have been made against breeders in developed countries. Greater
sensitivity will be needed in this area if access to new or wild germplasm
is not to be blocked.
10.14 PUBLIC ACCEPTANCE
The speed at which genetically modified (‘GM’) crops and food have
arrived has been unexpectedly rapid. In North America, where labelling
of GM food or products is not undertaken unless there is a substantial
difference from non-GM food, there are more than 300 million people
routinely eating GM produce. In Europe, different forces prevail on
public opinion, many of which are more connected with other events
such as the ‘mad cow disease’ (BSE) outbreak in the UK, trust of sci-
entists, politics and trade. These will slow acceptance and development
of GM foods and biotechnology and put Europe at a competitive dis-
advantage compared with North America. Australia lies between Eur-
ope and North America in terms of public acceptance of GM crops and
food, with transgenic cotton and carnations currently commercialised.
Major questions in acceptance of GM technology arise:
� Is GM food safe?
� Are there any long-term effects from eating GM food?
� Should all GM food be labelled?
� Should consumers have the right to choose between GM and non-
GM food?
� Will they contain new allergens?
� What are the environmental consequences?
There is, of course, no logical reason why any organisation would
wish to produce unsafe food. At present, GM food is subjected to much
301Plant Biotechnology
more stringent testing than conventional foods and is probably safer as a
result. The labelling issue is not as simple as it may seem. It is
straightforward to label a transgenic tomato as such but, for example,
soy products are used in differing amounts in thousands of processed
foods and it is difficult to label these in a meaningful and informative
way. Similarly, cotton oil is relatively pure and free of DNA or protein
derived from transgenes conferring herbicide tolerance. Does it need to
be labelled as GM? Is it substantially equivalent to the non-GM product
or not – where should the line be drawn? There are also concerns about
‘ethnically’ sensitive genes (e.g. a gene derived from a pig inserted in a
crop plant) and access of developing countries to GM technologies.
The large-scale consumption of GM food in North America by 300
million people since its introduction, without any reported problems,
supports the general view based on the science that GM food is safe.
Environmental issues should perhaps be of more concern. Pollination of
organic crops by transgenic maize is an issue,80 as is possible injury to
Monarch butterfly caterpillars eating food plants dusted with Bt maize
pollen. In contrast, there are reports of increased numbers of birds of
prey after 3 years’ growth of Bt insect-resistant crops, as fewer non-
target insects are killed, and this effect is transmitted through the food
chain.
At present, public debate often has little to do with the science and
actual risks and more to do with sensationalism and disinformation.
Banner headlines occur regularly in the press, on ‘Demon Seeds’,
‘Mutant Foods from the Gene Giants’, ‘Frankenstein foods’, etc.
However, this phase is expected to pass fairly rapidly, as understanding
of the benefits of the technologies in efficient food production, improved
food quality, protection of the environment and of biodiversity are
realised.
10.15 FUTURE PROSPECTS
Although transgenic technologies will not provide all the answers to
generating sustainable food production in the coming decades, the ‘gene
revolution’ will undoubtedly have more impact than the ‘green revolu-
tion’ on all aspects of agriculture and biotechnology. The potential is
that 80% of the food eaten in developed countries will have transgenic
content by the year 2010 and that up to 10% of the US maize crop will
be devoted to bioreactors, biopharming and production of neu-
traceuticals. Whether or not these percentages will be achieved in
practice will depend very much on public attitudes and acceptance of
transgenic technologies over the next few years.
302 Chapter 10

REFERENCES
1. E. M. Meyerowitz and C. R. Somerville (eds.), Arabidopsis,
Cold Spring Harbor Laboratory Press, Cold Spring Harbor, NY,
1994.
2. C. Dean and R. Schmidt, Annu. Rev. Plant Physiol. Plant Mol. Biol.,
1995, 46, 395.
3. M. Mohan, S. Nair, A. Bhagwat, T. G. Krishna, M. Yano, C. R.
Bhatia and T. Sasaki, Mol. Breeding, 1997, 3, 87.
4. W. Powell, G. C. Machray and J. Provan, Trends Plant Sci., 1996a,
1, 215.
5. W. Powell, M. Morgante, C. Andre, M. Hanafey, J. Vogel,
S. Tingey and A. Rafalski, Mol. Breeding, 1996b, 2, 225.
6. J.-M. Ribaut and D. Hoisington, Trends Plant Sci., 1998, 3, 236.
7. A. Briney, R. Wilson, R. H. Potter, I. Barclay, R. Appels and M. G.
K. Jones, Mol. Breeding, 1998, 4, 427.
8. S. J. Wylie, C. R. Wilson, R. A. C. Jones and M. G. K. Jones, Aust.
J. Agric. Res., 1993, 44, 41.
9. A. Karp, K. J. Edwards, M. Bruford, S. Funk, B. Vosman,
M. Morgante, O. Seberg, A. Kremer, P. Boursot, P. Arctander,
D. Tantz and G. M. Hewitt, Nat. Biotechnol., 1997, 15, 625.
10. Desprez, J. Amselem, M. Caboche and H. Hofte, Plant J., 1998, 14,
643.
11. D. M. Kehoe, P. Villand and S. Somerville, Trends Plant Sci., 1999,
4, 38.
12. R. G. Birch, Annu. Rev. Plant Physiol. Plant Mol. Biol., 1997
48, 297.
13. C. J. Thompson, N. R. Movva, R. Tichard, R. Crameris, J. E.
Davies and M. Lauwereys, EMBO J., 1987, 6, 2519.
14. D.M. Shah, R. B. Horsch, H. J. Klee, G.M. Kishore, J. A.Winter, N.
E. Turner, C. M. Hironaka, P. R. Sanders, C. S. Gasser, S. Aykent, N.
R. Siegel, S. R. Rogers and R. T. Fraley, Science, 1986, 233, 478.
15. G. W. Haughn, J. Smith, B. Mazur and C. Somerville, Mol. Gen.
Genet., 1998, 211, 266.
16. A. Haldrup, S. G. Petersen and F. T. Okkels, Plant Cell Rep., 1998,
18, 76.
17. J. Haseloff, K. R. Siemering, D. C. Prasher and S. Hodge, Proc.
Natl. Acad. Sci. USA, 1997, 94, 2122.
18. S. Tingay, D. McElroy, R. Kalla, S. Fieg, M. Wang, S. Thornton
and R. Brettel, Plant J., 1997.
19. S. Tingay, D. McElroy, R. Kalla, S. Fieg, M. Wang, S. Thornton
and R. Brettel, Plant J., 1997.
303Plant Biotechnology
20. A. M. Thayer, Chem. Eng. News, 1999, 77, 21.
21. P. J. Dale, TIBTech, 1995, 13, 398.
22. R. A. de Maagd, D. Bosch and W. Stiekma, Trends Plant Sci., 1999,
4, 9.
23. T. H. Schuler, G. M. Poppy, B. R. Kerry and I. Denholm, TIBTech,
1998, 16, 168.
24. N. W. Forrester, in Commercialisation of Transgenic Crops: Risk,
Benefit and Trade Consideration, ed. G. D. McLane, P. M. Water-
house, G. Evans and M. J. Gibbs, Bureau of Resource Science,
Canberra, 1997, p. 239.
25. J. C. Sanford and S. A. Johnstone, J. Theor. Biol., 1985, 113,
395.
26. A. van Kammen, Trends Plant Sci., 1997, 2, 409.
27. S. P. Kumpatla, M. B. Chandrasekharan, L. M. Iyer, G. Li and
T. C. Hall, Trends Plant Sci., 1998, 3, 97.
28. J. J. English and D. C. Baulcombe, Plant J., 1997, 12, 1311.
29. H. Vaucheret, C. Beclin, T. Elmayan, F. Feuerbach, C. Godon,
J.-B. Morel, P. Mourrain, J.-C. Palauqui and S. Vernheltes, Plant J.,
1998, 16, 651.
30. R. Yang, PhD Thesis, Murdoch University, Perth, 1999.
31. S. Luis, R. M. Manshardt, M. M. M. Fitch, J. L. Slightom, J. C.
Sanford and D. Gonsalves, Mol. Breeding, 1997, 3, 161.
32. J. Durner, J. Shah and D. F. Klessig, Trends Plant Sci., 1997
2, 266.
33. N. Benhamou, Trends Plant Sci., 1996, 1, 233.
34. C. Wasternack and B. Parthier, Trends Plant Sci., 1997, 2, 302.
35. E. Blumwald, G. S. Aharon and B. C.-H. Lam, Trends Plant Sci.,
1998, 3, 342.
36. P. J. G. M. de Witt, Trends Plant 5c/., 1997, 2, 452.
37. M. Kooman-Gersmann, R. Vogelslang, E. C. M. Hoogendijk and
P. J. G. M. de Witt, Mol. Plant Microbe Interact., 1997, 10, 821.
38. K. E. Hammond-Kosack, S. Tang, K. Harrison and J. G. Jones,
Plant Cell, 1998, 10, 1251.
39. V. Kanazin, L. F. Marek and R. C. Shoemaker, Proc. Natl. Acad.
Sci. USA, 1996, 93, 11746.
40. R. Buschges, K. Hollricher, R. Panstruga, G. Simons, M. Wolter,
A. Frijters, R. van Daelen, T. van der Lee, P. Diergaarde,
J. Groenendijk, S. Topsch, P. Vos, F. Salamini and P. Schulze-
Lefert, Cell, 1997, 88, 695.
41. W. Broekaert, B. P. A. Cammue, M. F. C. De Bolle, K. Thevissen,
G. W. De Samblanx and R. W. Osborn, Crit. Rev. Plant Sci., 1997,
16, 297.
304 Chapter 10

42. U. Bonas and G. Van den Ackerveken, Plant J., 1997, 12, 1.
43. F. Mourgues, M. Brisset and E. Chevreau, TIBTech, 1998, 16, 203.
44. X. Tang, M. Xie, Y. J. Kim, J. Zhou, D. F. Klessig and G. B.
Martin, Plant Cell, 1999, 11, 15.
45. M. G. K. Jones, Ann. Appl. Biol., 1981, 97, 353.
46. V. M. Williamson and R. S. Hussey, Plant Cell, 1996, 8, 1735.
47. P. E. Urwin, C.-J. Lilley, M. J. McPherson and H. J. Atkinson,
Plant J., 1997, 12, 455.
48. M. Rossi, F. L. Goggin, S. B. Milligan, I. Kaloshian, D. E. Ullman
and V. M. Williamson, Proc. Natl. Acad. Sci., USA, 1998, 95, 9750.
49. E. J. Stockinger, S. J. Gilmour and M. F. Thomashow, Proc. Natl.
Sci. USA, 1997, 94, 1035.
50. S. J. Gilmour, D. G. Zarka, E. F. Stockinger, M. P. Salazar, J. M.
Houghton and M. F. Thomashow, Plant J., 1998, 16, 433.
51. K. R. Jaglo-Ottosen, S. J. Gilmour, D. G. Zarka, O. Schabenberger
and M. F. Thomashow, Science, 1998, 280, 104.
52. Q. Liu, M. Kasuga, Y. Sakuma, H. Abe, S. Miura, K. Yamaguch-
Shinozaki and K. Shinozaki, Plant Cell, 1998, 10, 1391.
53. M. Kasuga, Q. Liu, K. Yamaguchi-Shinozaki and K. Shinozaki,
Nat. Biotechnol., 1999, 17, 287.
54. H. J. Bohnert and R. G. Jensen, Trends Biotechnol., 1996, 14, 89.
55. P. B. K. Kishor, Z. Hong, G.-H. Miao, C.-A. A. Hu and D. P. S.
Verma, Plant Physiol., 108, 1387.
56. D. Worrall, L. Elias, D. Ashford, M. Smallwood, C. Sidebottom, P.
Lillford, J. Telford, C. Holt and D. Bowles, Science, 1998, 282, 115.
57. N. J. Poole, in Commercialisation of Transgenic Crops: Risk, Benefit
and Trade Considerations, ed. G. D. McLane, P. M. Waterhouse, G.
Evans and M. J. Gibbs, Bureau of Resource Sciences, Canberra,
1997, p. 17.
58. L. Tabe and T. J. V. Higgins, Trends Plant Sci., 1998, 3, 282.
59. L. Molvig, L. M. Tabe, B. O. Eggum, A. E. Moore, S. Craig,
D. Spencer and T. J. V. Higgins, Proc. Natl. Acad. Sci. USA, 1997,
94, 8393.
60. F. Barro, L. Rooke, F. Bekes, R. Gras, A. S. Tatham, R. Fido, P. A.
Lazzeri, P. R. Shewry and P. Barcelo, Nat. Biotechnol., 1997
15, 1295.
61. K. Vasil and O. D. Anderson, Trends Plant Sci., 1997, 2, 292.
62. D. J. Murphy, TIBTech, 1996, 14, 206.
63. U. Sonnewald, M.-R. Hajirezaei, J. Kossman, A. Heyer, R. M.
Trethewey and L. Willmitzer, Nat. Biotechnol., 1997, 15, 794.
64. S. G. Ball, M. H. B. J. van de Wal and R. G. F. Visser, Trends Plant
Sci., 1998, 3, 462.
305Plant Biotechnology
65. S. Smeekens, Nat. Biotechnol., 1998, 16, 822.
66. R. Sevenier, R. D. Hall, I. M. van der Meer, H. J. C. Hakkert,
A. J. van Tunen and A. J. Koops, Nat. Biotechnol., 1998, 16, 843.
67. M. Stitt and U. Sonnewald, Annu. Rev. Plant Physiol. Plant Mol.
Biol., 1995, 46, 341.
68. K. Herbers and U. Sonnewald, TIBTech, 1996, 14, 198.
69. C. Nawrath, Y. Poirier and C. Somerville, Mol. Breeding, 1995
1, 105.
70. J. J. G. Van Soest and J. F. G. Vliegenthart, TIBTech, 1997, 15, 208.
71. C. Bryne, Chem. Ind., 1999, May, 343.
72. C. J. Arntzen, Nat. Biotechnol., 1997, 15, 221.
73. S. W. Ma, D.-L. Zhao, Z.-Q. Yin, R. Mukherjee, B. Singh, H.-Y.
Qin, C. R. Stiller and A. M. Jevnikar, Nat. Med., 1997, 3, 793.
74. K. Dalsgaard, A. Uttenthal, T. D. Jones, F. Xu, A. Merryweather,
W. D. O. Hamilton, J. P. M. Langeveld, R. S. Boshuizen,
S. Kamstrup, G. P. Lomonossoff, C. Porta, C. Vela, J. I. Casal,
R. H. Meloen and P. B. Rodgers, Nat. Biotechnol., 1997, 15, 248.
75. Modelska, B. Dietzschold, N. Sleysh, Z. F. Fu, K. Steplewski, D. C.
Hooper, H. Koprowski and V. Yusibov, Proc. Natl. Acad. Sci.
USA, 1998, 95, 2481.
76. J. K.-C. Ma, B. Y. Hikmal, K. Wycoff, N.-D. Vine, D. Chargeleque,
L. Yu, M. B. Hein and T. Lehmer, Nature, 1998, 4, 601.
77. J. Olson, Farm Ind. News, 1999, 32, 1.
78. E. E. Hood, D. Witcher, S. Maddock, T. Meyer, C. Baszczynski,
M. Bailey, P. Flynn, J. Register, L. Marshall, D. Bond, E. Kulisek,
A. Kusnadi, R. Evangelista, Z. Nikolov, C. Wooge, R. J. Mehigh,
R. Hernan, W. K. Kappel, D. Ritland, C. P. Li and J. A. Howard,
Mol. Breeding, 1997, 3, 291.
79. T. Tzfira, A. Zuker and A. Altman, TIBTech, 1998, 16, 439.
80. R. B. Jorgensen, T. Hanser, T. R. Mikkelsen and H. Ostergaard,
Trends Plant Sci., 1996, 1, 356.
306 Chapter 10
CHAPTER 11
Biotechnology-based Drug Discovery
K. K. JAIN
Jain PharmaBiotech, Blaesiring 7, 4057 Basel, Switzerland
11.1 INTRODUCTION TO DRUG DISCOVERY
11.1.1 Basics of Drug Discovery in the Biopharmaceutical Industry
Historically, pharmaceutical products have been developed primarily
through the random testing of thousands of synthetic compounds and
natural products. The traditional approach to drug discovery is based
on the generation of a hypothesis based on biochemistry and a phar-
macological approach to a disease. Targets are defined on the basis of
this hypothesis and lead discovery is a matter of chance. The classical
drug discovery effort also involves isolating and characterising natural
products with some biological activity. These compounds are then
‘refined’ by redesigning their molecular structure to yield new entities
with higher biological activity and lower toxicity/side-effects. The main
limitation of such a process is that the discovery of natural products
with defined biological activity is essentially a hit-or-miss approach and
therefore lacks a rational basis.
The focus of this chapter is on the description of drug discovery in the
biotechnology era. Genomics, proteomics, metabolomics, monoclonal
antibodies, antisense, RNA interference (RNAi), molecular diagnostics,
biomarkers and nanobiotechnology have a significant impact on the
drug discovery process.
Molecular Biology and Biotechnology, 5th Edition
Edited by John M Walker and Ralph Rapleyr Royal Society of Chemistry 2009
Published by the Royal Society of Chemistry, www.rsc.org
307
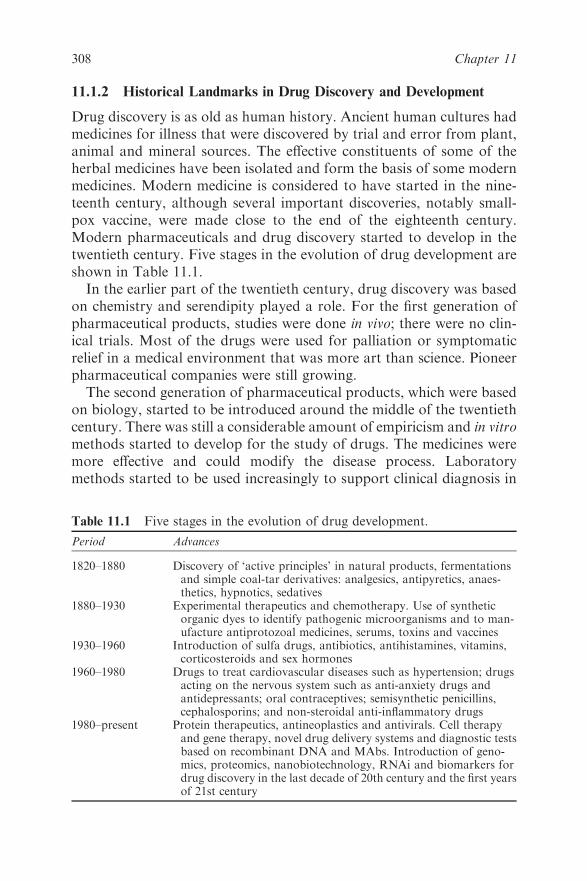
11.1.2 Historical Landmarks in Drug Discovery and Development
Drug discovery is as old as human history. Ancient human cultures had
medicines for illness that were discovered by trial and error from plant,
animal and mineral sources. The effective constituents of some of the
herbal medicines have been isolated and form the basis of some modern
medicines. Modern medicine is considered to have started in the nine-
teenth century, although several important discoveries, notably small-
pox vaccine, were made close to the end of the eighteenth century.
Modern pharmaceuticals and drug discovery started to develop in the
twentieth century. Five stages in the evolution of drug development are
shown in Table 11.1.
In the earlier part of the twentieth century, drug discovery was based
on chemistry and serendipity played a role. For the first generation of
pharmaceutical products, studies were done in vivo; there were no clin-
ical trials. Most of the drugs were used for palliation or symptomatic
relief in a medical environment that was more art than science. Pioneer
pharmaceutical companies were still growing.
The second generation of pharmaceutical products, which were based
on biology, started to be introduced around the middle of the twentieth
century. There was still a considerable amount of empiricism and in vitro
methods started to develop for the study of drugs. The medicines were
more effective and could modify the disease process. Laboratory
methods started to be used increasingly to support clinical diagnosis in
Table 11.1 Five stages in the evolution of drug development.
Period Advances
1820–1880 Discovery of ‘active principles’ in natural products, fermentationsand simple coal-tar derivatives: analgesics, antipyretics, anaes-thetics, hypnotics, sedatives
1880–1930 Experimental therapeutics and chemotherapy. Use of syntheticorganic dyes to identify pathogenic microorganisms and to man-ufacture antiprotozoal medicines, serums, toxins and vaccines
1930–1960 Introduction of sulfa drugs, antibiotics, antihistamines, vitamins,corticosteroids and sex hormones
1960–1980 Drugs to treat cardiovascular diseases such as hypertension; drugsacting on the nervous system such as anti-anxiety drugs andantidepressants; oral contraceptives; semisynthetic penicillins,cephalosporins; and non-steroidal anti-inflammatory drugs
1980–present Protein therapeutics, antineoplastics and antivirals. Cell therapyand gene therapy, novel drug delivery systems and diagnostic testsbased on recombinant DNA and MAbs. Introduction of geno-mics, proteomics, nanobiotechnology, RNAi and biomarkers fordrug discovery in the last decade of 20th century and the first yearsof 21st century
308 Chapter 11

an environment of experience-based medicine, which was still a mixture
of art and science. The last quarter of the century saw the development
of biotechnology.
Towards the end of the twentieth century and in the twenty-first
century, genomics and genetics started to play an important role in drug
development, with a marked increase in the number of biotechnology-
based drugs. Drug discovery activities have accelerated with the use of
high-throughput methods, biochips and robotics. The role of chemistry
is still considered to be important and proteomics is gradually assuming
an important role in drug discovery in the post-genomic era. Bioinfor-
matics and in silico methods are being used for drug discovery. The
clinical environment is evidence-based medicine with the start of evo-
lution of personalised medicines. With all the scientific advances in
medicine, there is still some resurgence of alternative or complementary
medicine and an evaluation of drugs from natural sources within the
pharmaceutical industry.
11.1.3 Current Status of Drug Discovery
The drug discovery process is shown in Figure 11.1. The usual duration
of this process is 5–6 years, which is half of the total development time
(10–12 years) taken from target identification to marketing of a drug.
Traditional screening methods are slow and labour intensive and have
limited the number and chemical diversity of the compounds and targets
Target Identification
5-6
Years
Target Validation
Screen Development
Hit to Lead
Lead Compound Optimization
Figure 11.1 Drug discovery process.
309Biotechnology-based Drug Discovery

that can be tested in a given assay. Even though many thousands of
distinct chemical structures exist, it is not unusual for screening utilising
this approach to be terminated at the end of several years with no lead
compounds identified, having examined only a small fraction of avail-
able compounds. This limitation of speed and scale often restricts both
the quality and quantity of lead compounds available for further testing
and development, thereby hindering drug discovery.
Several ‘hits’ are produced as a result of high-throughput screening
(HTS). The hit-to-lead stage has been added to the drug discovery.
Multiple parameters are optimised in parallel with produce leads with a
balanced profile of biological and physicochemical properties. New
technologies are playing an increasing role in this process. It is desirable
to have multiple series in hit optimisation so that more than one series is
available for lead optimisation.
11.2 NEW BIOTECHNOLOGIES FOR DRUG DISCOVERY
Various biotechnologies that can be applied for improving drug dis-
covery are listed in Table 11.2 and will be described briefly below.
Currently available ‘omics’ technologies for drug discovery include
genomics, proteomics and metabolomics.
11.3 GENOMIC TECHNOLOGIES FOR DRUG DISCOVERY
From the current knowledge of genomics, at least 500 targets are
available for drug therapy. Opportunities provided by genomics include
the potential for developing treatments for 100 of the most important
multifactorial diseases with 500–1000 disease-related genes and 3000–
10 000 new drug targets. Genomic technologies are built on basic tools
of biotechnology. Functional genomics represents a new phase of
Table 11.2 Biotechnologies for improving drug discovery.
Omics technologies:GenomicsProteomicsMetabolomics and metabonomicsMicroarrays and biochipsMonoclonal antibodies (MAbs)AntisenseRNA interference (RNAi)NanobiotechnologyBiomarkersBioinformatics
310 Chapter 11

genome analysis, i.e. function of genes. It is characterised by high-
throughput or large-scale experimental methods combined with statis-
tical and computational analysis of the results. The fundamental strat-
egy in a functional genomics approach is to expand the scope of
biological investigation from studying single genes or proteins to
studying all genes or proteins at once in a systematic fashion.
11.3.1 SNPs in Drug Discovery
The study of single nucleotide polymorphisms (SNPs) is crucial for
characterising molecular targets and can also validate the role of these
targets in disease. SNPs are important in the development of new
pharmaceuticals with impact in the following areas:
� Target identification. Positional cloning looks for disease-suscept-
ibility genes near markers that have an inheritance pattern similar
to that of the disease. SNPs are used as simple genetic markers.
� Target characterisation. The degree of genetic variation within a
target is important because it can alter gene function and influence
drug interaction. Because modern methods of drug discovery
involve high-throughput screening of large chemical libraries pro-
duced by combinatorial chemistry, it is important that the target of
the screen is representative of the majority of the target population.
This is even more important when SNPs affect the amino acid
structure and function of the protein. Although drug targets are
screened at nucleic acid level to determine their degree of genetic
variation, identification of the variants may be inadequate and
bioinformatic support is necessary.
� Target validation. There is an abundance of drug targets available
but many have no clue as to their role in disease. Genetic epide-
miology can be used to show the functional involvement of a par-
ticular drug target in the disease of interest. This approach can also
be used to identify new therapeutic targets for existing drugs.
� Pharmacogenetics. This is the study of how genetic variations affect
drug response and metabolism. Polymorphisms in enzymes that
metabolise drugs are also responsible for unexpected adverse effects
of normal doses of drugs. This information is now used for the
development of personalised medicines.
� Pharmacogenomics. This term implies the use of genetic sequence
and genomics information in patient management to enable ther-
apy decisions to be made. The genetic sequence and genomics
information can be that of the host (normal or diseased) or of the
311Biotechnology-based Drug Discovery
pathogen. Pharmacogenomics will have an impact on all phases
of drug development � from drug discovery to clinical trials.
Pharmacogenomics is an important basis for the development of
personalised medicines.
11.3.2 Gene Expression Profiling
Analysis of gene-expression patterns derived from large expressed
sequence tag (EST) databases has become a valuable tool in the dis-
covery of therapeutic targets and diagnostic markers. Sequence data
derived from a wide variety of cDNA libraries offer a wealth of infor-
mation for identifying genes for pharmaceutical product development.
Collecting, storing, organising, analysing and presenting cDNA
expression data require advanced bioinformatics methods and high-
performance computational equipment. Comparison of expression
patterns from normal and diseased tissues enables inferences about gene
function to be made and medically relevant genes as candidates for
therapeutics research and drug discovery.
11.3.3 Limitations of Genomics for Drug Discovery and
Need for Other Omics
Although useful, DNA sequence analysis alone does not lead efficiently
to new target identification, because one cannot easily infer the functions
of gene products or proteins and protein pathways from a DNA
sequence. It has become obvious that analysing genome sequences alone
will not lead to new therapies for human diseases. Rather, an under-
standing of protein function within the context of complex cellular
networks will be required to facilitate the discovery of novel drug targets
and, subsequently, new therapies directed against them.
Functional genomics and proteomics have provided a huge amount of
new drug targets. High-throughput screening and compound libraries
produced by combinatorial chemistry have increased the number of new
lead compounds. The challenge is to increase the efficiency of testing
lead efficacy and toxicity. The traditional methods of toxicity testing in
laboratory animals using haematological, clinical chemistry and histo-
logical parameters are inadequate to cope with this challenge. Gene and
protein expression studies following treatment with drugs have shown
that it is possible to identify changes in biochemical pathways that are
related to a drug’s efficacy and toxicity and precede tissue changes. The
patterns of these changes can be used as efficacy or toxicity markers in
high-throughput screening assay. Several other omics technologies play
312 Chapter 11
an important role in drug discovery. Notable among these are pro-
teomics and metabolomics.
11.4 ROLE OF PROTEOMICS IN DRUG DISCOVERY
The term ‘proteomics’ indicates PROTEins expressed by a genOME and
is the systematic analysis of protein profiles of tissues. The term ‘pro-
teome’ refers to all proteins produced by a species, much as the genome
is the entire set of genes. Proteomics parallels the related field of geno-
mics. Proteomics is important for drug discovery because many of the
pharmaceutically important regulation systems operate through pro-
teins (i.e., post-translationally). Major drugs act by binding to proteins.
For example a ‘protease inhibitor’ drug is designed to disable the pro-
tease enzyme (which is a protein) that allows a particular virus to
reproduce. A drug with the right shape can latch on to the surface of the
protease protein and keep it from doing its job. If the protease is dis-
abled, the virus cannot reproduce itself, so the damage it can inflict is
limited. The role of proteomics in drug development can be termed
‘pharmacoproteomics’ and is an important component of personalised
medicine.
11.4.1 Proteins as Drug Targets
The majority of drug targets are proteins that are encoded by genes
expressed within tissues affected by a disease. It is estimated that there
are approximately 10 000 different enzymes, more than 2000 different
G-protein-coupled receptors, 200 different ion channels and 100 differ-
ent nuclear hormone receptors encoded in the human genome. These
proteins are key components of the pathways involved in disease and,
therefore, are likely to be a rich source of new drug targets.
Proven drug targets share certain other characteristics, which can only
be identified by understanding their expression levels in cells and cannot
be determined by their gene sequences alone. Drug targets are (1) often
expressed primarily in specific tissues, allowing for selectivity of phar-
macological action and reducing the potential for adverse side-effects
and (2) generally expressed at low abundance in the cells of the relevant
organ. An effective target discovery system would therefore allow the
detection of genes that encode for proteins expressed in specific tissues at
low abundance, thereby permitting the rapid identification of proteins,
which are likely to be targets for therapeutic and diagnostic develop-
ment. Some proteomic technologies that are useful for drug discovery
are described briefly.
313Biotechnology-based Drug Discovery
11.4.2 Protein Expression Mapping by 2D Gel Electrophoresis
2D gel electrophoresis (2DGE) and image analysis may be used for the
quantitative study of global changes in protein expression in tissues, cells
or body fluids. This method has the advantages of direct determination
of protein abundance and detection of post-translational modifications
such as glycosylation or phosphorylation, which result in a shift in
mobility; mass spectrometry may be used for the subsequent char-
acterisation of proteins of interest. Because thousands of proteins are
imaged in one experiment, a picture of the protein profile of the sample
at a given point in time is obtained, allowing comparative proteome
analysis. Protein expression changes may give clues to the role of certain
proteins in disease and some of the identified proteins map to known
genetic loci of a disease.
11.4.3 Liquid Chromatography-based Drug Discovery
Liquid chromatography (LC) shifts the high-resolution separation from
front-end 2DGE to back end LC–mass spectrometry (MS). Proteins are
kept in solution so that a higher percentage of the sample is analysed
using affinity chromatography and having access to the entirely accu-
rately assembled genome of the organism under study. Protein mixture
may be digested to analyse at the peptide level. This high-efficiency
proteomics technology is applied to small-molecule drug discovery.
Instead of separating individual proteins using 2DGE, complex
mixture analysis can start with proteins pooled after partial fractiona-
tion by multi-dimensional LC, which involves serial protein separations
over a variety of chromatographic matrices. The complex mixtures are
treated with trypsin and the resulting peptides are separated by LC and
measured by MS. This approach may be specifically applied to integral
membrane proteins to obtain detailed biochemical information on this
unwieldy class of proteins.
11.4.4 Matrix-assisted Laser Desorption/Ionisation
Mass Spectrometry
Among several proteomic technologies used in drug discovery, matrix-
assisted laser desorption/ionisation (MALDI)-MS and its variants, and
related techniques, play an important role. MALDI time-of-flight (TOF)
MS targets, when uniformly precoated with a thin film of matrix/
nitrocellulose, make the sample preparation straightforward and permit
the enrichment and analysis of proteins at low levels in proteomics
314 Chapter 11
samples. In general, the sensitivity for proteins and peptides can be
enhanced 10–50 times compared with traditional MALDI sample pre-
paration techniques. Tissue imaging mass spectrometry (IMS) by
MALDI and ion trap MS with higher order MS scanning functions have
been used for localisation of dosed drug or metabolite in tissues.
Laser capture microscopy (LCM) is used to obtain related samples from
tissue for analyses by standard MALDI-MS and HPLC-MS. IMS by
MALDI ion trap MS has proved sensitive, specific and highly amenable
to the image analysis of traditional small molecule drug candidates
directly in tissue.1
A novel method for on-tissue identification of proteins in spatially
discrete regions is described using tryptic digestion followed by
MALDI-IMS with MS/MS analysis.2 IMS is first used to reveal the
protein and peptide spatial distribution in a tissue section and then a
serial section is robotically spotted with small volumes of trypsin solu-
tion to carry out in situ protease digestion. After hydrolysis, 2,5-dihy-
droxybenzoic acid matrix solution is applied to the digested spots, with
subsequent analysis by IMS to reveal the spatial distribution of the
various tryptic fragments. Sequence determination of the tryptic frag-
ments is performed using on-tissue MALDI-MS/MS analysis directly
from the individual digest spots. This protocol enables protein identifi-
cation directly from tissue while preserving the spatial integrity of the
tissue sample.
11.4.5 Protein–Protein Interactions
Protein interactions can be monitored in vivo over the course of the cell
cycle, drug treatments or other environmental stimuli. The development
of green fluorescent protein derivatives has provided the opportunity to
study protein–protein interactions in living cells. The structural orga-
nisation of macromolecular protein complexes, which may contain
scores of protein interactions and may be difficult to study in vitro, can
be analysed. Techniques to study protein–protein interactions in living
subjects will allow the study of cellular networks, including signal
transduction pathways, and also the development and optimisation of
pharmaceuticals for modulating protein–protein interactions.
Protein–protein interaction networks are also called ‘interactome’
networks. The interactome is a map of all interactions that take place in
an organism between all proteins, in all cells, all tissues, at all ages and in
response to all possible environmental conditions. The ability to find
links between sets of proteins involved in different genetic disorders
offers a novel approach for more rapidly identifying new candidate
315Biotechnology-based Drug Discovery
genes involved in human diseases. Pharmaceutical investigators use
interaction data to prioritise potential drug targets as these networks
help the companies to weed out proteins that have several interaction,
some of which are irrelevant to the target.
11.4.6 Use of Proteomic Technologies for Important Drug Targets
Protein kinases are encoded by more than 2000 genes and thus con-
stitute the largest single enzyme family in the human genome. Most
cellular processes are regulated by the reversible phosphorylation of
proteins on serine, threonine and tyrosine residues. At least 30% of all
proteins contain covalently bound phosphate. A novel method to
determine if drugs and drug targets are effective in combating disease is
by identifying the key regulatory protein ‘switches’’ (phosphorylation
sites) inside human cells. This allows the identification and character-
isation of changes in the chemical modification of proteins that may
arise in response to drug treatment. It can be used to identify novel
targets in disease, to compare the effects of different drug candidates and
to develop assays that can be used throughout preclinical and clinical
development. Kinomics, omic for kinome (the kinase complement of the
human genome), is a useful tool for identifying protein kinases that play
an important role in disease. It also assists in the drug optimisation
process. Kinomics can be used to understand both the mechanism of
action and the specificity of potential drugs. This knowledge forms a
crucial base from which to develop potent and selective compounds with
minimal side-effects. Protein kinases are important drug targets in
human cancers, inflammation and metabolic diseases.
Proteomic technologies have been used for the study of G-protein
coupled receptors (GPCRs), which are an important class of drug tar-
gets that exist as proteins on the surface membranes of all cells. GPCRs
are a superfamily of proteins accounting for approximately 1% of the
human genome and are associated with a wide range of therapeutic
categories, including asthma, inflammation, obesity, cancer, cardiovas-
cular, metabolic, gastrointestinal and neurological diseases. Purified
multiple GPCRs in a functional form can be used for the identification
of tight binding ligands. There are estimated to be B2000 GPCRs
within the human body with potential availability as drug discovery
targets. GPCRs have historically been valuable drug targets, but to date
there are only approximately 100 well-characterised GPCRs with known
ligands, several of which are currently targets of commercial drugs.
Approximately 60% of all currently available prescription drugs interact
with these receptors.
316 Chapter 11
11.5 METABOLOMIC AND METABONOMIC
TECHNOLOGIES FOR DRUG DISCOVERY
Metabolomics is the study of small molecules and their interactions
within an organism, which is critical to the drug-discovery process. The
importance of metabolomic studies is indicated by the finding that a
large proportion of the B6000 genes present in the genome of Sac-
charomyces cerevisiae and of those sequenced in other organisms,
encode proteins of unknown function. Many of these genes are ‘silent’,
i.e. they show no overt phenotype, in terms of growth rate or other
fluxes, when they are deleted from the genome. How the intracellular
concentrations of metabolites can reveal phenotypes for proteins active
in metabolic regulation has been demonstrated. Quantification of the
change of several metabolite concentrations relative to the concentration
change of one selected metabolite can reveal the site of action, in the
metabolic network, of a silent gene. In the same way, comprehensive
analyses of metabolite concentrations in mutants, providing ‘metabolic
snapshots’, can reveal functions when snapshots from strains deleted for
unstudied genes are compared to those deleted for known genes.
An approach combining proteomics with metabolomics creates a new
platform for identifying and validating metabolite biomarkers impor-
tant to the development of safe and effective drugs. The unique com-
bination of gene expression profiling (determining the level of activity of
genes in an organism at a specific time), metabolic profiling (determining
the identity and quantities of chemicals in an organism at a specific time)
and phenotypic profiling (measuring the physical and chemical char-
acteristics of an organism at a specific time), with data from all systems
and analysed by bioinformatics, creates a new paradigm for indus-
trialising functional genomics.
Metabonomics is a systems approach to investigate the metabolic
consequences of drug exposure, disease processes and genetic mod-
ification whereas metabolomics is the measurement of metabolite con-
centrations in cell systems. It is important to direct the timing of
proteomic and genomic studies to maximise the probability of observing
useful biological transitions that are indicative of function. Although a
number of spectroscopic methods have been used, NMR spectroscopy is
considered to be one of the most powerful methods for generating
multivariate metabolic data. An NMR-based systems approach is used
for drug toxicity screening to aid lead compound selection. Metabolic
phenotyping (metabotyping) is also used for investigating the metabolic
effects of genetic modification and modelling of human disease pro-
cesses. One deliberate gene knockout can produce several metabolic
317Biotechnology-based Drug Discovery
disturbances. Metabonomics can thus be used as a functional genomics
tool with applications in various stages of drug discovery and
development.
11.6 ROLE OF NANOBIOTECHNOLOGY
IN DRUG DISCOVERY
Nanotechnologies � nanoparticles and various nanodevices such as
nanobiosensors and nanobiochips � have the potential to improve drug
discovery. Microfluidics has already proven useful for drug discovery
and, through further miniaturisation, nanotechnology will improve the
ability to fabricate massive arrays in small spaces using nanofluidics.
Nanoparticles such as gold nanoparticles and quantum dots have
attracted considerable attention recently with their unique properties for
potential use in drug discovery.3
11.6.1 Nanobiotechnology for Target Validation
Multivalent attachment of small molecules to nanoparticles can increase
specific binding affinity and reveal new biological properties of such
nanomaterial. Multivalent drug design has yielded antiviral and anti-
inflammatory agents several orders of magnitude more potent than
monovalent agents. Parallel synthesis of a library has been described,
which is comprised of nanoparticles decorated with different synthetic
small molecules.4 Screening of this library against different cell lines led
to the discovery of a series of nanoparticles with high specificity for
endothelial cells, activated human macrophages or pancreatic cancer
cells. This multivalent approach could facilitate the development of
functional nanomaterials for applications such as differentiating cell
lines, detecting distinct cellular states and targeting specific cell types. It
has potential applications in high-throughput drug discovery, target
validation, diagnostics and human therapeutics.
11.6.2 Nanotechnology-based Drug Design at Cell Level
To create drugs capable of targeting human diseases, one must first
decode exactly how a cell or a group of cells communicates with other
cells and reacts to a broad spectrum of complex biomolecules sur-
rounding it. But even the most sophisticated tools currently used for
studying cell communications suffer from significant deficiencies and
typically can only detect a narrowly selected group of small molecules
318 Chapter 11
or, for a more sophisticated analysis, the cells must be destroyed for
sample preparation. A nanoscale probe, the scanning mass spectrometry
(SMS) probe, can capture both the biochemical makeup and topo-
graphy of complex biological objects. The SMS probe can help map all
those complex and intricate cellular communication pathways by
probing cell activities in the natural cellular environment, which might
lead to better disease diagnosis and drug design on the cellular level.
11.6.3 Nanomaterials as Drug Candidates
In addition to the use of nanobiotechnology for drug discovery, some
drugs are being developed from nanomaterials. Well-known examples of
these are dendrimers, fullerenes and nanobodies. Specialised chemistry
techniques allow precise control over the physical and chemical prop-
erties of the dendrimers. Polyvalent dendrimers interact simultaneously
with multiple drug targets. They can be developed into novel targeted
cancer therapeutics. Polymer–protein and polymer–drug conjugates can
be developed as anticancer drugs. Dendrimer conjugation with low
molecular weight drugs has been of increasing interest recently for
improving pharmacokinetics, targeting drugs to specific sites and facil-
itating cellular uptake. Opportunities for increasing the performance of
relatively large therapeutic proteins such as streptokinase (SK) using
dendrimers have been explored in one study.5 Using the active ester
method, a series of streptokinase–polyamidoamine (PAMAM) G3.5
conjugates were synthesised with varying amounts of dendrimer-
to-protein molar ratios. All of the SK conjugates displayed significantly
improved stability in phosphate buffer solution, compared with free
SK. The high coupling reaction efficiencies and the resulting high
enzymatic activity retention achieved in this study could lead to a
desirable approach for modifying many bioactive macromolecules with
dendrimers.
A key attribute of the fullerene molecules such as C60 is their
numerous points of attachment, allowing for precise grafting of active
chemical groups in 3D orientations. This attribute, the hallmark of
rational drug design, allows for positional control in matching fullerene
compounds to biological targets. In concert with other attributes,
namely the size of the fullerene molecules, their redox potential and its
relative inertness in biological systems, it is possible to tailor requisite
pharmacokinetic characteristics to fullerene-based compounds and
optimise their therapeutic effect. A number of water-soluble C60 deri-
vatives have been suggested for various medical applications. These
applications include neuroprotective agents, HIV-1 protease inhibitors,
319Biotechnology-based Drug Discovery
bone-disorder drugs, transfection vectors, X-ray contrast agents, pho-
todynamic therapy agents and a C60–paclitaxel chemotherapeutic.
Nanobodies, derived from naturally occurring single-chain anti-
bodies, are the smallest fragments of naturally occurring heavy-chain
antibodies that have evolved to be fully functional in the absence of a
light chain. Like conventional antibodies, nanobodies show high target
specificity and low inherent toxicity; however, like small-molecule drugs,
they can inhibit enzymes and can access receptor clefts. Nanobodies can
address therapeutic targets not easily recognised by conventional anti-
bodies such as active sites of enzymes.
11.7 ROLE OF BIOMARKERS IN DRUG DISCOVERY
A biomarker is a characteristic that can be objectively measured and
evaluated as an indicator of a physiological and also a pathological
process or pharmacological response to a therapeutic intervention. Any
specific molecular alteration of a cell on DNA, RNA, metabolite or
protein level can be referred to as a molecular biomarker.
Among the current applications of biomarkers, those for drug dis-
covery and development are one of the most important types. Bio-
markers can be used to predict and confirm target binding, to determine
mechanism of action of a drug, pharmacokinetics and toxicity. Their
role continues into the drug development stage to determine treatment
efficacy in clinical trials. It is worthwhile to develop biomarkers for
exploring the pharmacology of new molecules and to develop potential
biomarkers of efficacy. A molecule that does not have the intended
pharmacological effect is unlikely to have the desired efficacy and its
development should be terminated. Discovery efforts would then be
directed at understanding the reasons for the lack of pharmacological
effect and finding improved molecules. For those molecules that have
the intended pharmacological effect but then fail to show efficacy, it is
possible to say with confidence that the molecular target is ineffective
and that discovery efforts should be directed to other targets. Such an
approach will increase the overall success rates of the candidate mole-
cules delivered into clinical development.6
11.8 SCREENING IN DRUG DISCOVERY
Screening in drug discovery is conducted in a streamline assay format
aimed at hit identification. Screening may be low throughput (10 000–
50 000 assay points), medium throughput (50 000–100 000 data points)
or high throughput (100 000–500 000+ data points). Ideal screening
320 Chapter 11
procedure should be cost-effective and robust under varying conditions
such as chemical types. Two well-established strategies, diversity-based
and focused screening, have been compared and reviewed. Focused
screening is more widely used and the most popular of these methods
involves the use of 3D information on targets where crystal structure is
available. Diversity screening means testing all the molecules that could
be considered drug candidates and the number could go up to one
million samples. This approach is based on a commitment to increase in
capacity by automation, miniaturisation and throughput with reduction
of cost.
11.8.1 Cell-based Screening System
Unlike traditional methods in the drug discovery process, the cell-based
method provides deep biological information (time, space and activity)
about a drug candidate’s physiological impact on specific cellular targets
within living cells. This approach provides significant insight into the
potential efficacy and toxicity of a drug candidate on cells before initi-
ating animal testing and human clinical trials, thereby saving substantial
time and expense.
Cell-based assays have the advantage that they can be miniaturised to
increase screening throughput and reduce costs. Functional cell-based
assays would be useful for screening of modulators of ion channels.
Because the binding sites may be unknown, formatting of these assays is
difficult with the use of traditional biochemical or ligand-displacement
methods. New optical assays employ fluorescent or optical readouts and
permit cell-based assays for most targets, including ion channels. Fur-
ther, genetically encoded probes offer the possibility of biosensors for
intracellular biochemistry, specifically localised targets and protein–
protein interactions.
11.8.2 Receptor Targets: Human versus Animal Tissues
In the traditional approach to drug discovery, compounds are screened
against animal tissues containing many different types of receptors.
Companies such as Lundbeck Research USA follow approaches invol-
ving use of human tissues. The advantages of using human tissues are:
1. By having an isolated receptor as a target, chemists are better
able to design compounds that interact with only the target of
interest and not with other receptors that may be responsible for
side-effects.
321Biotechnology-based Drug Discovery

2. Using human receptors as drug design targets will substantially
reduce the number of problems that often arise during the drug
development process as a result of differences in a compound’s
activity in humans compared with its activity in animal models.
3. Use of human tissues may be more cost-effective than traditional
drug discovery because one can eliminate or redesign compounds
that react poorly with human receptor targets prior to initiating the
costly activities related to preclinical testing and clinical trials.
4. A compound targeted against specific receptor in human tissues is
better validated for entry into clinical development.
11.8.3 Tissue Screening
Testing directly in human tissue rather than in animal models or yeast
allows drug development teams to obtain vital information about what
their gene of interest is doing in a human system. Because animal models
are often not predictive of how drugs will behave in humans, obtaining
information directly from human tissues is a critical step in choosing one
target from many candidates. Even after the drug development process
has begun, determining where a particular gene is expressed in other,
perhaps unexpected, sites within the body may assist researchers in the
design and interpretation of preclinical or clinical studies.
11.9 TARGET VALIDATION TECHNOLOGIES
Once a gene has been identified as a potential therapeutic target, its
relevance to a disease process and its suitability as a target should be
validated before starting the costly procedure of drug discovery. Target
validation involves manipulating the target and confirming that the
resulting effect is consistent with purported role. In practice, this is not
easy because an infinite number of genes, proteins and other molecules
interact with each other in signalling pathways to direct cell function.
Finding a drug target that safely regulates disease without affecting
normal function has proved very challenging. Various methods to
achieve this are antisense and RNAi (vector-mediated gene inactivation
and transient gene inactivation), proteomics, gene expression arrays and
combinatorial biology approaches.
11.9.1 Animal Models for Genomics-based Target Validation Methods
Animal models of human disease are important for understanding the
disease mechanism and for the development and evaluation of new
322 Chapter 11
therapies. Some animal models are available where a genetic defect
occurs spontaneously. Animal models are invaluable for functional
genomic studies. Spontaneously occurring genetic defects in animals are
inadequate for serving as models of human disease and thus the need for
induced mutations. Mutations can be established in the animal genome
by one of two approaches: non-homologous recombinations (trans-
genic) or homologous recombination (knockout, null mutations).
11.9.2 Role of Knockout Mice in Drug Discovery
Most drugs act as inhibitors of their targets. Inactivating a gene in a
knockout mouse can mimic the effect of the target’s inhibitor. Mouse
functional genomics is similar to that in humans. Thus the knockout
mouse defines a drug target and its underlying physiology, permitting an
insight into the disease, its diagnosis and treatment. For example, p53
gene knockouts have been used extensively to investigate tumorigenesis.
The knockout mouse is becoming an invaluable addition to functional
genomics-driven drug discovery. There are, however, some reservations
about the value of mouse genetics in functional genomics. There are
some mutagenesis experiments that result in no phenotype, which may
be due to redundancies within the mouse genome or perhaps due to
takeover of the function of missing members in certain tissues. This,
however, occurs infrequently. If we believe the oft-quoted statement that
‘the first company to show biological relevance in an animal model wins’
in genomic drug development, there is little doubt that the mouse will
play an important part in this venture.
11.10 ANTISENSE FOR DRUG DISCOVERY
Antisense molecules are synthetic segments of DNA or RNA, designed
to mirror specific mRNA sequences and block protein production. The
use of antisense drugs to block abnormal disease-related proteins is
referred to as antisense therapeutics. Synthetic short segments of DNA
or RNA are referred to as oligonucleotides. The literal meaning of this
word is a polymer made of a few nucleotides. Naturally occurring RNA
or DNA oligonucleotides may or may not have antisense properties.
Antisense oligonucleotides are synthetic pieces of DNA (at least 15
nucleotides in length) that can hybridise to sequences in the RNA target
by Watson–Crick or Hoogstein base pairing. An alternative antisense
approach is the use of ribozymes that catalyse RNA cleavage and inhibit
the translation of RNA into protein. Peptide nucleic acids (PNAs),
which are DNA-like molecules, are potential antisense and antigene
323Biotechnology-based Drug Discovery
agents. Aptamers are synthetic chains of nucleotides that bind directly to
target proteins, inhibiting their activity and are considered to be anti-
sense compounds. A high-affinity DNA analogue, locked nucleic acid
(LNA), confers several desired properties to antisense agents. LNA/
DNA copolymers exhibit potent antisense activity on assay systems.
11.10.1 Antisense Oligonucleotides for Drug Target Validation
Antisense technology uses genetic sequence information to design
rapidly inhibitors of any gene target. Because of their exquisite specifi-
city, antisense oligonucleotides can inhibit the selected gene only,
without an impact on other closely related genes. As a result, antisense
inhibitors allow the identification of function of that single gene target
more precisely than any other method. Several companies have inte-
grated antisense technologies in functional genomics.
DNA microarrays have been used to evaluate thousands of genes
simultaneously. Target mRNA and protein expression can be inhibited
using antisense oligonucleotides to facilitate this process and determine
genetic pathways. Antisense technology is considered to be a viable
option for high-throughput determination of gene function and drug
target validation.
Peptide nucleic acid (PNA) inhibits gene expression. If two different
bacterial RNAs are targeted with a complementary PNA and a ran-
domised control sequence, the complementary PNA inhibits its intended
target, whereas the other does not. This provides an opportunity for
novel antibiotic discovery in addition to target validation using anti-
sense PNA. For validation of bacterial targets, the main advantages of
PNA is it can be used for any bacterial species and the level of gene
inhibition can be regulated. Genetic knockout is not applicable to all
bacterial species and gene expression is an all-or-none phenomenon
which cannot be regulated. Antisense PNA has the limitation that it
cannot knockout 100% of the target whereas genetic knockout can do
so. However, reduced levels of target activity mimic the therapeutic
situation more realistically. Both techniques are synergistic and useful.
In conclusion, antisense PNA technology makes good sense for appli-
cation in antibiotic target validation.
11.10.2 Aptamers
Aptamers (derived from the Latin word aptus¼ fitting) are single-
stranded DNA or RNA oligomers, which can bind to a given ligand
with high affinity and specificity due to their particular 3D structure and
324 Chapter 11

thereby antagonise the biological function of the ligand. Aptamers are
considered to be antisense compounds. The technology builds on the
ability of aptamers to bind tenaciously to proteins and have been used to
identify protein signatures. Streptavidin aptamers (streptavidin-binding
RNA ligands) are also potentially powerful tools for the study of RNAs
or ribonucleoproteins as a means for rapid detection, immobilisation
and purification. Recent developments demonstrate that aptamers are
valuable tools for diagnostics, purification processes, target validation,
drug discovery and therapeutic.
Aptamer expression libraries do not depend on information from
genome sequence. These can be used to find peptides with a desired
biological activity. This can be caused by the expressed peptide acti-
vating or inhibiting a cellular factor. For stable expression of peptides in
mammalian cells, libraries are constructed that express aptamers in the
context of protease-resistant scaffold structures. A limitation of this
approach is that highly complex mixtures of aptamers are required to
identify active aptamers in any pathway. In addition, it can be cum-
bersome to identify the cellular factor that is affected by the biologically
active peptide.
11.10.3 RNA as a Drug Target
RNA has a structural complexity rivalling that of proteins and thus
provides an opportunity as a target for small-molecule drugs. Several
steps are required to find and exploit RNAs as drug targets. Because all
proteins are synthesised using RNA template, they can be inhibited by
preventing the translation of mRNA. Advantages of targeting RNA are:
� Drugs that bind RNA can produce more selective action than those
that bind proteins. For example, a drug can bind to a region of
RNA which is relevant to the target tissue without affecting RNA
in other tissues.
� Proteins are difficult to isolate or purify whereas RNA is easier to
synthesise and use in assays.
� RNA can be easily synthesised in large quantities and is not
extensively modified in vivo, whereas large-scale production of
proteins is still limited.
11.10.4 Ribozymes
Ribozymes are enzymes comprised of RNA which can act both as a
catalyst and as a genetic molecule. In Nature, ribozymes catalyse RNA
325Biotechnology-based Drug Discovery
cleavage and RNA splicing reactions and are sometimes called ‘catalytic
RNAs’. Ribozymes are being increasingly used for the sequence-
specific inhibition of gene expression by the cleavage of mRNAs
encoding proteins of interest. The possibility of designing ribozymes
to cleave any specific target RNA has rendered them valuable tools
in both basic research and therapeutic applications. In the thera-
peutics area, they have been exploited to target viral RNAs in
infectious diseases, dominant oncogenes in cancers and specific somatic
mutations in genetic disorders. More recently, ribozymes have been used
for transgenic animal research, gene target validation and pathway
elucidation. For therapeutic purposes, a ribozyme can be considered to
be a chimeric RNA molecule consisting of two stretches of antisense
RNA flanking a nucleolytic motif. The antisense RNA component,
referred to as the complementary flanking regions, provides target
selectivity.
Unlike traditional pharmaceuticals, ribozymes disrupt the flow of
genetic information rather than inhibit protein function. The therapeutic
potential of ribozymes by targeting distinct mRNAs is tremendous and
is a novel approach to curing disease. Diseases which result from
undesirable expression of RNA, such as neoplastic disorders and viral
infections, should be particularly amenable to this therapeutic approach.
Use in genetic disorders is also being explored.
11.11 RNAI FOR DRUG DISCOVERY
RNA interference (RNAi) is a cellular mechanism to regulate the
expression of genes and the replication of viruses. RNAi or gene silen-
cing involves the use of a double-stranded RNA (dsRNA). Once in the
cell, the dsRNAs are processed into short, 21–23 nucleotide dsRNAs
termed small interfering RNAs (siRNAs) that are used in a sequence-
specific manner to recognize and destroy complementary RNAs. There
are several classes of naturally occurring small RNA species, including
siRNAs, microRNAs (miRNAs) and repeat-associated siRNAs
(rasiRNAs). The RNAi pathway has been exploited in simpler organ-
isms to evaluate gene function by introducing dsRNAs that are specific
to the targeted gene.
RNAi technology is being evaluated not only as an extremely pow-
erful instrument for functional genomic analyses, but also as a poten-
tially useful method to develop highly specific dsRNA-based gene-
silencing therapeutics. RNAi is an important method for analysing gene
function and identifying new drug targets that uses double-stranded
326 Chapter 11
RNA to knock down or silence specific genes. The challenge has been to
select reliably an siRNA segment that can efficiently silence the gene
without triggering unwanted effects. One solution is to use algorithms to
select highly functional siRNA sequences and then pool the best
sequences for guaranteed gene knockdown. RNAi technology could
considerably reduce the time needed for target validation and overall
drug development, accelerating the drug discovery process. RNAi
screening can identify high-value drugs targets such as kinases involved
in cell proliferation.
11.11.1 Use of siRNA Libraries to Identify Genes
as Therapeutic Targets
The ability of RNAi to provide relatively easy ablation of gene
expression has opened up the possibility of using collections of siRNAs
to analyse the significance of hundreds or thousands of different genes
whose expression is known to be upregulated in a disease, given an
appropriate tissue culture model of that disease. Perhaps more impor-
tant still is the possibility of using genome-wide collections of siRNAs,
whether synthetic or in viral vectors, as screening tools. The libraries of
RNAi reagents can be used in one of two ways.
One is in a high-throughput manner, in which each gene in the gen-
ome is knocked down one at a time and the cells or organism scored for
a desired outcome, e.g. death of a cultured cancer cell but not a normal
cell. Owing to the very large numbers of assays needed to look at the
involvement of all genes in the human genome, this approach is very
labour intensive.
The other approach is to use large pools of RNAi viral vectors
and apply a selective pressure that only cells with the desired
change in behaviour can survive. The genes knocked down in the
surviving cells can then be identified by sequencing the RNAi vectors
that they carry. This method is being used to investigate genes
involved in neurodegenerative diseases, diabetes and cancer. Both
approaches show considerable promise in identifying novel genes that
may make important therapeutic targets for inhibition either by con-
ventional drug discovery methods or, more controversially, by RNAi
itself.
Sets of siRNAs focused on a specific gene class (siRNA libraries) have
the capacity to increase greatly the pace of pathway analysis and func-
tional genomics. RNAi-based functional chemogenomics has been
integrated into drug discovery programs.
327Biotechnology-based Drug Discovery

11.11.2 RNAi as a Tool for Assay Development
RNAi can be a useful tool for assay development, hit selection and
specificity testing. RNAi can be used as a positive control to calibrate the
assay readout based on the effects of known levels of mRNA or protein
knockdown. Effects of compounds can then be tested against the known
inhibitory effects of RNAi reagents. Selectivity of certain RNAi reagents
can be used to advantage in assay development. By using RNAi reagents
with known specificity for individual mRNA isoforms, it should be
possible to predict the effects for compounds with similar specificity.
11.11.3 Challenges of Drug Discovery with RNAi
The advantages of cell-based RNAi screens over small-molecule
screening for target identification include the fact that most cell types are
amenable to RNAi and it is relatively easy to knock down any gene of
interest. So far, every gene tested has been susceptible to RNAi. How-
ever, one of the big issues is how to make siRNAs ‘druggable’. Some of
the challenges are:
� To ensure that the candidate siRNA is appropriately stabilised in a
‘druggable’ formulation or by chemical modifications. Stability of
the RNA towards exo- and endonucleases can be resolved by
appropriate chemical modifications.
� Safely and successfully delivering siRNA in an acceptable and
effective manner.
� Scaling up siRNA synthesis in the near term and, ultimately,
manufacturing reliably and effectively.
� Cell-based RNAi assays are particularly prone to edge effects because
the cells in the outer wells of the plates grow at a different rate than
the cells in the inner wells. One should ignore the outer wells.
� There are problems with the ‘penetrance’ of some RNAi screens, in
which the level of GFP in the cells is heterogeneous, making it
difficult to interpret. Actually, the expression levels of several pro-
teins vary significantly within cells grown in culture. Therefore, the
problem is not heterogeneity of the siRNA knockdown, but het-
erogeneity of protein expression, and is an artefact of the cell cul-
ture. Analysis of the data can be improved by looking at single cells
rather than entire wells.
Once these issues have been resolved, there is potential for rapid early-
stage drug development as RNAi-based therapy development relies
328 Chapter 11

predominantly on documented gene sequence data and leverages a
natural process.
11.11.4 Role of MicroRNA in Drug Discovery
MicroRNAs (miRNAs), small and mostly non-coding RNA gene pro-
ducts, are molecules derived from larger segments of ‘precursor’ RNA
that are found in all diverse multicellular organisms. miRNAs are 21–25
nucleotide transcripts that repress gene function through interactions
with target mRNAs. miRNAs appear to regulate at least one-third of all
gene expression and are also likely play significant roles in the mani-
festation of many disease states, including cancer and many metabolic
and infectious diseases. Thus they represent a new class of drug targets
for the pharmaceutical industry.
Investigators are seeking miRNA targets and functions with tools
ranging from traditional genetics to computer-based genome scanning.
Application to the Drosophila melanogaster and Anopheles gambiae
genomes identifies several hundred target genes potentially regulated by
one or more known miRNAs. These potential targets are rich in genes
that are expressed at specific developmental stages and that are involved
in cell fate specification, morphogenesis and the coordination of devel-
opmental processes, in addition to genes that are active in the mature
nervous system. miRNAs can be used for rapid target gene identification
and target validation. miRNAs and the genes they regulate are candi-
dates for the development of new therapies. Several methods have been
developed for computational prediction of miRNA targets. Online
resources provide researchers with useful tools and data for assessing the
impact of miRNAs on the gene or biological process of interest.7
11.12 BIOCHIPS AND MICROARRAYS
FOR DRUG DISCOVERY
Biochip is a broad term indicating the use of microchip technology in
molecular biology and can be defined as arrays of selected biomolecules
immobilised on a surface. DNA microarray is a rapid method of
sequencing and analysing genes. An array is an orderly arrangement of
samples. The sample spot sizes in microarray are usually less than
200mm in diameter. It is comprised of DNA probes formatted on a
microscale (biochips) plus the instruments needed to handle samples
(automated robotics), read the reporter molecules (scanners) and ana-
lyse the data (bioinformatic tools).
329Biotechnology-based Drug Discovery
11.12.1 Finding Lead Compounds
With an emphasis on functional genomics rather than sequencing, drug
discovery programmes are using custom chips to find lead compounds. It
has already been shown that it is possible to treat cells with compounds
and compare the resulting patterns of gene expression with patterns
previously obtained when treating cells in known ways, thereby identi-
fying which proteins or targets the compound is altering. Such in vitro
target identification should greatly improve the inefficient conventional
methods of developing drugs. Because animal testing of compounds is
expensive, time consuming and has other negative aspects, DNA
microarrays are likely to improve the efficiency of drug discovery by
supplementing the information obtained by traditional animal testing.
11.12.2 High-throughput cDNA Microarrays
High-throughput gene expression analysis is playing an important part in
the drug discovery process in a genomic-oriented atmosphere. This
requires an ability to survey and compare rapidly gene expression levels
between reference and test samples. In this setting, microarray technol-
ogy is exploiting collections of known sequences to pinpoint drug targets.
Assay miniaturisation and microfluidics have shown promise in high-
throughput screening. Microfluidic lab-on-a-chip technology has been
widely used to provide small volumes and fluid connections and could
eventually outperform conventionally used robotic fluid handling.8
11.12.3 Use of Gene Expression Data to Find New Drug Targets
Comprehensive gene expression analysis data and powerful computa-
tional methods coupled with appropriate genetically modified organisms
can be used to decipher the function of previously uncharacterised genes.
Comprehensive gene expression profiles of cells have been used to gen-
erate databases with a wide variety of phenotypes and following different
chemical treatments through the accurate and systematic analysis of gene
expression en masse. Such compendia of gene expression profiles were
used as a pattern matching tool to identify novel gene functions and to
understand the biochemical basis of drug action. This approach can be
applied for drug discovery and development. Gene expression data
highlight meaningful differences between normal and disease-related
genes and document the effects of drugs on gene function.
Gene expression analysis is the first new technology to be applied for
many steps in the drug development process. Microarrays are being used
330 Chapter 11
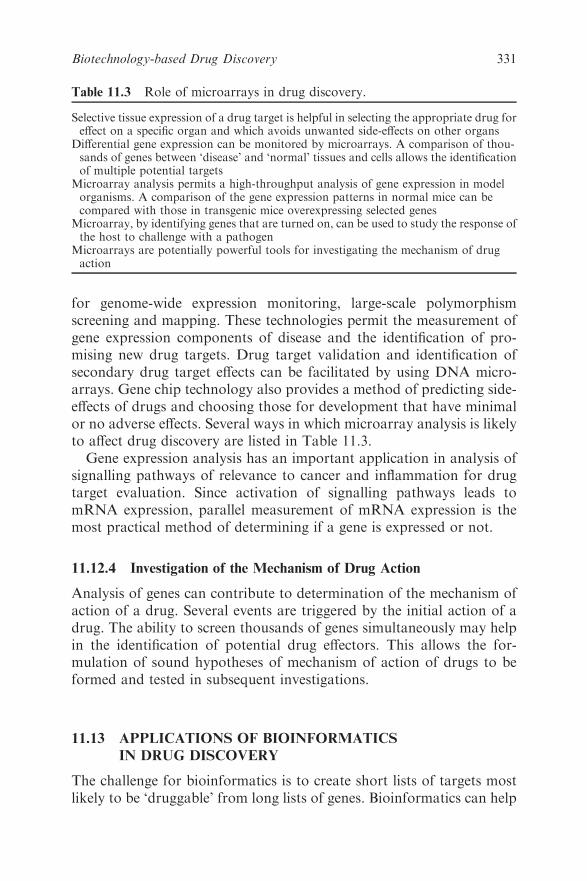
for genome-wide expression monitoring, large-scale polymorphism
screening and mapping. These technologies permit the measurement of
gene expression components of disease and the identification of pro-
mising new drug targets. Drug target validation and identification of
secondary drug target effects can be facilitated by using DNA micro-
arrays. Gene chip technology also provides a method of predicting side-
effects of drugs and choosing those for development that have minimal
or no adverse effects. Several ways in which microarray analysis is likely
to affect drug discovery are listed in Table 11.3.
Gene expression analysis has an important application in analysis of
signalling pathways of relevance to cancer and inflammation for drug
target evaluation. Since activation of signalling pathways leads to
mRNA expression, parallel measurement of mRNA expression is the
most practical method of determining if a gene is expressed or not.
11.12.4 Investigation of the Mechanism of Drug Action
Analysis of genes can contribute to determination of the mechanism of
action of a drug. Several events are triggered by the initial action of a
drug. The ability to screen thousands of genes simultaneously may help
in the identification of potential drug effectors. This allows the for-
mulation of sound hypotheses of mechanism of action of drugs to be
formed and tested in subsequent investigations.
11.13 APPLICATIONS OF BIOINFORMATICS
IN DRUG DISCOVERY
The challenge for bioinformatics is to create short lists of targets most
likely to be ‘druggable’ from long lists of genes. Bioinformatics can help
Table 11.3 Role of microarrays in drug discovery.
Selective tissue expression of a drug target is helpful in selecting the appropriate drug foreffect on a specific organ and which avoids unwanted side-effects on other organs
Differential gene expression can be monitored by microarrays. A comparison of thou-sands of genes between ‘disease’ and ‘normal’ tissues and cells allows the identificationof multiple potential targets
Microarray analysis permits a high-throughput analysis of gene expression in modelorganisms. A comparison of the gene expression patterns in normal mice can becompared with those in transgenic mice overexpressing selected genes
Microarray, by identifying genes that are turned on, can be used to study the response ofthe host to challenge with a pathogen
Microarrays are potentially powerful tools for investigating the mechanism of drugaction
331Biotechnology-based Drug Discovery
with three aspects of target selection:
1. classification of protein families;
2. an understanding of the biochemical and cellular behaviour of the
targets;
3. the development of targets involving predictions on detoxification,
stratification of patient populations and other gene-based variations.
The term ‘in silico biology’ is used for conducting biology before
setting foot in the laboratory for traditional ‘wet’ biology. Bioinfor-
matics has made this possible but it should not be misunderstood as a
replacement for ‘wet’ biology. Using simple point-and-click commands,
researchers can quickly perform a variety of biological analyses in silico.
The detection of similarities between amino acid sequences is funda-
mental to pharmaceutical research in silico. Conventional techniques
can only detect relationships between sequences when at least 25% of
their residues match.
11.13.1 Combination of In Silico and In vitro Studies
Information obtained in silico combined with information provided by
bacteria growing on Petri dishes may lead to novel drug targets and new
insights into the nature of conserved and essential genes in organisms. It
is recommended that, apart from prediction of the gene function, it is
worthwhile to get as much information out of the computer whenever
drug design is potentially involved. This narrows the range of necessary
experiments and saves time and money.
Metabolic instability is a common limiting factor in obtaining
acceptable ADME early in the drug discovery process. Metabolite
identification is helpful but early access to information is limited. A high
metabolic clearance may raise the question of where the drug is being
metabolised. Early identification of the metabolite and structure–
metabolism relationship may facilitate early discovery decisions.
Bioinformatic support in this situation is valuable. The increasing
volume and complexity of biological and chemical data require the use
of bioinformatic systems to extract knowledge relevant to decision
making for the drug discovery process. The largest and most important
category of information is genomic and proteomic databases with fur-
ther studies in gene/protein and disease associations and population
genetics. Databases can now communicate with each other over the
Internet. The daunting task of navigating through the massive amount
of data requires simple and integrated tools to generate innovative but
332 Chapter 11
meaningful information for drug discovery. The bioinformatic tools
should be able to cope with more than 100 drug discovery approaches
that are now available.
11.14 ROLE OF MODEL ORGANISMS IN DRUG DISCOVERY
Simple and easily accessible organisms can be used for probing gene
function because of the conservation of gene function and sequence
between widely divergent species. Commonly used organisms include
the mouse, chicken, frog, zebra fish, nematode worm (C. elegans) and
unicellular yeast (S. cerevisiae). Particularly useful are C. elegans and S.
cerevisiae because their genomes have been completely sequenced. The
mouse has the advantages that it is a mammal, some genetics is known,
transgenic knockouts can be made and some genomic data are already
available. The disadvantages are that it is costly and the generation time
is long. Evidence for the usefulness of model organisms in functional
genomics comes from search of known human disease genes in model
organisms and the finding that majority of known disease genes have
counterparts in lower species. This common origin is reflected not only
in the high degree of conservation of genes between organisms but also
in the role of genes in signalling networks. In many cases, the same
proteins interacting in the same manner are involved in analogous
processes in different species. Comparative genomics enables tests to be
performed quickly in organisms with simple genomes such as the fruit fly
or algae to predict and guide the analysis of gene function in organisms
with complex genomes such as humans.
The ease with which genes can be underexpressed or overexpressed in
these model organisms enables studies of gene function to be performed
in a short time. Because the early developmental stages of model
organisms are easily accessible, it is possible to examine gene expression
during embryogenesis to obtain clues to function. Functional homology
can be tested in species such as Drosophila that are amenable to genetics.
It is important to identify all components of a genetic pathway where a
particular gene functions. This knowledge is important if the disease
happens to be due to a mutation in a gene that cannot be corrected and
it becomes necessary to activate or inactivate the genetic pathway
downstream of the mutant gene as a strategy for treatment.
Multicellular organisms, such as C. elegans, offer numerous biological
advantages in programmes such as drug discovery, toxicology and basic
research because of its remarkable similarity to the human genome.
Over 70% ofB20 000 genes in C. elegans, are also found in humans and
70% of the 300 most important human disease genes have homologues
333Biotechnology-based Drug Discovery
with that of C. elegans. More is known about the biochemistry and
genetics of C. elegans than any other animal. Since much of the genetic
makeup of C. elegans also occurs in humans, laboratories in pharma-
ceutical companies and universities worldwide are modelling human
diseases in these organisms. Their goals are to find new drug targets and
to screen drug compounds in vivo using these biological systems. This
information has been used to manipulate the nematode genes to create a
‘human disease model’. Disease-model C. elegans develops abnormally
and has an abnormal size for its stage of development. These model
organisms can be exposed to drugs and changes can be monitored.
11.15 CHEMOGENOMIC APPROACH TO DRUG DISCOVERY
Chemogenomics is the interdisciplinary approach that attempts to
derive predictive links between the chemical structures of bioactive
molecules and the receptors with which these molecules interact.9 Che-
mogenomics thus unites medicinal chemistry with molecular biology
and uses low-resolution sequence homology to identify genomic targets
of interest. Insights from chemogenomics are used for the rational
compilation of screening sets and for the rational design and synthesis of
directed chemical libraries to accelerate drug discovery. Ligands iden-
tified by this method can be used in secondary biological assays to check
for biological activity. In the case of targets of unknown function, low-
throughput secondary assays can be used to determine the therapeutic
relevance of a novel target. Chemogenomics can be applied to the dis-
covery and description of all possible drug compounds (all of the che-
mical possibilities) directed at all possible drug targets. This approach
has the potential to cover a broad range of therapeutic areas, because
while gene families code for structurally similar proteins, each protein in
a gene family can have a very different biological function. Different
targets within a gene family may be implicated in widely different dis-
eases. In practice, the chemogenomics approach is accelerating the drug
discovery and will increase the flow of new drug candidates into
development.
11.16 VIRTUAL DRUG DEVELOPMENT
In addition to drug design, computers are used for modelling human
disease and response to therapy. Research and drug development can be
carried out in a virtual laboratory using computer-based models of
human disease, target validation and patient selection for clinical trials.
Drug testers turn to ‘virtual patients’ as guinea pigs and this technology
334 Chapter 11
can reveal unseen biological interactions that explain conflicting clinical
trial results.
Virtual screening is a strategy for introducing a more focused
approach to HTS. Computational analysis of very large real or virtual
chemical databases can readily identify compounds with appropriate
properties for binding to the target receptor. Full receptor–ligand
docking represents the most detailed – and the most time-consuming –
approach to virtual screening. One of the aims of introducing compu-
tational methods in the drug discovery process is the early elimination of
compounds which are chemically unsuitable for further development.
This approach is needed because HTS is identifying a large number of
hit compounds, many of which do not possess drug-like properties.
Several methods for predicting drug likeness have been described but the
focus is on the prediction of intestinal absorption and blood–brain
barrier penetration. The routine use of experimental absorption systems
in the pre-screening of compounds has provided data that can be used
for construction of improved models of drug absorption. Use of such
systems have the potential to reduce lead optimisation time and attrition
rates in preclinical and clinical phases of drug development.
11.17 ROLE OF BIOTECHNOLOGY IN LEAD GENERATION
AND VALIDATION
Structural characterisation of biomacromolecules, computer sciences
and molecular biology have made rational drug design feasible. Mole-
cular modelling has helped in the discovery process of new drugs, par-
ticularly lead generation and optimisation. With a host of methods
available, lead generation is no longer a problem in drug discovery.
However, there is still a need to improve the methods of lead validation
for potential therapeutic candidates. None of the screening methods
currently available has a very high degree of certainty but a success rate
of over 80% is acceptable while efforts are in progress to improve it. The
aim is to develop high-throughput screens that also provide clinically
relevant information. There is limitation of cell models in that the
human disease process is not reproduced reliably. An improved under-
standing of cell signalling pathways within the cell will provide a better
basis for the development of specific assays for various diseases.
11.18 CONCLUSION
Biotechnology-based methods are being used to improve drug discovery
and molecular targeting. Most of the new technologies are being used
335Biotechnology-based Drug Discovery
for this purpose. There is a considerable parallel activity in the devel-
opment of drug delivery and personalised medicine based on pharma-
cogenetics, pharmacogenomics and pharmacoproteomics. Various
omics, particularly combined genomic and proteomic approaches, have
contributed considerably to this process. Bioinformatics plays an
important role in integrating and analysing massive amounts of data
produced from application of various technologies. It is hoped that
biotechnology-based approaches will help in discovery of new drugs to
meet the current shortage.
REFERENCES
1. D. M. Drexler, T. J. Garrett, J. L. Cantone, R. W. Diters,
J. G. Mitroka, M. C. Prieto Conaway, S. P. Adams, R. A. Yost and
M. Sanders, J Pharmacol. Toxicol. Methods, 2007, 55, 279.
2. M. R. Groseclose, M. Andersson, W. M. Hardesty and R. M. Caprioli,
J. Mass Spectrom., 2007, 42, 254.
3. K. K. Jain, in Handbook of Drug Screening, ed. R. Seethala, Informa
Healthcare, New York, 2008.
4. R. Weissleder, K. Kelly, E. Y. Sun, T. Shtatland and L. Josephson,
Nat. Biotechnol., 2005, 23, 1418.
5. X. Wang, R. Inapagolla, S. Kannan, M. Lieh-Lai and R. M. Kan-
nan, Bioconjug. Chem., 2007, 18, 791.
6. R. W. Peck, Drug Discov. Today, 2007, 12, 289.
7. P. Mazierea and A. J. Enright, Drug Discov. Today, 2007, 12, 452.
8. P. S. Dittrich and A. Manz, Nat. Rev. Drug. Discov., 2006, 5, 210.
9. T. Klabunde, Br. J. Pharmacol., 2007, 152, 5.
336 Chapter 11

CHAPTER 12
Vaccines
NIALL MCMULLAN
School of Life Sciences, University of Hertfordshire, Hatfield, Hertfordshire
AL10 9AB, UK
12.1 AN OVERVIEW OF VACCINES AND VACCINATION
Some two centuries ago, Edward Jenner introduced the concept of modern
vaccination when he successfully used cowpox virus to induce protective
immunity to smallpox. The pioneering work of Jenner and his con-
temporary Louis Pasteur paved the way for the concept of vaccination.
The term vaccination (from the Latin vacca – cow) was coined by Pasteur
as a lasting tribute to Jenner’s work. The 1970s saw the global eradication
of smallpox, the last naturally occurring case being in Somalia in 1977.
Through the efforts of the WHO, other diseases have been targeted for
eradication, most notably measles and polio. Like smallpox, these diseases
are caused by viruses that only infect humans, thus increasing the odds of
eradication. Despite global eradication programmes, however, there are
still pockets of infection around the world. The need for effective vaccines
and vaccination programmes is brought into sharp focus when con-
sidering the fact that over half the human population of the world are
infected by one or more pathogens. The scale of malaria infection coupled
with the re-emergence of tuberculosis and the increasing incidence of HIV/
AIDS is an ever-present reminder of the burden of infectious disease.
Time and space do not permit the inclusion of animal diseases, an
issue in its own right, or the attempts to develop vaccines against cancer.
Molecular Biology and Biotechnology, 5th Edition
Edited by John M Walker and Ralph Rapleyr Royal Society of Chemistry 2009
Published by the Royal Society of Chemistry, www.rsc.org
337
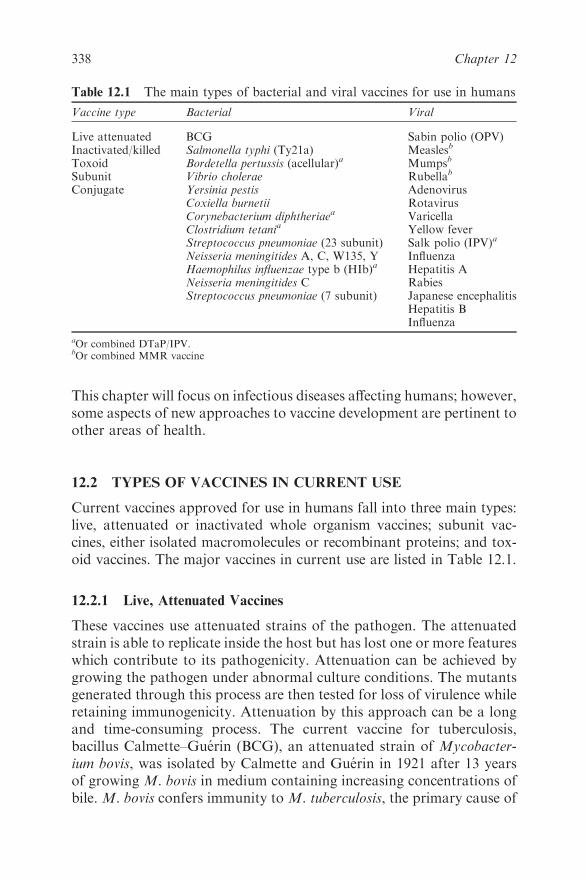
This chapter will focus on infectious diseases affecting humans; however,
some aspects of new approaches to vaccine development are pertinent to
other areas of health.
12.2 TYPES OF VACCINES IN CURRENT USE
Current vaccines approved for use in humans fall into three main types:
live, attenuated or inactivated whole organism vaccines; subunit vac-
cines, either isolated macromolecules or recombinant proteins; and tox-
oid vaccines. The major vaccines in current use are listed in Table 12.1.
12.2.1 Live, Attenuated Vaccines
These vaccines use attenuated strains of the pathogen. The attenuated
strain is able to replicate inside the host but has lost one or more features
which contribute to its pathogenicity. Attenuation can be achieved by
growing the pathogen under abnormal culture conditions. The mutants
generated through this process are then tested for loss of virulence while
retaining immunogenicity. Attenuation by this approach can be a long
and time-consuming process. The current vaccine for tuberculosis,
bacillus Calmette–Guerin (BCG), an attenuated strain of Mycobacter-
ium bovis, was isolated by Calmette and Guerin in 1921 after 13 years
of growing M. bovis in medium containing increasing concentrations of
bile. M. bovis confers immunity to M. tuberculosis, the primary cause of
Table 12.1 The main types of bacterial and viral vaccines for use in humans
Vaccine type Bacterial Viral
Live attenuated BCG Sabin polio (OPV)Inactivated/killed Salmonella typhi (Ty21a) Measlesb
Toxoid Bordetella pertussis (acellular)a Mumpsb
Subunit Vibrio cholerae Rubellab
Conjugate Yersinia pestis AdenovirusCoxiella burnetii RotavirusCorynebacterium diphtheriaea VaricellaClostridium tetania Yellow feverStreptococcus pneumoniae (23 subunit) Salk polio (IPV)a
Neisseria meningitides A, C, W135, Y InfluenzaHaemophilus influenzae type b (HIb)a Hepatitis ANeisseria meningitides C RabiesStreptococcus pneumoniae (7 subunit) Japanese encephalitis
Hepatitis BInfluenza
aOr combined DTaP/IPV.bOr combined MMR vaccine
338 Chapter 12

tuberculosis in humans due to similarities between the two organisms.
Although primarily associated with tuberculosis in cattle, M. bovis was
also a significant cause of tuberculosis in humans prior to the intro-
duction of pasteurised milk. The BCG vaccine is the most commonly
administered vaccine, with over 5 billion doses having been given since
its introduction in the 1940s. However, the efficacy of BCG is variable
due in part to the fact that BCG, per se, has never been cloned and
consequently there are variations between BCG preparations.1
Attenuated viral vaccines are more common, but the basic strategy
has been the same. Typically, attenuated strains of the virus are isolated
by passage through cells which are not the normal host cell. The Sabin
polio vaccine contains three different attenuated strains of poliovirus
developed by growth in monkey kidney epithelial cells. Attenuated
strains of the viruses responsible for measles, mumps and rubella were
produced by similar approaches. These attenuated strains are used in the
combined MMR vaccine. The attenuated measles virus may also used
on its own; consequently, the WHO data refer to measles-containing
vaccine (MCV).
The molecular attenuation or deletion of virulence genes should
permit more rapid production of attenuated strains for use of vaccines.
One current example is a typhoid vaccine, which uses the attenuated
Salmonella typhi strain Ty21a. Recently, the production of a biologically
contained Ebola virus has been reported.2 The gene encoding an
essential viral transcription factor (VP30) required for viral replication
was replaced by a reporter gene. Vero cells expressing the critical VP30
protein permit completion of the viral life cycle but the virus is contained
within the cell type. These VP30-negative viruses are genetically stable
and morphologically indistinguishable from the wild-type virus. The
production of this biologically contained form of Ebola virus will permit
studies of the virus outside of biosafety level-4 containment and should
accelerate vaccine development for this highly lethal and feared virus.
12.2.2 Inactivated Vaccines
Several inactivated vaccines are in current use in humans (Table 12.1).
The approach is chemical inactivation of the pathogen using for-
maldehyde or b-propiolactone. This approach usually ensures that the
immunogenic features of the pathogen are retained. Production of inac-
tivated vaccines requires large quantities of pathogenic material, with
associated risks for the workers involved. Furthermore, it is essential that
the inactivation process is complete, otherwise the pathogen will be
introduced into the population. This occurred with early batches of the
339Vaccines
Salk polio vaccine, resulting in paralytic polio in a number of recipients.
The advantage over live, attenuated vaccines is that there is no risk of
reversion to virulence. It is for this reason that the Salk vaccine is pre-
ferred over the Sabin polio vaccine in Scandinavian countries.
Inactivated vaccines generally produce significant antibody responses
but weaker cellular immunity, in particular cytotoxic T cell responses,
than live vaccines. This is due mainly to the absence of microbial protein
synthesis inside host cells. In turn, this leads to reduced or absent
cytosolic processing required for MHC class I presentation of peptides
and poor activation of cytotoxic CD8+ T cells. Furthermore, the
inability to replicate inside the host reduces immunostimulation and a
need for more booster immunisations.
12.2.3 Subunit Vaccines
Subunit vaccines are used widely to protect against a number of
important pathogens. Subunit vaccines typically use isolated antigenic
macromolecules from the external surface of the pathogen. Vaccines
against Haemophilus influenzae type b (HIb), Neisseria meningitidis and
Streptococcus pneumoniae contain capsular polysaccharides derived
from the bacteria. Alternatively, the vaccine may be a recombinant
protein such as the hepatitis B surface antigen (HBsAg) used in the
hepatitis B vaccine. Different factors influence or even dictate the use of
subunit vaccines as opposed to whole organism vaccines. Gram-negative
bacterial pathogens such as Haemophilus influenzae type b and Neisseria
meningitidis represent a significant health threat even when dead due to
the presence of lipopolysaccharide moieties (endotoxin) in their cell wall
structures. Endotoxin is a powerful inducer of proinflammatory cyto-
kines in macrophages leading to septic shock. In the case of hepatitis B
virus, the inability to culture the viruses has so far made attenuation
impossible.
Despite the limitations described above, subunit vaccines are among
the most efficacious vaccines due to their ability to elicit highly appro-
priate immune responses.
12.2.3.1 Capsular Polysaccharide Vaccines and Protein Carriers
(Conjugate Vaccines)
Haemophilus influenzae type b (HIb) and Neisseria meningitidis are the
major cause of bacterial meningitis in infants, toddlers and young
adults. Phagocytosis is the primary defence mechanism against extra-
cellular pathogens. A major pathogenic feature of Haemophilus
340 Chapter 12
influenzae type b (HIb), Neisseria meningitidis and Streptococcus pneu-
moniae is the presence of hydrophilic polysaccharides which possess
anti-phagocytic properties. This feature allows the pathogens to estab-
lish infection within the host. The production of opsonising antibodies
of the IgG isotype that promote phagocytosis is a key process in elim-
inating these pathogens. This is the basis of the current vaccines.
However, polysaccharides are generally weak inducers of antibody
responses due to poor T-helper cell responses to polysaccharides. This
leads to poor immunological memory and diminished antibody class
switching to IgG. Poor immune responses were a feature of the first
polysaccharide-based vaccines. This problem has been overcome by the
use of carrier proteins conjugated to the polysaccharides. Such vaccines
are referred to as conjugate vaccines and are now routinely used in
vaccination against Haemophilus influenzae type b (HIb) and Neisseria
meningitides. The use of carrier proteins has greatly enhanced the
immunogenicity of these vaccines. The basis for this is that the carrier
protein is processed by host cells and activates T-helper cells resulting in
the cytokines required to produce memory and antibody isotype
switching. The carrier proteins used are inactivated bacterial exotoxins
(toxoids), in particular tetanus toxoid. This exploits the fact that indi-
vidual will have been immunised against tetanus (see Section 12.2.3.3)
and will have memory T cells to the carrier protein, in turn increasing
the effectiveness of the T cell contribution.
S. pneumoniae displays considerable variability in the polysaccharide
capsule. The vaccine contains up to 23 different polysaccharides from
the major serovars. Alternatively, a conjugate vaccine containing 7
major polysaccharides is available. A polysaccharide-based typhoid
vaccine is also available.
12.2.3.2 Recombinant Protein Vaccines
The hepatitis B virus (HBV) vaccine is the major example of a recom-
binant protein vaccine in current use and the first vaccine produced by
recombinant DNA technology. The vaccine contains a highly purified
form of recombinant HBsAg, encoded by a single gene and expressed in
yeast.3 As with most subunit vaccines, it requires multiple boosters but
has proven to be highly efficacious. Humans are the only host for HBV.
Prior to the recombinant vaccine becoming available, the only available
source of HBV antigen was blood from infected individuals, a risky
procedure for those involved. This is a highly infectious virus and the
number of cases of infection prevented and indeed hepatic cancer cases
prevented is incalculable. WHO estimates suggest that up to 2 billion of
341Vaccines
the global population are infected with HBV, with 360 million chroni-
cally infected. Due to the large scale of HBV infection, the vaccine has
been introduced into infant immunisation programmes in over 160
countries. In the UK, the vaccine is retained for use in high-risk groups,
in particular healthcare workers and appropriate laboratory staff.
Recently, two recombinant protein vaccines have been developed for
human papilloma virus (HPV), the primary cause of cervical cancer and
genital warts. These vaccines combine HPV proteins in self-associating
virus-like particles. The vaccines are Gardisal (Merck), which contains
proteins from HPV 16, 18, 6 and 11 produced by recombinant yeast
technology, and Cervarix (GlaxoSmithKline), which contains proteins
from HPV 16 and 18 produced by recombinant baculovirus technology.4
12.2.3.3 Toxoid Vaccines
Toxoids are inactivated toxins. In some instances, bacterial exotoxins are
the sole or primary virulence factor and the strategy here is to immunise
against the exotoxin not the actual bacterium. Tetanus toxin produced
by Clostridium tetani is one such example. The bacterium is an obligate
anaerobe widely distributed in the environment and is non-invasive.
Tetanus exotoxin is a very potent toxin which interferes with neuronal
transmission and in extreme cases can prove fatal. Neonatal tetanus kills
thousands of children each year. The problem is particularly acute in
technologically underdeveloped countries, where home births in poor
sanitary conditions are often the norm. The vaccine is highly effective in
preventing the onset of tetanus. Diphtheria caused by infection with
Corynebacterium diphtheriae, another common pathogen, is also pre-
vented by use of a toxoid vaccine. Toxoid vaccines are expensive due to
the large-scale cultures of organisms required to obtain exotoxin.
12.3 THE NEED FOR NEW VACCINES
There is a constant demand for new and improved vaccines. Despite the
success of current vaccines in controlling widespread epidemics, none of
them demonstrates complete efficacy. In the case of cholera, the vaccine
efficacy is around 50% and, as stated earlier, efficacy for BCG varies
considerably. WHO figures for 2007 put the number of deaths from
tuberculosis at 1.5 million. Although herd immunity may ultimately lead
to eradication of some pathogens due to a reduced reservoir of infection,
this is probably only attainable for pathogens where the only natural
host is the human population. This was the case with smallpox and
raises a similar prospect for polio and measles. Furthermore, there are
342 Chapter 12
no vaccines available for major diseases such as HIV/AIDS and malaria.
In 2007, there were 2.5 million new cases of HIV infection and 2.1
million deaths recorded. One child under 5 years of age dies every 30 s
from malaria and there were 500 million cases of illnesses reported in
2007. The extent of these diseases inevitably results in co-infection.
There were 200 000 deaths associated with HIV/tuberculosis in 2007,
and the emergence of an extensively drug-resistant form of tuberculosis,
XDR-TB, compounds the existing problem.
12.4 NEW APPROACHES TO VACCINE DEVELOPMENT
The rapid development of molecular biological techniques coupled with
major advances in genomics and proteomics has formed the bedrock of
new vaccine development strategies. The techniques used in identifying
gene sequences and in whole genome sequencing are discussed in other
chapters. These techniques have been applied to the identification of
potential antigenic targets for vaccine development and facilitated new
methods for the expression and delivery of candidate genes. The com-
mon strategies arising from this include the development of recombinant
live vector vaccines expressing heterologous genes, as delivery systems,
and DNA vaccines (eukaryotic antigen expression vectors).
12.4.1 Recombinant Live Vectors
Recombinant live vectors expressing heterologous proteins have the
potential benefits of live vaccines without the need to isolate and
attenuate the actual pathogen. Several attenuated bacterial and viral
vectors have been constructed with varying levels of complexity to
deliver proteins from a range of pathogens. In principle, the introduc-
tion of these living vaccines should stimulate strong cellular responses as
the transgene products will be expressed and processed within the host
leading to MHC presentation. The stimulation of cytotoxic T cells via
MHC class I presentation is of particular importance in immunity to
viruses and other intracellular pathogens.
12.4.2 Recombinant BCG Vectors
BCG is the most commonly used vaccine in the world. Several recom-
binant BCG (rBCG) candidate vaccines containing genes from several
different pathogens have been developed and tested,5 and in general
these proved effective at stimulating both B and T cell responses. Pro-
tective immunity in animal models has been demonstrated for rBCG
343Vaccines

vaccines expressing the outer surface protein (OspA) of Borrelia burg-
dorferi,6 the merozoite surface protein 1 (MSP-1)7 and the Leishmania
protective antigen (LRC1).8 Other studies have shown immunogenicity
for rBCG vaccines but no protection was demonstrated. Likewise,
varying levels of heterologous protein have been reported.9–11 The
variability in protective responses and protein production may be due to
differences in the shuttle vectors used, stability of the rBCG vaccines
used and the route of administration.12 Despite the variability in
responses, the immunogenicity of rBCG vector vaccines shows promise.
12.4.3 Recombinant Salmonella Vectors
Salmonella spp. invade the gut and as such are good candidates for oral
delivery of vaccines. In common with other Gram-negative bacteria,
Salmonella possess type 3 secretion secretions (T3SS), which promote
their invasiveness. One system is used to infect non-phagocytic cells
while the second is required for intracellular replication and spread
within the host. Salmonella Pathogenicity Island 2 (SPI2-T3SS) creates a
needle-like complex through which bacterial effector proteins are
delivered into the cell. It has been shown that the SPI2-T3SS can be used
to deliver heterologous antigenic proteins.13 The introduction of pro-
teins through this route should result in intracellular processing of
proteins for presentation to T cells. Significantly, the SPI2-TSS has been
shown to be active in dendritic cells, the major professional antigen
presenting cells of the immune system.14 In one study,15 using S.
typhimurium strain, translational fusions between Salmonella effector
proteins (SseF or SseJ) and ovalbumin and L. monocytogenes proteins
listeriolysin O (Llo) and p60. The last two are protective antigens in
various models of listerial infection.16 Mice orally immunised with the
recombinant S. typhimurium carrying the fusion proteins showed
reduced Listeria burden. As found in other studies,17 this protection was
significantly greater than that observed with constitutively expressed
proteins. In clinical studies,18 mucosal delivery of an attenuated S.
typhimurium carrying an SopE-HIV Gag fusion protein from a lethal
plasmid showed some level of Il-2 response to the Gag protein as
determined by ELISPOT. However, the response was low compared
with that to Salmonella antigen alone. Only one shot of vaccine was
used, so it may be possible to enhance the responsiveness. Importantly,
the vaccine was well tolerated in the trial subjects, suggesting good safety
prospects.
A recombinant S. typhimurium strain which secretes the M. tubercu-
losis virulence protein ESAT-6 was tested in mice and demonstrated
344 Chapter 12

significant protection to subsequent challenge with M. tuberculosis19 as
measured by a reduction in the number of tubercle bacilli in the lungs.
Co-immunisation with a DNA vaccine using ESAT-6 ligated to mam-
malian expression vectors showed no enhancement, although priming
with the S. typhimurium vaccine followed by mixed immunisation
showed a synergistic effect with some enhanced protection in the spleens
of the M. tuberculosis-infected mice.
12.4.4 Recombinant Adenovirus Vectors
Adenoviruses, the primary cause of the common cold, show some pro-
mise as delivery systems for heterologous antigenic proteins. Attenuated
human adenoviruses (HAd7) have been used for many years to immu-
nise US military personnel and their families with no significant side-
effects.20 More recently, trials of attenuated human adenovirus 5
(HAd5) in non-human primates have shown protective immunity
against Ebola virus.21 Protective immunity has also been shown against
HIV-1 in non-human primates using a HAd5 vector expressing the HIV-
1 gag gene.22 Adenovirus vectors are stable and generally safe vectors
with good efficacy.23 Furthermore, adenovirus vectors have been shown
to be reliable and induce strong expression of transgenes. As they are
replication-defective, horizontal transmission is very unlikely.24 The
major disadvantages of using HAd vectors in humans is the presence of
pre-existing immunity to adenoviruses themselves. This arises from
routine exposure to the wild-type viruses. HAd vectors are highly
immunogenic in their own right and memory responses coupled with
prior exposure to the wild types is likely to be the cause of reduced
responses to heterologous proteins encoded in the vectors by neu-
tralising antibodies to the vector itself. There may also be destruction of
transduced cells expressing vector antigens. This type of memory
response is the probable reason for the recent withdrawal from clinical
trials of an adenovirus vector vaccine against HIV-1.25 Different
approaches have been undertaken to bypass this problem, such as prior
boosting with the recombinant DNA,26 microencapsulation of the
vector27 and the use of rarer types of adenoviruses.28 A further strategy
to overcome the preimmune interference is the use of non-human ade-
noviruses as vectors in humans.29 Pre-existing antibodies to bovine
adenovirus 3 (BAd3) are not prevalent in the human population.30
Replication-defective BAd3 vectors have been shown to express hetero-
logous proteins in various human cell types in vitro.31 The use of
non-human adenoviruses shows promise in the development of new
vector vaccine delivery systems in humans.
345Vaccines
12.4.5 Recombinant Vaccinia Vectors
Vaccinia has been used in humans since the pioneering work of Edward
Jenner at the end of the 18th century. As the prototype vaccine, it is
perhaps unsurprising that recombinant vaccinia vectors expressing a
multitude of genes from across the microbial world have been descri-
bed.32 However, vaccinia is not recommended for use in individuals with
compromised immune systems. In view of the ever-increasing population
of HIV-positive individuals and ageing populations coupled with the
immunogenicity of the vaccine and its ability to replicate in humans, the
use of vaccinia as a vector vaccine in humans is limited without sig-
nificant attenuation as seen in the modified vaccinia virus Ankara
(MVA). MVA has been demonstrated to be safe in immune-suppressed
non-human primates, suggesting a possible future role in vaccine devel-
opment.33 One alternative is to use other members of the pox family of
viruses such as the avipoxviruses. These are replication-deficient in
mammalian cells and offer some possibility for use in humans.
12.4.6 DNA Vaccines
The basis of this concept is the introduction of plasmid DNA encoding
antigenic transgenes into the host cells in which the transgenes are
expressed. In practice, although they do elicit specific immune responses,
such vaccines have shown low immunogenicity, probably through
reduced ability of the proteins to enter antigen processing pathways or
loss of the plasmid prior to sufficient concentrations of protein being
expressed. Immunogenicity can be augmented by including cytokine
genes in the plasmid. Another approach is to target the vaccine to the
antigen processing pathways using a gene encoding a targeting protein
for the processing pathways. This has been demonstrated using the gene
encoding the lysosome-associated membrane protein (LAMP). The use
of an LAMP/gag chimera has been shown to induce long-term immu-
nological memory in mice.34 Furthermore, a single dose of the plasmid
was sufficient to induce a secondary CD8+ T cell response without
CD4+ T-helper cell assistance. The inclusion of genes encoding
immunomodulatory molecules, in particular cytokines, would not just
enhance the immunogencity of the vaccine but also allow manipulation
of the immune response by altering the T-helper cell polarisation into
the subset, i.e. TH1 or TH2 appropriate to the pathogen. Additionally,
the inclusion of other molecules that influence the maturation of den-
dritic cells or molecules, such as chemokines that promote recruitment
of other antigen-presenting cells to the immunisation site, open up
346 Chapter 12
possibilities not available in more conventional vaccine preparations.
Such considerations may also apply to recombinant vector vaccines.
12.5 ADJUVANTS
The term adjuvant covers a multitude of potential substances with
diverse chemical properties. An adjuvant is a substance that increases the
effectiveness of the vaccine (from the Latin ad juvare – to help). Adju-
vants may create depots of vaccine, thus prolonging its availability at a
particular site, increase uptake of the vaccine by antigen presenting cells
or they may be immunostimulatory in their own right. There are many
different adjuvants available for experimental vaccines but the only ones
universally approved for use in humans are the aluminium salt-based
adjuvants including aluminium hydroxide, aluminium phosphate and
potassium aluminium sulfate (alum). The probable adjuvant activity of
alum is the creation of a vaccine depot at or near the site of immunisa-
tion. Other adjuvants used in experimental vaccines are described below.
12.5.1 Immune-stimulating Complexes (ISCOMs) and Liposomes
ISCOMs are a mixture of cholesterol, phospholipid and Quil A that form
a matrix structure described rather well as being similar in shape to a
practice golfball.35 The proteins are added to these lipid carriers and
orientate with their hydrophilic residues exposed. Liposomes containing
protein antigens are prepared by mixing the proteins with a suspension of
phospholipids and under appropriate conditions form a complex with the
proteins protruding out from the centre. Liposomes and ISCOMs prob-
ably fuse with the plasma membrane of cells, permitting the antigen to
enter the cell where they enter the cytosolic pathway. They are then
degraded and presented with MHC class I molecules to cytotoxic T cells.
A variation on the use of liposomes is the use of virosomes. These are func-
tionally reconstituted viral membranes which retain the cell-binding and
fusion properties of the virus. Virosome-encapsulated OVA elicited a
strong CTL response in mice with as little as 0.75mg of OVA when admi-
nistered by an intramuscular, intraperitoneal or subcutaneous route.36
12.5.2 Freund-type Adjuvants
Freund’s complete adjuvant (FCA) is the stalwart of experimental
vaccines. The adjuvant is a mixture of mineral oils containing heat-killed
M. tuberculosis cells together with an emulsifier. This is a very potent
adjuvant, stimulating both antibody and cellular immune responses in
347Vaccines
its own right. This is mainly due to the immunogenic properties of the
mycobacterial component. Due to potential formation of granuloma, a
mixture of epithelioid macrophages and T cells and the chronic
inflammation induced, it is not used in vaccines intended for application
in humans. Although it undoubtedly has a major role in immunisation
for the purposes of inducing immune responses in experimental animals
and in the production of antibodies as reagents, its use in vaccine
development may be questionable as the immune responses induced
may not be representative of the likely outcomes using preparations
approved for use in humans.
12.5.3 CpG Oligonucleotides (CpG ODNs)
CpG ODNs are unmethylated nucleotide sequences typically less than
20 nucleotides in length. There are three types of CpG ODNs dis-
tinguished by the backbone structure. Type A have a mixed phospho-
diester–phosphorothioate backbone, type B have a phosphorothioate
backbone and type C also have a phosphorothioate backbone with a
TCG dimer at the 50 end.37 These unmethylated sequences bind to one of
the pattern recognition receptors, toll-like receptor 9 (TLR 9) expressed
in intracellular endosomal compartments of dendritic cells, macro-
phages and to a lesser extent on other cell types. TLR9 typically binds
such sequences derived form bacteria following phagocytosis of bac-
teria. TLR9 induces cellular activation of dendritic cells inducing cyto-
kine production and promoting TH1 responses. The promotion of this
subset is primarily due to the release of Il-12. The ability to activate
dendritic cells and other antigen-presenting cells has generated much
interest in CpG ODNs as potential adjuvants for both DNA vaccines to
boost the low immunogenicity often observed with such vaccines and
also for more classical vaccine preparations. CpG ODNs have been
shown both to accelerate and to magnify immune responses, particularly
at lower vaccine doses. Differences in the immune responses between
type A and B CpG ODNs have been reported.38 Type B induced Ag-
specific CTL numbers in human PBMCs whereas type A did not.
Soluble factors induced by type A but not type B increased the cyto-
toxicity of established CD8+ clones.
Combining CpG ODNs with biphasic vesicles carrying the outer
membrane lipoprotein A (OmlA) from Actinobacillus pleuropneumoniae
delivered by nasal immunisation induced both systemic and localised
antibody responses in pigs, whereas the protein alone or with the CpG
ODN did not induce mucosal responses.39 The use of these
348 Chapter 12
immunostimulatory molecules coupled with new DNA-based vaccines
offers the prospect of a new era in vaccine design.
REFERENCES
1. P. E. M. Fine, I. A. M. Carneiro, J. B. Milstien and C. J. Clements,
WHO Discussion Document, 1999.
2. P. Halfman, J. H. Kim, H. Ebihara, T. Noda, G. Neumann,
H. Feldmann and Y. Kawaoka, Proc. Natl. Acad. Sci. USA, 2008,
105(4), 1129–1133.
3. P. Valenzuala, A. Medina, W. J. Rutter, G. Ammerer and B. D.
Hall, Nature, 1982, 298, 347–350.
4. Network for Education and Support in Immunisation, Immunisation
Curriculum Review and Update Workshop, 2007.
5. M. Dennehy and A. Williamson, Vaccine, 2005, 23(10), 1209–24.
6. C. K. Stover, G. P. Bansal and M. S. Hanson, J. Exp. Med., 1993,
178(1), 197–209.
7. S. Matsumoto, H. Yukitake, H. Kanbara and T. Yamada, J. Exp.
Med., 1998, 188, 845–854.
8. J. A. Streit, T. J. Recker, J. E. Donelson and M. E. Wilson, Exp.
Parasitol., 2000, 94(1), 33–41.
9. S. Langermann, S. R. Palaszynski and J. E. Burlein, et al., J. Exp.
Med.1994, 180, 2277–2286.
10. A. Aldovini and R. A. Young, Nature, 1991, 351(6326), 479–482.
11. B. Abomoelak, K. Huygen, L. Kremer, M. Turneer and C. Locht,
Infect. Immunol., 1999, 67(10), 5100–5105.
12. N. Ohara and T. Yamada, Vaccine, 2001, 1(19), 4089–4098.
13. H. Russmann, H. Shams, F. Poblete, Y. Fu, J. E. Galan and R. O.
Donis, Science, 1998, 281, 565–568.
14. J. Jantsch, C. Cheminay, D. Chakravortty, T. Lindig, J. Hein and
M. Hensel, Cell. Microbiol., 2003, 5, 933–945.
15. M. I. Husseiny, F. Wartha and M. Hensel, Vaccine, 2007, 25(1),
185–193.
16. M. Lara-Tejero and E. G. Pamer, Curr. Opin. Microbiol., 2004, 7(1),
45–50.
17. M. I. Husseiny and M. Hensel, Vaccine, 2004, 23(1), 185–193.
18. C. N. Kotton, A. J. Lankowski, N. Scott, D. Sisul, L. M. Chen,
K. Raschke, G. Borders, M. Boaz, A. Spentzou, J. E. Galan and
E. L. Hohmann, Vaccine, 2006, 24, 37–39.
19. H. Mollenkopf, D. Groine-Triebkorn, P. Andersen, J. Hess and
S. H. E. Kaufmann, Vaccine, 2001, 19(28–29), 4028–4035.
349Vaccines
20. F. H. Top Jr, R. A. Grossman, P. J. Bartelloni, H. E. Segal, B. A.
Dudding, P. K. Russell and E. L. Buescher, J. Infect. Dis., 1971,
124(2), 148–154.
21. N. J. Sullivan, T. W. Geisberg, J. B. Geisberg, L. Xu, Z. Y. Zang
and M. Roederer, et al., Nature, 2003, 424, 681–684.
22. D. R. Casimiro, A. Tang, L. Chen, T. M. Fu, R. K. Evans and
M. E. Davies, et al., J. Virol., 2003, 77(13), 7663–8.
23. N. Tatsis and H. C. Ertl, Mol. Ther., 2004, 10(4), 616–29.
24. D. S. Bangeri and S. K. Mittal, Vaccine, 2006(24) 849–862.
25. National Institutes of Allergy a Infectious Disease Press Release,
2007.
26. Z. Y. Yang, L. S. Wyatt, W. P. Kong, Z. Moodie, B. Moss and G. J.
Nabel, J. Virol., 2003, 77(1), 799–803.
27. G. Sailaja, H. HogenEsch, A. North, J. Hays and S. K. Mittal, Gene
Ther., 2002, 9(24), 1722–1729.
28. R. Vogels, D. Zuijdgeest, E. Hartkoorn, I. Damen and M. P. de
Bethune, et al., J. Virol., 2003, 77(15), 8263–8271.
29. D. S. Bangari and S. K. Mittal, Vaccine, 2006, 24, 849–862.
30. S. Moffatt, J. Hays, H. HogenEsch and S. K. Mittal, Virology, 2000,
272(1), 159–167.
31. U. B. Rasmussen, M. Benchaibi, V. Meyer, Y. Schlesinger and
K. Schughart, Hum. Gene Ther., 1999, 10(16), 2587–99.
32. B. Moss, Proc. Natl. Acad. Sci. USA, 1996, 93, 11341–11348.
33. K. J. Stittelaar, T. Kuiken, R. L. de Swart, G. Amerongen, H. W.
Vos, H. Niesters, et al., Vaccine, 19(27), 3700–9.
34. L. Barros de Arruda, P. R. Chikhlikar, J. T. August and E. T. A.
Marques, Immunology, 2004, 126–135.
35. D. E. S. Stewart-Tull, Vaccine protocols, in Methods in Molecular
Medicine, 87, 175–94.
36. L. Bungener, A. Huckriede, A. de Mare, J. de Vries-idema,
J. Wilschut and T. Daemen, Vaccine, 2005, 23(10), 1232–41.
37. D. M. Klinman, Int. Rev. Immunol., 2006, 25, 135–154.
38. S. Rothenfusser, V. Horning, M. Ayyoub, S. Britsch, A. Towar-
owski, A. Krug, A. Sarris, N. Lubenow, D. Speiser, S. Endres and
G. Hartmann, Blood, 2004, 103(6), 2162–9.
39. V. Alcon, M. Baca-Estrada, M. Vega-Lopez, P. Willson, L. A.
Babiuk, P. Kumar, R. Hecker and M. Foldvari, AAPS J., 2005,
7(3), 566–71.
350 Chapter 12
CHAPTER 13
Tissue Engineering
NILS LINK AND MARTIN FUSSENEGGER
Institute for Chemical and Bioengineering (ICB), ETH Zurich, HCI F115,
Wolfgang-Pauli-Strasse 10, CH-8093, Zurich, Switzerland
13.1 INTRODUCTION
13.1.1 Economic Impact of Healthcare
For thousands of years, medical practitioners have attempted to reduce
pain, cure disease, extend lifespan and generally improve quality of life.
The immense technological progress of the past 30 years has enabled
great advances to be made in the treatment of disease. This is reflected
statistically in life expectancies, which have increased significantly over
the past decades. However, longer life expectancy creates new medical
issues, particularly with regard to the longevity of organs and tissues
that must now function for longer periods of time. At present, organ
transplantation is the only possible therapy for some patients. Thus, as
life expectancy increases, so too does the demand for donor organs
(Table 13.1). In the USA alone, 90 000 patients were waiting for organs
in 2006.1 Furthermore, the treatment and care of patients undergoing
such treatment are costly [more than US$400 billion per year in the USA
(Tables 13.1 and 13.2)]. Although the use of synthetic materials aids in
keeping people alive, many implants function only to a limited extent
like living tissues. Unlike real tissues, which are in a constant state of
renewal, synthetic implants begin to show signs of decomposition within
Molecular Biology and Biotechnology, 5th Edition
Edited by John M Walker and Ralph Rapleyr Royal Society of Chemistry 2009
Published by the Royal Society of Chemistry, www.rsc.org
351
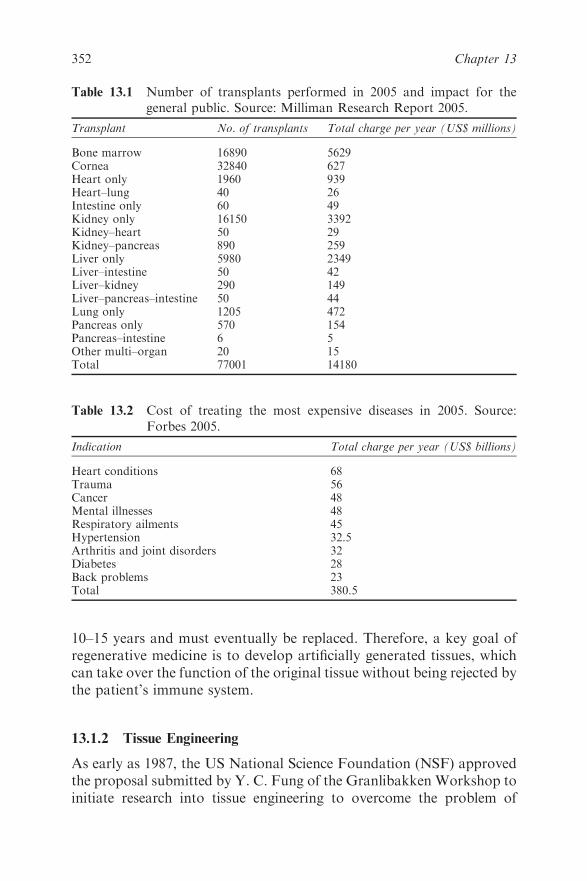
10–15 years and must eventually be replaced. Therefore, a key goal of
regenerative medicine is to develop artificially generated tissues, which
can take over the function of the original tissue without being rejected by
the patient’s immune system.
13.1.2 Tissue Engineering
As early as 1987, the US National Science Foundation (NSF) approved
the proposal submitted by Y. C. Fung of the Granlibakken Workshop to
initiate research into tissue engineering to overcome the problem of
Table 13.1 Number of transplants performed in 2005 and impact for the
general public. Source: Milliman Research Report 2005.
Transplant No. of transplants Total charge per year (US$ millions)
Bone marrow 16890 5629Cornea 32840 627Heart only 1960 939Heart–lung 40 26Intestine only 60 49Kidney only 16150 3392Kidney–heart 50 29Kidney–pancreas 890 259Liver only 5980 2349Liver–intestine 50 42Liver–kidney 290 149Liver–pancreas–intestine 50 44Lung only 1205 472Pancreas only 570 154Pancreas–intestine 6 5Other multi–organ 20 15Total 77001 14180
Table 13.2 Cost of treating the most expensive diseases in 2005. Source:
Forbes 2005.
Indication Total charge per year (US$ billions)
Heart conditions 68Trauma 56Cancer 48Mental illnesses 48Respiratory ailments 45Hypertension 32.5Arthritis and joint disorders 32Diabetes 28Back problems 23Total 380.5
352 Chapter 13

donor organ shortage. This project is regarded as the birth of tissue
engineering, the goal of which, according to the NSF, is ‘the application
of principles and methods of engineering and life sciences toward fun-
damental understanding of structure-function relationships in normal
and pathological mammalian tissues and the development of biological
substitutes to restore, maintain or improve tissue function’. This state-
ment makes it clear that tissue engineering is an interdisciplinary and
heterogeneous research field, where biologists, chemists, material scien-
tists and medical practitioners must work together to achieve success.2
After 50 years of progress in cell culture, immunology, the cell cycle,
proliferation, (trans-)differentiation and extracellular matrices (ECM),3,4
we are currently in a position to extract, culture and expand, in vitro, all
the existing cell types of an organism.
The groups of Hay, Heath and Ikehara have performed outstanding
investigations of the different growth factors, their effects and the
chronology of the markers expressed by cells during differentiation5–8
(Table 13.3). Nevertheless, the cell model developed thus is far from
complete. It is not difficult to keep cells alive in culture, but it is chal-
lenging to multiply them without altering their differentiation and phe-
notype.9–12 Therefore, research must continue to identify the exact
biochemical markers and growth factors that will finally enable the tissue
engineer to determine unambiguously whether the cells behave in exactly
the same way as cells in living organs. Only then can artificial tissues be
engineered which express the same phenotype as the desired organ.9
Within the field of tissue engineering, there are four main areas of
research: (i) cell therapy, which is based mainly on self-organization of
free cells that are injected into damaged tissue,13,14 (ii) bio-artificial devi-
ces, in which cells of a certain type are encapsulated to take on certain
functions of the organ, e.g. liver cells, pancreatic islet cells and kidney
cells,15–18 (iii) scaffold-assisted tissue engineering, in which cells are grown
on a matrix until they reach a certain level of stability,19,20 and (iv) scaf-
fold-free tissue engineering, in which cells form ex vivo after aggregation
of their natural extracellular matrix has occurred.21–23 A discussion of all
the topics is beyond the scope of this chapter. Therefore, we will focus on
the last two approaches, which involve the growth of real tissues in vitro.
13.1.3 Treating Disease Through Tissue Engineering
In the short time since the initiation of tissue engineering programs,
immense progress has been made. In principle, all diseases associated
with the failure of tissue functions are currently being addressed. Many
of the tissues, generated in vitro for the replacement of cartilage,
353Tissue Engineering
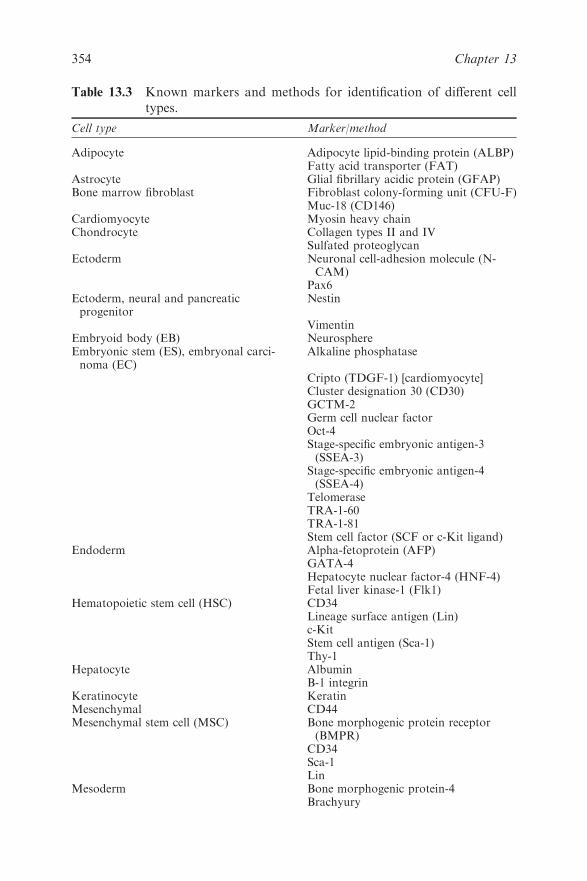
Table 13.3 Known markers and methods for identification of different cell
types.
Cell type Marker/method
Adipocyte Adipocyte lipid-binding protein (ALBP)Fatty acid transporter (FAT)
Astrocyte Glial fibrillary acidic protein (GFAP)Bone marrow fibroblast Fibroblast colony-forming unit (CFU-F)
Muc-18 (CD146)Cardiomyocyte Myosin heavy chainChondrocyte Collagen types II and IV
Sulfated proteoglycanEctoderm Neuronal cell-adhesion molecule (N-
CAM)Pax6
Ectoderm, neural and pancreaticprogenitor
Nestin
VimentinEmbryoid body (EB) NeurosphereEmbryonic stem (ES), embryonal carci-noma (EC)
Alkaline phosphatase
Cripto (TDGF-1) [cardiomyocyte]Cluster designation 30 (CD30)GCTM-2Germ cell nuclear factorOct-4Stage-specific embryonic antigen-3(SSEA-3)
Stage-specific embryonic antigen-4(SSEA-4)
TelomeraseTRA-1-60TRA-1-81Stem cell factor (SCF or c-Kit ligand)
Endoderm Alpha-fetoprotein (AFP)GATA-4Hepatocyte nuclear factor-4 (HNF-4)Fetal liver kinase-1 (Flk1)
Hematopoietic stem cell (HSC) CD34Lineage surface antigen (Lin)c-KitStem cell antigen (Sca-1)Thy-1
Hepatocyte AlbuminB-1 integrin
Keratinocyte KeratinMesenchymal CD44Mesenchymal stem cell (MSC) Bone morphogenic protein receptor
(BMPR)CD34Sca-1Lin
Mesoderm Bone morphogenic protein-4Brachyury
354 Chapter 13

articulation, heart, liver and pancreatic islets, have already undergone
clinical tests. Cartilage has already reached the stage of clinical appli-
cation24 due to the robustness and phenotypic stability of the cells and
also the fact that cartilage and bone tissues can be grown in vitro with
relative ease. These tissues do not require strong vascularization – still a
major challenge in tissue engineering – since there is a sufficient diffusion
of nutrients and oxygen through the scaffolds used for this type of cell.
Several tests have been conducted with three-dimensional hyaline
cartilage to remedy articular damage or abrasions when other treat-
ments fail (e.g. chondroitin sulfate (Chondrosulf)).25 Other tissues,
such as heart valves and heart-muscle tissues, have also been produced
in vitro.26,27 However, they have shown poor integration after
transplantation into the organ and have not reliably maintained their
function. Researchers and medics are working on a cure for liver mal-
function (liver cirrhosis and fibrosis), induced by either alcohol abuse or
viral infections such as hepatitis. Although the liver can regenerate itself,
Table 13.3 (Continued ).
Cell type Marker/method
Myoblast MyoDPax7
Neural stem cell NestinCD133
Neuron Microtubule-associated protein–2(MAP–2)
Oligodendrocyte Myelin basic protein (MPB)O4O1
Osteoblast Bone-specific alkaline phosphatase(BAP)
HydroxyapatiteOsteocalcin (OC)
Pancreatic islet GlucagonInsulinInsulin-promoting factor-1 (PDX-1)Pancreatic polypeptideSomatostatin
Pancreatic progenitor NestinSkeletal myocyte Myogenin
MR4Myosin light chain
Skeletal muscle Smooth muscle cell-specific myosin heavychain
Vascular endothelial cell cadherinWhite blood cell (WBC) Stro-1 antigen
CD4CD8
355Tissue Engineering
it can also become so weakened that transplantation is the only solution.
To overcome the perpetual shortage of donor organs, an attempt has
been made to propagate hepatocytes in vitro. However, only the cul-
turing of these cells as scaffold-free microtissues or on three-dimensional
scaffolds that mimic the natural extracellular matrix of the liver has
been successful; growing hepatocytes as monolayers changes their
phenotype and results in the loss of their natural function.23 In addition,
research into the generation of pancreatic islet tissues to combat dia-
betes, the main cause of hormone dysfunction in developed countries, is
ongoing.28,29
It is not possible here to list all the organs that are currently being
reconstructed in laboratories. We have, therefore, concentrated on the
most important diseases, for which a clinical therapy is standard or soon
will be. Although researchers have made great advances in the engi-
neering of tissues with simple structures (e.g. cartilage and liver), many
tissues do not consist of a single cell type but rather a specific archi-
tecture of many cell types that enables them to perform their tasks, as is
the case, for example, with the kidney, heart and skin. Hence it is very
important to understand the structure and cellular composition of
native tissue in order to reconstruct them for therapeutic applications.
13.2 CELL TYPES
In recent years, in-depth research has been performed to identify the
cells responsible for tissue-/organ-specific functions. Four classes of
(stem)-cell variants can be defined, namely (i) embryonic stem cells
(ESC), which are sub-divided into totipotent early embryonic stem
cells (eESC) and pluripotent blastocyst embryonic stem cells (bESC),
(ii) multipotent umbilical cord stem cells (uCSC), (iii) multipotent adult
stem cells (ASC) and (iv) differentiated cells (DC). Each of these variants
possess advantages and disadvantages.
13.2.1 Embryonic Stem Cells
For over 20 years, researchers have been able routinely to extract and
cultivate mouse embryonic stem cells.30 This cultivation expertise has
also permitted the isolation and cultivation of human embryonic stem
cell lineages.31 Embryonic stem cells are non-specialized cells which are
found in the inner cell mass of 7–30-day-old blastocysts or embryos.
At this stage of development, the three main cell lineages of ectoderm,
mesoderm and endoderm have not yet formed. Thus, embryonic stem
cells are pluripotent and are able to differentiate into every cell type of a
356 Chapter 13
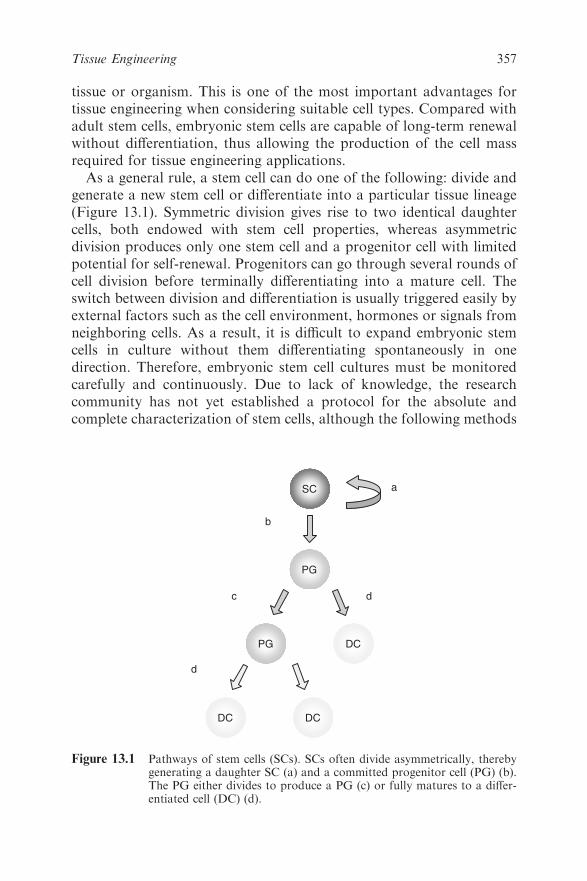
tissue or organism. This is one of the most important advantages for
tissue engineering when considering suitable cell types. Compared with
adult stem cells, embryonic stem cells are capable of long-term renewal
without differentiation, thus allowing the production of the cell mass
required for tissue engineering applications.
As a general rule, a stem cell can do one of the following: divide and
generate a new stem cell or differentiate into a particular tissue lineage
(Figure 13.1). Symmetric division gives rise to two identical daughter
cells, both endowed with stem cell properties, whereas asymmetric
division produces only one stem cell and a progenitor cell with limited
potential for self-renewal. Progenitors can go through several rounds of
cell division before terminally differentiating into a mature cell. The
switch between division and differentiation is usually triggered easily by
external factors such as the cell environment, hormones or signals from
neighboring cells. As a result, it is difficult to expand embryonic stem
cells in culture without them differentiating spontaneously in one
direction. Therefore, embryonic stem cell cultures must be monitored
carefully and continuously. Due to lack of knowledge, the research
community has not yet established a protocol for the absolute and
complete characterization of stem cells, although the following methods
SC
PG
DCPG
DC DC
a
b
c
d
d
Figure 13.1 Pathways of stem cells (SCs). SCs often divide asymmetrically, therebygenerating a daughter SC (a) and a committed progenitor cell (PG) (b).The PG either divides to produce a PG (c) or fully matures to a differ-entiated cell (DC) (d).
357Tissue Engineering
are commonly used simultaneously to ensure that the cells display the
required stem cell traits:9,32
� visual characterization by microscopy;
� formation of embryoid bodies;
� analysis of surface markers, such as the stage-specific embryonic
antigen (SSEA)-3, SSEA-4, TRA-l-60, TRA-1-81 and alkaline
phosphatase;
� determination of whether Oct-4 – a transcription factor typical of
undifferentiated cells is expressed and whether cells display high
telomerase activity;
� long-term cultivation to ensure long-term self-renewal, a special
characteristic of embryonic stem cells;
� microscopic analysis of chromosome damage;
� determination of whether sub-culturing is possible after freezing/
thawing;
� differentiation assays leading to a specific cell type;
� proteomic analysis.33
Using these methods, researchers are in a position to vary and
improve culture techniques in order to study the fundamental properties
of embryonic stem cells, including the precise determination of why
embryonic stem cells are not specialized, how they renew themselves
over many years and which factors cause stem cells to undergo differ-
entiation. The determination of these signals and the chronology of their
occurrence are of prime importance for the production of the desired
phenotype for tissue reconstruction. To trigger differentiation, the sur-
face of the culture dish, the scaffold, the chemical composition of the
culture medium (Figure 13.2) or the genetic expression pattern of the
cells can all be manipulated.
Embryonic stem cells are the only naturally occurring cells that are
able to divide frequently enough without manipulation to generate a
sufficient number of cells for therapeutic application. Were it not for
ethical concerns, restrictions or bans and also the risk of developing
teratomas or rejection by the patient, these cells would be the optimal
choice for tissue engineering. Furthermore, we still possess only a
rudimentary understanding of most of the differentiation pathways and
the culture conditions required to achieve precise lineage control of stem
cells. As a result, scientists often obtain differentiated cells, which have a
phenotypic resemblance to the cells of a certain tissue but which express
not only the usual markers, but also tissue-atypical proteins and do not
fulfill all the functions of the native cells in a tissue.
358 Chapter 13
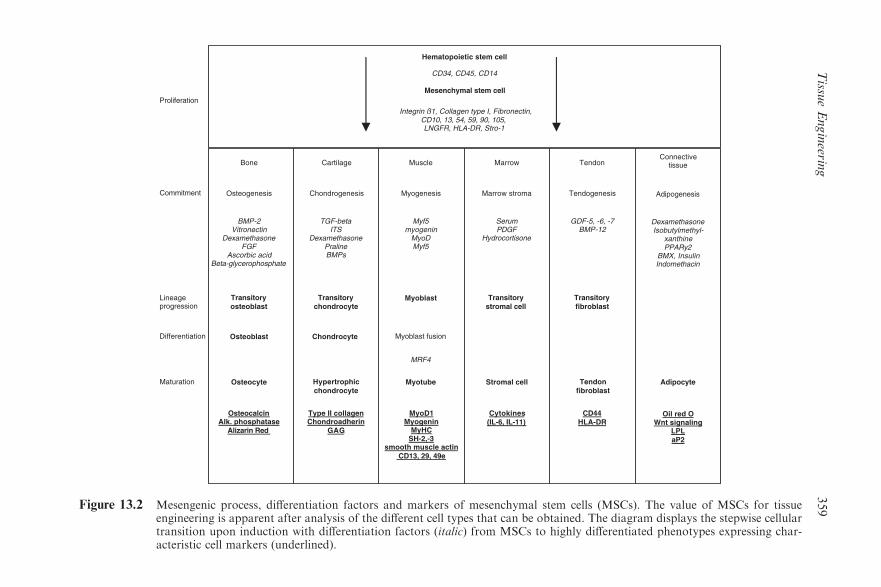
Bone Cartilage Muscle Marrow TendonConnective
tissue
Proliferation
Commitment
Lineageprogression
Differentiation
Maturation
Osteogenesis Chondrogenesis Myogenesis Marrow stroma Tendogenesis Adipogenesis
Transitory
osteoblast
Transitory
chondrocyteMyoblast Transitory
stromal cell
Transitory
fibroblast
Osteoblast Chondrocyte Myoblast fusion
Osteocyte Hypertrophic
chondrocyteMyotube Stromal cell Tendon
fibroblast Adipocyte
BMP-2Vitronectin
Dexamethasone FGF
Ascorbic acidBeta-glycerophosphate
OsteocalcinAlk. phosphatase
Alizarin Red
TGF-beta ITS
Dexamethasone Praline BMPs
Myf5myogenin
MyoDMyf5
SerumPDGF
Hydrocortisone
GDF-5, -6, -7BMP-12
Dexamethasone Isobutylmethyl-
xanthinePPARy2
BMX, InsulinIndomethacin
Type II collagenChondroadherin
GAG
Integrin ß1, Collagen type I, Fibronectin, CD10, 13, 54, 59, 90, 105, LNGFR, HLA-DR, Stro-1
MyoD1Myogenin
MyHCSH-2,-3
smooth muscle actin
CD13, 29, 49e
Cytokines
(IL-6, IL-11)
CD44
HLA-DROil red O
Wnt signalingLPL
aP2
MRF4
CD34, CD45, CD14
Mesenchymal stem cell
Hematopoietic stem cell
Figure 13.2 Mesengenic process, differentiation factors and markers of mesenchymal stem cells (MSCs). The value of MSCs for tissueengineering is apparent after analysis of the different cell types that can be obtained. The diagram displays the stepwise cellulartransition upon induction with differentiation factors (italic) from MSCs to highly differentiated phenotypes expressing char-acteristic cell markers (underlined).
359
Tissu
eEngineerin
g
13.2.2 Adult Stem Cells
Adult stem cells, also referred to as somatic stem cells, represent an ethi-
cally acceptable alternative to embryonic stem cells in that they do not
require harvesting of embryos. These cells constitute a very small popu-
lation of undifferentiated cells that can be found amongst the differentiated
cells of an organ. They renew themselves and differentiate into the major
specialized cells of the organ in which they reside. Their primary tasks are
to maintain the proper functioning and repair of the tissue. According to
the literature, adult stem cells have been found in the brain, skin, bone
marrow, peripheral blood, blood vessels, skeletal muscle and liver. Some
of the most important and best characterized adult stem cells include:
� Brain: neural stem cells can develop into four major cell types: (i)
neurons, (ii) astrocytes, (iii) oligodendrocytes and (iv) glial cells.34,35
� Bone marrow: containing two types of stem cells – first, the hema-
topoietic stem cells that give rise to all types of blood cells, i.e. (i)
red blood cells, (ii) B-lymphocytes, (iii) T-lymphocytes, (iv) natural
killer cells, (v) neutrophils, (vi) basophils, (vii) eosinophils, (viii)
monocytes, (ix) macrophages and (x) platelets; and second, the
mesenchymal stem cells (bone marrow stromal cells) which give rise
to different cell types, such as (i) osteocytes (bone cells), (ii) chon-
drocytes (cartilage cells), (iii) adipocytes and (iv) some types of
connective tissue cells (Figure 13.2).
� Digestive tract: epithelial stem cells differentiate into several cell
types such as (i) absorptive cells, (ii) goblet cells, (iii) paneth cells
and (iv) entero-endocrine cells.36,37
� Skin: epidermal stem cells can be found in the basal layer of the
epidermis. These stem cells give rise to keratinocytes. Follicular
stem cells give rise to both the hair follicle and to the epidermis at
the base of hair follicles.38,39
Unfortunately, not all essential human organs contain adult stem cells.
As in the case of the heart, the stem cells may not divide or differentiate
rapidly enough if the organ has been damaged.40–42 Most adult stem cells
are present only in small numbers and are, therefore, difficult to extract
and separate from other cells of the organs. In contrast to embryonic stem
cells, adult stem cells have lost their ability to differentiate naturally into
all the tissues of an organism. However, recent publications indicate that
adult stem cells exhibit plasticity or undergo transdifferentiation under
certain conditions.43–45 The discovery of plasticity among adult stem cells
is very important for tissue engineering, as it permits the generation of
360 Chapter 13
new types of cells through transdifferentiation.4 Another advantage of
adult stem cells is that it may be possible to use the patient’s own cells, to
expand them, to generate the desired tissues in vitro and to transplant the
tissues back into the patient, thereby avoiding the risk of immunological
rejection of the transplant. Therefore, adult stem cells, treated to differ-
entiate into specific cell types, could be a renewable source of cells and
tissues for the efficient treatment of diseases such as cystic fibrosis, renal
failure, stroke, burns, heart disease, diabetes and arthritis.
13.2.3 Mature Cells
In the human body, there are approximately 300 different types of dif-
ferentiated cells, each with its own specific function. During differentiation,
these cells lose the ability to divide and, by adapting to a specific task, can
no longer proliferate. Since cell therapy and tissue engineering rely on the
implantation of considerable quantities of well-characterized autologous
cells that display defined properties, differentiated cells must be manipu-
lated so that they multiply in vitro. Taking primary cells from the healthy
tissues of choice is mandatory for therapeutic applications. It is unim-
aginable that immortalized cells could be reintroduced into humans, as
they could develop into a cancer. There are different methods for re-
initiating the cell division of differentiated cells. One way is to modify the
cells genetically and conditionally immortalize them46 to proliferate for a
limited period of time without inducing epigenetic changes or changes in
the cell properties.46,47 Ideal candidate transgenes to control conditional
expansion of therapeutic cell populations could be Notch48 or antisense
p27Kip1.49 However, since these strategies enable proliferation induction in
a limited number of cell lines viral genes, such as the simian virus large T
antigen, the Herpes virus-16 E6/7 or the ubiquitous telomerase reverse
transcriptase, are sometimes used generically to trigger proliferation.50,51
In any case, proliferation-inducing transgenes must be tightly and timely
controlled using either state-of-the-art transcription or translation control
modalities52–54 or site-specific recombination technology to excise trans-
gene expression loci prior to implantation.55–58
Another way to trigger the proliferation of differentiated cells is to
reprogram them under controlled conditions. The phenotypic conver-
sion of a cell or a tissue type into another cell or tissue is referred to as
‘metaplasia’, with many examples prevalent in humans.59 Metaplasia
frequently begins with the de-differentiation of the cell, whereby endo-
genous proliferation genes are turned on and cell mass can be generated
for tissue engineering. This can be achieved either by adding extracts of
pluripotent cells to the media60–62 or by implanting the nucleus of the
361Tissue Engineering
cell in an ovum, from which the nucleus has been removed.63,64 How-
ever, a drawback of this approach is that the de-differentiated cells must
differentiate correctly after the proliferation step.
An alternative to obtaining the desired cell type is trans-differentia-
tion, which is a specific form of metaplasia in which the phenotype of a
mature cell is converted into another fully differentiated cell type.
Mammalian cells have been trans-differentiated by co-culture, by
modification of cell culture conditions or by genetic modification of the
cells. Hu et al. reported the transdifferentiation of myoblasts into mature
adipocytes by ectopic expression of the adipogenic transcription factors
PPAR gamma and C/EBPa under conditions conductive to adipogen-
esis.65 Schiller et al. showed that inhibition of gap-junctional commu-
nication between osteoblasts results in adipocyte formation as well.66
Furthermore, it has been shown that pancreatic cells can be converted
into hepatocytes by the induction of hepatic transcription factors using
dexamethasone67 and that myoblast transdifferentiation can be con-
trolled precisely by introducing differentiation determinants such as
MyoD and msx1.4 The microenvironment of the cells, including the
extracellular matrix, the surrounding cells, the local milieu and growth
or differentiation factors, plays a crucial role in redirecting cell fate.
Injection of endothelial cells into damaged heart tissue has led to their
trans-differentiation into beating cardiomyocytes.68 By the same means,
pancreatic epithelial cells have also trans-differentiated successfully into
hepatocytes.69 Trans-differentiation plays an essential role in tissue
engineering since large amounts of certain cell types, such as adipocytes,
can be grafted from patients with reintroduction of the tissue into the
body not resulting in immunogenic rejection.
13.3 EXTRACELLULAR MATRIX
13.3.1 Biological Extracellular Matrices
The second important component in tissue engineering is the extra-
cellular matrix (ECM). The ECM represents the secreted product of the
resident cells of each tissue and organ. Therefore, the ECM of each
tissue and organ has a unique structure and composition, providing
structural stability for the tissue. It includes information about the
position and alignment of the different cell types and ensures that the
relevant growth factors are provided at the right level, time and place to
coordinate organ morphogenesis and repair. Although all the cells in an
organism are embedded in ECM, sufficient amounts of ECM for use in
tissue engineering can only be extracted from a few tissues such as skin,
362 Chapter 13
the pericardium, small intestine, urinary bladder, liver and Achilles
tendon.70,71 ECM is by no means static and uniform but is rather a
structure that adapts continuously to the requirements of the tissue. The
composition and structure of the ECM are directly coupled to its
location within the organ, the function of the tissue and the age of the
individual.72–75 For example, kidney has very little ECM compared with
its cellular component, whereas tissue that is primarily structural, such
as tendons and ligaments, displays large amounts and a differential
composition of ECM.76,77 ECM is composed mainly of collagen, of
which more than 20 types have been identified thus far.78 The most
common is type 1 collagen that has been highly conserved during the
course of evolution. Thus, allogenic and xenogenic sources of type 1
collagen are both relevant for tissue engineering, making collagen the
most widely used biologic scaffold in therapeutic interventions. The 12
subtypes of collagen are responsible for the distinctive biological activity
of the ECM. In combination with laminin they form a three-dimensional
mesh-like structure that is adapted to the specific function of a tissue and
provides optimal strength, rigidity or plasticity.79 Laminin, the second
most abundant protein in ECM, is a complex trimeric, cross-linked
adhesion protein with separate binding domains for collagen IV,
heparin, heparin sulfate and direct cell binding.80 Laminin exists in
different isoforms, depending on the particular mixture of the peptide
chains81,82 and plays an important role in the vascularization and
maintenance of vascular structures.83,84 Since vascularization of scaf-
folds for tissue repair is the most rate-limiting step, laminin is considered
to be an important component of cell-friendly scaffold material.85
A very important peptide motif found in most proteins which form the
ECM (e.g. the glycoproteins fibronectin or vitronectin) is the arginine,
glycine and asparaginic acid sequence (RGD).86,87 This motif binds to
cellular adhesion molecules (CAM), known as integrins, thereby
anchoring the cells mechanically in the ECM. The different RGD
sequences adopt different conformations in the different matrix proteins,
so that these sequences are recognized by different integrin subtypes
expressed by specific cell types which favors a tissue-specific cellular
organization. Furthermore, the generation of focal adhesions generates
cell responses such as the polarization of the cells, the production of
survival signals and factors for the remodulation of the ECM. Therefore,
synthetic scaffolds produced for tissue engineering are often modified
with special RGD–peptide sequences to render them biocompatible, to
provide better integration and to control the setup of the tissue.88–90
Important non-protein components of ECM are the glycosaminogly-
cans (GAGs), which do not have a structural function. However, they
363Tissue Engineering
substantially modulate the gel properties of the ECM by retaining water
and binding growth factors and cytokines. Also, their ability to mediate
ECM–cell interactions makes heparin-rich GAGs a valuable component
for tissue engineering-compatible scaffolds.91 In addition to structural
proteins, the ECM also contains trace amounts of a variety of bioactive
proteins which functionalize the bio-scaffold. Non-limiting examples
include vascular endothelial growth factor, basic fibroblast growth factor,
epidermal growth factor, hepatocyte growth factor, keratinocyte growth
factor, transforming growth factor beta and platelet-derived growth
factor. Due to the presence of such growth factor cocktails, natural ECM
grafts are often used to functionalize synthetic scaffolds,92 which are
otherwise biologically inert and fail to degrade and promote infiltration
of cells from neighboring tissues. In contrast, the use of unmodified, de-
cellularized ECM promotes rapid cell infiltration, scaffold degradation,
deposition of neo-matrix and tissue organization with a minimum of scar
tissue.93 Today, over one million patients have been treated successfully
with xenogeneic ECM scaffolds94 to heal skin lesions,95 promote vascular
reconstruction96,97 and re-establish the urinary tract,98–100 the intes-
tine,101 diaphragm,102 rotator cuff103 and muscle structures.104
The complex three-dimensional structure and composition of ECM
have yet to be fully elucidated, exemplifying how difficult it is to design
ECM-containing scaffold mimetics. Bottom-up approaches to functio-
nalize synthetic scaffolds with well-characterized components (e.g.
laminin, fibronectin, hyaluronic acid, vascular endothelial growth fac-
tors)105 have resulted in some success for very specialized applications,
but there is still a long way to go until fully functional ECM mimetics
can be used as synthetic scaffolds.
13.3.2 Artificial Extracellular Matrices
It will be extremely challenging to reproduce exactly a biological
extracellular matrix through artificial means in the coming decades. To
obtain a scaffold resembling biological ECM, many researchers cur-
rently use Matrigel, a cocktail of substances extracted from natural
ECM.106 The advantage of Matrigel is that it is a liquid at temperatures
below 4 1C, where it can be mixed with desired cell populations to result
in a pre-seeded ready-to-implant scaffold upon gelation at physiological
temperatures. Despite the superior attributes of ECM, it is sometimes
advised to use artificial scaffolds for tissue engineering to achieve
reproducibility and control of the individual parameters.
A protocol for the manufacture of a so-called ideal scaffold has yet to
be developed. Therefore, special attention must be paid to the essential
364 Chapter 13
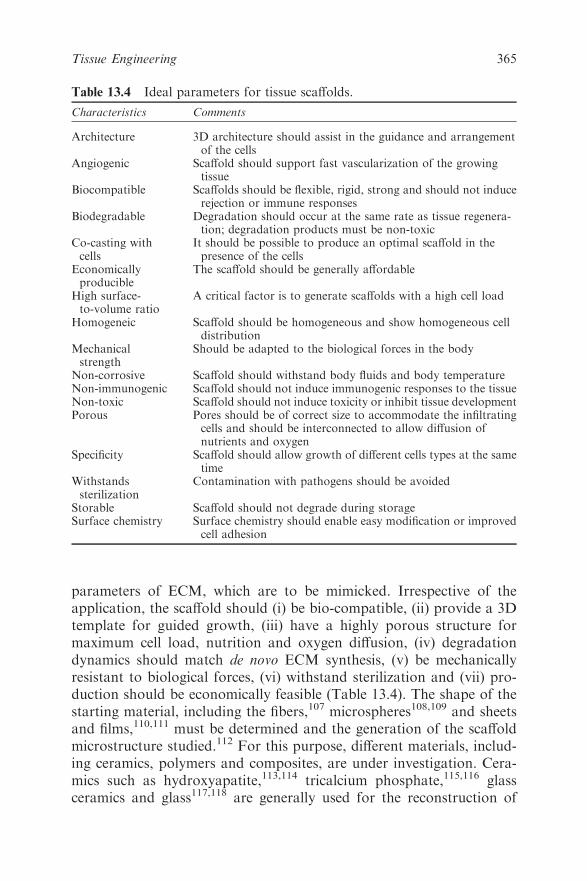
parameters of ECM, which are to be mimicked. Irrespective of the
application, the scaffold should (i) be bio-compatible, (ii) provide a 3D
template for guided growth, (iii) have a highly porous structure for
maximum cell load, nutrition and oxygen diffusion, (iv) degradation
dynamics should match de novo ECM synthesis, (v) be mechanically
resistant to biological forces, (vi) withstand sterilization and (vii) pro-
duction should be economically feasible (Table 13.4). The shape of the
starting material, including the fibers,107 microspheres108,109 and sheets
and films,110,111 must be determined and the generation of the scaffold
microstructure studied.112 For this purpose, different materials, includ-
ing ceramics, polymers and composites, are under investigation. Cera-
mics such as hydroxyapatite,113,114 tricalcium phosphate,115,116 glass
ceramics and glass117,118 are generally used for the reconstruction of
Table 13.4 Ideal parameters for tissue scaffolds.
Characteristics Comments
Architecture 3D architecture should assist in the guidance and arrangementof the cells
Angiogenic Scaffold should support fast vascularization of the growingtissue
Biocompatible Scaffolds should be flexible, rigid, strong and should not inducerejection or immune responses
Biodegradable Degradation should occur at the same rate as tissue regenera-tion; degradation products must be non-toxic
Co-casting withcells
It should be possible to produce an optimal scaffold in thepresence of the cells
Economicallyproducible
The scaffold should be generally affordable
High surface-to-volume ratio
A critical factor is to generate scaffolds with a high cell load
Homogeneic Scaffold should be homogeneous and show homogeneous celldistribution
Mechanicalstrength
Should be adapted to the biological forces in the body
Non-corrosive Scaffold should withstand body fluids and body temperatureNon-immunogenic Scaffold should not induce immunogenic responses to the tissueNon-toxic Scaffold should not induce toxicity or inhibit tissue developmentPorous Pores should be of correct size to accommodate the infiltrating
cells and should be interconnected to allow diffusion ofnutrients and oxygen
Specificity Scaffold should allow growth of different cells types at the sametime
Withstandssterilization
Contamination with pathogens should be avoided
Storable Scaffold should not degrade during storageSurface chemistry Surface chemistry should enable easy modification or improved
cell adhesion
365Tissue Engineering
hard tissue, whereas polymers are implemented for the formation of soft
tissues.119,120 Polymers are usually the material of choice as their
properties can be modulated with ease. Gelatin,121 elastin,19,122 col-
lagen,123,124 fibrin glue125,126 and hyaluronic acid,80–82 all of biological
origin, are the most important polymers for production of artificial
scaffolds. Synthetic polymers are also available including poly(lactic
acid), poly(glycolic acid), polycaprolactone poly(lactic-co-glycolic acid),
polyethylene, poly(ethylene glycol), poly(ethylene oxide)-block-poly-
caprolactone, poly(ethylene terephthalate), polytetrafluoroethylene and
polyurethane.127 Both degradable and non-degradable synthetic poly-
mers exist. Although degradable polymers are usually selected, such as
the most widely used poly(lactic acid), the degradation products must be
either biologically inert or easily metabolized, but above all non-toxic.
As a result of refining the production process for scaffold material, the
spectrum and quality of scaffold types have increased considerably.
Latest-generation scaffolds have average pore sizes ranging from a few
nanometers128 to several micrometers.129 In many cases the pores are
interconnected to allow the transport of nutrients and metabolic
waste124 and to provide a high surface-to-mass ratio for the promotion
of cell differentiation and proliferation. These scaffolds are produced by
various techniques, including (i) electrospinning, (ii) phase separation,
(iii) foaming processes, (iv) microsphere sintering, (v) solid free-form
fabrication, (vi) shape deposition manufacturing, (vii) fused deposition
modeling, (viii) non-fused liquid deposition modeling, (ix) 3D printing,
(x) selective laser sintering, (xi) stereo-lithographic processes, (xii)
leaching processes and (xiii) self-assembly.130
Electrospinning is one of the most commonly used techniques to
develop scaffolds for tissue engineering, because it is possible to modu-
late the fiber size from the nanometer to the micrometer scale and
to guide the arrangement of fibers in the non-woven 3D fiber
network.131,132 The process consists of forcing a polymer melt through
an electrically charged nozzle (10–20 kV), thereby forming a thin poly-
mer string. The solvent quickly evaporates en route to the collector,
which can be a simple grounded plate for random orientation of the
fibers or a drum for their parallel alignment.132 Different processing
parameters such as the polymer or solvent chosen, viscosity, surface
tension, the charge applied, the polymer mass flux through the nozzle,
the processing temperature and the humidity, all control the diameter
and the ultrastructure of the generated fibers.133 Another advantage of
electrospinning is that fibers of different polymers can be co-deposited
into a multilayered structure.134 Such scaffolds display a range of
favorable properties for cell attachment (e.g. a wide range of pore sizes,
366 Chapter 13
high porosity and parallel fiber orientation).135,136 Yang et al. showed
that cells tend to grow in the direction of the fiber and that spatial
orientation of the fibers therefore plays a key role in guiding cell growth
and the subsequent organization of the tissues.137
Phase separation is another valuable and cost-effective process to
form scaffolds for tissue engineering. The polymer is usually dissolved in
a solvent that is brought into contact with a non-solvent. During the
casting process, the solvent diffuses out and the non-solvent diffuses into
the polymer solution until the polymer becomes unstable and pre-
cipitates, thereby forming the final scaffold after a only a few hundred
milliseconds.138,139 The pore size of such scaffolds can be varied from
nanometers to several micrometers140 and can be extended by other
processes such as salt leaching.139 These scaffolds are ideal for the
engineering of special tissues such as skin and bone, the pore size of
which must be in the range 0.04–0.4mm.141
Self-assembly systems are gaining in importance in the development
of artificial scaffolds.125,142 They utilize a bottom-up approach, whereby
molecules undergo self-association to form a higher order structure
without external manipulation. Special attention should be paid to the
monomer, which must be well designed to induce chemical reactivity
and structural compatibility. Given these prerequisites, various building
blocks have been used, such as nanofiber scaffolds,143 peptides144,145 and
dipolar molecules.146 Although the design of scaffolds by molecular self-
assembly is extremely challenging, it is a promising process that can be
performed under physiological conditions which allow pre-seeding of
the scaffolds with desired cell populations.
The choice of a specific scaffold for tissue engineering is usually based
on the type of tissue to be engineered. Several researchers have provided
specific information concerning each type of scaffold and their appli-
cation.132,147–151 However, this information should be treated with
caution because the described scaffolds were, in part, developed by
material scientists and chemists and have not been tested in depth with
cell cultures. For example, foaming processes may result in inclusion
of air bubbles which compromise cell colonization,141 salt-leaching
processes do not completely remove entrapped salt crystals128 and
sterilization radically changes the microstructure of polymer scaffolds.
In conclusion, only successful testing in in vivo models will finally
prove whether a scaffold is suitable for tissue engineering or not. Despite
all the obstacles that scientists have encountered in producing natural
or synthetic scaffolds for tissue engineering, many scaffolds have
already been approved by the FDA and are being used in a clinical
setting (Table 13.5).
367Tissue Engineering
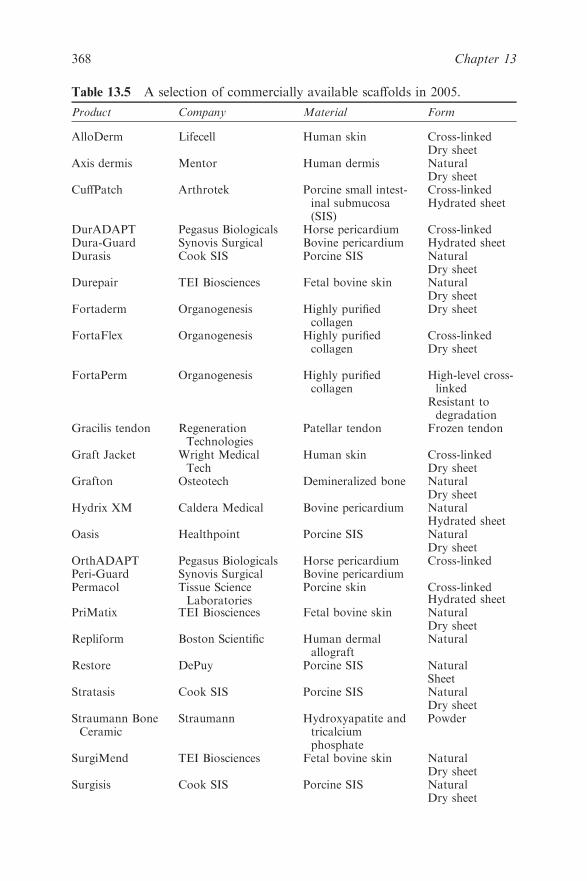
Table 13.5 A selection of commercially available scaffolds in 2005.
Product Company Material Form
AlloDerm Lifecell Human skin Cross-linkedDry sheet
Axis dermis Mentor Human dermis NaturalDry sheet
CuffPatch Arthrotek Porcine small intest-inal submucosa(SIS)
Cross-linkedHydrated sheet
DurADAPT Pegasus Biologicals Horse pericardium Cross-linkedDura-Guard Synovis Surgical Bovine pericardium Hydrated sheetDurasis Cook SIS Porcine SIS Natural
Dry sheetDurepair TEI Biosciences Fetal bovine skin Natural
Dry sheetFortaderm Organogenesis Highly purified
collagenDry sheet
FortaFlex Organogenesis Highly purifiedcollagen
Cross-linkedDry sheet
FortaPerm Organogenesis Highly purifiedcollagen
High-level cross-linked
Resistant todegradation
Gracilis tendon RegenerationTechnologies
Patellar tendon Frozen tendon
Graft Jacket Wright MedicalTech
Human skin Cross-linkedDry sheet
Grafton Osteotech Demineralized bone NaturalDry sheet
Hydrix XM Caldera Medical Bovine pericardium NaturalHydrated sheet
Oasis Healthpoint Porcine SIS NaturalDry sheet
OrthADAPT Pegasus Biologicals Horse pericardium Cross-linkedPeri-Guard Synovis Surgical Bovine pericardiumPermacol Tissue Science
LaboratoriesPorcine skin Cross-linked
Hydrated sheetPriMatix TEI Biosciences Fetal bovine skin Natural
Dry sheetRepliform Boston Scientific Human dermal
allograftNatural
Restore DePuy Porcine SIS NaturalSheet
Stratasis Cook SIS Porcine SIS NaturalDry sheet
Straumann BoneCeramic
Straumann Hydroxyapatite andtricalciumphosphate
Powder
SurgiMend TEI Biosciences Fetal bovine skin NaturalDry sheet
Surgisis Cook SIS Porcine SIS NaturalDry sheet
368 Chapter 13
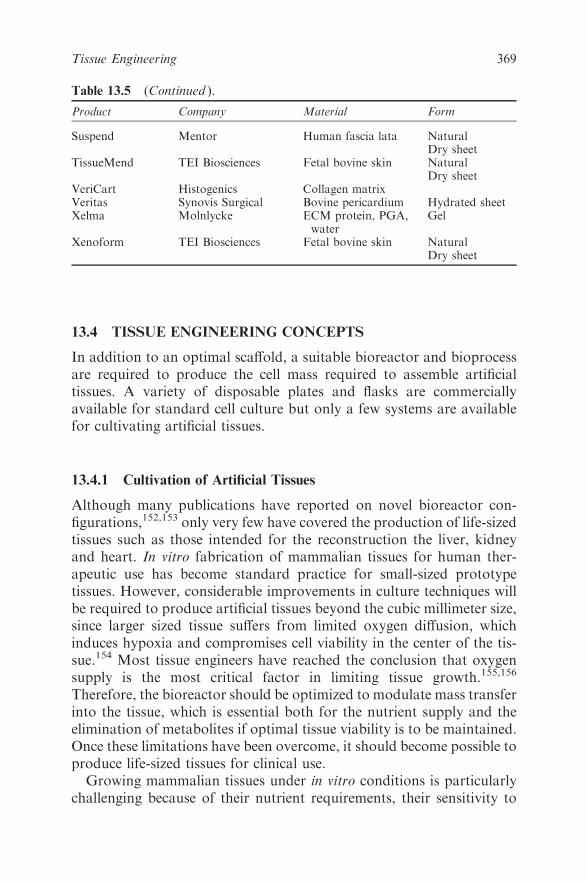
13.4 TISSUE ENGINEERING CONCEPTS
In addition to an optimal scaffold, a suitable bioreactor and bioprocess
are required to produce the cell mass required to assemble artificial
tissues. A variety of disposable plates and flasks are commercially
available for standard cell culture but only a few systems are available
for cultivating artificial tissues.
13.4.1 Cultivation of Artificial Tissues
Although many publications have reported on novel bioreactor con-
figurations,152,153 only very few have covered the production of life-sized
tissues such as those intended for the reconstruction the liver, kidney
and heart. In vitro fabrication of mammalian tissues for human ther-
apeutic use has become standard practice for small-sized prototype
tissues. However, considerable improvements in culture techniques will
be required to produce artificial tissues beyond the cubic millimeter size,
since larger sized tissue suffers from limited oxygen diffusion, which
induces hypoxia and compromises cell viability in the center of the tis-
sue.154 Most tissue engineers have reached the conclusion that oxygen
supply is the most critical factor in limiting tissue growth.155,156
Therefore, the bioreactor should be optimized to modulate mass transfer
into the tissue, which is essential both for the nutrient supply and the
elimination of metabolites if optimal tissue viability is to be maintained.
Once these limitations have been overcome, it should become possible to
produce life-sized tissues for clinical use.
Growing mammalian tissues under in vitro conditions is particularly
challenging because of their nutrient requirements, their sensitivity to
Table 13.5 (Continued ).
Product Company Material Form
Suspend Mentor Human fascia lata NaturalDry sheet
TissueMend TEI Biosciences Fetal bovine skin NaturalDry sheet
VeriCart Histogenics Collagen matrixVeritas Synovis Surgical Bovine pericardium Hydrated sheetXelma Molnlycke ECM protein, PGA,
waterGel
Xenoform TEI Biosciences Fetal bovine skin NaturalDry sheet
369Tissue Engineering
metabolic waste and their susceptibility to shear stresses.157 The required
nutrients and growth parameters and the cells’ susceptibility to stress
vary considerably, depending on the type of tissue.158,159 These
differences must be accounted for when designing a bioreactor and a
bioprocess for a particular type of tissue.
Here we present several cultivation techniques that are currently being
applied in tissue engineering. When scaffold design is the primary
research interest, it is best to cultivate the artificial tissues in a Petri dish.
The scaffold is placed in the dish, covered with culture medium and the
cells are seeded on to the scaffold where they quickly migrate and attach.
However, the static milieu in the dish may rapidly lead to localized
oxygen limitation and insufficient removal of metabolic waste products
from the tissue. The thickest bone tissue obtained by this method has
been 0.5mm.160 Static culture conditions have always resulted in a shell
of cells around the scaffold with poor migration into the interior of the
scaffold.161,162 Diffusion can be improved by cultivating tissue samples
in medium-containing spinner flasks. Spinner flasks allow constant
mixing of the culture and therefore provide better supply of nutrients
and oxygen to the tissue. Nevertheless, the culture medium still becomes
depleted over time and 50% of it must be exchanged every 3 days.163 For
this kind of bioreactor, the typical mixing rate is 50–80 rpm, a com-
promise between optimal mass transfer and minimal shear stress.163
Using spinner flasks, cartilage tissue has been grown to a thickness of
0.5mm, which is almost five times thicker than isogenic tissues grown
in Petri dishes.158 However, typical cartilage implants used today are
2–5mm thick.158
Although hollow-fiber bioreactors are not suitable for the produc-
tion of implantable tissues, they have been extensively studied for the
design of extracorporeal devices which could provide liver and kidney
function in a dialysis-like therapy.164,165 The hollow-fiber bioreactor
consists of a closed container filled with a cell-containing matrix, into
which a bundle of semi-permeable hollow fibers is inserted. A constant
flow of culture medium through the fiber provides nutrients and elim-
inates metabolic waste products. With this method, the interface-to-
tissue mass ratio is very high and provides a more homogeneous nutrient
supply throughout the tissue. This type of bioreactor more closely
resembles the situation in a vertebrate body, where cells are usually
never more than 200mm away from the next blood vessel. Studies
with hepatocytes cultured in a hollow-fiber bioreactor revealed that, if
the distance between the fibers exceeds 250 mm, then a perpendicular
flow to the fibers is necessary to achieve a sufficient stream of nutrients
to the cells.166
370 Chapter 13
An important recent development in the construction of hollow-fiber
bioreactors is the use of degradable fiber materials. After degradation of
the hollow fibers, the tissue is in principle ready for implantation.167
Poly(D,L-lactide-co-glycolide) fibers maintain their structural integrity
for 4 weeks and degrade homogenously until they disappear completely
by 8 weeks, thereby maintaining the structure of the tissue.167 Although
artificial tissues produced by hollow-fiber bioreactors have not yet been
used in clinical trials, the bioreactor itself is already in clinical use as
cartridges for dialysis/plasma separation. These cartridges contain
50–200 g of primary hepatocytes and are connected for 6–8 h per day in
a typical dialysis setting.17
One of the most commonly applied reactors for the generation of
tissues is the rotating-wall bioreactor. The tissue floats freely in the
chamber and the rotation speed, usually 15–30 rpm, is adjusted so that
the tissue remains in a state of zero gravity. Cartilage tissues up to 5 mm
thick 168 and liver tissues with a thickness of up to 3mm have been
produced.169 Rotating-wall bioreactors have been used to produce many
other tissues, of which the most important has been myocardial
tissues.170,171
Arguably, the best bioreactor system to cultivate artificial tissues
is the perfusion bioreactor, which typically contains a small chamber
through which a flow of fresh and defined medium is pumped at a
constant rate. The scaffold is usually fixed to a porous support in the
middle of the chamber. The flow of medium through the scaffold
enhances cell growth inside the scaffold and provides mechanical sti-
mulation in the form of shear force as the media is forced through the
scaffold.172 A disadvantage of this bioreactor is that the orientation of
the cells follows the direction of the liquid flow. Although alignment of
the cells is desired in tissue engineering, engineers would prefer the
cells to align perpendicular rather than parallel to the liquid flow.173
Perfusion bioreactors are of particular interest for growing tissues
for skin replacement and consist of two chambers, through one of which
is pumped medium optimized for the growth of epithelial cells and
through the other is pumped medium optimized for the growth of
connective tissue. This configuration permits the production of two-
layer skin tissues.174 The perfusion system can even be employed to
simulate biological forces. For instance, Watanabe et al. applied inter-
mittent hydrostatic pressure (0–5MPa) when cultivating cartilage,175
whereas Seidel et al. applied mechanical compression forces.176 Other
perfusion bioreactors with a modified configuration have also been
used for the tissue engineering of skeletal muscle and oesteochondral
composites.
371Tissue Engineering
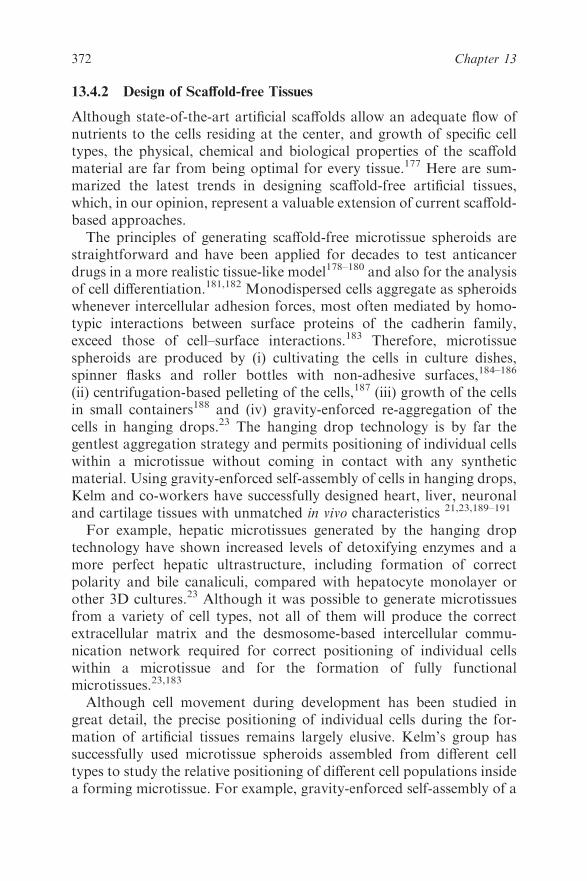
13.4.2 Design of Scaffold-free Tissues
Although state-of-the-art artificial scaffolds allow an adequate flow of
nutrients to the cells residing at the center, and growth of specific cell
types, the physical, chemical and biological properties of the scaffold
material are far from being optimal for every tissue.177 Here are sum-
marized the latest trends in designing scaffold-free artificial tissues,
which, in our opinion, represent a valuable extension of current scaffold-
based approaches.
The principles of generating scaffold-free microtissue spheroids are
straightforward and have been applied for decades to test anticancer
drugs in a more realistic tissue-like model178–180 and also for the analysis
of cell differentiation.181,182 Monodispersed cells aggregate as spheroids
whenever intercellular adhesion forces, most often mediated by homo-
typic interactions between surface proteins of the cadherin family,
exceed those of cell–surface interactions.183 Therefore, microtissue
spheroids are produced by (i) cultivating the cells in culture dishes,
spinner flasks and roller bottles with non-adhesive surfaces,184–186
(ii) centrifugation-based pelleting of the cells,187 (iii) growth of the cells
in small containers188 and (iv) gravity-enforced re-aggregation of the
cells in hanging drops.23 The hanging drop technology is by far the
gentlest aggregation strategy and permits positioning of individual cells
within a microtissue without coming in contact with any synthetic
material. Using gravity-enforced self-assembly of cells in hanging drops,
Kelm and co-workers have successfully designed heart, liver, neuronal
and cartilage tissues with unmatched in vivo characteristics 21,23,189–191
For example, hepatic microtissues generated by the hanging drop
technology have shown increased levels of detoxifying enzymes and a
more perfect hepatic ultrastructure, including formation of correct
polarity and bile canaliculi, compared with hepatocyte monolayer or
other 3D cultures.23 Although it was possible to generate microtissues
from a variety of cell types, not all of them will produce the correct
extracellular matrix and the desmosome-based intercellular commu-
nication network required for correct positioning of individual cells
within a microtissue and for the formation of fully functional
microtissues.23,183
Although cell movement during development has been studied in
great detail, the precise positioning of individual cells during the for-
mation of artificial tissues remains largely elusive. Kelm’s group has
successfully used microtissue spheroids assembled from different cell
types to study the relative positioning of different cell populations inside
a forming microtissue. For example, gravity-enforced self-assembly of a
372 Chapter 13
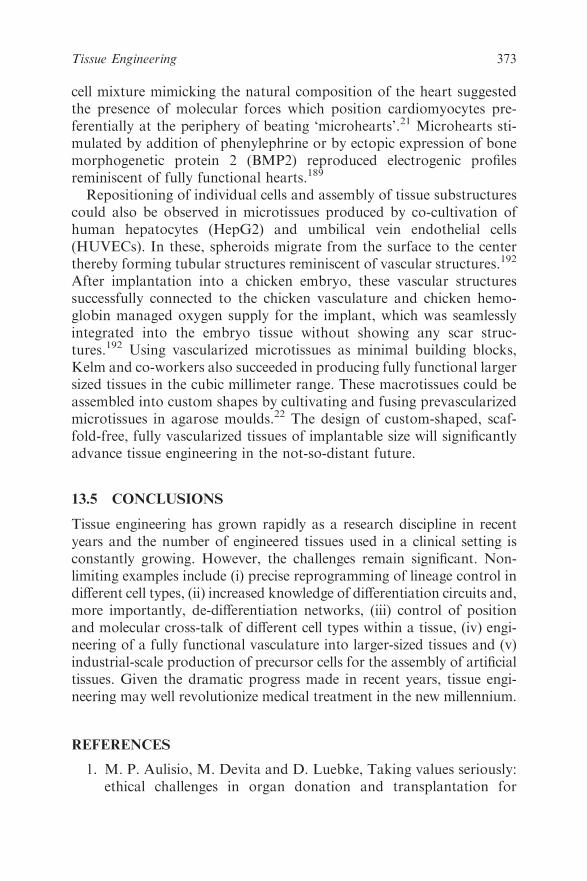
cell mixture mimicking the natural composition of the heart suggested
the presence of molecular forces which position cardiomyocytes pre-
ferentially at the periphery of beating ‘microhearts’.21 Microhearts sti-
mulated by addition of phenylephrine or by ectopic expression of bone
morphogenetic protein 2 (BMP2) reproduced electrogenic profiles
reminiscent of fully functional hearts.189
Repositioning of individual cells and assembly of tissue substructures
could also be observed in microtissues produced by co-cultivation of
human hepatocytes (HepG2) and umbilical vein endothelial cells
(HUVECs). In these, spheroids migrate from the surface to the center
thereby forming tubular structures reminiscent of vascular structures.192
After implantation into a chicken embryo, these vascular structures
successfully connected to the chicken vasculature and chicken hemo-
globin managed oxygen supply for the implant, which was seamlessly
integrated into the embryo tissue without showing any scar struc-
tures.192 Using vascularized microtissues as minimal building blocks,
Kelm and co-workers also succeeded in producing fully functional larger
sized tissues in the cubic millimeter range. These macrotissues could be
assembled into custom shapes by cultivating and fusing prevascularized
microtissues in agarose moulds.22 The design of custom-shaped, scaf-
fold-free, fully vascularized tissues of implantable size will significantly
advance tissue engineering in the not-so-distant future.
13.5 CONCLUSIONS
Tissue engineering has grown rapidly as a research discipline in recent
years and the number of engineered tissues used in a clinical setting is
constantly growing. However, the challenges remain significant. Non-
limiting examples include (i) precise reprogramming of lineage control in
different cell types, (ii) increased knowledge of differentiation circuits and,
more importantly, de-differentiation networks, (iii) control of position
and molecular cross-talk of different cell types within a tissue, (iv) engi-
neering of a fully functional vasculature into larger-sized tissues and (v)
industrial-scale production of precursor cells for the assembly of artificial
tissues. Given the dramatic progress made in recent years, tissue engi-
neering may well revolutionize medical treatment in the new millennium.
REFERENCES
1. M. P. Aulisio, M. Devita and D. Luebke, Taking values seriously:
ethical challenges in organ donation and transplantation for
373Tissue Engineering
critical care professionals, Crit. Care Med., 2007, 35(2 Suppl),
S95–101.
2. R. Langer and J. P. Vacanti, Tissue Eng. Sci., 1993, 260(5110),
920–6.
3. M. Ehrbar, A. Metters, P. Zammaretti, J. A. Hubbell and A. H.
Zisch, Endothelial cell proliferation and progenitor maturation
by fibrin-bound VEGF variants with differential susceptibilities
to local cellular activity, J. Control. Release, 2005, 101(1–3),
93–109.
4. C. Fux, D. Langer and M. Fussenegger, Dual-regulated myoD-
and msx1-based interventions in C2C12-derived cells enable pre-
cise myogenic/osteogenic/adipogenic lineage control, J. Gene
Med., 2004, 6(10), 1159–69.
5. D. C. Hay, D. Zhao, A. Ross, R. Mandalam, J. Lebkowski and
W. Cui, Direct differentiation of human embryonic stem cells to
hepatocyte-like cells exhibiting functional activities, Cloning Stem
Cells, 2007, 9(1), 51–62.
6. J. K. Heath and A. G. Smith, Regulatory factors of embryonic
stem cells, J. Cell Sci. Suppl., 1988, 10, 257–66.
7. J. K. Heath, A. G. Smith, L. W. Hsu and P. D. Rathjen, Growth
and differentiation factors of pluripotential stem cells, J. Cell Sci.
Suppl., 1990, 13, 75–85.
8. S. Ikehara, Pluripotent hemopoietic stem cells in mice and humans,
Proc. Soc. Exp. Biol. Med., 2000, 223(2), 149–55.
9. A. Alhadlaq and J. J. Mao, Mesenchymal stem cells: isolation and
therapeutics, Stem Cells Dev., 2004, 13(4), 436–48.
10. I. Jasmund, S. Schwientek, A. Acikgoz, A. Langsch, H. G. Machens
and A. Bader, The influence of medium composition and matrix on
long-term cultivation of primary porcine and human hepatocytes,
Biomol. Eng., 2007, 24(1), 59–69.
11. S. H. Khoo and M. Al-Rubeai, Metabolomics as a complementary
tool in cell culture, Biotechnol. Appl. Biochem., 2007, 47(Pt 2), 71–84.
12. L. Yao, C. S. Bestwick, L. A. Bestwick, N. Maffulli and R. M.
Aspden, Phenotypic drift in human tenocyte culture, Tissue Eng.,
2006, 12(7), 1843–9.
13. A. I. Caplan, Review: mesenchymal stem cells: cell-based recon-
structive therapy in orthopedics., Tissue Eng., 2005, 11(7–8),
1198–211.
14. N. Kimelman, G. Pelled, G. A. Helm, J. Huard, E. M. Schwarz and
D. Gazit, Review: gene- and stem cell-based therapeutics for bone
regeneration and repair, Tissue Eng., 2007, 13(6), 1135–50.
374 Chapter 13

15. W. H. Fissell, Developments towards an artificial kidney, Expert
Rev. Med. Devices, 2006, 3(2), 155–65.
16. M. Miyamoto, Current progress and perspectives in cell therapy
for diabetes mellitus, Hum. Cell, 2001, 14(4), 293–300.
17. J. K. Park and D. H. Lee, Bioartificial liver systems: current status
and future perspective, J. Biosci. Bioeng., 2005, 99(4), 311–9.
18. A. Saito, Development of bioartificial kidneys, Nephrology
(Carlton), 2003, 8(Suppl), S10–5.
19. W. H. Zimmermann and T. Eschenhagen, Cardiac tissue engineer-
ing for replacement therapy, Heart Fail. Rev., 2003, 8(3), 259–69.
20. V. L. Tsang and S. N. Bhatia, Fabrication of three-dimensional
tissues, Adv. Biochem. Eng. Biotechnol., 2007, 103, 189–205.
21. J. M. Kelm, E. Ehler, L. K. Nielsen, S. Schlatter, J. C. Perriard and
M. Fussenegger, Design of artificial myocardial microtissues,
Tissue Eng., 2004, 10(1–2), 201–14.
22. J. M. Kelm, V. Djonov, L. M. Ittner, D. Fluri, W. Born, S. P.
Hoestrup and M. Fussenegger, Design of custom-shaped vascu-
larized tissues using microtissue spheroids as minimal building
units, Tissue Eng., 2006, 12(8), 2151–60.
23. J. M. Kelm and M. Fussenegger, Microscale tissue engineering
using gravity-enforced cell assembly, Trends Biotechnol., 2004,
22(4), 195–202.
24. S. Marlovits, P. Zeller, P. Singer, C. Resinger and V. Vecsei,
Cartilage repair: generations of autologous chondrocyte trans-
plantation, Eur. J. Radiol., 2006, 57(1), 24–31.
25. D. W. Hayes Jr, R. L. Brower and K. J. John, Articular cartilage.
Anatomy, injury and repair, Clin. Podiatr. Med. Surg., 2001, 18(1),
35–53.
26. P. V. Kochupura, E. U. Azeloglu, D. J. Kelly, S. V. Doronin, S. F.
Badylak, I. B. Krukenkamp, I. S. Cohen and G. R. Gaudette,
Tissue-engineered myocardial patch derived from extracellular
matrix provides regional mechanical function, Circulation, 2005,
112(9 Suppl), I144–9.
27. T. C. Flanagan, C. Cornelissen, S. Koch, B. Tschoeke, J. S. Sach-
weh, T. Schmitz-Rode and S. Jockenhoevel, The in vitro develop-
ment of autologous fibrin-based tissue-engineered heart valves
through optimised dynamic conditioning, Biomaterials, 2007,
28(23), 3388–97.
28. A. Cohen and E. S. Horton, Progress in the treatment of type 2
diabetes: new pharmacologic approaches to improve glycemic
control, Curr. Med. Res. Opin., 2007, 23(4), 905–17.
375Tissue Engineering
29. M. Nair, Diabetes mellitus, Part 1: physiology and complications,
Br. J. Nurs., 2007, 16(3), 184–8.
30. M. J. Evans and M. H. Kaufman, Establishment in culture of pluri-
potential cells from mouse embryos, Nature, 1981, 292(5819), 154–6.
31. J. A. Thomson, J. Itskovitz-Eldor, S. S. Shapiro, M.A. Waknitz,
J. J. Swiergiel, V. S. Marshall and J. M. Jones, Embryonic stem cell
lines derived from human blastocysts, Science, 1998, 282(5391),
1145–7.
32. I. Singec, R. Jandial, A. Crain, G. Nikkhah and E. Y. Snyder, The
leading edge of stem cell therapeutics, Annu. Rev. Med., 2007, 58,
313–28.
33. D. Van Hoof, C. L. Mummery, A. J. Heck and J. Krijgsveld,
Embryonic stem cell proteomics, Expert Rev. Proteomics, 2006,
3(4), 427–37.
34. D. Mondal, L. Pradhan and V. F. LaRussa, Signal transduction
pathways involved in the lineage-differentiation of NSCs: can the
knowledge gained from blood be used in the brain?, Cancer Invest.,
2004, 22(6), 925–43.
35. K. Nakashima and T. Taga, Mechanisms underlying cytokine-
mediated cell-fate regulation in the nervous system, Mol. Neuro-
biol., 2002, 25(3), 233–44.
36. S. J. Leedham, M. Brittan, S. A. McDonald and N. A. Wright,
Intestinal stem cells, J. Cell Mol. Med., 2005, 9(1), 11–24.
37. J. R. Walters, Cell and molecular biology of the small intestine:
new insights into differentiation, growth and repair, Curr. Opin.
Gastroenterol., 2004, 20(2), 70–6.
38. L. Alonso and E. Fuchs, Stem cells of the skin epithelium, Proc.
Natl. Acad. Sci. USA, 2003, 100 Suppl 1, 11830–5.
39. G. Cotsarelis, Epithelial stem cells: a folliculocentric view, J. Invest.
Dermatol., 2006, 126(7), 1459–68.
40. P. Anversa, A. Leri, M. Rota, T. Hosoda, C. Bearzi, K. Urbanek,
J. Kajstura and R. Bolli, Concise review: stem cells, myocardial
regeneration and methodological artifacts, Stem Cells, 2007, 25(3),
589–601.
41. A. Leri, J. Kajstura and P. Anversa, Cardiac stem cells and
mechanisms of myocardial regeneration, Physiol. Rev., 2005, 85(4),
1373–416.
42. K. Urbanek, D. Cesselli, M. Rota, A. Nascimbene, A. De Angelis,
T. Hosoda, C. Bearzi, A. Boni, R. Bolli, J. Kajstura, P. Anversa
and A. Leri, Stem cell niches in the adult mouse heart, Proc. Natl.
Acad. Sci. USA, 2006, 103(24), 9226–31.
376 Chapter 13
43. K. A. Jackson, S. M. Majka, G. G. Wulf and M. A. Goodell, Stem
cells: a minireview, J. Cell Biochem. Suppl., 2002, 38, 1–6.
44. A. Vescovi, A. Gritti, G. Cossu and R. Galli, Neural stem cells:
plasticity and their transdifferentiation potential, Cells Tissues
Organs, 2002, 171(1), 64–76.
45. H. E. Young, C. Duplaa, M. Romero-Ramos, M. F. Chesselet,
P. Vourc’h, M. J. Yost, K. Ericson, L. Terracio, T. Asahara,
H. Masuda, S. Tamura-Ninomiya, K. Detmer, R. A. Bray, T. A.
Steele, D. Hixson, M. el-Kalay, B. W. Tobin, R. D. Russ, M. N.
Horst, J. A. Floyd, N. L. Henson, K. C. Hawkins, J. Groom,
A. Parikh, L. Blake, L. J. Bland, A. J. Thompson, A. Kirincich,
C. Moreau, J. Hudson, F. P. Bowyer, 3rd, T. J. Lin and A. C.
Black, Jr., Adult reserve stem cells and their potential for tissue
engineering, Cell Biochem. Biophys., 2004, 40(1), 1–80.
46. M. Heyde, K. A. Partridge, R. O. Oreffo, S. M. Howdle, K. M.
Shakesheff and M. C. Garnett, Gene therapy used for tissue engi-
neering applications, J. Pharm. Pharmacol., 2007, 59(3), 329–50.
47. T. May, P. P. Mueller, H. Weich, N. Froese, U. Deutsch, D. Wirth,
A. Kroger and H. Hauser, Establishment of murine cell lines by
constitutive and conditional immortalization, J. Biotechnol., 2005,
120(1), 99–110.
48. B. Varnum-Finney, L. Xu, C. Brashem-Stein, C. Nourigat,
D. Flowers, S. Bakkour, W. S. Pear and I. D. Bernstein, Pluri-
potent, cytokine-dependent, hematopoietic stem cells are immor-
talized by constitutive Notch1 signaling, Nat. Med., 2000, 6(11),
1278–81.
49. C. Fux, S. Moser, S. Schlatter, M. Rimann, J. E. Bailey and
M. Fussenegger, Streptogramin- and tetracycline-responsive dual
regulated expression of p27 (Kip1) sense and antisense enables
positive and negative growth control of Chinese hamster ovary
cells, Nucleic Acids Res., 2001, 29(4), E19.
50. M. B. Goldring, Immortalization of human articular chondrocytes
for generation of stable, differentiated cell lines, Methods Mol.
Med., 2004, 100, 23–36.
51. C. Priesner, F. Hesse, D. Windgassen, R. Klocke, D. Paul and
R. Wagner, Liver-specific physiology of immortal, functionally
differentiated hepatocytes and of deficient hepatocyte-like variants,
In vitro Cell Dev. Biol. Anim., 2004, 40(10), 318–30.
52. M. Fussenegger, R. P. Morris, C. Fux, M. Rimann and B. von
Stockar C. J., Streptogramin-based gene regulation systems for
mammalian cells, Nat. Biotechnol., 2000, 18(11), 1203–8.
377Tissue Engineering

53. M. Gossen and H. Bujard, Tight control of gene expression in
mammalian cells by tetracycline-responsive promoters, Proc. Natl.
Acad. Sci. USA, 1992, 89(12), 5547–51.
54. W. Weber, B. P. Kramer, C. Fux, B. Keller and M. Fussenegger,
Novel promoter/transactivator configurations for macrolide- and
streptogramin-responsive transgene expression in mammalian
cells, J. Gene Med., 2002, 4(6), 676–86.
55. M. Fussenegger, J. E. Bailey, H. Hauser and P. P. Mueller, Genetic
optimization of recombinant glycoprotein production by mam-
malian cells, Trends Biotechnol., 1999, 17(1), 35–42.
56. Z. Ivics, A. Katzer, E. E. Stuwe, D. Fiedler, S. Knespel and
Z. Izsvak, Targeted Sleeping Beauty transposition in human cells,
Mol. Ther., 2007, 15(6), 1137–44.
57. C. Miskey, Z. Izsvak, R. H. Plasterk and Z. Ivics, The Frog Prince:
a reconstructed transposon from Rana pipiens with high trans-
positional activity in vertebrate cells, Nucleic Acids Res., 2003,
31(23), 6873–81.
58. M. Narushima, N. Kobayashi, T. Okitsu, Y. Tanaka, S. A. Li,
Y. Chen, A. Miki, K. Tanaka, S. Nakaji, K. Takei, A. S. Gutierrez,
J. D. Rivas-Carrillo, N. Navarro-Alvarez, H. S. Jun, K. A.
Westerman, H. Noguchi, J. R. Lakey, P. Leboulch, N. Tanaka and
J. W. Yoon, A human beta-cell line for transplantation therapy to
control type 1 diabetes, Nat. Biotechnol., 2005, 23(10), 1274–82.
59. D. Tosh and J. M. Slack, How cells change their phenotype, Nat.
Rev. Mol. Cell Biol., 2002, 3(3), 187–94.
60. P. Collas, C. K. Taranger, A. C. Boquest, A. Noer and J. A. Dahl,
On the way to reprogramming cells to pluripotency using cell-free
extracts, Reprod. Biomed. Online, 2006, 12(6), 762–70.
61. P. Mali and L. Cheng, Reprogramming somatic cells without
fusion or ethical confusion, Regen. Med., 2006, 1(6), 837–840.
62. K. Takahashi and S. Yamanaka, Induction of pluripotent stem
cells from mouse embryonic and adult fibroblast cultures by
defined factors, Cell, 2006, 126(4), 663–76.
63. K. Hochedlinger and R. Jaenisch, Nuclear reprogramming and
pluripotency, Nature, 2006, 441(7097), 1061–7.
64. R. Jaenisch, K. Hochedlinger and K. Eggan, Nuclear cloning,
epigenetic reprogramming and cellular differentiation, Novartis
Found. Symp., 2005, 265, 107–18; discussion 118–28.
65. E. Hu, P. Tontonoz and B. M. Spiegelman, Transdifferentiation
of myoblasts by the adipogenic transcription factors PPAR gamma
and C/EBP alpha, Proc. Natl. Acad. Sci. USA, 1995, 92(21),
9856–60.
378 Chapter 13
66. P. C. Schiller, G. D’Ippolito, R. Brambilla, B. A. Roos and G. A.
Howard, Inhibition of gap-junctional communication induces the
trans-differentiation of osteoblasts to an adipocytic phenotype in
vitro, J. Biol. Chem., 2001, 276(17), 14133–8.
67. C. N. Shen, J. M. Slack and D. Tosh, Molecular basis of trans-
differentiation of pancreas to liver, Nat. Cell Biol., 2000, 2(12),
879–87.
68. G. Condorelli, U. Borello, L. De Angelis, M. Latronico, D. Sirabella,
M. Coletta, R. Galli, G. Balconi, A. Follenzi, G. Frati, M. G. Cusella
De Angelis, L. Gioglio, S. Amuchastegui, L. Adorini, L. Naldini,
A. Vescovi, E. Dejana and G. Cossu, Cardiomyocytes induce
endothelial cells to trans-differentiate into cardiac muscle: implica-
tions for myocardium regeneration, Proc. Natl. Acad. Sci. USA,
2001, 98(19), 10733–8.
69. M. D. Dabeva, S. G. Hwang, S. R. Vasa, E. Hurston, P. M.
Novikoff, D. C. Hixson, S. Gupta and D. A. Shafritz, Differ-
entiation of pancreatic epithelial progenitor cells into hepatocytes
following transplantation into rat liver, Proc. Natl. Acad. Sci.
USA, 1997, 94(14), 7356–61.
70. T. W. Gilbert, T. L. Sellaro and S. F. Badylak, Decellularization of
tissues and organs, Biomaterials, 2006, 27(19), 3675–83.
71. J. C. Myers, P. S. Amenta, A. S. Dion, J. P. Sciancalepore,
C. Nagaswami, J. W. Weisel and P. D. Yurchenco, The mole-
cular structure of human tissue type XV presents a unique
conformation among the collagens, Biochem. J., 2007, 404(3),
535–44.
72. A. M. Pizzo, K. Kokini, L. C. Vaughn, B. Z. Waisner and S. L.
Voytik-Harbin, Extracellular matrix (ECM) microstructural
composition regulates local cell-ECM biomechanics and funda-
mental fibroblast behavior: a multidimensional perspective,
J. Appl. Physiol., 2005, 98(5), 1909–21.
73. P. Schedin, T. Mitrenga, S. McDaniel and M. Kaeck, Mammary
ECM composition and function are altered by reproductive state,
Mol. Carcinog., 2004, 41(4), 207–20.
74. M.Maatta, A. Liakka, S. Salo, K. Tasanen, L. Bruckner-Tuderman
and H. Autio-Harmainen, Differential expression of basement
membrane components in lymphatic tissues, J. Histochem. Cyto-
chem., 2004, 52(8), 1073–81.
75. A. C. Bellail, S. B. Hunter, D. J. Brat, C. Tan and E. G. Van Meir,
Microregional extracellular matrix heterogeneity in brain modu-
lates glioma cell invasion, Int. J. Biochem. Cell Biol., 2004, 36(6),
1046–69.
379Tissue Engineering
76. P. Lin, W. C. Chan, S. F. Badylak and S. N. Bhatia, Assessing
porcine liver-derived biomatrix for hepatic tissue engineering,
Tissue Eng., 2004, 10(7–8), 1046–53.
77. J. H. Miner, Renal basement membrane components, Kidney Int.,
1999, 56(6), 2016–24.
78. K. Gelse, E. Poschl and T. Aigner, Collagens – structure, function
and biosynthesis, Adv. Drug Deliv. Rev., 2003, 55(12), 1531–46.
79. J. Huxley-Jones, D. L. Robertson and R. P. Boot-Handford, On
the origins of the extracellular matrix in vertebrates, Matrix Biol.,
2007, 26(1), 2–11.
80. J. Schwarzbauer, Basement membranes: Putting up the barriers,
Curr. Biol., 1999, 9(7), R242–4.
81. R. Timpl, Macromolecular organization of basement membranes.
Curr. Opin. Cell Biol., 1996, 8(5), 618–24.
82. R. Timpl and J. C. Brown, Supramolecular assembly of basement
membranes, Bioessays, 1996, 18(2), 123–32.
83. R. Folberg and A. J. Maniotis, Vasculogenic mimicry, Apmis,
2004, 112(7–8), 508–25.
84. Z. Werb, T. H. Vu, J. L. Rinkenberger and L. M. Coussens,
Matrix-degrading proteases and angiogenesis during development
and tumor formation, Apmis, 1999, 107(1), 11–8.
85. T. Neumann, S. D. Hauschka and J. E. Sanders, Tissue engi-
neering of skeletal muscle using polymer fiber arrays, Tissue Eng.,
2003, 9(5), 995–1003.
86. M. D. Pierschbacher and E. Ruoslahti, Cell attachment activity of
fibronectin can be duplicated by small synthetic fragments of the
molecule, Nature, 1984, 309(5963), 30–3.
87. K. M. Yamada and D. W. Kennedy, Dualistic nature of adhesive
protein function: fibronectin and its biologically active peptide
fragments can autoinhibit fibronectin function, J. Cell Biol., 1984,
99(1 Pt 1), 29–36.
88. S. Miyamoto, B. Z. Katz, R. M. Lafrenie and K. M. Yamada,
Fibronectin and integrins in cell adhesion, signaling and mor-
phogenesis, Ann. N. Y. Acad. Sci., 1998, 857, 119–29.
89. M. Mochizuki, N. Yamagata, D. Philp, K. Hozumi, T. Watanabe,
Y. Kikkawa, Y. Kadoya, H. K. Kleinman and M. Nomizu,
Integrin-dependent cell behavior on ECM peptide-conjugated
chitosan membranes, Biopolymers, 2007, 88(2), 122–30.
90. J. E. Schwarzbauer, Fibronectin: from gene to protein, Curr. Opin.
Cell Biol., 1991, 3(5), 786–91.
91. J. P. Hodde, S. F. Badylak, A. O. Brightman and S. L. Voytik-
Harbin, Glycosaminoglycan content of small intestinal submucosa:
380 Chapter 13
a bioscaffold for tissue replacement, Tissue Eng., 1996, 2(3),
209–217.
92. W. M. Elbjeirami, E. O. Yonter, B. C. Starcher and J. L. West,
Enhancing mechanical properties of tissue-engineered constructs
via lysyl oxidase crosslinking activity, J. Biomed. Mater. Res. A,
2003, 66(3), 513–21.
93. M. A. Cobb, S.F. Badylak, W. Janas, and F.A. Boop, Histology
after dural grafting with small intestinal submucosa. Surg. Neurol.,
1996, 46 (4), 389–93; discussion 393–4.
94. S. F. Badylak, The extracellular matrix as a scaffold for tissue
reconstruction, Semin. Cell Dev. Biol., 2002, 13(5), 377–83.
95. S. Badylak, S. Meurling, M. Chen, A. Spievack and A. Simmons-
Byrd, Resorbable bioscaffold for esophageal repair in a dog model,
J. Pediatr. Surg., 2000, 35(7), 1097–103.
96. S. Nemcova, A. A. Noel, C. J. Jost, P. Gloviczki, V. M. Miller and
K. G. Brockbank, Evaluation of a xenogeneic acellular collagen
matrix as a small-diameter vascular graft in dogs – preliminary
observations, J. Invest. Surg., 2001, 14(6), 321–30.
97. K. J. Zehr, M. Yagubyan, H. M. Connolly, S. M. Nelson and H. V.
Schaff, Aortic root replacement with a novel decellularized cryo-
preserved aortic homograft: postoperative immunoreactivity and
early results, J. Thorac. Cardiovasc. Surg., 2005, 130(4), 1010–5.
98. C. Danielsson, S. Ruault, A. Basset-Dardare and P. Frey, Mod-
ified collagen fleece, a scaffold for transplantation of human
bladder smooth muscle cells, Biomaterials, 2006, 27(7), 1054–60.
99. B. P. Kropp, S. Badylak and K. B. Thor, Regenerative bladder
augmentation: a review of the initial preclinical studies with por-
cine small intestinal submucosa, Adv. Exp. Med. Biol., 1995, 385,
229–35.
100. P. A. Merguerian, P. P. Reddy, D. J. Barrieras, G. J. Wilson,
K. Woodhouse, D. J. Bagli, G. A. McLorie and A. E. Khoury,
Acellular bladder matrix allografts in the regeneration of func-
tional bladders: evaluation of large-segment (424 cm) substitution
in a porcine model, BJU Int., 2000, 85(7), 894–8.
101. S. Q. Liu, Gastrointestinal Regenerative Engineering. Bioregenerative
Engineering: Principles and Applications, Wiley, Hoboken, NJ, 2007.
102. J. R. Fuchs, A. Kaviani, J.T. Oh, D. LaVan, T. Udagawa, R.W.
Jennings, J.M. Wilson, and D.O. Fauza, Diaphragmatic recon-
struction with autologous tendon engineered from mesenchymal
amniocytes, J. Pediatr. Surg., 2004, 39 (6), 834–8; discussion 834–8.
103. C. G. Zalavras, R. Gardocki, E. Huang, M. Stevanovic,
T. Hedman and J. Tibone, Reconstruction of large rotator cuff
381Tissue Engineering
tendon defects with porcine small intestinal submucosa in an ani-
mal model, J. Shoulder Elbow Surg., 2006, 15(2), 224–31.
104. P. G. De Deyne and S. M. Kladakis, Bioscaffolds in tissue engi-
neering: a rationale for use in the reconstruction of musculoskeletal
soft tissues, Clin. Podiatr. Med. Surg., 2005, 22(4), 521–32, v.
105. C. C. Weber, H. Cai, M. Ehrbar, H. Kubota, G. Martiny-Baron,
W. Weber, V. Djonov, E. Weber, A.S. Mallik, M. Fussenegger,
K. Frei, J. A. Hubbell and A. H. Zisch, Effects of protein and gene
transfer of the angiopoietin-1 fibrinogen-like receptor-binding
domain on endothelial and vessel organization, J. Biol. Chem.,
2005, 280(23), 22445–53.
106. W. L. Rust, A. Sadasivam and N. R. Dunn, Three-dimensional
extracellular matrix stimulates gastrulation-like events in human
embryoid bodies, Stem Cells Dev., 2006, 15(6), 889–904.
107. V. Ella, M. E. Gomes, R. L. Reis, P. Tormala and M. Kellomaki,
Studies of P (L/D)LA 96/4 non-woven scaffolds and fibres;
properties, wettability and cell spreading before and after intru-
sive treatment methods, J. Mater. Sci. Mater. Med., 2007, 18(6),
1253–61.
108. J. P. Rubin, J. M. Bennett, J. S. Doctor, B. M. Tebbets and K. G.
Marra, Collagenous microbeads as a scaffold for tissue engineering
with adipose-derived stem cells, Plast. Reconstr. Surg., 2007,
120(2), 414–24.
109. T. Suciati, D. Howard, J. Barry, N. M. Everitt, K. M. Shakesheff
and F. R. Rose, Zonal release of proteins within tissue engineering
scaffolds, J. Mater. Sci. Mater. Med., 2006, 17(11), 1049–56.
110. A. S. Rowlands, S. A. Lim, D. Martin and J. J. Cooper-White,
Polyurethane/poly(lactic-co-glycolic) acid composite scaffolds
fabricated by thermally induced phase separation, Biomaterials,
2007, 28(12), 2109–21.
111. T. Takezawa, K. Ozaki and C. Takabayashi, Reconstruction of a
hard connective tissue utilizing a pressed silk sheet and type-I col-
lagen as the scaffold for fibroblasts, Tissue Eng., 2007, 13(6), 1357–66.
112. R. Izquierdo, N. Garcia-Giralt, M.T. Rodriguez, E. Caceres, S.J.
Garcia, J.L. Gomez Ribelles, M. Monleon, J.C. Monllau, and
J. Suay, Biodegradable PCL scaffolds with an interconnected
spherical pore network for tissue engineering, J. Biomed. Mater.
Res. A, 2007, 85(1), 25–35.
113. J. G. Dellinger, J. Cesarano III and R. D. Jamison, Robotic
deposition of model hydroxyapatite scaffolds with multiple archi-
tectures and multiscale porosity for bone tissue engineering,
J. Biomed. Mater. Res. A, 2007, 82(2), 383–94.
382 Chapter 13

114. I. K. Jun, Y. H. Koh, S. H. Lee and H. E. Kim, Novel hydro-
xyapatite (HA) dual-scaffold with ultra-high porosity, high surface
area and compressive strength, J. Mater. Sci. Mater. Med., 2007,
18(6), 1071–7.
115. J. O. Eniwumide, H. Yuan, S. H. Cartmell, G. J. Meijer, and J. D.
de Bruijn, Ectopic bone formation in bone marrow stem cell seeded
calcium phosphate scaffolds as compared to autograft and (cell
seeded) allograft, Eur. Cell Mater., 2007, 14, 30–8; discussion 39.
116. Li, Y. and W. Weng, In vitro synthesis and characterization of
amorphous calcium phosphates with various Ca/P atomic ratios,
J. Mater. Sci. Mater. Med., 2007, 18(12), 2303–8.
117. C. V. Brovarone, E. Verne and P. Appendino, Macroporous
bioactive glass-ceramic scaffolds for tissue engineering, J. Mater.
Sci. Mater. Med., 2006, 17(11), 1069–78.
118. J. R. Jones, O. Tsigkou, E. E. Coates, M. M. Stevens, J. M. Polak
and L. L. Hench, Extracellular matrix formation and mineraliza-
tion on a phosphate-free porous bioactive glass scaffold using
primary human osteoblast (HOB) cells, Biomaterials, 2007, 28(9),
1653–63.
119. A. R. Boccaccini and J. J. Blaker, Bioactive composite materials
for tissue engineering scaffolds, Expert Rev. Med. Devices, 2005,
2(3), 303–17.
120. G. C. Engelmayr Jr and M. S. Sacks, A structural model for the
flexural mechanics of nonwoven tissue engineering scaffolds,
J. Biomech. Eng., 2006, 128(4), 610–22.
121. C. W. Yung, L. Q. Wu, J. A. Tullman, G. F. Payne, W. E. Bentley,
and T. A. Barbari, Transglutaminase crosslinked gelatin as a tissue
engineering scaffold. J. Biomed. Mater. Res. A, 2007, 83(4), 1039–46.
122. J. B. Leach, J. B. Wolinsky, P. J. Stone and J. Y. Wong, Cross-
linked alpha-elastin biomaterials: towards a processable elastin
mimetic scaffold, Acta Biomater., 2005, 1(2), 155–64.
123. K. A. Faraj, T. H. Van Kuppevelt and W. F. Daamen, Con-
struction of collagen scaffolds that mimic the three-dimensional
architecture of specific tissues. Tissue Eng., 2007, 13(0), 2387–94.
124. F. J. O’Brien, B. A. Harley, M. A. Waller, I. V. Yannas, L. J.
Gibson and P. J. Prendergast, The effect of pore size on perme-
ability and cell attachment in collagen scaffolds for tissue engi-
neering, Technol. Health Care, 2007, 15(1), 3–17.
125. E. Alsberg, E. Feinstein, M. P. Joy, M. Prentiss and D. E. Ingber,
et al., Magnetically-guided self-assembly of fibrin matrices with
ordered nano-scale structure for tissue engineering, Tissue Eng.,
2006, 12(11), 3247–56.
383Tissue Engineering

126. D. Eyrich, H. Wiese, G. Maier, D. Skodacek, B. Appel, H. Sarhan,
J. Tessmar, R. Staudenmaier, M. M. Wenzel, A. Goepferich, and
T. Blunk, In vitro and in vivo cartilage engineering using a com-
bination of chondrocyte-seeded long-term stable fibrin gels and
polycaprolactone-based polyurethane scaffolds, Tissue Eng., 2007,
13(9), 2207–18.
127. J. Velema and D. Kaplan, Biopolymer-based biomaterials as
scaffolds for tissue engineering, Adv. Biochem. Eng. Biotechnol.,
2006, 102, 187–238.
128. S. Lin-Gibson, J. A. Cooper, F. A. Landis and M. T. Cicerone,
Systematic investigation of porogen size and content on scaffold
morphometric parameters and properties, Biomacromolecules,
2007, 8(5), 1511–8.
129. D. A. Wahl, E. Sachlos, C. Liu and J. T. Czernuszka, Controlling
the processing of collagen–hydroxyapatite scaffolds for bone tissue
engineering, J. Mater. Sci. Mater. Med., 2007, 18(2), 201–9.
130. T. Weigel, G. Schinkel and A. Lendlein, Design and preparation of
polymeric scaffolds for tissue engineering, Expert Rev. Med.
Devices, 2006, 3(6), 835–51.
131. U. Boudriot, R. Dersch, A. Greiner and J. H. Wendorff, Electro-
spinning approaches toward scaffold engineering – a brief over-
view., Artif Organs, 2006, 30(10), 785–92.
132. R. Murugan and S. Ramakrishna, Design strategies of tissue
engineering scaffolds with controlled fiber orientation. Tissue Eng.,
2007, 13(8), 1845–66.
133. L. S. Nair, S. Bhattacharyya and C. T. Laurencin, Development of
novel tissue engineering scaffolds via electrospinning, Expert Opin.
Biol. Ther., 2004, 4(5), 659–68.
134. C. M. Vaz, S. van Tuijl, C. V. Bouten and F. P. Baaijens, Design
of scaffolds for blood vessel tissue engineering using a multi-
layering electrospinning technique, Acta Biomater., 2005, 1(5),
575–82.
135. Z. Ma, M. Kotaki, R. Inai and S. Ramakrishna, Potential of
nanofiber matrix as tissue-engineering scaffolds, Tissue Eng., 2005,
11(1–2), 101–9.
136. R. Murugan and S. Ramakrishna, Nano-featured scaffolds for
tissue engineering: a review of spinning methodologies, Tissue
Eng., 2006, 12(3), 435–47.
137. F. Yang, R. Murugan, S. Wang and S. Ramakrishna, Electro-
spinning of nano/micro scale poly(L-lactic acid) aligned fibers and
their potential in neural tissue engineering, Biomaterials, 2005,
26(15), 2603–10.
384 Chapter 13
138. J. Guan, K. L. Fujimoto, M. S. Sacks and W. R. Wagner, Pre-
paration and characterization of highly porous, biodegradable
polyurethane scaffolds for soft tissue applications, Biomaterials,
2005, 26(18), 3961–71.
139. P. Roychowdhury and V. Kumar, Fabrication and evaluation of
porous 2,3-dialdehydecellulose membrane as a potential biode-
gradable tissue-engineering scaffold, J. Biomed. Mater. Res. A,
2006, 76(2), 300–9.
140. J. Nakamatsu, F. G. Torres, O. P. Troncoso, Y. Min-Lin and
A. R. Boccaccini, Processing and characterization of porous
structures from chitosan and starch for tissue engineering scaffolds,
Biomacromolecules, 2006, 7(12), 3345–55.
141. P. Sarazin, X. Roy and B. D. Favis, Controlled preparation and
properties of porous poly(L-lactide) obtained from a co-continuous
blend of two biodegradable polymers, Biomaterials, 2004, 25(28),
5965–78.
142. S. Zhang, Emerging biological materials through molecular self-
assembly, Biotechnol. Adv., 2002, 20(5–6), 321–39.
143. F. Gelain, A. Lomander, A. L. Vescovi and S. Zhang, Systematic
studies of a self-assembling peptide nanofiber scaffold with other
scaffolds, J. Nanosci. Nanotechnol., 2007, 7(2), 424–34.
144. E. Garreta, D. Gasset, C. Semino and S. Borros, Fabrication of a
three-dimensional nanostructured biomaterial for tissue engineer-
ing of bone, Biomol. Eng., 2007, 24(1), 75–80.
145. T. C. Holmes, S. de Lacalle, X. Su, G. Liu, A. Rich and S. Zhang,
Extensive neurite outgrowth and active synapse formation on self-
assembling peptide scaffolds, Proc. Natl. Acad. Sci. USA, 2000,
97(12), 6728–33.
146. M. Altman, P. Lee, A. Rich and S. Zhang, Conformational
behavior of ionic self-complementary peptides, Protein Sci., 2000,
9(6), 1095–105.
147. S. J. Hollister, Porous scaffold design for tissue engineering, Nat.
Mater., 2005, 4(7), 518–24.
148. H. H. Lu and J. Jiang, Interface tissue engineering and the for-
mulation of multiple-tissue systems, Adv. Biochem. Eng. Bio-
technol., 2006, 102, 91–111.
149. A. G. Mikos, S. W. Herring, P. Ochareon, J. Elisseeff, H. H. Lu,
R. Kandel, F. J. Schoen, M. Toner, D. Mooney, A. Atala, M. E.
Van Dyke, D. Kaplan and G. Vunjak-Novakovic, Engineering
complex tissues, Tissue Eng., 2006, 12(12), 3307–39.
150. A. S. Mistry and A. G. Mikos, Tissue engineering strategies for
bone regeneration, Adv. Biochem. Eng. Biotechnol., 2005, 94, 1–22.
385Tissue Engineering
151. K. Rezwan, Z. Chen, J. J. Blaker and A. R. Boccaccini, Biode-
gradable and bioactive porous polymer/inorganic composite
scaffolds for bone tissue engineering, Biomaterials, 2006, 27(18),
3413–31.
152. N. Karim, K. Golz and A. Bader, The cardiovascular tissue-
reactor: a novel device for the engineering of heart valves, Artif.
Organs, 2006, 30(10), 809–14.
153. Y. Martin and P. Vermette, Bioreactors for tissue mass culture:
design, characterization and recent advances, Biomaterials, 2005,
26(35), 7481–503.
154. R. M. Sutherland, B. Sordat, J. Bamat, H. Gabbert, B. Bourrat
and W. Mueller-Klieser, Oxygenation and differentiation in mul-
ticellular spheroids of human colon carcinoma, Cancer Res., 1986,
46(10), 5320–9.
155. J. M. Piret and C. L. Cooney, Immobilized mammalian cell cultiva-
tion in hollow fiber bioreactors, Biotechnol. Adv., 1990, 8(4), 763–83.
156. F. Zhao, P. Pathi, W. Grayson, Q. Xing, B. R. Locke and T. Ma,
Effects of oxygen transport on 3-d human mesenchymal stem cell
metabolic activity in perfusion and static cultures: experiments and
mathematical model, Biotechnol. Prog., 2005, 21(4), 1269–80.
157. N. L. Parenteau and J. Hardin-Young, The use of cells in
reparative medicine, Ann. N. Y. Acad. Sci., 2002, 961, 27–39.
158. R. P. Lanza, R. Langer and J. P. Vacanti, Principles of Tissue
Engineering, Academic Press, San Diego, CA, 1997.
159. U. Meyer, U. Joos and H. P. Wiesmann, Biological and biophy-
sical principles in extracorporal bone tissue engineering, Part I. Int.
J. Oral Maxillofac. Surg., 2004, 33(4), 325–32.
160. I. Martin, R. F. Padera, G. Vunjak-Novakovic and L. E. Freed, In
vitro differentiation of chick embryo bone marrow stromal cells into
cartilaginous and bone-like tissues, J. Orthop. Res., 1998, 16(2), 181–9.
161. S. L. Ishaug, G. M. Crane, M. J. Miller, A. W. Yasko, M. J.
Yaszemski and A. G. Mikos, Bone formation by three-dimensional
stromal osteoblast culture in biodegradable polymer scaffolds, J.
Biomed. Mater. Res., 1997, 36(1), 17–28.
162. I. Martin, B. Obradovic, L. E. Freed and G. Vunjak-Novakovic,
Method for quantitative analysis of glycosaminoglycan distribu-
tion in cultured natural and engineered cartilage, Ann. Biomed.
Eng., 1999, 27(5), 656–62.
163. E. M. Bueno, B. Bilgen and G. A. Barabino, Wavy-walled bio-
reactor supports increased cell proliferation and matrix deposition
in engineered cartilage constructs, Tissue Eng., 2005, 11(11–12),
1699–709.
386 Chapter 13
164. H. D. Humes, S. M. MacKay, A. J. Funke and D. A. Buffington,
Tissue engineering of a bioartificial renal tubule assist device:
in vitro transport and metabolic characteristics, Kidney Int., 1999,
55(6), 2502–14.
165. H. F. Lu, W. S. Lim, P. C. Zhang, S. M. Chia, H. Yu, H. Q.
Mao and K. W. Leong, Galactosylated poly(vinylidene difluoride)
hollow fiber bioreactor for hepatocyte culture, Tissue Eng., 2005,
11(11–12), 1667–77.
166. J. M. Macdonald, M. Grillo, O. Schmidlin, D. T. Tajiri and T. L.
James, NMR spectroscopy and MRI investigation of a potential
bioartificial liver, NMR Biomed., 1998, 11(2), 55–66.
167. X. Wen and P. A. Tresco, Fabrication and characterization of
permeable degradable poly(DL-lactide-co-glycolide) (PLGA) hol-
low fiber phase inversion membranes for use as nerve tract gui-
dance channels, Biomaterials, 2006, 27(20), 3800–9.
168. L. E. Freed, R. Langer, I. Martin, N. R. Pellis and G. Vunjak-
Novakovic, Tissue engineering of cartilage in space, Proc. Natl.
Acad. Sci. USA, 1997, 94(25), 13885–90.
169. V. I. Khaoustov, G. J. Darlington, H. E. Soriano, B. Krishnan,
D. Risin, N. R. Pellis and B. Yoffe, Induction of three-dimensional
assembly of human liver cells by simulated microgravity, In vitro
Cell Dev. Biol. Anim., 1999, 35(9), 501–9.
170. G. Vunjak-Novakovic and L. E. Freed, Culture of organized cell
communities, Adv. Drug Deliv. Rev., 1998, 33(1–2), 15–30.
171. L. E. Freed and G. Vunjak-Novakovic, Microgravity tissue engi-
neering, In vitro Cell Dev. Biol. Anim., 1997, 33(5), 381–5.
172. H. L. Holtorf, J. A. Jansen and A. G. Mikos, Flow perfusion
culture induces the osteoblastic differentiation of marrow stroma
cell-scaffold constructs in the absence of dexamethasone,
J. Biomed. Mater. Res. A, 2005, 72(3), 326–34.
173. E. M. Darling and K. A. Athanasiou, Articular cartilage bior-
eactors and bioprocesses, Tissue Eng., 2003, 9(1), 9–26.
174. A. Ratcliffe and L. E. Niklason, Bioreactors and bioprocessing for
tissue engineering, Ann. N. Y. Acad. Sci., 2002, 961, 210–5.
175. S. Watanabe, S. Inagaki, I. Kinouchi, H. Takai, Y. Masuda and
S. Mizuno, Hydrostatic pressure/perfusion culture system designed
and validated for engineering tissue, J. Biosci. Bioeng., 2005,
100(1), 105–11.
176. J. O. Seidel, M. Pei, M. L. Gray, R. Langer, L. E. Freed and
G. Vunjak-Novakovic, Long-term culture of tissue engineered
cartilage in a perfused chamber with mechanical stimulation,
Biorheology, 2004, 41(3–4), 445–58.
387Tissue Engineering
177. E.R. Ochoa and J.P. Vacanti, An overview of the pathology and
approaches to tissue engineering. Ann. N. Y. Acad. Sci., 2002, 979,
10–26; discussion 35–8.
178. J. P. Burgues, L. Gomez, J. L. Pontones, C. D. Vera, J. F. Jimenez-
Cruz, and M. Ozonas, A chemosensitivity test for superficial
bladder cancer based on three-dimensional culture of tumour
spheroids. Eur. Urol., 2007, 51 (4), 962–9; discussion 969–70.
179. L. A. Kunz-Schughart, J. P. Freyer, F. Hofstaedter and R. Ebner,
The use of 3-D cultures for high-throughput screening: the multi-
cellular spheroid model, J. Biomol. Screen., 2004, 9(4), 273–85.
180. P. L. Olive and R. E. Durand, Drug and radiation resistance in
spheroids: cell contact and kinetics, Cancer Metastasis Rev., 1994,
13(2), 121–38.
181. B. J. Conley, J. C. Young, A. O. Trounson and R. Mollard,
Derivation, propagation and differentiation of human embryonic
stem cells, Int. J. Biochem. Cell Biol., 2004, 36(4), 555–67.
182. T. Korff, T. Krauss and H. G. Augustin, Three-dimensional
spheroidal culture of cytotrophoblast cells mimics the phenotype
and differentiation of cytotrophoblasts from normal and pre-
eclamptic pregnancies, Exp. Cell Res., 2004, 297(2), 415–23.
183. R. C. Bates, N. S. Edwards and J. D. Yates, Spheroids and cell
survival, Crit. Rev. Oncol. Hematol., 2000, 36(2–3), 61–74.
184. H. Okubo, M. Matsushita, H. Kamachi, T. Kawai, M. Takahashi,
T. Fujimoto, K. Nishikawa and S. Todo, A novel method for
faster formation of rat liver cell spheroids, Artif. Organs, 2002,
26(6), 497–505.
185. A. Rothermel, T. Biedermann, W. Weigel, R. Kurz, M. Ruffer,
P. G. Layer and A. A. Robitzki, Artificial design of three-dimen-
sional retina-like tissue from dissociated cells of the mammalian
retina by rotation-mediated cell aggregation, Tissue Eng., 2005,
11(11–12), 1749–56.
186. X. Wang, G. Wei, W. Yu, Y. Zhao, X. Yu and X. Ma, Scalable
producing embryoid bodies by rotary cell culture system and con-
structing engineered cardiac tissue with ES-derived cardiomyocytes
in vitro, Biotechnol. Prog., 2006, 22(3), 811–8.
187. A. Ivascu and M. Kubbies, Rapid generation of single-tumor
spheroids for high-throughput cell function and toxicity analysis,
J. Biomol. Screen., 2006, 11(8), 922–32.
188. Y. Hasebe, N. Okumura, T. Koh, H. Kazama, G. Watanabe,
T. Seki and T. Ariga, Formation of rat hepatocyte spheroids on
agarose, Hepatol. Res., 2005, 32(2), 89–95.
388 Chapter 13
189. J. M. Kelm, V. Djonov, S. P. Hoerstrup, C. I. Guenter, L. M.
Ittner, F. Greve, A. Hierlemann, C. D. Sanchez-Bustamante, J. C.
Perriard, E. Ehler and M. Fussenegger, Tissue-transplant fusion
and vascularization of myocardial microtissues and macrotissues
implanted into chicken embryos and rats, Tissue Eng., 2006, 12(9),
2541–53.
190. J. M. Kelm, L. M. Ittner, W. Born, V. Djonov andM. Fussenegger,
Self-assembly of sensory neurons into ganglia-like microtissues,
J. Biotechnol., 2006, 121(1), 86–101.
191. J. M. Kelm, N. E. Timmins, C. J. Brown, M. Fussenegger and
L. K. Nielsen, Method for generation of homogeneous multi-
cellular tumor spheroids applicable to a wide variety of cell types,
Biotechnol. Bioeng., 2003, 83(2), 173–80.
192. J. M. Kelm, C. Diaz Sanchez-Bustamante, E. Ehler, S. P. Hoerstrup,
V. Djonov, L. Ittner and M. Fussenegger, VEGF profiling and
angiogenesis in human microtissues, J. Biotechnol., 2005, 118(2),
213–29.
389Tissue Engineering
CHAPTER 14
Transgenesis
ELIZABETH J. CARTWRIGHT AND XIN WANG
Faculty of Medical and Human Sciences and Faculty of Life Sciences,
University of Manchester, Oxford Road, Manchester M13 9PT, UK
14.1 INTRODUCTION
14.1.1 From Gene to Function
The sequencing of the human genome has had a major impact on our
understanding of our genetic make-up. Since its launch in 1990, the
Human Genome Project has worked towards the goal of sequencing
every gene in the human genome and mapping them to their precise
chromosomal locations. In 2001, draft sequences of the full human
genome were published and in 2004 were refined to reveal that there are
between 20 000 and 25 000 protein-encoding human genes.1,2 It is now
vital that we fully address the next big challenge – to identify the
function of these genes in both health and disease. A number of tech-
nologies are currently used to analyse mammalian gene function,
including the techniques that will be the focus of this chapter – trans-
genesis technologies.
This chapter will outline the transgenic techniques that are currently
used to modify the genome in order to extend our understanding of the
in vivo function of these genes in normal development and physiology,
and also in pathogenesis.
Molecular Biology and Biotechnology, 5th Edition
Edited by John M Walker and Ralph Rapleyr Royal Society of Chemistry 2009
Published by the Royal Society of Chemistry, www.rsc.org
390

Transgenesis is a general term which covers several ways of modifying
the genome of intact organisms, for example, it is possible to eliminate a
gene of interest or introduce extra pieces of DNA (overexpress) in a
whole organism or a specific tissue. Transgenesis can be carried out in
numerous organisms, including plants, the fruit fly (Drosophila), worm
(Caenorabditis elegans), frog (Xenopus), zebrafish, large mammals
including sheep and small mammals such as the rat and mouse. Each of
these model organisms is valuable in its own right; the fruit fly and the
worm have been used extensively to provide information regarding the
basic functional processes of organisms such as cell proliferation,
metabolic pathways and developmental processes. The zebrafish is
particularly suited to use in studies to elucidate vertebrate gene function
and large mammals have even been used as ‘bio incubators’ to produce
recombinant proteins. Although historically the rat has been used in
many physiological experiments, the ability to modify its genome is
much more limited than in the mouse. Subsequently, it is the mouse that
has become by far the most popular organism in which to study mam-
malian gene function and in particular human disease.
This chapter will outline the most commonly used transgenic tech-
nologies applied to the mouse genome, including overexpression trans-
genesis, gene targeting and conditional gene targeting. In addition, it will
outline how we determine in vivo function in the mice that are generated
by these transgenic techniques and, finally, we address some of the
ethical issues which must be considered when using animals as a model
system for research.
14.2 TRANSGENESIS BY DNA PRONUCLEAR INJECTION
Transgenesis by DNA pronuclear injection is the oldest and still the
most widely used method of introducing foreign genes into the mam-
malian germline, subsequently to generate mammalian transgenic ani-
mals (including mice, rats and livestock). The basis of this technique,
which was developed in the early 1980s by, amongst others, Gordon,
Ruddle, Brinster, Palmiter and colleagues,3–5 is the microinjection of
DNA of interest (the transgene) into the pronucleus of fertilised oocytes
(single-cell embryos) leading to the ectopic expression (overexpression)
of the transgene in the genome.
14.2.1 Generation of a Transgenic Mouse
This is a multi-step process (Figure 14.1) which begins with the con-
struction of the transgene, involves collection of fertilised oocytes,
391Transgenesis
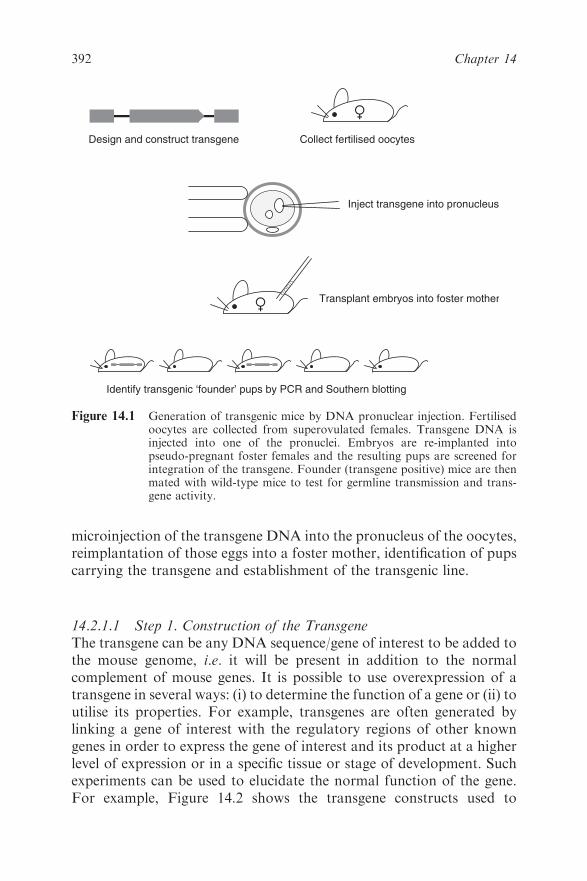
microinjection of the transgene DNA into the pronucleus of the oocytes,
reimplantation of those eggs into a foster mother, identification of pups
carrying the transgene and establishment of the transgenic line.
14.2.1.1 Step 1. Construction of the Transgene
The transgene can be any DNA sequence/gene of interest to be added to
the mouse genome, i.e. it will be present in addition to the normal
complement of mouse genes. It is possible to use overexpression of a
transgene in several ways: (i) to determine the function of a gene or (ii) to
utilise its properties. For example, transgenes are often generated by
linking a gene of interest with the regulatory regions of other known
genes in order to express the gene of interest and its product at a higher
level of expression or in a specific tissue or stage of development. Such
experiments can be used to elucidate the normal function of the gene.
For example, Figure 14.2 shows the transgene constructs used to
Collect fertilised oocytesDesign and construct transgene
Inject transgene into pronucleus
Transplant embryos into foster mother
Identify transgenic ‘founder’ pups by PCR and Southern blotting
Figure 14.1 Generation of transgenic mice by DNA pronuclear injection. Fertilisedoocytes are collected from superovulated females. Transgene DNA isinjected into one of the pronuclei. Embryos are re-implanted intopseudo-pregnant foster females and the resulting pups are screened forintegration of the transgene. Founder (transgene positive) mice are thenmated with wild-type mice to test for germline transmission and trans-gene activity.
392 Chapter 14

overexpress the plasma membrane calcium pump isoform 4 (PMCA4) in
the cardiomyocytes (under the regulation of the MLC2v promoter) and
in the vascular smooth muscle (driven by the SM22a promoter) – ana-
lysis of these transgenic lines has revealed that PMCA4 is involved in
contractility in the heart and in the maintenance of peripheral blood
pressure and vascular tone.6,7 It is possible to use DNA pronuclear
injection experiments to determine the function of regulatory elements
of genes by fusing them to a reporter gene such as LacZ or GFP, whose
expression can be readily detected.8,9 It is also possible to use a transgene
to express the wild-type form of a gene in a mouse that carries an
endogenous mutant form i.e. it can be used to rescue a genetic defect.10
Transgene design has a major influence on the successful expression of
the microinjected DNA; there are a number of elements that must be
incorporated into the transgene construct, in addition to the protein
coding sequence of the gene of interest, that are critical for gene expres-
sion. Essentially a transgene should also contain a promoter, an intron
and a transcriptional stop sequence. The promoter is the regu-
latory sequence which determines in which cells and at what time the
MLC2v
promoter PMCA4b cDNA SV40 polyA
synthetic
intronic
sequence
SV40
intron
SM22α
promoter PMCA4b cDNA SV40 polyA
synthetic
intronic
sequence
Figure 14.2 Construction of transgene. Examples of two transgenes designed tooverexpress isoform 4 of the plasma membrane calcium pump(PMCA4b) in different tissues. Both constructs contain the same essen-tial elements, i.e. a promoter sequence, cDNA of the gene of interest, aregion of intronic sequence and a polyA tail. The top panel will result inthe overexpression of PMCA4b in the heart, whereas the transgene in thebottom panel was designed to overexpress PMCA4b in vascular smoothmuscle cells.
393Transgenesis
transgene is active and is usually derived from sequences upstream of, and
including, the transcriptional start site which contain the necessary reg-
ulatory elements for transcription. The protein coding sequence is usually
derived from the cDNA of the gene of interest and will contain both the
ATG start codon and a translational stop codon. It is important to
include an intron in the transgene construct as this increases transgene
activity;11 however, this does not need to be an intron from the gene of
interest. It is not clear why the inclusion of an intron has a positive effect
on transgene expression, but it is hypothesised to be due to a functional
link between transcription and splicing. The transgene must also contain
a transcriptional stop signal including a polyA addition sequence (AAA-
UAA). A number of transgenes have included both the intron and tran-
scriptional stop signal at the end of the coding sequence (as in Figure 14.2:
SM22a–PMCA4b transgene), although they can be included separately
(see Figure 14.2: MLC2v–PMCA4b transgene).
It is clear that the construction of a transgene is a multi-step cloning
process which is most conveniently carried out in a bacterial plasmid. It
has been shown that it is important to remove all of the prokaryotic
plasmid sequences from the transgene prior to microinjection as its
inclusion may inhibit its expression.12 It is also clear that DNA that has
been linearised prior to microinjection, rather than being left in its circular
or supercoiled state, will integrate with greater efficiency.13 Interestingly,
although a large transgene (430kb) may present technical difficulties
when cloning and isolating the DNA, their large size does not appear to
effect the frequency of integration into the genome. The final aspect to
consider is the purity of the DNA to be microinjected as it must be free of
any contaminants which might be harmful to the oocytes to be injected.
14.2.1.2 Step 2. Collection of Fertilised Oocytes
To improve the efficiency of the generation of the transgenic mice, it is
essential to have a large number of viable fertilised eggs (oocytes)
available for microinjection. Normally female mice will generate 6–10
eggs when naturally ovulating; however, it is possible to recover 20–30
eggs from a single female by inducing superovulation. The consequence
is that less female mice are required for the production of a suitable
number of quality eggs. Young female mice are injected with a combi-
nation of hormones, which mimic natural mouse hormones, and these
ensure that large numbers of mature eggs are released from the ovaries
simultaneously; treatment with follicle stimulating hormone is followed
44–48 h later by treatment with leutinising hormone. Fertilised oocytes
are collected from the oviducts of the females following overnight
394 Chapter 14
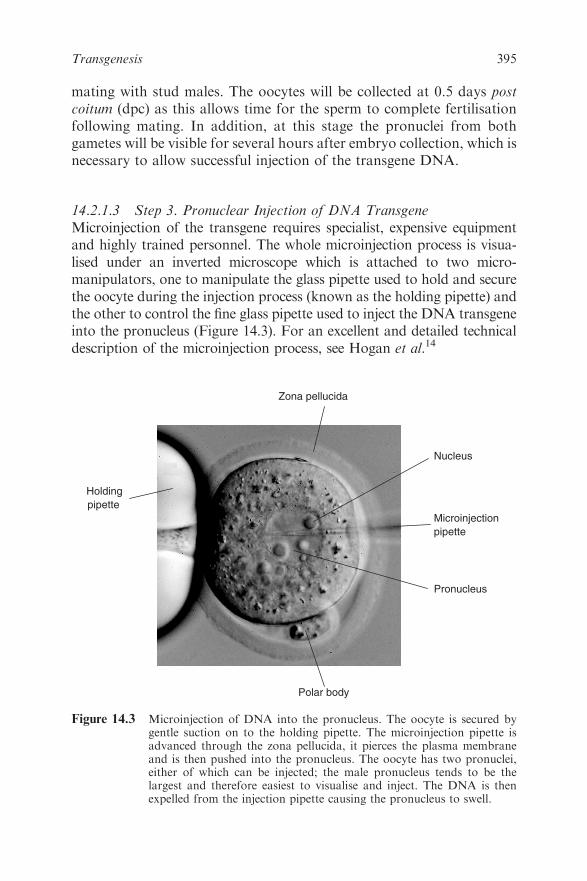
mating with stud males. The oocytes will be collected at 0.5 days post
coitum (dpc) as this allows time for the sperm to complete fertilisation
following mating. In addition, at this stage the pronuclei from both
gametes will be visible for several hours after embryo collection, which is
necessary to allow successful injection of the transgene DNA.
14.2.1.3 Step 3. Pronuclear Injection of DNA Transgene
Microinjection of the transgene requires specialist, expensive equipment
and highly trained personnel. The whole microinjection process is visua-
lised under an inverted microscope which is attached to two micro-
manipulators, one to manipulate the glass pipette used to hold and secure
the oocyte during the injection process (known as the holding pipette) and
the other to control the fine glass pipette used to inject the DNA transgene
into the pronucleus (Figure 14.3). For an excellent and detailed technical
description of the microinjection process, see Hogan et al.14
Zona pellucida
Polar body
Nucleus
Pronucleus
Microinjection
pipette
Holding
pipette
Figure 14.3 Microinjection of DNA into the pronucleus. The oocyte is secured bygentle suction on to the holding pipette. The microinjection pipette isadvanced through the zona pellucida, it pierces the plasma membraneand is then pushed into the pronucleus. The oocyte has two pronuclei,either of which can be injected; the male pronucleus tends to be thelargest and therefore easiest to visualise and inject. The DNA is thenexpelled from the injection pipette causing the pronucleus to swell.
395Transgenesis
It is usual that between 60 and 80% of the microinjected embryos will
survive the process (viability can be tested by culturing the embryos to the
two-cell stage) and be suitable for re-implantation into a surrogate female.
Surrogate/recipient females are rendered pseudo-pregnant by mating with
either a vasectomised or genetically sterile male. Of these re-implanted
embryos, between 10 and 25% will survive to term. It is this high attrition
rate of embryos at each stage which necessitates the use of such large
numbers of fertilised eggs at the beginning of the whole procedure.
The transgene will integrate randomly into the genome, into any chro-
mosome, including the sex chromosomes and often in multiple copies in a
head-to-tail array.15 Interestingly, it appears that integration most often
occurs at just one site in the genome, even if multiple copies integrate.
Experience has shown that when microinjecting linearised DNA,
approximately 25% of the resulting pups carry the transgene, these are
known as founder transgenics. Due to the precise timing of injection and
therefore integration of the transgene into the pronucleus, prior to
replication, a high proportion (approximately 70%) of the transgenic
mice will carry the transgene in every cell of the body. It is essential that
the transgene integrates into the germ cells to be able to transmit the
gene modification to the next generation. In those mice in which inte-
gration of the transgene occurred after DNA replication, the transgene
will integrate into a proportion of the somatic and germ cells only; these
mice are known as mosaics.
14.2.1.4 Step 4. Generation of a Transgenic Line
Founder transgenic mice are identified by DNA analysis including PCR
and Southern blotting. It is common for DNA to be isolated from small
pieces of tissue taken from the ears of the mice or from a small section of
the end of the tail. The presence or absence of the transgene can be
identified by PCR analysis using transgene-specific primers which will
not amplify the endogenous gene locus. Southern blot analysis is then
used to verify the integration of the transgene and to identify the number
of copies that have inserted into the genome.
Once founders have been identified, they must be bred to wild-type
mice to determine if the transgene can be passed to the next generation;
in other words, they will be tested for germline transmission. The
resultant pups must then be screened by PCR to identify heterozygous
(Tg/+) transgenic mice from their wild-type (+/+) littermates – these
would be expected in a 50:50 ratio.
One of the main drawbacks of generating transgenic mice by pro-
nuclear injection of DNA is the so called position effect, i.e. the
396 Chapter 14

transgene can integrate at any chromosomal location and the site of
integration itself could effect its expression. For example, a transgene
could insert into a region of the chromosome that suppresses gene
activity or could even insert into a functioning endogenous gene. Both of
these scenarios would lead to a phenotype that is not solely due to the
effect of the transgene. It is therefore essential that the phenotype of at
least three independent founder lines carrying the same transgene are
analysed to determine the effect of overexpression of the gene of interest.
14.2.2 Summary of Advantages and Disadvantages of Generating
Transgenic Mice by Pronuclear Injection of DNA
Although the generation of transgenic mice by DNA pronuclear injection
has several disadvantages and the list of potential technical problems is
lengthy (for example, see Ref. 14), it remains a very rewarding technique
which provides essential information regarding the biological function of a
gene. Table 14.1 summarises the major advantages and disadvantages of
this process.
14.3 GENE TARGETING BY HOMOLOGOUS
RECOMBINATION IN EMBRYONIC STEM CELLS
Gene targeting was developed to ablate (knock out) the function of a
specific gene. Although gene targeting is still most commonly used to
generate this type of mutation, the method is now the basis of many
techniques which can produce a whole variety of DNA modifications to
Table 14.1 Advantages and disadvantages of generating transgenic mice by
pronuclear injection of DNA.
AdvantagesConceptually straightforwardCloned DNA from any species can be microinjectedIntegration of transgene is relatively efficientProcess is relatively quick – taking as little as 3 months to generate a construct,microinject DNA, analyse genotype of founder pups and test for germline transmissionof the transgene
DisadvantagesMicroinjection requires specialist, expensive equipment and highly trained personnelIntegration site is random which may affect the level and pattern of expression.Therefore, need to analyse the phenotype (effect of the gene deletion) of mice fromseveral founder lines
The endogenous gene remains intact in the genome which may complicate molecular andphenotypic analysis
397Transgenesis
the mouse genome, including the deletion/rearrangement of large
regions of chromosomes containing multiple genes,16,17 the introduction
of subtle mutations into the genome,18,19 the knock-in of a gene of
interest20–22 and conditional gene targeting (see Section 14.4).
The technique of gene targeting in the mouse has enabled major
advances to be made in our understanding of mammalian gene function,
in normal developmental, biochemical and physiological processes, and
also in disease processes. The technique was established by bringing
together two important findings (i) that homologous recombination can
be used to modify specifically a target mammalian gene and (ii) that
embryonic stem cells isolated from pre-implantation stage mouse embryos
can be maintained in culture and then used to contribute to the germline
of another mouse. The importance of this technique to biomedical
research was acknowledged when Mario R. Capecchi, Martin J. Evans
and Oliver Smithies jointly received the Nobel Prize in Physiology or
Medicine 2007 for their discoveries of the ‘principles for introducing spe-
cific gene modifications in mice by the use of embryonic stem cells’.
14.3.1 Basic Principles
14.3.1.1 Homologous Recombination
Homologous recombination is used to introduce modifications into a
gene by exchanging endogenous DNA sequences in the chromosome with
cloned DNA sequences (targeting vector). Gene targeting by homologous
recombination in mammalian cells was first reported in 1985,23,24 allow-
ing for the stable insertion of DNA into the genome at a predictable site.
14.3.1.2 Embryonic Stem Cells
Embryonic stem (ES) cells are isolated from the inner cell mass of pre-
implantation stage embryos at 3.5 days post coitum; at this stage
embryos are known as blastocysts. The crucially important factor about
the progenitor cells of these early embryos is that they are pluripotent –
they have the potential to differentiate into any cell type, including the
germ cells, of the subsequent embryo. It was in 1986 that Evans and
colleagues demonstrated that these ES cells could be maintained in
culture, where they could be genetically modified and then used to
repopulate the germline of another mouse, thereby generating chimeric
offspring containing genetic material from both the recipient mouse and
the ES cells.25 The chimeric mice, when mated, could pass on the genetic
mutation to the next generation; with the mutation being inherited
according to Mendel’s laws of genetics.
398 Chapter 14
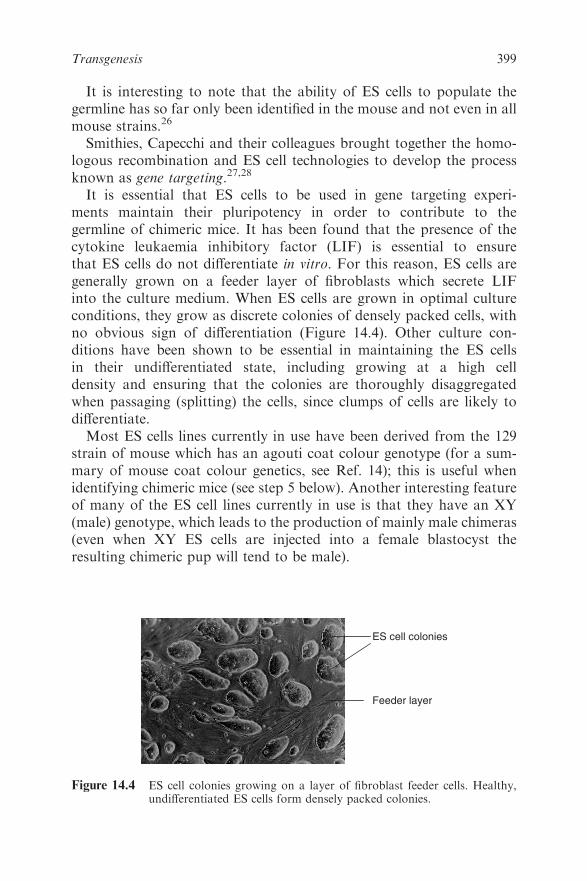
It is interesting to note that the ability of ES cells to populate the
germline has so far only been identified in the mouse and not even in all
mouse strains.26
Smithies, Capecchi and their colleagues brought together the homo-
logous recombination and ES cell technologies to develop the process
known as gene targeting.27,28
It is essential that ES cells to be used in gene targeting experi-
ments maintain their pluripotency in order to contribute to the
germline of chimeric mice. It has been found that the presence of the
cytokine leukaemia inhibitory factor (LIF) is essential to ensure
that ES cells do not differentiate in vitro. For this reason, ES cells are
generally grown on a feeder layer of fibroblasts which secrete LIF
into the culture medium. When ES cells are grown in optimal culture
conditions, they grow as discrete colonies of densely packed cells, with
no obvious sign of differentiation (Figure 14.4). Other culture con-
ditions have been shown to be essential in maintaining the ES cells
in their undifferentiated state, including growing at a high cell
density and ensuring that the colonies are thoroughly disaggregated
when passaging (splitting) the cells, since clumps of cells are likely to
differentiate.
Most ES cells lines currently in use have been derived from the 129
strain of mouse which has an agouti coat colour genotype (for a sum-
mary of mouse coat colour genetics, see Ref. 14); this is useful when
identifying chimeric mice (see step 5 below). Another interesting feature
of many of the ES cell lines currently in use is that they have an XY
(male) genotype, which leads to the production of mainly male chimeras
(even when XY ES cells are injected into a female blastocyst the
resulting chimeric pup will tend to be male).
ES cell colonies
Feeder layer
Figure 14.4 ES cell colonies growing on a layer of fibroblast feeder cells. Healthy,undifferentiated ES cells form densely packed colonies.
399Transgenesis
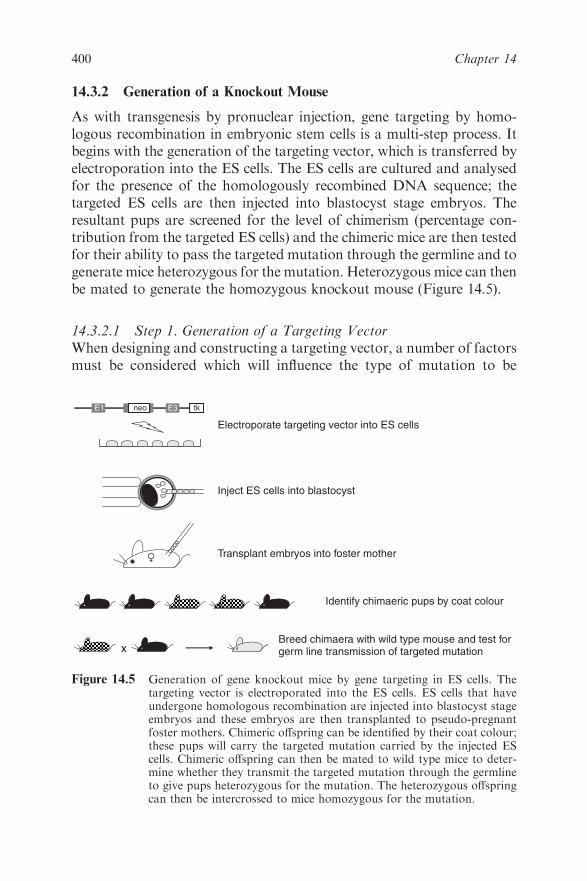
14.3.2 Generation of a Knockout Mouse
As with transgenesis by pronuclear injection, gene targeting by homo-
logous recombination in embryonic stem cells is a multi-step process. It
begins with the generation of the targeting vector, which is transferred by
electroporation into the ES cells. The ES cells are cultured and analysed
for the presence of the homologously recombined DNA sequence; the
targeted ES cells are then injected into blastocyst stage embryos. The
resultant pups are screened for the level of chimerism (percentage con-
tribution from the targeted ES cells) and the chimeric mice are then tested
for their ability to pass the targeted mutation through the germline and to
generate mice heterozygous for the mutation. Heterozygous mice can then
be mated to generate the homozygous knockout mouse (Figure 14.5).
14.3.2.1 Step 1. Generation of a Targeting Vector
When designing and constructing a targeting vector, a number of factors
must be considered which will influence the type of mutation to be
Transplant embryos into foster mother
E3E1 neo tk
Electroporate targeting vector into ES cells
Identify chimaeric pups by coat colour
Inject ES cells into blastocyst
xBreed chimaera with wild type mouse and test for germ line transmission of targeted mutation
Figure 14.5 Generation of gene knockout mice by gene targeting in ES cells. Thetargeting vector is electroporated into the ES cells. ES cells that haveundergone homologous recombination are injected into blastocyst stageembryos and these embryos are then transplanted to pseudo-pregnantfoster mothers. Chimeric offspring can be identified by their coat colour;these pups will carry the targeted mutation carried by the injected EScells. Chimeric offspring can then be mated to wild type mice to deter-mine whether they transmit the targeted mutation through the germlineto give pups heterozygous for the mutation. The heterozygous offspringcan then be intercrossed to mice homozygous for the mutation.
400 Chapter 14
introduced, the efficiency of targeting and the ease with which successful
targeting can be detected.
DNA homologous with the chromosomal/gene site of interest. For suc-
cessful and efficient targeting, the vector must contain at least 5–10 kb of
isogenic DNA homologous with the sequence to be targeted. This
homologous sequence is divided between the short arm of homology
(1–1.5 kb) and a long arm of homology (4–8 kb); this permits easy
screening of the ES clones. It is ideal to identify gene targeted colonies
by PCR designed to span the short arm of homology. It is known that
the efficiency of homologous recombination is decreased when there are
base pair differences between the donor and recipient DNA.29 For this
reason, it is now common practice for the DNA used to construct the
targeting vector to originate from the same mouse strain as the ES cells
(i.e. isogenic DNA).
Positive and negative selection cassettes. Since gene targeting by
homologous recombination occurs at low frequencies (typically 10�5–10�6
of ES cells treated with construct DNA) and the targeting construct is
much more likely to insert randomly into the genome, it is essential to be
able to screen ES cell colonies quickly and efficiently for successful tar-
geting. For this reason, most targeting vectors will be designed to insert a
positive selection cassette into the gene of interest. For example, the
neomycin phosphotransferase gene (neo) is often used as a positive mar-
ker, which when expressed in the ES cell genome will render the cells
resistant to treatment with the antibiotic neomycin sulfate (G418).
A negative selection marker can also be used to enrich for gene targeted
colonies. The selection marker is cloned outside of the homologous
sequence in the targeting vector and will therefore not insert into the
genome when homologous recombination occurs, but will insert into the
genome if random integration of the targeting vector occurs. For example,
the herpes simplex virus thymidine kinase gene (HSVtk) when expressed in
ES cells will produce a toxic product in the presence of gancyclovir
(a thymidine analogue), killing ES cells expressing this gene (Figure 14.6).
14.3.2.2 Step 2. ES Cell Transfection
The most efficient method for introducing the targeting vector into the
ES cells is by electroporation. The linearised vector DNA is electro-
porated into a large number of ES cells in a single cell suspension; the
cells are then plated on to fresh feeder cells. Then, 24 h after electro-
poration, the selection process can begin, which will kill cells which have
not incorporated the targeting vector by homologous recombination.
The ES cells are cultured in media containing the drugs used for
401Transgenesis
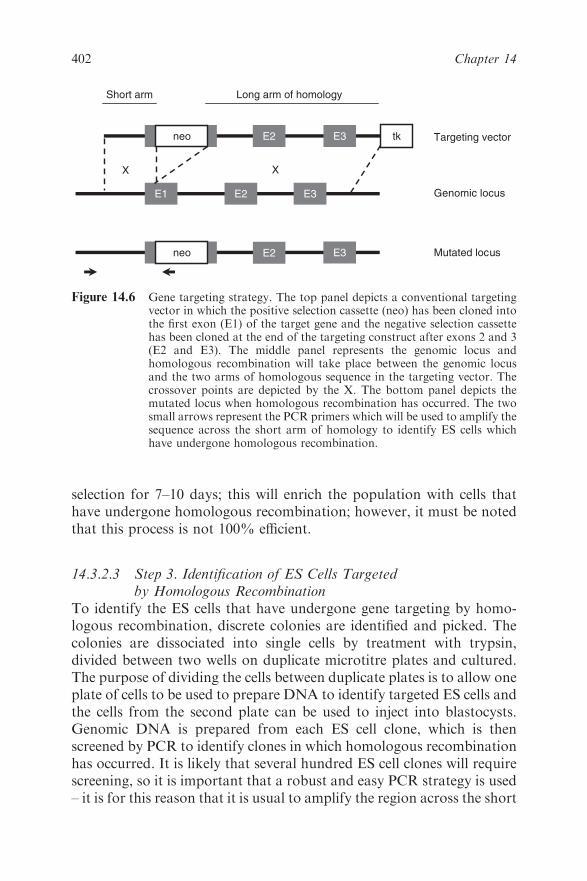
selection for 7–10 days; this will enrich the population with cells that
have undergone homologous recombination; however, it must be noted
that this process is not 100% efficient.
14.3.2.3 Step 3. Identification of ES Cells Targeted
by Homologous Recombination
To identify the ES cells that have undergone gene targeting by homo-
logous recombination, discrete colonies are identified and picked. The
colonies are dissociated into single cells by treatment with trypsin,
divided between two wells on duplicate microtitre plates and cultured.
The purpose of dividing the cells between duplicate plates is to allow one
plate of cells to be used to prepare DNA to identify targeted ES cells and
the cells from the second plate can be used to inject into blastocysts.
Genomic DNA is prepared from each ES cell clone, which is then
screened by PCR to identify clones in which homologous recombination
has occurred. It is likely that several hundred ES cell clones will require
screening, so it is important that a robust and easy PCR strategy is used
– it is for this reason that it is usual to amplify the region across the short
E2 E3E1
E3E2neo tk
E3E2neo
Targeting vector
Genomic locus
Mutated locus
Short arm Long arm of homology
X X
Figure 14.6 Gene targeting strategy. The top panel depicts a conventional targetingvector in which the positive selection cassette (neo) has been cloned intothe first exon (E1) of the target gene and the negative selection cassettehas been cloned at the end of the targeting construct after exons 2 and 3(E2 and E3). The middle panel represents the genomic locus andhomologous recombination will take place between the genomic locusand the two arms of homologous sequence in the targeting vector. Thecrossover points are depicted by the X. The bottom panel depicts themutated locus when homologous recombination has occurred. The twosmall arrows represent the PCR primers which will be used to amplify thesequence across the short arm of homology to identify ES cells whichhave undergone homologous recombination.
402 Chapter 14
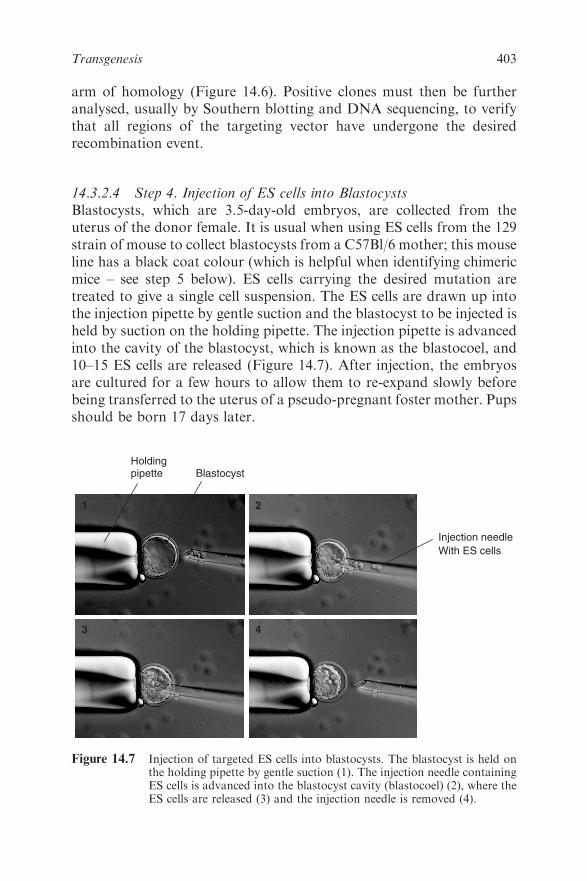
arm of homology (Figure 14.6). Positive clones must then be further
analysed, usually by Southern blotting and DNA sequencing, to verify
that all regions of the targeting vector have undergone the desired
recombination event.
14.3.2.4 Step 4. Injection of ES cells into Blastocysts
Blastocysts, which are 3.5-day-old embryos, are collected from the
uterus of the donor female. It is usual when using ES cells from the 129
strain of mouse to collect blastocysts from a C57Bl/6 mother; this mouse
line has a black coat colour (which is helpful when identifying chimeric
mice – see step 5 below). ES cells carrying the desired mutation are
treated to give a single cell suspension. The ES cells are drawn up into
the injection pipette by gentle suction and the blastocyst to be injected is
held by suction on the holding pipette. The injection pipette is advanced
into the cavity of the blastocyst, which is known as the blastocoel, and
10–15 ES cells are released (Figure 14.7). After injection, the embryos
are cultured for a few hours to allow them to re-expand slowly before
being transferred to the uterus of a pseudo-pregnant foster mother. Pups
should be born 17 days later.
1
3
Holdingpipette Blastocyst
Injection needle
With ES cells
2
4
Figure 14.7 Injection of targeted ES cells into blastocysts. The blastocyst is held onthe holding pipette by gentle suction (1). The injection needle containingES cells is advanced into the blastocyst cavity (blastocoel) (2), where theES cells are released (3) and the injection needle is removed (4).
403Transgenesis
14.3.2.5 Step 5. Identification of Chimeric Mice and Breeding to
Generate Homozygous Mutant (Knockout) Mice
Approximately 1 week after mouse pups are born, their coat colour
becomes apparent. At this stage, it is possible to identify agouti from
non-agouti coat colour. It is therefore possible to identify chimeric mice
by their coat colour if ES cells from the 129 mouse strain (agouti) have
contributed to the development of a C57Bl/6 embryo (non-agouti).
Embryos in which the ES cells had made no contribution would appear
as wild-type C57Bl/6 (black), whereas those pups in which the 129 ES
cells had made a contribution would contain a certain level of agouti
coat colouring. Chimeric mice therefore contain some cells carrying the
targeted mutation on one allele and other cells which are wild type.
To generate a gene knockout mouse, it is essential that some of the
germ cells carry the targeted mutation. To test for germline transmission
of the mutation, chimeric mice are bred to wild-type mice; should germ-
line transmission occur, a proportion of the pups will be heterozygous for
the targeted mutation. Heterozygous mice can then be bred to produce
mice homozygous for the targeted mutation – gene knockout mice.
14.3.3 Summary of Advantages and Disadvantages of Generating
Gene Knockout Mice
As will be evident from the section above, the generation of a knockout
mouse by gene targeting in ES cells is not a process to be undertaken
lightly. It is labour intensive, technically demanding and fraught with
problems; however, with good experimental design and know-how, this
technique will provide enormous amounts of invaluable information
about the function of the target gene. Table 14.2 summarises the major
advantages and disadvantages of this process.
14.4 CONDITIONAL GENE TARGETING
As has been described above, gene targeting has rapidly become a highly
developed technology that facilitates the study of gene function. How-
ever, 15–20% of germline mutations result in embryonic lethality,30
thereby precluding analysis of gene function in the adult tissues.
Moreover, gene targeting disrupts the function of the gene within all
tissues, creating a complex phenotype in which it may be difficult to
distinguish direct function of the gene of interest in a particular tissue
from any secondary effects. To resolve these critical problems, Gu et al.
developed the conditional inactivation of gene expression using the Cre–
loxP system.31
404 Chapter 14

Cre (Cause recombination) recombinase is a 38 kDa enzyme isolated
from the P1 bacteriophage. The loxP site is a 34 bp sequence comprising
two 13 bp inverted repeats separated by an asymmetric 8 bp core which
indicates the orientation of the loxP site (Figure 14.8). The Cre recom-
binase efficiently binds the two loxP sites and catalyses the recombina-
tion, resulting in the deletion, inversion or translocation of the sequences
between the two recombination sites, according to the orientation of two
loxP sites (Figure 14.9).
Cre is not the only recombinase that has been described for use in
conditional gene targeting; Flp recombinase from Saccharomyces cere-
visiae is also used.32 Similarly to the Cre–loxP system, Flp recognises
two FRT sites (34 bp DNA sequence) and catalyses the DNA recom-
bination between the two recombination sites. The Flp recombinase is
not as effective as Cre at 37 1C; its optimum function is at 25–30 1C.33
The use of the Flp–FRT system is not as widespread as that of the Cre–
loxP system, due to the limited availability of mouse lines expressing the
Table 14.2 Advantages and disadvantages of generating a knockout mouse by
gene targeting in embryonic stem cells.
AdvantagesThe integration site and therefore the gene modification are highly specificA variety of mutations can be achieved including null mutations (gene knockout),deletion/rearrangement of large regions of chromosomes, site-specific mutations, geneknock-in
Recessive alleles can be studied
DisadvantagesMicroinjection requires specialist, expensive equipment and highly trained personnelProcess is very time consuming, taking 1.5–2 years to generate a targeting vector, targetES cells, identify homologous recombination events, microinject ES cells and testchimeric pups for germline transmission of mutation
Process is expensive as it is labour intensive, requires expensive equipment and themouse husbandry costs will be high
Embryonic lethality – if the target gene is essential for development of the embryo, thenit will not be possible to study the role of the gene in the adult mouse
Sometimes difficult to determine if the phenotype observed is primarily due to thedeletion of the target gene or is a secondary consequence of the deletion of the targetgene on a downstream pathway
Figure 14.8 Scheme of Cre binding to the loxP site. Cre specifically recognises andbinds to inverted repeats surrounding an asymmetric 8 bp core region.
405Transgenesis

Flp recombinase. This section will therefore focus on the description of
the Cre–loxP recombination system.
14.4.1 Generation of a Conditional Knockout Mouse
Using the Cre–loxP System
The generation of conditional knockout mice is a multi-step process,
which involves mating two separate mouse lines generated by DNA
pronuclear injection and/or gene targeting by homologous recombina-
tion in ES cells.
1. Homologous recombination in embryonic stem (ES) cells is used to
generate mutant mice (Flox mice) in which the essential exon(s) of
the gene is flanked by two loxP sites. These sites do not interfere
with the normal expression of the gene but constitute a binding
domain for the Cre recombinase which will excise the DNA frag-
ment between the loxP sites.
2. Generating inducible and/or tissue-specific Cre-expressing mouse
lines by pronuclear injection or the knock-in method using
embryonic stem cells.
3. Crossing the Flox mouse with the specific Cre-expressing mouse to
achieve the deletion of the gene in a particular cell lineage or tissue
type at a certain time.
Cre
Deletion
A
Cre
Inversion
B
Cre
Reciprocal translocation
C
Figure 14.9 Cre-mediated recombination. The orientation of the loxP sites influencesthe type of recombination that occurs. (A) Deletion of DNA occursbetween two loxP sites in the same orientation; following recombinationone loxP site remains in the genome. (B) Inversion of DNA occursbetween two loxP sites in the opposite direction. (C) Reciprocal trans-location occurs between loxP sites placed in non-homologous chromo-somes. The arrow heads indicate the orientation of the loxP sites.
406 Chapter 14
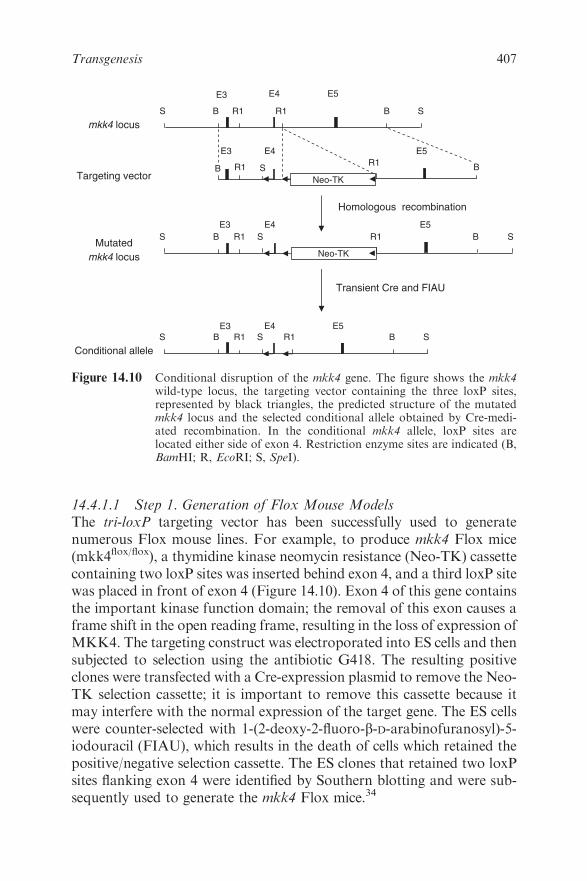
14.4.1.1 Step 1. Generation of Flox Mouse Models
The tri-loxP targeting vector has been successfully used to generate
numerous Flox mouse lines. For example, to produce mkk4 Flox mice
(mkk4flox/flox), a thymidine kinase neomycin resistance (Neo-TK) cassette
containing two loxP sites was inserted behind exon 4, and a third loxP site
was placed in front of exon 4 (Figure 14.10). Exon 4 of this gene contains
the important kinase function domain; the removal of this exon causes a
frame shift in the open reading frame, resulting in the loss of expression of
MKK4. The targeting construct was electroporated into ES cells and then
subjected to selection using the antibiotic G418. The resulting positive
clones were transfected with a Cre-expression plasmid to remove the Neo-
TK selection cassette; it is important to remove this cassette because it
may interfere with the normal expression of the target gene. The ES cells
were counter-selected with 1-(2-deoxy-2-fluoro-b-D-arabinofuranosyl)-5-
iodouracil (FIAU), which results in the death of cells which retained the
positive/negative selection cassette. The ES clones that retained two loxP
sites flanking exon 4 were identified by Southern blotting and were sub-
sequently used to generate the mkk4 Flox mice.34
S
E4
E4
Mutated
mkk4 locus
Conditional allele
Targeting vector
S
mkk4 locus
S
E3
Transient Cre and FIAU
B
E4
R1
E5
B
E3
B R1R1
E5
B
E3
B R1 R1
E5
S
B
Homologous recombination
Neo-TK
Neo-TK
S
E3
B R1
E4
R1
E5
BS S
SR1
S
Figure 14.10 Conditional disruption of the mkk4 gene. The figure shows the mkk4wild-type locus, the targeting vector containing the three loxP sites,represented by black triangles, the predicted structure of the mutatedmkk4 locus and the selected conditional allele obtained by Cre-medi-ated recombination. In the conditional mkk4 allele, loxP sites arelocated either side of exon 4. Restriction enzyme sites are indicated (B,BamHI; R, EcoRI; S, SpeI).
407Transgenesis

14.4.1.2 Step 2. Generation of the Cre-expressing Mouse Lines
Over the past few years, many tissue-specific Cre mouse lines have been
developed which have greatly facilitated the study of gene function.
Established Cre lines can be identified using a database (http://
www.mshri.on.ca/nagy/Cre-pub.html). The core part of this approach is
to choose a tissue-specific promoter which drives Cre expression speci-
fically and efficiently. Three methods are widely used for generating Cre
mouse models:
1. Standard transgenesis by pronuclear injection. The generation of a
Cre-expressing mouse in which a transgene vector consisting of Cre
driven by a tissue-specific promoter is inserted into the genome by
standard transgenesis is the most popular method. It is a relatively
rapid procedure with a straightforward concept and in many cases
has generated very efficient Cre lines. However, this method
involves random integration of the Cre-transgene into the genome,
which sometimes results in unwanted Cre expression or low Cre
expression levels which prohibits any further analysis of the
function of the gene of interest.
2. Bacterial artificial chromosome (BAC) transgenesis. BAC clones
contain large fragments of mouse genomic DNA, including most
regulatory elements of the chosen promoter; hence introducing Cre
into the BAC presents an advantage that the Cre expression pat-
tern reflects truthful endogenous gene expression. The main
drawbacks of this technique are that an additional loxP site exists
in the BAC vector which needs to be removed prior to pronuclear
injection and that other genes and their promoter regions may exist
within the BAC vector and may therefore interfere with the desired
Cre expression pattern.35
3. Knock-in approach using homologous recombination in ES cells. The
knock-in strategy requires homologous recombination in ES cells
to insert the Cre recombinase construct downstream of the endo-
genous targeted promoter. The advantage of this approach is that
Cre expression is closely correlated to the expression profile of the
chosen promoter; however, as has already been highlighted in this
chapter, this is a long and expensive procedure.
Many genes have different functions, from developmental stages to
adulthood. Using an early promoter (i.e. the promoter from a gene that is
expressed very early in development) to drive Cre activity in a tissue-
specific gene-knockout system sometimes results in embryonic lethality.
To overcome this limitation, inducible gene targeting was first developed
408 Chapter 14
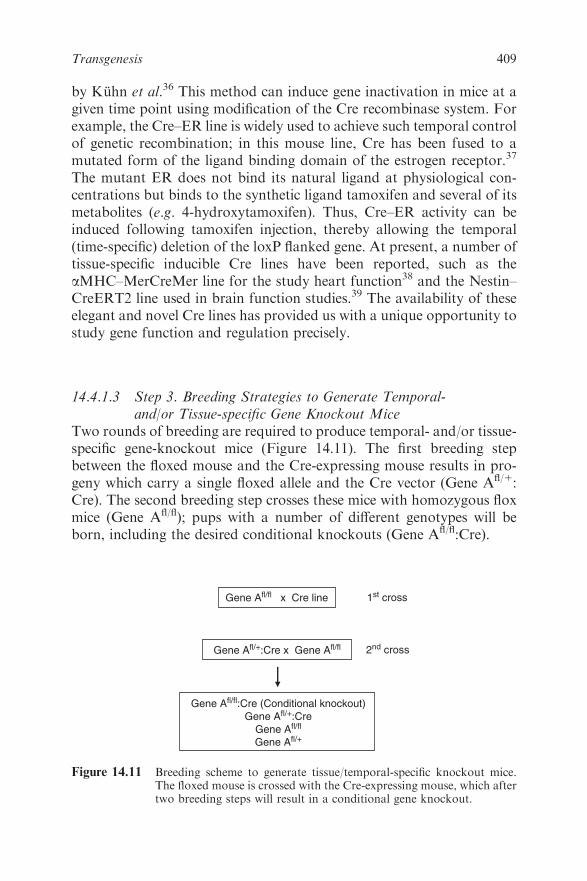
by Kuhn et al.36 This method can induce gene inactivation in mice at a
given time point using modification of the Cre recombinase system. For
example, the Cre–ER line is widely used to achieve such temporal control
of genetic recombination; in this mouse line, Cre has been fused to a
mutated form of the ligand binding domain of the estrogen receptor.37
The mutant ER does not bind its natural ligand at physiological con-
centrations but binds to the synthetic ligand tamoxifen and several of its
metabolites (e.g. 4-hydroxytamoxifen). Thus, Cre–ER activity can be
induced following tamoxifen injection, thereby allowing the temporal
(time-specific) deletion of the loxP flanked gene. At present, a number of
tissue-specific inducible Cre lines have been reported, such as the
aMHC–MerCreMer line for the study heart function38 and the Nestin–
CreERT2 line used in brain function studies.39 The availability of these
elegant and novel Cre lines has provided us with a unique opportunity to
study gene function and regulation precisely.
14.4.1.3 Step 3. Breeding Strategies to Generate Temporal-
and/or Tissue-specific Gene Knockout Mice
Two rounds of breeding are required to produce temporal- and/or tissue-
specific gene-knockout mice (Figure 14.11). The first breeding step
between the floxed mouse and the Cre-expressing mouse results in pro-
geny which carry a single floxed allele and the Cre vector (Gene Afl/1:
Cre). The second breeding step crosses these mice with homozygous flox
mice (Gene Afl/fl); pups with a number of different genotypes will be
born, including the desired conditional knockouts (Gene Afl/fl:Cre).
Gene Afl/fl x Cre line
Gene Afl/+:Cre x Gene Afl/fl
Gene Afl/fl:Cre (Conditional knockout)
Gene Afl/+:Cre
Gene Afl/fl
Gene Afl/+
1st cross
2nd cross
Figure 14.11 Breeding scheme to generate tissue/temporal-specific knockout mice.The floxed mouse is crossed with the Cre-expressing mouse, which aftertwo breeding steps will result in a conditional gene knockout.
409Transgenesis

14.4.2 Chromosomal Engineering Using the Cre–loxP System
Chromosomal abnormalities cause many human genetic disorders and
foetal loss, such as DiGeorge syndrome, which is due to the deletion of a
large region within chromosomal 22 and is characterised by congenital
heart defects, immunodeficiency and abnormal facial appearance. Due
to the restriction on working with human material and the lack of
experimental models, progress in dissecting the genetic basis underlying
congenital diseases has been slow. In 1999, Lindsay et al. made a
revolutionary step when they successfully created the DiGeorge mouse
model bearing the 1.2Mb chromosomal deletion using homologous
recombination in ES cells and the Cre–loxP technique.17 Due to the
unique properties of the Cre–loxP system, the manipulation of chro-
mosomal rearrangements (deletion, inversion or translocation) in order
to model human diseases has become feasible and this will greatly
empower scientists in studying human inherited diseases.
14.4.3 Summary of Advantages and Disadvantages of Conditional
Gene Targeting
Conditional gene targeting is an exceptionally elegant extension of the
classical gene targeting approach which permits the expression of a gene
modification at a given time and/or in a particular cell type or tissue. The
system can be exploited to introduce subtle mutations into the genome
and to make large chromosomal modifications. However, its disadvan-
tages must be fully considered before embarking on the study of gene
function using this system. Table 14.3 summarises the main advantages
and disadvantages of generating a conditional knockout mouse.
Table 14.3 Advantages and disadvantages of generating a conditional knock-
out mouse.
AdvantagesAvoids embryonic lethality and complicated secondary effects which can be induced byconventional gene targeting
Gene function can be studied in a specific cell type or tissue at any given time pointChromosomal abnormalities causing human diseases can be modelled in mice
DisadvantagesTwo transgenic lines (Flox mice and Cre mice) are required to generate conditionalknockout mouse models
Efficiency of gene deletion varies depending on the gene locus position and the Creactivity
Time consuming and expensive
410 Chapter 14
14.5 PHENOTYPIC ANALYSIS OF GENETICALLY
MODIFIED MICE
Genetically modified mice, generated by any of the techniques described
within this chapter, are merely a sophisticated tool with which to work
when determining the function of a gene. The mutant mouse must be
fully analysed at the molecular, biochemical and in vivo levels to
determine the function of that gene.
Initially all mice will be analysed to determine their genotype; for
example, PCR or Southern blot analysis will be carried out to determine
whether the mouse carries the desired gene mutation and whether it is
heterozygous or homozygous for the mutation.
It is the effect that the genotype has on the phenotype, the character-
istics and traits of the mouse, which is of key interest.
Having ascertained the genotype of the mouse, it is essential to
determine that the introduced genetic modification has resulted in the
desired altered gene regulation; for example, that disruption of the target
gene or the introduction of a DNA construct has resulted in the ablation
or overexpression of the gene product, respectively. RNA analysis by
reverse transcriptase PCR (RT-PCR) or real-time PCR, Northern
blotting or in situ hybridisation can be used to establish the expression
pattern of the transgene or confirm disruption/deletion of the gene of
interest. Modified levels/localisation of the gene product (protein) can
then be identified by Western blot analysis and immunohistochemistry.
Having identified the direct effect that the gene modification has had on
the gene of interest, it is important to investigate the downstream effects
of the gene modification by determining expression levels of genes in the
same pathways or known interaction partners, etc. DNA microarray
technologies are extremely valuable in identifying novel genes whose
expression may be influenced by modification of the gene of interest.40
The functional tests that must be carried out to determine the effect of
the gene modification will depend on each particular gene; for example,
it would be important to measure intracellular Ca21 levels in a mouse
model in which a calcium handling protein is disrupted or the activity of
an enzyme should be tested where the gene encoding that enzyme has
been modified.
To determine the role of the gene of interest in normal development,
physiology and pathology, there are numerous assessments that can be
carried out. The first thing to assess is whether the gene of interest is vital
to embryonic development and therefore whether its modification leads
to embryonic lethality. The simplest assessment is to analyse the geno-
typing results; for example, are homozygous gene knockout offspring
411Transgenesis
born when heterozygous mice are crossed? If the gene modification does
lead to a lethal phenotype, it will then be necessary to assess the point of
lethality and ultimately how and why the modification leads to
embryonic death.41
There is a vast array of tests that can be carried out to determine the
function of the gene in normal physiology, ranging from very simple
observations of the gross appearance of the mouse to extremely
sophisticated screens. For example, a comprehensive screening protocol
named SHIRPA has been developed to identify and characterise phe-
notypic changes associated with a gene mutation.42 This protocol
includes assessments of muscle and lower motor neurone function,
spinocerebellar function, sensory function, neuropsychiatric function
and autonomic function using a variety of functional, biochemical and
histological techniques. The effect of the gene mutation on other organ
systems including the heart can also be measured using specialised tests
and equipment.6,43 Simple breeding tests can be used to determine if the
gene modification affects fertility, which can then be followed up, for
example, with in depth analysis of sperm function.44
It is therefore the analysis of the functional, biochemical and mole-
cular changes that occur due to a gene modification that will help us to
determine the function of the genes in the genome.
14.6 ETHICAL AND ANIMAL WELFARE CONSIDERATIONS
The mouse has become an extremely popular model for the study of
mammalian gene function for a number of reasons. Although it has long
been known that the mouse has a similar physiological structure to
humans, we now know that approximately 99% of mouse genes have
human homologues.45 Mice are mammals and subsequently undergo
similar developmental processes to humans; they also have many phy-
siological and behavioural similarities. In addition, mice develop some
of the same diseases as humans, including cancer, cardiovascular dis-
ease, hypertension, obesity, diabetes, glaucoma, neurological defects,
deafness, osteoporosis and asthma. For these reasons, mice are con-
sidered by many as an essential biomedical tool in our armoury to
combat human disease through increased understanding of disease
mechanisms and development of therapeutic agents.
It is not only the physiological and genetic aspects of the mouse that
make it a suitable model for studying gene function; on a practical level,
the mouse is very convenient to work with as it has a short gestation
period (19–21 days), reaches breeding age within 6–8 weeks and colonies
are relatively inexpensive to maintain.
412 Chapter 14
It is clear, however, that the mouse is not without its disadvantages
when using it as a model in which to study human gene function and the
development of human disease. It is obvious that even though the two
species share 99% gene homology, millions of years of evolution have
resulted in major differences between the two species.
The mouse does not naturally develop all diseases exhibited by
humans; for example, one of the most important diseases of the elderly
population is Alzheimer’s disease, which mice do not normally develop.
However, genetic manipulation of the mouse genome through gene
targeting and transgenesis has enabled many aspects of this disease to be
modelled.46 In other instances, reproducing mutations in the mouse
genome which are known to cause disease in humans does not lead to
mimicking of the human phenotype.47,48 A recent development in
extending the use of the mouse as a model for human disease is by
‘humanising’ the mouse; this is a process which includes replacing large
segments of the mouse genome with the syntenic human sequence
(syntenic regions are areas of chromosomes in which genes occur in the
same order in different species), allowing both the gene itself and sur-
rounding regulatory regions to be replaced.49 This new adaptation of
transgenic technology promises to enable more accurate models of
human disease to be developed in the mouse. It is clear, therefore, that
the mouse is not a perfect model in which to study mammalian gene
function and for use as a model for human disease; however, the
application of transgenic techniques and genetic mutation in the mouse
genome has greatly informed our knowledge of gene function.
As research scientists using an animal system as a model, it is essential
that we consider the welfare of our animal models and must closely
weigh the benefit we gain from their use as part of our research against
the cost to their welfare. This chapter has so far highlighted the benefits
to research of transgenesis and of using the mouse as a model of human
disease; however, the cost to animals used in this research may include
suffering due to the phenotype caused by the genetic modification,
embryonic or post-natal death as a result of the effect of the genetic
modification or animal welfare may be comprised during the production
of the GM mice, e.g. by superovulation, vasectomy, embryo collection
and transfer.
There are many ways to ensure that a minimal number of animals are
used to gain the maximum amount of information. One essential
method is to ensure that animal experiments are carried out in combi-
nation with in vitro, cellular and bioinformatic techniques and are fully
informed by the findings of these other research methods. The number
of animals used can be reduced through good technical practice. It is
413Transgenesis
also important that a research project is continually assessed in the light
of new published data and that animal requirements are regularly
reassessed to ensure minimal animal usage to maximise statistical ana-
lyses throughout the course of a project.
Transgenesis is a powerful technology which has been and will con-
tinue to be used successfully to increase our knowledge of gene function
in health and disease. It is therefore incumbent on the researcher to
ensure that exemplary practice regarding animal welfare is used to
ensure that the cost:benefit ratio is correctly balanced.
14.7 CONCLUSIONS
The generation of mouse models using a variety of transgenesis tech-
niques in order to study gene function has been immensely popular
amongst researchers since the introduction of the techniques in the
1980s. This chapter gives an outline of several of the fundamental
technologies involved, but there are many aspects of transgenesis which
have not been addressed here, including the use of other model systems
from plants, non-vertebrates, other vertebrates and even large mammals
– all of which have an important place in research to determine gene
function.
Over recent years, we have gathered immense amounts of information
regarding mammalian gene function; however, we are still a long way
from knowing the function of the majority of the genes in the genome.50
The next major breakthrough in the use of transgenesis to understand
mammalian gene function will be the development of large-scale projects
which will systematically mutate every one of the 20 000–25 000 genes in
the genome. Several such projects are now under way, including
EUCOMM (European Conditional Mouse Mutagenesis Programme;
www.eucomm.org), which is a European Union-funded consortium,
KOMP (Knock-out Mouse Project; www.nih.gov/science/models/
mouse/knockout/index.html), which is funded by the National Institutes
of Health (NIH) in the USA, and NorCOMM (North American Con-
ditional Mouse Mutagenesis Programme; www.norcomm.org), which is
a Canadian project funded by Genome Canada, A number of other
consortia are also preparing to join the international effort to knock out
every gene in the genome.
14.8 ACKNOWLEDGEMENTS
We would like to thank Graham Morrissey and Lynnette Knowles for
some of the photographs used in this chapter.
414 Chapter 14
REFERENCES
1. J. D. McPherson, M. Marra, L. Hillier, R. H. Waterston,
A. Chinwalla and J. Wallis, et al., Nature, 2001, 409, 934.
2. International Human Genome Sequencing Consortium, Nature,
2004, 431, 931.
3. J. W. Gordon, G. A. Scangos, D. J. Plotkin, J. A. Barbosa and
F. H. Ruddle, Proc. Natl. Acad. Sci. USA, 1980, 77, 7380.
4. R. L. Brinster, H. Y. Chen, M. Trumbauer, A. W. Senear,
R. Warren and R. D. Palmiter, Cell, 1981, 27, 223.
5. R. D. Palmiter, H. Y. Chen and R. L. Brinster, Cell, 1982, 29, 701.
6. D. Oceandy, E. J. Cartwright, M. Emerson, S. Prehar, F. M. Bau-
doin, M. Zi, N. Alatwi, L. Venetucci, K. Schuh, J. C. Williams,
A. L. Armesilla and L. Neyses, Circulation, 2007, 115, 483.
7. K. Schuh, T. Quaschning, S. Knauer, K. Hu, S. Kocak, N.
Roethlein and L. Neyses, J. Biol. Chem., 2003, 278, 41246.
8. J. F. Schiltz, A. Rustighi, M. A. Tessari, J. Liu, P. Braghetta, R. Sgarra,
M. Stebel, G. M. Bressan, F. Altruda, V. Giancotti, K. Chada and
G. Manfioletti, Biochem. Biophys. Res. Commun., 2003, 309, 718.
9. N. Iguchi, H. Tanaka, S. Yamada, H. Nishimura and Y. Nishi-
mune, Biol. Reprod., 2004, 70, 1239.
10. A. A. Migchielsen, M. L. Breuer, M. S. Hershfield and D. Valerio,
Hum. Mol. Genet., 1996, 5, 1523.
11. T. Choi, M. Huang, C. Gorman and R. Jaenisch, Mol. Cell. Biol.,
1991, 11, 3070.
12. L. Kjer-Nielsen, K. Holmberg, J. D. Perera and J. McCluskey,
Transgenic Res., 1992, 1, 182.
13. R. L. Brinster, H. Y. Chen, M. E. Trumbauer, M. K. Yagle and R.
D. Palmiter, Proc. Natl. Acad. Sci. USA, 1985, 82, 4438.
14. B. Hogan, R. Beddington, F. Costantini and E. Lacy, Manipulating
the Mouse Embryo: a Laboratory Manual, Cold Spring Harbor
Laboratory Press, Cold Spring Harbor, NY, 1994.
15. F. Costantini and E. Lacy, Nature, 1981, 294, 92.
16. F. Buchholz, Y. Refaeli, A. Trumpp and J. M. Bishop, EMBO Rep.,
2000, 1, 133.
17. E. A. Lindsay, A. Botta, V. Jurecic, S. Carattini-Rivera, Y. C.
Cheah, H. M. Rosenblatt, A. Bradley and A. Baldini, Nature, 1999,
401, 379.
18. J. A. Cearley and P. J. Detloff, Transgenic Res., 2001, 10, 479.
19. P. Dickinson, W. L. Kimber, F. M. Kilanowski, S. Webb, B. J.
Stevenson, D. J. Porteous and J. R. Dorin, Transgenic Res., 2000,
9, 55.
415Transgenesis
20. Y. Geng, W. Whoriskey, M. Y. Park, R. T. Bronson, R. H.
Medema, T. Li, R. A. Weinberg and P. Sicinski, Cell, 1999, 97, 767.
21. N. Hosen, T. Shirakata, S. Nishida, M. Yanagihara, A. Tsuboi, M.
Kawakami, Y. Oji, Y. Oka, M. Okabe, B. Tan, H. Sugiyama and
I. L. Weissman, Leukemia, 2007, 21, 1783.
22. M. Ikeya, M. Kawada, Y. Nakazawa, M. Sakuragi, N. Sasai, M.
Ueno, H. Kiyonari, K. Nakao and Y. Sasai, Int. J. Dev. Biol., 2005,
49(7), 807.
23. F. L. Lin, K. Sperle and N. Sternberg, Proc. Natl. Acad. Sci. USA,
1985, 82, 1391.
24. O. Smithies, R. G. Gregg, S. S. Boggs, M. A. Koralewski and R. S.
Kucherlapati, Nature, 1985, 317, 230.
25. E. Robertson, A. Bradley, M. Kuehn and M. Evans, Nature, 1986,
323, 445.
26. R. L. Gardner and F. A. Brook, Int. J. Dev. Biol., 1997, 41, 235.
27. T. Doetschman, R. G. Gregg, N. Maeda, M. L. Hooper, D. W.
Melton, S. Thompson S and O. Smithies, Nature, 1987, 330, 576.
28. K. R. Thomas and M. R. Capecchi, Cell, 1987, 51, 503.
29. H. te Riele, E. R. Maandag and A. Berns, Proc. Natl. Acad. Sci.
USA, 1992, 89, 5128.
30. B. P. Zambrowicz, A. Abuin, R. Ramirez-Solis, L. J. Richter,
J. Piggott and H. BeltrandelRio, et al., Proc. Natl. Acad. Sci. USA,
2003, 100, 14109.
31. H. Gu, J. D. Marth, P. C. Orban, H. Mossmann and K. Rajewsky,
Science, 1994, 265, 103.
32. S. M. Dymecki, Proc. Natl. Acad. Sci. USA, 1996, 93, 6191.
33. F. Buchholz, L. Ringrose, P. O. Angrand, F. Rossi and A. F.
Stewart, Nucleic Acids Res., 1996, 24, 4256.
34. X. Wang, B. Nadarajah, A. C. Robinson, B. W. McColl, J. W. Jin,
F. Dajas-Bailador, R. P. Boot-Handford and C. Tournier, Mol.
Cell. Biol., 2007, 27, 7935.
35. C. S. Branda and S. M. Dymecki, Dev. Cell, 2004, 6, 7.
36. R. Kuhn, F. Schwenk, M. Aguet and K. Rajewsky, Science, 1995,
269, 1427.
37. R. Feil, J. Brocard, B. Mascrez, M. LeMeur, D. Metzger and
P. Chambon, Proc. Natl. Acad. Sci. USA, 1996, 93, 10887.
38. D. S. Sohal, M. Nghiem, M. A. Crackower, S. A. Witt, T. R.
Kimball, K. M. Tymitz, J. M. Penninger and J. D. Molkentin,
Circ. Res., 2001, 89, 20.
39. I. Imayoshi, T. Ohtsuka, D. Metzger, P. Chambon and
R. Kageyama, Genesis, 2006, 44, 233.
416 Chapter 14
40. J. D. Horton, N. A. Shah, J. A. Warrington, N. N. Anderson,
S. W. Park, M. S. Brown and J. L. Goldstein, Proc. Natl. Acad. Sci.
USA, 2003, 100, 12027.
41. X. Wang, A. J. Merritt, J. Seyfried, C. Guo, E. S. Papadakis, K. G.
Finegan, M. Kayahara, J. Dixon, R. P. Boot-Handford, E. J.
Cartwright, U. Mayer and C. Tournier, Mol. Cell. Biol., 2005,
25, 336.
42. D. C. Rogers, E. M. Fisher, S. D. Brown, J. Peters, A. J. Hunter and
J. E. Martin, Mamm. Genome, 1997, 8, 711.
43. X. L. Tian, S. L. Yong, X. Wan, L. Wu, M. K. Chung, P. J. Tchou,
D. S. Rosenbaum, D. R. Van Wagoner, G. E. Kirsch and Q. Wang,
Cardiovasc. Res., 2004, 61, 256.
44. K. Schuh, E. J. Cartwright, E. Jankevics, K. Bundschu, J.
Liebermann, J. C. Williams, A. L. Armesilla, M. Emerson, D.
Oceandy, K. P. Knobeloch and L. Neyses, J. Biol. Chem., 2004, 279,
28220.
45. R. H. Waterston, K. Lindblad-Toh, E. Birney, J. Rogers, J. F. Abril
and P. Agarwal, et al., Nature, 2002, 420, 520.
46. J. A. Richardson and D. K. Burns, Ilar J., 2002, 43, 89.
47. W.H. Colledge, B. S. Abella, K. M. Southern, R. Ratcliff, S. H.
Cheng, L. J. MacVinish, J. R. Anderson, A. W. Cuthbert and M. J.
Evans, Nat. Genet., 1995, 10, 445.
48. S. J. Engle, D. E. Womer, P. M. Davies, G. Boivin, A. Sahota, H. A.
Simmonds, P. J. Stambrook and J. A. Tischfield,Hum. Mol. Genet.,
1996, 5, 1607.
49. H. A. Wallace, F. Marques-Kranc, M. Richardson, F. Luna-
Crespo, J. A. Sharpe, J. Hughes, W. G. Wood, D. R. Higgs and
A. J. Smith, Cell, 2007, 128, 197.
50. C. P. Austin, J. F. Battey, A. Bradley, M. Bucan, M. Capecchi and
F. S. Collins, et al., Nat. Genet., 2004, 36, 921.
417Transgenesis
CHAPTER 15
Protein Engineering
JOHN ADAIRa AND DUNCAN MCGREGORb
a Ithaka Life Sciences Ltd, NETPark Incubator, Thomas Wright Way,
Sedgefield, Co. Durham TS21 3FD, UK; bCyclogenix Ltd, Crombie Lodge,
Aberdeen Science and Technology Park, Balgownie Drive, Aberdeen AB22
8GU, UK
15.1 INTRODUCTION
Protein engineering is the process of constructing novel protein mole-
cules, by design from first principles or by altering an existing structure.
There are two main reasons for wishing to do this. First, there is the
desire to understand for its own sake how proteins are assembled and
what elements of the primary sequence contribute to folding, stability
and function. These features can be probed by altering one or more
specific amino acids in a directed manner within a protein and observing
the outcome after production of the altered version. Often, related
proteins with similar but not identical sequences exist in Nature that
have slightly different properties and these differing sequences can be
used as guides for the alterations.
A second reason for wishing to change a protein is that the protein may
be suitable, in principle, for a particular technology purpose but the ver-
sion found in Nature does not have the optimal properties required for the
task. For example, an enzyme may be considered as part of an industrial
process but a feature of the protein, such as the temperature stability or
pH optimum for the catalytic activity or the need for a co-factor may not
Molecular Biology and Biotechnology, 5th Edition
Edited by John M Walker and Ralph Rapleyr Royal Society of Chemistry 2009
Published by the Royal Society of Chemistry, www.rsc.org
418
be compatible with the process. Amino acid changes can be made that can
tailor the enzyme so that it functions better in the new environment. There
are many other examples of how proteins can be altered to make them
better suited to commercial and technological activities and some of these
are noted in Section 15.3.
To engineer a protein implies an understanding of protein structural
principles, knowledge of proteins as a material and an appreciation of
the limits of the material so that rational design or alteration, of the
properties can be achieved. In addition, the engineer should have to
hand the tools to produce and analyse the desired protein. The tools and
an increasing understanding of the underlying principles have been
developing in a parallel but intertwined manner over the past two dec-
ades (see Refs 1–3 for reviews of early developments in the field). In this
chapter we will provide a background to protein engineering and sum-
marise some recent developments.
15.1.1 Protein Structures
Our current knowledge of how proteins look, how they behave and the
principles that determine how a primary structure folds derives from two
sources. First, studies on the structures of proteins using physical
techniques, along with biochemical studies on the properties and phy-
sical interactions of the amino acids within proteins and with their
environment, have shown that the amino acids of proteins adopt par-
ticular secondary structures such as the a-helix or b-strand and these
secondary structures in turn are folded into tertiary structure motifs.
Small proteins may comprise only one such tertiary structure motif;
however, larger proteins are often comprised of a number of motifs,
which may also be termed domains, that are themselves folded into a
particular arrangement with specific interactions between the domains.
In some cases separate proteins are organised into larger complexes by
inter-domain interactions to form quaternary structures. Within the
tertiary structures, particular amino acid groupings combine to provide
the function of the protein. For example, certain amino acid side-chains
located at different points in the primary amino acid sequence may be
brought into close association by the tertiary structure to generate a
catalytic function or a specific ligand-binding surface.
Second, and drawing on the first, theorising and calculation have
provided insights into the ways proteins may assemble and function. For
example, early observations on the likelihood of particular amino acids
participating in different secondary structure motifs provided the initial
impetus for protein structure prediction algorithms (e.g. Chou and
419Protein Engineering
Fasman4). Many basic questions about the properties of proteins
remain unresolved. For example the mechanics of protein folding
remains a subject of debate.5 This may not be unexpected, given that the
number of sequences that have currently been obtained and structures
that have been determined, are still a small fraction of the available
repertoire occurring in Nature. Fortunately, Nature, via selection,
repeats successful structural motifs and this redundancy allows an
insight into the way in which different amino acid sequences can adopt
similar structures. As further sequences become available and struc-
tures determined and as methods become more efficient at placing
new sequences within existing sequence and structure families,6 then
the ‘who, what and when’ of protein structures may become more
accessible. The ‘why’ and the ‘how’ still require a lot more effort.
Protein engineering seeks to accelerate our understanding of the ‘why’
and the ‘how’.
In addition, and adding a further layer of complexity, correct protein
folding in vivo appears to be assisted by accessory protein complexes.
The role of these folding chaperones and accessory proteins is still being
elucidated,7 but it appears that in vivo mechanisms have developed that
allow incorrectly folded proteins to be rescued or slow folding domains
to be assisted in their folding.
In the next section, the basic tools that are required for protein
engineering are described, followed by a series of examples of successful
protein engineering.
15.2 TOOLS OF THE TRADE
15.2.1 Sequence Identification
Sequence identification, by protein or gene sequencing, is now a rela-
tively straightforward process. Large databases now exist containing
many thousands of sequences, e.g. the Protein Data Bank.8 In addition,
genome-sequencing projects are providing new DNA sequences and
open reading frames at an ever-increasing rate. The functions of many of
these sequences are known, from biochemical or genetic data or by
sequence homology to other known sequences. This gives the protein
engineer an approach to rational design.
15.2.2 Structure Determination and Modelling
High-resolution structural information, determined by X-ray crystal-
lography or nuclear magnetic resonance (NMR) techniques, is at the
420 Chapter 15

core of understanding of protein biochemistry. There are a large number
of proteins for which high-resolution structural information is available,
but this number remains well below the number of sequences identified
by protein or gene sequencing. It has been suggested that a ‘relatively’
small number (around 1000–2000) of unique fold topologies may exist in
nature.6,9–11 Proteins with little primary sequence homology have been
observed to adopt similar folds and can be grouped into protein
superfamilies. These groupings may reflect ancient evolutionary rela-
tionships (but care needs to be taken in inferring functional activities to
regions that may be conserved for purely physical reasons).
Structural genomics approaches and international cooperation to
determine structures of representative proteins may allow better linkage
of sequences to structures.11,12 In the meantime, while this comprehen-
sive structural database is being assembled, attempts are being made to
predict protein structures by a variety of means.
Prediction of protein structures from primary sequence has a long
history.4 Significant progress has been made in predicting structures by
modelling new sequences on to the known structures of homologous
sequences or sub-sequences.6,13 Ab initio calculation for structure pre-
diction is still the subject of investigations.14–16 A question that recurs is
how close does a model approach reality and what confidence can be
placed in the detail, before protein engineering experiments can begin.
As will be seen below, some of the manipulation methods seek to cir-
cumvent this problem.
15.2.3 Sequence Modification
Modification of an existing protein by alteration of the gene sequence,
from whole domains down to single amino acids, is now a routine
process and this area is now the least challenging part of the engineering
process. Procedures for preparing novel DNA sequences have been
available since the early days of recombinant DNA technology. Large
sequence segments were initially generated by synthesis of the desired
double-stranded (ds) DNA sequence from short oligonucleotide seg-
ments that are annealed and ligated.17,18 Currently, polymerase chain
reaction (PCR)19 amplification methods for gene synthesis are the most
often used, to fill in and amplify partially overlapping oligonucleotides
(see Figure 15.1, summarised in Ref. 10).
Individual nucleotide changes or alterations of short segments of
sequence in a pre-existing sequence can be performed by oligonucleotide-
directed site-specific mutagenesis or the use of the now ubiquitous PCR
(see below).
421Protein Engineering
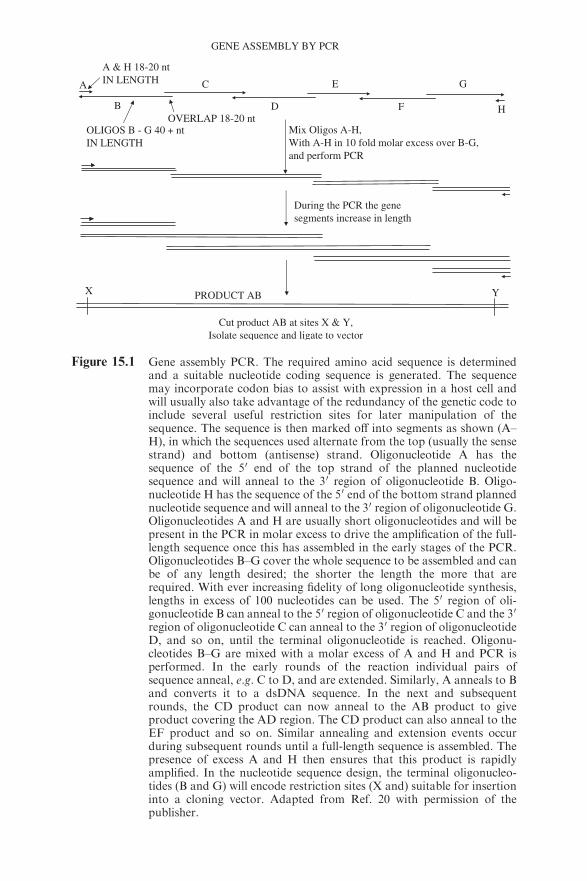
GENE ASSEMBLY BY PCR
A
B
C
D
E
F
G
H
Mix Oligos A-H,
With A-H in 10 fold molar excess over B-G,
and perform PCR
Cut product AB at sites X & Y,
Isolate sequence and ligate to vector
OVERLAP 18-20 ntOLIGOS B - G 40 + nt
IN LENGTH
During the PCR the gene
segments increase in length
A & H 18-20 nt
IN LENGTH
PRODUCT ABX Y
Figure 15.1 Gene assembly PCR. The required amino acid sequence is determinedand a suitable nucleotide coding sequence is generated. The sequencemay incorporate codon bias to assist with expression in a host cell andwill usually also take advantage of the redundancy of the genetic code toinclude several useful restriction sites for later manipulation of thesequence. The sequence is then marked off into segments as shown (A–H), in which the sequences used alternate from the top (usually the sensestrand) and bottom (antisense) strand. Oligonucleotide A has thesequence of the 50 end of the top strand of the planned nucleotidesequence and will anneal to the 30 region of oligonucleotide B. Oligo-nucleotide H has the sequence of the 50 end of the bottom strand plannednucleotide sequence and will anneal to the 30 region of oligonucleotide G.Oligonucleotides A and H are usually short oligonucleotides and will bepresent in the PCR in molar excess to drive the amplification of the full-length sequence once this has assembled in the early stages of the PCR.Oligonucleotides B–G cover the whole sequence to be assembled and canbe of any length desired; the shorter the length the more that arerequired. With ever increasing fidelity of long oligonucleotide synthesis,lengths in excess of 100 nucleotides can be used. The 50 region of oli-gonucleotide B can anneal to the 50 region of oligonucleotide C and the 30
region of oligonucleotide C can anneal to the 30 region of oligonucleotideD, and so on, until the terminal oligonucleotide is reached. Oligonu-cleotides B–G are mixed with a molar excess of A and H and PCR isperformed. In the early rounds of the reaction individual pairs ofsequence anneal, e.g. C to D, and are extended. Similarly, A anneals to Band converts it to a dsDNA sequence. In the next and subsequentrounds, the CD product can now anneal to the AB product to giveproduct covering the AD region. The CD product can also anneal to theEF product and so on. Similar annealing and extension events occurduring subsequent rounds until a full-length sequence is assembled. Thepresence of excess A and H then ensures that this product is rapidlyamplified. In the nucleotide sequence design, the terminal oligonucleo-tides (B and G) will encode restriction sites (X and) suitable for insertioninto a cloning vector. Adapted from Ref. 20 with permission of thepublisher.
These methods are restricted to gene-coded amino acids. Sequences
may also be generated by chemical protein synthesis, which also allows
the incorporation of non-coded amino acids into the protein sequence
in vitro.21,22
15.2.3.1 Defined Sequence Alterations
In many situations, specific alteration of one or a small number amino
acids is required. This can conveniently be done by site-specific muta-
genesis procedures. There are two basic site-specific mutagenesis proce-
dures. Both involve annealing of one or more oligonucleotides to a
region of (at least temporarily) single-stranded DNA (ssDNA) followed
by in vitro DNA polymerase-directed extension of the oligonucleotide(s).
Non-PCR Methods. In the older, non-PCR, procedures the DNA
sequence to be modified is linked to a replication origin (e.g. in a plas-
mid, bacteriophage or ‘phagemid’), allowing in vivo amplification of
the modified and parental genotypes. A synthetic oligonucleotide har-
bouring the required mutation is annealed either to circular ssDNA
template, for example the genome of an ssDNA phage such as M13
or FX174 or the ssDNA form of a phagemid (Figure 15.2a) or to a
partially single-stranded dsDNA template (Figure 15.2b). Partial
ssDNA templates can be generated by a variety of enzymic methods.
The annealed oligonucleotide acts as a primer for in vitro DNA
synthesis using DNA polymerase, usually T4 or T7 DNA polymerase,
and in the presence of DNA ligase, closed circular double-stranded
DNA (dsDNA) molecules are generated (Figure 15.2c). The dsDNA is
introduced into a suitable host cell where replication and hence segre-
gation of parental and mutant daughter strand occur. The desired
modification is then identified by one of a number of screening or
selection procedures. The product Betaseron23 (see Section 15.4.1.1) was
generated in this manner.
PCR-based Methods. While the non-PCR methods are well known
and have been optimised over a period of many years and commercial
kits are available for the various procedures, PCR-based methods
have now become more widespread.
In the PCR-based approaches, the desired modification is generated
and amplified in vitro by annealing to denatured target DNA a synthetic
oligonucleotide harbouring the required mutation along with an oligo-
nucleotide that can act as a primer for replication of the complementary
DNA strand (Figure 15.3).
423Protein Engineering
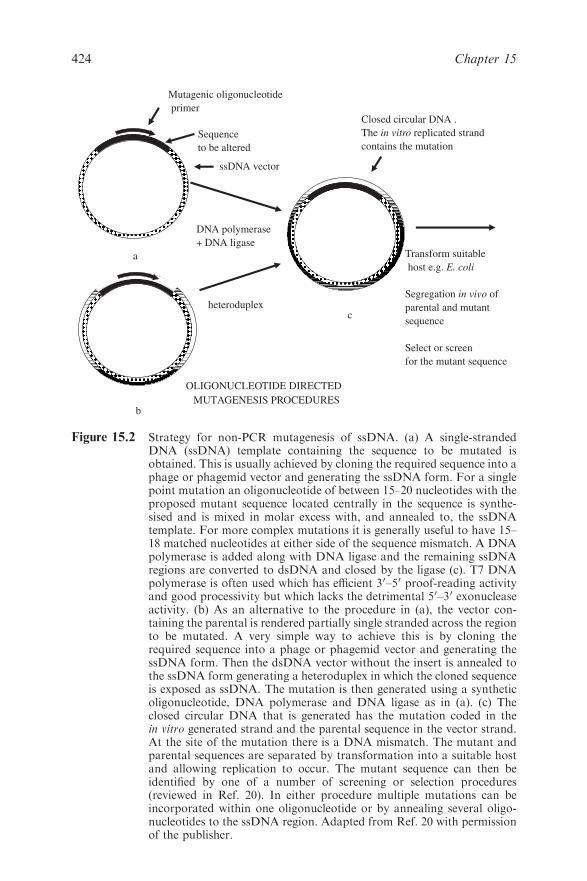
a
c
OLIGONUCLEOTIDE DIRECTED
MUTAGENESIS PROCEDURES
Mutagenic oligonucleotide
primer
Transform suitable
host e.g. E. coli
Segregation in vivo of
parental and mutant
sequence
Select or screen
for the mutant sequence
ssDNA vector
Sequence
to be altered
heteroduplex
DNA polymerase
+ DNA ligase
b
Closed circular DNA .
The in vitro replicated strand
contains the mutation
a
Figure 15.2 Strategy for non-PCR mutagenesis of ssDNA. (a) A single-strandedDNA (ssDNA) template containing the sequence to be mutated isobtained. This is usually achieved by cloning the required sequence into aphage or phagemid vector and generating the ssDNA form. For a singlepoint mutation an oligonucleotide of between 15–20 nucleotides with theproposed mutant sequence located centrally in the sequence is synthe-sised and is mixed in molar excess with, and annealed to, the ssDNAtemplate. For more complex mutations it is generally useful to have 15–18 matched nucleotides at either side of the sequence mismatch. A DNApolymerase is added along with DNA ligase and the remaining ssDNAregions are converted to dsDNA and closed by the ligase (c). T7 DNApolymerase is often used which has efficient 30–50 proof-reading activityand good processivity but which lacks the detrimental 50–30 exonucleaseactivity. (b) As an alternative to the procedure in (a), the vector con-taining the parental is rendered partially single stranded across the regionto be mutated. A very simple way to achieve this is by cloning therequired sequence into a phage or phagemid vector and generating thessDNA form. Then the dsDNA vector without the insert is annealed tothe ssDNA form generating a heteroduplex in which the cloned sequenceis exposed as ssDNA. The mutation is then generated using a syntheticoligonucleotide, DNA polymerase and DNA ligase as in (a). (c) Theclosed circular DNA that is generated has the mutation coded in thein vitro generated strand and the parental sequence in the vector strand.At the site of the mutation there is a DNA mismatch. The mutant andparental sequences are separated by transformation into a suitable hostand allowing replication to occur. The mutant sequence can then beidentified by one of a number of screening or selection procedures(reviewed in Ref. 20). In either procedure multiple mutations can beincorporated within one oligonucleotide or by annealing several oligo-nucleotides to the ssDNA region. Adapted from Ref. 20 with permissionof the publisher.
424 Chapter 15
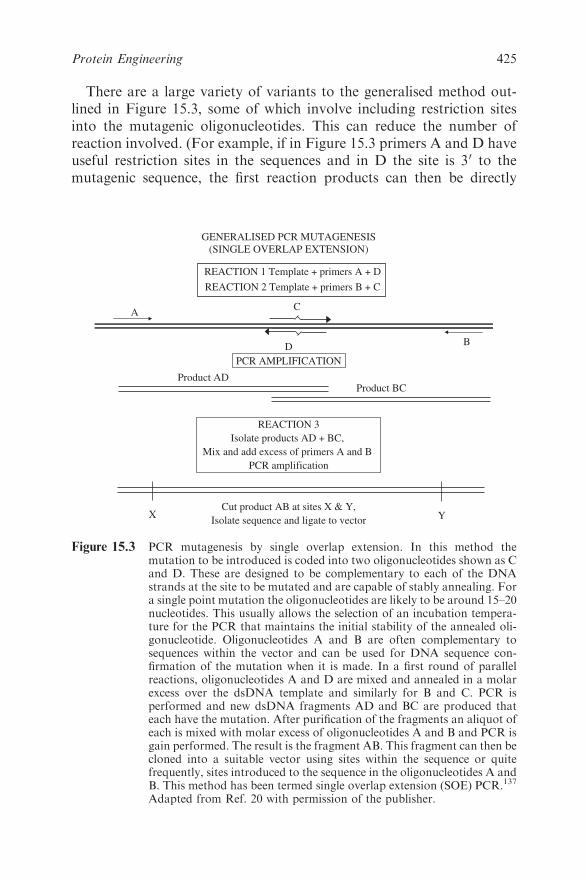
There are a large variety of variants to the generalised method out-
lined in Figure 15.3, some of which involve including restriction sites
into the mutagenic oligonucleotides. This can reduce the number of
reaction involved. (For example, if in Figure 15.3 primers A and D have
useful restriction sites in the sequences and in D the site is 30 to the
mutagenic sequence, the first reaction products can then be directly
GENERALISED PCR MUTAGENESIS
(SINGLE OVERLAP EXTENSION)
REACTION 1 Template + primers A + D
REACTION 2 Template + primers B + C
AC
DB
PCR AMPLIFICATION
X YCut product AB at sites X & Y,
Isolate sequence and ligate to vector
REACTION 3
Isolate products AD + BC,
Mix and add excess of primers A and B
PCR amplification
Product ADProduct BC
Figure 15.3 PCR mutagenesis by single overlap extension. In this method themutation to be introduced is coded into two oligonucleotides shown as Cand D. These are designed to be complementary to each of the DNAstrands at the site to be mutated and are capable of stably annealing. Fora single point mutation the oligonucleotides are likely to be around 15–20nucleotides. This usually allows the selection of an incubation tempera-ture for the PCR that maintains the initial stability of the annealed oli-gonucleotide. Oligonucleotides A and B are often complementary tosequences within the vector and can be used for DNA sequence con-firmation of the mutation when it is made. In a first round of parallelreactions, oligonucleotides A and D are mixed and annealed in a molarexcess over the dsDNA template and similarly for B and C. PCR isperformed and new dsDNA fragments AD and BC are produced thateach have the mutation. After purification of the fragments an aliquot ofeach is mixed with molar excess of oligonucleotides A and B and PCR isgain performed. The result is the fragment AB. This fragment can then becloned into a suitable vector using sites within the sequence or quitefrequently, sites introduced to the sequence in the oligonucleotides A andB. This method has been termed single overlap extension (SOE) PCR.137
Adapted from Ref. 20 with permission of the publisher.
425Protein Engineering
cloned). The amplified DNA fragment is then ligated into a bacterial
replication origin in a plasmid or ‘phage and cloned by introduction into
bacteria.
A variant of the procedure allows the linking together of separate
sequences, which may code for domains from different proteins or allow
the reorganisation of domains within a protein. In this procedure,
outlined in Figure 15.4, the primers C and D are hybrids containing
sequences that can anneal to both of the domains in question. The first
reactions then generate dsDNA fragments that now overlap in sequence
and the desired product can then be generated in a third reaction using
the primers A and B.
In all of these cases, the design of the oligonucleotide sequences and
the reaction conditions need to be considered carefully, along with the
correct choice of thermostable DNA polymerase. However, these pro-
cedures are very rapid and highly efficient.
15.2.3.2 Molecular Evolution
The difficulty with protein engineering has been, and will continue to be,
knowing what to alter. In many circumstances, directed modification of
a sequence is not a suitable procedure for obtaining a desired outcome,
because it is often not clear where the true target amino acid(s) reside(s)
and to what to alter it/them. A number of strategies have been devel-
oped to produce and test members of large libraries or repertoires of
variants of a particular sequence. Methods of this kind are rapidly
becoming the workhorse for the protein engineer and are termed
directed evolution.24,25
The approach relies on three main features: first, that a method exists
to generate the large number of variants; second, that the nucleic acid
that codes for the protein sequence of interest remains physically asso-
ciated with the protein during the selection process; third, a screening or
selection strategy is available that will enrich from among the collection
of variants those novel protein sequences that have the phenotype of
interest.
Generation of Variants. Molecular evolution methods require that a
number of variants of a parental sequence be generated. The collec-
tion of variants is called a library. There are a variety of ways of gen-
erating this library of variants. For example, if selection among all
possible amino acids at one location is required then the codon at that
point can be replaced by the triplet NNN, where N means each of the
four bases. This can be achieved either by direct replacement of a
426 Chapter 15

PCR DOMAIN FUSION
REACTION 1 Template +primers A + D
REACTION 2 Template +primers B + C
A C
D B
PCR AMPLIFICATION
X YCut product AB at sites X & Y,
Isolate sequence and ligate to vector
REACTION 3
Isolate Products AD + BC,
MIX and add excess of primers A and B
PCR amplification
Product ADProduct BC
X Y
Figure 15.4 PCR domain fusion, The domain fusion PCR is similar to the operationdescribed in Figure 15.3. In this case the design of the central primers ismore complex. Oligonucleotide A has the sequence of the sense strand atthe N-terminal end of the first domain and so can anneal to the antisensestrand of the coding sequence of the first domain. Oligonucleotide B hasthe sequence of antisense strand at the C terminal end of the seconddomain. Oligonucleotides A and B are usually 18–20 nucleotides inlength and these lengths can be adjusted to ensure that the oligonu-cleotides remain annealed at the temperature of the PCR extensionreaction. Oligonucleotide C is a hybrid of two sequences. At the 50 endthe first 20 (approximately) nucleotides are the same as the codingsequence at the C-terminus of the first domain. This part of the oligo-nucleotide sequence ends at the point where the fusion will occur. Thesecond portion of the oligonucleotide sequence (also often around 20nucleotides) has the sequence of the sense strand at the N-terminal end ofthe second domain. Therefore, oligonucleotide C can anneal to theantisense strand of the coding sequence of the second domain, leaving anon-annealed ‘tail’. Oligonucleotide D is a similar hybrid sequence butcan anneal to the sense strand of the first domain, also leaving a non-annealed ‘tail’. Two PCR reactions are done. In the first, oligonucleotidesA and D are in molar excess over the coding sequence for the firstdomain. In the second reaction, oligonucleotides B and C are in molarexcess over the coding sequence for the second domain. At the end of thereactions, products AD and BC are formed. Product AD codes for thefirst domain and also codes for a number of amino acids from theN-terminal region of the second domain, with the point of fusion exactlyas dictated by the sequence in oligonucleotide D. In product BC, theDNA sequence codes for the C-terminal amino acids of the first domainand the amino acids of the second domain. Importantly, the productsAD and BC now have a significant nucleotide sequence homology.Products AD and BC are purified and an aliquot of each is mixed withmolar excess of oligonucleotides A and B in a third PCR reaction. Theresultant product AB now has the coding sequence of both domains in-frame and joined exactly at the desired point. This fragment can then becloned into a suitable vector using sites near the ends of the sequence or,frequently, using sites introduced to the sequence in the oligonucleotidesA and B. Adapted from Ref. 20 with permission of the publisher.

double strand section with NNN in both strands or by PCR using a
priming oligonucleotide with NNN at the desired position. This strat-
egy can be extended for a number of amino acid locations. More typi-
cally, rather than using NNN codons, libraries are encoded by NNK
(K¼G or T) to reduce the number of stop codons (TGA, TAA and
TAG) appearing in libraries. A more recent approach, using trinucleo-
tide codons in place of single base additions during oligonucleotide
synthesis, results in an even distribution of all amino acid codons,
while eliminating all stop codons.26,27
Larger scale variation can be achieved in certain circumstances by a
technique known generically as DNA shuffling.28,29 In the basic proce-
dure, the nucleotide sequences of a number of closely related proteins are
used. Breaks are introduced randomly in the sequences and the pooled
DNA is then denatured and annealed. Gaps are filled by PCR and then
the resultant new sequences are cloned. The procedure provides a means
for crossover between multiple original sequences and generates new
sequences in which the sequence differences are recombined.
Since the original procedure was described, a number of other pro-
cedures for generating the libraries have been published, with a variety
of acronyms, each seeking to improve the procedure for particular
circumstances: StEP,30 ITCHY,31 SCRATCHY,32 RACHITT33 and
SHIPREC.34
Even with such procedures, only small segments of a protein can be
altered at one time because of the number of possible combinations that
are involved. Strategies the require the presentation and amplification in
a cellular system are limited by the ability of the host to take up indi-
vidual members and libraries of 109–1010 members are considered large
numbers here, in vitro libraries can exceed these numbers so that
libraries of 1012–1014 can be formed. However, the possible combina-
tions of all residues in even small protein domains far exceed this.
Linking Coding Sequence to Product. The physical linkage of popula-
tions of peptides or proteins to their encoding nucleic acids to create
large, diverse display libraries has provided a rich source of ligands to
a wide range of target molecules. Enrichment of ligands from these
libraries is achieved by the co-selection of target-binding peptides
along with their associated encoding nucleic acids, which allows the
subsequent identification of the selected peptide sequences. This
approach has been most widely exemplified using the phage display
system. In this system, a range of options exists that provide for
retaining a link between the coding sequence and the expressed
product.35,36
428 Chapter 15
In the original procedure, the coding sequence of interest is inserted
into the gene sequence for one of the coat proteins of a bacteriophage
(‘phage), (usually the filamentous ‘phages, as used for the site-directed
mutagenesis methods noted above). When expressed during the course
of infection the fusion is assembled into the virus coat. The hybrid
‘phage can then be selected for by binding to specific ligand, for example
an antibody. The hybrid protein remains linked to the coding sequence
inside the ‘phage. The ‘phage genome can then be rescued and amplified
and further rounds of binding can be performed. This procedure pro-
vides the basis for a means of selection among variants.
In the original peptide system, libraries of peptide were screened for
binding to antibody to identify binding epitopes. However, the same
principle applies to protein: protein interactions.
As an alternative to a ‘phage, a ‘phagemid’ can be used. Here, the
‘phage coat protein that is used to generate the presenting fusion has
been inserted into a plasmid. The host bacterium, containing the pha-
gemid vector, must then be co-infected with autonomously replicating
bacteriophage, termed helper ‘phage, to provide the full complement of
proteins necessary to produce mature phage particles. Today this tech-
nique provides the basis for most library screening methods.
A variant of this procedure involves generating a fusion of the protein
or peptide of interest with a DNA binding protein and arranging for the
recognition motif to be included in the ‘phage genome along with the
coding sequence for the fusion. When the fusion is expressed it binds to
its cognate DNA sequence on the ‘phage genome and becomes pack-
aged. The protein of interest protrudes through the ‘phage coat and is
available fro ligand binding and selection. The subsequent steps of
selection and amplification are the same as for phage display.37
In addition to presentation on the surface of a ‘phage, proteins and
peptides can also be presented on the surface of bacteria, baculovirus or
eukaryotic cells.38–43
Another in vivo approach is exemplified by the ‘peptides on plasmids’
approach, where peptides are fused to the lacI DNA-binding protein
and expressed in the cytoplasm of bacteria, resulting in a protein–DNA
complex library that can be selected against targets after bacterial lysis
to release the complexes.44
Alternatively, in vitro procedures have been devised. The challenge
here is to be able to maintain the specific coding sequence–product link
and to separate out the individual products. The in vivo procedures
described above require the insertion of the library DNA into bacterial
cells and the efficiency of bacterial transformation restricts library sizes
to the 109–1010 range. Similarly, the display of peptides on bacterial or
429Protein Engineering
yeast surfaces or the display of peptides directly on their encoding
plasmids all require a transformation step which imposes a limit on the
library sizes that can be constructed.
It is generally accepted that there is a correlation between library size
and the affinity of ligands that can be isolated from them.45 This has
prompted the development of display technologies in which the size-
limiting transformation step is unnecessary, allowing ever-larger display
libraries to be constructed. These new technologies enable higher affinity
ligands to be obtained through the sampling of an increased structural
repertoire, which is made possible through the generation of libraries
which are up to four orders of magnitude larger than those that can be
constructed for phage display. These can be separated into RNA- and
DNA-based procedures.
RNA-based procedures were developed first. The best known of these
are known as ‘ribosome display’ and ‘mRNA display’.45–51 In both of
these systems, protein-coding mRNA is transcribed and translated
in vitro. In ribosome display, the translated protein folds while emerging
from the ribosome and remains linked to the mRNA during selection for
function, after which the coding mRNA sequence is reverse transcribed
to DNA, amplified and transcribed to make more mRNA for further
rounds of selection. This is achieved through linking the library protein
to a spacer protein (a number of different spacer proteins can be used) to
allow space for the library protein to fold correctly unhindered by
proximity to the ribosome and by deleting the stop codon from the
coding sequence. This these latter change causes ribosome stalling
and hence linkage between the protein and its mRNA molecule. Both
prokaryotic and eukaryotic cell-free translation systems can be used,
although the prokaryotic methods are more prevalent. The key is to
ensure that the folded protein does not disengage from the ribosome
while the selection for function is occurring. This requires that selec-
tions are performed at low temperature and in the presence of magne-
sium ions.
In mRNA display, mRNA molecules encoding protein or peptide
libraries are tagged at the 30-end with the antibiotic puromycin.50,52
During translation, when the ribosome reaches the puromycin molecule,
the antibiotic is covalently transferred to the elongating peptide chain
(while still attached to the mRNA), thereby linking the mRNA to the
encoded protein. Although this is more robust than ribosome display,
there is no method for ensuring attachment between the correct elon-
gating peptide -chain and its encoding mRNA molecule. As both
methods are mRNA based, there are stability issues that must be con-
sidered when using these procedures.
430 Chapter 15
DNA-based methods can be divided into non-covalent (CIS dis-
play53), covalent54,55 and emulsion-based systems.56
CIS display exploits the high-fidelity cis-activity that is exhibited by a
group of bacterial plasmid DNA-replication initiation proteins typified
by RepA of the R1 plasmid. In this context, cis-activity refers to the
property of the RepA family of proteins to bind exclusively to the
template DNA from which they have been expressed. By genetically
fusing peptide libraries to the N-terminus of the RepA protein, Odegrip
et al.53 demonstrated that it is possible to achieve a direct linkage of
peptides to the DNA molecules that encode them in vitro. The rationale
of the system is that in vivo, R1 plasmid replication is initiated through
the binding of RepA to the plasmid origin of replication (ori). Ori is
separated from the RepA-coding sequence by a DNA element termed
CIS. The consensus model for cis-activity is that the CIS element, which
contains a rho-dependent transcriptional terminator, causes the host
RNA polymerase to stall. This delay allows a nascent RepA polypeptide
emerging from a translating ribosome to bind transiently to CIS, which
in turn directs the protein to bind to the adjacent ori site, thus linking
genotype to phenotype.
DNA-based covalent display approaches are essentially similar to CIS
display, but require a covalent interaction between protein and DNA to
retain the linkage of genotype to phenotype, through the cis action of the
cross-linking protein. Two requirements are needed for successful use of
this technique. First, proteins are required which interact in vitro with the
DNA sequence which encodes them (cis action), and second, the said
proteins must establish a covalent linkage to their own DNA template.
This method suffers from the fact that the DNA is chemically modified,
which can prevent the recovery and identification of the binding peptide
of interest. Despite this, Reiersen et al.55 demonstrated the isolation of
scFv antibody fragments from an immunised library using a covalent
display approach based on the cis-acting P2 A DNA binding protein.
Tawfik and Griffiths56 demonstrated that directed evolution proce-
dures could be undertaken in cell-free emulsions in which transcription
and translation occur in water microdroplets in an oil emulsion. This
allows the physical co-localisation of coding sequence and product. In
the original procedure, optimisation of an enzyme was performed and
selection could be detected by the presence of product. More recently,
the procedure has been generalised to allow for selection among ligand
binding variants57 [see Rothe et al.58 for a recent review of these in vitro
compartmentalisation (IVC) methods].
A further in vitro procedure combines emulsion compartmentalisation
with a cis-display method.59 Here, in an elegant experiment, a
431Protein Engineering

biotinylated DNA fragment library composed of random sequence
fused to DNA encoding streptavidin is compartmentalised in emulsions
(one DNA molecule per compartment), then transcribed and translated.
The resulting fusion protein can then bind to the biotinylated DNA to
maintain the link between coding sequence and expressed product.
Identification of the Required Phenotype. Third, these methods require
a screening or selection strategy that will enrich from among the
library those novel protein sequences that have the phenotype of
interest. It has been suggested that the First Law of Directed Evolu-
tion is ‘you get what you screen (or select) for’.60,61 Screens which
involve binding to a ligand can easily be devised.62 Procedures for
screening or selection for enzyme function or protease resistance have
been summarised.63,64 Selection systems often involve complementa-
tion of an essential function within the host organism,65 but more
novel in vivo selection systems have also been proposed66,67 where
selection takes place within a whole organism.
15.2.4 Production
Once a novel sequence has been identified and designed, it must be
expressed to determine that the function is as required. A range of
expression systems are available, from microbial systems (Escherichia
coli being the most obvious),68 yeasts (e.g. Saccharomyces cerevisiae and
Pichia pastoris), insect cells, filamentous fungi and mammalian cell
cultures through to transgenic animals and plants. Cell-free systems for
the expression of relatively small quantities of product for initial analysis
are also being developed. These can now produce sufficient quantities of
product for early stage analysis.69
Chemical in vitro synthesis of polypeptides and small proteins was
noted earlier as a means of introducing non-natural amino acids into the
sequence, but might also be considered as an alternative expression
option, assuming that it can be done cost-effectively.70,71
The scale of production also varies. In the early stages of development
of a novel protein, for example where a protein has been identified
among a number from a display library, only small quantities (micro-
grams) of the protein may be needed to confirm a biological property. In
the second stage, larger quantities (tens to hundreds of milligrams) of
purer material are required, typically to obtain structural information
and to perform more demanding in vitro and in vivo bioassays. In some
situations, larger quantities (grams to the multi-kilogram or tonne scale)
of material purified by rigorous (and usually costly) procedures may be
432 Chapter 15
required if the protein is required for commercial purposes (for example,
for industrial enzymes or for therapeutic purposes).
Often a number of approaches may need to be tried to find a suitable
expression host, as it cannot safely be assumed that an altered protein
will express in the same manner as the parental sequence and in the case
of novel sequences no precedent exists. These factors are becoming of
increasing importance as more strategies rely on library display systems,
where members of a library may be lost or under-represented because of
poor expression or folding properties.
15.2.5 Analysis
Methods must exist for the analysis of the properties of the modified
proteins. Where a function is being altered (introduced, modified or
removed), a biological assay may already be available to measure the
function and activity of the parental protein or can usually be devised to
measure the ability of the newly produced protein (this assay may well be
the same as the screening assay). The issue is often of ensuring that the
assay can function with very small amounts of material, such as that
obtained from library amplification procedures. Methods that include
physical adsorption or binding may be better suited to this than those that
rely on detection of a catalytic product. In the latter case, diffusible product
must remain close to the point of production and so water–oil emulsion
compartmentalisation or single well techniques are better suited here.
In many cases, acquiring and demonstrating the new function may be
all that is required. However, in addition to functional assays, inter-
pretation of the results may require a structural understanding of the
alteration, particularly to gain further insights into protein folding.
Assuming that a reasonable quantity of the novel protein can be pre-
pared, gross properties can readily be detected by spectroscopic or other
large-scale measurements (e.g. circular dichroism, turbidity, enthalpic,
sedimentation or chromatographic properties). However, detailed
structural information about the end product is still the rate-limiting
step in rational protein engineering and design. Casimiro et al.72 showed
that PCR-based gene synthesis, expression in E. coli of milligram
quantities of isotopically labelled protein and NMR spectroscopy can be
achieved in a reasonably short time, with first NMR spectra available
for a novel sequence as little as 2 months after the initiation of the gene
synthesis steps. More recently, there has been interest in developing
methods for rapid determination, on a small scale, of the structural
information about coded sequences identified in genomic projects,
which can be applied to engineered proteins.73
433Protein Engineering
15.3 APPLICATIONS
Applications of protein engineering are everywhere in biology, as a
means of producing novel molecules and as a means of understanding
the basic properties of proteins. Therefore, to attempt a comprehensive
survey is fruitless. However, it is useful to note some specific examples of
the different types of molecules that can be achieved, from the simplest
point mutations and domain rearrangements to more demanding multi-
site alterations and de novo designs. The examples given in the following
sections reflect our personal bias towards biopharmaceuticals, but
hopefully will prove of general interest. The examples indicate that
protein engineering procedures have been used to develop potentially
beneficial medicines for over 20 years now. Walsh74 has recently tabu-
lated approved recombinant protein medicines, several of which are the
result of protein engineering experiments.
15.3.1 Point Mutations
Individual point mutations in proteins can be readily achieved once the
gene sequence is available, using the techniques noted earlier. Numerous
examples of amino acid sequence variants are known. Many of the early
proteins considered and approved as pharmaceuticals have now been
modified in various ways and modified forms are now available as drug
products. Some key examples are given below.
15.3.1.1 Betaseron/Betaferon (r-Interferon b-1b)
One of the earliest examples of pharmaceutical protein engineering was
the production of interferon b-1b. This novel protein was generated by
the substitution of a cysteine (Cys) for serine (Ser) at residue 17 of the
154 amino acid interferon b.23 This substitution reduces the possibility
of incorrect disulfide bridge formation during synthesis in E. coli and
also removes a possible site for post-translational oxidation. The
resultant protein is expressed in E. coli at a specific activity approaching
that of native fibroblast-derived interferon b. The molecule has been
licensed since 1993 for use for the reduction of frequency and degree of
severity of relapses in ambulatory patients with relapsing remitting
multiple sclerosis.
15.3.1.2 Novel Insulins
Insulin is a pancreatic hormone that acts to regulate blood glucose
levels. Insulin is given to used in the treatment of diabetes to help
434 Chapter 15
regulate blood glucose levels. Recombinant insulin (humulin) was the
first biotechnology therapeutic product in 1982. Since the early approval
of recombinant insulin, a number of altered forms have been developed
that seek to improve the effectiveness of the delivered insulin. The first of
these, Humalog (insulin lispro), was approved in 1996. Humalog is an
engineered, fast-acting analogue of insulin. In Humalog, the two resi-
dues at the C-terminus of the B chain, Pro28 and Lys29, have been
reversed in their order. The C-terminal alterations were designed based
on structural and sequence homology to insulin-like growth factor 1
(IGF-1) and the sequence reversal reduces the dimerisation of the B
subunit. This reduced self-association means that the monomer is more
readily available to function after food uptake and therefore can be
administered very shortly before meals.
Since 1996, a number of recombinant forms have been licensed.74
15.3.1.3 Aranesp (Darbopoietin a) Modified Erythropoietin
Erythropoietin (EPO) is a hormone that stimulates the formation of red
blood cells.75 It is approved for treatment of anaemia. Since its approval
in 1989, EPO has become the largest selling biotechnology drug with
multi-billion dollar sales. In 2001, a modified version, Aranesp, was
approved. Aranesp is a hyper-glycosylated form of EPO in which the
amino acid sequence has been altered at two locations so as to introduce
two new N-linked carbohydrate attachment motifs. Aranesp therefore
bears five N-linked carbohydrate structures compared with the three in
the native form. This results in a longer in vivo half-life for the product
and allows for less frequent dosing of the patient 76 Aranesp is fast on its
way to being a blockbuster drug.
15.3.2 Domain Shuffling (Linking, Swapping and Deleting)
Most large proteins are composed of smaller, independently folding
domains, generally corresponding to the protein folds mentioned earlier.
These domains are often linked together by short peptide sequences and
in many, but not all, cases the domains are identifiable as separate exons
in the gene sequence. Using standard molecular biology techniques, it is
possible to add, remove or swap domains from one protein to another to
rebuild proteins.
15.3.2.1 Linking Domains
Domain Fusions for Cell Targeting. Among the very earliest examples of
protein engineering, the binding site region of an antibody was
435Protein Engineering
genetically linked to an enzyme. The IgG antibody is a Y- or T-shaped
structure comprising two identical 50 kDa ‘heavy’ chains and two
identical 25 kDa ‘light’ chains. The heavy chain comprises an N-terminal
variable domain (VH) and three constant domains (CH1, CH2, CH3)
with a short hinge region between CH1 and CH2. The light chain
comprises an N-terminal variable domain, VL and a constant domain
CL. The antigen-binding region, known as the Fab region, comprises
the VH and CH1 domain of one heavy chain and one complete light
chain. The C-terminal CH2 and CH3 domains of the two heavy chains
associate together to form the Fc region. The Fc region is involved with
interactions with various cells of the immune system and with comple-
ment and is also important in determining the serum half-life of anti-
bodies, at least of the IgG type.77
The antibody–enzyme gene fusions were constructed by taking the
DNA sequence that codes for the heavy chain component of Fab of the
antibody and linking this either to staphylococcal nuclease78 or to E.coli
DNA polymerase coding sequences.79 Introduction of these fusion genes
in a cell that produces the antibody light chain and expression of the
fusion gene reconstituted both antigen binding and enzymic activity.
These early examples provided the foundation for many other
examples where a binding function [antibody, cytokine, growth factor or
extracellular ligand binding domain (ECD) of a receptor] is linked to an
effector function (toxin, enzyme, cytokine). Also, a non-antibody
binding domain can be attached to the Fc region of an antibody to take
advantage of the long serum half-life of antibodies to improve the
pharmacokinetic properties of a designed molecule.
Some of these domain fusions are now licensed for human use
(Table 15.1). For example, Enbrel (etanercept) comprises the extracellular
domains of the receptor for the cytokine tumour necrosis factor a (TNFa)
genetically fused to the Fc regions of IgG. Enbrel is used to block the
activity of the TNFa.80 Enbrel is currently licensed for the reduction in
signs and symptoms of moderately to severely active rheumatoid arthritis
in patients who have an inadequate response to one or more disease-
modifying anti-rheumatic drugs. Other approved fusions with similar
architecture include Amevive and Orencia (Table 15.1).
Ontak is a different form of genetic fusion in which the cytokine
interleukin-2 (IL-2) is used to replace the receptor-binding domain of
diphtheria toxin.81 Ontak is used to target the diphtheria A and B
domain to cells expressing the receptor for IL-2, which is overexpressed
in leukaemia cells. Ontak was approved in 1999 to treat certain patients
with advanced or recurrent cutaneous T-cell lymphoma (CTCL) when
other treatments have not worked.
436 Chapter 15

Table 15.1 Selected engineered protein products.
Product (international non-proprietary name) Format
Firstapproval date Target Application
Approved fusion proteinsEnbrel (etanercept) Tumour necrosis factor receptor
(TNFR) p75–Ig Fc fusion(dimeric)
1998 TNFa Rheumatoid arthritis
Ontak (denileukin difitox) Recombinant interleukin (rIL)-2–diphtheria toxin fusion protein
1999 IL-2 receptor Cutaneous T-cell lymphoma
Amevive (alefacept) CD2-binding region of LFA-3fused to IgG1 Fc
2003 CD2 Treatment of adult patientswith moderate to severechronic plaque psoriasis whoare candidates for systemictherapy or phototherapy
Orencia (abatacept) CTLA4–Ig Fc fusion (dimeric) 2005 CD80, CD86 Rheumatoid arthritis
437
Protein
Engineerin
g
Fusions to Stabilise Dimeric Proteins. In other situations, it is useful to
fuse together genetically domains which are normally associated by
non-covalent interactions or disulfide bridges. This allows more con-
venient production and ensures that the domains remain in proximity
even at the low concentrations that would be observed during in vivo
dosing. Examples include joining the VH and VL domains of anti-
bodies together with a linker peptide to form molecules called single
chain Fvs (scFvs) and linking the domains of heterodimeric cytokines
(e.g. IL-12 to produce Flex-12.82 The scFv molecule is another veteran
of protein engineering, having first been disclosed during the 1980s.83,84
15.3.2.2 Swapping Protein Domains
Another simple procedure used in protein engineering is whole domain
swapping, in which analogous domains from different sources are
swapped into a multi-domain protein to provide a novel functionality.
Chimeric Mouse–Human Antibodies. Here the antigen binding do-
mains from a mouse monoclonal antibody are linked to the constant
regions (which provide immune effector functions and dictate biologi-
cal half-life) from a human antibody.85 This switching can markedly
reduce unwanted immunogenicity compared with the original mouse
antibody.86 Several chimeric antibody products have been licensed as
pharmaceuticals (Table 15.2).
Polyketide Synthases (PKSs). Polyketides are a class of chemical com-
pounds which include many pharmaceutical compounds, including anti-
biotics, antifungals and immunosuppressants, and which together
account for billions of pounds of sales per annum. These chemicals are
produced in various soil microorganisms and fungi. Their synthesis
involves the regulated action of a sequence of enzymes, the polyketide
synthases (PKSs). The PKSs occur either as small proteins that have a
small number of distinct non-repeating catalytic domains (iterative
PKSs) or as large multi-domain polypeptides. In the latter, while each
domain has a specific enzyme function, the same function may be pre-
sent a number of times (modular PKSs). In both cases, the product of
one catalytic domain forms the substrate for the reaction of a neigh-
bouring domain, the modular polyketides producing the more complex
molecules. By selectively adding, deleting and rearranging the order of
the catalytic domains to generate novel PKSs, a novel order of catalytic
reactions is established and hence new products can be generated.87–91
438 Chapter 15
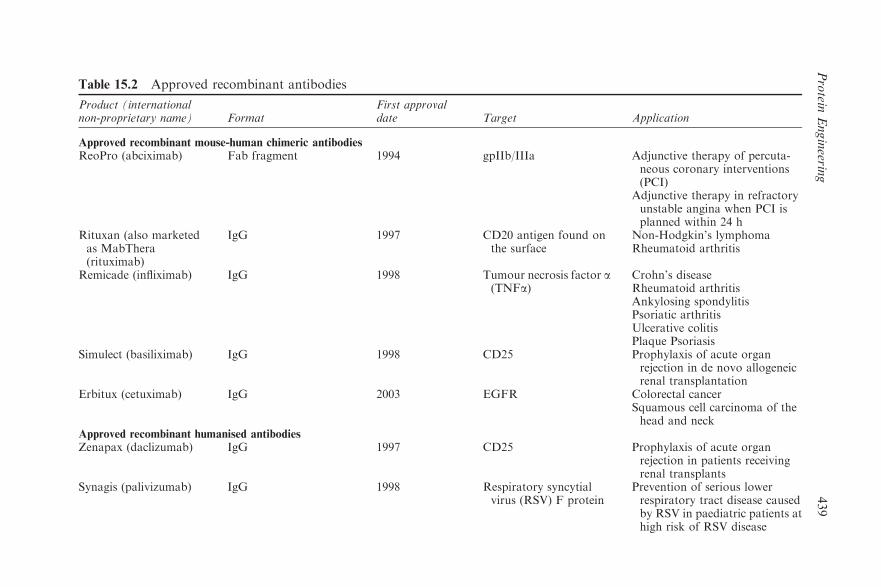
Table 15.2 Approved recombinant antibodies
Product (internationalnon-proprietary name) Format
First approvaldate Target Application
Approved recombinant mouse-human chimeric antibodiesReoPro (abciximab) Fab fragment 1994 gpIIb/IIIa Adjunctive therapy of percuta-
neous coronary interventions(PCI)
Adjunctive therapy in refractoryunstable angina when PCI isplanned within 24 h
Rituxan (also marketedas MabThera(rituximab)
IgG 1997 CD20 antigen found onthe surface
Non-Hodgkin’s lymphomaRheumatoid arthritis
Remicade (infliximab) IgG 1998 Tumour necrosis factor a(TNFa)
Crohn’s diseaseRheumatoid arthritisAnkylosing spondylitisPsoriatic arthritisUlcerative colitisPlaque Psoriasis
Simulect (basiliximab) IgG 1998 CD25 Prophylaxis of acute organrejection in de novo allogeneicrenal transplantation
Erbitux (cetuximab) IgG 2003 EGFR Colorectal cancerSquamous cell carcinoma of thehead and neck
Approved recombinant humanised antibodiesZenapax (daclizumab) IgG 1997 CD25 Prophylaxis of acute organ
rejection in patients receivingrenal transplants
Synagis (palivizumab) IgG 1998 Respiratory syncytialvirus (RSV) F protein
Prevention of serious lowerrespiratory tract disease causedby RSV in paediatric patients athigh risk of RSV disease
439
Protein
Engineerin
g
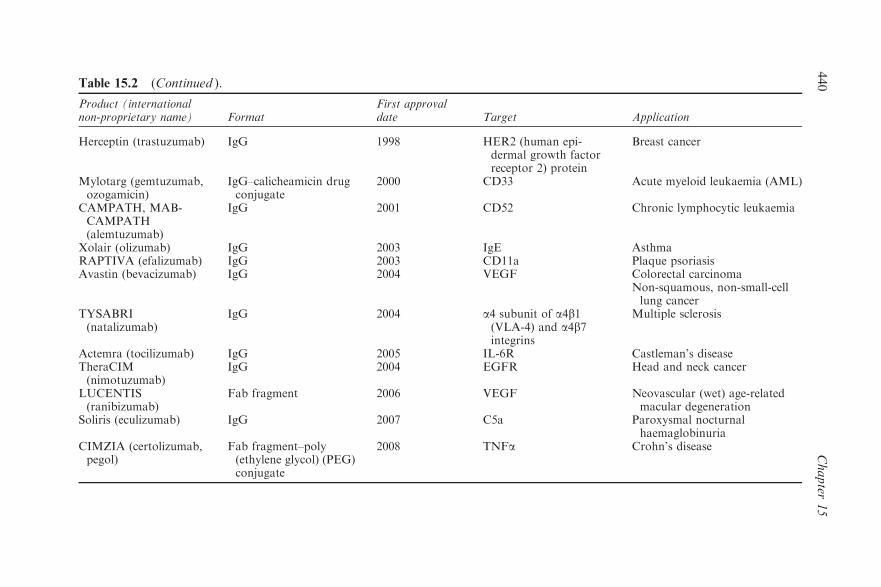
Table 15.2 (Continued ).
Product (internationalnon-proprietary name) Format
First approvaldate Target Application
Herceptin (trastuzumab) IgG 1998 HER2 (human epi-dermal growth factorreceptor 2) protein
Breast cancer
Mylotarg (gemtuzumab,ozogamicin)
IgG–calicheamicin drugconjugate
2000 CD33 Acute myeloid leukaemia (AML)
CAMPATH, MAB-CAMPATH(alemtuzumab)
IgG 2001 CD52 Chronic lymphocytic leukaemia
Xolair (olizumab) IgG 2003 IgE AsthmaRAPTIVA (efalizumab) IgG 2003 CD11a Plaque psoriasisAvastin (bevacizumab) IgG 2004 VEGF Colorectal carcinoma
Non-squamous, non-small-celllung cancer
TYSABRI(natalizumab)
IgG 2004 a4 subunit of a4b1(VLA-4) and a4b7integrins
Multiple sclerosis
Actemra (tocilizumab) IgG 2005 IL-6R Castleman’s diseaseTheraCIM(nimotuzumab)
IgG 2004 EGFR Head and neck cancer
LUCENTIS(ranibizumab)
Fab fragment 2006 VEGF Neovascular (wet) age-relatedmacular degeneration
Soliris (eculizumab) IgG 2007 C5a Paroxysmal nocturnalhaemaglobinuria
CIMZIA (certolizumab,pegol)
Fab fragment–poly(ethylene glycol) (PEG)conjugate
2008 TNFa Crohn’s disease
440
Chapter
15
15.3.2.3 Deleting Domains
In some situations, only a subset of the domains in a naturally occurring
protein are required for the development of a functional therapeutic.
Tissue plasminogen activator (tPA) is a serine protease secreted by
endothelial cells. Following binding to fibrin, tPA activates plasminogen
to plasmin which then initiates local thrombolysis. Reteplase is a variant
form in which three of the five domains of tPA have been deleted. One of
the domains that confers fibrin selectivity and the catalytic domain are
retained.92 Reteplase is licensed as Retavase for the treatment of acute
myocardial infarction to improve blood flow in the heart.
15.3.3 Whole Protein Shuffling
Many proteins exist as multi-member families in which the homologues
display slightly different biological activities determined by the sequence
variation. In the early days of protein engineering, hybrid genes were
generated by swapping sequence stretches using convenient common
restriction sites93 or by in vivo recombination between homologous
genes in a more random manner.94 These methods produced small
numbers of novel genes that could be examined individually. More
recently, protein homologues have been used to generate very large
libraries of novel variants by sequence shuffling. New variants, such as
thermostable enzyme mutants, can then be identified by selection or
screening procedures, as noted earlier.95
15.3.4 Protein–Ligand Interactions
15.3.4.1 Enzyme Modifications
Many examples of protein engineering involve changes to enzymes to
examine and modify enzyme–substrate interactions. These experiments
can be traced back to the earliest attempts at protein engineering, using
tyrosyl-tRNA synthetase.96–98
The types of changes include the following: enhancing catalytic
activity; modification of substrate specificity, including the de novo
generation of novel catalytic functions; alterations to pH profiles, so
that an enzyme can function in non-physiological conditions; improving
oxidation resistance by replacing oxidation sensitive amino acids such as
cysteine (Cys), tryptophan (Trp) or methionine (Met) by sterically
similar non-oxidizable amino acids such as serine (Ser), phenylalanine
(Phe) or glutamate (Glu), respectively; improving stability to heavy
metals by replacing Cys and Met residues and surface carboxyl groups;
removing protease cleavage motifs; and removing sites at which catalytic
441Protein Engineering
product might otherwise bind to induce allosteric feedback inhibition.
Leisola and Turunen99 have provided a recent brief summary with
pertinent references; see also Ref. 100.
15.3.4.2 Substitution of Binding Specificities
A number of examples are available where the specificity for a ligand has
been transferred from one protein background to another. Some of the
examples require small changes, some require large-scale transfer of
many residues. For example, the specificity of the hormone prolactin
was modified by substitution of eight amino acids at the receptor
binding surface so that the modified hormone now binds to the receptor
for growth hormone.101
Protein domains often have loop regions that span between other
secondary structure motifs (a-helix, b-strand). In some cases, the func-
tionality of the protein resides in these loops and they can be the target
for relatively simple substitution experiments. For example, the speci-
ficity of basic fibroblast growth factor was altered to that of acidic
fibroblast growth factor by the substitution of one particular loop
region.102
On a more adventurous scale, antibody humanisation involves
transfer of up to six loops that form the antigen binding surface, from
the b-sheet frameworks of the antigen binding domains of a non-human
antibody to that of a human antibody. This feat has taken some years to
become routine, since the first description in 1986.18 However, it has
now progressed to the point where a significant number of humanised
antibodies are marketed and profitable drugs (Table 15.2).
15.3.5 Towards De Novo Design
15.3.5.1 Development of Novel Binding Molecules
An intermediate step between experiments of the kind described above
and ‘true’ de novo design is to take a particular protein scaffold and
modify it so as to introduce new functions or retain function on a
radically altered scaffold. This is often done by taking a small, compact
domain of known structure and using phage display procedures to
modify part of the surface of the protein and to screen or select for the
introduction of a new function. Early examples included examination of
the structural plasticity of a protein fold by redesigning the N- and C-
termini within the sequence of the IL-4 cytokine, circularly permuting
the sequence without affecting the overall fold.103 In another early
example, Martin et al.104 described how a ‘minibody’ scaffold derived
442 Chapter 15

from an immunoglobulin binding domain and retaining only two loops
and six b-strands was used to obtain a novel antagonist for IL-6.
Over the last several years, there has been a growing use of naturally
occurring, small, stably folding domains as the basis for developing novel
proteins with specific functions, usually as binding domains.105–111 The
desired specificity and affinity features can be introduced using the
molecular evolution procedures described earlier, and significant pro-
gress has been made in preparing novel molecules. These newer molecules
aim to provide high-affinity binding and to avoid some of the practical
issues surrounding the antibody molecules (e.g. engineering and pro-
duction and not least the crowded intellectual property arena). A non-
exhaustive list of examples being commercialised is given in Table 15.3.
A long-term aim of examining such molecules is to bring protein or
peptide biopharmaceutical closer to the ‘normal’ pharmaceutical para-
digm of an orally available, synthetic, low molecular weight compound.
Beyond this there is the possibility of true de novo or ab initio design.
15.3.5.2 De Novo Design
Discussion of and attempts to design protein domains from first principles
have been under way for some time.112–114 Ab initio design brings different
challenges. In principle, for any protein of n residues there are 2� 10n
different possible sequences. As noted earlier, however, known structure
space is populated by a relatively small number of stable fold types. The
structures and sequences databases demonstrate that a range of sequences
can be accommodated in similar protein folds and a range of sequences
can fulfil similar functions. One approach to designing a functional pro-
tein is to decide what fold may be appropriate and then identify what
sequence(s) would be needed to generate the desired fold and function.115–
118 The next decade should bring significant developments in this area.
15.4 CONCLUSIONS AND FUTURE DIRECTIONS
Protein engineering, as a methodology, is now a mature technology.
Through the pragmatic approach allowed by molecular evolution
methods, novel proteins are being produced for research and commer-
cial applications at an ever-increasing rate. In the near future, there will
be an increasing effort to exploit the technology in areas that have been
less tractable to date: in understanding the structure and function of
membrane proteins that are the focus for many pharmaceutical strate-
gies,119,120 and in the developing field of nanotechnology, including
biosensors, bioelectronics and biocomputing.
443Protein Engineering
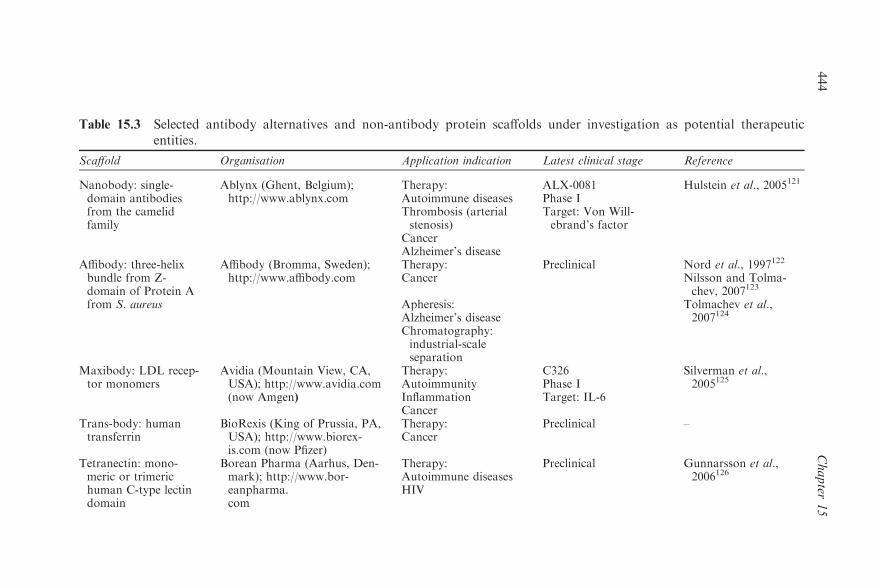
Table 15.3 Selected antibody alternatives and non-antibody protein scaffolds under investigation as potential therapeutic
entities.
Scaffold Organisation Application indication Latest clinical stage Reference
Nanobody: single-domain antibodiesfrom the camelidfamily
Ablynx (Ghent, Belgium);http://www.ablynx.com
Therapy: ALX-0081 Hulstein et al., 2005121
Autoimmune diseases Phase IThrombosis (arterialstenosis)
Target: Von Will-ebrand’s factor
CancerAlzheimer’s disease
Affibody: three-helixbundle from Z-domain of Protein Afrom S. aureus
Affibody (Bromma, Sweden);http://www.affibody.com
Therapy: Preclinical Nord et al., 1997122
Cancer Nilsson and Tolma-chev, 2007123
Apheresis: Tolmachev et al.,2007124Alzheimer’s disease
Chromatography:industrial-scaleseparation
Maxibody: LDL recep-tor monomers
Avidia (Mountain View, CA,USA); http://www.avidia.com(now Amgen)
Therapy: C326 Silverman et al.,2005125Autoimmunity Phase I
Inflammation Target: IL-6Cancer
Trans-body: humantransferrin
BioRexis (King of Prussia, PA,USA); http://www.biorex-is.com (now Pfizer)
Therapy: Preclinical –Cancer
Tetranectin: mono-meric or trimerichuman C-type lectindomain
Borean Pharma (Aarhus, Den-mark); http://www.bor-eanpharma.com
Therapy: Preclinical Gunnarsson et al.,2006126Autoimmune diseases
HIV
444
Chapter
15
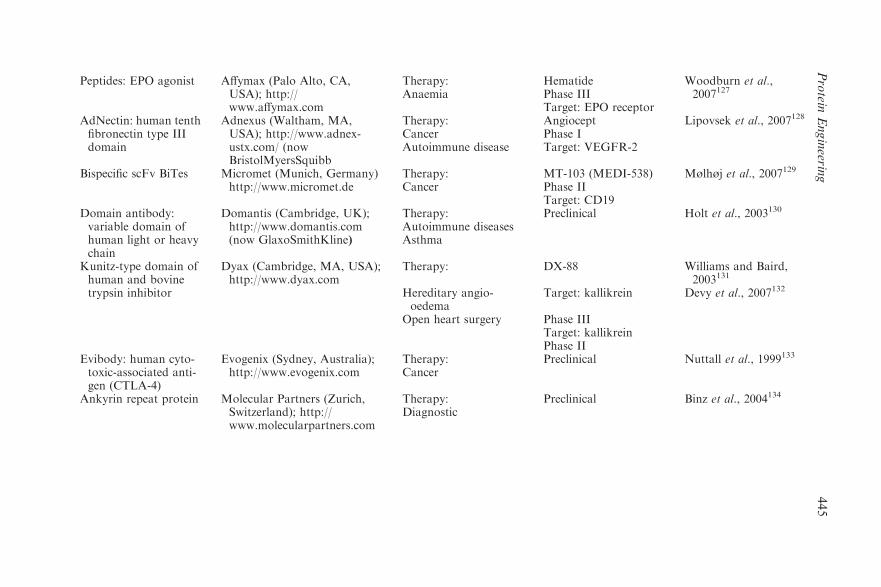
Peptides: EPO agonist Affymax (Palo Alto, CA,USA); http://www.affymax.com
Therapy: Hematide Woodburn et al.,2007127Anaemia Phase III
Target: EPO receptorAdNectin: human tenthfibronectin type IIIdomain
Adnexus (Waltham, MA,USA); http://www.adnex-ustx.com/ (nowBristolMyersSquibb
Therapy: Angiocept Lipovsek et al., 2007128
Cancer Phase IAutoimmune disease Target: VEGFR-2
Bispecific scFv BiTes Micromet (Munich, Germany)http://www.micromet.de
Therapy: MT-103 (MEDI-538) Mølhøj et al., 2007129
Cancer Phase IITarget: CD19
Domain antibody:variable domain ofhuman light or heavychain
Domantis (Cambridge, UK);http://www.domantis.com(now GlaxoSmithKline)
Therapy: Preclinical Holt et al., 2003130
Autoimmune diseasesAsthma
Kunitz-type domain ofhuman and bovinetrypsin inhibitor
Dyax (Cambridge, MA, USA);http://www.dyax.com
Therapy: DX-88 Williams and Baird,2003131
Hereditary angio-oedema
Target: kallikrein Devy et al., 2007132
Open heart surgery Phase IIITarget: kallikreinPhase II
Evibody: human cyto-toxic-associated anti-gen (CTLA-4)
Evogenix (Sydney, Australia);http://www.evogenix.com
Therapy: Preclinical Nuttall et al., 1999133
Cancer
Ankyrin repeat protein Molecular Partners (Zurich,Switzerland); http://www.molecularpartners.com
Therapy: Preclinical Binz et al., 2004134
Diagnostic
445
Protein
Engineerin
g
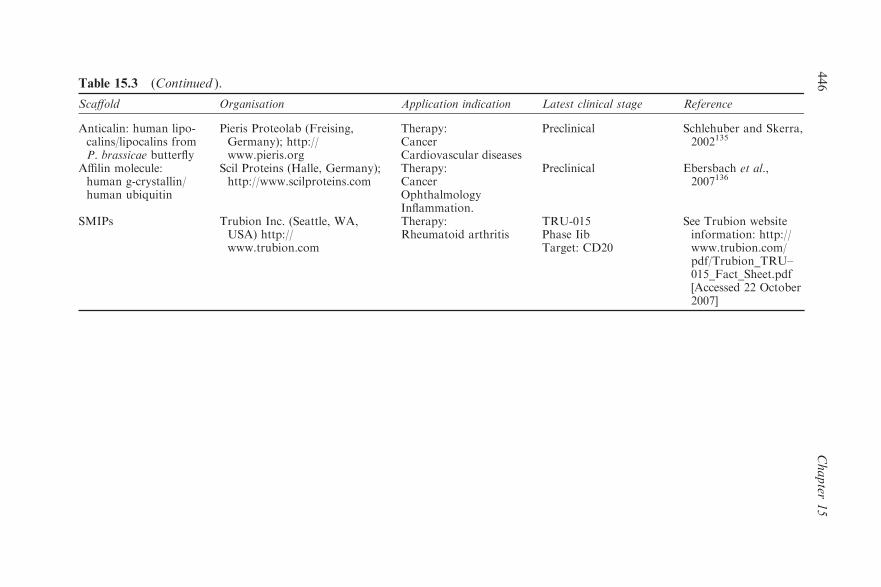
Table 15.3 (Continued ).
Scaffold Organisation Application indication Latest clinical stage Reference
Anticalin: human lipo-calins/lipocalins fromP. brassicae butterfly
Pieris Proteolab (Freising,Germany); http://www.pieris.org
Therapy: Preclinical Schlehuber and Skerra,2002135Cancer
Cardiovascular diseasesAffilin molecule:human g-crystallin/human ubiquitin
Scil Proteins (Halle, Germany);http://www.scilproteins.com
Therapy: Preclinical Ebersbach et al.,2007136Cancer
OphthalmologyInflammation.
SMIPs Trubion Inc. (Seattle, WA,USA) http://www.trubion.com
Therapy: TRU-015 See Trubion websiteinformation: http://www.trubion.com/pdf/Trubion_TRU–015_Fact_Sheet.pdf[Accessed 22 October2007]
Rheumatoid arthritis Phase IibTarget: CD20
446
Chapter
15
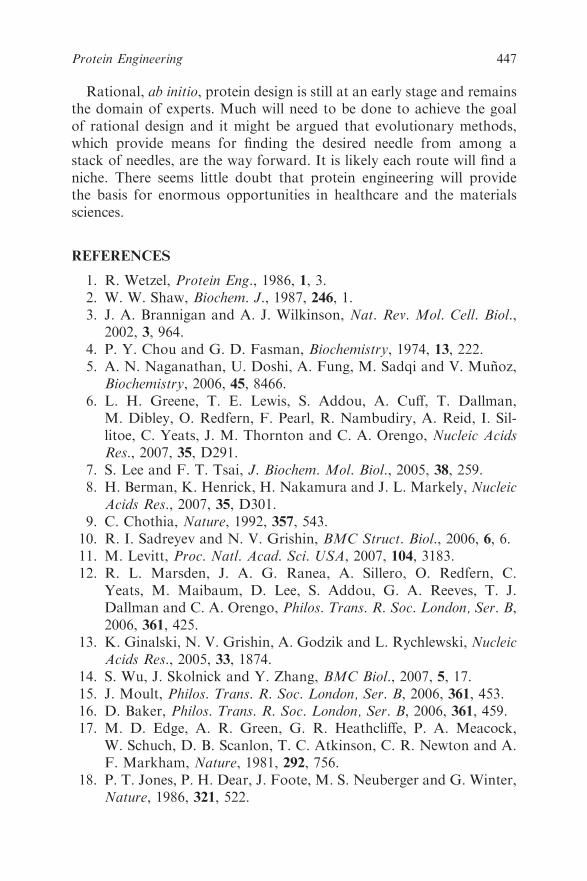
Rational, ab initio, protein design is still at an early stage and remains
the domain of experts. Much will need to be done to achieve the goal
of rational design and it might be argued that evolutionary methods,
which provide means for finding the desired needle from among a
stack of needles, are the way forward. It is likely each route will find a
niche. There seems little doubt that protein engineering will provide
the basis for enormous opportunities in healthcare and the materials
sciences.
REFERENCES
1. R. Wetzel, Protein Eng., 1986, 1, 3.
2. W. W. Shaw, Biochem. J., 1987, 246, 1.
3. J. A. Brannigan and A. J. Wilkinson, Nat. Rev. Mol. Cell. Biol.,
2002, 3, 964.
4. P. Y. Chou and G. D. Fasman, Biochemistry, 1974, 13, 222.
5. A. N. Naganathan, U. Doshi, A. Fung, M. Sadqi and V. Munoz,
Biochemistry, 2006, 45, 8466.
6. L. H. Greene, T. E. Lewis, S. Addou, A. Cuff, T. Dallman,
M. Dibley, O. Redfern, F. Pearl, R. Nambudiry, A. Reid, I. Sil-
litoe, C. Yeats, J. M. Thornton and C. A. Orengo, Nucleic Acids
Res., 2007, 35, D291.
7. S. Lee and F. T. Tsai, J. Biochem. Mol. Biol., 2005, 38, 259.
8. H. Berman, K. Henrick, H. Nakamura and J. L. Markely, Nucleic
Acids Res., 2007, 35, D301.
9. C. Chothia, Nature, 1992, 357, 543.
10. R. I. Sadreyev and N. V. Grishin, BMC Struct. Biol., 2006, 6, 6.
11. M. Levitt, Proc. Natl. Acad. Sci. USA, 2007, 104, 3183.
12. R. L. Marsden, J. A. G. Ranea, A. Sillero, O. Redfern, C.
Yeats, M. Maibaum, D. Lee, S. Addou, G. A. Reeves, T. J.
Dallman and C. A. Orengo, Philos. Trans. R. Soc. London, Ser. B,
2006, 361, 425.
13. K. Ginalski, N. V. Grishin, A. Godzik and L. Rychlewski, Nucleic
Acids Res., 2005, 33, 1874.
14. S. Wu, J. Skolnick and Y. Zhang, BMC Biol., 2007, 5, 17.
15. J. Moult, Philos. Trans. R. Soc. London, Ser. B, 2006, 361, 453.
16. D. Baker, Philos. Trans. R. Soc. London, Ser. B, 2006, 361, 459.
17. M. D. Edge, A. R. Green, G. R. Heathcliffe, P. A. Meacock,
W. Schuch, D. B. Scanlon, T. C. Atkinson, C. R. Newton and A.
F. Markham, Nature, 1981, 292, 756.
18. P. T. Jones, P. H. Dear, J. Foote, M. S. Neuberger and G. Winter,
Nature, 1986, 321, 522.
447Protein Engineering
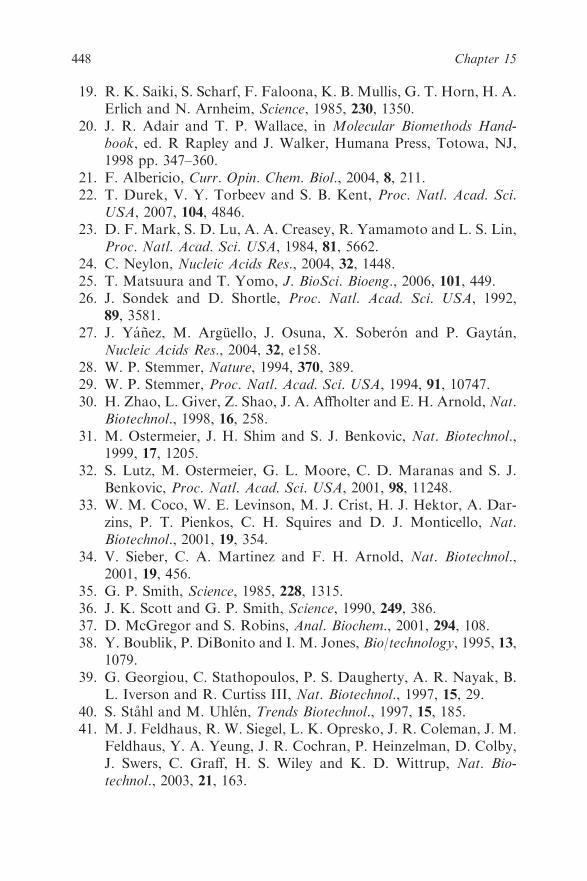
19. R. K. Saiki, S. Scharf, F. Faloona, K. B. Mullis, G. T. Horn, H. A.
Erlich and N. Arnheim, Science, 1985, 230, 1350.
20. J. R. Adair and T. P. Wallace, in Molecular Biomethods Hand-
book, ed. R Rapley and J. Walker, Humana Press, Totowa, NJ,
1998 pp. 347–360.
21. F. Albericio, Curr. Opin. Chem. Biol., 2004, 8, 211.
22. T. Durek, V. Y. Torbeev and S. B. Kent, Proc. Natl. Acad. Sci.
USA, 2007, 104, 4846.
23. D. F. Mark, S. D. Lu, A. A. Creasey, R. Yamamoto and L. S. Lin,
Proc. Natl. Acad. Sci. USA, 1984, 81, 5662.
24. C. Neylon, Nucleic Acids Res., 2004, 32, 1448.
25. T. Matsuura and T. Yomo, J. BioSci. Bioeng., 2006, 101, 449.
26. J. Sondek and D. Shortle, Proc. Natl. Acad. Sci. USA, 1992,
89, 3581.
27. J. Yanez, M. Arguello, J. Osuna, X. Soberon and P. Gaytan,
Nucleic Acids Res., 2004, 32, e158.
28. W. P. Stemmer, Nature, 1994, 370, 389.
29. W. P. Stemmer, Proc. Natl. Acad. Sci. USA, 1994, 91, 10747.
30. H. Zhao, L. Giver, Z. Shao, J. A. Affholter and E. H. Arnold, Nat.
Biotechnol., 1998, 16, 258.
31. M. Ostermeier, J. H. Shim and S. J. Benkovic, Nat. Biotechnol.,
1999, 17, 1205.
32. S. Lutz, M. Ostermeier, G. L. Moore, C. D. Maranas and S. J.
Benkovic, Proc. Natl. Acad. Sci. USA, 2001, 98, 11248.
33. W. M. Coco, W. E. Levinson, M. J. Crist, H. J. Hektor, A. Dar-
zins, P. T. Pienkos, C. H. Squires and D. J. Monticello, Nat.
Biotechnol., 2001, 19, 354.
34. V. Sieber, C. A. Martinez and F. H. Arnold, Nat. Biotechnol.,
2001, 19, 456.
35. G. P. Smith, Science, 1985, 228, 1315.
36. J. K. Scott and G. P. Smith, Science, 1990, 249, 386.
37. D. McGregor and S. Robins, Anal. Biochem., 2001, 294, 108.
38. Y. Boublik, P. DiBonito and I. M. Jones, Bio/technology, 1995, 13,
1079.
39. G. Georgiou, C. Stathopoulos, P. S. Daugherty, A. R. Nayak, B.
L. Iverson and R. Curtiss III, Nat. Biotechnol., 1997, 15, 29.
40. S. Stahl and M. Uhlen, Trends Biotechnol., 1997, 15, 185.
41. M. J. Feldhaus, R. W. Siegel, L. K. Opresko, J. R. Coleman, J. M.
Feldhaus, Y. A. Yeung, J. R. Cochran, P. Heinzelman, D. Colby,
J. Swers, C. Graff, H. S. Wiley and K. D. Wittrup, Nat. Bio-
technol., 2003, 21, 163.
448 Chapter 15

42. S. A. Gai and K. D. Wittrup, Curr. Opin. Struct. Biol., 2007, 17,
467.
43. P. S. Daugherty, Curr. Opin. Struct. Biol., 2007, 17, 474.
44. M. G. Cull, J. F. Miller and P. J. Schatz, Proc. Natl. Acad. Sci.
USA, 1992, 89, 1865.
45. A. S. Perelson and G. F. Oster, J. Theor. Biol., 1979, 81, 645.
46. L. C. Mattheakis, R. R. Bhatt and W. J. Dower, Proc. Natl. Acad.
Sci. USA, 1994, 91, 9022.
47. J. Hanes and A. Pluckthun, Proc. Natl. Acad. Sci. USA, 1997,
94, 4937.
48. M. He and M. J. Taussig, Nat. Methods, 2007, 4, 281.
49. G. Coia, L. Pontes-Braz, S. D. Nuttall, P. J. Hudson and R. A.
Irving, J. Immunol. Methods, 2001, 254, 191.
50. R. W. Roberts and J. W. Szostak, Proc. Natl. Acad. Sci. USA,
1997, 94, 12297.
51. C. Zahnd, P. Amstutz and A. Pluckthun, Nat. Methods, 2007,
4, 269.
52. N. Nemoto, E. Miyamoto-Sato, Y. Husimi and H. Yanagawa,
FEBS Lett., 1997, 414, 405.
53. R. Odegrip, D. Coomber, B. Eldridge, R. Hederer, P. A. Kuhlman,
C. Ullman, K. FitzGerald and D. McGregor, Proc. Natl. Acad.
Sci. USA, 2004, 101, 2806.
54. J. Bertschinger and D. Neri, Protein Eng. Des. Sel., 2004, 17, 699.
55. H. Reiersen, I. Lobersli, G. A. Løset, E. Hvattum, B. Simonsen,
J. E. Stacy, D. McGregor, K. Fitzgerald, M. Welschof, O. H.
Brekke and O. J Marvik, Nucleic Acids Res., 2005, 33, e10.
56. D. S. Tawfik and A. D. Griffiths, Nat. Biotechnol., 1998, 16, 652.
57. A. Sepp, D. S. Tawfik and A. D. Griffiths, FEBS Lett., 2002, 532,
455.
58. A. Rothe, R. N. Surjadi and B. E. Power, Trends Biotechnol., 2006,
24, 587.
59. M. Yonezawa, N. Doi, Y. Kawahashi, T. Higashinakagawa and
H. Yanagawa, Nucleic Acids Res., 2003, 31, e118.
60. C. Schmidt-Dannert and F. H. Arnold, Trends Biotechnol., 1999,
17, 135.
61. F. H. Arnold, http://eands.caltech.edu/articles/arnold/arnold. html.
62. H. Zhao and F. H. Arnold, Curr. Opin. Struct. Biol., 1997, 7, 480.
63. E. G. Hibbert and P. A. Dalby, Microb. Cell Fact., 2005, 4, 29.
64. C. Chiarabelli, J. W. Vrijbloed, R. M. Thomas and P. L. Luisi,
Chem. Biodivers., 2006, 3, 827.
65. P. Kast and D. Hilvert, Curr. Opin. Struct. Biol., 1997, 7, 470.
449Protein Engineering
66. R. Pasqualini and E. Ruoslahti, Nature, 1996, 380, 364.
67. D. R. Christianson, M. G. Ozawa, R. Pasqualini and W. Arap,
Methods Mol. Biol., 2007, 357, 385.
68. K. Graumann and A. Premstaller, Biotechnol. J., 2006, 1, 164.
69. F. Katzen, G. Chang and W. Kudlicki, Trends Biotechnol., 2005,
23, 150.
70. B. L. Bray, Nat. Rev. Drug Discov., 2003, 2, 587.
71. T. Bruckdorfer, O. Marder and F. Albericio, Curr. Pharm. Bio-
technol., 2004, 5, 29.
72. D. R. Casimiro, P. E. Wright and H. J. Dyson, Structure, 1997, 5,
1407.
73. W. Peti, R. Page, K. Moy, M. O’Neil-Johnson, I. A. Wilson,
R. C. Stevens and K. Wuthrich, J. Struct. Funct. Genomics, 2005,
6, 259.
74. G. Walsh, Nat. Biotechnol., 2006, 24, 769.
75. M. Joyeux-Faure, J. Pharmacol. Exp. Ther., 2007, 323, 759.
76. A. M. Sinclair and S. Elliott, J. Pharm. Sci., 2005, 94, 1626.
77. P. J. Carter, Nat. Rev. Immunol., 2006, 6, 343.
78. M. S. Neuberger, G. T. Williams, E. B. Mitchell, S. S. Jouhal, J. G.
Flanagan and T. H. Rabbitts, Nature, 1985, 314, 268.
79. G. T. Williams and M. S. Neuberger, Gene, 1986, 43, 319.
80. K. M. Mohler, D. S. Torrance, C. A. Smith, R. G. Goodwin, K. E.
Stremler, V. P. Fung, H. Madani and M. B. Widmer, J. Immunol.,
1993, 151, 1548.
81. D. P. Williams, K. Parker, P. Bacha, W. Bishai, M. Borowski, F.
Genbauffe, T. B. Strom and J. R. Murphy, Protein Eng., 1987, 1,
493.
82. G. J. Lieschke, P. K. Rao, M. K. Gately and R. C. Mulligan, Nat.
Biotechnol., 1997, 15, 35.
83. R. E. Bird, K. D. Hardman, J. W. Jacobson, S. Johnson, B. M.
Kaufman, S. M. Lee, T. Lee, S. H. Pope, G. S. Riordan and M.
Whitlow, Science, 1988, 242, 423.
84. J. S. Huston, D. Levinson, M. Mudgett-Hunter, M. S. Tai,
J. Novotny, M. N. Margolies, R. J. Ridge, R. E. Bruccoleri,
E. Haber, R. Crea and H. Oppermann, Proc. Natl. Acad. Sci. USA,
1988, 85, 5879.
85. S. L. Morrison, M. J. Johnson, L. A. Herzenberg and V. T. Oi,
Proc. Natl. Acad. Sci. USA, 1984, 81, 6851.
86. A. F. LoBuglio, R. H. Wheeler, J. Trang, A. Haynes, K. Rogers,
E. B. Harvey, L. Sun, J. Ghrayeb and M. B. Khazaeli, Proc. Natl.
Acad. Sci. USA, 1989, 86, 4220.
87. J. Staunton and K. J. Weissman, Nat. Prod. Rep., 2001, 18, 380.
450 Chapter 15

88. H. G. Menzella, R. Reid, J. R. Carney, S. S. Chandran, S. J.
Reisinger, K. G. Patel, D. A Hopwood and D. V. Santi, Nat.
Biotechnol., 2005, 23, 1171.
89. H. G. Menzella, J. R. Carney and D. V. Santi, Chem. Biol., 2007,
14, 143.
90. D. H. Sherman, Nat. Biotechnol., 2005, 23, 1083.
91. H. Jenke-Kodama, T. Borner and E. Dittmann, PLoS Comput.
Biol., 2006, 2, e132.
92. T. K. Nordt and C. Bode, Heart, 2003, 89, 1358.
93. A. G. Porter, L. D. Bell, J. Adair, G. H. Catlin, J. Clarke, J. A.
Davies, K. Dawson, R. Derbyshire, S. M. Doel, L. Dunthorne,
M. Finlay, J. Hall, M. Houghton, C. Hynes, I. Lindley, M.
Nugent, G. J. O’Neil, J. C. Smith, A. Stewart, W. Tacon, J. Viney,
N. Warburton, P. G. Boseley and K. G. McCullagh, DNA, 1986,
5, 137.
94. H. Weber and C. Weissmann, Nucleic Acids Res., 1983, 11, 5661.
95. J. Hecky and K. M. Muller, Biochemistry, 2005, 44, 12640.
96. G. Winter, A. R. Fersht, A. J. Wilkinson, M. Zoller and M. Smith,
Nature, 1982, 299, 756.
97. A. J. Wilkinson, A. R. Fersht, D. M. Blow, P. Carter and G.
Winter, Nature, 1984, 307, 187.
98. A. Fersht and G. Winter, Trends Biochem. Sci., 1992, 17, 292.
99. M. Leisola and O. Turunen, Appl. Microbiol. Biotechnol., 2007,
75, 1225.
100. F. H. Arnold, www.che.caltech.edu/groups/fha/directed_evolution,
2007. Accessed 9 November 2007.
101. B. C. Cunningham, D. J. Henner and J. A. Wells, Science, 1990,
247, 1461.
102. A. P. Seddon, D. Aviezer, L.-Y. Li, P. Bohlen and A. Yayon,
Biochemistry, 1995, 34, 731.
103. R. J. Kreitman, R. K. Puri and I. Pastan, Proc. Natl. Acad. Sci.
USA, 1994, 91, 6889.
104. F. Martin, C. Toniatti, A. L. Salvati, G. Ciliberto, R. Cortese and
M. Sollazzo, J. Mol. Biol., 1996, 255, 86.
105. I. Tomlinson, Nat. Biotechnol., 2004, 22, 521.
106. H. K. Binz, P. Amstutz and A. Pluckthun, Nat. Biotechnol., 2005,
23, 1257.
107. K. J. Jeong, R. Mabry and G. Georgiou, Nat. Biotechnol., 2005,
23, 1493.
108. D. S. Gill and N. K. Damle, Curr. Opin. Biotechnol., 2006,
17, 653.
109. R. J. Hosse, A. Rothe and B. E. Power, Protein Sci., 2006, 15, 14.
451Protein Engineering
110. A. Rothe, R. J. Hosse and B. E. Power, FASEB J., 2006, 20, 1599.
111. P. M. Watt, Nat. Biotechnol., 2006, 24, 177.
112. K. E. Drexler, Proc. Natl. Acad. Sci. USA, 1981, 78, 5275.
113. C. Pabo, Nature, 1983, 301, 200.
114. L. Regan and W. F. deGrado, Science, 1988, 241, 976.
115. B. I. Dahiyat and S. L. Mayo, Science, 1997, 278, 82.
116. P. B. Harbury, J. J. Plecs, B. Tidor, T. Alber and P. S. Kim, Sci-
ence, 1998, 282, 1462.
117. G. Dantas, B. Kuhlman, D. Callender, M. Wong and D. Baker,
J. Mol. Biol., 2003, 332, 449.
118. B. Kuhlman, G. Dantas, G. C. Ireton, G. Varani, B. L. Stoddard
and D. Baker, Science, 2003, 302, 1364.
119. N. Hurwitz, M. Pellegrini-Calace and D. T. Jones, Philos. Trans.
R. Soc. London, Ser. B, 2006, 361, 465.
120. P. Barth, J. Schonbrun and D. Baker, D. Proc. Natl. Acad. Sci.
USA, 2007, 104, 15682.
121. J. J. Hulstein, P. G. de Groot, K. Silence, A. Veyradier, R. Fijnheer
and P. J. Lenting, Blood, 2005, 106, 3035.
122. K. Nord, E. Gunneriusson, J. Ringdahl, S. Stahl, M. Uhlen and
P. A. Nygren, Nat. Biotechnol., 1997, 15, 772.
123. F. Nilsson and V. Tolmachev, Curr. Opin. Drug Discov. Dev., 2007,
10, 167.
124. V. Tolmachev, A. Orlova, F. Y. Nilsson, J. Feldwisch, A. Wenn-
borg and L. Abrahmsen, Expert Opin. Biol.Ther., 2007, 7, 555.
125. J. Silverman, Q. Liu, A. Bakker, W. To, A. Duguay, B. M. Alba,
R. Smith A. Rivas, P. Li, H. Le, E. Whitehorn, K. W. Moore,
C. Swimmer, V. Perlroth, M. Vogt, J. Kolkman and W. P. Stem-
mer, Nat. Biotechnol., 2005, 23, 1556.
126. L. C. Gunnarsson, L. Dexlin, E. N. Karlsson, O. Holst and
M. Ohlin, Biomol Eng., 2006, 23, 111.
127. K. W. Woodburn, Q. Fan, S. Winslow, M. J. Chen, R. B.
Mortensen, N. Casadevall, R. B. Stead and P. J. Schatz, Exp
Hematol., 2007, 35, 1201.
128. D. Lipovsek, S. M. Lippow, B. J. Hackel, M. W. Gregson,
P. Cheng, A. Kapila and K. D. Wittrup, J. Mol. Biol., 2007, 368,
1024.
129. M. Mølhøj, S. Crommer, K. Brischwein, D. Rau, M. Sriskandar-
ajah, P. Hoffmann, P. Kufer, R. Hofmeister and P. A. Baeuerle,
Mol Immunol., 2007, 44, 1935.
130. L. J. Holt, C. Herring, L. S. Jespers, B. P. Woolven and I. M.
Tomlinson, Trends Biotechnol., 2003, 21, 484.
131. A. Williams and L. G. Baird, Transfus. Apher. Sci., 2003, 29, 255.
452 Chapter 15

132. L. Devy, S. A. Rabbani, M. Stochl, M. Ruskowski, I. Mackie,
L. Naa, M. Toews, R. van Gool, J. Chen, A. Ley, R. C. Ladner, D.
T. Dransfield and P. Henderikx, Neoplasia, 2007, 9, 927.
133. S. D. Nuttall, M. J. Rousch, R. A. Irving, S. E. Hufton, H. R.
Hoogenboom and P. J. Hudson, Proteins, 1999, 36, 217.
134. H. K. Binz, P. Amstutz, A. Kohl, M. T. Stumpp, C. Briand,
P. Forrer, M. G. Grutter and A. Pluckthun,Nat. Biotechnol., 2004,
22, 575.
135. S. Schlehuber and A. Skerra, Biophys. Chem., 2002, 96, 213.
136. H. Ebersbach, E. Fiedler, T. Scheuermann, M. Fiedler, M. T.
Stubbs, C. Reimann, G. Proetzel, R. Rudolph and U. Fiedler,
J. Mol. Biol., 2007, 372, 172.
137. S. N. Ho, H. D. Hunt, R. M. Horton, J. K. Pullen and L. R. Pease,
Gene, 1989, 77, 51.
453Protein Engineering

CHAPTER 16
Immobilisation of Enzymes and Cells
GORDON F. BICKERSTAFF
School of Science, University of the West of Scotland, Paisley Campus,
Paisley PA1 2BE, UK
16.1 INTRODUCTION
The number of new biocatalysts required to support the rapid growth of
biotechnology applications is increasing substantially. Although many
biocatalysts can be used as free enzymes or as whole cells, immobilisa-
tion adds features that can significantly improve the commercial viabi-
lity and stability. Immobilisation methodology has expanded greatly in
the past 40 years in a wide range of analytical, biotransformation and
medical applications.1 A consequence of the explosion of this techno-
logy is that there is now a bewildering array of permutations for
immobilisation of biological material.2 Biological catalysts have a high
degree of individual variability and, although many immobilisation
techniques have wide applicability, it is impossible for one or even a few
methods to cater for the great diversity of requirements inherent in
biological material. This is especially so when the aim is to produce an
optimum system in which an immobilised biocatalyst can function at
high levels of efficiency, stability and economy.2
Molecular Biology and Biotechnology, 5th Edition
Edited by John M Walker and Ralph Rapleyr Royal Society of Chemistry 2009
Published by the Royal Society of Chemistry, www.rsc.org
454
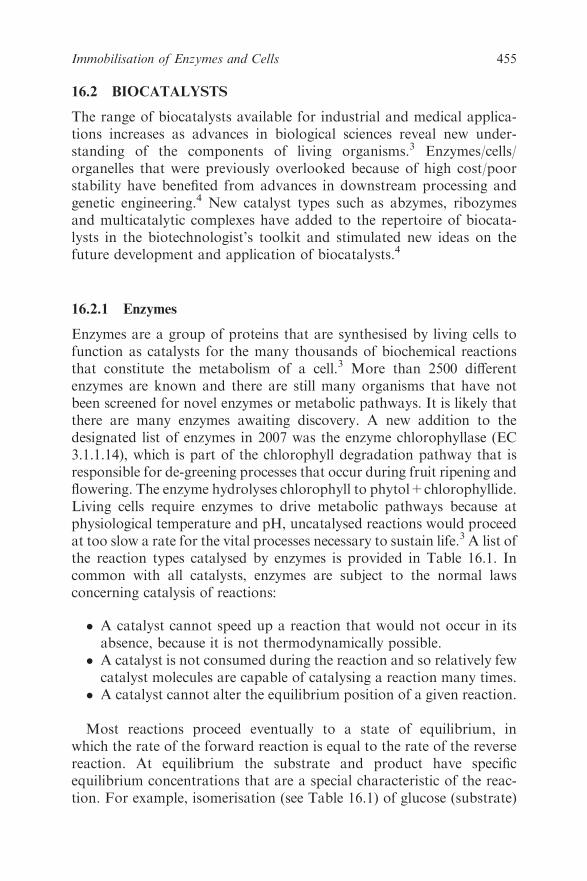
16.2 BIOCATALYSTS
The range of biocatalysts available for industrial and medical applica-
tions increases as advances in biological sciences reveal new under-
standing of the components of living organisms.3 Enzymes/cells/
organelles that were previously overlooked because of high cost/poor
stability have benefited from advances in downstream processing and
genetic engineering.4 New catalyst types such as abzymes, ribozymes
and multicatalytic complexes have added to the repertoire of biocata-
lysts in the biotechnologist’s toolkit and stimulated new ideas on the
future development and application of biocatalysts.4
16.2.1 Enzymes
Enzymes are a group of proteins that are synthesised by living cells to
function as catalysts for the many thousands of biochemical reactions
that constitute the metabolism of a cell.3 More than 2500 different
enzymes are known and there are still many organisms that have not
been screened for novel enzymes or metabolic pathways. It is likely that
there are many enzymes awaiting discovery. A new addition to the
designated list of enzymes in 2007 was the enzyme chlorophyllase (EC
3.1.1.14), which is part of the chlorophyll degradation pathway that is
responsible for de-greening processes that occur during fruit ripening and
flowering. The enzyme hydrolyses chlorophyll to phytol+chlorophyllide.
Living cells require enzymes to drive metabolic pathways because at
physiological temperature and pH, uncatalysed reactions would proceed
at too slow a rate for the vital processes necessary to sustain life.3A list of
the reaction types catalysed by enzymes is provided in Table 16.1. In
common with all catalysts, enzymes are subject to the normal laws
concerning catalysis of reactions:
� A catalyst cannot speed up a reaction that would not occur in its
absence, because it is not thermodynamically possible.
� A catalyst is not consumed during the reaction and so relatively few
catalyst molecules are capable of catalysing a reaction many times.
� A catalyst cannot alter the equilibrium position of a given reaction.
Most reactions proceed eventually to a state of equilibrium, in
which the rate of the forward reaction is equal to the rate of the reverse
reaction. At equilibrium the substrate and product have specific
equilibrium concentrations that are a special characteristic of the reac-
tion. For example, isomerisation (see Table 16.1) of glucose (substrate)
455Immobilisation of Enzymes and Cells
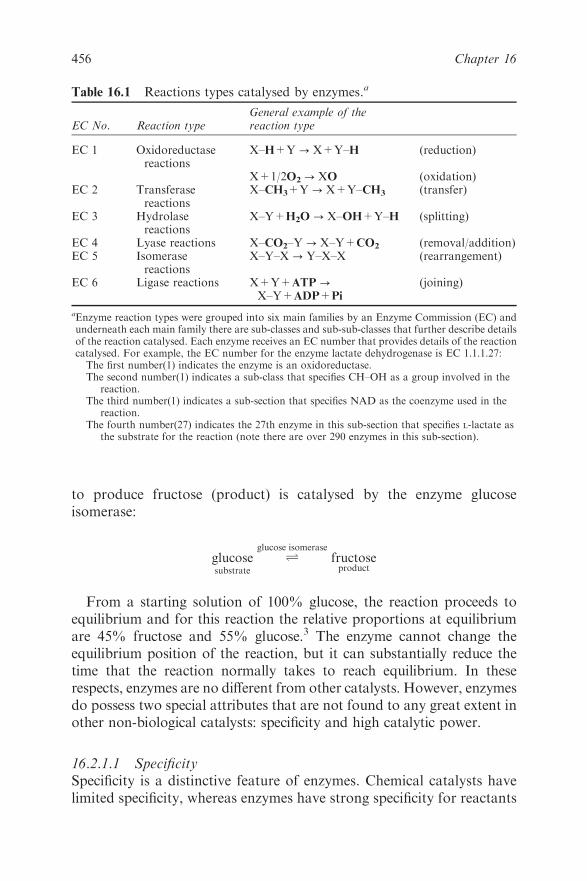
to produce fructose (product) is catalysed by the enzyme glucose
isomerase:
glucosesubstrate
Ð
glucose isomerase
fructoseproduct
From a starting solution of 100% glucose, the reaction proceeds to
equilibrium and for this reaction the relative proportions at equilibrium
are 45% fructose and 55% glucose.3 The enzyme cannot change the
equilibrium position of the reaction, but it can substantially reduce the
time that the reaction normally takes to reach equilibrium. In these
respects, enzymes are no different from other catalysts. However, enzymes
do possess two special attributes that are not found to any great extent in
other non-biological catalysts: specificity and high catalytic power.
16.2.1.1 Specificity
Specificity is a distinctive feature of enzymes. Chemical catalysts have
limited specificity, whereas enzymes have strong specificity for reactants
Table 16.1 Reactions types catalysed by enzymes.a
EC No. Reaction typeGeneral example of thereaction type
EC 1 Oxidoreductasereactions
X–H+Y-X+Y–H (reduction)
X+1/2O2-XO (oxidation)EC 2 Transferase
reactionsX–CH3+Y-X+Y–CH3 (transfer)
EC 3 Hydrolasereactions
X–Y+H2O-X–OH+Y–H (splitting)
EC 4 Lyase reactions X–CO2–Y-X–Y+CO2 (removal/addition)EC 5 Isomerase
reactionsX–Y–X-Y–X–X (rearrangement)
EC 6 Ligase reactions X+Y+ATP-
X–Y+ADP+Pi(joining)
aEnzyme reaction types were grouped into six main families by an Enzyme Commission (EC) andunderneath each main family there are sub-classes and sub-sub-classes that further describe detailsof the reaction catalysed. Each enzyme receives an EC number that provides details of the reactioncatalysed. For example, the EC number for the enzyme lactate dehydrogenase is EC 1.1.1.27:
The first number(1) indicates the enzyme is an oxidoreductase.The second number(1) indicates a sub-class that specifies CH–OH as a group involved in the
reaction.The third number(1) indicates a sub-section that specifies NAD as the coenzyme used in the
reaction.The fourth number(27) indicates the 27th enzyme in this sub-section that specifies L-lactate as
the substrate for the reaction (note there are over 290 enzymes in this sub-section).
456 Chapter 16
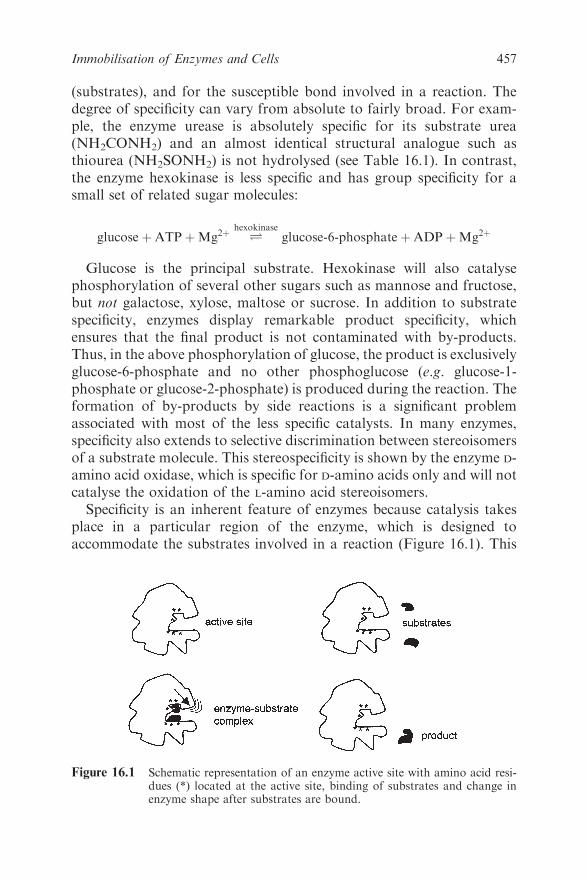
(substrates), and for the susceptible bond involved in a reaction. The
degree of specificity can vary from absolute to fairly broad. For exam-
ple, the enzyme urease is absolutely specific for its substrate urea
(NH2CONH2) and an almost identical structural analogue such as
thiourea (NH2SONH2) is not hydrolysed (see Table 16.1). In contrast,
the enzyme hexokinase is less specific and has group specificity for a
small set of related sugar molecules:
glucoseþATPþMg2þ Ðhexokinase
glucose-6-phosphateþADP þMg2þ
Glucose is the principal substrate. Hexokinase will also catalyse
phosphorylation of several other sugars such as mannose and fructose,
but not galactose, xylose, maltose or sucrose. In addition to substrate
specificity, enzymes display remarkable product specificity, which
ensures that the final product is not contaminated with by-products.
Thus, in the above phosphorylation of glucose, the product is exclusively
glucose-6-phosphate and no other phosphoglucose (e.g. glucose-1-
phosphate or glucose-2-phosphate) is produced during the reaction. The
formation of by-products by side reactions is a significant problem
associated with most of the less specific catalysts. In many enzymes,
specificity also extends to selective discrimination between stereoisomers
of a substrate molecule. This stereospecificity is shown by the enzyme D-
amino acid oxidase, which is specific for D-amino acids only and will not
catalyse the oxidation of the L-amino acid stereoisomers.
Specificity is an inherent feature of enzymes because catalysis takes
place in a particular region of the enzyme, which is designed to
accommodate the substrates involved in a reaction (Figure 16.1). This
Figure 16.1 Schematic representation of an enzyme active site with amino acid resi-dues (*) located at the active site, binding of substrates and change inenzyme shape after substrates are bound.
457Immobilisation of Enzymes and Cells
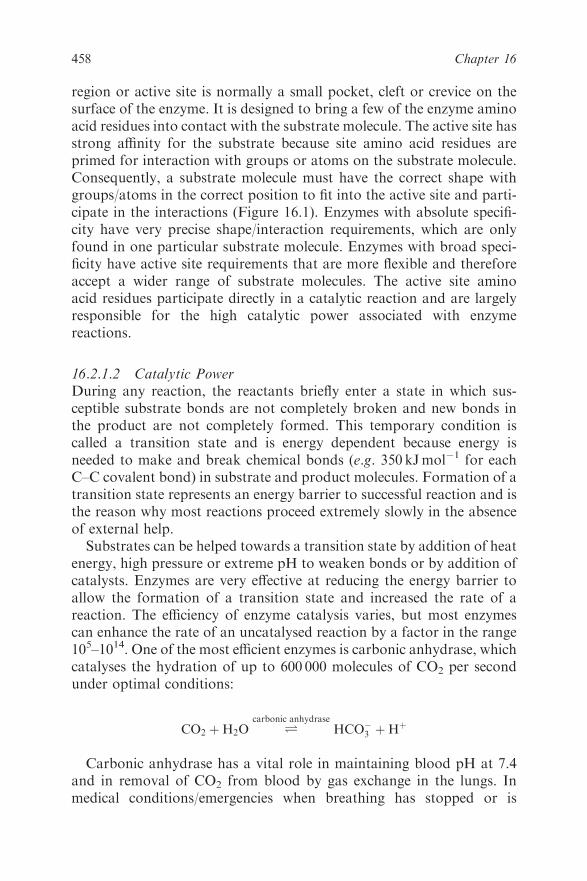
region or active site is normally a small pocket, cleft or crevice on the
surface of the enzyme. It is designed to bring a few of the enzyme amino
acid residues into contact with the substrate molecule. The active site has
strong affinity for the substrate because site amino acid residues are
primed for interaction with groups or atoms on the substrate molecule.
Consequently, a substrate molecule must have the correct shape with
groups/atoms in the correct position to fit into the active site and parti-
cipate in the interactions (Figure 16.1). Enzymes with absolute specifi-
city have very precise shape/interaction requirements, which are only
found in one particular substrate molecule. Enzymes with broad speci-
ficity have active site requirements that are more flexible and therefore
accept a wider range of substrate molecules. The active site amino
acid residues participate directly in a catalytic reaction and are largely
responsible for the high catalytic power associated with enzyme
reactions.
16.2.1.2 Catalytic Power
During any reaction, the reactants briefly enter a state in which sus-
ceptible substrate bonds are not completely broken and new bonds in
the product are not completely formed. This temporary condition is
called a transition state and is energy dependent because energy is
needed to make and break chemical bonds (e.g. 350 kJmol�1 for each
C–C covalent bond) in substrate and product molecules. Formation of a
transition state represents an energy barrier to successful reaction and is
the reason why most reactions proceed extremely slowly in the absence
of external help.
Substrates can be helped towards a transition state by addition of heat
energy, high pressure or extreme pH to weaken bonds or by addition of
catalysts. Enzymes are very effective at reducing the energy barrier to
allow the formation of a transition state and increased the rate of a
reaction. The efficiency of enzyme catalysis varies, but most enzymes
can enhance the rate of an uncatalysed reaction by a factor in the range
105–1014. One of the most efficient enzymes is carbonic anhydrase, which
catalyses the hydration of up to 600 000 molecules of CO2 per second
under optimal conditions:
CO2 þH2O Ðcarbonic anhydrase
HCO�
3 þHþ
Carbonic anhydrase has a vital role in maintaining blood pH at 7.4
and in removal of CO2 from blood by gas exchange in the lungs. In
medical conditions/emergencies when breathing has stopped or is
458 Chapter 16
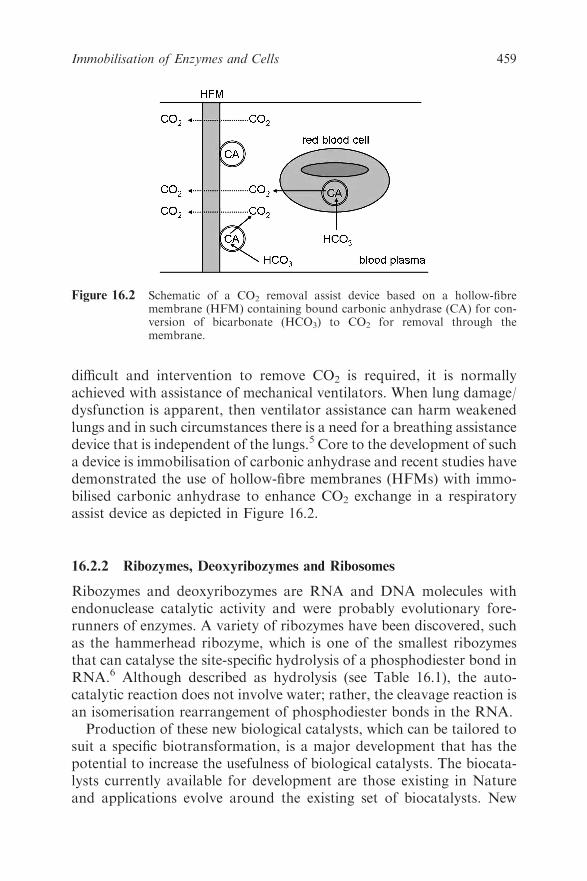
difficult and intervention to remove CO2 is required, it is normally
achieved with assistance of mechanical ventilators. When lung damage/
dysfunction is apparent, then ventilator assistance can harm weakened
lungs and in such circumstances there is a need for a breathing assistance
device that is independent of the lungs.5 Core to the development of such
a device is immobilisation of carbonic anhydrase and recent studies have
demonstrated the use of hollow-fibre membranes (HFMs) with immo-
bilised carbonic anhydrase to enhance CO2 exchange in a respiratory
assist device as depicted in Figure 16.2.
16.2.2 Ribozymes, Deoxyribozymes and Ribosomes
Ribozymes and deoxyribozymes are RNA and DNA molecules with
endonuclease catalytic activity and were probably evolutionary fore-
runners of enzymes. A variety of ribozymes have been discovered, such
as the hammerhead ribozyme, which is one of the smallest ribozymes
that can catalyse the site-specific hydrolysis of a phosphodiester bond in
RNA.6 Although described as hydrolysis (see Table 16.1), the auto-
catalytic reaction does not involve water; rather, the cleavage reaction is
an isomerisation rearrangement of phosphodiester bonds in the RNA.
Production of these new biological catalysts, which can be tailored to
suit a specific biotransformation, is a major development that has the
potential to increase the usefulness of biological catalysts. The biocata-
lysts currently available for development are those existing in Nature
and applications evolve around the existing set of biocatalysts. New
Figure 16.2 Schematic of a CO2 removal assist device based on a hollow-fibremembrane (HFM) containing bound carbonic anhydrase (CA) for con-version of bicarbonate (HCO3) to CO2 for removal through themembrane.
459Immobilisation of Enzymes and Cells

applications will be possible if bespoke biocatalysts can be designed to
suit an application. Ribozymes have attracted great attention because
comparative studies of the properties of enzymes and ribozymes can
provide new fundamental information on the chemical/physical princi-
ples of biological catalysis.6 Ribozymes also recognise their target sub-
strate (RNA) in a highly sequence-specific manner and this degree of
specificity should permit the development of important therapeutic
applications for both inherited and acquired diseases.6 For example,
ribozymes may be used to counteract harmful gene expression by attack-
ing gene products (mRNA) produced by faulty, damaged or uncon-
trolled genes.6 Such targets might be the mRNA produced by oncogenes
(cancer) and viral genomes from human immunodeficiency virus type 1
(HIV-1).
In another area of development, a 49 nucleotide long ribozyme has been
immobilised on an agarose support material and used to catalyse forma-
tion of C–C bonds in a Diels–Alder reaction, which is one of the most
important C–C bond formation reactions used by organic chemists.7 An
important point with this development is that a number of limitations
imposed by protein-based enzymes that catalyse these reactions can be
overcome using a ribozyme.7
Ribosomes have been known for a long time as the structures in cells
that are responsible for protein synthesis. Recent studies on bacterial
ribosomes have revealed that the active site of a ribosome where the
peptide bond is formed between two amino acids is composed of RNA.
Thus although a ribosome is a complex multi-component ribonucleotide
and protein structure; it has a ribozyme at its core active site.8
16.2.3 Splicesomes
In the late 1970s, it was found that eukaryotic genes are transcribed into
mRNA sequences that contain conserved coding sequences (exons) and
non-conserved non-coding sequences (introns). Given the notion of a
chromosome as a single long length of DNA then a process of alternative
splicing allows for coding sequences to be copied out from various places
in a chromosome and spliced together to form different coding sequences
of mRNA that generate proteins with specific characteristics.9 This
mechanism has provided evolution with a capacity for genetic diversity, to
produce families of enzymes by varying the splicing process, and a capacity
to produce many more copies of functional protein than would be possible
if one gene coding sequence was totally responsible for only one protein.
The splicesome is a multi-component ribonucleotide protein structure
that catalyses the excision of intron non-coding sequences from
460 Chapter 16
transcribed immature lengths of mRNA.9 Further understanding of the
role and properties of the splicesome will have a great impact on genetic
engineering and construction of new and novel enzymes. The enzymes in
the biotechnologist’s current toolkit are those that evolution has shaped
and refined to meet its needs over countless millennia. It may be that
there are earlier constructs that were tried and discarded or new ones
that have not yet been tested and that these can be produced using
mechanisms employed by a splicesome. It is also apparent from studies
on the effects of mutations that errors in the splicing process can result in
disease. A mutation responsible for mental retardation associated with
lactic acidosis (Leigh’s syndrome) was found to cause binding of a
human splicing regulatory factor that then caused retention rather than
excision of intron sequences in the coding sequence for a subunit of the
enzyme pyruvate dehydrogenase.9 A fuller understanding of splicesome
mechanisms will help to guide therapeutic solutions for diseases caused
by malfunction of splicesome activity.
16.2.4 Abzymes
Antibodies are proteins and, like enzyme and receptor proteins, they
have binding domains (regions) where they bind other molecules.
Antibodies bind molecules called antigens and can bind small molecules
(haptens) or small parts (determinants) of high molecular weight anti-
gens, which may be attached to cells. Catalytic antibodies or abzymes
are an additional class of biocatalyst because they have distinct catalytic
properties.10 They catalyse several reactions, including hydrolysis,
cyclisation reactions, elimination reactions and synthesis.
Comparative studies between enzymes and abzymes indicate that
enzymes have varying levels of specificity built into their structure,
whereas antibodies have much greater recognition qualities. It seems likely
that enzymes and antibodies are ‘molecular cousins’ that evolved from a
common ancestor with catalytic and recognition properties. Enzymes
probably evolved to concentrate on catalysis and their recognition prop-
erty adapted to provide specificity. Antibodies evolved the recognition
property to a very high degree and retained useful elements of catalysis.
Comparison of the properties of enzymes and abzymes will provide new
understanding of the selectivity process inherent in enzyme specificity,10
Abzymes could have exciting applications in many areas of bio-
technology, medicine, analytical biochemistry and molecular biology.11
In particular, enzyme specificity is limited to that already provided by
Nature and often such limitation restricts the range of possible catalysis.
With protein engineering, it will be possible to alter and improve the
461Immobilisation of Enzymes and Cells
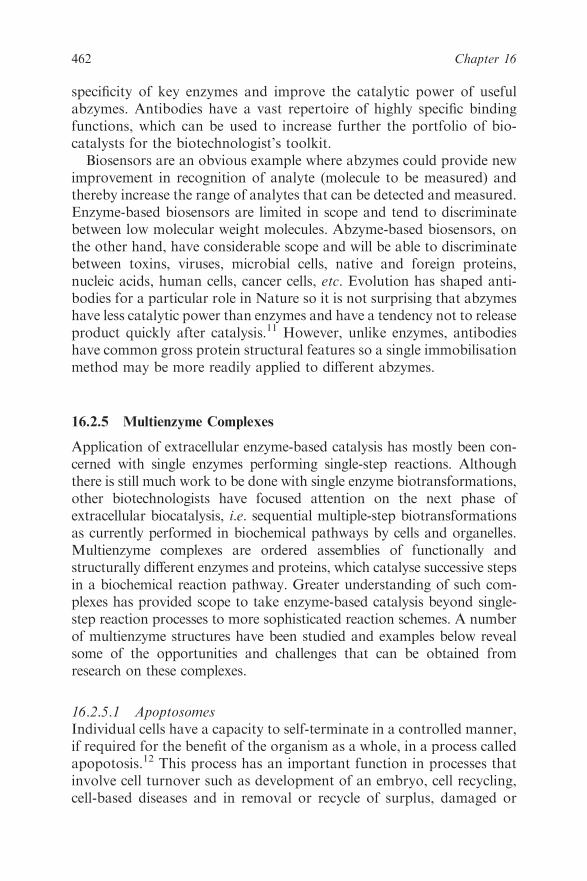
specificity of key enzymes and improve the catalytic power of useful
abzymes. Antibodies have a vast repertoire of highly specific binding
functions, which can be used to increase further the portfolio of bio-
catalysts for the biotechnologist’s toolkit.
Biosensors are an obvious example where abzymes could provide new
improvement in recognition of analyte (molecule to be measured) and
thereby increase the range of analytes that can be detected and measured.
Enzyme-based biosensors are limited in scope and tend to discriminate
between low molecular weight molecules. Abzyme-based biosensors, on
the other hand, have considerable scope and will be able to discriminate
between toxins, viruses, microbial cells, native and foreign proteins,
nucleic acids, human cells, cancer cells, etc. Evolution has shaped anti-
bodies for a particular role in Nature so it is not surprising that abzymes
have less catalytic power than enzymes and have a tendency not to release
product quickly after catalysis.11 However, unlike enzymes, antibodies
have common gross protein structural features so a single immobilisation
method may be more readily applied to different abzymes.
16.2.5 Multienzyme Complexes
Application of extracellular enzyme-based catalysis has mostly been con-
cerned with single enzymes performing single-step reactions. Although
there is still much work to be done with single enzyme biotransformations,
other biotechnologists have focused attention on the next phase of
extracellular biocatalysis, i.e. sequential multiple-step biotransformations
as currently performed in biochemical pathways by cells and organelles.
Multienzyme complexes are ordered assemblies of functionally and
structurally different enzymes and proteins, which catalyse successive steps
in a biochemical reaction pathway. Greater understanding of such com-
plexes has provided scope to take enzyme-based catalysis beyond single-
step reaction processes to more sophisticated reaction schemes. A number
of multienzyme structures have been studied and examples below reveal
some of the opportunities and challenges that can be obtained from
research on these complexes.
16.2.5.1 Apoptosomes
Individual cells have a capacity to self-terminate in a controlled manner,
if required for the benefit of the organism as a whole, in a process called
apopotosis.12 This process has an important function in processes that
involve cell turnover such as development of an embryo, cell recycling,
cell-based diseases and in removal or recycle of surplus, damaged or
462 Chapter 16
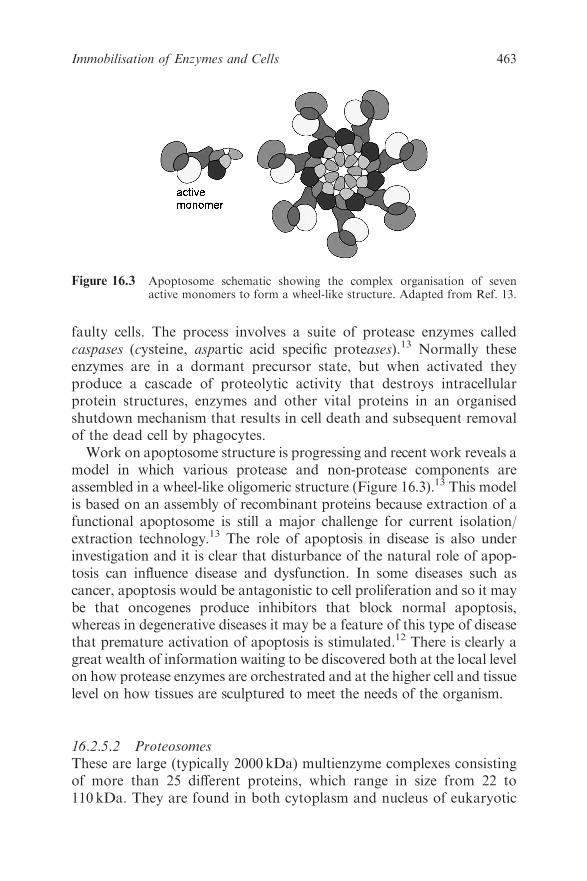
faulty cells. The process involves a suite of protease enzymes called
caspases (cysteine, aspartic acid specific proteases).13 Normally these
enzymes are in a dormant precursor state, but when activated they
produce a cascade of proteolytic activity that destroys intracellular
protein structures, enzymes and other vital proteins in an organised
shutdown mechanism that results in cell death and subsequent removal
of the dead cell by phagocytes.
Work on apoptosome structure is progressing and recent work reveals a
model in which various protease and non-protease components are
assembled in a wheel-like oligomeric structure (Figure 16.3).13 This model
is based on an assembly of recombinant proteins because extraction of a
functional apoptosome is still a major challenge for current isolation/
extraction technology.13 The role of apoptosis in disease is also under
investigation and it is clear that disturbance of the natural role of apop-
tosis can influence disease and dysfunction. In some diseases such as
cancer, apoptosis would be antagonistic to cell proliferation and so it may
be that oncogenes produce inhibitors that block normal apoptosis,
whereas in degenerative diseases it may be a feature of this type of disease
that premature activation of apoptosis is stimulated.12 There is clearly a
great wealth of information waiting to be discovered both at the local level
on how protease enzymes are orchestrated and at the higher cell and tissue
level on how tissues are sculptured to meet the needs of the organism.
16.2.5.2 Proteosomes
These are large (typically 2000 kDa) multienzyme complexes consisting
of more than 25 different proteins, which range in size from 22 to
110 kDa. They are found in both cytoplasm and nucleus of eukaryotic
Figure 16.3 Apoptosome schematic showing the complex organisation of sevenactive monomers to form a wheel-like structure. Adapted from Ref. 13.
463Immobilisation of Enzymes and Cells
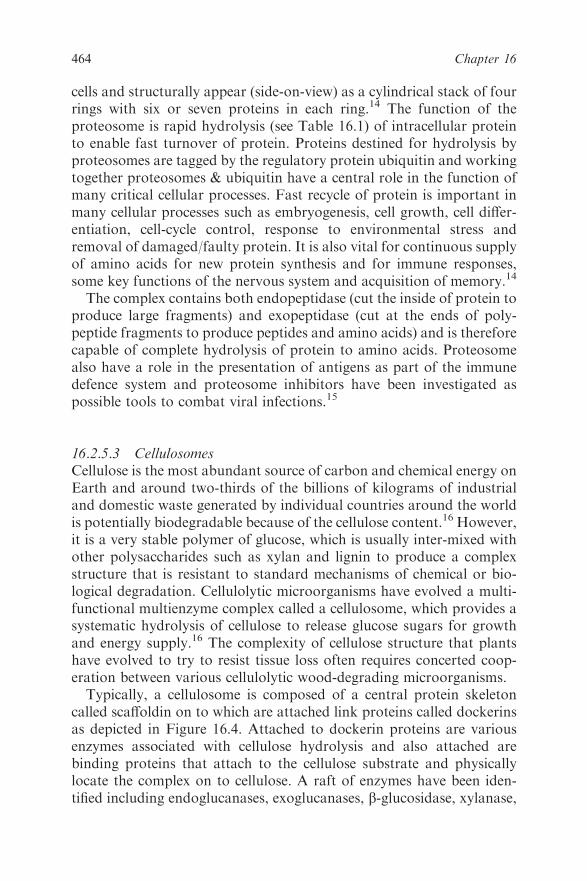
cells and structurally appear (side-on-view) as a cylindrical stack of four
rings with six or seven proteins in each ring.14 The function of the
proteosome is rapid hydrolysis (see Table 16.1) of intracellular protein
to enable fast turnover of protein. Proteins destined for hydrolysis by
proteosomes are tagged by the regulatory protein ubiquitin and working
together proteosomes & ubiquitin have a central role in the function of
many critical cellular processes. Fast recycle of protein is important in
many cellular processes such as embryogenesis, cell growth, cell differ-
entiation, cell-cycle control, response to environmental stress and
removal of damaged/faulty protein. It is also vital for continuous supply
of amino acids for new protein synthesis and for immune responses,
some key functions of the nervous system and acquisition of memory.14
The complex contains both endopeptidase (cut the inside of protein to
produce large fragments) and exopeptidase (cut at the ends of poly-
peptide fragments to produce peptides and amino acids) and is therefore
capable of complete hydrolysis of protein to amino acids. Proteosome
also have a role in the presentation of antigens as part of the immune
defence system and proteosome inhibitors have been investigated as
possible tools to combat viral infections.15
16.2.5.3 Cellulosomes
Cellulose is the most abundant source of carbon and chemical energy on
Earth and around two-thirds of the billions of kilograms of industrial
and domestic waste generated by individual countries around the world
is potentially biodegradable because of the cellulose content.16 However,
it is a very stable polymer of glucose, which is usually inter-mixed with
other polysaccharides such as xylan and lignin to produce a complex
structure that is resistant to standard mechanisms of chemical or bio-
logical degradation. Cellulolytic microorganisms have evolved a multi-
functional multienzyme complex called a cellulosome, which provides a
systematic hydrolysis of cellulose to release glucose sugars for growth
and energy supply.16 The complexity of cellulose structure that plants
have evolved to try to resist tissue loss often requires concerted coop-
eration between various cellulolytic wood-degrading microorganisms.
Typically, a cellulosome is composed of a central protein skeleton
called scaffoldin on to which are attached link proteins called dockerins
as depicted in Figure 16.4. Attached to dockerin proteins are various
enzymes associated with cellulose hydrolysis and also attached are
binding proteins that attach to the cellulose substrate and physically
locate the complex on to cellulose. A raft of enzymes have been iden-
tified including endoglucanases, exoglucanases, b-glucosidase, xylanase,
464 Chapter 16
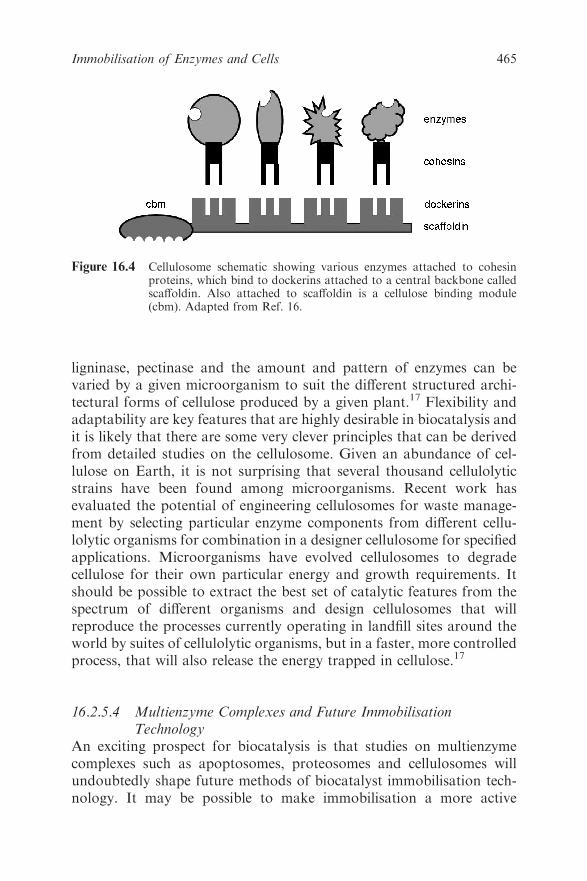
ligninase, pectinase and the amount and pattern of enzymes can be
varied by a given microorganism to suit the different structured archi-
tectural forms of cellulose produced by a given plant.17 Flexibility and
adaptability are key features that are highly desirable in biocatalysis and
it is likely that there are some very clever principles that can be derived
from detailed studies on the cellulosome. Given an abundance of cel-
lulose on Earth, it is not surprising that several thousand cellulolytic
strains have been found among microorganisms. Recent work has
evaluated the potential of engineering cellulosomes for waste manage-
ment by selecting particular enzyme components from different cellu-
lolytic organisms for combination in a designer cellulosome for specified
applications. Microorganisms have evolved cellulosomes to degrade
cellulose for their own particular energy and growth requirements. It
should be possible to extract the best set of catalytic features from the
spectrum of different organisms and design cellulosomes that will
reproduce the processes currently operating in landfill sites around the
world by suites of cellulolytic organisms, but in a faster, more controlled
process, that will also release the energy trapped in cellulose.17
16.2.5.4 Multienzyme Complexes and Future Immobilisation
Technology
An exciting prospect for biocatalysis is that studies on multienzyme
complexes such as apoptosomes, proteosomes and cellulosomes will
undoubtedly shape future methods of biocatalyst immobilisation tech-
nology. It may be possible to make immobilisation a more active
Figure 16.4 Cellulosome schematic showing various enzymes attached to cohesinproteins, which bind to dockerins attached to a central backbone calledscaffoldin. Also attached to scaffoldin is a cellulose binding module(cbm). Adapted from Ref. 16.
465Immobilisation of Enzymes and Cells
participant in biotransformation reactions by introducing specificity to
support materials via immobilised specific binding domains that
improve accurate binding of particular substrate materials so increasing
substrate specificity and catalytic power. It will be possible to mimic
the cellulosome and immobilise an array of specific enzymes and regu-
latory proteins together for sophisticated multi-step biotransformations
(Figure 16.4).
The future will provide one modular universal support material on to
which can be attached any number of binding, regulatory and catalytic
protein modules that are required for a given biotransformation. In the
future, successful development of these systems will allow the produc-
tion of cell-free complex processes and will allow more sophisticated
opportunities for enzyme-based biocatalysis such as versatile fuel cells,
recycling of complex waste materials, multianalyte analytical biosensors
and cell-free biosynthesis of biopolymers such as proteins and carbo-
hydrates. A development that will support this approach to biocatalysis
is nanobiotechnology18 and the availability of highly defined nano-
particles (see Section 16.3.1.1).
16.2.6 Cells
Cells are a different class of biocatalyst in that they contain considerable
arrays of molecular biocatalysts (such as enzymes), which they harness
in sequential step reactions to catalyse extensive biotransformations (e.g.
glucose-CO2+H2O). Therefore, the range and scale of biocatalysis
within a particular cell is vastly greater than that of particular extra-
cellular enzymes, ribozymes, etc. Cell-based biocatalysis can be achieved
with animal, plant and microbial sources. Cell-based systems are par-
ticularly valuable for multiple-step reactions and reactions that involve
complex energy transduction such as ATP hydrolysis.19 At first sight it
may seem that the need for extracellular enzymes is questionable.
However, cells are living organisms and their priority is life support,
rather than completion of a biotransformation required by a bio-
technologist. Consequently, biochemical resources and energy are used
by cells for growth and so cells are not efficient biocatalysts for many
simple biotransformations.20 Sometimes cells need to be ‘tricked’ into
switching on a metabolic pathway, which is dormant because the cells
have no need for it, when the biotechnologist has a need for the pathway
to complete a biotransformation. Cells are important biocatalysts for
complex and multistep reactions and the merits of various cells as bio-
catalysts are discussed briefly below.
466 Chapter 16

16.2.6.1 Animal Cells
Commercial applications for animal cells are increasing and they are
now routinely used for expression of proteins from recombinant DNA.
They are also used as hosts for attenuated strains of important viruses in
the production of vaccines for foot-and-mouth disease, polio, rabies,
measles and rubella, etc.21
A particularly important catalytic biotransformation of animal cells is
post-translational modification of commercial proteins. Many key
proteins receive biochemical modification after biosynthesis (translation
of mRNA to protein) and such modifications are essential for proper
functioning of a mature protein.22 Bacterial cells can be used to express
commercial human proteins, but bacteria cannot complete the post-
translational modifications needed to make a protein fully functional.
Post-translational modifications include glycosylation (adding sugar
residues), formation of disulfide bridges, amidation, carboxylation or
phosphorylation of amino acid residues and highly specific protease-
based cutting of a protein chain to produce a particular protein shape.23
However, animal cells are fragile, have special growth requirements,
have low product yields and are susceptible to infection by bacteria and
viruses. Animal cell culture is therefore comparatively expensive and
normally reserved for high-value medical products.
16.2.6.2 Plant Cells
In addition to crops, many plants produce compounds that have commer-
cial value. Over three-quarters of the 32 000+ known natural products are
derived from plants.24 These include medicines and drugs such as atropine,
morphine and digoxin, essential oils and fragrances such as menthol,
strawberry, vanilla and camphor, pigments such as anthocyanin, beta-
cyanin and saffron, and speciality products such as enzymes, fungicides,
pesticides, peptides, vitamins and pigments.25 Perhaps the most notorious
plant products are narcotics such as opium, cocaine and morphine.
Greater development of plant biocatalysis has been slow due to the
disadvantages associated with whole plant cultivation, such as weather
requirements, low product yield, geographical complications, pesticide/
herbicide requirements and expensive extraction processes. A particular
problem relates to plant vacuoles that accumulate waste products.
During cell disruption to release plant protein products, waste materials
are also released that contaminate the product and often cause disrup-
tion/inactivation of the final protein product.26
Advances in plant genetic engineering will enable a whole range of
products, which were previously difficult to obtain from plants, to be
467Immobilisation of Enzymes and Cells
produced in quantity from domesticated crop plants. Transgenic plants
are beginning to compete with microbial cell systems for bulk produc-
tion of biomolecules. Other improvements in plant cell tissue culture
have permitted processes that provide a suitable alternative to whole
plant cultivation for speciality low-volume products.27
16.2.6.3 Microorganisms (Bacteria, Yeast and Filamentous Fungi)
Microorganisms are without question the most versatile and adaptable
forms of life and this ability has enabled them to survive on this planet
for over 3 billion years. A key feature in this remarkable success is an
immense capacity that microorganisms have for biocatalysis. We have
made extensive use of the biocatalytic properties of microorganisms in
production of beverages and foodstuffs, and this is a common factor
shared by all communities in the world.
Advances in microbiological sciences over the past 70 years have
revealed an enormous biocatalytic potential inherent in microorganisms
and this has stimulated new contributions to medicine, agriculture,
waste (water and hazardous) management and animal feed. It is clear
that microorganisms have considerably more potential for bio-
transformation of a wide range of organic and biochemicals and current
opinion suggests that less than 3% of the total range of microorganisms
on Earth have been thoroughly characterised in terms of biocatalytic
potential. As biocatalysts, some microorganisms are producers of
organic material (autotrophs), whereas some are consumers of organic
material (heterotrophs), and although bacteria are prokaryotic (i.e. they
lack nuclear membrane, mitochondria, endoplasmic reticulum, Golgi
apparatus and lysosomes) they possess sophisticated and flexible cata-
lytic systems for both biosynthesis and biodegradation. Although easier
to cultivate than animal or plant cells, they are not without some
drawbacks as biocatalysts. A critical concern is safety and assurance
that products are free from residual bacterial/fungal toxins/cells.
16.2.7 Biocatalyst Selection
The choice of catalyst for a particular biotransformation will be influ-
enced by a number of factors, but three are fundamental.2 The first is the
availability of biocatalysts, and this may range from pure enzyme,
partially purified enzyme, crude enzyme preparation, cell/organelle
extract, dead whole cells, to living whole cells, which may be growing or
resting cultures. The next factor is a suitable bioreactor together with
optimum configuration and operating conditions for efficient biocata-
lysis. Many configurations are available and these considerations are
468 Chapter 16

influenced by biocatalyst characteristics, substrate properties and
requirements of the finished product. The third key factor is the need or
not for the additional features provided by immobilisation, and this will
depend on choices made for the first two factors.2
16.3 IMMOBILISATION
In a solution, biocatalysts behave as any other solute in that they are
readily dispersed in solution or solvent and have complete freedom of
movement in solution (Figure 16.5). Immobilisation may be viewed as a
procedure specifically designed to limit freedom of movement of a
biocatalyst. Immobilisation normally involves attachment of biocatalyst
to or location within, an insoluble support material.3 In effect, a bio-
catalyst is separated from the bulk of the solution to create a hetero-
geneous two-phase system (Figure 16.5). Immobilisation provides three
basic advantages over soluble-based systems:
� repeated use of the biocatalyst in batch reactions;
� simple separation of biocatalyst from product after reaction;
� continuous use of a biocatalyst in a suitable reactor system.
An immobilised biocatalyst is easily recovered after a batch reaction
and this facility allows repeated use of the biocatalyst in a fresh batch.
Figure 16.5 Diagram showing how immobilisation separates a biocatalyst from thebulk solution phase to produce a heterogeneous two-phase mixture.
469Immobilisation of Enzymes and Cells
This advantage can improve the commercial viability of a reaction pro-
cess that was previously too expensive in terms of biocatalyst costs.
Removal of biocatalyst from a product solution after reaction is com-
plete means that the final product is not contaminated with biocatalyst
and fewer expensive extraction procedures are required in finishing steps.
Immobilisation of a biocatalyst will increase the options for bioreactor
selection. An immobilised biocatalyst can be incorporated into cylind-
rical flow-through columns or other devices to produce continuous
bioreactors in which a continuous flow of substrate enters at one end of
the bioreactor and a continuous flow of product emerges from the other
end.28 Such systems can operate continuously for weeks or months.
Recent expansion of biotechnology and expected developments that
will accrue from advances in genetic technology have stimulated
enthusiasm for immobilisation of biocatalysts.29 Research and devel-
opment work has provided an extensive array of support materials and
methods for biocatalyst immobilisation and much of the new immobi-
lisation may be attributed to specific improvements for given applica-
tions rather than a concerted attempt to build a set of industrial
standards for immobilisation methodology. Consequently, there have
been few detailed and comprehensive comparative studies on immobi-
lisation methods and supports. Therefore, no ideal support material or
method of immobilisation has emerged to provide a standard for a given
type of immobilisation. Some work using functionalised mesoporous
silica with open pores has extended the understanding of enzyme
behaviour in an entrapment model and has contributed to the design of
confining matrices to optimise the catalytic process by developing a
model that accounts for the influence of a matrix environment on
concentration effects, catalytic activity, turnover, structural integrity,
enzyme denaturation/renaturation cycles and solvent effects.
Selection of support material and method of immobilisation is made
by weighing the various characteristics and required features of a bio-
catalyst application against the properties/limitations/characteristics of
a combined immobilisation/support (Figure 16.6). A number of prac-
tical aspects should be considered before embarking on experimental
work to ensure that the final immobilised biocatalyst is fit for a planned
application and will operate with optimum effectiveness.30
16.3.1 Choice of Support Material
A decision on type of support material for immobilisation will require
careful evaluation of the proposed use of the biocatalyst and char-
acteristics of the intended application.31 Virtually any inorganic, organic
470 Chapter 16
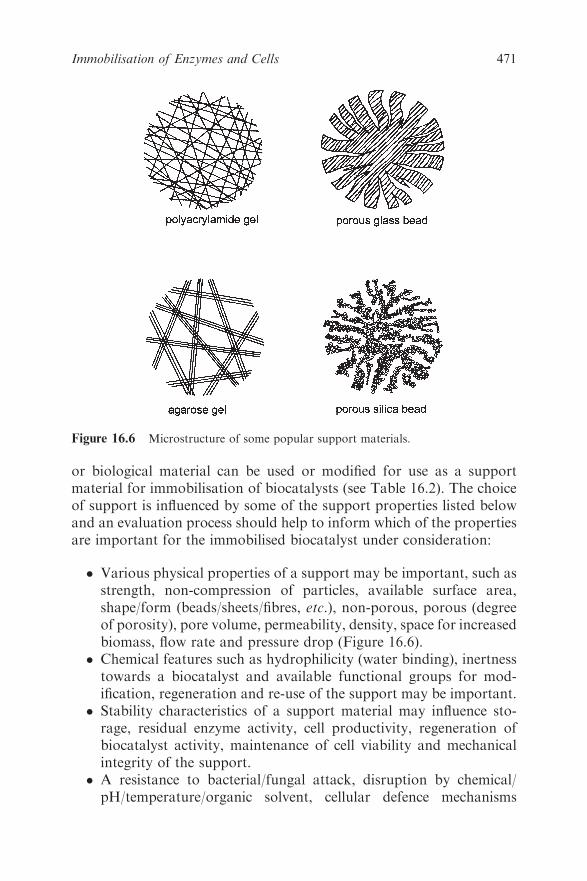
or biological material can be used or modified for use as a support
material for immobilisation of biocatalysts (see Table 16.2). The choice
of support is influenced by some of the support properties listed below
and an evaluation process should help to inform which of the properties
are important for the immobilised biocatalyst under consideration:
� Various physical properties of a support may be important, such as
strength, non-compression of particles, available surface area,
shape/form (beads/sheets/fibres, etc.), non-porous, porous (degree
of porosity), pore volume, permeability, density, space for increased
biomass, flow rate and pressure drop (Figure 16.6).
� Chemical features such as hydrophilicity (water binding), inertness
towards a biocatalyst and available functional groups for mod-
ification, regeneration and re-use of the support may be important.
� Stability characteristics of a support material may influence sto-
rage, residual enzyme activity, cell productivity, regeneration of
biocatalyst activity, maintenance of cell viability and mechanical
integrity of the support.
� A resistance to bacterial/fungal attack, disruption by chemical/
pH/temperature/organic solvent, cellular defence mechanisms
Figure 16.6 Microstructure of some popular support materials.
471Immobilisation of Enzymes and Cells

(antibodies/killer cells) may be required if a biocatalyst is to operate
in a harsh or challenging environment.
� Operational safety considerations such as biocompatibility
(immune response), toxicity of component or residual chemical
reagents may be important if a support will come into direct or
indirect contact with food, biological fluids, etc.
� There may be health and safety concerns with a support itself or sup-
port modification procedures and these may be important for process
workers and end product users, and an immobilised biocatalyst may
be subject to GRAS (generally recognised as safe) requirements for
FDA approval (for food/pharmaceutical/medical applications).
� Key economic concerns may be raised concerning the availability
and cost of the support material and/or chemicals, special equip-
ment/reagents, technical skill required, environmental impact,
industrial-scale chemical preparation, feasibility for scale-up, con-
tinuous processing, effective working life, reusable support and
contamination (enzyme/cell-free product).
� Overall reaction characteristics influenced by a support will include
flow rate, enzyme/cell loading, catalytic productivity, reaction
kinetics, side reactions, multiple enzyme and or cell systems, batch
or continuous operation system, reactor type and diffusion limita-
tions on mass transfer of cofactors/substrates/products.
16.3.1.1 Nanotechnology and Nanoparticle Support Materials
The microelectronics industry and the biosensor industry have both
sought greater levels of miniaturisation in their respective technology
Table 16.2 Some support materials for biocatalyst immobilisation.
Inorganic Organic Biological Nanoparticles
Aluminium oxide Polyethylene Cellulose Gold nanoparticlesNickel oxide Polystyrene Dextran Quantum dotsStainless steel Polyacrylate Agarose NanobodiesPorous glass Nylon Starch LiponanoparticlesPorous silica Polyacrylamide Alginate NanofibresFused silica Polymethacrylate Carrageenan Nanoporous silicaDiatomaceous earth Polypyrrole Chitin NanoprismsIron oxide Polyaniline Bone NanotubesTitanium oxide Polyphenol Chitosan NanoparticlesPumice stone Polyester Collagen, gelatinZirconium oxide Poly(vinyl alcohol) LiposomeSilicon dioxide PTFE Cells (yeast)Activated carbon
472 Chapter 16
development and both have now reached a scale where it is possible to
work together to produce new products.31,32 Engineers have shrunk the
dimensions of microfabricated structures to provide faster high-density
electronic chips for the electronics industry. Biotechnologists have
reduced the volumes required in analytical devices from millilitre to
microlitre and nanolitre levels. A convergence can now take place that
will allow each sector to take advantage of the unique benefits and
technology that each side has developed and create new innovation in
the area of nanobiotechnology.33 Biological materials offer impressive
molecular recognition and self-assembly capacity and can be immobi-
lised on non-biological electro/mechanical components to produce new
hybrid systems. New research is seeking to use the natural self-assembly
characteristics of some biological molecules to assist microfabrication of
nanowires for production of two- and three-dimensional nanocircuits
for electronics development. A notable benefit of biological intervention
in microfabrication is that biological materials allow a greater range of
assembly options that can enhance traditional photolithography meth-
ods for production of electronic circuits.33
Innovation in molecular detection has a focus on moving towards
highly multiplexed molecular recognition systems using preconfigured
arrays and departing from arrays with fixed recognition sites printed on
solid surfaces. This requires new methods of registering and quantifying
a specific binding event through electrochemical and/or electronic events
and nanotechnology will be instrumental in delivering this objective.33
The incorporation of biological components into microelectromecha-
nical systems (MEMS) and implantable devices is achievable, but must
be built with biocompatible materials or coated with biocompatible
materials.34
Immobilisation methods and materials have moved into a new phase
to benefit from the opportunities provided by nanotechnology. New
support materials such as polymeric microspheres (nanoparticles) have
been produced with size ranges from 50 to 10 000 nm and used to
covalently bind enzymes, antibodies and proteins.35 Various nanosized
objects have been produced, including nanotubes, nanochannels,
nanoparticles, nanopores, nanocapacitors, quantum dots, nanorods and
nanoprisms.35 These have increased the range of potential support
materials and support configurations that can be used for immobilisa-
tion. Further indications are that nanoparticles may be engineered to
provide cell-specific delivery of therapeutic agents such as enzymes,
proteins and drugs after injection into the bloodstream.36
Until relatively recently, most enzymes and cells were immobilised on/
in relatively large structures (micrometre to millimetre scale) to ease the
473Immobilisation of Enzymes and Cells

collection, recovery and handling of immobilised enzyme preparations.
New procedures have immobilised biocatalysts to nanoparticles with
diameters on the nanometre scale. Reduction in size of support material
will generally reduce some of the negative support material effects that
limit the effectiveness of a catalytic reaction, particularly in relation to
diffusion of substrates and products to and from an enzyme.37 In
addition, nanoparticles composed of or covered with biocompatible
materials have potential for in vivo delivery of therapeutic systems. For
example, nanoparticles of gold have very low toxicity.
Nanotechnology can provide exciting opportunities for a wide range
of significant developments in biotechnology. However, there is one
obstacle that requires a solution if the opportunities are to be fully
realised and that is energy. Biological systems require and can transduce
very specific chemical energy to drive biological systems. Microelec-
tronic systems require and can transduce electrical energy to drive
microelectromechanical devices. The two are not easily compatible. An
efficient, workable solution that provides a common energy currency to
both systems will provide a foundation for new generations of bio-
microelectromechanical devices. A solution will facilitate production of
a wider range of efficient functional hybrid devices composed of active
biological and active non-biological electronic materials each drawing
energy from a single energy source.
16.3.2 Choice of Immobilisation Procedures
There are five principal methods for immobilisation of biocatalysts:
adsorption, covalent binding, entrapment, encapsulation and cross-
linking (Figure 16.7), and the relative merits of each are discussed below.
16.3.2.1 Adsorption
Immobilisation by adsorption is the simplest method and involves
reversible non-covalent interactions between biocatalyst and support
material (Figure 16.7).38 The forces involved are mostly weak electro-
static such as van der Waals forces and ionic and hydrogen bonding
interactions, although hydrophobic bonding can be significant. These
forces are individually very weak, but sufficiently large in number to
provide good binding. For example, it is known that yeast cells have a
surface chemistry that is substantially negatively charged so that use of a
positively charged support material will allow immobilisation. Existing
surface chemistry on a biocatalyst and on a support is utilised for
adsorption, so no chemical activation or modification of support is
474 Chapter 16
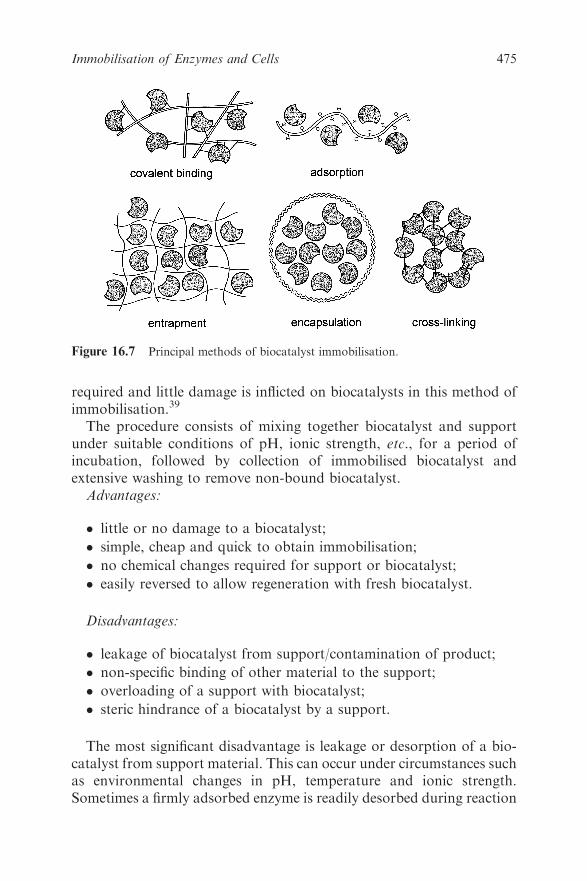
required and little damage is inflicted on biocatalysts in this method of
immobilisation.39
The procedure consists of mixing together biocatalyst and support
under suitable conditions of pH, ionic strength, etc., for a period of
incubation, followed by collection of immobilised biocatalyst and
extensive washing to remove non-bound biocatalyst.
Advantages:
� little or no damage to a biocatalyst;
� simple, cheap and quick to obtain immobilisation;
� no chemical changes required for support or biocatalyst;
� easily reversed to allow regeneration with fresh biocatalyst.
Disadvantages:
� leakage of biocatalyst from support/contamination of product;
� non-specific binding of other material to the support;
� overloading of a support with biocatalyst;
� steric hindrance of a biocatalyst by a support.
The most significant disadvantage is leakage or desorption of a bio-
catalyst from support material. This can occur under circumstances such
as environmental changes in pH, temperature and ionic strength.
Sometimes a firmly adsorbed enzyme is readily desorbed during reaction
Figure 16.7 Principal methods of biocatalyst immobilisation.
475Immobilisation of Enzymes and Cells
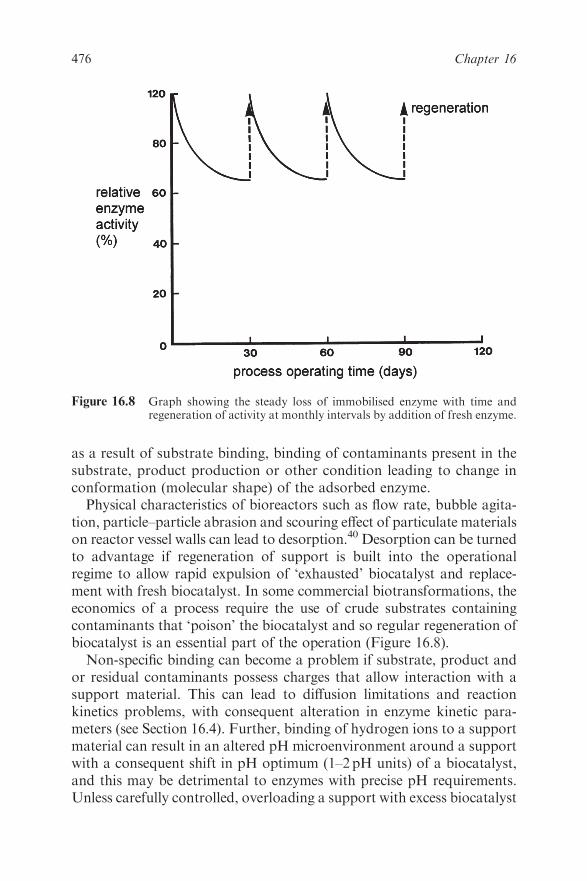
as a result of substrate binding, binding of contaminants present in the
substrate, product production or other condition leading to change in
conformation (molecular shape) of the adsorbed enzyme.
Physical characteristics of bioreactors such as flow rate, bubble agita-
tion, particle–particle abrasion and scouring effect of particulate materials
on reactor vessel walls can lead to desorption.40 Desorption can be turned
to advantage if regeneration of support is built into the operational
regime to allow rapid expulsion of ‘exhausted’ biocatalyst and replace-
ment with fresh biocatalyst. In some commercial biotransformations, the
economics of a process require the use of crude substrates containing
contaminants that ‘poison’ the biocatalyst and so regular regeneration of
biocatalyst is an essential part of the operation (Figure 16.8).
Non-specific binding can become a problem if substrate, product and
or residual contaminants possess charges that allow interaction with a
support material. This can lead to diffusion limitations and reaction
kinetics problems, with consequent alteration in enzyme kinetic para-
meters (see Section 16.4). Further, binding of hydrogen ions to a support
material can result in an altered pH microenvironment around a support
with a consequent shift in pH optimum (1–2pH units) of a biocatalyst,
and this may be detrimental to enzymes with precise pH requirements.
Unless carefully controlled, overloading a support with excess biocatalyst
Figure 16.8 Graph showing the steady loss of immobilised enzyme with time andregeneration of activity at monthly intervals by addition of fresh enzyme.
476 Chapter 16
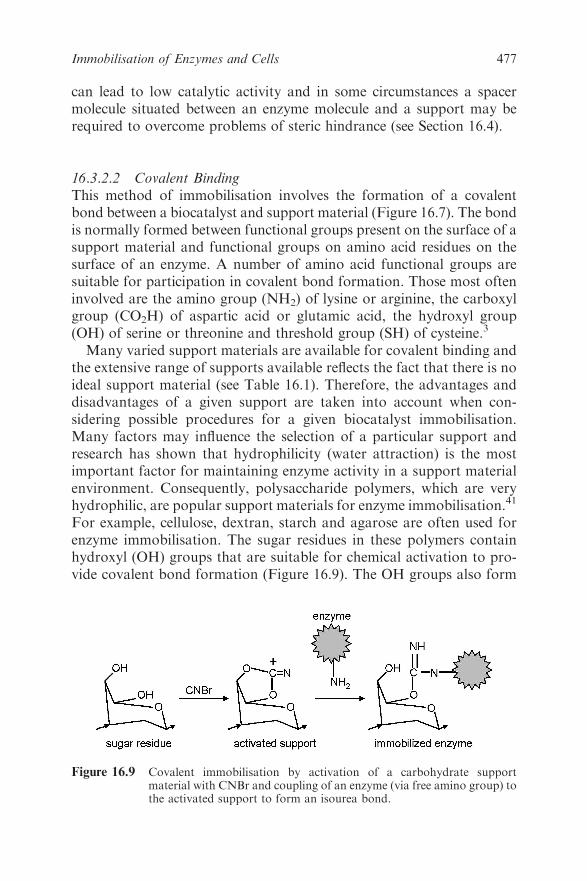
can lead to low catalytic activity and in some circumstances a spacer
molecule situated between an enzyme molecule and a support may be
required to overcome problems of steric hindrance (see Section 16.4).
16.3.2.2 Covalent Binding
This method of immobilisation involves the formation of a covalent
bond between a biocatalyst and support material (Figure 16.7). The bond
is normally formed between functional groups present on the surface of a
support material and functional groups on amino acid residues on the
surface of an enzyme. A number of amino acid functional groups are
suitable for participation in covalent bond formation. Those most often
involved are the amino group (NH2) of lysine or arginine, the carboxyl
group (CO2H) of aspartic acid or glutamic acid, the hydroxyl group
(OH) of serine or threonine and threshold group (SH) of cysteine.3
Many varied support materials are available for covalent binding and
the extensive range of supports available reflects the fact that there is no
ideal support material (see Table 16.1). Therefore, the advantages and
disadvantages of a given support are taken into account when con-
sidering possible procedures for a given biocatalyst immobilisation.
Many factors may influence the selection of a particular support and
research has shown that hydrophilicity (water attraction) is the most
important factor for maintaining enzyme activity in a support material
environment. Consequently, polysaccharide polymers, which are very
hydrophilic, are popular support materials for enzyme immobilisation.41
For example, cellulose, dextran, starch and agarose are often used for
enzyme immobilisation. The sugar residues in these polymers contain
hydroxyl (OH) groups that are suitable for chemical activation to pro-
vide covalent bond formation (Figure 16.9). The OH groups also form
Figure 16.9 Covalent immobilisation by activation of a carbohydrate supportmaterial with CNBr and coupling of an enzyme (via free amino group) tothe activated support to form an isourea bond.
477Immobilisation of Enzymes and Cells

hydrogen bonds with water molecules and thereby create a hydrophilic
environment within a support material.
Polysaccharide supports do have a weakness in that they are sus-
ceptible to microbial/fungal disintegration and organic solvents used in
some reaction processes can cause shrinkage of polysaccharide gels.
Support materials are usually used in bead form (Figure 16.6) and there
are many procedures for coupling an enzyme and a support in a covalent
bond. However, most reactions fall into the following main categories:
� formation of an isourea linkage;
� formation of a diazo linkage;
� formation of a peptide bond;
� an alkylation reaction.
It is important to choose a reaction method that will not inactivate an
enzyme by reacting with amino acid residues at the enzyme active site.
Hence if an enzyme employs a carboxyl group at its active site (see
Figure 16.1) for participation in catalysis, then it is wise to choose a
reaction method that involves amino groups for covalent bond forma-
tion with a support.42 Basically two steps are involved in covalent
binding of enzymes to support materials.
First, functional groups on a support material are activated by a
specific chemical reagent such as cyanogen bromide (CNBr), and sec-
ond, an enzyme is added in a coupling reaction to form a covalent bond
with the activated support material. Normally an activation reaction is
designed to make functional groups on a support strongly electrophilic
(electron deficient). In the coupling reaction, these groups will react with
strong nucleophiles (electron donating), such as the amino (NH2)
functional groups of certain amino acids on the surface of an enzyme, to
form a covalent bond. It is possible to vary the coupling conditions to
allow single-point or multiple-point attachment (see Figure 16.11) and
influence the stability of an immobilised enzyme (see Section 16.4).
In the CNBr method, an enzyme and support are joined via an isourea
linkage. In carbodiimide activation, a support material should have a
carboxyl (CO2H) functional group and an enzyme and support are
joined via a peptide bond. If the support material contains an aromatic
amino functional group, it can be diazotised using nitrous acid. Sub-
sequent addition of enzyme leads to the formation of a diazo linkage
between a reactive diazo group on a support and the ring structure of an
aromatic amino acid such as tyrosine.
It is important to recognise that no method of immobilisation is
restricted to a particular type of support material and that an extremely
478 Chapter 16
large number of permutations are possible between methods of immo-
bilisation and support materials. This is possible by chemical mod-
ification of normal functional groups on a support material to produce a
range of derivatives containing different functional groups. For exam-
ple, the normal functional group in cellulose is the OH of glucose and
chemical modifications of these groups have produced a range of cel-
lulose derivatives such as AE-cellulose (aminoethyl), CM-cellulose
(carboxymethyl) and DEAE-cellulose (diethylaminoethyl). Thus che-
mical modification increases the range of immobilisation methods that
can be used for a given support material.43
16.3.2.3 Entrapment
Immobilisation by entrapment differs from adsorption and covalent
binding in that enzyme molecules are free in solution, but restricted in
movement by the lattice structure of a gel (see Figure 16.6, agarose). The
porosity of a gel lattice is controlled to ensure that the structure is tight
enough to prevent leakage of enzyme or cells and at the same time allow
free movement of substrate and product. Inevitably the support will act
as a barrier to mass transfer and, although this can have serious
implications for reaction kinetics, it can have useful advantages as
harmful cells, proteins and enzymes are prevented from interaction with
the immobilised biocatalyst. There are several methods of entrapment:
� ionotropic gelation with multivalent cations (e.g. alginate);
� temperature-induced gelation (e.g. agarose, gelatin);
� organic polymerisation by chemical/photochemical reaction (e.g.
polyacrylamide);
� precipitation from an immiscible solvent (e.g. polystyrene).
Entrapment can be achieved by mixing an enzyme with a polyionic
polymer material and then cross-linking the polymer with multivalent
cations in an ion-exchange reaction to form a lattice structure that traps
the biocatalyst (ionotropic gelation).44 Temperature change is a simple
method of gelation by phase transition using 1–4% solutions of agarose
or gelatin. However, the gels formed are soft and unstable. A significant
development in this area has been an introduction of k-carrageenan
polymers, which can form gels by ionotropic gelation and by tempera-
ture-induced phase transition, and this has introduced a greater degree
of flexibility in gelation systems for immobilisation.
Alternatively, it is possible to mix an enzyme with chemical monomers
that are then polymerised to form a cross-linked polymeric network,
479Immobilisation of Enzymes and Cells
trapping the enzyme in the interstitial spaces of a lattice (see Figure 16.6,
polyacrylamide). The latter method is more widely used and a number of
acrylic monomers are available for the formation of hydrophilic copo-
lymers. For example, acrylamide monomer is polymerised to form
polyacrylamide and methyl acrylate is polymerised to form poly-
methacrylate. In addition to a monomer, a cross-linking agent is added
during polymerisation to form cross-linkages between polymer chains
and help to create a three-dimensional network lattice. The pore size of a
gel and its mechanical properties are determined by the relative amounts
of monomer and cross-linking agent. It is possible to vary these con-
centrations to influence the porosity of a lattice structure. The polymer
formed may be broken up into particles of a desired size or poly-
merisation can be arranged to form beads of defined size to suit parti-
cular bioreactor requirements. Precipitation occurs by phase separation
rather than by chemical reaction, but does bring a biocatalyst into
contact with a water-miscible organic solvent and most biocatalysts are
not tolerant of such solvents. Hence this method is limited to highly
stable/previously stabilised enzymes or non-living cells.
16.3.2.4 Encapsulation
Encapsulation of enzymes and or cells can be achieved by enveloping
biological components within various forms of semi-permeable mem-
brane (see Figure 16.7). It is similar to entrapment in that enzymes/cells
are free in solution, but restricted in space. Large proteins or enzymes
cannot pass out of or into the capsule, but small substrates and products
can pass freely across the semipermeable membrane. Many materials
have been used to construct microcapsules varying from 10 to 100mm in
diameter and nylon membranes and cellulose nitrate membranes have
proved popular.45
Problems associated with diffusion of substrates in/products out are
more acute and can result in rupture of a membrane if products from a
reaction accumulate rapidly (Figure 16.10). A further problem may arise
if an immobilised biocatalyst particle has a density fairly similar to that
of the bulk solution and therefore ‘floats’ in the solution. This can cause
process problems and may require reassessment of reactor configura-
tion, flow dynamics, etc.
It is also possible to use biological cells as capsules and a notable
example of this is the use of erythrocytes (red blood cells). The mem-
brane of an erythrocyte is normally only permeable to small molecules.
However, when erythrocytes are placed in a hypotonic solution they
swell up and the cell membrane stretches and increases membrane
480 Chapter 16

permeability. In this condition, erythrocyte proteins diffuse out of the
cell and enzymes can diffuse into the cell. Returning swollen erythro-
cytes to an isotonic solution allows the cell membrane to return to
normal and trapped enzymes inside the cell do not leak out. Recent
work has used a filamentous fungus to entrap yeast cells in an arrange-
ment that represents a forced symbiosis with modification of growth
media to supply a particular carbon source that can only be used by the
fungus.46
16.3.2.5 Cross-linking
This type of immobilisation is support free and involves joining cells (or
enzymes) to each other to form a large three-dimensional complex
structure and it can be achieved by chemical or by physical methods (see
Figure 16.7). Chemical methods of cross-linking normally involve
Figure 16.10 Immobilisation in a semipermeable enzyme depicting some of theproblems associated with diffusion of substrate into and product out ofthe structure.
481Immobilisation of Enzymes and Cells

covalent bond formation between proteins or cells by means of a bi- or
multifunctional reagent such as glutaraldehyde and toluene diisocya-
nate.47 However, the toxicity of such reagents is a limiting factor in
applying this method to living cells and many enzymes. Both albumin
and gelatin have been used to provide additional protein molecules as
spacers to minimise the close proximity or crowding problems that can
be caused by cross-linking an enzyme.
Physical cross-linking of cells by flocculation is well known in the
biotechnology industry and does lead to high cell densities. Flocculating
agents such as polyamines, polyethylenimine, polystyrene sulfonates and
various phosphates have been used extensively and are well char-
acterised. Cross-linking is rarely used as the only means of immobili-
sation because absence of mechanical properties and poor stability are
severe limitations. Cross-linking is most often used to enhance other
methods of immobilisation by assisting the reduction of cell or enzyme
leakage in other systems.
A potentially useful development is the production of cross-linked
enzyme crystals (CLECs).48 Production of enzyme crystals has long been
seen as a final step in enzyme purification procedures as it signifies high
purity. The principal use of enzyme crystals per se has been in X-ray
crystallography to study enzyme structures and recent recognition that
some enzyme crystals were catalytically active has led to the develop-
ment of CLECs.
Figure 16.11 Schematic depicting the stages in denaturation of an enzyme and sta-bilisation of an enzyme against protein denaturation by multi-pointattachment to a support material.
482 Chapter 16
Indications are that CLECs have superior stability characteristics and
may enable novel enzyme-catalysed biotransformations to occur in
difficult environments such as in organic solvents, in a gas phase or in
supercritical fluids. Enzyme crystals might be more easily incorporated
into microelectronic devices such as a CHEMFET (chemically sensitive
field effect transistor) and ISFET (ion-selective field effect transistor) to
produce novel ‘bio-chips’ for the next generation of biosensors.
16.4 PROPERTIES OF IMMOBILISED BIOCATALYSTS
When a biocatalyst is immobilised, its fundamental characteristics are
usually changed in one way or another and the change may be a
drawback or an improvement. The nature of the alteration depends on
the inherent properties of the biocatalyst and additional characteristics
imposed by the support material on the biocatalyst, substrate and
product.49 It is very difficult to quantify these properties and char-
acteristics given the diversity of biocatalysts, support materials and
methods of immobilisation. Consequently, it has proved impossible to
predict completely what effect a particular immobilisation will have on
an enzyme or cell or on the reaction that it catalyses, and the only
recourse is to evaluate a number of methods to discover and develop a
system that provides the greatest positive improvement for the appli-
cation under consideration.50
16.4.1 Stability
The two most important properties that may be changed by immobili-
sation are stability and catalytic activity. Stability is defined as an ability
to resist alteration and in the context of biocatalyst stability it is
important to distinguish several different types of stability:
� inactivation by heat;
� disruption by chemicals;
� digestion by proteases or cells;
� inactivation by change in pH;
� loss of catalytic activity during storage;
� loss of catalytic activity due to process operations.
The various types are not necessarily interdependent and an observed
increase in heat stability does not indicate that there will be a corre-
sponding increase in storage stability or operational stability. Although
immobilisation does not guarantee an improvement in stability, it is
483Immobilisation of Enzymes and Cells

generally recognised that it does represent a strategy that can be used as
a means of developing more stable enzyme preparations.51
Generally, it is found that covalent immobilisation is more effective
than the other methods at improving enzyme resistance to heat, che-
mical disruption and pH changes. Disruptants normally induce loss of
catalytic activity by causing a considerable alteration in the protein
structure of an enzyme (Figure 16.11). In particular, disruptants disperse
the many non-covalent bonds responsible for holding the enzyme
polypeptide chain in its highly specific shape or conformation, thus
causing the polypeptide chain to unfold with a consequent loss of active
site structure and catalytic activity. Given that unfolding is associated
with loss of activity, it is probable that multi-point attachment of an
enzyme polypeptide chain to a support material provides extra rigidity
to the folded protein chain and therefore greater resistance to protein
unfolding (Figure 16.11).
16.4.2 Catalytic Activity
Immobilisation almost invariably changes the catalytic activity of an
enzyme, and this is clearly reflected in alterations in the characteristic
kinetic constants of the enzyme-catalysed reaction. In particular, the
maximum reaction velocity (Vmax) obtained with an immobilised
enzyme is usually lower than that obtained with the corresponding
soluble enzyme under the same reaction conditions. The Michaelis
constant (Km), which reflects the affinity that the enzyme has for its
substrate, is usually changed upon immobilisation, indicating that
binding of substrate to the active site has been altered. Four principal
factors influence the catalytic activity of immobilised enzymes: (a)
conformation, (b) steric, (c) micro-environment and (d) diffusion.
The conformation of an enzyme refers to the particular shape adopted
by the polypeptide chain, which is essential for maintaining the active
site structure (see Figure 16.1). Immobilisation procedures that involve
modification or interaction with amino acid residues on the polypeptide
chain can sometimes disturb protein structure and thereby affect the
enzyme activity. Covalent immobilisation is most likely to cause an
alteration in the protein conformation of an enzyme. A steric problem
arises if the enzyme is immobilised in a position that causes the active
site to be less accessible to the substrate molecules. In solution, a free
enzyme molecule is surrounded by a homogeneous micro-environment
in which the enzyme is fully integrated with all components of the
solution.
484 Chapter 16

Immobilisation creates a heterogeneous micro-environment consist-
ing of two phases, i.e. the immobilised enzyme and the bulk of the
solution from which the immobilised enzyme is separated (see Figure
16.5). Therefore, all components of the reaction, substrate, products,
activators, ions, etc., are partitioned between the immobilised enzyme
phase and the bulk solution phase. This feature can significantly alter
the characteristics of an enzyme reaction even if the enzyme molecule
itself is not changed by immobilisation. The support material may
influence the partitioning effect. If the support material attracts sub-
strate then this can improve catalytic activity. Reaction rate is also
reduced by diffusion restriction. As the substrate is consumed, more
substrate must diffuse into the enzyme from the bulk solution and
product must diffuse away from the active site. This is normally a
problem for all forms of immobilised enzymes, but particularly so for
encapsulated enzymes (see Figure 16.10).
Diffusional limitations may be divided into two types, external dif-
fusion restriction and internal diffusion restriction. The external type
refers to a zone or barrier that surrounds the support material, called the
Nernst layer. Substrate molecules can diffuse into this layer by normal
convection and by a passive molecular diffusion. If substrate molecules
pass through this layer slowly, then this may limit the rate of enzyme
reaction. External diffusion restriction can be improved by speeding up
the flow of solvent over and through the immobilised enzyme by
increasing the stirring rate.
Internal diffusion restrictions are due to a diffusion limitation inside
the immobilised enzyme preparation (see Figure 16.10). In this case,
diffusion of substrate molecules occurs by a passive molecular mecha-
nism only, which may be more difficult to overcome if it is a seriously
limiting factor. The overall rate of diffusion is markedly influenced by
the method of immobilisation. Covalent and adsorption procedures
cause less diffusion limitation than do entrapment and encapsulation
procedures.
16.4.3 Coenzyme Regeneration
Around 25% of enzymes are oxidoreductases (see Table 16.1) and they
catalyse many reactions that are of great interest to biotechnologists.
However, most of these enzymes require participation of a coenzyme
such as NAD, NADH, NADP, NADPH or ATP.51 Coenzymes are
chemically changed during reaction and so in effect become an expensive
consumable. Hence efficient regeneration of coenzyme is essential
485Immobilisation of Enzymes and Cells
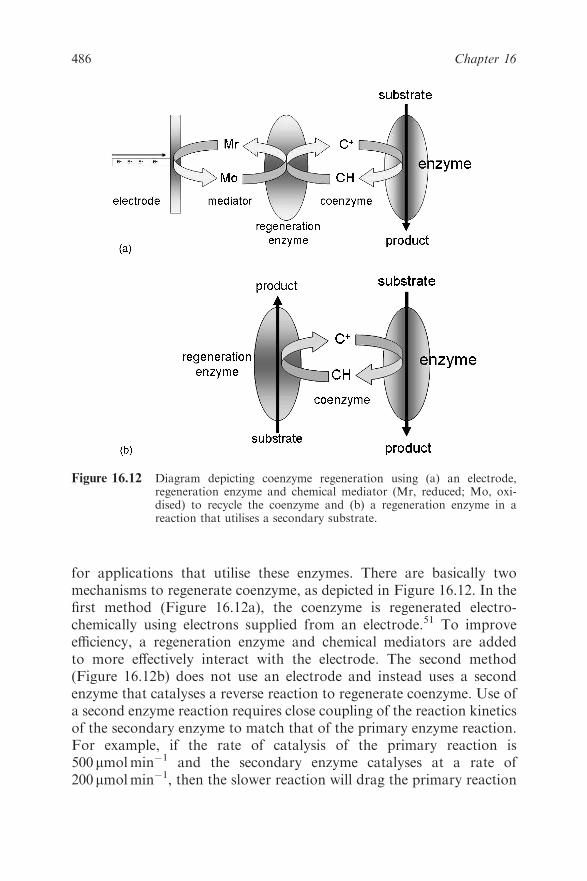
for applications that utilise these enzymes. There are basically two
mechanisms to regenerate coenzyme, as depicted in Figure 16.12. In the
first method (Figure 16.12a), the coenzyme is regenerated electro-
chemically using electrons supplied from an electrode.51 To improve
efficiency, a regeneration enzyme and chemical mediators are added
to more effectively interact with the electrode. The second method
(Figure 16.12b) does not use an electrode and instead uses a second
enzyme that catalyses a reverse reaction to regenerate coenzyme. Use of
a second enzyme reaction requires close coupling of the reaction kinetics
of the secondary enzyme to match that of the primary enzyme reaction.
For example, if the rate of catalysis of the primary reaction is
500mmolmin�1 and the secondary enzyme catalyses at a rate of
200mmolmin�1, then the slower reaction will drag the primary reaction
Figure 16.12 Diagram depicting coenzyme regeneration using (a) an electrode,regeneration enzyme and chemical mediator (Mr, reduced; Mo, oxi-dised) to recycle the coenzyme and (b) a regeneration enzyme in areaction that utilises a secondary substrate.
486 Chapter 16
and lower the efficiency. On the other hand, if the secondary reaction is
too fast (e.g. 2000 mmolmin�1), then there would be inefficient and
uneconomical waste of material. There are enzymes available that have
been adapted for coenzyme regeneration to improve the efficiency of the
process.52
Many attempts have been made to immobilise coenzymes and
enzymes together to try to produce a universal efficient biocatalytic
system with continuous coenzyme regeneration and, although some
systems work well, further innovation is still required to produce a fully
efficient and effective system that will realise the full potential of all the
valuable enzymes that have coenzyme requirements.
16.5 APPLICATIONS
Immobilisation technology is now firmly established53 among the tools
used by biotechnologists to improve the effectiveness of biocatalysts for
biotransformations in industry, analysis and medicine. Consequently,
there are many examples of applications that use immobilised biocata-
lysts and further information can been obtained from reviews and
books. A few examples are given in Table 16.3 to indicate the wide
range. The future for immobilised biocatalysts is promising and exciting
developments in this field will support the expected expansion and
progress of biotechnology in various industries and medicine in the 21st
century. Advances in nanotechnology have provided engineering tools
to facilitate the development of enzyme-immobilised microchannel
reactors that utilise microlitre and nanolitre fluidic systems for enzyme
reactions.53
Material engineers have produced highly defined nanoparticles that
enable immobilised enzymes to be situated in defined fluidic micro-
channels for microscale reaction processes. Advances in the under-
standing and application of microfluidics will increase the scope for
microscale reactions that have many advantages including substantial
reduction of mass transfer effects and high enzyme loading.37,54 How-
ever, the debate surrounding the impact of bio-nanotechnology on
society has started and, in the light of public understanding and reac-
tion to genetically modified (GM) food, it is likely that biotechnologists
will have an important role to play in ensuring that applications and
impacts associated with environmental and health issues have a stronger
profile in general discussions of the impact of bio-nanotechnology on
society.55
487Immobilisation of Enzymes and Cells
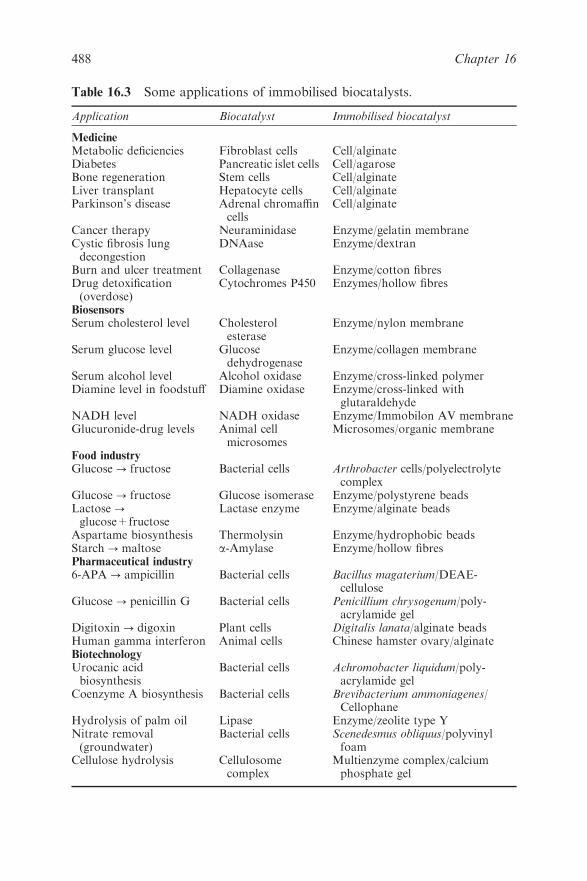
Table 16.3 Some applications of immobilised biocatalysts.
Application Biocatalyst Immobilised biocatalyst
MedicineMetabolic deficiencies Fibroblast cells Cell/alginateDiabetes Pancreatic islet cells Cell/agaroseBone regeneration Stem cells Cell/alginateLiver transplant Hepatocyte cells Cell/alginateParkinson’s disease Adrenal chromaffin
cellsCell/alginate
Cancer therapy Neuraminidase Enzyme/gelatin membraneCystic fibrosis lungdecongestion
DNAase Enzyme/dextran
Burn and ulcer treatment Collagenase Enzyme/cotton fibresDrug detoxification(overdose)
Cytochromes P450 Enzymes/hollow fibres
BiosensorsSerum cholesterol level Cholesterol
esteraseEnzyme/nylon membrane
Serum glucose level Glucosedehydrogenase
Enzyme/collagen membrane
Serum alcohol level Alcohol oxidase Enzyme/cross-linked polymerDiamine level in foodstuff Diamine oxidase Enzyme/cross-linked with
glutaraldehydeNADH level NADH oxidase Enzyme/Immobilon AV membraneGlucuronide-drug levels Animal cell
microsomesMicrosomes/organic membrane
Food industryGlucose- fructose Bacterial cells Arthrobacter cells/polyelectrolyte
complexGlucose- fructose Glucose isomerase Enzyme/polystyrene beadsLactose-glucose+fructose
Lactase enzyme Enzyme/alginate beads
Aspartame biosynthesis Thermolysin Enzyme/hydrophobic beadsStarch-maltose a-Amylase Enzyme/hollow fibresPharmaceutical industry6-APA- ampicillin Bacterial cells Bacillus magaterium/DEAE-
celluloseGlucose-penicillin G Bacterial cells Penicillium chrysogenum/poly-
acrylamide gelDigitoxin-digoxin Plant cells Digitalis lanata/alginate beadsHuman gamma interferon Animal cells Chinese hamster ovary/alginateBiotechnologyUrocanic acidbiosynthesis
Bacterial cells Achromobacter liquidum/poly-acrylamide gel
Coenzyme A biosynthesis Bacterial cells Brevibacterium ammoniagenes/Cellophane
Hydrolysis of palm oil Lipase Enzyme/zeolite type YNitrate removal(groundwater)
Bacterial cells Scenedesmus obliquus/polyvinylfoam
Cellulose hydrolysis Cellulosomecomplex
Multienzyme complex/calciumphosphate gel
488 Chapter 16
REFERENCES
1. G. F. Bickerstaff, Genetic Eng. Biotechnol., 1995, 15, 13–30.
2. G. F. Bickerstaff, Immobilisation of Enzymes and Cells, Humana
Press, Totowa, NJ, 1997.
3. G. F. Bickerstaff, Enzymes in Industry and Medicine, Edward
Arnold, London, 1987.
4. D. J. Pollard and J. M. Woodley, Trends Biotechnol., 2006, 25,
66–73.
5. J. L. Kaar, H.-I. Oh, A. J. Russell and W. J. Federspiel, Bio-
materials, 2007, 28, 3131–3139.
6. S. Schubert and J. Kurreck, Curr. Drug Targets, 2004, 5, 667–681.
7. J. C. Schlatterer, F. Stuhlmann and A. Jaschke, ChemBioChem,
2003, 4, 1089–1092.
8. M. V. Rodnina, M. Beringer and W. Wintermeyer, Trends Biochem.
Sci., 2006, 32, 20–26.
9. J. Tazi, S. Durand and P. Jeanteur, Trends Biochem. Sci., 2005, 30,
469–478.
10. A. G. Gabibov, Immunol. Lett., 2006, 103, 1–2.
11. A. G. Gabibov, N. A. Ponomarenko, E. B. Tretyak, M. A. Paltsev
and S. V. Suchkov, Autoimmun. Rev., 2006, 5, 324–330.
12. C. Adrain, G. Brumatti and S. J. Martin, Trends Mol. Med., 2006,
31, 565–570.
13. X. Yu, D. Acehan, J.-F. Menetret, C. R. Booth, S. J. Ludtke, S. J.
Riedl, Y. Shi, X. Wang and C. W. Akey, Structure, 2005, 13,
1725–1735.
14. A. C. Ciechanover and M. G. Masucci, The Ubiquitin–Proteasome
Proteolytic System, World Scientific, Singapore, 2002.
15. A. J. Rivett and A. R. Hearn, Curr. Protein Pept. Sci., 2004, 5,
153–161.
16. E. A. Bayer, R. Lamed and M. E. Himmel, Curr. Opin. Biotechnol.,
2007, 18, 237–245.
17. E. A. Bayer, J.-P. Belaich, Y. Shoham and R. Lamed, Annu. Rev.
Microbiol. 2004, 58, 521–554.
18. G. B. Sukhorukov and H. Mohwald, Trends Biotechnol., 2006, 25,
93–98.
19. G. Orive, R. M. Hernandez, A. R. Gascon and J. L. Pedraz, in
Immobilisation of Enzymes and Cells, 2nd edn, ed. J. M. Guisan, ,
Humana Press, Totowa, NJ, 2006, pp. 427–437.
20. E. E. Kheadr, J. C. Vuillemard and S. A. El-Deeb, Food Res. Int.,
2003, 36, 241–252.
489Immobilisation of Enzymes and Cells
21. V. Nedovic and R. Willaert, Applications of Cell Immobilisation
Biotechnology, Springer, Berlin, 2005.
22. V. Nedovic and R. Willaert, Fundamentals of Cell Immobilisation
Biotechnology, Springer, Berlin, 2004.
23. H. Lodish, A. Berk, P. Matsudaira, C. A. Kaiser, M. Krieger, M. P.
Scott, S. L. Zipursky and J. Darnell, Molecular Cell Biology, 5th
edn, Freeman, New York, 2004.
24. V. Gomod, P. Chamberlain, R. Jefferis and L. Faye, Trends Bio-
technol., 2005, 23, 559–565.
25. F. Bourgaud, A. Gravot, S. Milesi and E. Gontier, Plant Sci., 2001,
161, 839–851.
26. R. Y. K. Yang, O. Bayraktar and H. T. Pu, J. Biotechnol., 2003,
100, 13–22.
27. O. S. M. Goddijin and J. Pen, Trends Biotechnol., 1995, 13, 379–387.
28. L. Cao, Carrier-bound Immobilized Enzymes, Wiley InterScience,
New York, 2006.
29. P. Gadler and K. Faber, Trends Biotechnol., 2006, 25, 83–88.
30. G. F. Bickerstaff, in Immobilisation of Enzymes and Cells, ed. G.F.
Bickerstaff, Humana Press, Totowa, NJ, 1997, pp. 1–11.
31. A. Curtis and C. Wilkinson, Trends Biotechnol., 2001, 19, 98–101.
32. B. M. Cullum and T. Vo-Dinh, Trends Biotechnol., 2000, 18,
388–393.
33. L.-Q. Wu and G. F. Payne, Trends Biotechnol., 2004, 22,
593–599.
34. P. Fortina, L. J. Kricka, S. Surrey and P. Grodzinski, Trends Bio-
technol., 2005, 23, 168–173.
35. K. K. Jain, Trends Biotechnol., 2006, 24, 143–145.
36. S. S. Davis, Trends Biotechnol., 1997, 15, 217–223.
37. J. Kim, J. W. Grate and P. Wang, Chem. Eng. Sci., 2006, 61,
1017–1026.
38. J. M. Guisan, in Immobilisation of Enzymes and Cells,2nd edn, ed.
J. M. Guisan, , Humana Press, Totowa, NJ, 2006, pp. 1–13.
39. N. Ozturk, A. Akgol, M. Arisoy and A. Denizli, Sep. Purif. Tech-
nol., 2007, 58, 83–90.
40. R. Reshmi, G. Sanjay and S. Sugunan, Catal. Commun., 2006, 7,
460–465.
41. M. Paterson and J. F. Kennedy, in Immobilisation of Enzymes and
Cells, ed. G.F. Bickerstaff, Humana Press, Totowa, NJ, 1997,
pp. 153–165.
42. M. F. Cardosi, in Immobilisation of Enzymes and Cells, ed. G.F.
Bickerstaff, Humana Press, Totowa, NJ, 1997, pp. 217–227.
490 Chapter 16
43. C. Mateo, J. M. Palomo, G. Fernandez-Lorente, J. M. Guisan and
R. Fernandez-Lafuente, Enzyme Microb. Technol., 2007, 40,
1451–1463.
44. J. E. Fraser and G. F. Bickerstaff, in Immobilisation of Enzymes and
Cells, ed. G.F. Bickerstaff, Humana Press, Totowa, NJ, 1997,
pp. 61–66.
45. G. Orive, M. R. Hernandez, A. R. Gascon, R. Calafiore, T. M. S.
Chang, P. deVos, G. Hortelano, D. Hunkeler, I. Lacık and J. L.
Pedraz, Trends Biotechnol., 2004, 22, 87–92.
46. R. A. Peinado, J. J. Moreno, J. M. Villalba, J. A. Gonzalez-Reyes,
J. M. Ortega and J. C. Mauricio, Enzyme Microb. Technol., 2006,
40, 79–84.
47. A. L. Margolin, Trends Biotechnol., 1996, 14, 223–230.
48. H. Noritomi, A. Sasanuma, A. Kato and K. Nagahama, Biochem.
Eng. J., 2007, 33, 228–231.
49. A. Pandey, C. Webb, C. R. Soccol and C. Larrochem (eds.), Enzyme
Technology, Springer, Berlin, 2006.
50. J. Rudge and G. F. Bickerstaff, Biochem. Soc. Trans., 1984, 12,
311–312.
51. J. Toher, A. M. Kelly and G. F. Bickerstaff, Biochem. Soc. Trans.,
1990, 18, 313–314.
52. W. Liu and P. Wang, Biotech. Adv., 2007, 25, 369–384.
53. S. Venkatasubbarao, Trends Biotechnol., 2004, 22, 630–637.
54. M. Miyazaki and H. Maeda, Trends Biotechnol., 2006, 24, 463–470.
55. D. Parr, Trends Biotechnol., 2005, 23, 395–398.
491Immobilisation of Enzymes and Cells
CHAPTER 17
Downstream Processing
DANIEL G. BRACEWELL,a MOHAMMAD ALI S. MUMTAZa AND
C. MARK SMALESb
a Department of Biochemical Engineering, University College London,
Torrington Place, London WC1E 7JE, UK; bProtein Science Group,
Department of Biosciences, University of Kent, Canterbury, Kent CT2 7NJ,
UK
17.1 INTRODUCTION
The production of high-value biological products has intensified many
times over in the last few decades. Since the original sourcing of natural
products from the likes of plants, animals and microbes, the advent of
recombinant DNA technology has allowed researchers and industrialists
alike the ability to produce almost any biological product that one might
desire to a relatively large scale and with consistent reproducibility.
Whether using ‘natural’ sources of biological products (e.g. blood,
plants, microorganisms) or recombinant material expressed intracellu-
larly or secreted into culture medium and feedstocks, in almost all cases
it is necessary to purify (at least partially) the product of interest from
other biological contaminants. This process is termed downstream
processing and refers to the recovery of target biological products such
as proteins, peptides, DNA and virus particles from other contaminants.
With the growing demand for biological products and increased pro-
tein yields from fermentation processes, particularly from mammalian
expression systems, downstream bioprocessing has become both a major
Molecular Biology and Biotechnology, 5th Edition
Edited by John M Walker and Ralph Rapleyr Royal Society of Chemistry 2009
Published by the Royal Society of Chemistry, www.rsc.org
492
expense and a bottleneck in the production of biological products at
large scale. Indeed, since the 1980s, developments in the use of mam-
malian cell culture for the expression of high-value therapeutic proteins
have seen productivities and yields increase by over 100-fold,1 and this
has resulted in pressure on the ability to deliver efficient and cost-efficient
downstream processing of these molecules. Although improvements in
product yields per unit volume are economically beneficial, unfortunately
this does not directly correlate with downstream processing. In most
cases, where chromatography is central to downstream processing, it is
the total mass of the product that determines the amount of chromato-
graphy resin required and therefore cost.2 Currently it is estimated that
industrial downstream bioprocessing of biopharmaceuticals constitutes
over 40% of the manufacturing cost,3 and this is sure to rise as yields are
further increased. The design of downstream processing systems on an
industrial scale must therefore be carefully undertaken and optimised,
although this is not necessarily as crucial for academic or small-scale
industrial laboratory-based processes.
Traditionally, downstream processing has been, and continues to be,
heavily reliant upon adsorptive chromatographic procedures, although
high-performance liquid chromatography (HPLC) and size-exclusion
chromatography (SEC) also play key roles. The actual approach and
series of steps undertaken during the downstream processing for any
given biomolecule are determined by a number of factors, including the
nature of the molecule, the source and how the material is presented for
processing. Further, on an industrial scale, the number of steps involved,
recoveries, requirements and cost of the process as a whole must be
carefully considered before designing the approach to be taken. Hence the
selection of all unit operations to be utilised throughout a processing
workflow must be assessed before designing and undertaking any system.
The variables involved in such systems and the interactions between these
have recently been investigated using two case studies.4 We note that
throughout the work process it is necessary to monitor continually the
integrity and authenticity of the molecule of interest using an array of
analytical technologies, and this must be integrated into the workflow.
Here we restrict ourselves to the purification of proteins from in vitro
cultured expression systems (e.g. E. coli, mammalian cells) to illustrate the
typical workflow and processes involved in downstream bioprocessing.
17.2 INITIAL CONSIDERATIONS AND PRIMARY RECOVERY
With respect to the use of recombinant DNA technology and cell
expression systems, a significant difference between the E. coli and
493Downstream Processing
mammalian cell expression systems used both academically and
industrially is that whereas E. coli proteins are expressed intracellularly,
industrially relevant protein targets expressed in mammalian cells are
typically processed through the secretory pathway and secreted into the
surrounding culture media. Therefore, the recombinant material from
such in vitro mammalian expression systems may be recovered directly
from the culture medium whereas in the case of expression in E.coli it is
necessary to break open the cells (lysis) in order to release the intra-
cellular recombinant protein.
17.2.1 Centrifugation and Filtration
Centrifugation and filtration are often the first step employed in any
downstream bioprocessing workflow. Centrifugation is used either to
remove or to collect cells and debris (collect cells where intracellular
material needs to be released; remove cell debris where the biomolecule
of interest is in the culture medium) before further processing is
undertaken. Due to the limitations of size, batch centrifugation on a
large scale is not feasible and in this case continuous-flow centrifugation
can be used. Both centrifugation and filtration can be used to clarify cell
culture supernatants and cell extracts; however, on a large scale tradi-
tional filtering is not possible due to the membrane size that would be
required and fouling of the membrane. Cross-flow filtration has been
employed to reduce both fouling of the membrane and improve the flow
rate, and this approach has been successfully used to remove soluble host
proteins during the recovery of inclusion bodies in E. coli cell lysates.5
17.2.2 Cell Lysis
In the case of biologics that are expressed intracellularly (e.g. in bacterial
and plant cell expression systems), it is necessary to release the material
so that it can be recovered and purified. The three main approaches for
achieving this are enzymatic, chemical and physical lysis. Both chemical
and enzymatic approaches can be used to help selectively release target
products, but this requires the optimisation of each procedure for
individual target molecules.6 Chemical approaches generally rely on the
use of detergents or high pH/alkaline solutions to disrupt and lyse the
cell, both of which can adversely affect the molecule of interest if these
approaches are not optimised for individual targets. Enzymatic lysis can
also be used to give specificity to both the process of lysis and release of
the target product and therefore offers a more controlled method of cell
lysis.7 The recent advances in the development of enzyme systems for the
494 Chapter 17
rupturing of bacterial and yeast cells have been well described by Salazar
and Asenjo.8 Physical approaches to cell lysis at the laboratory scale
include grinding (e.g. in a mortar), high pressure (e.g. in a French press)
and osmotic shock. In the case of heat-stable products, heat lysis
methods may also be applicable, a readily scaleable approach. Large-
scale physical disruption is, however, most commonly performed by
either high-speed agitator bead mills or high-pressure industrial homo-
genisers. The equipment used derives from the paint and dairy indus-
tries, respectively.9
17.2.3 Recovery of Material from Inclusion Bodies
The high-level expression of recombinant protein using E. coli expres-
sion systems often results in the formation of inclusion bodies, insoluble
aggregates of material that form in vivo.10 Inclusion bodies usually result
due to the inability of the E. coli host to fold and process correctly the
polypeptide chain(s) of the recombinant protein and/or via inter-
molecular interactions between partially folded polypeptide chains.
Although the protein material found within inclusion bodies has no
biological activity and is therefore usually of little value as is, inclusion
bodies can be easily isolated from E. coli cells at high purities, thereby
acting as a useful purification means.10 Further, it is often possible to
recover the biological activity of the protein of interest once the inclu-
sion bodies have been purified, making this a potential means of
expressing and purifying target recombinant proteins. However, recov-
ery of protein from inclusion bodies can be awkward, recoveries can be
low and the process can be expensive. Further, inclusion bodies are not
usually absolutely pure and there may be significant loss of protein
during the recovery of material from inclusion bodies. Hence careful
attention must be paid to the design of the strategies employed for the
recovery of material from inclusion bodies to ensure good recovery and
purification of the protein of interest.
There are four steps typically involved in the purification and biolo-
gical recovery of proteins within inclusion bodies. These are the isolation
of the inclusion bodies from the host E. coli cells, resolubilisation of the
protein material within the inclusion bodies, refolding of the resolubi-
lised material into a bioactive form and further purification or polishing
of the protein of interest.10 The most important steps are the solubili-
sation and refolding. Inclusion bodies and therefore the proteins con-
tained within, are usually resolubilised using high concentrations (6–8M)
of chaotropic agents such as urea. The resolubilised proteins are then
refolded by slowly removing the resolubilising agent while transferring
495Downstream Processing
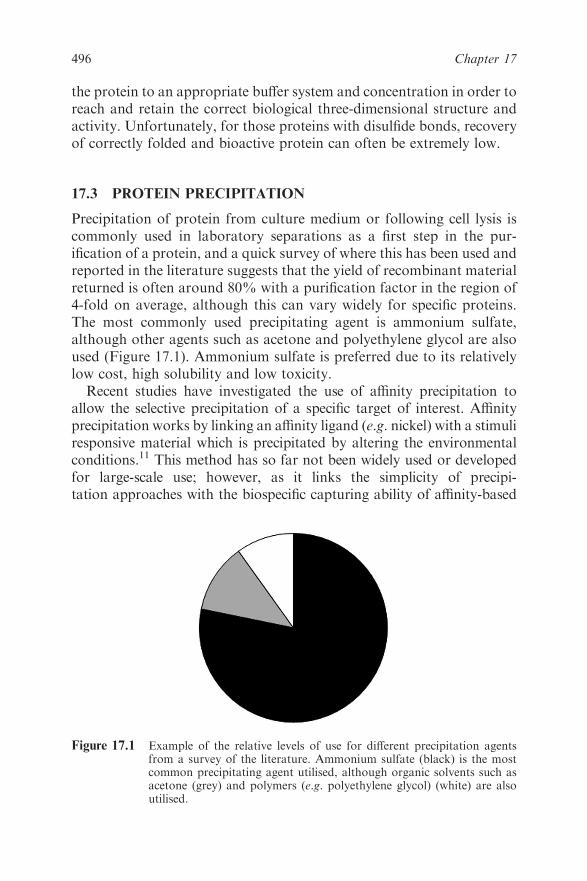
the protein to an appropriate buffer system and concentration in order to
reach and retain the correct biological three-dimensional structure and
activity. Unfortunately, for those proteins with disulfide bonds, recovery
of correctly folded and bioactive protein can often be extremely low.
17.3 PROTEIN PRECIPITATION
Precipitation of protein from culture medium or following cell lysis is
commonly used in laboratory separations as a first step in the pur-
ification of a protein, and a quick survey of where this has been used and
reported in the literature suggests that the yield of recombinant material
returned is often around 80% with a purification factor in the region of
4-fold on average, although this can vary widely for specific proteins.
The most commonly used precipitating agent is ammonium sulfate,
although other agents such as acetone and polyethylene glycol are also
used (Figure 17.1). Ammonium sulfate is preferred due to its relatively
low cost, high solubility and low toxicity.
Recent studies have investigated the use of affinity precipitation to
allow the selective precipitation of a specific target of interest. Affinity
precipitation works by linking an affinity ligand (e.g. nickel) with a stimuli
responsive material which is precipitated by altering the environmental
conditions.11 This method has so far not been widely used or developed
for large-scale use; however, as it links the simplicity of precipi-
tation approaches with the biospecific capturing ability of affinity-based
Figure 17.1 Example of the relative levels of use for different precipitation agentsfrom a survey of the literature. Ammonium sulfate (black) is the mostcommon precipitating agent utilised, although organic solvents such asacetone (grey) and polymers (e.g. polyethylene glycol) (white) are alsoutilised.
496 Chapter 17
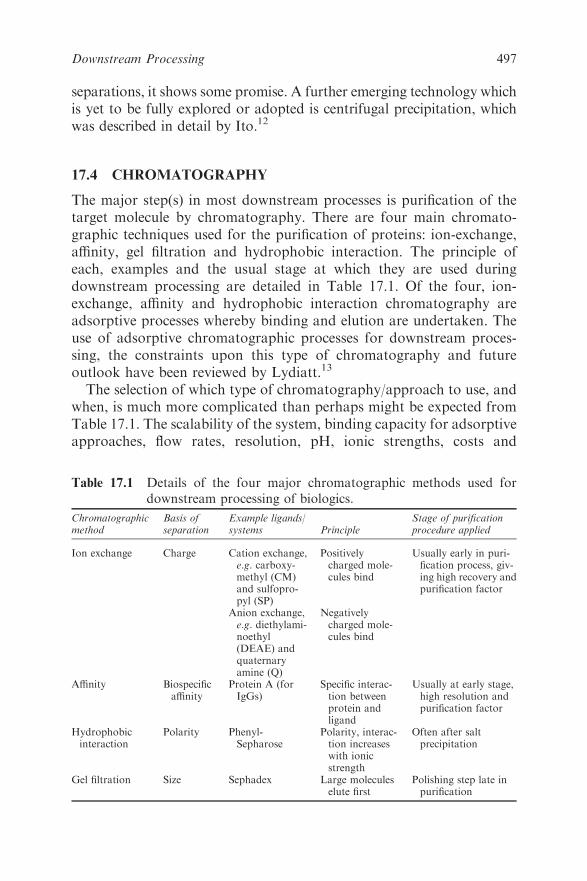
separations, it shows some promise. A further emerging technology which
is yet to be fully explored or adopted is centrifugal precipitation, which
was described in detail by Ito.12
17.4 CHROMATOGRAPHY
The major step(s) in most downstream processes is purification of the
target molecule by chromatography. There are four main chromato-
graphic techniques used for the purification of proteins: ion-exchange,
affinity, gel filtration and hydrophobic interaction. The principle of
each, examples and the usual stage at which they are used during
downstream processing are detailed in Table 17.1. Of the four, ion-
exchange, affinity and hydrophobic interaction chromatography are
adsorptive processes whereby binding and elution are undertaken. The
use of adsorptive chromatographic processes for downstream proces-
sing, the constraints upon this type of chromatography and future
outlook have been reviewed by Lydiatt.13
The selection of which type of chromatography/approach to use, and
when, is much more complicated than perhaps might be expected from
Table 17.1. The scalability of the system, binding capacity for adsorptive
approaches, flow rates, resolution, pH, ionic strengths, costs and
Table 17.1 Details of the four major chromatographic methods used for
downstream processing of biologics.
Chromatographicmethod
Basis ofseparation
Example ligands/systems Principle
Stage of purificationprocedure applied
Ion exchange Charge Cation exchange,e.g. carboxy-methyl (CM)and sulfopro-pyl (SP)
Positivelycharged mole-cules bind
Usually early in puri-fication process, giv-ing high recovery andpurification factor
Anion exchange,e.g. diethylami-noethyl(DEAE) andquaternaryamine (Q)
Negativelycharged mole-cules bind
Affinity Biospecificaffinity
Protein A (forIgGs)
Specific interac-tion betweenprotein andligand
Usually at early stage,high resolution andpurification factor
Hydrophobicinteraction
Polarity Phenyl-Sepharose
Polarity, interac-tion increaseswith ionicstrength
Often after saltprecipitation
Gel filtration Size Sephadex Large moleculeselute first
Polishing step late inpurification
497Downstream Processing

monitoring of the process are among a few of the variables that must be
considered before design of the system and ultimate scale-up operation.
Another important consideration is the chromatography matrix itself,
and ideally this should be:
� reusable;
� chemically stable (not leach during processing);
� physically stable (i.e. withstand the required flow conditions);
� have appropriate internal structure/porosity to give suitable mass
transfer and capacity;
� be commercially available from a reliable source to meet regulatory
requirements;
� be cost effective.
Typical matrix types often encountered include agarose and cross-
linked agaroses, cross-linked dextran, composites of dextran and poly-
acrylamide or dextran and agarose, cellulose and organic polymer-based
beads.
A survey of approximately 100 papers in the primary literature where
the four chromatographic approaches outlined above have been utilised
confirms that affinity chromatography achieves the highest purification
factors of all these approaches (Table 17.2). However, ion-exchange
chromatography is the most commonly utilised chromatographic
approach, comprising approximately 41% of all purification steps used,
and gel filtration chromatography (17%) is the second most widely
used approach. Precipitation is used almost exclusively as a first step
(Figure 17.2), whereas ion exchange is used as a bulk purification step
and as a polishing step late in the workflow (Figure 17.2).
Table 17.2 The average and maximum purification factors of the four major
chromatographic methods utilised during downstream processing
as determined from a survey of the primary literature.
Chromatography methodPurification factor
Average Maximum
Ion exchange 7 143Affinity 57 499Hydrophobic interaction 10 79Gel filtration 5 26Precipitationa 4 33
aPrecipitation is not a chromatographic method but is included for comparison.
498 Chapter 17
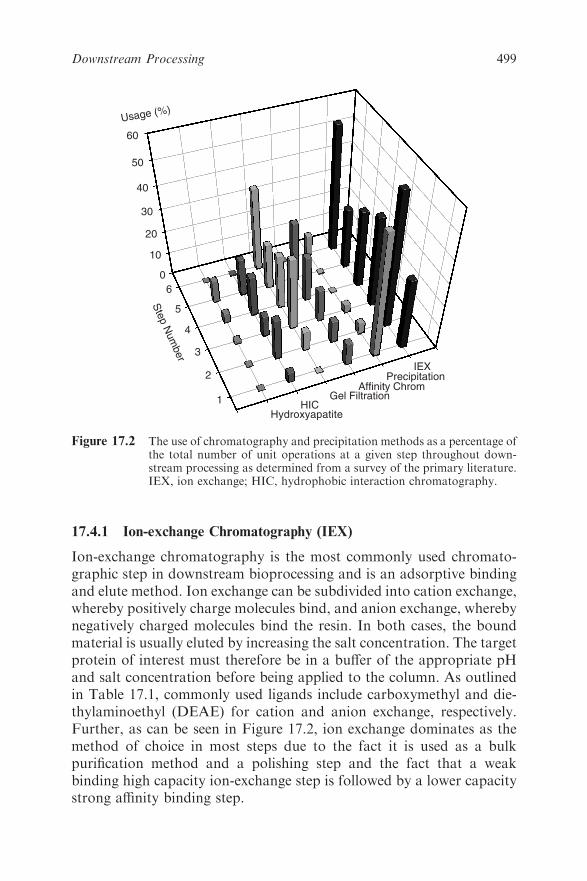
17.4.1 Ion-exchange Chromatography (IEX)
Ion-exchange chromatography is the most commonly used chromato-
graphic step in downstream bioprocessing and is an adsorptive binding
and elute method. Ion exchange can be subdivided into cation exchange,
whereby positively charge molecules bind, and anion exchange, whereby
negatively charged molecules bind the resin. In both cases, the bound
material is usually eluted by increasing the salt concentration. The target
protein of interest must therefore be in a buffer of the appropriate pH
and salt concentration before being applied to the column. As outlined
in Table 17.1, commonly used ligands include carboxymethyl and die-
thylaminoethyl (DEAE) for cation and anion exchange, respectively.
Further, as can be seen in Figure 17.2, ion exchange dominates as the
method of choice in most steps due to the fact it is used as a bulk
purification method and a polishing step and the fact that a weak
binding high capacity ion-exchange step is followed by a lower capacity
strong affinity binding step.
0
10
20
30
40
50
60
1
2
3
4
5
6
IEXPrecipitation
Affinity ChromGel Filtration
HICHydroxyapatite
Usage (%)
Ste
p N
um
ber
Figure 17.2 The use of chromatography and precipitation methods as a percentage ofthe total number of unit operations at a given step throughout down-stream processing as determined from a survey of the primary literature.IEX, ion exchange; HIC, hydrophobic interaction chromatography.
499Downstream Processing
17.4.2 Affinity Chromatography
Applied correctly and with the appropriate ligand, affinity chromato-
graphy is the most powerful chromatographic purification method
available to yield high purification factors in a single step. Due to the
high biospecificity of this approach, it is used as a fundamental capture
step in most processes where an appropriate ligand is available and this
is one of the limitations in using the approach. The approach is thus
based upon the affinity of the target molecule for a ligand immobilised
on an appropriate resin. Protein A capture of monoclonal antibodies
expressed from in vitro cultured mammalian cells is one of the most
widely used affinity chromatography steps. Indeed, industrially the gold
standard purification of monoclonal antibodies is to use protein A
chromatography as the first step in the purification process after primary
recovery steps.14 For example, in 2002 the demand for protein A resins
exceeded 10 000 L and an already $50 million a year market was growing
at a rate of 50% per year.15 However, increased yields of recombinantly
produced monoclonal antibodies coupled with the high cost of protein A
resins mean that investigators are currently focused upon improving the
capacity and throughput of this approach in order to continue making
this approach economical. A further area of concern with the use of
protein A is the stability of these resins upon cleaning, and therefore
there is much interest in finding alternatives to protein A chromato-
graphy for antibody purification.14
A number of other affinity ligands are also used at the industrial and
laboratory scale. Dye-based ligands are perhaps the largest industrially
utilised approach, largely for the purification of industrially produced
enzymes. Immobilised metal affinity chromatography is also widely used
at the laboratory scale, particularly the use of poly His-tags, whereby the
target protein of interest is engineered to contain a His-tag usually of
six consecutive His residues at either the C- or N-terminal end of the
protein. This approach is popular due to the high binding capacity,
stability, robustness and recovery offered by poly His-tags.16 However, a
drawback of such an approach is that it is often necessary to remove the
His-tag during bioprocessing to maintain the authenticity of the bio-
molecule, adding further steps and costs to the process. It is there-
fore most widely applied to high-throughput research approaches
where there is a need to purify a large number of different proteins for
further study.
Although the development of affinity separations is one of enormous
potential, the growth of regular packed bed affinity chromatography
seems to have plateaued over the past few years. The limitations do not
500 Chapter 17
lie in affinity�based separations but in packed bed chromatography
columns and the lack of cheap ligands available for use at an industrial
scale. The recent development of the Capture Select technology by BAC
and GE Healthcare is a new approach for designing/developing novel
ligands. This technology uses a unique antibody found in Camelidae,
specifically a small 12 kDa antigen�binding fragment, to develop cus-
tomised ligands which can be used for purifying recombinant proteins,
scavenging impurities and removing viral load from complex media
using an animal�free system. This approach offers optimal binding
affinity coupled with a high specificity over a broad range which allows
the step to be fine tuned for a given process by incorporating specific
elution conditions and stability.17 The technology has not yet become
widely adopted at the industrial scale but offers an alternative method to
affinity chromatography development. Other alternatives, such as affi-
nity precipitation, expanded bed adsorption and affinity membrane
chromatography, are therefore currently being investigated as possible
replacements.
17.4.3 Hydrophobic Interaction Chromatography (HIC)
Hydrophobic interaction chromatography is a useful tool for the pur-
ification of proteins, providing a powerful complementary separation
step to ion-exchange and gel filtration chromatography. It has also
shown much promise as a simultaneous protein purification and
refolding step.18 As hydrophobic interactions are strongest at high ionic
strengths, this approach is often used fairly early in downstream bio-
processing, directly after precipitation steps19 when salt levels are high,
or in combination with gel filtration20 or ion-exchange chromato-
graphy.21 Although hydrophobic interaction chromatography is an
adsorptive process, the interactions are generally weaker than in affinity
and ion-exchange chromatography, thus resulting in minimal structural
damage and loss of activity to the target protein.22 Hydrophobic
interaction chromatography is also very useful in the removal of DNA
impurities and for purifying DNA-based products.23
17.4.4 Gel Filtration Chromatography
Gel filtration chromatography does not involve bind–elute chromato-
graphy but rather separates proteins on the basis of size through porous
beads. Large molecules are not able to enter the pores and elute first
whereas small molecules elute later. In order for gel filtration chroma-
tography to separate entirely on the basis of size alone, there must be no
501Downstream Processing
interaction between the matrix and the molecules in the mobile phase.
Gel filtration chromatography has been used for over 50 years and is
primarily used as a polishing step late in downstream processing where
the feedstream is relatively pure compared with earlier purification steps.
Gel filtration is mainly used at the industrial scale as a final chroma-
tography step to remove protein aggregates and small impurities and has
a low loading capacity and low throughput. A vast array of different
columns and matrices are now commercially available with pore sizes as
small as 3 mm.24 The majority of the developments in the use of gel fil-
tration in recent years have been in its utilisation as an analytical tool
and for the separation of biopolymers25 rather than proteins, especially
at an industrial scale.
17.5 ALTERNATIVES TO PACKED BED CHROMATOGRAPHY
Packed bed chromatography has been, and continues to be, the most
widely used mode of chromatography used on both a large and small
scale, industrially and academically. Despite this approach being on the
whole of high cost and low throughput, it has predominated, largely due
to the very high resolution that can be achieved and a lack of alter-
natives that can deliver similar resolution. However, the high cost of this
approach coupled with increased product yields/concentrations in
feedstocks and the practicalities and limitations that these bring mean
that there is now a real need to investigate and develop alternatives to
this traditional approach. Such alternatives include, but are not limited
to, membrane chromatography, expanded bed adsorption, aqueous
two-phase extraction and protein crystallisation. These potential
approaches and the likelihood of their success have been discussed in
detail by Przybycien et al.26
17.5.1 Expanded Bed Adsorption
Expanded bed adsorption combines the essential product capture step
with the separation of solids and liquids in one step, thus reducing the
number of steps in a process, and has been well described and reviewed
by Anspach et al.27 This approach can result in increased yield and
reduced overall process time and cost.28 The first stabilised expanded
bed adsorption column was developed in the early 1990s,13,29 and this
approach has now been used in the processing of whole cell mammalian
cell culture broth and has found successful application in affinity chro-
matography. This approach has also been used for the purification of
monoclonal antibodies, providing higher recovery at lower cost and
502 Chapter 17

shorter processing time compared with packed bed chromatography.30
Expanded bed adsorption has also been used as an alternative process
for the purification of an insulin precursor, MI3.31 Despite the apparent
advantages, expanded bed adsorption currently remains an alternative
technique and has not yet proven to be a threat to the dominance of
packed bed chromatography in the biopharmaceutical industry.
17.5.2 Aqueous Two-phase Extraction
The process of aqueous two-phase extraction has recently attracted the
attention of investigators wishing to develop alternatives to traditional
packed bed chromatographic procedures. This has been particularly
evident in the purification of plant-manufactured biopharmaceuticals.32
Aqueous two-phase systems integrate the steps of cell disruption with
product recovery using either polymer-based systems, hydrophobic
and affinity precipitation or the use of surfactants.33 The theory is
that the protein of interest and cellular debris and other material will
exhibit differential solubility between two aqueous phases. The two
phases are usually created by mixing solutions of polyethylene glycol
with either dextran or salts to form two immiscible layers or phases.
Despite the fact that aqueous two-phase extraction can be applied to
very crude mixtures while providing high capacity and easy scale-up, its
use to date has been limited to selected industrial applications. This is
largely due to the high cost of the polymers used and a lack of fully
developed design approaches. Novel polymers are currently being
developed that may overcome such limitations, especially the develop-
ment of low-cost starch- and cellulose-based polymers for some of the
more attractive uses of aqueous two-phase systems such as affinity
precipitation.
17.5.3 Membrane Chromatography and Filtration
A number of recent reviews on the use of membrane chromatography
have suggested that theoretically this approach could have a number of
advantages over traditional packed bed chromatography.34 Membrane
chromatography can exhibit dynamic binding capacities of up to 10
times higher and flow rates of up to a 100 times faster than packed
bed chromatography, especially for selected applications such as the
purification of large particles.35 Membrane chromatography is also
significantly cheaper per cycle if hidden costs, including validation,
cleaning and the manpower involved in packed bed chromatography,
are taken into account. Despite these perceived advantages, membrane
503Downstream Processing

chromatography has not been widely adopted by the bioprocessing
industry, mainly because it is limited by the throughput as a result
of the available surface area per unit compared with packed bed
chromatography.
Membrane filtration is also used as an alternative method of clarifying
cell culture media and cell extracts and techniques such as ultrafiltration
and high-performance tangential flow filtration (HPTFF) have been
investigated as integral steps in downstream processing schemes. Indeed,
there have been reports where HPTFF has been successfully used as a
polishing step.36 Perhaps one of the more significant advances in this
area has been the use of pH and charged membranes to manipulate the
product. These approaches have been shown to be useful for the
removal of viruses from mammalian cell systems and endotoxins from
bacterial systems. Despite such advances, these approaches have not
been fully adopted and membrane fouling remains a problem during
such processing, and these approaches are usually used prior to chro-
matographic steps.
17.5.4 Crystallisation
Crystallisation as a purification technique has long been used by
investigators and industrialists in the small-molecule field, but has lar-
gely been ignored until recently in the biologics field. With increasing
product yields and concentrations, this approach is now attracting much
interest as an alternative to some chromatographic steps, thereby
reducing the number of these required. Crystallisation of proteins has
long been used in structural analysis studies where screens have been
developed to find conditions that allow the successful crystallisation of a
target protein. Now the potential of this approach in downstream
processing is being seriously considered and has been used during the
purification of glucose isomerase and insulin. A number of investigators
have now reviewed the principles of protein crystallisation and the
technical aspects of process development for its large-scale use.37
Despite the promise of this approach, there are still scale-up issues
involved in further developing this technique and a lack of process
development in the area.38 The development of novel microanalysis
methods to determine large-scale conditions that will drive crystal-
lisation of the target protein of interest at high yield is currently under
way and may help overcome such limitations.39 Hence there is the
potential to develop low-cost methods of purification that utilise crys-
tallisation for many biologics, although currently this potential is largely
unrealised.
504 Chapter 17

17.5.5 Monolith Columns
Monoliths are continuous stationary phases available in a variety of
shapes and sizes and have shown potential to be developed with chro-
matographic ligands.40 Monoliths are polymerised directly into a single
unit although, for biotechnology purposes, many regular monolith tubes
are prepared and interlaced into a single column with a limited pore size
of around 5 mm.41 Monoliths show great potential for providing high
mass transfer through convective flow, thus enabling both capacity and
resolution to be independent of flow rate. A further perceived advantage
over conventional chromatographic beds is that they do not require
packing and therefore reduce validation and labour costs. However,
despite the fact that monoliths are being developed for affinity and ion-
exchange chromatography, they have as yet not been able to make
significant inroads into industrial-scale protein purification processing,
largely due to technical problems involved in developing large-scale
monolith columns. One use of monoliths that has been commercially
validated is for the purification of pharmaceutical-grade plasmid
DNA.42 Success has been more readily achieved in this case as there are
clear capacity advantages over conventional chromatographic resins
which have porous internal structures designed for smaller protein-sized
molecules. This capacity advantage may also translate to purifications of
other very large molecular structures such as virus-like particles and
viruses.
17.6 DESIGN OF BIOMOLECULES FOR DOWNSTREAM
PROCESSING
There is much interest in how high-value biological products, and par-
ticularly proteins, can be designed for downstream bioprocessing.
Although it has long been recognised that the properties of a target
molecule influence its behaviour and the approaches taken during
downstream processing, until relatively recently there has not necessarily
been a concerted and integrated approach to link the two together for
any particular molecule. This requires designing the molecule for the
downstream processing envisaged and integrates the upstream and
downstream investigations such that the two processes are seamless.
To date, the design of molecules for downstream processing has lar-
gely been limited to the use of affinity tags and fusion proteins for
purification. These have been particularly adopted at the small labora-
tory scale but are often not practical, too costly or potentially have
legislative issues associated with them, which have prevented such
505Downstream Processing

approaches becoming more widely adopted at large scale. However, the
design of molecules to aid in more efficient traditional chromatographic
approaches, such that fewer steps and greater yields are achieved, and/or
for aiding alternative approaches such as protein crystallisation and
aqueous phase partitioning is an attractive proposition. Further, careful
design of biomolecules may also be used in the future to prevent or limit
aggregation and harmful post-translation modifications occurring (e.g.
deamidation) during the expression of the protein of interest in fer-
menters and while undergoing downstream processing.43 This area of
designing molecules for manufacturability, from expression to for-
mulation, is likely to be one in which there will be much interest and
investigation in the coming years and may ultimately dictate the direc-
tion that industrial-scale downstream processing follows.
17.7 SCALEDOWN METHODS
Scaledown methods are critical to assist decision making when the
intention is ultimately to operate a purification process at large scale.
This is because when increasing the scale of a purification process from
what is typically a laboratory-scale sequence of operations, many
changes occur. Some might impact on the cells, such as the change from
a benchtop centrifuge to a continuous centrifuge for cell harvest, others
may impact on the final product such as the pumping and vialing
operation in a large-scale process, all of which can have unpredictable
effects that can seriously delay the development of large-scale opera-
tions. Scaledown methods seek to mimic these critical changes to mea-
sure the effect (if any) of these changes but to allow this to be achieved
with a minimal amount of material, far less than would be required in
the pilot plant environment. This provides scope to assess more pro-
cessing options and the manufacturability of different molecules and
host cell lines (as described in the previous section) at realistic scale
and hence cost. Methods have been established for operations such as
filtration44,45 and centrifugation46,47 making bench-scale studies which
predict full-scale operation feasible. Such methodology has also been
developed for chromatography.48
17.8 VALIDATION AND ROBUSTNESS
A traditional mantra used in the sector is ‘the process is the product’.
This statement goes a long way to explaining how complex biologics can
be manufactured in a safe manner. A strict definition of the process is
made which has validated limits within which the process must run.
506 Chapter 17

By operating in this fashion, one seeks to produce a consistent product
which has proven efficacy from clinical trials. The US Food and Drug
Administration (FDA) defines this act of process validation as ‘estab-
lishing documented evidence which provides a high degree of assurance
that a specific process will consistently produce a product meeting its
predetermined specifications and quality attributes’.49 This reliance on
defining the process to such a high level arises from the difficulty in
defining by analytical techniques biological products, particularly bio-
pharmaceuticals, to the necessary degree of accuracy.
The key end-point of process development is demonstration to the
regulatory authorities that the final large-scale process can indeed be
operated consistently (typically three repeats are required). To ensure
this and that subsequent manufacture is reliable, it makes logical sense
that the process is designed such that the validated limits of operation
are in robust regions, that is, the variability natural to such processes
will be tolerated by the process and it will remain within its validated
limits. To assist in developing such robust processes, many companies
now embrace the principles of ‘quality by design’. Key to this strategy is
the judicious use of monitoring and control strategies within the pro-
cess.50 Traditionally, this involves approaches such as absorbance
measurements, gel electrophoresis and HPLC analysis; however, with
the advent of more state-of-the-art technologies such as mass spectro-
metry, a greater degree of monitoring and hence confidence in the
process is now envisaged. These more advanced approaches are being
actively encouraged by the FDA via their Process Analytical Technol-
ogy (PAT) initiative.
17.9 FORMULATION AND ANTIVIRAL TREATMENTS
17.9.1 Formulation
In order that biomaterials, and particularly biopharmaceutical protein-
based therapeutic drugs, can be maintained and delivered in a biologi-
cally active state, it is often necessary to formulate purified materials in
excipients and additives that protect the product from deleterious
reactions and degradations that compromise the authenticity of such
products. This can be achieved in either the solid (lyophilised) or solu-
tion state and both are routinely used for the preparation of such pro-
ducts. Current methods for determining the best formulation(s) for
preservation, stability and delivery rely heavily upon trial-and-error
approaches. Preservation is then usually investigated using higher tem-
perature and varying pH studies in order to ‘force’ stability issues (often
507Downstream Processing
described as accelerated stability studies) and stability is then investi-
gated routinely using isoelectric focusing, SDS-PAGE and fluorescence
methodology. Particularly with regard to antibody-based therapies
where relatively large amounts of material are required per dose,51 there
is interest in the development of high-concentration liquid formulations
(4100mgmL�1) destined for clinical use. In particular, there is much
academic and industrial interest in developing our ability to predict
appropriate formulation strategies and compositions for particular
proteins that would negate the need for time-consuming trial-and-error
studies.52
17.9.2 Antiviral Treatments
Ever since the transmission of HIV infection to haemophiliac patients
through contaminated blood-based products in the early 1980s, there
have been stricter controls and scrutiny of the methods of viral inacti-
vation utilised during bioprocessing. This is of particular concern when
using mammalian cells to produce biotherapeutic products, as there is
clear potential to host harmful viruses. Current good practice therefore
dictates that products destined for use as therapeutics are submitted to
antiviral treatments with two different viral-inactivation steps each of
which gives a four to five log reduction in virus load. To achieve this
level of reduction, several steps with viral removal functionality are
required, although some of these steps may have dual functions. The
methods employed to achieve this are varied and the regulatory bodies
do not require specific viral inactivation treatments but rather judge the
validity of the approach used for each product on its own merits.53
The most commonly used methods to reduce viral load are the heating
of protein solutions and lyophilisates, nanofiltration, low-pH hold steps,
UV irradiation, solvent/detergent treatments and those process removal
steps that are part of the purification methodology or the production of
the protein of interest. Of these treatments, heat treatment is the current
‘gold standard’ and many therapeutic protein preparations are treated in
this way (e.g. albumin, Factor VIII, Factor IX, thrombin, fibrinogen,
IgG). Further, heat treatment has the advantage of being one of the few
methods that can be applied to a given product in the vial without the
need for disruption of the product. Typical heat treatment in the liquid
state consists of 60 1C for 10 h, whereas in the lyophilised state samples
are typically subjected to temperatures of 90 1C for 10 h or 80 1C for
72 h. The disadvantage of heat treatment is that as proteins denature and
undergo deleterious reactions upon heat stress, it is necessary to formu-
late the protein of interest in stabilising excipients such as sucrose to
508 Chapter 17

prevent such reactions. It has been shown that the excipients themselves
can break down and react with the protein of interest under certain heat
treatment conditions, resulting in disadvantageous side reactions that
compromise the authenticity of the protein product.53
17.10 CURRENT DEVELOPMENTS AND FUTURE
DIRECTIONS
Downstream processing of high-value biological products has long been
dominated by adsorptive packed bed chromatographic approaches,
despite a number of limitations to this technique, including the high
cost, low throughput and complexity of scale-up. However, the ability of
currently available expression technologies to produce ever higher yields
and concentrations of high-value biological products means that the
downstream bioprocessing community has begun to consider alter-
natives to this traditional approach that may at least reduce the extent of
its use. Many consider that the traditional approach of small incre-
mental improvements to operations already working at the limit is
proving ineffective at resolving downstream processing bottlenecks.
Consequently, there is a drive to investigate unit operations that
might replace some of the current dependence on packed bed chroma-
tography. Recent reviews suggest that the most notable trends in this
area are to integrate steps (thereby reducing the number), the develop-
ment of platform technologies (so as to move towards a more systemic
approach), further process optimisation and the increased use of dis-
posable equipment.
Process integration is a logical approach towards reducing costs as a
reduced number of steps will allow greater throughput and potentially
yield. This approach has already delivered a number of new technolo-
gies, including affinity precipitation and expanded bed adsorption.
Unsurprisingly, the focus tends towards eliminating intermediate pur-
ification steps and moving directly from product capture to product
polishing. The aim is to develop an integrated process which uses the
minimum number of steps in a logical way, with each step focusing on
the removal of a certain impurity. This has resulted in some polishing
steps being employed before bulk separation processes, for instance, the
removal of specific proteases early on in the process to preserve product
stability. However, to implement such a concept, a systematic approach
has to be taken towards process development. Increased regulatory
issues, and the fact that integrating new developments into the process
can often yield haphazard results, have necessitated that a more orga-
nised approach be taken. This must be undertaken to ensure that
509Downstream Processing
individual steps during downstream processing all work together and
are managed in such a way that optimum processing is achieved at each
step. A current lack of systematic approaches highlights the need to
design platform technologies for specific types or classes of biological
products so as to make process optimisation a simpler task. This will be
aided by developments in microscale bioprocess optimisation and pro-
cess simulation software, which have allowed the formulation of a
process very early in the development of a product.54 Finally, the trend
towards disposable technology is likely to continue in the foreseeable
future and any novel developments in downstream processing must be
able to incorporate such a move. For example, recent studies have
shown that smaller disposable membranes use up to 95% less buffer
than conventional systems and can reduce monoclonal antibody pol-
ishing costs by 70%. Disposables are also encroaching upon upstream
bioprocessing with disposable bioreactors as large as 1000L being
developed. All of these areas and approaches, particularly systematic
approaches, are likely to play key roles in future developments for
optimising downstream processing of high-value biological products.
REFERENCES
1. F. M. Wurm, Nat. Biotechnol., 2004, 22, 1393–98.
2. D. Lowa, R. O’Leary and N. S. Pujar, J. Chromatogr. B, 2007,
848, 48–63.
3. Frost and Sullivan Research Analyst Pharmaceuticals and Bio-
technology Research and Consulting Practice (2004) Report on The
strategic analysis of downstream processing in biopharmaceuticals
production.
4. J. M. King, N. J. Titchener-Hooker and Y. Zhou, Bioprocess Bio-
syst. Eng., 2007, 30, 123–34.
5. A. Venkiteshwaran, P. Heider, S. Matosevic, A. Bogsnes, A. Staby,
S. Sharfstein and G. Belfort, Biotechnol. Prog., 2007, 23, 667–72.
6. H. Schutte and M. R. Kula, Biotechnol. Appl. Biochem., 1990,
12, 599–620.
7. J. A. Asenjo and B. A. Andrews, Bioprocess Technol., 1990,
9, 143–75.
8. O. Salazar and J. A. Asenjo, Biotechnol. Lett., 2007, 29, 985–94.
9. M. R. Kula and H. Schutte, Biotechnol. Prog., 1987, 3, 31–42.
10. S. M. Singh and A. K. Panda, J. Biosci. Bioeng., 2005, 99, 303–10.
11. R. Freitag, I. Schumacher and F. Hilbrig, Biotechnol. J. 2007, 2,
685–90.
12. Y. Ito, Anal. Biochem., 2000, 277, 143–53.
510 Chapter 17
13. A. Lyddiatt, Curr. Opin. Biotechnol., 2002, 13, 95–103.
14. D. Low, R. O’Leary and N. S. Pujar, J. Chromatogr. B, 2007,
848, 48–63.
15. J. Curling, Biopharm. Int. 2004, August 1.
16. P.-O. W. C. K. I. Y. G. B. M. Ashok Kumar, Biotechnol. Bioeng.,
2003, 84, 494–503.
17. F. Detmers, P. Hermans and M. ten Haaft, Genet. Eng. News,
2007, 27, 8.
18. X. D. Geng and Q. Bai, Sci. China, Ser. B, 2002, 45, 655–69.
19. M. L. Stracke, H. C. Krutzsch, E. J. Unsworth, A. Arestad,
V. Cioce, E. Schiffmann and L. A. Liotta, J. Biol. Chem., 1992,
267, 2524–9.
20. C. T. Tomaz and J. A. Queiroz, J. Chromatogr. A, 1999, 865,
123–8.
21. T. Unge, H. Ahola, R. Bhikhabhai, K. Backbro, S. Lovgren,
E. M. Fenyo, A. Honigman, A. Panet, J. S. Gronowitz and
B. Strandberg, AIDS Res. Hum. Retroviruses, 1990, 6, 1297–303.
22. J. A. Queiroz, C. T. Tomaz and J. M. Cabral, J. Biotechnol., 2001,
87, 143–59.
23. M. M. Diogo, J. A. Queiroz, G. A. Monteiro, S. A. Martins, G. N.
Ferreira and D. M. Prazeres, Biotechnol. Bioeng., 2000, 68, 576–83.
24. H. G. Barth, B. E. Boyes and C. Jackson, Anal. Chem., 1998,
70, 251R–78R.
25. H. G. Barth and G. D. Saunders, LC GC N. Am., 2006, 24, 38.
26. T. M. Przybycien, N. S. Pujar and L. M. Steele, Curr. Opin. Bio-
technol., 2004, 15, 469–78.
27. F. B. Anspach, D. Curbelo, R. Hartmann, G. Garke and W.-D.
Deckwer, J. Chromatogr. A, 1999, 865, 129–44.
28. A. Suding and M. Tomusiak, Abstr. Pap. Am. Chem. Soc., 1993,
205, 61–BTEC.
29. N. M. Draeger and H. A. Chase, Bioseparation, 1991, 2, 67–80.
30. Y. Gonzalez, N. Ibarra, H. Gomez, M. Gonzalez, L. Dorta,
S. Padilla and R. Valdes, J. Chromatogr. B, 2003, 784, 183–7.
31. P. Brixius, I. Mollerup, O. E. Jensen, M. Halfar, J. Thommes and
M. R. Kula, Biotechnol. Bioeng., 2006, 93, 14–20.
32. D. Balasubramaniam, C. Wilkinson, K. Van Cott and C. Zhang,
J. Chromatogr. A, 2003, 989, 119–29.
33. R. M. Banik, A. Santhiagu, B. Kanari, C. Sabarinath and S. N.
Upadhyay, World J. Microbiol. Biotechnol., 2003, 19, 337–48.
34. R. Ghosh, J. Chromatogr. A, 2002, 952, 13–27.
35. H. N. Endres, J. A. C. Johnson, C. A. Ross, J. K. Welp and M. R.
Etzel, Biotechnol. Appl. Biochem., 2003, 37, 259–66.
511Downstream Processing

36. R. van Reis and A. Zydney, Curr. Opin. Biotechnol., 2001,
12, 208–11.
37. E. K. Lee and W. S. Kim, Biotechnol. Bioprocess., 2003, 27,
277–320.
38. S. Schmidt, D. Havekost, K. Kaiser, J. Kauling and H. K. Henzler,
Eng. Life Sci., 2005, 5, 273–76.
39. V. Klyushnichenko, Curr. Opin. Drug Discov. Dev., 2003, 6, 848–54.
40. M. Vodopivec, A. Podgornik, M. Berovic and A. Strancar,
J. Chromatogr. B, 2003, 795, 105–13.
41. A. Jungbauer and R. Hahn, J. Sep. Sci., 2004, 27, 767–78.
42. J. Urthalera, R. Schlegl, A. Podgornik, A. Strancar, A. Jungbauer
and R. Necina, J. Chromatogr. A, 2005, 1065, 93–106.
43. M. E. Cromwell, E. Hilario and F. Jacobson, Aaps J., 2006,
8, E572–9.
44. N. B. Jackson, J. M. Liddell and G. J. Lye, J. Membr. Sci., 2006,
276, 31–41.
45. T. Reynolds, M. Boychyn, T. Sanderson, M. Bulmer, J. More and
M. Hoare, Biotechnol. Bioeng., 2003, 83, 454–64.
46. M. Boychyn, S. S. Yim, M. Bulmer, J. More, D. G. Bracewell and
M. Hoare, Bioprocess Biosyst. Eng., 2004, 26, 385–91.
47. N. Hutchinson, N. Bingham, N. Murrell, S. Farid and M. Hoare,
Biotechnol. Bioeng., 2006, 95, 483–91.
48. M. D. Wenger, P. DePhillips, C. E. Price and D. G. Bracewell,
Biotechnol. Appl. Biochem., 2007, 47, 131–9.
49. G. Sofer and L. Hagel, Handbook of Process Chromatography:
a Guide to Optimisation, Scale-up and Validation, Academic Press,
San Diego, 1997.
50. G. K. Sofer and D. W. Zabriskie, Biopharmaceutical Process
Validation, Marcel Dekker, New York, 2000.
51. S. Kozlowski and P. Swann, Adv. Drug Deliv. Rev., 2006,
58, 707–22.
52. A. L. Daugherty and R. J. Mrsny, Adv. Drug Deliv. Rev., 2006,
58, 686–706.
53. C. M. Smales, D. S. Pepper and D. C. James, Biotechnol. Bioeng.,
2000, 67, 177–88.
54. M. Micheletti and G. J. Lye, Curr. Opin. Biotechnol., 2006,
17, 611–8.
512 Chapter 17
CHAPTER 18
Biosensors
MARTIN F. CHAPLIN
London South Bank University, Borough Road, London SE1 0AA, UK
18.1 INTRODUCTION
Biosensors are analytical devices that convert biological actions into
electrical signals in order to quantify them.1–3 In this chapter, only
biosensors that make use of the specificity of biological processes are
described, that is, the recognition of enzymes for their substrates or
other ligands, antibodies for their antigens, lectins for carbohydrates
and nucleic acids or peptide nucleic acids for their complementary
sequences. Biosensor science is interdisciplinary, bringing together
chemistry, physics, biology, electronics and engineering to solve real-
world analytical problems. The parts of a typical biosensor are shown in
Figure 18.1.4
The primary advantage of using biologically active molecules as part
of a biosensor is due to their high specificity and, hence, high dis-
criminatory power. Thus, they are generally able to detect particular
molecular species from within complex mixtures of other materials with
similar structure that may be present at comparable or substantially
higher concentrations. Often, samples can be analysed with little or no
prior clean-up. In this respect they show distinct advantages over most
‘traditional’ analytical methods; for example, colorimetric assays such as
the Lowry assay for proteins.
Molecular Biology and Biotechnology, 5th Edition
Edited by John M Walker and Ralph Rapleyr Royal Society of Chemistry 2009
Published by the Royal Society of Chemistry, www.rsc.org
513
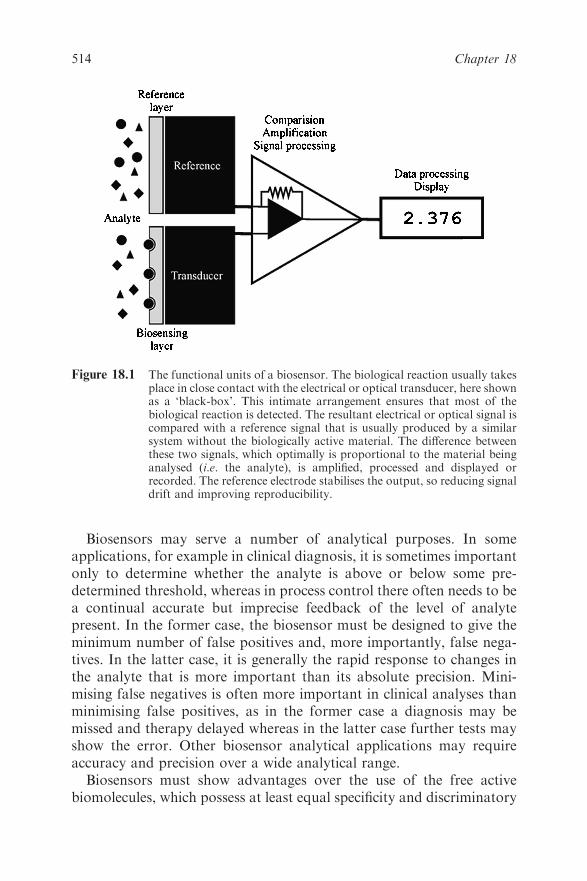
Biosensors may serve a number of analytical purposes. In some
applications, for example in clinical diagnosis, it is sometimes important
only to determine whether the analyte is above or below some pre-
determined threshold, whereas in process control there often needs to be
a continual accurate but imprecise feedback of the level of analyte
present. In the former case, the biosensor must be designed to give the
minimum number of false positives and, more importantly, false nega-
tives. In the latter case, it is generally the rapid response to changes in
the analyte that is more important than its absolute precision. Mini-
mising false negatives is often more important in clinical analyses than
minimising false positives, as in the former case a diagnosis may be
missed and therapy delayed whereas in the latter case further tests may
show the error. Other biosensor analytical applications may require
accuracy and precision over a wide analytical range.
Biosensors must show advantages over the use of the free active
biomolecules, which possess at least equal specificity and discriminatory
Figure 18.1 The functional units of a biosensor. The biological reaction usually takesplace in close contact with the electrical or optical transducer, here shownas a ‘black-box’. This intimate arrangement ensures that most of thebiological reaction is detected. The resultant electrical or optical signal iscompared with a reference signal that is usually produced by a similarsystem without the biologically active material. The difference betweenthese two signals, which optimally is proportional to the material beinganalysed (i.e. the analyte), is amplified, processed and displayed orrecorded. The reference electrode stabilises the output, so reducing signaldrift and improving reproducibility.
514 Chapter 18
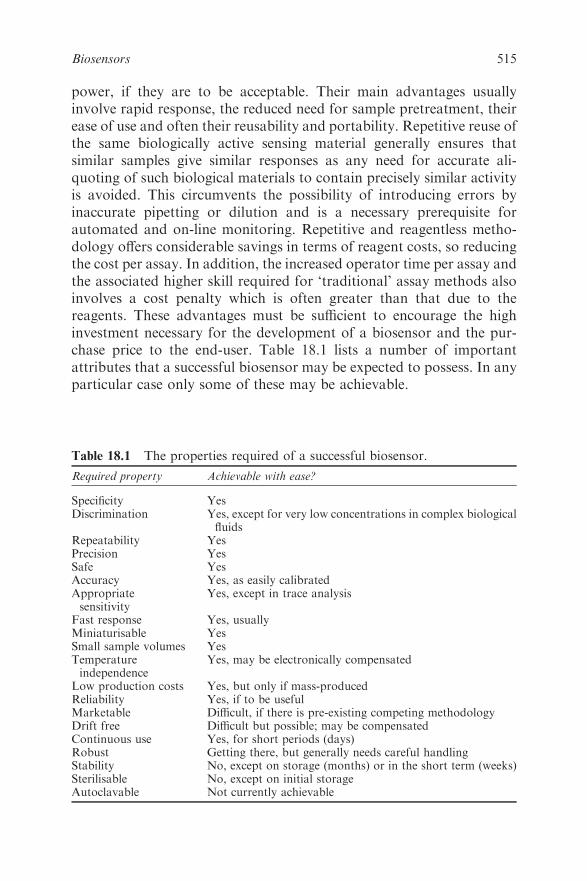
power, if they are to be acceptable. Their main advantages usually
involve rapid response, the reduced need for sample pretreatment, their
ease of use and often their reusability and portability. Repetitive reuse of
the same biologically active sensing material generally ensures that
similar samples give similar responses as any need for accurate ali-
quoting of such biological materials to contain precisely similar activity
is avoided. This circumvents the possibility of introducing errors by
inaccurate pipetting or dilution and is a necessary prerequisite for
automated and on-line monitoring. Repetitive and reagentless metho-
dology offers considerable savings in terms of reagent costs, so reducing
the cost per assay. In addition, the increased operator time per assay and
the associated higher skill required for ‘traditional’ assay methods also
involves a cost penalty which is often greater than that due to the
reagents. These advantages must be sufficient to encourage the high
investment necessary for the development of a biosensor and the pur-
chase price to the end-user. Table 18.1 lists a number of important
attributes that a successful biosensor may be expected to possess. In any
particular case only some of these may be achievable.
Table 18.1 The properties required of a successful biosensor.
Required property Achievable with ease?
Specificity YesDiscrimination Yes, except for very low concentrations in complex biological
fluidsRepeatability YesPrecision YesSafe YesAccuracy Yes, as easily calibratedAppropriatesensitivity
Yes, except in trace analysis
Fast response Yes, usuallyMiniaturisable YesSmall sample volumes YesTemperatureindependence
Yes, may be electronically compensated
Low production costs Yes, but only if mass-producedReliability Yes, if to be usefulMarketable Difficult, if there is pre-existing competing methodologyDrift free Difficult but possible; may be compensatedContinuous use Yes, for short periods (days)Robust Getting there, but generally needs careful handlingStability No, except on storage (months) or in the short term (weeks)Sterilisable No, except on initial storageAutoclavable Not currently achievable
515Biosensors
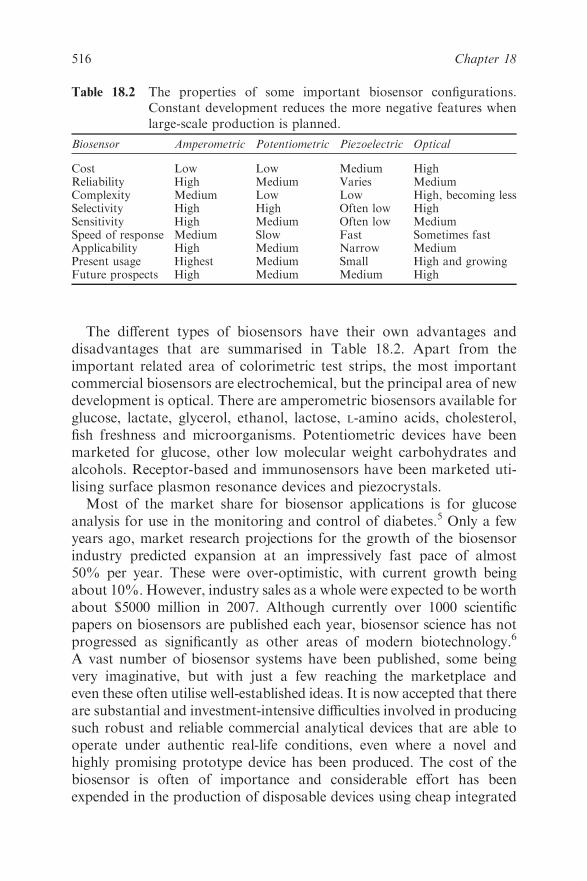
The different types of biosensors have their own advantages and
disadvantages that are summarised in Table 18.2. Apart from the
important related area of colorimetric test strips, the most important
commercial biosensors are electrochemical, but the principal area of new
development is optical. There are amperometric biosensors available for
glucose, lactate, glycerol, ethanol, lactose, L-amino acids, cholesterol,
fish freshness and microorganisms. Potentiometric devices have been
marketed for glucose, other low molecular weight carbohydrates and
alcohols. Receptor-based and immunosensors have been marketed uti-
lising surface plasmon resonance devices and piezocrystals.
Most of the market share for biosensor applications is for glucose
analysis for use in the monitoring and control of diabetes.5 Only a few
years ago, market research projections for the growth of the biosensor
industry predicted expansion at an impressively fast pace of almost
50% per year. These were over-optimistic, with current growth being
about 10%. However, industry sales as a whole were expected to be worth
about $5000 million in 2007. Although currently over 1000 scientific
papers on biosensors are published each year, biosensor science has not
progressed as significantly as other areas of modern biotechnology.6
A vast number of biosensor systems have been published, some being
very imaginative, but with just a few reaching the marketplace and
even these often utilise well-established ideas. It is now accepted that there
are substantial and investment-intensive difficulties involved in producing
such robust and reliable commercial analytical devices that are able to
operate under authentic real-life conditions, even where a novel and
highly promising prototype device has been produced. The cost of the
biosensor is often of importance and considerable effort has been
expended in the production of disposable devices using cheap integrated
Table 18.2 The properties of some important biosensor configurations.
Constant development reduces the more negative features when
large-scale production is planned.
Biosensor Amperometric Potentiometric Piezoelectric Optical
Cost Low Low Medium HighReliability High Medium Varies MediumComplexity Medium Low Low High, becoming lessSelectivity High High Often low HighSensitivity High Medium Often low MediumSpeed of response Medium Slow Fast Sometimes fastApplicability High Medium Narrow MediumPresent usage Highest Medium Small High and growingFuture prospects High Medium Medium High
516 Chapter 18
chip technology; disposable technology offering opportunities for con-
tinuing and increased revenue. Such silicon-based methodology7 has
opened up the possibility of having a number of different sensors on one
device, allowing multi-parameter assays. A realistic target for the future is
a density of a million sensors per square centimetre. However, there must
be a demand for very large numbers of such devices in order for their
production to be economically viable. Relatively unsophisticated pro-
cesses, involving screen printing or ink-jet technologies, are currently
preferred, due to their lower start-up costs, whereas photolithography can
be used for the production of sub-micron structures with well-defined
geometry.
By far the largest biosensor application area is in clinical diagnostics.
This includes monitoring of critical metabolites during surgery. The
major target markets are concerned with use for self-testing at home,
within the physician’s office for screening and within casualty and other
hospital departments for point-of-care diagnosis. These application
areas are potentially very wide. The use of rapid biosensor techniques in
doctors’ surgeries and in hospitals avoids the need for expensive and,
most importantly, time-consuming testing at central clinical labora-
tories. Thus diagnosis and treatment may start during the first visit of a
patient. This removes the need to wait for a return visit after the clinical
tests have been completed elsewhere and allowing time, perhaps, for the
patient’s condition to deteriorate somewhat. Also, there is less like-
lihood of the sample being mishandled or contaminated. As an example,
testing for diabetes using glucose biosensors is now routine even if a
patient has an apparently unrelated complaint. Centralised clinical
analytical facilities remain a necessity due to the need, in many cases, for
multiple different analyses on the same sample and difficulties such as
regulatory compliance. Legislation and the increasing possibility of
medical malpractice claims often impose stringent quality assurance and
control standards on clinical analyses. This makes it much more
expensive to bring novel clinical biosensors to the marketplace today
than in the past, but generally allows those biosensors that are already
established, giving them a distinct competitive edge.
Home diagnosis and testing is an area that is being opened up by, for
example, pregnancy and ovulation test kits, blood cholesterol testing
and diabetes control.8 Clearly, there are risks and problems involved
with their more widespread use, but many people prefer to use them as
indications for whether a trip to the doctor’s surgery is really necessary
or not. As counselling may be necessary with some potential home
diagnosis applications (for example, cancer and AIDS), controversy
exists over their development.
517Biosensors
One of the major potential uses for biosensors is for in vivo applica-
tions such as for the close control of diabetes. The purpose here is to
monitor continuously the levels of metabolites such that corrective
action can be employed immediately when necessary. Clearly, such
biosensors must be biocompatible and miniaturised so that they are
implantable. In addition, they should be reagentless, the reaction being
controlled only by the presence of the metabolite and the stabilised
bioreagent. The signal generated must be drift free over the period of
interest. At the present time, such biosensors have a relatively short
lifespan of a few days at most, due mainly to problems which arise from
the body’s response.
Industrial analyses involve food, cosmetics and fermentation process
control and quality control and monitoring. The defence industry is
interested in detectors for explosives, nerve gases and microbial spores
and toxins. Environmental uses of biosensors are mainly in areas of water
quality and pollution control. A typical application might be to detect
parts per million of particular molecular species such as an industrial
toxin within the highly complex mixtures produced as process effluent.
18.2 THE BIOLOGICAL REACTION
An important factor in most biosensor configurations is the sensing
surface. This normally consists of a thin layer of biologically active
material in intimate contact with the electronic or optical transducer. In
some cases the biological material may be covalently or non-covalently
attached to the surface, but often in electrochemical biosensors it forms
part of a thin membrane covering the sensing surface. Generally, the
conversion of the biological process into an electronic or optical signal is
most efficient where there is minimal distance between where the bio-
logical reaction or binding takes place and where the electronic trans-
duction takes place. In addition, it is important for the retention of
biological activity that the biological material is not lost into analyte
solutions. The immobilisation technology for holding the biocatalyst in
place is extensive, with examples of immobilisation methods summarised
in Table 18.3. Much current research is directed at stabilising enzymes
for use in biosensors.9 At a suitable pH, polyelectrolytes such as die-
thylaminoethyldextran wrap around enzymes, restricting their move-
ment and reducing their tendency to denature. Polyelectrolytes in
combination with polyalcohols, such as sorbitol and lactitol, have been
shown to stabilise enzymes considerably against thermal inactivation for
use in biosensors. More recently, enzymes have been specifically engi-
neered for their use in biosensors.
518 Chapter 18

18.3 THEORY
In the absence of diffusion effects (see later), most biological reactions
and binding processes can be described in terms of saturation kinetics:
biological materialþ analyte Ð bound analyte ð1Þ
The bound analyte is then detected optically or by weight or gives rise to a
biological action, so generating the electronic response. This electronic or
optical response varies with the extent of binding or biological response,
which, in turn, varies with the concentration of the bound analyte. Apart
from the logarithmic relationship in potentiometric biosensors, the optical,
biological and electronic responses are often proportional:
bound analyte ! biological or optical response ! electronic response
electronic response
¼ðmaximum electronic response possibleÞ � ðanalyte concentrationÞ
ðhalf- saturation constantÞ þ ðanalyte concentrationÞ
ð2Þ
where the half-saturation constant is equal to the analyte concen-
tration which gives rise to half the maximum electronic response possible
(Figure 18.2). The response is linear, to within 95%, at analyte con-
centrations up to about one-twentieth of the half-saturation constant.
Table 18.3 Examples of biosensor immobilisation methods.
Physical entrapmentBiologically active material held next to the sensing surface by a semipermeable mem-brane that prevents it from escaping to the bulk phase but allows passage of theanalyte. Often this membrane is synthesised in situ and sometimes it is made such thatit increases the specificity of the sensing or reduces unwanted side-reactions. This isusually a simple and inexpensive method
Non-covalent bindingAdsorption of proteins on a porous carbon or silicon electrode. This may suffer fromgradual leaching of the enzyme to the bulk phase
Covalent bindingTreatment of the biosensor surface with 3-aminopropyltriethoxysilane followed bycoupling of biologically active material to the reactive amino groups remaining on thecross-linked siloxane surface. Proteins may be attached by use of carbodiimides, whichform amide links between amines and carboxylic acids. Such methods permanentlyattach the biological material but are difficult to reproduce exactly and sometimescause a large reduction in activity
Membrane entrapmentCross-linking of proteins with glutaraldehyde within a cellulose or nylon supporting net.Due to limiting diffusion, this method can only be used for low molecular weight analytes
519Biosensors
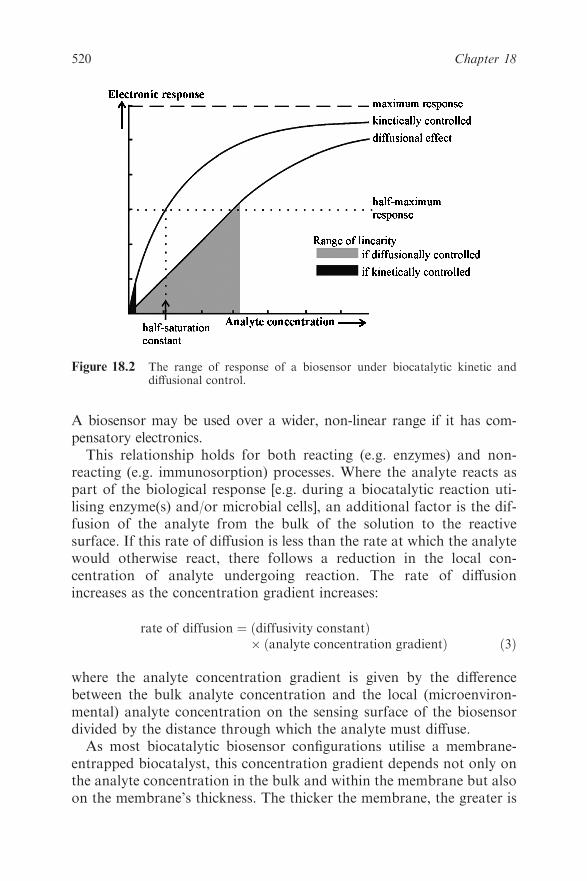
A biosensor may be used over a wider, non-linear range if it has com-
pensatory electronics.
This relationship holds for both reacting (e.g. enzymes) and non-
reacting (e.g. immunosorption) processes. Where the analyte reacts as
part of the biological response [e.g. during a biocatalytic reaction uti-
lising enzyme(s) and/or microbial cells], an additional factor is the dif-
fusion of the analyte from the bulk of the solution to the reactive
surface. If this rate of diffusion is less than the rate at which the analyte
would otherwise react, there follows a reduction in the local con-
centration of analyte undergoing reaction. The rate of diffusion
increases as the concentration gradient increases:
rate of diffusion ¼ ðdiffusivity constantÞ� ðanalyte concentration gradientÞ ð3Þ
where the analyte concentration gradient is given by the difference
between the bulk analyte concentration and the local (microenviron-
mental) analyte concentration on the sensing surface of the biosensor
divided by the distance through which the analyte must diffuse.
As most biocatalytic biosensor configurations utilise a membrane-
entrapped biocatalyst, this concentration gradient depends not only on
the analyte concentration in the bulk and within the membrane but also
on the membrane’s thickness. The thicker the membrane, the greater is
Figure 18.2 The range of response of a biosensor under biocatalytic kinetic anddiffusional control.
520 Chapter 18
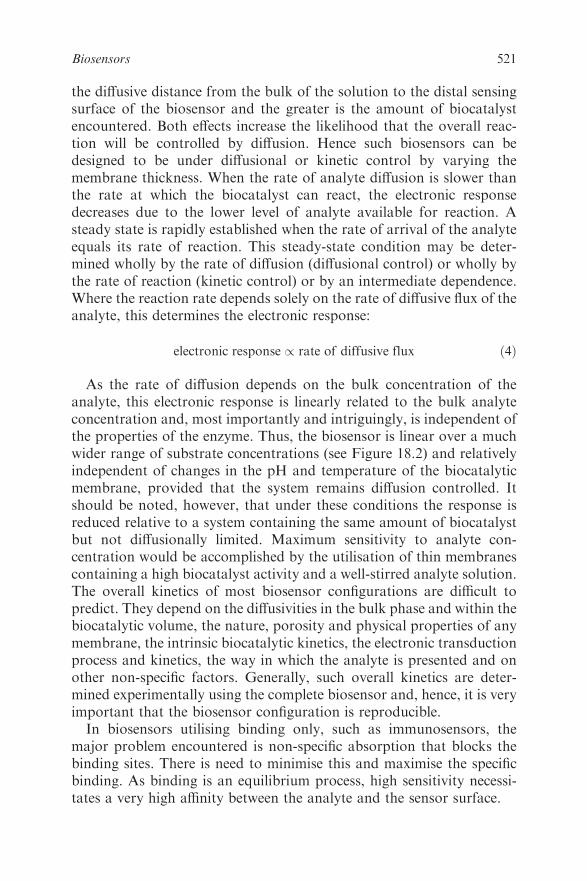
the diffusive distance from the bulk of the solution to the distal sensing
surface of the biosensor and the greater is the amount of biocatalyst
encountered. Both effects increase the likelihood that the overall reac-
tion will be controlled by diffusion. Hence such biosensors can be
designed to be under diffusional or kinetic control by varying the
membrane thickness. When the rate of analyte diffusion is slower than
the rate at which the biocatalyst can react, the electronic response
decreases due to the lower level of analyte available for reaction. A
steady state is rapidly established when the rate of arrival of the analyte
equals its rate of reaction. This steady-state condition may be deter-
mined wholly by the rate of diffusion (diffusional control) or wholly by
the rate of reaction (kinetic control) or by an intermediate dependence.
Where the reaction rate depends solely on the rate of diffusive flux of the
analyte, this determines the electronic response:
electronic response / rate of diffusive flux ð4Þ
As the rate of diffusion depends on the bulk concentration of the
analyte, this electronic response is linearly related to the bulk analyte
concentration and, most importantly and intriguingly, is independent of
the properties of the enzyme. Thus, the biosensor is linear over a much
wider range of substrate concentrations (see Figure 18.2) and relatively
independent of changes in the pH and temperature of the biocatalytic
membrane, provided that the system remains diffusion controlled. It
should be noted, however, that under these conditions the response is
reduced relative to a system containing the same amount of biocatalyst
but not diffusionally limited. Maximum sensitivity to analyte con-
centration would be accomplished by the utilisation of thin membranes
containing a high biocatalyst activity and a well-stirred analyte solution.
The overall kinetics of most biosensor configurations are difficult to
predict. They depend on the diffusivities in the bulk phase and within the
biocatalytic volume, the nature, porosity and physical properties of any
membrane, the intrinsic biocatalytic kinetics, the electronic transduction
process and kinetics, the way in which the analyte is presented and on
other non-specific factors. Generally, such overall kinetics are deter-
mined experimentally using the complete biosensor and, hence, it is very
important that the biosensor configuration is reproducible.
In biosensors utilising binding only, such as immunosensors, the
major problem encountered is non-specific absorption that blocks the
binding sites. There is need to minimise this and maximise the specific
binding. As binding is an equilibrium process, high sensitivity necessi-
tates a very high affinity between the analyte and the sensor surface.
521Biosensors
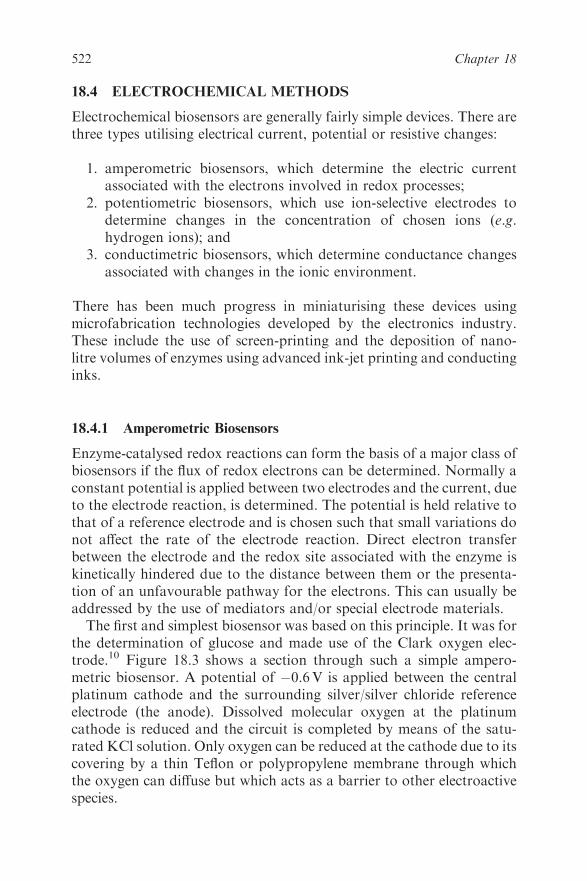
18.4 ELECTROCHEMICAL METHODS
Electrochemical biosensors are generally fairly simple devices. There are
three types utilising electrical current, potential or resistive changes:
1. amperometric biosensors, which determine the electric current
associated with the electrons involved in redox processes;
2. potentiometric biosensors, which use ion-selective electrodes to
determine changes in the concentration of chosen ions (e.g.
hydrogen ions); and
3. conductimetric biosensors, which determine conductance changes
associated with changes in the ionic environment.
There has been much progress in miniaturising these devices using
microfabrication technologies developed by the electronics industry.
These include the use of screen-printing and the deposition of nano-
litre volumes of enzymes using advanced ink-jet printing and conducting
inks.
18.4.1 Amperometric Biosensors
Enzyme-catalysed redox reactions can form the basis of a major class of
biosensors if the flux of redox electrons can be determined. Normally a
constant potential is applied between two electrodes and the current, due
to the electrode reaction, is determined. The potential is held relative to
that of a reference electrode and is chosen such that small variations do
not affect the rate of the electrode reaction. Direct electron transfer
between the electrode and the redox site associated with the enzyme is
kinetically hindered due to the distance between them or the presenta-
tion of an unfavourable pathway for the electrons. This can usually be
addressed by the use of mediators and/or special electrode materials.
The first and simplest biosensor was based on this principle. It was for
the determination of glucose and made use of the Clark oxygen elec-
trode.10 Figure 18.3 shows a section through such a simple ampero-
metric biosensor. A potential of �0.6V is applied between the central
platinum cathode and the surrounding silver/silver chloride reference
electrode (the anode). Dissolved molecular oxygen at the platinum
cathode is reduced and the circuit is completed by means of the satu-
rated KCl solution. Only oxygen can be reduced at the cathode due to its
covering by a thin Teflon or polypropylene membrane through which
the oxygen can diffuse but which acts as a barrier to other electroactive
species.
522 Chapter 18
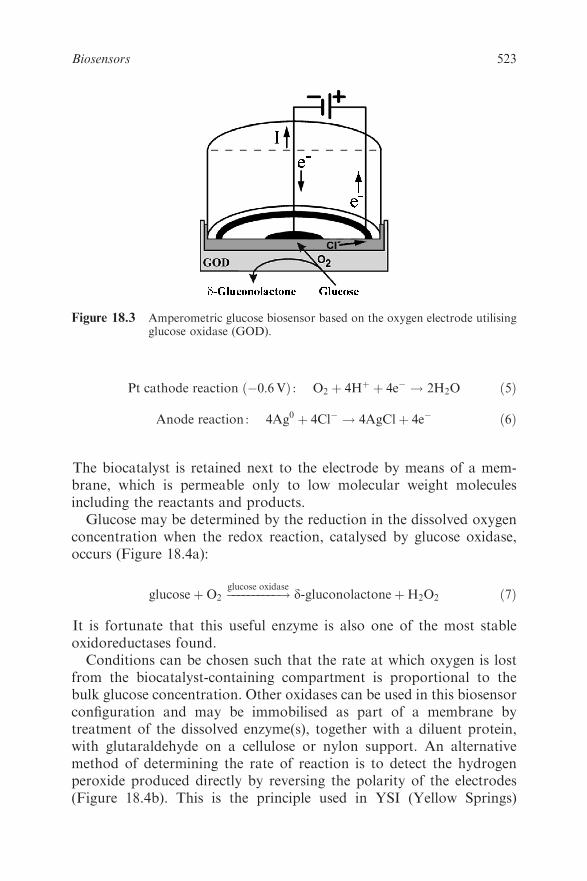
Pt cathode reaction ð�0:6VÞ : O2 þ 4Hþ þ 4e� ! 2H2O ð5Þ
Anode reaction : 4Ag0 þ 4Cl� ! 4AgClþ 4e� ð6Þ
The biocatalyst is retained next to the electrode by means of a mem-
brane, which is permeable only to low molecular weight molecules
including the reactants and products.
Glucose may be determined by the reduction in the dissolved oxygen
concentration when the redox reaction, catalysed by glucose oxidase,
occurs (Figure 18.4a):
glucoseþO2 ����������!glucose oxidase
d-gluconolactoneþH2O2 ð7Þ
It is fortunate that this useful enzyme is also one of the most stable
oxidoreductases found.
Conditions can be chosen such that the rate at which oxygen is lost
from the biocatalyst-containing compartment is proportional to the
bulk glucose concentration. Other oxidases can be used in this biosensor
configuration and may be immobilised as part of a membrane by
treatment of the dissolved enzyme(s), together with a diluent protein,
with glutaraldehyde on a cellulose or nylon support. An alternative
method of determining the rate of reaction is to detect the hydrogen
peroxide produced directly by reversing the polarity of the electrodes
(Figure 18.4b). This is the principle used in YSI (Yellow Springs)
Figure 18.3 Amperometric glucose biosensor based on the oxygen electrode utilisingglucose oxidase (GOD).
523Biosensors
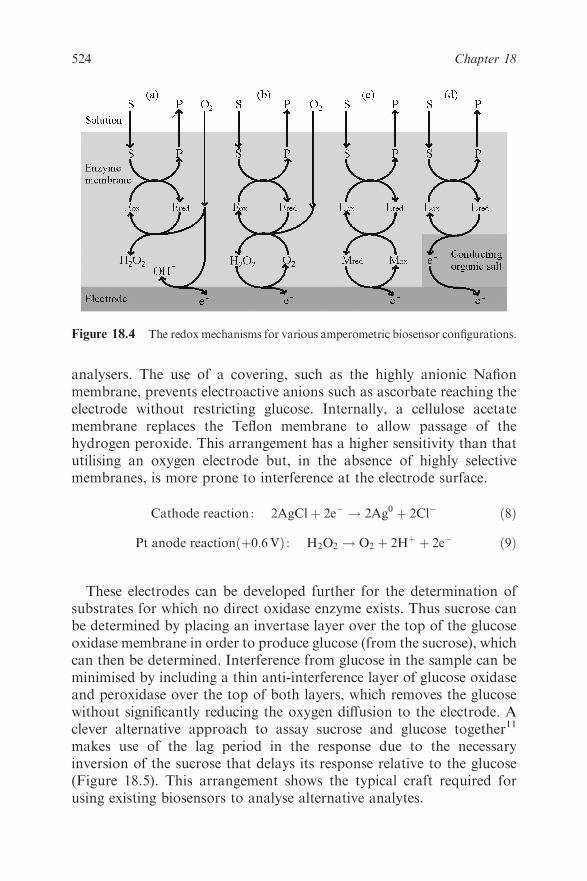
analysers. The use of a covering, such as the highly anionic Nafion
membrane, prevents electroactive anions such as ascorbate reaching the
electrode without restricting glucose. Internally, a cellulose acetate
membrane replaces the Teflon membrane to allow passage of the
hydrogen peroxide. This arrangement has a higher sensitivity than that
utilising an oxygen electrode but, in the absence of highly selective
membranes, is more prone to interference at the electrode surface.
Cathode reaction : 2AgClþ 2e� ! 2Ag0 þ 2Cl� ð8Þ
Pt anode reactionðþ0:6VÞ : H2O2 ! O2 þ 2Hþ þ 2e� ð9Þ
These electrodes can be developed further for the determination of
substrates for which no direct oxidase enzyme exists. Thus sucrose can
be determined by placing an invertase layer over the top of the glucose
oxidase membrane in order to produce glucose (from the sucrose), which
can then be determined. Interference from glucose in the sample can be
minimised by including a thin anti-interference layer of glucose oxidase
and peroxidase over the top of both layers, which removes the glucose
without significantly reducing the oxygen diffusion to the electrode. A
clever alternative approach to assay sucrose and glucose together11
makes use of the lag period in the response due to the necessary
inversion of the sucrose that delays its response relative to the glucose
(Figure 18.5). This arrangement shows the typical craft required for
using existing biosensors to analyse alternative analytes.
Figure 18.4 The redoxmechanisms for various amperometric biosensor configurations.
524 Chapter 18

Many biochemicals may be analysed using similar biosensors. One
interesting example is the biosensor for determining the artificial
sweetener aspartame in soft drinks, where three enzymes are necessary in
the sensing membrane in order to produce the H2O2 for the electrode
reaction:
aspartameþH2O �����!peptidase
L-aspartateþ L-phenylalanine methyl ester ð10Þ
L-aspartateþ a-ketoglutarate ��������������������!aspartate aminotransferase
L-glutamate
þ oxaloacetate ð11Þ
L-glutamateþO2 þH2O ������������!glutamate oxidase
a-ketoglutarateþNHþ4 þH2O2 ð12Þ
Fish freshness can be determined using a similar concept; the
nucleotides in fish changing due to a series of reactions after death. Fish
freshness can be quantified in terms of its K value, where
K ¼HxRþHxð Þ � 100
ATPþADPþAMP þ IMPþHxRþHxð13Þ
Figure 18.5 A kinetically controlled anti-interference membrane for sucrose. Thesample is presented as a rapid pulse of material in the flowing stream.Use of phosphate buffer, which catalyses mutarotation, removes the needfor the mutarotase enzyme.
525Biosensors

where HxR, IMP and Hx represent inosine, inosine-50-monophosphate
and hypoxanthine, respectively. After fish die, their ATP undergoes
catabolic degradation through a series of reactions:
ATP ! ADP ! AMP ! IMP ! HxR ! Hx ! xanthine ! uric acid ð14Þ
The accumulation of the intermediates inosine and hypoxanthine rela-
tive to the nucleotides is an indicator of how long the fish has been dead
and its handling and storage conditions and hence its freshness.
A commercialised fish freshness biosensor has been devised which uti-
lises a triacylcellulose membrane containing immobilised nucleoside
phosphorylase and xanthine oxidase over an oxygen electrode:
inosineþ phosphate ������������������!nucleoside phosphorylase
hypoxanthine
þ ribose phosphate ð15Þ
hypoxanthineþO2 �����������!xanthine oxidase
xanthineþH2O2 ð16Þ
xanthineþO2 �����������!xanthine oxidase
uric acidþH2O2 ð17Þ
The electrode may be used to determine the reduction in oxygen12 or
the increase in hydrogen peroxide. The inosine content may be deter-
mined after the hypoxanthine content by the addition of the necessary
phosphate. The nucleotides can be determined using the same electrode
and sample, subsequent to the addition of nucleotidase and adenosine
deaminase. Typically, K values below 20 show the fish is very fresh and
may be eaten raw. Fish with a K value between 20 and 40 must be
cooked but those with a K value above 40 are not fit for human con-
sumption. Critical K values vary amongst species, but can be a reliable
indicator applicable to frozen, smoked or fish stored under modified
atmospheres. Clearly, a relatively simple probe that accurately and
reproducibly determines fish freshness has significant economic impor-
tance to the fish industry. In its absence, freshness is determined com-
pletely subjectively by inspection.
Although such biosensors are easy to produce, they do suffer from
some significant drawbacks. The reaction is dependent on the con-
centration of molecular oxygen, which precludes its use in oxygen-
deprived environments such as in vivo. Also, the potential used is suffi-
cient to cause other redox processes to occur, such as ascorbate oxida-
tion/reduction, which may interfere with the analyses. Much research
has been undertaken on the development of substances that can replace
oxygen in these reactions.13 Generally, oxidases are far more specific for
526 Chapter 18

the oxidisable reactant than they are for molecular oxygen itself as the
oxidant. Many other materials can act as the oxidant. The optimal
properties of such materials include fast electron transfer rates, the
ability to be easily regenerated by an electrode reaction and retention
within the biocatalytic membrane. In addition, they should not react
with other molecules, including molecular oxygen that may be present.
Many such oxidants, now called mediators, have been developed. Their
redox reactions, which together transfer the electrons from the substrate
to the electrode, so producing the electrical signal, are summarised in
Figure 18.6. As they allow reduced working potentials, interference from
natural redox materials is reduced.
The mediated biosensor reaction consists of three redox processes:
substrateðreducedÞ þ enzymeðoxidisedÞ �����������!enzyme reaction
productðoxidisedÞþ enzymeðreducedÞ ð18Þ
enzymeðreducedÞ þmediatorðoxidisedÞ �����������!enzyme reaction
enzymeðoxidisedÞþmediatorðreducedÞ ð19Þ
mediatorðreducedÞ ������������!electrode reaction
mediatorðoxidisedÞ þ e� ð20Þ
When a steady-state response has been obtained, the rates of all of
these processes and the rate of the diffusive flux in must be equal (see
Figure 18.4c). Any of these, or a combination, may be the controlling
factor. Although the level of response is reproducible, it is therefore
difficult to predict its magnitude.
Several blood glucose biosensors, for the control of diabetes, have
been built and marketed based on this mediated system (Figure 18.7).
The sensing area is a single-use disposable electrode, typically produced
by screen-printing on to a plastic strip and consisting of an Ag/AgCl
reference electrode and a carbon working electrode containing glucose
oxidase and a derivatised ferrocene mediator. Both electrodes are cov-
ered with wide-mesh hydrophilic gauze to permit even spreading of a
blood drop sample and to prevent localised cooling effects due to uneven
evaporation. The electrodes are kept dry until use and have a shelf-life of
6 months when sealed in aluminium foil. They can detect glucose con-
centrations of 2–25mM in single tiny drops of blood (1–4 ml) and
accurately display the result within 5–40 s. The pricing is such that the
biosensor is sold cheaply with the major profit arising from the sale of
the necessary disposable electrodes. Such biosensors are currently used
527Biosensors

by millions of people with diabetes in more than 50 countries world-
wide. The profits from this area, although by far the greatest in the
biosensor industry, are levelling off as, while the world diabetic popu-
lation stands at over 200 million and is steadily expanding, diabetic
patients use their biosensors less often when their diabetes appears under
Figure 18.6 The redox reactions of amperometric biosensor mediators. Tetracyano-quinodimethane acts as a partial electron acceptor whereas ferrocene,tetrathiafulvalene and N-methylphenazinium can all act as partial elec-tron donors.
528 Chapter 18

control. Although the subject of much research, the use of continuous
subcutaneous in vivo glucose sensing, using electrode-based biosensors,
has not overcome the difficulties caused by the body’s response and poor
patient acceptability. New non-biosensor technologies are being devel-
oped,14 involving near-infrared light which can penetrate tissue and
detect glucose in the blood, albeit at low sensitivity and in the face of
almost overwhelming interference.
When an oxidase is unable to react rapidly enough with available
mediators, horseradish peroxidase, which rapidly reacts with ferrocene
mediators, can be included with the enzyme. This catalyses the reduction
of the hydrogen peroxide produced by the oxidase and consequent
oxidation of the mediator. In this case, the mediator is acting as an
electron donor rather than acceptor. The oxidised mediator then can be
Figure 18.7 A biosensor for glucose used in diabetes monitoring. A drop of blood isapplied to the disposable electrode at the bottom with its glucose con-centration being produced on the read-out a few seconds later. On theright is a system for the controlled pricking of a finger.
529Biosensors
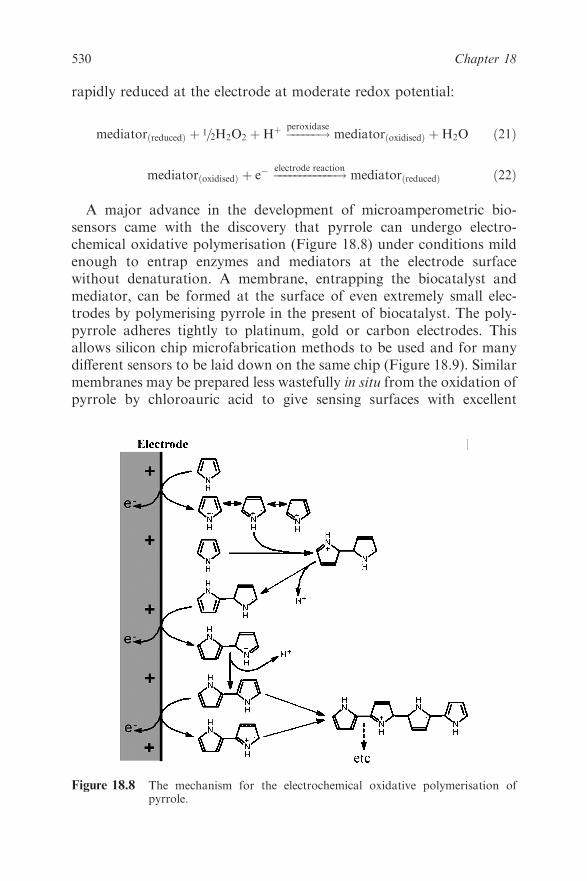
rapidly reduced at the electrode at moderate redox potential:
mediatorðreducedÞ þ 1=2H2O2 þHþ ������!peroxidase
mediatorðoxidisedÞ þH2O ð21Þ
mediatorðoxidisedÞ þ e� ������������!electrode reaction
mediatorðreducedÞ ð22Þ
A major advance in the development of microamperometric bio-
sensors came with the discovery that pyrrole can undergo electro-
chemical oxidative polymerisation (Figure 18.8) under conditions mild
enough to entrap enzymes and mediators at the electrode surface
without denaturation. A membrane, entrapping the biocatalyst and
mediator, can be formed at the surface of even extremely small elec-
trodes by polymerising pyrrole in the present of biocatalyst. The poly-
pyrrole adheres tightly to platinum, gold or carbon electrodes. This
allows silicon chip microfabrication methods to be used and for many
different sensors to be laid down on the same chip (Figure 18.9). Similar
membranes may be prepared less wastefully in situ from the oxidation of
pyrrole by chloroauric acid to give sensing surfaces with excellent
Figure 18.8 The mechanism for the electrochemical oxidative polymerisation ofpyrrole.
530 Chapter 18
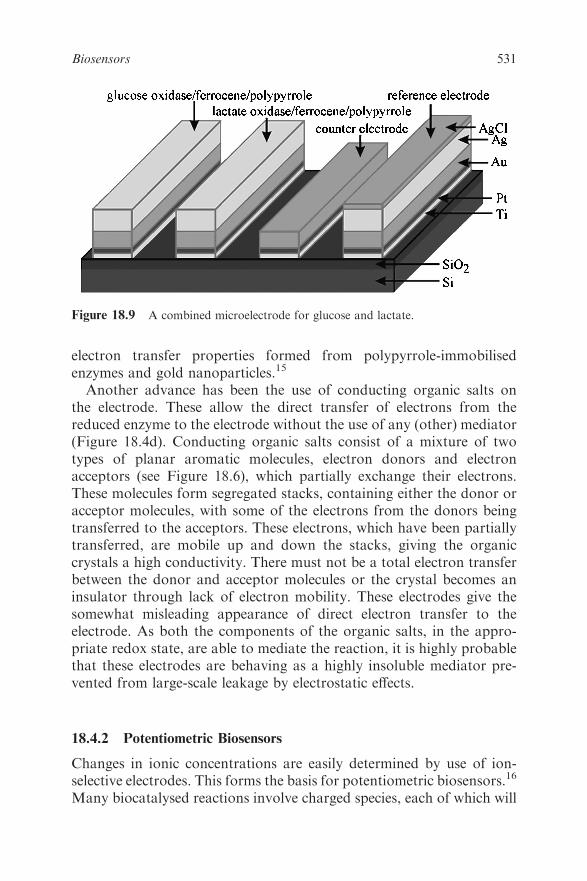
electron transfer properties formed from polypyrrole-immobilised
enzymes and gold nanoparticles.15
Another advance has been the use of conducting organic salts on
the electrode. These allow the direct transfer of electrons from the
reduced enzyme to the electrode without the use of any (other) mediator
(Figure 18.4d). Conducting organic salts consist of a mixture of two
types of planar aromatic molecules, electron donors and electron
acceptors (see Figure 18.6), which partially exchange their electrons.
These molecules form segregated stacks, containing either the donor or
acceptor molecules, with some of the electrons from the donors being
transferred to the acceptors. These electrons, which have been partially
transferred, are mobile up and down the stacks, giving the organic
crystals a high conductivity. There must not be a total electron transfer
between the donor and acceptor molecules or the crystal becomes an
insulator through lack of electron mobility. These electrodes give the
somewhat misleading appearance of direct electron transfer to the
electrode. As both the components of the organic salts, in the appro-
priate redox state, are able to mediate the reaction, it is highly probable
that these electrodes are behaving as a highly insoluble mediator pre-
vented from large-scale leakage by electrostatic effects.
18.4.2 Potentiometric Biosensors
Changes in ionic concentrations are easily determined by use of ion-
selective electrodes. This forms the basis for potentiometric biosensors.16
Many biocatalysed reactions involve charged species, each of which will
Figure 18.9 A combined microelectrode for glucose and lactate.
531Biosensors
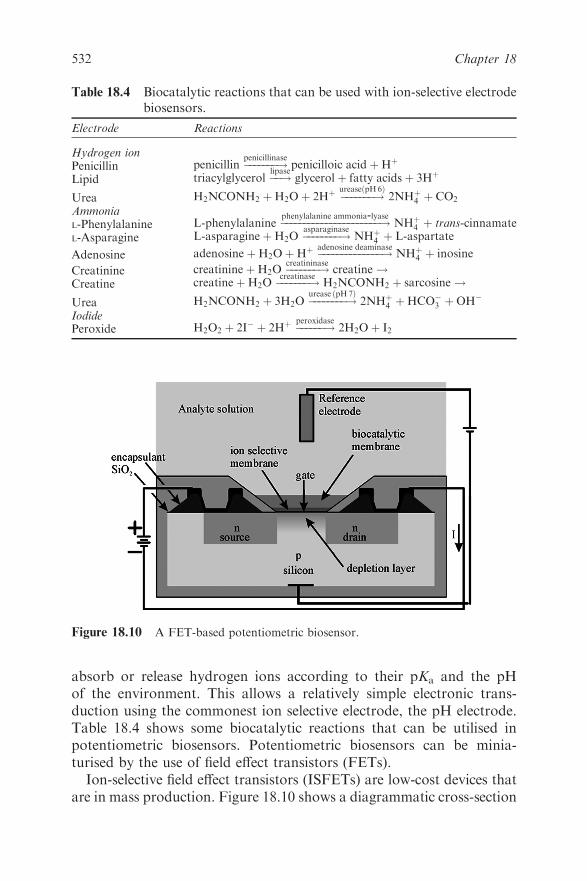
absorb or release hydrogen ions according to their pKa and the pH
of the environment. This allows a relatively simple electronic trans-
duction using the commonest ion selective electrode, the pH electrode.
Table 18.4 shows some biocatalytic reactions that can be utilised in
potentiometric biosensors. Potentiometric biosensors can be minia-
turised by the use of field effect transistors (FETs).
Ion-selective field effect transistors (ISFETs) are low-cost devices that
are in mass production. Figure 18.10 shows a diagrammatic cross-section
Table 18.4 Biocatalytic reactions that can be used with ion-selective electrode
biosensors.
Electrode Reactions
Hydrogen ionPenicillin penicillin �������!
penicillinasepenicilloic acidþHþ
Lipid triacylglycerol ��!lipase
glycerolþ fatty acidsþ 3Hþ
Urea H2NCONH2 þH2Oþ 2Hþ �������!ureaseðpH6Þ
2NHþ4 þ CO2
AmmoniaL-Phenylalanine L-phenylalanine ����������������������!
phenylalanine ammonia-lyaseNHþ
4 þ trans-cinnamate
L-Asparagine L-asparagineþH2O ��������!asparaginase
NHþ4 þ L-aspartate
Adenosine adenosineþH2OþHþ ��������������!adenosine deaminase
NHþ4 þ inosine
Creatinine creatinineþH2O �������!creatininase
creatine !Creatine creatineþH2O �������!
creatinaseH2NCONH2 þ sarcosine !
Urea H2NCONH2 þ 3H2O ��������!urease ðpH7Þ
2NHþ4 þHCO�
3 þOH�
IodidePeroxide H2O2 þ 2I� þ 2Hþ ������!
peroxidase2H2Oþ I2
Figure 18.10 A FET-based potentiometric biosensor.
532 Chapter 18
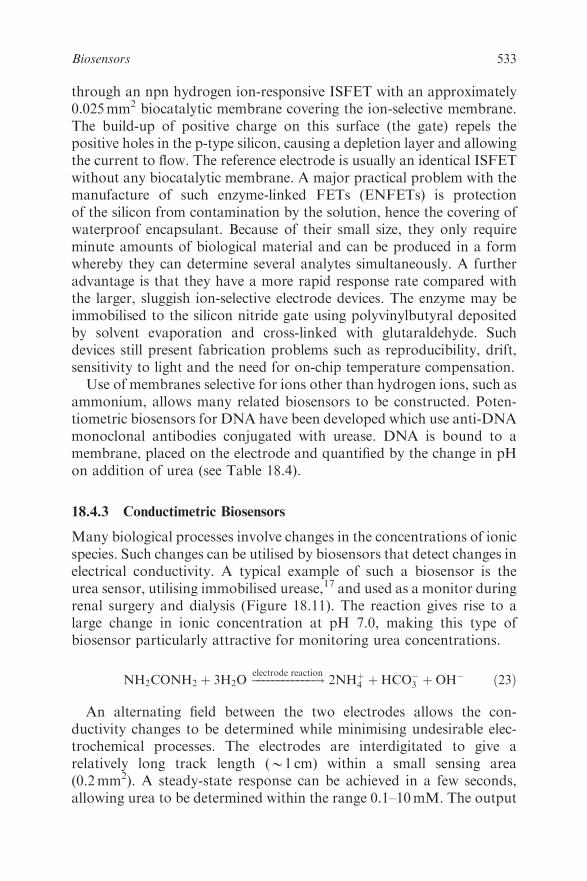
through an npn hydrogen ion-responsive ISFET with an approximately
0.025mm2 biocatalytic membrane covering the ion-selective membrane.
The build-up of positive charge on this surface (the gate) repels the
positive holes in the p-type silicon, causing a depletion layer and allowing
the current to flow. The reference electrode is usually an identical ISFET
without any biocatalytic membrane. A major practical problem with the
manufacture of such enzyme-linked FETs (ENFETs) is protection
of the silicon from contamination by the solution, hence the covering of
waterproof encapsulant. Because of their small size, they only require
minute amounts of biological material and can be produced in a form
whereby they can determine several analytes simultaneously. A further
advantage is that they have a more rapid response rate compared with
the larger, sluggish ion-selective electrode devices. The enzyme may be
immobilised to the silicon nitride gate using polyvinylbutyral deposited
by solvent evaporation and cross-linked with glutaraldehyde. Such
devices still present fabrication problems such as reproducibility, drift,
sensitivity to light and the need for on-chip temperature compensation.
Use of membranes selective for ions other than hydrogen ions, such as
ammonium, allows many related biosensors to be constructed. Poten-
tiometric biosensors for DNA have been developed which use anti-DNA
monoclonal antibodies conjugated with urease. DNA is bound to a
membrane, placed on the electrode and quantified by the change in pH
on addition of urea (see Table 18.4).
18.4.3 Conductimetric Biosensors
Many biological processes involve changes in the concentrations of ionic
species. Such changes can be utilised by biosensors that detect changes in
electrical conductivity. A typical example of such a biosensor is the
urea sensor, utilising immobilised urease,17 and used as a monitor during
renal surgery and dialysis (Figure 18.11). The reaction gives rise to a
large change in ionic concentration at pH 7.0, making this type of
biosensor particularly attractive for monitoring urea concentrations.
NH2CONH2 þ 3H2O ������������!electrode reaction
2NHþ4 þHCO�
3 þOH� ð23Þ
An alternating field between the two electrodes allows the con-
ductivity changes to be determined while minimising undesirable elec-
trochemical processes. The electrodes are interdigitated to give a
relatively long track length (B1 cm) within a small sensing area
(0.2mm2). A steady-state response can be achieved in a few seconds,
allowing urea to be determined within the range 0.1–10mM. The output
533Biosensors
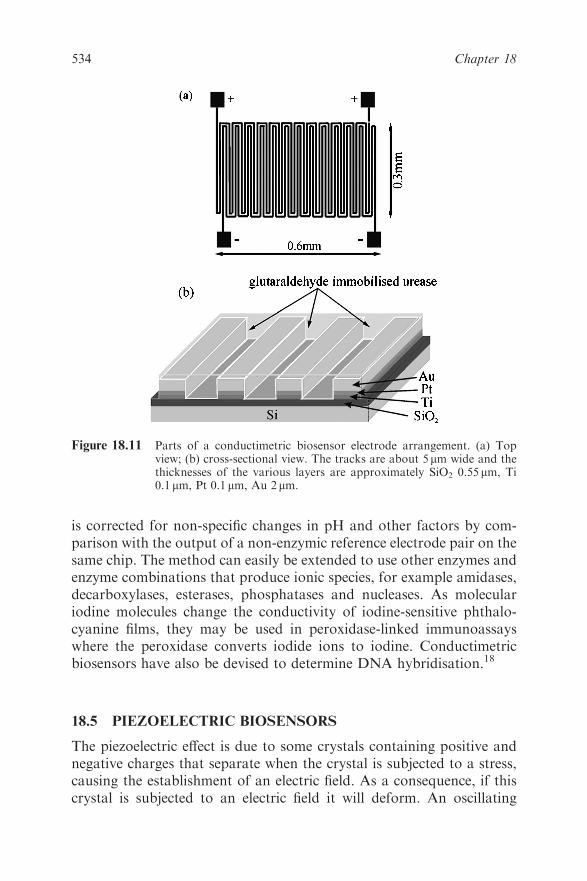
is corrected for non-specific changes in pH and other factors by com-
parison with the output of a non-enzymic reference electrode pair on the
same chip. The method can easily be extended to use other enzymes and
enzyme combinations that produce ionic species, for example amidases,
decarboxylases, esterases, phosphatases and nucleases. As molecular
iodine molecules change the conductivity of iodine-sensitive phthalo-
cyanine films, they may be used in peroxidase-linked immunoassays
where the peroxidase converts iodide ions to iodine. Conductimetric
biosensors have also be devised to determine DNA hybridisation.18
18.5 PIEZOELECTRIC BIOSENSORS
The piezoelectric effect is due to some crystals containing positive and
negative charges that separate when the crystal is subjected to a stress,
causing the establishment of an electric field. As a consequence, if this
crystal is subjected to an electric field it will deform. An oscillating
Figure 18.11 Parts of a conductimetric biosensor electrode arrangement. (a) Topview; (b) cross-sectional view. The tracks are about 5mm wide and thethicknesses of the various layers are approximately SiO2 0.55 mm, Ti0.1 mm, Pt 0.1 mm, Au 2 mm.
534 Chapter 18

electric field of a resonant frequency will cause the crystal to vibrate with
a characteristic frequency dependent on its composition and thickness
and also the way in which it has been cut. As this resonant frequency
varies when molecules adsorb on the crystal surface, a piezoelectric
crystal may form the basis of a biosensor. Even small changes in reso-
nant frequencies are easy to determine with precision and accuracy using
straightforward electronics. Differences in mass, even as small as 1 ng
cm–2, can be measured when adsorbed on the sensing surface. Changes
in frequency are generally determined relative to a similarly treated
reference crystal but without the active biological material. As an
example, a biosensor for cocaine in the gas phase may be made by
attaching cocaine antibodies to the surface of a piezoelectric crystal.
This biosensor changes frequency by about 50Hz for a 1 ppb atmo-
spheric cocaine sample and can be reused after flushing for a few seconds
with clean air. The relative humidity of the air is important, because if it
is too low the response is less sensitive and if it is too high the piezo-
electric effect may disappear altogether. Cocaine in solution can be
determined after drying such biosensors.19
Enzymes with gaseous substrates or inhibitors can also be attached to
such crystals, as has been proved by the production of biosensors for
formaldehyde incorporating formaldehyde dehydrogenase and for
organophosphorus insecticides incorporating acetylcholinesterase.
One of the drawbacks preventing the more widespread use of piezo-
electric biosensors is the difficulty in using them to determine analytes in
solution. The frequency of a piezoelectric crystal depends on the liquid’s
viscosity, density and specific conductivity. Under unfavourable condi-
tions, the crystal may cease to oscillate completely. There is also a
marked effect of temperature due to its effect on viscosity. The binding
of material to the crystal surface may be masked by other intermolecular
effects at the surface and bulk viscosity changes consequent upon even
small concentration differences. There is also the strong possibility of
interference due to non-specific binding.
Antibody–antigen binding can be determined by measuring the fre-
quency changes in air after drying the crystal. Such procedures,
although sensitive, are difficult to reproduce repetitively, as the antibody
layer may be partially lost when the antigen is removed. However, one-
shot biosensors have been developed, using this principle, for the
detection of several food contaminants such as enterobacteria.20
Piezoelectricity is also utilised in surface acoustic wave (SAW) devices
where a set of interdigitated electrodes is microfabricated at each end of
a rectangular quartz plate (Figure 18.12). Binding of molecules to the
surface affects the propagating wave, generated at one end, such that its
535Biosensors
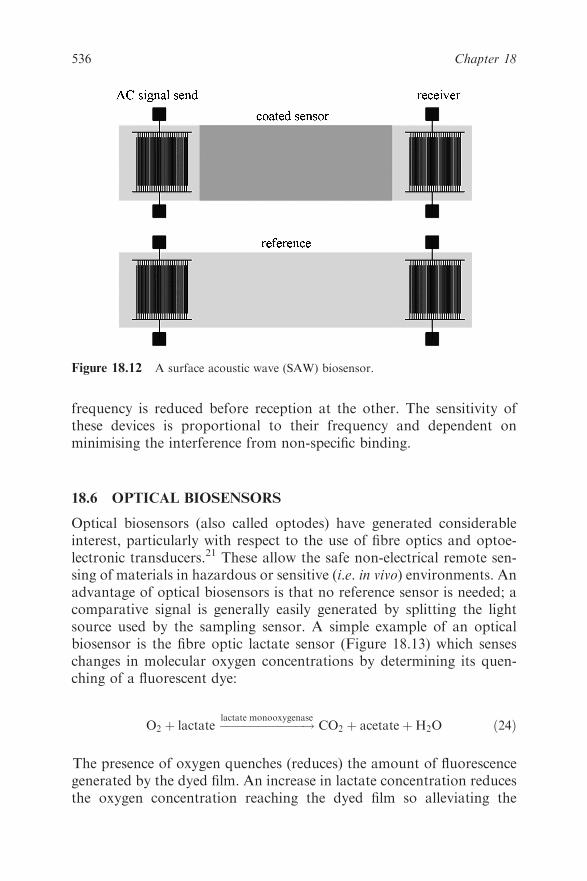
frequency is reduced before reception at the other. The sensitivity of
these devices is proportional to their frequency and dependent on
minimising the interference from non-specific binding.
18.6 OPTICAL BIOSENSORS
Optical biosensors (also called optodes) have generated considerable
interest, particularly with respect to the use of fibre optics and optoe-
lectronic transducers.21 These allow the safe non-electrical remote sen-
sing of materials in hazardous or sensitive (i.e. in vivo) environments. An
advantage of optical biosensors is that no reference sensor is needed; a
comparative signal is generally easily generated by splitting the light
source used by the sampling sensor. A simple example of an optical
biosensor is the fibre optic lactate sensor (Figure 18.13) which senses
changes in molecular oxygen concentrations by determining its quen-
ching of a fluorescent dye:
O2 þ lactate �����������!lactate monooxygenase
CO2 þ acetateþH2O ð24Þ
The presence of oxygen quenches (reduces) the amount of fluorescence
generated by the dyed film. An increase in lactate concentration reduces
the oxygen concentration reaching the dyed film so alleviating the
Figure 18.12 A surface acoustic wave (SAW) biosensor.
536 Chapter 18
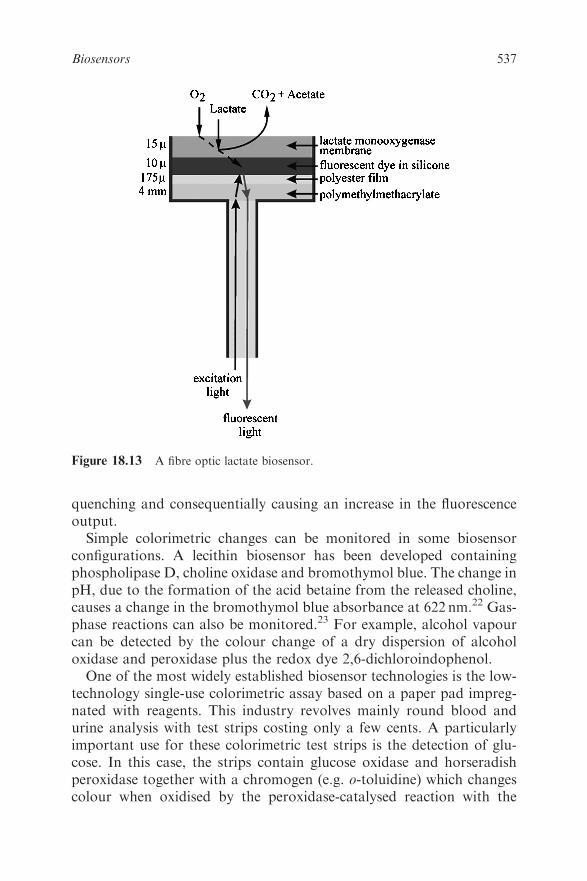
quenching and consequentially causing an increase in the fluorescence
output.
Simple colorimetric changes can be monitored in some biosensor
configurations. A lecithin biosensor has been developed containing
phospholipase D, choline oxidase and bromothymol blue. The change in
pH, due to the formation of the acid betaine from the released choline,
causes a change in the bromothymol blue absorbance at 622 nm.22 Gas-
phase reactions can also be monitored.23 For example, alcohol vapour
can be detected by the colour change of a dry dispersion of alcohol
oxidase and peroxidase plus the redox dye 2,6-dichloroindophenol.
One of the most widely established biosensor technologies is the low-
technology single-use colorimetric assay based on a paper pad impreg-
nated with reagents. This industry revolves mainly round blood and
urine analysis with test strips costing only a few cents. A particularly
important use for these colorimetric test strips is the detection of glu-
cose. In this case, the strips contain glucose oxidase and horseradish
peroxidase together with a chromogen (e.g. o-toluidine) which changes
colour when oxidised by the peroxidase-catalysed reaction with the
Figure 18.13 A fibre optic lactate biosensor.
537Biosensors

hydrogen peroxide produced by the aerobic oxidation of glucose:
ðreducedÞchromogenð2HÞ þH2O2 �����!peroxidase
ðoxidisedÞdyeþ 2H2O ð25Þ
The colour produced can be evaluated by visual comparison with a test
chart or by the use of a portable reflectance meter. Many test strips
incorporate anti-interference layers to produce more reproducible and
accurate results.
It is possible to link up luminescent reactions to biosensors, as light
output is a relatively easy phenomenon to transduce to an electronic
output. As an example, the reaction involving immobilised (or free)
luciferase can be used to detect the ATP released by the lysis of micro-
organisms:24
luciferinþATPþO2 ���!luciferase
oxyluciferinþ CO2 þAMP
þ pyrophosphateþ light ð26Þ
This allows the rapid detection of urinary infections by detecting the
microbial content of urine samples.
18.6.1 Evanescent Wave Biosensors
A light beam will be totally reflected when it strikes an interface between
two transparent media, from the side with the higher refractive index, at
angles of incidence (y) greater than the critical angle (Figure 18.14a).
This is the principle that allows transparent fibres to be used as optical
waveguides. At the point of reflection an electromagnetic field is induced
which penetrates into the medium with the lower refractive index,
usually air or water. This field is called the evanescent wave and it
rapidly decays exponentially with the penetration distance and generally
has effectively disappeared within a few hundred nanometres. The exact
depth of penetration depends on the refractive indices and the wave-
length of the light and can be controlled by the angle of incidence. The
evanescent wave may interact with the medium and the resultant elec-
tromagnetic field may be coupled back into the higher refractive index
medium (usually glass) by essentially the reverse process. This gives rise
to changes in the light emitted down the waveguide. Thus, it can be used
to detect changes occurring in the liquid medium. The necessary surface
interactions impose a limitation on the sensitivity of such devices at
about 10 pgmm�2 and the requirement to limit non-specific absorption.
538 Chapter 18
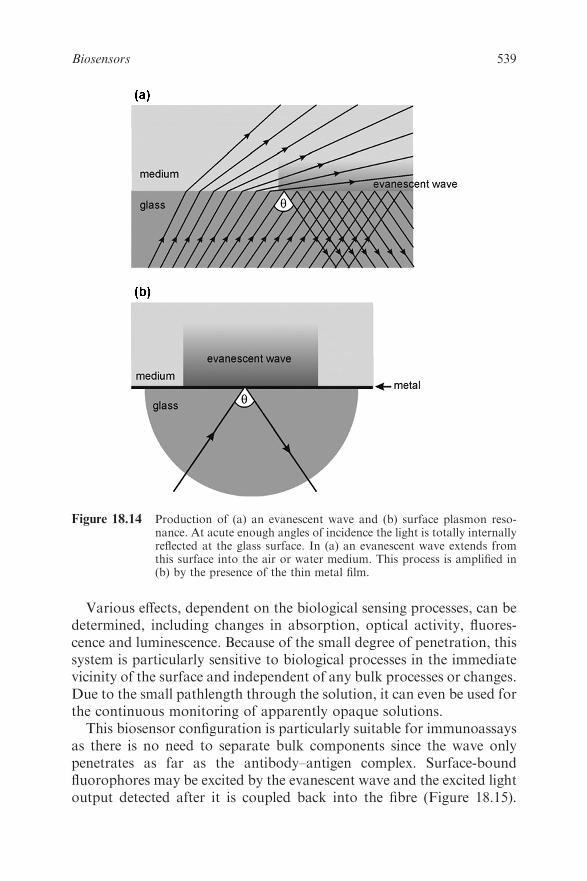
Various effects, dependent on the biological sensing processes, can be
determined, including changes in absorption, optical activity, fluores-
cence and luminescence. Because of the small degree of penetration, this
system is particularly sensitive to biological processes in the immediate
vicinity of the surface and independent of any bulk processes or changes.
Due to the small pathlength through the solution, it can even be used for
the continuous monitoring of apparently opaque solutions.
This biosensor configuration is particularly suitable for immunoassays
as there is no need to separate bulk components since the wave only
penetrates as far as the antibody–antigen complex. Surface-bound
fluorophores may be excited by the evanescent wave and the excited light
output detected after it is coupled back into the fibre (Figure 18.15).
Figure 18.14 Production of (a) an evanescent wave and (b) surface plasmon reso-nance. At acute enough angles of incidence the light is totally internallyreflected at the glass surface. In (a) an evanescent wave extends fromthis surface into the air or water medium. This process is amplified in(b) by the presence of the thin metal film.
539Biosensors
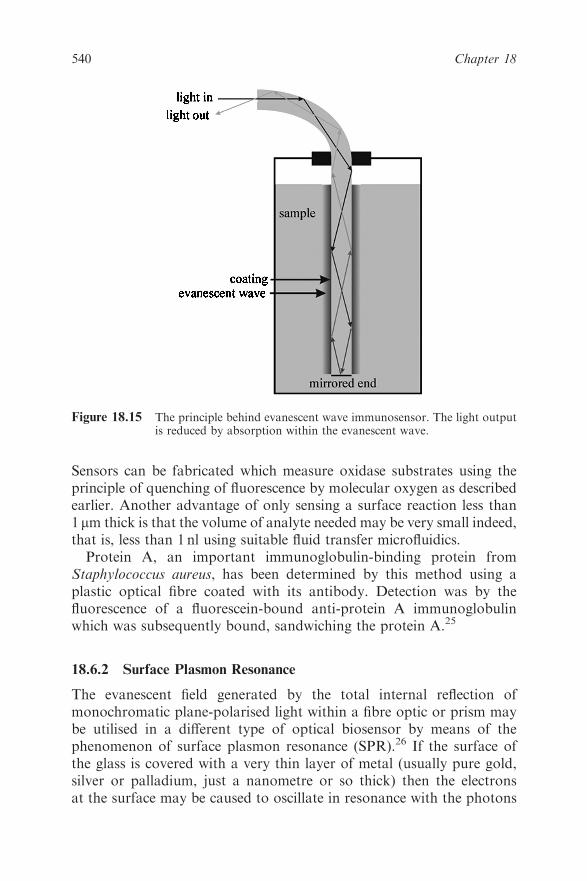
Sensors can be fabricated which measure oxidase substrates using the
principle of quenching of fluorescence by molecular oxygen as described
earlier. Another advantage of only sensing a surface reaction less than
1mm thick is that the volume of analyte needed may be very small indeed,
that is, less than 1 nl using suitable fluid transfer microfluidics.
Protein A, an important immunoglobulin-binding protein from
Staphylococcus aureus, has been determined by this method using a
plastic optical fibre coated with its antibody. Detection was by the
fluorescence of a fluorescein-bound anti-protein A immunoglobulin
which was subsequently bound, sandwiching the protein A.25
18.6.2 Surface Plasmon Resonance
The evanescent field generated by the total internal reflection of
monochromatic plane-polarised light within a fibre optic or prism may
be utilised in a different type of optical biosensor by means of the
phenomenon of surface plasmon resonance (SPR).26 If the surface of
the glass is covered with a very thin layer of metal (usually pure gold,
silver or palladium, just a nanometre or so thick) then the electrons
at the surface may be caused to oscillate in resonance with the photons
Figure 18.15 The principle behind evanescent wave immunosensor. The light outputis reduced by absorption within the evanescent wave.
540 Chapter 18
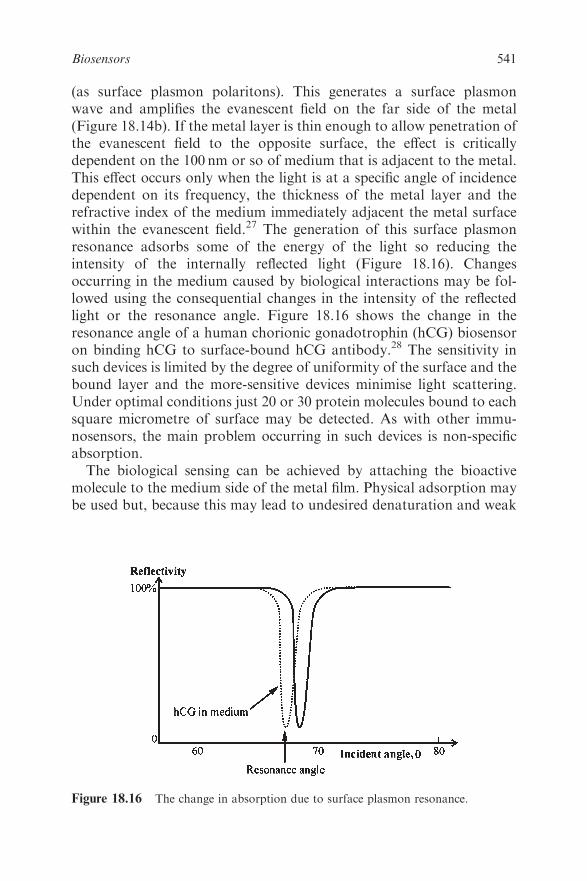
(as surface plasmon polaritons). This generates a surface plasmon
wave and amplifies the evanescent field on the far side of the metal
(Figure 18.14b). If the metal layer is thin enough to allow penetration of
the evanescent field to the opposite surface, the effect is critically
dependent on the 100 nm or so of medium that is adjacent to the metal.
This effect occurs only when the light is at a specific angle of incidence
dependent on its frequency, the thickness of the metal layer and the
refractive index of the medium immediately adjacent the metal surface
within the evanescent field.27 The generation of this surface plasmon
resonance adsorbs some of the energy of the light so reducing the
intensity of the internally reflected light (Figure 18.16). Changes
occurring in the medium caused by biological interactions may be fol-
lowed using the consequential changes in the intensity of the reflected
light or the resonance angle. Figure 18.16 shows the change in the
resonance angle of a human chorionic gonadotrophin (hCG) biosensor
on binding hCG to surface-bound hCG antibody.28 The sensitivity in
such devices is limited by the degree of uniformity of the surface and the
bound layer and the more-sensitive devices minimise light scattering.
Under optimal conditions just 20 or 30 protein molecules bound to each
square micrometre of surface may be detected. As with other immu-
nosensors, the main problem occurring in such devices is non-specific
absorption.
The biological sensing can be achieved by attaching the bioactive
molecule to the medium side of the metal film. Physical adsorption may
be used but, because this may lead to undesired denaturation and weak
Figure 18.16 The change in absorption due to surface plasmon resonance.
541Biosensors
binding, covalent binding is often preferred. Gold films can be coated
with a monolayer of long-chain 1,o-hydroxyalkylthiols, which are
copolymerised to a flexible un-cross-linked carboxymethylated dextran
gel, allowing the subsequent binding of bioactive molecules. This flat
plate system, marketed as Biacore,29 allows the detection of parts per
million of protein antigen where the appropriate antibody is bound to
the gel. Similarly, biosensors for DNA detection can be constructed by
attaching a DNA or RNA probe to the metal surface when as little as a
few femtograms of complementary DNA or RNA can be detected30
and, as a bonus, the rate of hybridisation may be determined. Such
biosensors retain the advantages of the use of evanescent fields as
described earlier. They can also be used to investigate the kinetics of the
binding and dissociation processes.31 In spite of the relatively low costs
possible for producing biosensing surfaces, the present high cost of the
instrumentation is restricting developments in this area. However,
developments in the use of low-cost light-emitting diodes and lens arrays
together with the use of porous surfaces to increase surface area,
microfluidics and integrated devices with in-built waveguided inter-
ferometry of reference beams are allowing the field to progress rapidly.
18.7 WHOLE CELL BIOSENSORS
As biocatalysts, whole microbial cells can offer some advantages over
pure enzymes when used in biosensors.32 Generally, microbial cells are
cheaper, have longer active lifetimes and are less sensitive to inhibition,
pH and temperature variations than the isolated enzymes. Against these
advantages, such devices usually offer longer response and recovery
times, a lower selectivity and they are prone to biocatalytic leakage.
They are particularly useful where multistep or coenzyme-requiring
reactions are necessary. The microbial cells may be viable or dead. The
advantage of using viable cells is that the sensor may possess a self-
repair capability, but this must be balanced against the milder condi-
tions necessary for use and problems that might occur due to membrane
permeability and cellular outgrowth. Different types of whole cell bio-
sensors are shown in Table 18.5.
Biochemical oxygen demand (BOD) biosensors most often use a
single selected microbial species. Although rapid, linear and repro-
ducible, they give a different result to conventional testing, which
involve incubation over 5 days, and reflect the varying metabolism of a
mixed microbial population. Thermophilic organisms have been used in
such a biosensor for use in hot wastewater.
542 Chapter 18

18.8 RECEPTOR-BASED SENSORS
Receptor-based sensors include immunosensors33 (Table 18.6) and some
of these have been mentioned earlier. Most biosensor configurations
may be used, with Figure 18.17 showing some of those possible. Direct
binding of the antigen to immobilised antibody (Figure 18.17a) or
antigen–antibody sandwich (Figure 18.17b) may be detected using pie-
zoelectric or SPR devices,34 as can antibody release due to free antigen
(Figure 18.17c). Binding of enzyme-linked antigen (Figure 18.17d) or
antibody can form the basis of all types of immunosensors but has
proved particularly useful in amperometric devices. The amount of
enzyme activity bound in these receptor-based sensors is dependent on
the relative concentrations of the competing labelled and unlabelled
Table 18.5 Whole cell biosensors.
Analyte Organism Biosensor
Ammonia Nitrosomonas sp. Amperometric (O2)Biological oxygendemand (BOD)
Many Amperometric (O2/mediated),polarographic (O2) or potentio-metric (FET/H2)
Cysteine Proteus morganii Potentiometric (H2S)Glutamate Escherichia coli Potentiometric (CO2)Glutamine Sarcina flava Potentiometric (NH3)Herbicides Cyanobacteria Amperometric (mediated)Nicotinic acid Lactobacillus
arabinosusPotentiometric (H1)
Sulfate Desulfovibriodesulfuricans
Potentiometric (SO3–)
Thiamine Lactobacillus fermenti Amperometric (mediated)
Table 18.6 A selection of receptor-based sensors.
Analyte Sensing method Biosensor
Anthrax spores (warfare) Antibody Surface acoustic waveCholera toxin (warfare) Antibody PotentiometricVerotoxin-producing E. coli Peptide nucleic acid Surface plasmon resonanceCocaine Antibody/protein A PiezoelectricHuman chorionicgonadotrophin
Antibody/catalase Amperometric (O2)
Antibody Surface plasmon resonanceHepatitis B surface antigen Antibody/
peroxidasePotentiometric (I–)
Insulin Antibody/catalase Amperometric (O2)Ricin (warfare) Antibody Evanescent wave
FluorescenceTrinitrotoluene (TNT) Antibody/labelledantigen
543Biosensors
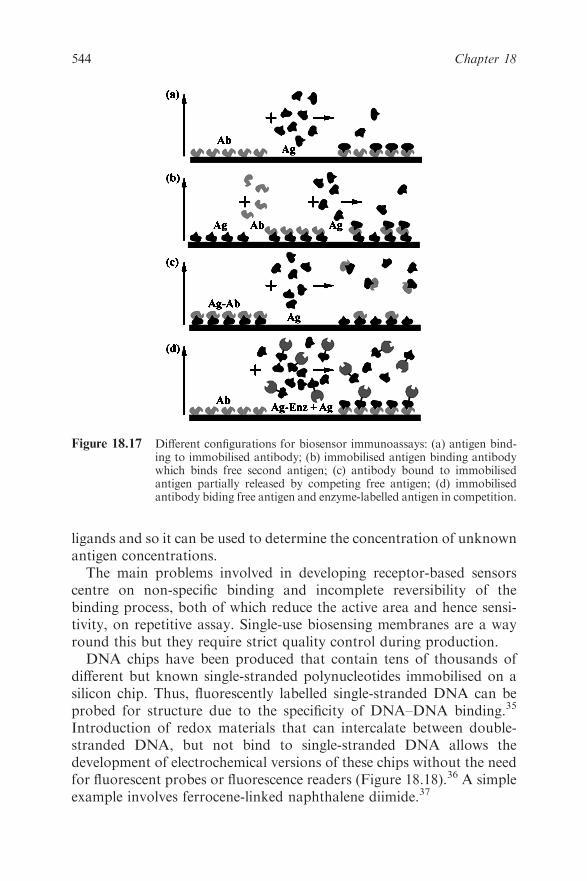
ligands and so it can be used to determine the concentration of unknown
antigen concentrations.
The main problems involved in developing receptor-based sensors
centre on non-specific binding and incomplete reversibility of the
binding process, both of which reduce the active area and hence sensi-
tivity, on repetitive assay. Single-use biosensing membranes are a way
round this but they require strict quality control during production.
DNA chips have been produced that contain tens of thousands of
different but known single-stranded polynucleotides immobilised on a
silicon chip. Thus, fluorescently labelled single-stranded DNA can be
probed for structure due to the specificity of DNA–DNA binding.35
Introduction of redox materials that can intercalate between double-
stranded DNA, but not bind to single-stranded DNA allows the
development of electrochemical versions of these chips without the need
for fluorescent probes or fluorescence readers (Figure 18.18).36 A simple
example involves ferrocene-linked naphthalene diimide.37
Figure 18.17 Different configurations for biosensor immunoassays: (a) antigen bind-ing to immobilised antibody; (b) immobilised antigen binding antibodywhich binds free second antigen; (c) antibody bound to immobilisedantigen partially released by competing free antigen; (d) immobilisedantibody biding free antigen and enzyme-labelled antigen in competition.
544 Chapter 18

Proteins, such as antibodies, may also be attached to DNA chips by
means of covalently attached complementary probes, so allowing
thousands of differently binding proteins to be specifically attached to
single chips. The high negative charge on the complementary linkers
almost totally removes the chance of non-specific binding. This area is
likely to expand considerably over the next few years.
18.9 CONCLUSION
Biosensors form an interesting and varied part of biotechnology. They
have been applied to solve a number of analytical problems and some
have achieved notable commercial success. They have been slow to
Figure 18.18 DNA biosensor. Binding of the complementary strand allows certainredox molecules to intercalate into the DNA fragment to allow detec-tion via amperometry.
545Biosensors

evolve from research prototype to the marketplace and have not yet
reached their full potential. Many more commercial products are
expected over the next few years, particularly in medical diagnostics and
the war against terrorism.38
REFERENCES
1. J. D. Newman and S. J. Setford, Mol. Biotechnol., 2006, 32, 249.
2. M. N. Velasco-Garcia and T. Mottram, Biosyst. Eng., 2003, 84, 1.
3. H. Nakamura and I. Karube, Anal. Bioanal. Chem., 2003, 377, 446.
4. G. A. Urban, in Encyclopedia of Analytical Chemistry, ed. R. A.
Meyers, Wiley, Chichester, 2000, p. 1164.
5. J. D. Newman and A. P. F. Turner, Biosens. Bioelectron., 2005,
20, 2435.
6. P. T. Kissinger, Biosens. Bioelectron., 2005, 20, 2512.
7. Z. Zhu, J. Zhang and J. Zhu, Sens. Lett., 2005, 3, 71.
8. J. Wang, Electroanalysis, 2001, 13, 983.
9. T. D. Gibson, Analusis, 1999, 27, 632.
10. L. C. Clark and C. H. Lyons, Ann. N. Y. Acad. Sci., 1962, 102, 29.
11. E. Watanabe, M. Takagi, S. Takei, M. Hoshi and C. Shu-gui,
Biotechnol. Bioeng., 1991, 38, 99.
12. S. S. Hu and C. C. Liu, Electroanalysis, 1997, 9, 1174.
13. F. W. Scheller, F. Schubert, B. Neumann, D. Pfeiffer, R. Hintsche,
I. Dransfeld, U. Wollenberger, R. Renneberg, A. Warsinke,
G. Johansson, M. Skoog, X. Yang, V. Bogdanovskaya, A. Buckmann
and S. Y. Zaitsev, Biosens. Bioelectron., 1991, 6, 245.
14. H. E. Koschwanez and W. M. Reichert, Biomaterials, 2007,
28, 3687.
15. J. Njagi and S. Andreescu, Biosens. Bioelectron., 2007, 23, 168.
16. R. Koncki, Anal. Chim. Acta, 2007, 599, 7.
17. N. F. Sheppard, D. J. Mears and A. Guiseppielie, Biosens. Bio-
electron., 1996, 11, 967.
18. S.-J. Park, A. Taton and C. A. Mirkin, Science, 2002, 295, 1503.
19. B. S. Attili and A. A. Suleiman, Microchem. J., 1996, 54, 174.
20. M. Plomer, G. G. Guilbault and B. Hock, Enzyme Microb. Tech-
nol., 1992, 14, 230.
21. A. Leung, P. M. Shankar and R. Mutharasan, Sens. Actuators B,
2007, 125, 688.
22. V. P. Kotsira and Y. D. Clonis, J. Agric. Food Chem, 1998, 46, 3389.
23. S. Lamare and M. D. Legoy, Trends Biotechnol., 1993, 11, 413.
24. M. F. Chaplin, in Physical Methods for Microorganisms Detection,
ed. W. M. Nelson, CRC Press, Boca Raton, FL,1991, p. 81.
546 Chapter 18

25. Y. H. Chang, T. C. Chang, E. F. Kao and C. Chou, Biosci. Bio-
technol. Biochem., 1996, 60, 1571.
26. X. D. Hoa, A. G. Kirk and M. Tabrizian, Biosens. Bioelectron.,
2007, 23, 151.
27. J. Homola, Anal. Bioanal. Chem., 2003, 377, 528.
28. J. W. Attridge, P. B. Daniels, J. K. Deacon, G. A. Robinson and
G. P. Davidson, Biosens. Bioelectron., 1991, 6, 201.
29. R. L. Rich and D. G. Myszka, Drug Discov. Today: Technol., 2004,
1, 301.
30. T. Schwarz, D. Yeung, E. Hawkins, P. Heaney and A. McDougall,
Trends Biotechnol., 1991, 9, 339.
31. M. Fivash, E. M. Towler and R. J. Fisher, Curr. Opin. Biotechnol.,
1998, 9, 370.
32. Y. I. Korpan and A. V. Elskaya, Biochemistry (Moscow), 1995,
60, 1517.
33. O. Lazcka, F. J. Del Campo and F. X. Munoz, Biosens. Bioelectron.,
2007, 22, 1205.
34. C. L. Morgan, D. J. Newman and C. P. Price, Clin. Chem., 1996,
42, 193.
35. R. C. Anderson, G. McGall and R. J. Lipshutz, Top. Curr. Chem.,
1997, 194, 117.
36. A. L. Ghindilis, M. W. Smith, K. R. Schwarzkopf, K. M. Roth,
K. Peyvan, S. B. Munro, M. J. Lodes, A. G. Stover, K. Bernards,
K. Dill and A. McShea, Biosens. Bioelectron., 2007, 22, 1853.
37. J. Wang, Anal. Chim. Acta, 2002, 469, 63.
38. J. J. Gooding, Anal. Chim. Acta, 2006, 559, 137.
547Biosensors

CHAPTER 19
Biofuels and Biotechnology
JONATHAN R. MIELENZ
Oak Ridge National Laboratory, Oak Ridge TN 37831, USA
19.1 INTRODUCTION
The world obtains 86% of its energy from fossil fuels, 40% from pet-
roleum, a majority of which goes to the transportation sector
(www.IEA.gov). Well-recognized alternatives are fuels derived from
renewable sources known as biofuels. There are a number of biofuels
useful for transportation fuels, which include ethanol, biobutanol,
mixed alcohols, biodiesel and hydrogen. These biofuels are produced
from biologically derived feedstock, almost exclusively being plant
materials, either food or feed sources or inedible plant material called
lignocellulose or biomass. This chapter discusses technologies for pro-
duction of liquid transportation biofuels from renewable feedstocks that
can use existing infrastructure, so hydrogen will not be included. In
addition, a specific emphasis will be placed upon the research oppor-
tunities and potential for application of system biology tools to dissect
and understand the biological processes central to production of these
biofuels from biomass and biological materials.
There are a number of technologies for production of each of these
biofuels that range from fully mature processes such as grain-derived
ethanol, the emerging technologies for cellulose-derived ethanol, bio-
butanol and thermochemical conversion technologies and immature
processes such as production of hydrogen from renewable biological
Molecular Biology and Biotechnology, 5th Edition
Edited by John M Walker and Ralph Rapleyr Royal Society of Chemistry 2009
Published by the Royal Society of Chemistry, www.rsc.org
548
feedstocks. Conversion of biomass by various thermochemical and
combustion technologies to produce thermochemical biodiesel or steam
and electricity provide growing sources of bioenergy. However, like
hydrogen, these technologies are outside of the scope of this chapter, as
is the use of biological processing for upgrading and conversion of fossil
fuels. Therefore, this chapter will focus on the current status of pro-
duction of biofuels produced from biological-derived feedstocks using
biological processes.
Regardless of the status of development of the biological process for
production of the biofuels, each process can benefit from research and
resulting development activities using the latest biological research tools
and techniques. Among the most recently evolving research tools is what
is collectively known as ‘omics’ techniques, such as genomics, tran-
scriptomics, proteomics, metabolomics and fluxomics, plus an ever
growing omics word generation.1 These and other similar methodologies
are central to understanding the interactive functioning of gene
expression, resulting protein/enzyme production, which impacts the
cellular metabolism and carbon and metabolite flow. These emerging
system biology ‘omics’ tools are just beginning to be applied to under-
stand and improve the biological processes involved in conversion of
renewable plant and animal material to biofuels, and further opportu-
nities will be discussed in this chapter.
19.2 PRODUCTION OF THE MAJOR BIOFUELS
Ethanol is currently (March 2008) being produced from over 140
commercial biorefineries throughout the USA and numerous processing
plants in Brazil, yielding over 8.0 billion gallons in the USA (www.e-
thanolrfa.org) and nearly 4.5 billion gallons in Brazil (2007)
(www.iea.org). In the USA, most of the feedstock for production of
ethanol currently is corn, whereas Brazil exclusively uses sucrose from
sugar cane.2,3 This latter process is the simplest as sucrose is readily
metabolized by yeast to ethanol in a highly efficient mature process that
provides minimal areas for improvement of the fermentation process
and will not be discussed further. However, the conversion processes for
corn starch-based ethanol is considerably more complex, whether it uses
the simpler dry mill process or the complex corn wet milling, and both
biological conversion technologies for production of ethanol from corn
offer opportunities for process improvement. Due to their simplicity, dry
mills comprise a majority of the corn ethanol plants.
Biodiesel use is growing rapidly in the USA using primarily soybean
oil as the feedstock with additional sources coming from waste fats and
549Biofuels and Biotechnology
oils from food processing and restaurants. Total production in the USA
is only 250 million US gallons (2008), although the production plant
capacity is 2.24 billion US gallons, so the production capacity greatly
exceeds sales (www.biodiesel.org). In Europe, an estimated 2.3 billion
US gallons of biodiesel were produced in 2007, with 84% of the biodiesel
coming from canola/rapeseed sources (www.eubia.org). Over half of the
production comes from Germany, with the nearest producer country,
France, producing only about 30% as much biodiesel. Alteration of the
crop source offers good opportunity for expansion in the USA to replace
food sources such as soybean oil.
19.2.1 Corn Processing and Ethanol
The corn dry milling process is a simpler process than the wet mill
process and has fewer unit operations. The corn is initially milled with a
hammer mill or grinder to crush the corn kernels, followed by addition
of water and heating of the corn slurry to liquefy the corn starch. During
the heating process a thermostable a-amylase4 is added to initiate the
starch hydrolysis at high temperature (90 1C) and decrease microbial
contaminants. This hydrolysis process generates partially hydrolyzed
starch maltodextrins and little if any free glucose. Upon cooling to 50–
60 1C and adjustment of the pH to about 5, glucoamylase is added to
initiate the cleavage of single glucose units off of the starch oligomers
produced by the a-amylase action. A critical process parameter is
maximizing glucose generation while minimizing reversion sugars
formed by reverse enzyme action as conversion approaches over 95%
glucose. The corn slurry–enzyme mixture is cooled and, when the tem-
perature reaches below 40 1C, fermentation yeast, Saccharomyces cere-
visiae is added. This yeast is either obtained by on-site production or
purchased from an inoculum producer. The fermentation continues over
a few days until a majority of the starch-derived glucose is converted to
ethanol, typically yielding a beer with about 9% (w/w) ethanol.5,6
By contrast, the corn wet mill process is a true refinery process initiated
by steeping the corn with water and sulfur dioxide to swell the corn and
make it easily disrupted by mechanical processing. This steeping process
lasts at 40–60h and supports active lactic acid fermentation by resident
Lactobacillus. Subsequently, the milling process permits the separation of
the corn pericarp, corn starch, germ and soluble portion of the corn as a
result of the steeping process. This steep slurry is refined by a complex
series of separation processes yielding highly purified corn starch and
fractions that yield corn oil after further purification, pericarp and germ
residues that provide high-protein feed products. The corn steep liquor
550 Chapter 19

containing nearly all amino acids, minerals, other nutritional compo-
nents along with typically about 50% lactic acid after extensive eva-
poration of the water. The highly purified corn starch is the largest
product by weight and is used to produce a number of starch products
such as cooking starch and derivatives destined for a variety of uses
including adhesives, gums and coatings. Additionally, the starch can be
further processed by a series of hydrolysis processes that include acid
hydrolysis to produce a variety of specialty syrups for the baking, candy
and food processing industries. Additional products employ enzymes to
take advantage of their high degree of specificity that yield highly
selective materials. The starch conversion process usually is initiated at
high temperature (approximately 90–95 1C) in a jet cooker dosed with a
thermostable a-amylase,4 which rapidly cleaves the starch slurry to high
molecular weight oligomers. Like the dry mill process, the maltodextrin
syrup is then converted to over 95% glucose by the action of glucoa-
mylase, but with much higher purity compared with the dry mill process.
The glucose is purified for the incomplete hydrolysis products and is
destined for various uses, including intravenous glucose, fermentation
grade glucose used to produce light beer and sold to the food industry.
One of the largest markets is the production of high-fructose corn syrup
(HFCS), which is produced by conversion of glucose to fructose by
the action of xylose/glucose isomerase, typically sold as 42% fructose, or
via enrichment processes, 55% fructose HFCS. A chromatographic
enrichment process is needed to attain 55% fructose due the natural
enzymatic equilibrium between glucose and fructose at about 42%
fructose. HFCS is sold largely as a sugar substitute, especially to the soft
drinks market.
Purified glucose is highly versatile and can be used as a carbon source
for a number of fermentative conversion processes. Over the last two
decades, large volumes of ethanol have been produced by yeast fer-
mentation in high purity and yield using wet mill-produced glucose. This
highlights the benefit of the capital intensive wet mill process. For
example, wet mill operations can produce ethanol from the glucose or
divert any specified amount of the glucose stream to produce alternative
higher value products. Examples of existing higher value products
include antibiotics, amino acids and other food and feed additives
such as vitamins. Glucose is also used to produce industrial products
such as enzymes, organic acids such as citric acid and chemical inter-
mediates such as 2,3-propanediol. This chemical intermediate is being
produced by the DuPont/Tate and Lyle joint venture, located in Lou-
don, TN, using glucose obtained from the adjacent Tate and Lyle corn
wet mill.7
551Biofuels and Biotechnology
19.2.2 Biomass Conversion for Ethanol
Multifaceted bioconversion technologies are emerging for the produc-
tion of ethanol from lignocellulosic biomass. A high degree of com-
plexity is required because, unlike corn kernels, which are over 70%
starch on a dry basis, biomass contains three primary structural com-
ponents, 33–50% cellulose, 17–35% hemicellulose and 12–24% lignin,
with the remainder being minerals, protein and other minor materials.8
In addition, since in Nature plants must withstand normal degradative
processes as part of their survival, plant cell walls and the exterior of
plant are highly resistant to enzymatic and microbial attack. As a result,
over the last 30+ years a number of conversion processes have evolved
that vary in complexity. The initial disruptive process needed to initiate
the structural breakdown of biomass is called pretreatment and at least
seven processes have been developed, ranging from highly alkaline to
acidic environments and organic solvent based.9–11 They all accomplish
the partial disruption of the plant structure to allow the internal com-
ponents, in particular the carbohydrates, to be exposed to enzymatic
and microbial attack under controlled environments of a fermentation
process. These processes vary from multi-enzyme and multi-fermenta-
tion approaches called separate hydrolysis and fermentation (SHF)12 to
simpler simultaneous cellulose hydrolysis or saccharification and fer-
mentation (SSF).13–15 In the SHF process, the biomass cellulose is
hydrolyzed with cellulases to liberate fermentable glucose followed by a
separate step for fermentation to ethanol. The SSF process combines the
enzymatic hydrolysis with the fermentation, simultaneously reducing the
process complexity. A natural extension is simultaneous saccharification
and cofermentation (SSCF) with microorganisms that are able to covert
both hexose and pentose sugars to ethanol. This process simplification
culminates with the development of fermentation microorganism pro-
duces its own enzymes for cellulose hydrolysis, called consolidated
bioprocessing (CBP). A fermentation technology that is the most ver-
satile is the combination of gasification of biomass and other organic
materials to a gaseous form followed by fermentation of the resulting
gases to ethanol. All these conversion options have significant potential
to benefit from use of advanced molecular and biotechnology analysis
tools offered by systems biology tools.
19.2.2.1 Enzymatic Hydrolysis and Conversion
The enzymes that are typically employed in the hydrolysis of the bio-
mass carbohydrates are cellulases including endoglucanases or b-1,
4-endoglucan hydrolase (EC 3.2.1.4) and exoglucanases which are
552 Chapter 19
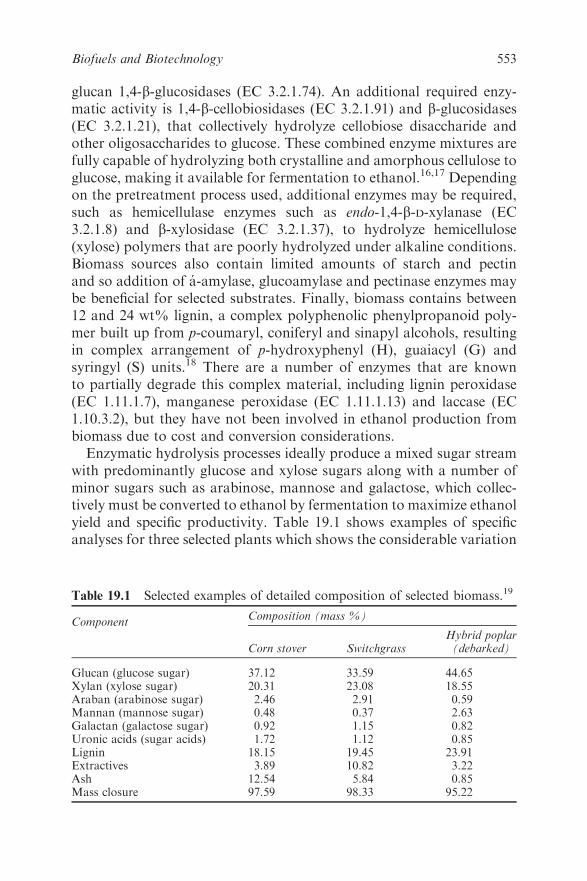
glucan 1,4-b-glucosidases (EC 3.2.1.74). An additional required enzy-
matic activity is 1,4-b-cellobiosidases (EC 3.2.1.91) and b-glucosidases
(EC 3.2.1.21), that collectively hydrolyze cellobiose disaccharide and
other oligosaccharides to glucose. These combined enzyme mixtures are
fully capable of hydrolyzing both crystalline and amorphous cellulose to
glucose, making it available for fermentation to ethanol.16,17 Depending
on the pretreatment process used, additional enzymes may be required,
such as hemicellulase enzymes such as endo-1,4-b-D-xylanase (EC
3.2.1.8) and b-xylosidase (EC 3.2.1.37), to hydrolyze hemicellulose
(xylose) polymers that are poorly hydrolyzed under alkaline conditions.
Biomass sources also contain limited amounts of starch and pectin
and so addition of a-amylase, glucoamylase and pectinase enzymes may
be beneficial for selected substrates. Finally, biomass contains between
12 and 24 wt% lignin, a complex polyphenolic phenylpropanoid poly-
mer built up from p-coumaryl, coniferyl and sinapyl alcohols, resulting
in complex arrangement of p-hydroxyphenyl (H), guaiacyl (G) and
syringyl (S) units.18 There are a number of enzymes that are known
to partially degrade this complex material, including lignin peroxidase
(EC 1.11.1.7), manganese peroxidase (EC 1.11.1.13) and laccase (EC
1.10.3.2), but they have not been involved in ethanol production from
biomass due to cost and conversion considerations.
Enzymatic hydrolysis processes ideally produce a mixed sugar stream
with predominantly glucose and xylose sugars along with a number of
minor sugars such as arabinose, mannose and galactose, which collec-
tively must be converted to ethanol by fermentation to maximize ethanol
yield and specific productivity. Table 19.1 shows examples of specific
analyses for three selected plants which shows the considerable variation
Table 19.1 Selected examples of detailed composition of selected biomass.19
ComponentComposition (mass %)
Corn stover SwitchgrassHybrid poplar(debarked)
Glucan (glucose sugar) 37.12 33.59 44.65Xylan (xylose sugar) 20.31 23.08 18.55Araban (arabinose sugar) 2.46 2.91 0.59Mannan (mannose sugar) 0.48 0.37 2.63Galactan (galactose sugar) 0.92 1.15 0.82Uronic acids (sugar acids) 1.72 1.12 0.85Lignin 18.15 19.45 23.91Extractives 3.89 10.82 3.22Ash 12.54 5.84 0.85Mass closure 97.59 98.33 95.22
553Biofuels and Biotechnology
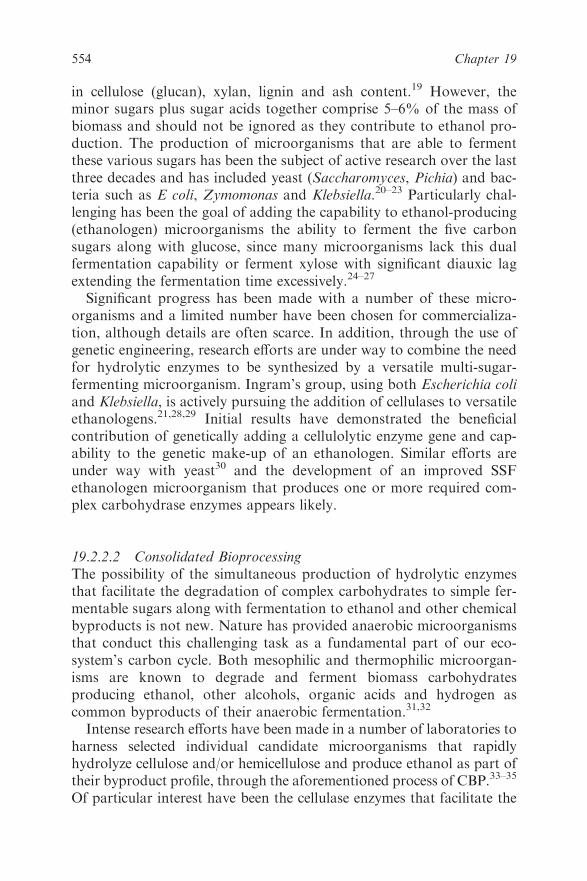
in cellulose (glucan), xylan, lignin and ash content.19 However, the
minor sugars plus sugar acids together comprise 5–6% of the mass of
biomass and should not be ignored as they contribute to ethanol pro-
duction. The production of microorganisms that are able to ferment
these various sugars has been the subject of active research over the last
three decades and has included yeast (Saccharomyces, Pichia) and bac-
teria such as E coli, Zymomonas and Klebsiella.20–23 Particularly chal-
lenging has been the goal of adding the capability to ethanol-producing
(ethanologen) microorganisms the ability to ferment the five carbon
sugars along with glucose, since many microorganisms lack this dual
fermentation capability or ferment xylose with significant diauxic lag
extending the fermentation time excessively.24–27
Significant progress has been made with a number of these micro-
organisms and a limited number have been chosen for commercializa-
tion, although details are often scarce. In addition, through the use of
genetic engineering, research efforts are under way to combine the need
for hydrolytic enzymes to be synthesized by a versatile multi-sugar-
fermenting microorganism. Ingram’s group, using both Escherichia coli
and Klebsiella, is actively pursuing the addition of cellulases to versatile
ethanologens.21,28,29 Initial results have demonstrated the beneficial
contribution of genetically adding a cellulolytic enzyme gene and cap-
ability to the genetic make-up of an ethanologen. Similar efforts are
under way with yeast30 and the development of an improved SSF
ethanologen microorganism that produces one or more required com-
plex carbohydrase enzymes appears likely.
19.2.2.2 Consolidated Bioprocessing
The possibility of the simultaneous production of hydrolytic enzymes
that facilitate the degradation of complex carbohydrates to simple fer-
mentable sugars along with fermentation to ethanol and other chemical
byproducts is not new. Nature has provided anaerobic microorganisms
that conduct this challenging task as a fundamental part of our eco-
system’s carbon cycle. Both mesophilic and thermophilic microorgan-
isms are known to degrade and ferment biomass carbohydrates
producing ethanol, other alcohols, organic acids and hydrogen as
common byproducts of their anaerobic fermentation.31,32
Intense research efforts have been made in a number of laboratories to
harness selected individual candidate microorganisms that rapidly
hydrolyze cellulose and/or hemicellulose and produce ethanol as part of
their byproduct profile, through the aforementioned process of CBP.33–35
Of particular interest have been the cellulase enzymes that facilitate the
554 Chapter 19
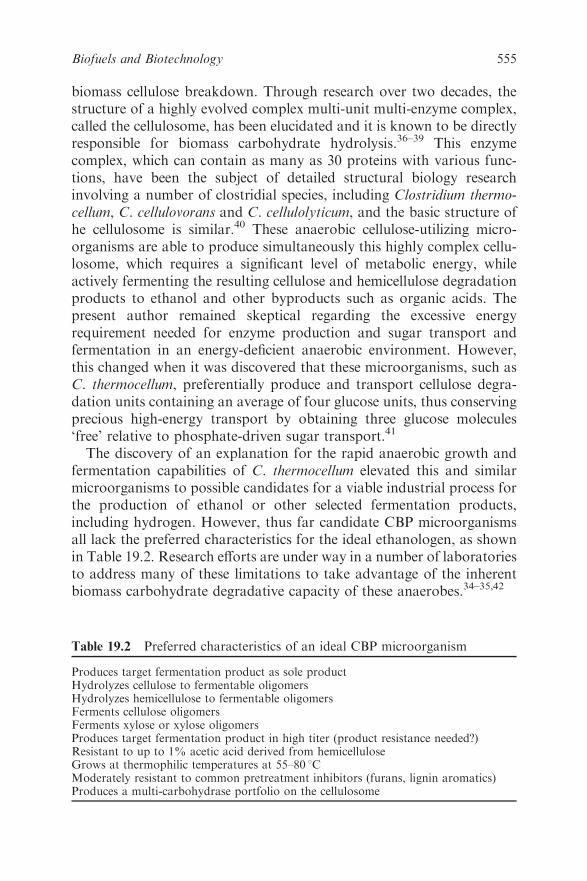
biomass cellulose breakdown. Through research over two decades, the
structure of a highly evolved complex multi-unit multi-enzyme complex,
called the cellulosome, has been elucidated and it is known to be directly
responsible for biomass carbohydrate hydrolysis.36–39 This enzyme
complex, which can contain as many as 30 proteins with various func-
tions, have been the subject of detailed structural biology research
involving a number of clostridial species, including Clostridium thermo-
cellum, C. cellulovorans and C. cellulolyticum, and the basic structure of
he cellulosome is similar.40 These anaerobic cellulose-utilizing micro-
organisms are able to produce simultaneously this highly complex cellu-
losome, which requires a significant level of metabolic energy, while
actively fermenting the resulting cellulose and hemicellulose degradation
products to ethanol and other byproducts such as organic acids. The
present author remained skeptical regarding the excessive energy
requirement needed for enzyme production and sugar transport and
fermentation in an energy-deficient anaerobic environment. However,
this changed when it was discovered that these microorganisms, such as
C. thermocellum, preferentially produce and transport cellulose degra-
dation units containing an average of four glucose units, thus conserving
precious high-energy transport by obtaining three glucose molecules
‘free’ relative to phosphate-driven sugar transport.41
The discovery of an explanation for the rapid anaerobic growth and
fermentation capabilities of C. thermocellum elevated this and similar
microorganisms to possible candidates for a viable industrial process for
the production of ethanol or other selected fermentation products,
including hydrogen. However, thus far candidate CBP microorganisms
all lack the preferred characteristics for the ideal ethanologen, as shown
in Table 19.2. Research efforts are under way in a number of laboratories
to address many of these limitations to take advantage of the inherent
biomass carbohydrate degradative capacity of these anaerobes.34–35,42
Table 19.2 Preferred characteristics of an ideal CBP microorganism
Produces target fermentation product as sole productHydrolyzes cellulose to fermentable oligomersHydrolyzes hemicellulose to fermentable oligomersFerments cellulose oligomersFerments xylose or xylose oligomersProduces target fermentation product in high titer (product resistance needed?)Resistant to up to 1% acetic acid derived from hemicelluloseGrows at thermophilic temperatures at 55–80 1CModerately resistant to common pretreatment inhibitors (furans, lignin aromatics)Produces a multi-carbohydrase portfolio on the cellulosome
555Biofuels and Biotechnology

19.2.2.3 Gasification for Ethanol
Thermochemical processing of biomass, as mentioned in the Introduc-
tion, is not the subject of this chapter, but it has the real advantage in
that any carbon-containing material can be converted rapidly with no
pretreatment. A process called gasification is a thermochemical conver-
sion process conducted in the absence of oxygen. With this process, all
carbon-based materials yield common molecular building blocks of CO2,
CO, H2O and H2. Gasification with oxygen produces synthesis gas with
typically about 40% CO, 40% H2, 3% CH4 and 17% CO2 on a volume
basis.43 Typical uses include generation of heat and power or as feedstock
for chemicals.44 However, the diversity of Nature has produced anae-
robic microorganisms that are able to utilize the aforementioned gasified
products to grow and produce byproducts of fermentation. One micro-
organism, C. ljungdahlii, is of particular interest because it produces
primarily ethanol under certain conditions along with smaller amounts
of acetic acid and hydrogen. Engineering research has been under way
for over 15 years to develop a commercial process with this unique
fermentation process45–48 and commercialization is apparently moving
forward (http://alicoinc.com/news_releases/2007/03-01-07A.html). How-
ever, little genetic improvement has occurred with these types of micro-
organism, providing a potentially fertile ground for biotechnological
improvement.
19.2.3 Biodiesel
Biodiesel is either a derivative of triglycerides resulting in a fatty acid
methyl ester (FAME) or the result of thermochemical conversion of
biomass. The feedstock for FAME biodiesel is typically soybean oil in the
USA or rapeseed/canola in Europe or Canada, although waste grease
and fat from food operations can serve as feedstocks. However, the
conversion technology to produce the FAME is the very mature, low-cost
chemical transesterification process, which permits little opportunity for
alternative processes such as enzymatic esterification.49–51 The process
entails blending a triglyceride with an alcohol, usually methanol, in molar
excess with an alkaline catalyst such as methoxide that caused the
methanol to replace glycerol ester to the fatty acid yielding free glycerol
and a FAME. The most significant opportunity for process and product
improvement lies in the selection of alternative crop species beyond
soybeans, and canola fills this niche to some extent. However, the prime
driver for alternative crop species is both high yield of oil per acre and an
optimal degree of unsaturation. Soybeans typically yield about 376 lb per
acre of oil whereas canola produces about twice that amount per acre.52
556 Chapter 19
The degree of unsaturation is important in order to provide a degree of
cold tolerance when blended with petroleum diesel at the 20% level, but
oxidative instability is caused by the excessive double bond content.
Canola is nearly 92% unsaturated but 63% of the fatty acids have only
one double bond compared with 84% and 25% for soybean oil,
respectively. Ideal plant species, such as an improved canola that has
higher productivity and is able to be grown at in warmer mid-latitudes,
should be the subject of plant breeding and bioengineering. Recent
production expansion aims at producing 1.8 billion US gallons, but only
0.33 billion gallons are in production at present. Unfortunately, the
current cost of soybean oil has risen from $0.31 to $0.55 per pound,
causing plants to reconsider operation.53 Germany, the largest producer
of biodiesel, is facing market problems for very different reasons as of
January 2008 due to large Federal tax increases, and this threatens the
otherwise huge production from canola/rapeseed.
19.3 APPLICATION OF BIOTECHNOLOGY TOOLS TO
BIOFUELS PROCESSES
Technologies for biofuel production vary in the degree of process
maturity from highly refined corn ethanol and FAME biodiesel pro-
duction to emerging technologies for production of ethanol and ther-
mochemical biodiesel, not to mention nascent renewable gasoline
production schemes. Therefore, these technologies provide varying
degrees of potential improvement by advanced biotechnology tools
collectively called system biology tools. A system biology approach
essentially examines a biological process holistically at the system or
total biological process level, including the system’s genetic content
(genome), gene expression, enzyme and protein production, flow of
metabolic intermediates and resulting interaction with the genome and
enzymatic processes. An example of application of system biology tools
is the examination of differential expression of the genome by tran-
scriptomic analysis using whole genome microarray methods where
theoretically the degree of differential expression of every gene can be
examined. Such an approach provides potential insights into the inter-
action of multiple gene systems and pathways. A companion biological
tool is examination of the proteins present within a biological system,
called a proteome, using advanced protein processing and analysis tools.
Combining the transcriptome and the proteome data and analysis of
results can provides unparalleled information needed to begin to
understand the functioning of a biological system.
557Biofuels and Biotechnology
Critical to most of these system biology tools is access to the genomic
sequence data as they form the foundation of gene expression and pro-
teome analysis. Fortunately, genome sequence technology is advancing
at an immense pace where bacterial genome sequencing is measured in
hours and genome maps can be constructed and genes identified in
weeks. This genomic information is used to construct microarrays using
selected oligonucleotides for coding regions of the genome. The oligo-
nucleotides are attached to a solid support and used for hybridization
studies with labeled cDNA produced from RNA from selected biological
samples. Due in part to the vagaries of nucleic hybridization, differential
hybridization is often used with RNA from two samples from different
biological conditions labeled with different molecular tags. The micro-
array is able to detect difference in expression of specific genes by the
ratio of hybridization by competing labeled RNAs produced from two
different experimental conditions. Use of this technology is growing
rapidly, spawning numerous companies and supportive products with
improved data sets.1
Analysis of proteins expressed by a biological system, called pro-
teomics, can provide valuable information regarding the biological
process functioning in a specific environment especially regarding the
presence of specific enzymes for known biological processes. Like tran-
scriptomics, proteomic analysis of protein expression requires knowledge
of the system’s genome sequence, whether it is a complex biological
system with multiple (micro)organisms or a biological process func-
tioning with a single (micro)organism. Early proteomic analysis exam-
ined proteins using two-dimensional gel analyses, which is a particularly
challenging technique to obtain acceptable separation of the thousands
of proteins present in microbial, let alone eukaryotic, cells. Gel-based
proteomic analysis has largely been replaced with mass spectrometric
analysis aided by various initial sample separation technologies such as
liquid chromatography. With advanced separation and detection
instrumentation, detection of nearly all the soluble proteins present in a
microorganism, called the ‘whole proteome’, can be accomplished.54
However, the proteome analysis can miss poorly expressed proteins and
hard to capture hydrophobic and membrane proteins.
Of particular interest are the alterations in the enzymes and other
proteins present in a biological system as conditions change and the
biological system responds to a changing environment. However, both
proteomics and transcriptomics are limited to the degree of accuracy of
gene calling where the gene function has been assigned to open reading
frames in the genome. Additionally, the function of numerous theore-
tical genes or open reading frames remains unknown even within the
558 Chapter 19
genome of E. coli, the most studied organism, limiting full under-
standing of a biological system. An additional challenge is that the
reason for the change in thousands of genes seen by differential tran-
scriptomic or proteomic analysis is often unknown due the lack of
holistic knowledge of the gene expression cascades at the organism level.
During biofuel production, the cell’s metabolic content, called meta-
bolome, changes in response to the fermentation conditions. Through
knowledge of the internal and external biochemicals present, which are
the result of ongoing metabolic activity, much can be learned about the
overall operation and functioning of the biological system under
investigation. With temporal evaluation of metabolism, particularly
after a perturbation or substrate addition, the flow of biological inter-
mediates and precursor–product relationships can be determined. This
analysis of the flow of metabolic intermediates, or fluxomics, is valuable
both to understand the functions of a biological system and to determine
metabolic responses to environmental or process changes or stimuli. A
true systems biology analysis of a biological process will involve all the
aforementioned ‘omics’ analysis tools to understand an ongoing biolo-
gical process. A prime example of systems biology tools application is
the process of bacterial sporulation, where known environmental stimuli
(such a nitrogen deficiency) lead to a cascade of gene and protein
expression culminating in the construction of biological survival system,
the bacterial endospore.55 All these ‘omics’ tools have the potential also
to delineate the biological processes under way during biofuels pro-
duction, thus potentially providing knowledge whose use may provide
keys to making significant improvements in the microorganism and
engineered processes, yielding more economical biofuels production.
19.3.1 Improved Production of Corn Ethanol
The production of ethanol from corn or grain starch is mature tech-
nology that was the target of early genetic engineering enzyme pro-
duction in the early 1980s with the cloning and expression of the key
enzymes required for glucose production. For example, a-amylase,
glucoamylase and other accessory enzymes such as pullulanase and
isomaltase needed for cleavage of a-1,4- and a-1,6-glyceride linkages in
starch and elimination of reversion sugars56–60 were genetically cloned
and made commercially available. Production of many of these enzymes
proceeded through classical protein engineering improvement strategies
to improve thermostability, pH optimum/stability and specific activity
in conjunction with genetic and process improvements to improve the
volumetric productivity of the enzyme fermentation.61,62 Improvements
559Biofuels and Biotechnology
in characteristics and production levels of these enzymes have expanded
applications, but the largest markets for enzymes, such as sweetener and
detergent enzymes, has become a commodity business. This has made
further research for incremental improvements difficult to support.63
The fermentation microorganism Saccharomyces cerevisiae is a highly
productive and efficient producer of ethanol from glucose within both
the wet and dry mill processes. However, opportunities remain for
process improvement using new approaches to analyze the metabolic
limitations that may arise. Fundamental analysis of the S. cerevisiae
genome has been investigated for laboratory fermentation.64,65 In
addition, this technology has been applied in the beer and wine industry
with the temporal analysis of the fermentation of simple sugars by
S. cerevisiae.66 Interesting differences have been detected among wine
yeast strains that ferment primarily glucose and fructose from wine
grapes Vitis vinifera L. For example. microarray analysis of natural
vineyard populations of S. cerevisiae found significant differences in
amino acid expressions, especially methionine, which showed that the
natural population can vary significantly in gene expression due to
segregation patterns of relatively few genes.67 These differences pre-
sumably may impact flavor components in the fermentation broth, in
this case wine. In addition, transcriptomic analysis has been used to
determine the impact of high ethanol levels routinely reached during
fermentation, especially with wine and champagne yeast where ethanol
tolerance is required to meet product specifications.68 A more holistic
approach has been taken for beer production where the yeast must
ferment hydrolyzed starch from added grains along with supplemented
sugar. Distinct differences detected in the proteome of ale versus lager
beer yeast have allowed researchers to conclude that the yeast involved
has undergone significant interspecies hybridization and evolution as a
‘genetic tree’ can be derived with selected yeast.49,69 To some extent it is
encouraging that very traditional, long-standing industries such as wine
and beer manufacturing have already applied the tools of systems
biology to their craft, yielding potentially beneficial insights into product
improvement.
Among all yeast fermentations, glycerol has long been accepted as an
expected co-product of ethanol production, which must be removed
during processing, especially for the fuel alcohol industry. Significant
progress has been made in understanding why glycerol is produced,
providing an avenue to strain improvement. It has been determined that
glycerol is produced or induced as an osmotic stress response.70 Indeed,
mutant analysis has made progress in identifying specific mutant
changes that impact glycerol production, permitting strategies for
560 Chapter 19

reduction of glycerol production including strategies to limit substrate,
modify acid/base additions or other known engineering conditions
present in commercial fermenters.71,72 Further research is needed as
additional S. cerevisiae glycerol mutants are produced. Through rapid
sampling and processing, the yeast RNA can be acquired and processed
for gene expression analysis, for example, providing information on the
gene expression under way even from industrial-sized fermenters. This
information, coupled with closely monitored fermentation broth etha-
nol, glycerol and other byproducts (external metabolome), will provide
information on the fermentation temporal changes permitting engi-
neering and possible genetic engineering solutions as needed. However,
such investigations must be limited to on-going inefficiencies or diffi-
culties that impose a sufficient economic burden to warrant research
time and costs.
19.3.2 Ethanol Production from Biomass
19.3.2.1 SHF and SSF Processing
Enzyme manufacture for SHF and SSF/SSCF applications have grown
in anticipation of biomass ethanol biorefineries that will require cellu-
lases and other biomass enzymes. An important producer of cellulases
for biomass hydrolysis is Trichoderma reesei and Genencor/Danisco has
used microarray technology to evaluate and presumably improve the
enzyme production.73 Similar approaches are undoubtedly underway at
Novozymes and other enzyme manufacturers, but much will remain
unavailable until patent application publication. Target enzymes include
1,4-b-cellobiosidases and endo-1,4-b-D-xylanases. Indeed, Wilson has
used microarray and proteomic analysis to detect induction of a xyla-
nase with cellobiose by a biomass degrading bacterium T. fusca.74
Finally, in the Fall of 2007, Genencor launched a new enzyme formu-
lation intended for SSF conversion, called Accellerase, which is a blend
of cellulases and cellobiosidases (genencor.com).
The process for production of ethanol from biomass described earlier
contains two biological unit operations: enzymatic hydrolysis of the
complex biomass carbohydrates cellulose and hemicellulose that remain
after pretreatment by exogenously added enzymes, and fermentation of
the resulting simple carbohydrates by an ethanologenic microorganism
to ethanol. The latter fermentation operation can comprise two fermen-
tations: conversion of cellulose-derived glucose to ethanol and fermen-
tation of hemicellulose-derived pentose/xylose sugars to ethanol.
Depending on the fermentation capabilities of the ethanologenic micro-
organism chosen, either one or two fermentation steps are required,
561Biofuels and Biotechnology
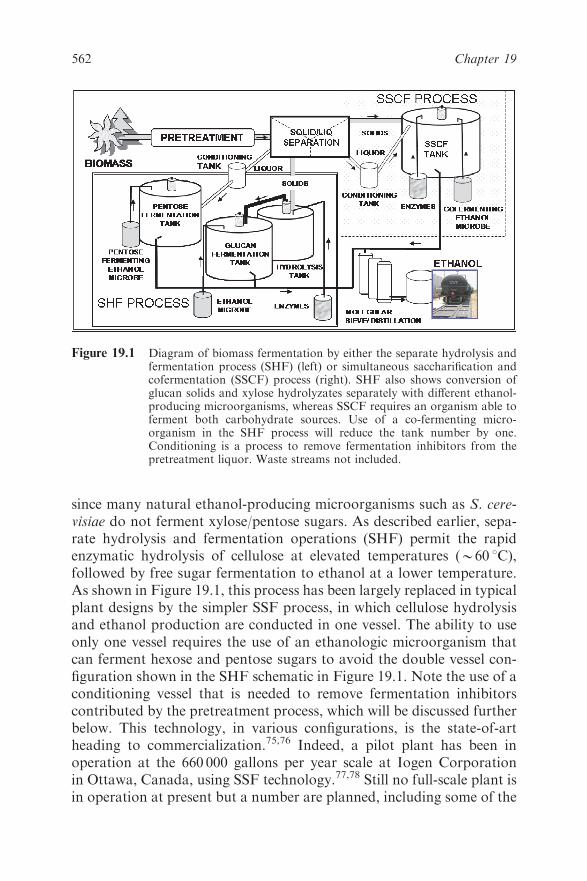
since many natural ethanol-producing microorganisms such as S. cere-
visiae do not ferment xylose/pentose sugars. As described earlier, sepa-
rate hydrolysis and fermentation operations (SHF) permit the rapid
enzymatic hydrolysis of cellulose at elevated temperatures (B60 1C),
followed by free sugar fermentation to ethanol at a lower temperature.
As shown in Figure 19.1, this process has been largely replaced in typical
plant designs by the simpler SSF process, in which cellulose hydrolysis
and ethanol production are conducted in one vessel. The ability to use
only one vessel requires the use of an ethanologic microorganism that
can ferment hexose and pentose sugars to avoid the double vessel con-
figuration shown in the SHF schematic in Figure 19.1. Note the use of a
conditioning vessel that is needed to remove fermentation inhibitors
contributed by the pretreatment process, which will be discussed further
below. This technology, in various configurations, is the state-of-art
heading to commercialization.75,76 Indeed, a pilot plant has been in
operation at the 660 000 gallons per year scale at Iogen Corporation
in Ottawa, Canada, using SSF technology.77,78 Still no full-scale plant is
in operation at present but a number are planned, including some of the
Figure 19.1 Diagram of biomass fermentation by either the separate hydrolysis andfermentation process (SHF) (left) or simultaneous saccharification andcofermentation (SSCF) process (right). SHF also shows conversion ofglucan solids and xylose hydrolyzates separately with different ethanol-producing microorganisms, whereas SSCF requires an organism able toferment both carbohydrate sources. Use of a co-fermenting micro-organism in the SHF process will reduce the tank number by one.Conditioning is a process to remove fermentation inhibitors from thepretreatment liquor. Waste streams not included.
562 Chapter 19
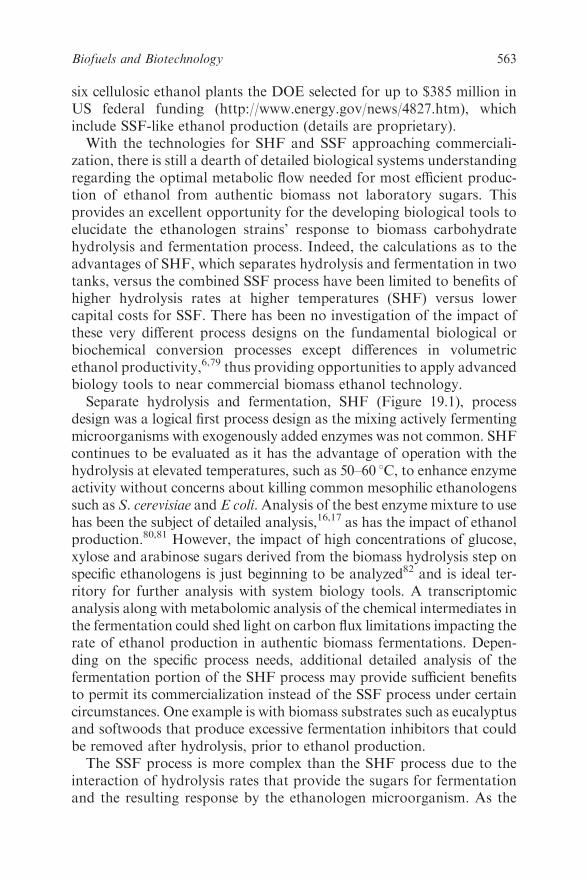
six cellulosic ethanol plants the DOE selected for up to $385 million in
US federal funding (http://www.energy.gov/news/4827.htm), which
include SSF-like ethanol production (details are proprietary).
With the technologies for SHF and SSF approaching commerciali-
zation, there is still a dearth of detailed biological systems understanding
regarding the optimal metabolic flow needed for most efficient produc-
tion of ethanol from authentic biomass not laboratory sugars. This
provides an excellent opportunity for the developing biological tools to
elucidate the ethanologen strains’ response to biomass carbohydrate
hydrolysis and fermentation process. Indeed, the calculations as to the
advantages of SHF, which separates hydrolysis and fermentation in two
tanks, versus the combined SSF process have been limited to benefits of
higher hydrolysis rates at higher temperatures (SHF) versus lower
capital costs for SSF. There has been no investigation of the impact of
these very different process designs on the fundamental biological or
biochemical conversion processes except differences in volumetric
ethanol productivity,6,79 thus providing opportunities to apply advanced
biology tools to near commercial biomass ethanol technology.
Separate hydrolysis and fermentation, SHF (Figure 19.1), process
design was a logical first process design as the mixing actively fermenting
microorganisms with exogenously added enzymes was not common. SHF
continues to be evaluated as it has the advantage of operation with the
hydrolysis at elevated temperatures, such as 50–60 1C, to enhance enzyme
activity without concerns about killing common mesophilic ethanologens
such as S. cerevisiae and E coli. Analysis of the best enzyme mixture to use
has been the subject of detailed analysis,16,17 as has the impact of ethanol
production.80,81 However, the impact of high concentrations of glucose,
xylose and arabinose sugars derived from the biomass hydrolysis step on
specific ethanologens is just beginning to be analyzed82 and is ideal ter-
ritory for further analysis with system biology tools. A transcriptomic
analysis along with metabolomic analysis of the chemical intermediates in
the fermentation could shed light on carbon flux limitations impacting the
rate of ethanol production in authentic biomass fermentations. Depen-
ding on the specific process needs, additional detailed analysis of the
fermentation portion of the SHF process may provide sufficient benefits
to permit its commercialization instead of the SSF process under certain
circumstances. One example is with biomass substrates such as eucalyptus
and softwoods that produce excessive fermentation inhibitors that could
be removed after hydrolysis, prior to ethanol production.
The SSF process is more complex than the SHF process due to the
interaction of hydrolysis rates that provide the sugars for fermentation
and the resulting response by the ethanologen microorganism. As the
563Biofuels and Biotechnology
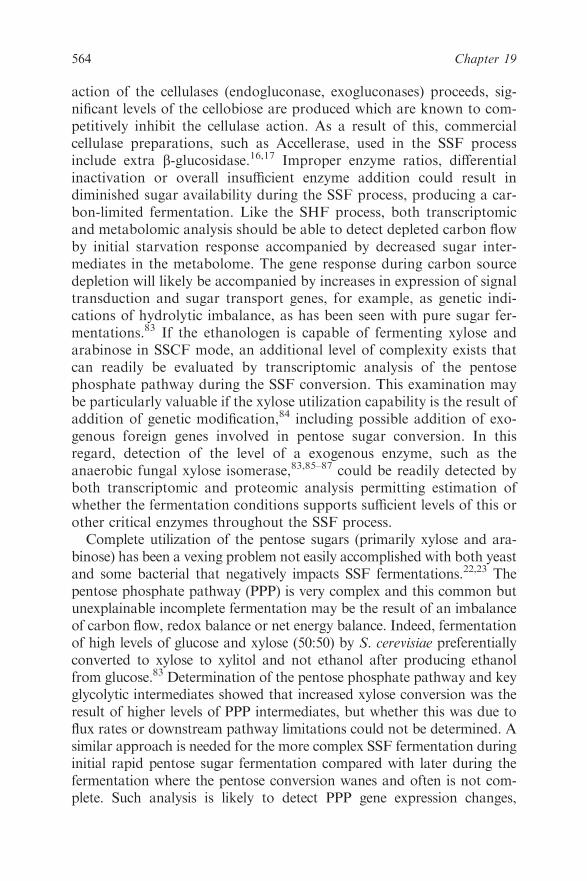
action of the cellulases (endogluconase, exogluconases) proceeds, sig-
nificant levels of the cellobiose are produced which are known to com-
petitively inhibit the cellulase action. As a result of this, commercial
cellulase preparations, such as Accellerase, used in the SSF process
include extra b-glucosidase.16,17 Improper enzyme ratios, differential
inactivation or overall insufficient enzyme addition could result in
diminished sugar availability during the SSF process, producing a car-
bon-limited fermentation. Like the SHF process, both transcriptomic
and metabolomic analysis should be able to detect depleted carbon flow
by initial starvation response accompanied by decreased sugar inter-
mediates in the metabolome. The gene response during carbon source
depletion will likely be accompanied by increases in expression of signal
transduction and sugar transport genes, for example, as genetic indi-
cations of hydrolytic imbalance, as has been seen with pure sugar fer-
mentations.83 If the ethanologen is capable of fermenting xylose and
arabinose in SSCF mode, an additional level of complexity exists that
can readily be evaluated by transcriptomic analysis of the pentose
phosphate pathway during the SSF conversion. This examination may
be particularly valuable if the xylose utilization capability is the result of
addition of genetic modification,84 including possible addition of exo-
genous foreign genes involved in pentose sugar conversion. In this
regard, detection of the level of a exogenous enzyme, such as the
anaerobic fungal xylose isomerase,83,85–87 could be readily detected by
both transcriptomic and proteomic analysis permitting estimation of
whether the fermentation conditions supports sufficient levels of this or
other critical enzymes throughout the SSF process.
Complete utilization of the pentose sugars (primarily xylose and ara-
binose) has been a vexing problem not easily accomplished with both yeast
and some bacterial that negatively impacts SSF fermentations.22,23 The
pentose phosphate pathway (PPP) is very complex and this common but
unexplainable incomplete fermentation may be the result of an imbalance
of carbon flow, redox balance or net energy balance. Indeed, fermentation
of high levels of glucose and xylose (50:50) by S. cerevisiae preferentially
converted to xylose to xylitol and not ethanol after producing ethanol
from glucose.83 Determination of the pentose phosphate pathway and key
glycolytic intermediates showed that increased xylose conversion was the
result of higher levels of PPP intermediates, but whether this was due to
flux rates or downstream pathway limitations could not be determined. A
similar approach is needed for the more complex SSF fermentation during
initial rapid pentose sugar fermentation compared with later during the
fermentation where the pentose conversion wanes and often is not com-
plete. Such analysis is likely to detect PPP gene expression changes,
564 Chapter 19
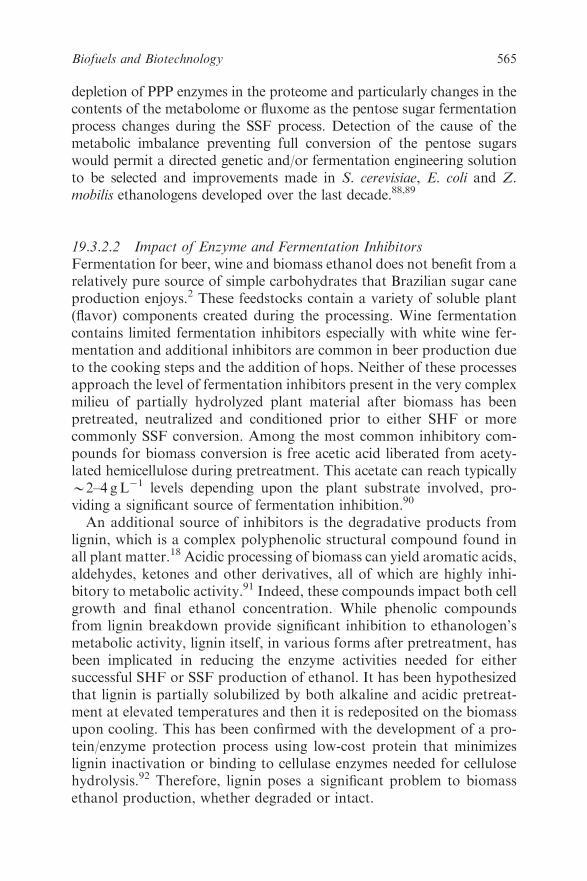
depletion of PPP enzymes in the proteome and particularly changes in the
contents of the metabolome or fluxome as the pentose sugar fermentation
process changes during the SSF process. Detection of the cause of the
metabolic imbalance preventing full conversion of the pentose sugars
would permit a directed genetic and/or fermentation engineering solution
to be selected and improvements made in S. cerevisiae, E. coli and Z.
mobilis ethanologens developed over the last decade.88,89
19.3.2.2 Impact of Enzyme and Fermentation Inhibitors
Fermentation for beer, wine and biomass ethanol does not benefit from a
relatively pure source of simple carbohydrates that Brazilian sugar cane
production enjoys.2 These feedstocks contain a variety of soluble plant
(flavor) components created during the processing. Wine fermentation
contains limited fermentation inhibitors especially with white wine fer-
mentation and additional inhibitors are common in beer production due
to the cooking steps and the addition of hops. Neither of these processes
approach the level of fermentation inhibitors present in the very complex
milieu of partially hydrolyzed plant material after biomass has been
pretreated, neutralized and conditioned prior to either SHF or more
commonly SSF conversion. Among the most common inhibitory com-
pounds for biomass conversion is free acetic acid liberated from acety-
lated hemicellulose during pretreatment. This acetate can reach typically
B2–4 gL�1 levels depending upon the plant substrate involved, pro-
viding a significant source of fermentation inhibition.90
An additional source of inhibitors is the degradative products from
lignin, which is a complex polyphenolic structural compound found in
all plant matter.18Acidic processing of biomass can yield aromatic acids,
aldehydes, ketones and other derivatives, all of which are highly inhi-
bitory to metabolic activity.91 Indeed, these compounds impact both cell
growth and final ethanol concentration. While phenolic compounds
from lignin breakdown provide significant inhibition to ethanologen’s
metabolic activity, lignin itself, in various forms after pretreatment, has
been implicated in reducing the enzyme activities needed for either
successful SHF or SSF production of ethanol. It has been hypothesized
that lignin is partially solubilized by both alkaline and acidic pretreat-
ment at elevated temperatures and then it is redeposited on the biomass
upon cooling. This has been confirmed with the development of a pro-
tein/enzyme protection process using low-cost protein that minimizes
lignin inactivation or binding to cellulase enzymes needed for cellulose
hydrolysis.92 Therefore, lignin poses a significant problem to biomass
ethanol production, whether degraded or intact.
565Biofuels and Biotechnology

Dilute acid pretreatment and steam or hot water pretreatment result in
an acidic environment during the initial biomass processing steps, whe-
ther from added acids or self-generated acetic acid from hemicellulose
deacetylation. It is known that acid attack on sugars leads to the pro-
duction of degradation products called furans, with xylose yielding fur-
fural and glucose yielding hydroxymethylfurfural. This chemical reaction
is accelerated at the high temperatures needed for effective pretreatment.
These furan derivatives not only emanate from monomeric sugars, but
also kinetic analysis has determined that intact cellulose and cellulose
oligomers are subject to acid attack generating furan inhibitors.10,93
Regardless of the source, the pretreatment process must be operated
carefully to minimize the excessive acidic hydrolysis of both the hemi-
cellulose and cellulose since these furans are highly toxic to all ethano-
logenic microorganisms tested.94 Fortunately, there are a number of
processes, collectively called conditioning (Figure 19.1), that can be used
to minimize or eliminate the toxic byproducts of pretreatment of bio-
mass, which include the over-liming process,95–98 that permit fermenta-
tion processes to proceed with a variety of ethanologen microorganisms.
Addition of fermentation inhibitors during ethanol production is
needed to elucidate the metabolic impact of the myriad of chemical
inhibitors, each of which may have a different impact on the fermentation
process. Transcriptomic analysis before and immediately after charging
fermentation with the selected inhibitor would be a powerful approach to
detecting directly the impact of that inhibitor on the biological processes
that occur during the fermentation. Work is under way at the USDA
laboratory in Peoria, IL, to investigate the impact of furfural and
hydroxyfurfurals on S. cerevisiae fermentations and has resulting in the
detection of specific genes associated with the pentose phosphate path-
way for xylose utilization that mitigates the inhibitory response.99,100
Their results using microarray analysis indicate that there is a non-
transitory multigene response to furfural addition that eventually leads to
adaptation to this potent metabolic inhibitor and provide ample
opportunities for further evaluation of a very complex genetic response.
19.2.2.3 Consolidated Bioprocessing
A process for production of biomass ethanol without addition of exo-
genous cellulase enzymes has been under development for years using
mesophilic and thermophilic anaerobes capable of growing and fer-
menting cellulose to ethanol and other fermentative byproducts. This
process is called consolidated bioprocessing (CBP) due to the elimina-
tion of the requirement for exogenously added enzymes as needed by the
566 Chapter 19
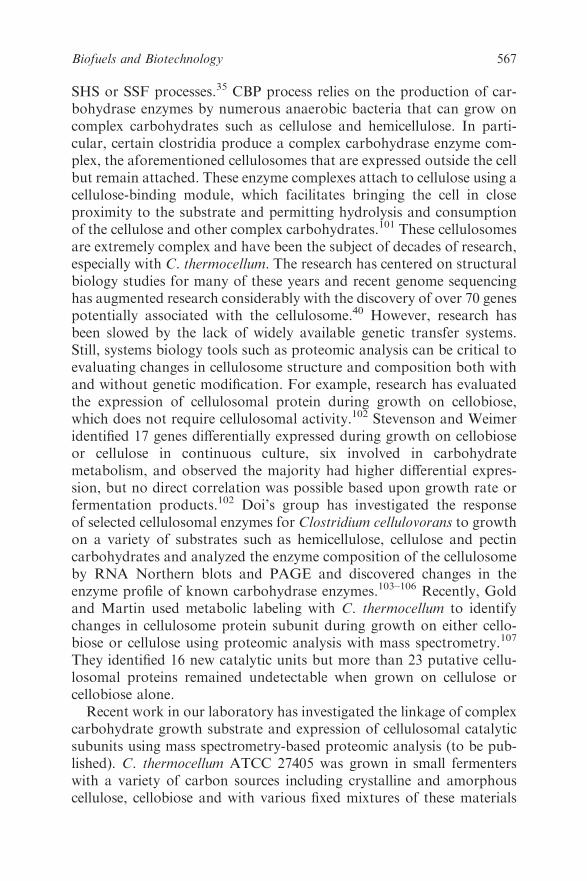
SHS or SSF processes.35 CBP process relies on the production of car-
bohydrase enzymes by numerous anaerobic bacteria that can grow on
complex carbohydrates such as cellulose and hemicellulose. In parti-
cular, certain clostridia produce a complex carbohydrase enzyme com-
plex, the aforementioned cellulosomes that are expressed outside the cell
but remain attached. These enzyme complexes attach to cellulose using a
cellulose-binding module, which facilitates bringing the cell in close
proximity to the substrate and permitting hydrolysis and consumption
of the cellulose and other complex carbohydrates.101 These cellulosomes
are extremely complex and have been the subject of decades of research,
especially with C. thermocellum. The research has centered on structural
biology studies for many of these years and recent genome sequencing
has augmented research considerably with the discovery of over 70 genes
potentially associated with the cellulosome.40 However, research has
been slowed by the lack of widely available genetic transfer systems.
Still, systems biology tools such as proteomic analysis can be critical to
evaluating changes in cellulosome structure and composition both with
and without genetic modification. For example, research has evaluated
the expression of cellulosomal protein during growth on cellobiose,
which does not require cellulosomal activity.102 Stevenson and Weimer
identified 17 genes differentially expressed during growth on cellobiose
or cellulose in continuous culture, six involved in carbohydrate
metabolism, and observed the majority had higher differential expres-
sion, but no direct correlation was possible based upon growth rate or
fermentation products.102 Doi’s group has investigated the response
of selected cellulosomal enzymes for Clostridium cellulovorans to growth
on a variety of substrates such as hemicellulose, cellulose and pectin
carbohydrates and analyzed the enzyme composition of the cellulosome
by RNA Northern blots and PAGE and discovered changes in the
enzyme profile of known carbohydrase enzymes.103–106 Recently, Gold
and Martin used metabolic labeling with C. thermocellum to identify
changes in cellulosome protein subunit during growth on either cello-
biose or cellulose using proteomic analysis with mass spectrometry.107
They identified 16 new catalytic units but more than 23 putative cellu-
losomal proteins remained undetectable when grown on cellulose or
cellobiose alone.
Recent work in our laboratory has investigated the linkage of complex
carbohydrate growth substrate and expression of cellulosomal catalytic
subunits using mass spectrometry-based proteomic analysis (to be pub-
lished). C. thermocellum ATCC 27405 was grown in small fermenters
with a variety of carbon sources including crystalline and amorphous
cellulose, cellobiose and with various fixed mixtures of these materials
567Biofuels and Biotechnology
with hemicellulose and/or pectin. These experiments were conducted
with 15N metabolic labeling and multi-dimensional LC–MS/MS pro-
teomic analysis. Interesting patterns of expression of endogluconases
were observed with fermentations of crystalline and amorphous cellulose
and cellobiose at the individual enzyme family level. Xylanase enzyme
expression was poorly responsive to cellulose and increased in expression
in the presence of cellobiose. Not surprisingly, sinceC. thermocellum does
not metabolize xylose and other pentose sugars, xylanase enzymes
showed no specific pattern of induction in the absence of cellulose.
However, more than 21 additional cellulosomal proteins were detected
and specific responses to alternative non-cellulose substrates were
observed. This study forms the foundation for the analysis of the cellu-
losomal composition present during the fermentation of natural biomass
substrates such as switchgrass and poplar that are the subject of on-going
research.
Genetic transformation systems have been developed for specific
microorganisms capable of CBP, which opens heretofore closed doors
for strain development aimed at the cellulosome and other metabolic
processes. For example, genetic systems have been developed for a
limited number of anaerobic cellulose-hydrolyzing microorganisms
including Clostridium cellulolyticum,108 C. thermocellum109 and Ther-
moanaerobacterium saccharolyticum.110 These genetic tool developments
position the researchers to investigate the structure–function relation-
ship of cellulosome gene components and the intricacies of the cellulose
fermentation. An example of the power of a genetic system is seen with
the recent genetic engineering of T. saccharolyticum into a homoethano-
logenic bacterium.111 This thermophilic anaerobe ferments preferen-
tially hemicellulose through the action of its portfolio of hemicellulases
and produce by fermentation ethanol, lactic acid, acetic acid and
hydrogen. Genetic engineering strategies were used specifically to block
key genes in the acetate and lactate pathways, thus terminating the
production of these common fermentative organic acids. Through suc-
cessive genetic blocking strategies, lactic acid production was eliminate
first,112 followed by disruption of the acetate pathway, with an indust-
rially important compensating increasing in ethanol production.111 With
the elimination of organic acid production, this genetically developed
strain of T. saccharolyticum has the potential to be developed into a
useful microorganism for conversion of the hemicellulose portion of
biomass that is particularly present in the alkaline pretreatment methods
due to the lack of acid-catalyzed hemicellulose depolymerization.113
Development of a holistic picture of a biological system requires that
gene and protein expression be examined and analyzed. This can be
568 Chapter 19
further connected to any resulting metabolic products, either extra-
cellular as is common for fermentation processes or for intracellular
metabolites, both typically detected by advance mass spectrometric
techniques. This combined approach has recently been applied to the
complex process of fermentation of cellulose or cellobiose to metabolic
products (ethanol, acetate and lactate) in our laboratory. The experi-
mental approach was the fermentation of either cellulose or cellobiose
by C. thermocellum using two identical fermenters for dual biological
replicates. Fermentations were sampled throughout exponential and
stationary phase to the point of full carbon source depletion.
The transcriptomic analysis was conducted using the complete gen-
ome sequence that was completed by the US DOE Joint Genome
Institute (JGI) (http://genome.jgi-psf.org/finished_microbes/cloth/cloth.
home.html) using microarrays prepared at ORNL with 70-mer oligo-
nucleotides for predicted ORFs and employing differential dye tagging
as standard protocols.114 Typical fermentations yielded six sample
points, so the differential microarray analysis was conducted in a variety
of ways both within a single type of fermentation (cellobiose or cellu-
lose) during exponential versus stationary growth or between fermen-
tations (cellobiose versus cellulose). Analysis of the differential
expression between cellobiose and cellulose fermentations yielded
numerous differences, which included a strong induction of cellulosomal
proteins as the culture reached stationary phase regardless of carbon
source (to be published). Both cultures supported higher levels of energy
and biosynthetic pathways as expected for a rapidly growing culture.
Analysis between different carbon source cultures at either late expo-
nential or stationary phase showed strong induction of cellulosomal
proteins during active growth that tapered upon reaching the stationary
phase. Although these are global analyses based upon functional
groups, more detailed comparisons are under way with this total tran-
scriptomic analysis. One approach that assists in this further analysis is
cluster analysis for gene expression during six time points within fer-
mentation. Cluster analysis for the cellulose fermentation permitted
both clustering based on similar temporal comparisons and multiple
categories of gene patters were observed with about 378 genes showing
near level expression, while 192 genes showed significant decreasing
expression throughout the fermentation. By comparison, 424 genes
showed increasing genes expression throughout the fermentation pro-
cess and 145 genes showed dramatic increased expression only upon
reaching late stationary. Interestingly, only 11 of the expressed genes
within this latter set were from the multi-gene sporulation pathway
which contains 51 identified genes involved in sporulation. This is
569Biofuels and Biotechnology
apparently because the minimal medium used for our research does not
support sporulation of C. thermocellum (to be published).
Global or even functional group analysis provides information on
general trends but analysis of specific gene patterns found within the
huge database that microarrays provide can investigate specific ques-
tions. Among the logical targets for C. thermocellum are genes that
impact ethanol production. C. thermocellum produces ethanol and
organic acids acetate and lactate during fermentation, but these latter
metabolites detract from the ethanol yield. Elimination of these organic
acids by classical genetic engineering would be the preferred approach.
Examination of the genome of C. thermocellum detected two structural
genes for lactate dehydrogenase (LDH) in the pathway to lactic acid
production. One of these genes has been cloned from C. thermocellum
ATCC 27405.115 It is not known if they were functional duplications or
spurious crossovers, but knowledge of the expression of both genes
would likely simplify the genetic engineering approach. Examination of
the genetic expression of LDH by microarray analysis showed that
indeed there was a significant difference in expression of two genes. One
LDH gene (Genome ID Cthe0345) showed continuous temporal
expression in cells grown on cellulose, whereas the other (Genome ID
Cthe1053) did not demonstrate any significant expression under the
conditions used. Apparently only one gene is strongly expressed and
should be the initial target for genetic modification or knockout.
Interestingly, the gene that was cloned by Ozkan et al.115 was Cthe1053
and it demonstrated LDH activity when put under expression of the lac
promoter. Either the gene regulatory signals for the Cthe1053 were
faulty or the regulatory signals prevented expression of this otherwise
functional Cthe1053 LDH gene under the conditions used at a high
enough level to be detected by the microarray.
In additional to gene expression patterns determined with micro-
arrays, examination of the proteins present in cells for different condi-
tions or different strains can shed additional light on the cell’s
metabolism. An important characteristic needed for C. thermocellum is
tolerance to ethanol. The wild-type C. thermocellum is tolerant to less
than 1% ethanol, but early researchers found that the microorganism
can adapt to increasing ethanol added to the selection culture and have
demonstrated growth in 2% ethanol.116 Strobel and co-workers have
developed a strain of C. thermocellum that can grow in as high at 7%
ethanol and used proteomic analysis to detect protein differences
between the wild-type and the stable adapted strains.117 The study
detected numerous differentially expressed membrane proteins that were
down-regulated in the ethanol-adapted strain, providing potential
570 Chapter 19
targets for genetic improvement by protein overexpression to introduce
tolerance in potential production strains. Due to the high homology of
Nature, it highly likely that genes that cause ethanol tolerance will
function in related microorganisms for an analogous homologous gene,
for example in T. saccharolyticum. Also, selection of production strains
resistant to inhibitors such as acetate, furfural and lignin monomers
remains an important potential avenue for strain improvement.
19.2.2.4 Gasification Ethanol Production
One of the most versatile processes for the utilization of carbonaceous
material is gasification, where the carbonaceous feedstock is converted
to CO, CO2, H2 and H2O. A gasifier can convert plant matter (biomass),
plastics and rubber to these compounds due to the high temperature
controlled anaerobic process. Interestingly, there are a group of anae-
robic bacteria, some thermophiles, which are able to convert these
gaseous compounds to cellular material and ethanol as a byproduct of
fermentation.48 The biochemistry uses the reductive acetyl-CoA path-
way to permit conversion of the synthesis gas to ethanol, acetate and
other chemical byproducts. The process uses high-density Clostridium
ljungdahlii as the microbial catalyst and, depending on the fermentation
conditions, either acetic acid or ethanol has been produced.118 Indeed,
production of acetic acid as a fermentation product has limited the yield
of ethanol under certain fermentation conditions. The process requires
gas to liquid to microorganism transfer, so improving mass transfer has
been the primary target of process improvement over the past 20
years.42–45 However, claims of up to 80% consumption of gases in a
specially designed fermenter have been made by BRI Engineering,
allowing potential commercialization of this process.
The potential for process improvement using genetic engineering of
the key enzymes acetyl-CoA synthase and CO dehydrogenase could
yield significant process improvements. Additionally, transcriptomic
and proteomic analysis of wild-type strains during syngas fermentation
would likely detect the level of expression of enzymes involved
in ethanol synthesis and acetate production, shedding light on the
importance of blocking acetate production. These include alcohol
dehydrogenase for ethanol synthesis and acetate kinase and phospho-
transacetylase for acetate production. Additionally, quantitative pro-
teomics could detect potential pathway limitations, providing guidance
for genetic engineering over expression of both predictable and unex-
pected proteins needed for syngas fermentation. To accomplish this, the
genome sequence of C. ljungdahlii is required. This microorganism is in
571Biofuels and Biotechnology
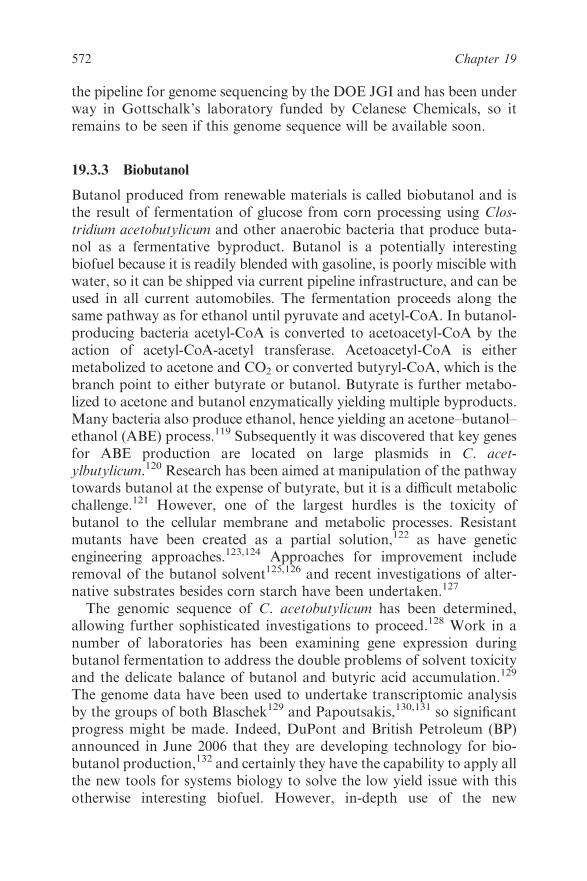
the pipeline for genome sequencing by the DOE JGI and has been under
way in Gottschalk’s laboratory funded by Celanese Chemicals, so it
remains to be seen if this genome sequence will be available soon.
19.3.3 Biobutanol
Butanol produced from renewable materials is called biobutanol and is
the result of fermentation of glucose from corn processing using Clos-
tridium acetobutylicum and other anaerobic bacteria that produce buta-
nol as a fermentative byproduct. Butanol is a potentially interesting
biofuel because it is readily blended with gasoline, is poorly miscible with
water, so it can be shipped via current pipeline infrastructure, and can be
used in all current automobiles. The fermentation proceeds along the
same pathway as for ethanol until pyruvate and acetyl-CoA. In butanol-
producing bacteria acetyl-CoA is converted to acetoacetyl-CoA by the
action of acetyl-CoA-acetyl transferase. Acetoacetyl-CoA is either
metabolized to acetone and CO2 or converted butyryl-CoA, which is the
branch point to either butyrate or butanol. Butyrate is further metabo-
lized to acetone and butanol enzymatically yielding multiple byproducts.
Many bacteria also produce ethanol, hence yielding an acetone–butanol–
ethanol (ABE) process.119 Subsequently it was discovered that key genes
for ABE production are located on large plasmids in C. acet-
ylbutylicum.120 Research has been aimed at manipulation of the pathway
towards butanol at the expense of butyrate, but it is a difficult metabolic
challenge.121 However, one of the largest hurdles is the toxicity of
butanol to the cellular membrane and metabolic processes. Resistant
mutants have been created as a partial solution,122 as have genetic
engineering approaches.123,124 Approaches for improvement include
removal of the butanol solvent125,126 and recent investigations of alter-
native substrates besides corn starch have been undertaken.127
The genomic sequence of C. acetobutylicum has been determined,
allowing further sophisticated investigations to proceed.128 Work in a
number of laboratories has been examining gene expression during
butanol fermentation to address the double problems of solvent toxicity
and the delicate balance of butanol and butyric acid accumulation.129
The genome data have been used to undertake transcriptomic analysis
by the groups of both Blaschek129 and Papoutsakis,130,131 so significant
progress might be made. Indeed, DuPont and British Petroleum (BP)
announced in June 2006 that they are developing technology for bio-
butanol production,132 and certainly they have the capability to apply all
the new tools for systems biology to solve the low yield issue with this
otherwise interesting biofuel. However, in-depth use of the new
572 Chapter 19

biological tool kit (‘the omics’) to this complex metabolic challenge will
likely assist further in solving this difficult process problem.
19.3.4 Biodiesel
As stated previously, transesterification (TE) is a mature chemical
process lending itself to minimal process improvement. As a chemical
conversion process, it has the inherent benefit of functioning at high
temperatures and pressures, providing very fast catalysis rates. Since the
reactants are simple (alcohol and triglycerides), process separations after
TE conversion are also relatively easy. This situation lends itself to
minimal if any competitive advantage of an enzyme catalyst such as
lipases,49 unless specific products such as surfactant esters are desired.
However, progress must be made to develop an alternative use for
glycerol, a significant byproduct of biodiesel production, if the biodiesel
business is to continue to expand.
19.3.5 New Concepts
At least two new companies have been formed recently that are aiming
at the production of petroleum-like products that can serve as renewable
gasoline or diesel. LS9 Inc. (www.LS9.com) in San Carlos, CA, was
founded by Professors George Church and Chris Sommerville of Har-
vard and Stanford University, respectively. LS9 intends to develop and
commercialize technology to convert renewable materials such as bio-
mass into highly reduced petroleum equivalents using a biotechnology-
based bioconversion process. Their website describes conversion of
renewable sugars and fatty acids, obtained from plant material or nat-
ural triglycerides in plant or animal fats and oils. If a fatty acid feedstock
is used the process apparently reduces the fatty acid C-terminus to a
reduced form such as a methyl group. While the process is essentially the
reverse of technology for production of dicarboxylic acids developed a
decade ago,133 this new process will likely face the same hurdles of high-
priced feedstock as witnessed with the biodiesel industry currently and
the cost of the chemical energy to drive the reductive processes. The
company has attracted significant venture capital investment for the
next few years.
The second company, Amyris Biotechnologies (www.amyr-
isbiotech.com), in Emeryville, CA, has similar business plan to produce
renewable gasoline and petroleum fuels from biomass feedstocks
through the application of synthetic biology. Their website describes
synthetic biology as ‘a new scientific discipline that involves the design
573Biofuels and Biotechnology

and construction of new biological parts or systems, as well as the re-
design of existing biological systems, for specific applications’. They are
developing a fermentation process for production of both a renewable
gasoline and a biodiesel and their website emphasizes technology
demonstrated for production of terpenoids by fermentation.134
These and similar companies face significant challenges, essentially
producing a highly reduced fuel from either approximately half-reduced
carbon (C6H12O6, hexose sugars) or expensive triglycerides and fatty
acids. The use of sugars from plants as feedstock will face the same cost
and conversion issues regarding efficient and effective hydrolysis of
carbohydrate polymers while avoiding inhibitory byproducts discussed
earlier. In addition, development of a microbial catalyst that provides its
own cellulases, etc., will be equally beneficial since the CBP process
concept is not limited to ethanol and alternative fermentation products
can be produced driven only by the microorganism’s genetic and
metabolic capabilities. Therefore, application of all the relevant systems
biology tools will likely be very beneficial to identify, for example,
biological processes that are inefficient regarding the use of valuable
reducing equivalents in their fermentation processes as well as the
understanding the impact of expected inhibitors generated during the
biomass fermentation regimens.
19.4 FUTURE PERSPECTIVES
Long term, regardless of the conversion technology, the supply of
renewable feedstock must fit the process for which it is destined. While
thermochemical processes, of course, have much less restrictions
regarding the biomass sources supplied, the biological conversion sys-
tems described here are dramatically impacted by the feedstock char-
acteristics and quality. Corn-based ethanol processes require a high
starch content and the seed grain suppliers have improved the corn
yields with high starch content kernels. However, the nascent biomass
energy industry is being built upon available residues from the food and
feed industry and, for maximum cost effectiveness, this must change.
An important additional aspect to consider is that there are numerous
types of plant biomass feedstocks available for biofuels production,135
ranging from herbaceous corn stover and switchgrass to woody sources
such as hardwoods and pine forest residues. Their composition varies
considerably with differences in the levels of cellulose, hemicellulose and
lignin, as shown in Table 19.3. Among the critical differences from a
process perspective are the levels of acetic acid and lignin, as these are
important contributors to fermentation inhibition.94,96–98 Process
574 Chapter 19
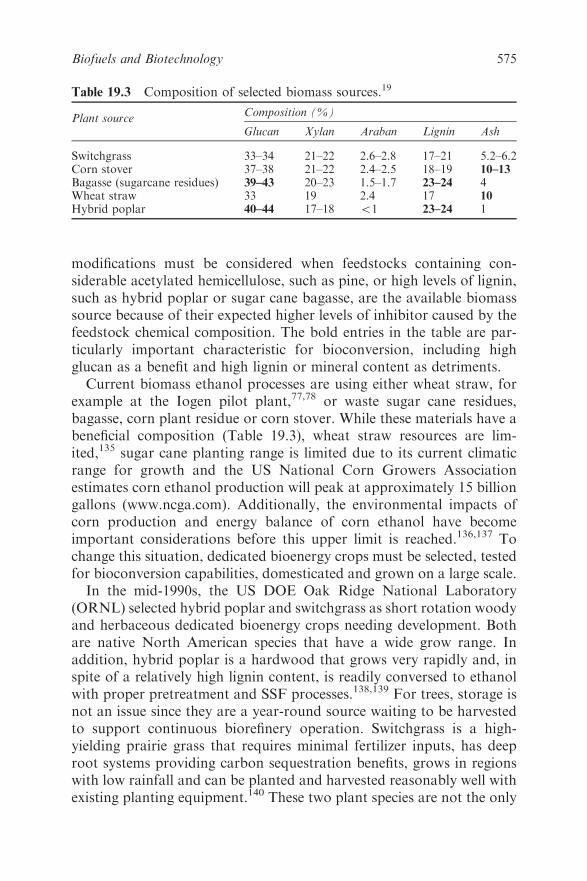
modifications must be considered when feedstocks containing con-
siderable acetylated hemicellulose, such as pine, or high levels of lignin,
such as hybrid poplar or sugar cane bagasse, are the available biomass
source because of their expected higher levels of inhibitor caused by the
feedstock chemical composition. The bold entries in the table are par-
ticularly important characteristic for bioconversion, including high
glucan as a benefit and high lignin or mineral content as detriments.
Current biomass ethanol processes are using either wheat straw, for
example at the Iogen pilot plant,77,78 or waste sugar cane residues,
bagasse, corn plant residue or corn stover. While these materials have a
beneficial composition (Table 19.3), wheat straw resources are lim-
ited,135 sugar cane planting range is limited due to its current climatic
range for growth and the US National Corn Growers Association
estimates corn ethanol production will peak at approximately 15 billion
gallons (www.ncga.com). Additionally, the environmental impacts of
corn production and energy balance of corn ethanol have become
important considerations before this upper limit is reached.136,137 To
change this situation, dedicated bioenergy crops must be selected, tested
for bioconversion capabilities, domesticated and grown on a large scale.
In the mid-1990s, the US DOE Oak Ridge National Laboratory
(ORNL) selected hybrid poplar and switchgrass as short rotation woody
and herbaceous dedicated bioenergy crops needing development. Both
are native North American species that have a wide grow range. In
addition, hybrid poplar is a hardwood that grows very rapidly and, in
spite of a relatively high lignin content, is readily conversed to ethanol
with proper pretreatment and SSF processes.138,139 For trees, storage is
not an issue since they are a year-round source waiting to be harvested
to support continuous biorefinery operation. Switchgrass is a high-
yielding prairie grass that requires minimal fertilizer inputs, has deep
root systems providing carbon sequestration benefits, grows in regions
with low rainfall and can be planted and harvested reasonably well with
existing planting equipment.140 These two plant species are not the only
Table 19.3 Composition of selected biomass sources.19
Plant sourceComposition (%)
Glucan Xylan Araban Lignin Ash
Switchgrass 33–34 21–22 2.6–2.8 17–21 5.2–6.2Corn stover 37–38 21–22 2.4–2.5 18–19 10–13Bagasse (sugarcane residues) 39–43 20–23 1.5–1.7 23–24 4Wheat straw 33 19 2.4 17 10Hybrid poplar 40–44 17–18 o1 23–24 1
575Biofuels and Biotechnology

potential dedicated crop selections as other native grasses, willow species
and tropical energy cane have specific benefits for certain agronomic
regions.141–143
To maximize productivity of biomass to ethanol and other chemicals
selected dedicated energy crop species must be improved by plant
genetic engineering and breeding with the aim of building in plant
characteristics that are superior to the best available cultivar regarding
ease of complete bioconversion to product. Such research has begun
with a forage species, alfalfa, aimed at the reduction of lignin content.
The Samuel Roberts Noble Foundation has shown genetic alteration of
six different enzymatic steps involved in lignin production with reduced
lignin content and proportionately improved enzymatic hydrolysis of
the plant residues.144 Similar breeding and genetic research on potential
crops is under way aimed at improving not only the yield of the selected
crop, but also modification of the plant characteristics by addition of
hydrolytic enzymes involved in bioprocessing.145,146 Improvement of
hybrid poplar took a significant leap forward with the completion of its
genome sequence.147 Work has been under way at ORNL to utilize this
genomic sequence for selected genetic modification and gene knockouts
to improve this fast-growing tree for bioconversion. Indeed, the simul-
taneous improvements of switchgrass and hybrid poplar are central
themes of the ORNL-centered multi-partner US DOE Bioenergy Cen-
ters awarded in the Fall of 2007 (www.bioenergycenter.org). The ideal
eventual process will be comprised of dedicated, high-yielding biomass
feedstocks specially bred for minimal impact on the environment while
having composition and structural characteristics that facilitate rapid
carbohydrate depolymerization and conversion to ethanol or other
chemicals. This will be accomplished by concerted and linked research
on both improvement of the plant species and optimization of the
conversion process for this improved feedstock, permitting an eco-
nomically sustainable biofuels industry to grow and displace significant
levels of petroleum.
REFERENCES
1. W. D. Deckwer, D. Jahn, D. Hempel and A. P. Zeng, Eng. Life
Sci., 2006, 6(5), 455–469.
2. G. M. Zanin, C. C. Santana, E. P. S. Bon, R. C. L. Giordano,
F. F. de Moraes, S. R. Andrietta, C. C. De Carvalho Neto, I. C.
Macedo, D. L. Fo, L. P. Ramos and J. D. Fontana, Appl. Biochem.
Biotechnol., 2000, 84–86(1–9), 1147–1161.
576 Chapter 19
3. J. Goldemberg, Science, 2007, 317(5843), 1325.
4. G.E. Inglett (ed.), Corn: Culture, Processing and Products, AVI
Publishing, Westport, CT, 1970, pp. 241–261.
5. S. Rajagopalan, E. Ponnampalam, D. McCalla and M. Stowers,
Appl. Biochem. Biotechnol., 2005, 120(1), 37–50.
6. A. McAloon, F.Taylor, W. Yee, K. Ibsen and R. Wooley, Deter-
minig the Cost of Producing Ethanol from Corn Starch and Lig-
nocellulosic Feedstocks, National Renewable Energy Laboratory,
Golden, Colorado, Report TP-580-28893. 2000.
7. C. E. Nakamura and G. M. Whited, Curr. Opin. Biotechnol., 2003,
14(5), 454–459.
8. C. E. Wyman, Annu. Rev. Energy Environ., 1999, 24, 189–226.
9. Y. Y. Lee, M. Ladisch, M. Holtzapple, R. Elander, B. Dale and
C. Wyman, Bioresource Technol., 2005, 96(18), 1959–1966.
10. N. Mosier, C. Wyman, B. Dale, R. Elander, Y. Y. Lee,
M. Holtzapple and M. Ladisch, Bioresource Technol., 2005, 96(6),
673–686.
11. M. Galbe and G. Zacchi, Adv. Biochem. Eng. Biotechnol., 2007,
108, 41–65.
12. C. R. Wilke, R. D. Yan and U. von Stockar, Biotechnol. Bioeng.
Symp., 1976, 6, 55.
13. M. Takagi, S. Abe, G. H. Suzuki, G. H. Emert and N. Yata, in
Proceedings of the Bioconversion Symposium, Indian Institute of
Technology, New Delhi, 1977, pp. 551–571.
14. F. Alfani, A. Gallifuoco, A. Saporosi, A. Spera and M. Cantarella,
J Ind. Microbiol. Biotechnol., 2000, 25(4), 184–192.
15. D. D. Spindler, C. E. Wyman, A. Mohagheghi and K. Grohmann,
Appl. Biochem. Biotechnol., 1988, 17(1–3), 279–294.
16. M. E. Himmel, M. F. Ruth and C. E. Wyman, Curr. Opin. Bio-
technol., 1999, 10(4), 358–364.
17. R. A. Nieves, C. I. Ehrman, W. S. Adney, R. T. Elander and M. E.
Himmel, World J. Microbiol. Biotechnol., 1998, 14(2), 301–304.
18. W. Boerjan, J. Ralph and M. Baucher, Annu. Rev. Plant Biol.,
2003, 54, 519–549.
19. US DOE EERE Biomass Program Biomass Feedstock Composi-
tion and Property Database, http://www.eere.energy.gov/biomass/
progs/search1.cgi.
20. B. S. Dien, M. A. Cotta and T. W. Jeffries, Appl. Microbiol. Bio-
technol., 2003, 63(3), 58–66.
21. S. Zhou and L. O. Ingram, Biotechnol. Lett., 2001, 23, 1455–1462.
22. L.O. Ingram, F. Alterthum and T. Conway, US Patent 5 000 000,
1991.
577Biofuels and Biotechnology
23. M. Zhang, C. Eddy, K. Deanda, M. Finkelstein and S. Picataggio,
Science, 1995, 267(5195), 240–243.
24. A. Mohagheghi, N. Dowe, D. Schell, Y.-C. Chou, C. Eddy and
M. Zhang, Biotechnol. Lett., 2004, 26(4), 321–325.
25. A. Mohagheghi, K. Evans, Y.-C. Cho and M. Zhang, Appl. Bio-
chem. Biotechnol., 2002, 98–100, 885–898.
26. N. W. Y. Ho, Z. Chen, A. P. Brainard and M. Sedlak, Adv. Bio-
chem. Eng. Biotechnol., 1999, 65, 163–192.
27. T. W. Jeffries and Y. S. Jin, Appl. Microbiol. Biotechnol., 2004,
63(5), 495–509.
28. S. Zhou, L. P. Yomano, A. Z. Saleh, F. C. Davis, H. C. Aldrich
and L. O. Ingram, Appl. Environ. Microbiol., 1999, 65, 2439–2445.
29. S. Zhou, F. C. Davis and L. O. Ingram, Appl. Environ. Microbiol.,
2001, 67, 6–14.
30. W. H. van Zyl, L. R. Lynd, R. den Haan and J. E. McBride, Adv.
Biochem. Eng. Biotechnol., 2007, 108, 205–235.
31. I. S. Maddox, Biotechnol. Genet. Eng. Rev., 1989, 7, 189–220.
32. D. Antoni, V. V. Zverlov and W. H. Schwarz, Appl. Microbiol.
Biotechnol., 2007, 77(1), 23–35.
33. M. Ozkan, S. G. Desai, Y.-H. Zhang, D. M. Stevenson, J. Beane,
M. L. Guerinot and L. R. Lynd, J.Ind. Microbiol. Biotechnol.,
2001, 27, 275–280.
34. L. R. Lynd, P. J. Weimer, W. H. van Zyl and I. S. Pretorius,
Microbiol. Mol. Biol. Rev., 2002, 66(3), 506–577.
35. L. R. Lynd, W. H. van Zyl, J. E. McBride and M. Laser, Curr.
Opin. Biotechnol., 2005, 16(5), 577–583.
36. J. H. D. Wu, W. H. Orme-Johnson and A. L. Demain, Biochem-
istry, 1988, 27, 1703–1709.
37. J. H. D. Wu, ACS Symp. Ser., 1993, 516, 251–264.
38. C. R. Felix and L. G. Ljungdahl, Annu. Rev. Microbiol., 1993,
47, 791–819.
39. W. H. Schwarz, Appl. Microbiol. Biotechnol., 2001, 56, 634–649.
40. A. L. Demain, M. Newcomb and J. H. D. Wu, Microbiol. Mol.
Biol. Rev., 2005, 69(1), 124–154.
41. Y.-H. P. Zhang and L. R. Lynd, Proc. Natl. Acad. Sci. USA, 2005,
102, 7321–7325.
42. E. Guedon, M. Desvaux and H. Petitdemange, Appl. Environ.
Microbiol., 2002, 68(1), 53–58.
43. T. Reed, M. Graboski and B. Levie, US DOE Report
SERI/PR-234-2571, Department of Energy, Washington, DC,
1987.
44. J. P. Longwell, Fuel Energy Abstr., 1997, 38(6), 445–445.
578 Chapter 19

45. K. T. Klasson, M. D. Ackerson, E. C. Clausen and J. L. Gaddy,
Res. Conserv. Recyc., 1991, 5(2–3), 145–165.
46. A. J. Grethlein and M. K. Jain, Trends Biotechnol., 1992, 10,
418–423.
47. H. Younesi, G. Najafpour and A. R. Mohamed, Biochem. Eng. J.,
2005, 27(2), 110–119.
48. A. M. Henstra, J. Sipma, A. Rinzema and A. J. M. Stams, Curr.
Opin. Biotechnol., 2007, 18(3), 200–206.
49. H. Baumann, M. Buhler, H. Fochem, F. Hirsinger, H. Zoebelein
and J. Falbe, Angew. Chem. Int. Ed., 1988, 27(1), 41–62.
50. U. Biermann, W. Friedt, S. Lang, W. Luhs, G. Machmuller,
J. O. Metzger, M. Ruschgen Klaas, H. J. Schafer and M. P.
Schneider, Angew. Chem. Int. Ed., 2000, 39(13), 2206–2224.
51. J. Van Gerpen, B. Shanks and R. Pruszko, Biodiesel Production
Technology. National Renewable Energy Laboratory, Golden,
Colorado, Report Report SR-510-36244, 2004.
52. R.K. Downey, Canola: a quality brassica oilseed. In: Advances in
new crops: proceedings of the First national Symposium NEW
CROPS, J. Janick and J. E. Simon (eds.), Timber Press, Prtland,
OR, 1990 pp.211–215.
53. S.R. Schill, Biodiesel Mag., 2008, March, 64–70.
54. U. Bond and A. Blomberg, in Yeasts in Food and Beverages, ed.
A. Querol and G.H. Fleet, Springer, Berlin, 2006, pp. 175–213.
55. K. V. Alsaker and E. T. Papoutsakis, J. Bacteriol., 2005, 187(20),
7103–7118.
56. J. R Mielenz and S. Mickel (CPC International), US Patent 4 493
893, 1985.
57. J. R. Mielenz, Proc. Natl. Acad. Sci. USA, 1983, 80, 5975–5979.
58. J.A. Eratt and A. Nasim US Patent 4 870 014, 1989.
59. R.M. Berka, D. Cullen, G.L. Gray, K.J. Hayenga and V.B. Lawlis,
U.S. Patent 5 364 770, 1989.
60. R. D. Coleman, S. S. Yang andM. P. McAlister, J Bacteriol., 1987,
169(9), 4302–4307.
61. D. W. Goddette, C. Paech, S. S. Yang, J. R. Mielenz, C. Bystroff,
M. E. Wilke and R. J. Fletterick, J. Mol. Biol., 1992, 228(2),
580–595.
62. A. Shaw and R. Bott, Curr. Opin. Struct. Biol., 1996, 6(4), 546–550.
63. O. Kirk, T. V. Borchert and C. C. Fuglsang, Curr. Opin. Bio-
technol., 2002, 13(4), 345–351.
64. G. Giaever, A. M. Chu, L. Ni, C. Connelly and L. Riles, et al.,
Nature, 2002, 418, 387–391.
579Biofuels and Biotechnology
65. J. Forster, I. Famili, P. Fu, B. Ø. Palsson and J. Nielsen,Metabolic
Network Genome Res., 2003, 13(2), 244–253.
66. T. Hirasawa, Y. Nakakura, K. Yoshikawa, K. Ashitani,
K. Nagahisa, C. Furusawa, Y. Katakura, H. Shimizu and
S. Shioya, Appl. Microbiol. Biotechnol., 2006, 70(3), 346–357.
67. D. Cavalieri, J. P. Townsend and D. L. Hartl, Proc. Natl. Acad.
Sci. USA, 2000, 97, 12369–12374.
68. T. Hirasawa, K. Yoshikawa, Y. Nakakura, K. Nagahisa,
C. Furusawa, Y. Katakura, H. Shimizu and S. Shioya, J. Bio-
technol., 2007, 131(1), 34–44.
69. J. I. Castrillo, L. A. Zeef, D. C. Hoyle, N. Zhang, A. Hayes and
D. C. J. Gardner, et al., J. Biol., 2007, 6, 4.
70. Y. Inoue, Y. Tsujimoto and A. Kimura, J Biol Chem., 1998,
273(5), 2977–2983.
71. N. Hao, M. Behar, S. C. Parnell, M. P. Torres, C. H. Borchers,
T. C. Elston and H. G. Dohlman, Curr. Biol., 2007, 17(8), 659–667.
72. S. Hohmann, M. Krantz and B. Nordlander, Methods Enzymol.,
2007, 428, 29–45.
73. P. K. Foreman, D. Brown, L. Dankmeyer, R. Dean, S. Diener,
N. S. Dunn-Coleman, F. Goedegebuur, T. D. Houfek, G. J.
England, A. S. Kelley, H. J. Meerman, T. Mitchell, C. Mitchinson,
H. A. Olivares, P. J. Teunissen, J. Yao and M. Ward, J. Biol.
Chem., 2003, 278(34), 31988–31997.
74. S. Chen and D. B. Wilson, J Bacteriol., 2007, 189(17), 6260–6265.
75. A. Aden, M. Ruth, K. Ibsen, J. Jechura, K. Neeves, J. Sheehan,
B. Wallace, L. Montague, A. Slayton and J. Lukas, Lignocellulosic
Biomass to Ethanol Process Design and Economics Utilizing Co-
Current Dilute Acid Prehydrolysis and Enzymatic Hydrolysis for
Corn Stover 2002 National Renewable Energy Laboratory,
Golden, Colorado, Report TP-510-32438, 2002.
76. R.Wallace, K Ibsen, A.J Mcaloon and W.C Yee, Feasibility study
for co-locating and integrating ethanol production plants from
corn starch and lignocellulosic feedstock. National Renewable
Energy Laboratory, Report TP-510-37092, 2004.
77. K. Sanderson, Nature, 2006, 444, 673–676.
78. J. S. Tolan, Clean Prod. Processes, 2002, 3(4), 339–345.
79. M. S. Krishnan, F. Taylor, B. H. Davison and N. P. Nghiem,
Bioresource Technol., 2000, 75(2), 99–105.
80. T. Han, R. Gonzales, A. Martinez, M. Rodriguez, L. O. Ingram,
J. F. Preston and K. T. Shanmugam, J. Bacteriol., 2001, 183,
2979–2988.
580 Chapter 19
81. M. Sedlak, H. J. Edenberg and N. W. Y. Ho, Enzyme Microb.
Technol., 2003, 33, 19–28.
82. R. Gonzalez, H. Tao, K. T. Shanmugam, S. W. York and L. O.
Ingram, Biotechnol. Prog., 2002, 18, 6–20.
83. J. Zaldivar, A. Borges, B. Johansson, H. P. Smits, S. G. Villas-
Boas, J. Nielsen and L. Olsson, Appl Microbiol Biotechnol., 2002,
59, 436–442.
84. L. Salusjarvi, M. Poutanen, J.-P. Pitkanen, H. Koivistoinen,
A. Aristidou, N. Kalkkinen, L. Ruohonen and M. Penttile, Yeast,
2003, 20, 295–314.
85. A. J. A. van Maris, A. A. Winkler, M. Kuyper, W. T. A. M. de
Laat, J. P. van Dijken and J. T. Pronk, Adv. Biochem. Eng. Bio-
technol., 2007, 108, 179–204.
86. M. Kuyper, M. P. Hartog, M. J. Toirkens, M. J. H. Almering,
A. A. Winkler, J. P. van Dijken and J. T. Pronk, FEMS Yeast Res.,
2005, 5, 399–409.
87. M. Kuyper, H. R. Harhangi, A. K. Stave, A. A. Winkler, M. S. M.
Jetten, W. T. A. M. de Laat, J. J. J. den Ridder, H. J. M. O. den
Camp, J. P. van Dijken and J. T. Pronk, FEMS Yeast Res., 2003,
4(1), 69–78.
88. K. A. Gray, L. Zhao and M. Emptage, Curr. Opin. Chem. Biol.,
2006, 10(2), 141–146.
89. B. Hahn-Hagerdal, M. Galbe, M. F. Gorwa-Grauslund, G. Liden
and G. Zacchi, Trends Biotechnol., 2006, 24(12), 549–556.
90. J. R. M. Almeida, T. Modig, A. Petersson, B. Hahn-Hagerdal,
G. Liden and M. F. Gorwa-Grauslund, J. Chem. Technol. Bio-
technol., 2007, 82(4), 340–349.
91. T.-A. Hsu, in Handbook on Bioethanol: Production and Utilization,
C. Wyman ed., Taylor and Francis, Washington, DC, 1996,
pp. 179–195.
92. B. Yang and C. Wyman, Biotechnol. Bioeng., 2006, 94(4), 611–617.
93. M. Galbe and G. Zacchi, Adv. Biochem. Eng. Biotechnol., 2007,
108, 41–65.
94. J. P. Delgenes, R. Moletta and J. M. Navarro, Enzyme Microb.
Technol., 1996, 19(3), 220–225.
95. A. Martinez, M. E. Rodriguez, M. L. Wells, S. W. York,
J. F. Preston and L. O. Ingram, Biotechnol. Prog., 2001, 17(2),
287–293.
96. S. I. Mussatto and I. C. Roberto, Bioresource Technol., 2004, 93(1),
1–10.
97. E. Palmqvist and B. Hahn-Hagerdal, Bioresource Technol., 2000,
74(1), 17–24.
581Biofuels and Biotechnology
98. E. Palmqvist and B. Hahn-Hagerdal, Bioresource Technol., 2000,
74(1), 25–33.
99. S. W. Gorsich, B. S. Dien, N. N. Nichols, P. J. Slininger, Z. L. Liu
and C. D. Skory,Appl. Microbiol. Biotechnol., 2006, 71(3), 339–349.
100. Z. L. Liu, Appl. Microbiol. Biotechnol., 2006, 73(1), 27–36.
101. V. V. Zverlov, J. Kellermann and W. H. Schwarz, Proteomics,
2005, 5(14), 3646–3653.
102. D. M. Stevenson and P. J. Weimer, Appl. Environ. Microbiol.,
2005, 71, 4672–4678.
103. A. Kosugi, K. Murashima and R. H. Doi, J. Bacteriol., 2001,
183(24), 7037–7043.
104. S. O. Han, H. Yukawa, M. Inui and R. H. Doi, J. Bacteriol., 2003,
185(20), 6067–6075.
105. S. O. Han, H.-Y. Cho, H. Yukawa, M. Inui and R. H. Doi,
J. Bacteriol., 2004, 186(13), 4218–4227.
106. S. O. Han, H. Yukawa, M. Inui and R. H. Doi, Microbiology,
2005, 151, 1491–1497.
107. N. D. Gold and V. J. J. Martin, J. Bacteriol., 2007, 189,
6787–6795.
108. K. C. B. Jennert, C. Tardif, D. I. Young and M. Young, Micro-
biology, 2000, 146, 3071–3080.
109. M. V. Tyurin, S. G. Desai and L. R. Lynd, Appl. Environ.
Microbiol., 2004, 70(2), 883–890.
110. V. Mai, W. Lorenz and J. Weigel, FEMS Microbiol. Lett., 1997,
148, 163–167.
111. A. J. Shaw, K. K. Podkaminer, S. G. Desai, J. S. Bardsley, S. R.
Rogers, P. G. Thorne, D. A. Hogsett and L. R. Lynd, Proc. Natl.
Acad. Sci., 2008, 105(37), 13769–13774.
112. S. G. Desai, M. L. Guerinot and L. R. Lynd, Appl. Microbiol.
Biotechnol., 2004, 65(5), 600–605.
113. F. Teymouri, L. Laureano-Perez, H. Alizadeh and B. E. Dale,
Bioresource Technol., 2005, 96, 2014–2018.
114. S. D. Brown, B. Raman, C. K. McKeown, S. P. Kale, Z. He and
J. R. Mielenz, Appl. Biochem. Biotechnol., 2007, 137–140, 663–674.
115. M. Ozkan, E. I. Yllmaz, L. R. Lynd and G. Ozcengiz, Can. J.
Microbiol., 2004, 50(10), 845–851.
116. A. A. Herrero and R. F. Gomez, Appl. Environ. Microbiol., 1980,
40(3), 571–577.
117. T. I. Williams, J. C. Combs, B. C. Lynn and H. J. Strobel, Appl.
Microbiol. Biotechnol., 2007, 74(2), 422–432.
118. J.L. Gaddy, US Patent 6 136 577, 1996.
119. E. R. Weyer and L. F. Rettger, J. Bacteriol., 1927, 14, 399–424.
582 Chapter 19
120. E. Cornillot, R. V. Nair, E. T. Papoutsakis and P. Soucaille, J.
Bacteriol., 1997, 179, 5442–5447.
121. D. R. Woods, Trends Biotechn., 1995, 13(7), 259–264.
122. J. Sierra, R. Acousta, D. Montoya, G. Buitrago and E. Silva, Rev.
Colomb. Cienc. Quim.-Farm., 1996, 25, 26–35.
123. E. M. Green, Z. L. Boynton, L. M. Harris, F. B. Rudolph,
E. T. Papoutsakis and G. N. Bennett, Microbiology, 1996, 142,
2079–2086.
124. D. R. Woods, Trends Biotechnol., 1995, 13, 259–264.
125. N. Qureshi and H. P. Blaschek, Biotechnol. Prog., 1999, 15,
594–602.
126. T. C. Ezeji, P. M. Karcher, N. Qureshi and H. P. Blaschek, Bio-
process Biosyst. Eng., 2005, 27, 207–214.
127. N. Qureshi, B. C. Saha and M. A. Cotta, Bioprocess Biosyst. Eng.,
2007, 30, 419–427.
128. J. Nolling, G. Breton, M. V. Omelchenko and D. R. Smith,
J. Bacteriol., 2001, 183(16), 4823–4838.
129. T. C. Ezeji, N. Qureshi and H. P. Blaschek, Curr. Opin.Biotechnol.,
2007, 18, 220–227.
130. C. J. Paredes, R. S. Senger, I. S. Spath, J. R. Borden, R.
Sillers and E. T. Papoutsakis, Appl. Environ. Microbiol., 2007, 73,
4631–4638.
131. J. R. Borden and E. T. Papoutsakis, Appl. Environ. Microbiol.,
2007, 73, 3061–3068.
132. http://onlinepressroom.net/DuPont/NewsReleases/June 20, 2006.
133. S. Picataggio, T. Rohrer, K. Deanda, D. Lanning, R. Reynolds,
J. Mielenz and L. D. Eirich, Bio/Technology, 1992, 10, 894–898.
134. V. J. J. Martin, D. J. Piteral, S. T. Withers, J. D. Newman and
J. D. Keasling, Nat. Biotechnol., 2003, 21, 796–802.
135. R. D. Perlack, L. L. Wright, A. F. Turhollow, R. L. Graham,
B. J. Stokes and D. C. Urbach, US DOE Report OSTI ID: 885984,
Department of Energy, Washington, DC, 2005.
136. A. E. Farrell, R. J. Plevin, B. T. Turner, A. D. Jones, M. O’Hare
and D. Kammen, Science, 2006, 311, 506–508.
137. S. B. McLaughlin, D. G. de la Torre Ugarte, C. T. Garten Jr,
L. R. Lynd, M. A. Sanderson, V. R. Tolbert and D. D. Wolf,
Environ. Sci. Technol., 2002, 36(10), 2122–2129.
138. X. Pan, N. Gilkes, J. Kadla, K. Pye, S. Saka, D. Gregg, K. Ehara,
D. Xie, D. Lam and J. Saddler, Biotechnol. Bioeng., 2006, 94(5),
851–861.
139. C. Luo, D. L. Brink and H. W. Blanch, Biomass Bioenergy, 2002,
22(2), 125–138.
583Biofuels and Biotechnology
140. S. B. McLaughlin, J. R. Kiniry, C. M. Taliaferro and D. D.
Ugarte, Adv. Agron., 2006, 90, 267–297.
141. S. Hanley, J. Barker, J. Van Ooijen, C. Aldam, S. Harris,
I. Ahman, S. Larsson and A. Karp, Theor. Appl. Genet., 2002,
105(6–7), 1087–1096.
142. P. J. Tharakan, T. A. Volk, L. P. Abrahamson and E. H. White,
Biomass Bioenergy, 2003, 25(6), 571–580.
143. R. Ming, P. H. Moore, K. K. Wu, A. D. Hont and J. C.
Glaszmann, Plant Breed. Rev.2006, 27, 15–118.
144. F. Chen and R. A. Dixon, Nat. Biotechnol., 2007, 25, 759–761.
145. M. Sticklen, Curr. Opin. Biotechnol., 2006, 17(3), 315–319.
146. M. B. Sticklen, Crop Sci., 2007, 47, 2238–2248.
147. G. A. Tuskan, S. DiFazio, S. Jansson, J. Bohlmann and I.
Grigoriev, Science, 2006, 313(5793), 1596–160.
584 Chapter 19

Subject Index
ABCB1 transporter 67
abiotic stresses 293
absolute quantification 86
abzymes 461–2
acetate metabolism 213
acetic acid 565, 566, 570, 571, 574–5
active site 457–8
adenovirus vectors 345
adipocytes 362
adjuvants 347–9
adsorption, immobilisation by 474–7
adult stem cells 359, 360–1
adverse drug reactions 65
affinity
antibody 245, 263–4
chromatography 260, 497, 498, 500–1
ligands 500–1
precipitation 496
agarose gel electrophoresis 6–7
agglutination tests 78, 101
Agrobacterium-mediated
transformation 280
AIDS see HIV/AIDS
alfafa 576
alkaloids 211–12
allelic differences 113
allergy tests 231
amino acids 212, 294–5
structures 419
ammonium sulfate 496
amperometric biosensors 234, 516, 522–31
ampicillin resistance 25, 26, 27, 29
amplicons 82, 127
amplified fragment length
polymorphism 95–6, 275
Amyris Biotechnologies 573–4
analyte-specific reagents 51, 55
aneuploidy 56, 64
angiotensin converting enzyme 68
angle of incidence 538, 541
animal cells 467
animal models, target validation 322–3
animal welfare 412–14
annealing 123–4
antibiotic resistance
bacterial 104–6
plasmids 24–9
antibodies 245–65, 341, 435–6
affinity 245, 263–4
approved recombinant 439–40
biopharming 299
biosensors and 543–5
catalytic 461–2
chimeric 248, 249, 251–5, 439–40
from diversity libraries and display
technologies 256–63
enhancing potency 264–5
humanisation 249–50, 255–6, 439–40, 442
magnetic nanoparticles targeting
230, 231
nanobodies from 320
phage display 257–62
protein A chromatography 500
structure and function 250–1
as therapeutics 246–50, 264
antibody sequence databases 255
586 Subject Index
antigens 245
binding 250–1, 253–4, 543–4
antisense molecules 323–6
antiviral treatments 508–9
vaccines 338
viral load and 87, 508
apoptosis 462–3
apoptosomes 462–3
aptamers 324–5
aqueous two-phase extraction 503
Arabidopsis thaliana 273, 295
arabinose 33–4, 35
Aranesp 435
artificial extracellular matrices 364–9
artificial tissue cultivation 369–71
aspartame 525
assay development 328
association studies 143–4, 152
attenuated human adenoviruses 345
attenuation 338–9
automated DNA sequencing 130–1
automated extraction systems 81
autonomous replication sequence 175–6
autoradiography 12
avirulence genes 288
B-cell lymphoma 60–1
B-cells 246, 247, 248, 258
Bacillus thuringiensis toxins 284–5
bacteria
antibiotic resistance 104–6
classical diagnosis 78
DNA, manipulation of 170–6
expression systems 20–5
genomes 113
genomic analysis 114
infectious disease tests 54
nucleic acid-based typing of 93–7
pathogenic 291
transformation 118
vaccines 338
see also Clostridium; Escherichia
coli; Mycobacterium
bacterial artificial chromosomes 117–18,
147–8
transgenesis 408
BamH1 26–7
BCG vaccine 338–9, 342
recombinant 343–4
beer 560, 565
β-galactosidase gene 118, 120
betaseron/betaferon 434
bifurcation 202
bioartificial devices 353
bioartificial liver 213–14
biobutanol 572–3
biocatalysts 455–69
abzymes 461–2
cells 466–8
enzymes 455–9
immobilised (see also
immobilisation)
applications 487–8
and bioreactors 470
catalytic activity 458–9, 484–5
coenzyme regeneration 485–7
stability 483–4
multienzyme complexes 462–6
ribozymes, deoxyribozymes and
ribosomes 459–60
selection 468–9
splicesomes 460–1
biochemical oxygen demand
biosensors 542
biochips, in drug discovery 329–31
biodegradable plastics 298
biodiesel 549–50, 556–7, 573
biofuels 548–76
biotechnology tools 557–74
biobutanol 572–3
biodiesel 573
ethanol production from biomass
561–72
new concepts 573–4
future perspectives 574–6
production of major biofuels
549–57
biodiesel 549–50, 556–7
biomass conversion for ethanol
552–6
corn processing and ethanol 549,
550–1
Subject Index 587
bioinformatics
crops 279
in drug discovery 331–3
gene discovery and localisation 150–2
PCR 125–6
biological extracellular matrix 362–4
biological reaction 518–19
biological support materials 472
bioluminescence 97
biomarkers 320
biomass conversion
consolidated bioprocessing 552,
554–5, 566–71
enzymatic hydrolysis and conversion
552–4
enzyme and fermentation inhibitors
565–6
gasification for ethanol 556, 571–2
SHF and SSF processing 561–5
types of biomass 574–5
biomolecules, downstream processing
505–6
bionanotechnology 220–41
magnetic nanoparticles 226–32
nanoscale construction 236–40
semiconductor quantum dots 222–6
zerovalent noble metal nanoparticles
232–6
biopanning 239
biopharming 298–9
bioreactors
for artificial tissues 369–71
immobilised biocatalysts and 470
plants as 298–9
biosensors 513–46
abzyme-based 462
application areas 517–18
biological reaction 518–19
electrochemical 516, 522–36
amperometric 234, 516, 522–31
conductimetric 533–4
potentiometric 516, 531–3
functional units of a 514
immobilised biocatalysts in 488
noble metal nanoparticles 233, 234
optical 516, 536–42
evanescent wave 538–40
surface plasmon resonance 539,
540–2
piezoelectric 516, 534–6
properties of important
configurations 516
properties of successful 515
receptor-based 543–5
theory of 519–21
whole cell 542–3
biosilification 237
bladder cancer 63–4
blastocysts 356, 398, 400, 403
blinking, qdot 226
blood cells 360, 480–1
blue/white selection 28–9, 118–19, 120
bone cells 359, 360
bone marrow 359, 360
brain
cells 360
human, receptor activity 176–7, 178
breast cancer 63, 64, 69, 70
breeding, knockout mice 409
bulk Bohr radius 223
cancer drugs 68–71, 248, 264
Cancer Genome Anatomy website 63
canola 293, 295, 296, 550, 556–7
capillary electrophoresis 53, 130, 136
Capture Select technology 501
carbonic anhydrase 458–9
carrier proteins 341
cartilage 355, 359, 360
caspases 463
catalogue databases 151–2
catalysis 455–6
catalytic power, enzymes 458–9, 484–5
cDNA
high-throughput microarrays 330
library 120–2
reverse PCR synthesis 82–3, 126
CdS qdots 238, 239
cell-based screening 321
cell-free systems 44–5, 432
cell types, identification 354–5
cellobiose 567–8, 569
588 Subject Index
cells
as biocatalysts 466–8
cell therapy 353, 361
differentiated 361–2
lysis 494–5
markers 359
transfection 401–2
see also stem cells
cellulases 552–5, 561, 564
cellulose 552–3, 561–3, 567–9
hemicellulose 552–3, 561, 565–6,
568, 575
cellulosomes 464–5, 555, 567–9
central biochemical pathway 181, 182
central nervous system diseases 99–100
centrifugation 494
ceramics 365
cervical cancer 89, 102
chemogenomics 334
chemotherapy 68–71, 248, 264
chimeric antibodies 248, 249, 251–5
approved 439–40
chimeric mouse 398–9, 400, 403, 404
human antibodies 438–40
Chlamydia trachomatis 102–3
Chlamydomonas reinhardtii 210
chlorophyllase 455
cholera 342
chromatography 497–502
affinity 260, 497, 498, 500–1
aqueous-two phase extraction 503
crystallisation 504
denaturing HPLC 140–2
expanded bed adsorption 502–3
GC–MS 209–10
gel filtration 497, 498, 501–2
hydrophobic interaction 497, 498,
501
ion exchange 497, 498, 499
LC–MS 210, 314
matrix 498
membrane chromatography and
filtration 503–4
monolith columns 505
chromogen 537–8
chromosomal disorders 56
chromosomes see bacterial artificial
chromosomes; yeast artificial
chromosomes
CIS display 431, 432
Clinical and Laboratory Standards
Institute 55
clinical diagnostics, biosensors 517
clinical microbiology
classical diagnosis 78–9
hybridisation techniques 90–3
nucleic acid-based diagnosis 99–106
nucleic acid-based typing of
bacteria 93–7
pyrosequencing 97–8
real-time qPCR 87–8
TaqMan low-density arrays 85, 98–9,
127
viral load determination 87
clonality, B- and T-cells 60, 61
cloning
extra-large segments of DNA 170–2
identification in 119–20, 121
library screening and 118–19
vectors 115–18
Clostridium
C. acetobutylicum 572
C. ljungdahlii 571
C. thermocellum 555, 567–8, 569–70
cluster analysis 569
cocaine 535
coding sequence, product linkage 428–32
codons, in E. coli and eukaryotes 34–6
coenzyme regeneration 485–7
coercivity, magnetic 226–7, 228
collagen 363
colorectal cancer 69
colorimetric assays 537–8
commercial kits
manual extraction 81
sample collection and transport 80
sexually transmitted diseases 102, 103
viral load 87
complementarity, principle of 90
complementarity-determining regions
251, 255–6
concentration gradients 520
Subject Index 589
conditional gene targeting 404–10
conditioning 562, 566
conductimetric biosensors 533–4
conducting organic salts 531
conjugate vaccines 341
connective tissue 359, 360
connectivity theorems 204
consolidated bioprocessing 552, 554–5,
566–71
contamination, PCR and 82
‘contigs’ 145–7
control coefficients 202–3, 204
coranoviruses 76
core glycosylation 183
corn processing 549, 550–1, 575
correlation networks 214
cosmid vectors 117
covalent binding 475, 477–9
in biosensors 519
and stability 484
covalent phage display 431
CpG oligonucleotides 348
Cre-expressing mouse lines 408–9
Cre–loxP system 404–10
crops
abiotic stresses 293
bioinformatics 279
DNA fingerprinting 278
DNA microarrays 279
male sterility 292–3
manipulating quality 294–8
marker-assisted selection 275–7
molecular diagnostics 277–8
molecular maps of 273–4
molecular markers 274–5
natural resistance genes 288–90
nematode resistance to 292
pests and disease resistance 284–92
transgenic see transgenic crops
see also plants
cross-linking 475, 481–3
crystallinity, bionanoparticles 228, 237
crystallisation 504
cultivation, artificial tissues 369–71
CYP2C9 enzyme 66–7
CYP2D6 enzyme 65–6, 69
cystic fibrosis 57, 58
daughter cells 357
de novo design 442–3, 444–6, 447
defined sequence alterations
non-PCR methods 423, 424
PCR-based methods 423, 425–6,
427
degradable polymers 298, 366, 371
deletion 56
denaturation 123–4, 129
denaturing HPLC 140–2
dendrimers 237, 319
dendritic cells 344, 348
deoxyribozymes 459–60
desorption problem 475–6
diabetes 516, 517, 518, 527–9
diatoms 237
dideoxynucleotide chain terminators
129
differential equations 198–201
differentiated cells 361–2
differentiation factors, stem cells 359
diffusion
in biosensors 520–1
restrictions 485
diffusive flux 521, 527
DiGeorge syndrome 410
digestive tract cells 360
direct labelling 13
display technologies 256–63
alternative 262–3
antibody phage display 257–62
disposable technologies 509, 510,
516–17, 527, 529
diversity screening 321
DNA
biosensors 533, 542, 544–5
blotting 9–10
cloning extra-large segments of
170–2
constructs in yeast 162–4
electrophoresis of 6–7
isolation of 3–5
labelling 3, 12–15
end-labelling 13–14
nick translation 15, 17
random primer labelling 14–15, 16
ligation 116–17
590 Subject Index
markers 274
nanotechnology detection of 235–6
particle bombardment 281
phage display 431–2
pronuclear injection 391–7, 408
restriction mapping of fragments 8
target and template 16, 123–4
vaccines 346–7
see also cDNA
DNA fingerprinting 93, 133, 278
DNA libraries 120–2, 426, 428, 429–30
DNA microarrays 53, 143–4, 558
crops 279
for drug discovery 329–31
DNA sequence
databases 11–12, 18, 151
identification 420
modification 421–32
defined sequence alterations 423–6
molecular evolution 426, 428–32
tagged sites 147
DNA sequencing 128–31
automated 130–1
dideoxynucleotide chain terminators
129
double-stranded DNA 129–30
mapping 145
mutation detection 139
PCR cycle sequencing 130
pyrosequencing 131
DNA technologies
cloning process 118–20
cloning vectors 115–18
DNA libraries 120–2, 426, 428, 429–30
molecular cloning 20–45, 115, 116
see also polymerase chain reaction
(PCR)
domain fusion PCR 427
domain fusions 435–7, 438
domain shuffling 428, 435–41
deleting 441
linking domains 435–8
swapping domains 438–40
donor organs 351, 353, 356
double-stranded DNA, sequencing
129–30
downstream processing 492–510
antiviral treatments 508–9
chromatography 497–502
design of biomolecules for 505–6
formulation 507–8
future developments 509–10
initial considerations and primary
recovery 493–6
packed bed chromatography
alternatives 502–5
protein precipitation 496–7
scaledown methods 506
validation and robustness 506–7
drug development 188, 190
stages in evolution of 308
virtual 334–5
drug discovery
antisense for 323–6
biochips and microarrays for 329–31
bioinformatics applications in 331–3
biomarkers role in 320
chemogenomics and 334
current status of 309–10
genomics for 310–13
historical landmarks in 308–9
metabolomics and metabonomics
for 317–18
model organisms in 333–4
nanobiotechnology role in 318–20
new biotechnologies for 310
proteomics role in 313–16
RNA interference for 326–9
screening in 309–10, 320–2
target validation technologies 322–3
traditional approach 307
drug metabolism 65–7
drug transporter proteins 67
drugs
adverse drug reactions 65
from alkaloids 211
anti-cancer 69–71, 248, 264
antibodies as 246–50, 264
biopharming 298–9
chemotherapy 68–71, 264
engineered protein approvals 437,
439–40
Subject Index 591
engineered proteins under
investigation 444–6
formulation 507–8
immobilised biocatalysts 488
from yeast protein production 160
dry milling process 549, 550
Ebola virus 339, 345
edible vaccines 298–9
EIA test 79, 100
elasticity coefficients 204
electrical properties, noble metal
nanoparticles 233, 234, 236
electrochemical biosensors 516, 522–36
electrochemical oxidative
polymerisation 530
electroelution 7
electron microscopy 78, 101
electronic response 519–20, 521
electrophoresis
capillary 53, 130, 136
in mutation detection 139, 140, 141
of nucleic acids 6–7
pulsed field gel electrophoresis 6, 94
electroporation 400, 401
electrospinning 366–7
elementary flux mode analysis 205–6
ELISA test 79, 100, 103, 247, 258
embryonic lethality 404, 408, 411–12
embryonic stem cells 354, 356–8
knockout mouse generation 400–4,
405
in transgenesis 398–9
emission spectra, quantum dots 222,
224
emulsion-based display 431–2
Enbrel 436, 437
encapsulation 475, 480–1
encephalitis 99
end-labelling 13–14
endoparasites 292
endotoxin 340
enterococci 105
enteroviruses 101
entrapment 475, 479–80, 519
enzymatic rate laws 199–201
enzymes 1–3, 455–9
catalytic power 458–9, 484–5
coenzyme regeneration 485–7
covalent binding 477–8, 484
crystals 482–3
hydrolysis and conversion 552–4
inhibitors 565–6
modifications 441–2
multienzyme complexes 462–6
reaction types catalysed by 456
in redox reactions 522–4, 527, 528
specificity 456–8
see also cellulases; restriction
endonucleases
Epstein–Barr virus 99
erythrocytes 480–1
erythropoietin 435
humanised EPO 179–86
Escherichia coli 105–6
acetate metabolism and recombinant
protein synthesis 213
antibody fragments expressed in
253, 254, 257–60
codon usage in 34–6
expression vectors 24–5, 27–8
fusion proteins from 37–9
host-related issues 21–3
in primary recovery 494, 495
yeast DNA constructs in 162–3
essential amino acids 212
ethanol production
from biomass 552–6, 561–72
corn processing 549, 550–1, 575
ethanologens 554, 555, 561, 563–4, 566
ethics, transgenesis 412–14
ethidium bromide 7
eukaryotes
cloning vectors 44
codon usage in 34–6
gene identification 114
genome sequencing 145
genomes 113, 118, 145
genomic analysis 114
evanescent wave biosensors 538–40
expanded bed adsorption 502–3
expressed sequence tags 150, 273, 312
592 Subject Index
expression systems see protein
expression systems
expression vectors 24–9
extension 123–4
external metabolites 205
extracellular matrix
artificial 364–9
biological 362–4
Fab antibody fragments 253, 258–60,
261–2
false negatives 514
false positives 514
fatty acid methyl ester 556
Fc region 250, 436
FDA
antibody approval 245–6, 249–50, 256
diagnostic assays 51, 52, 54, 55, 63–4
fermentation 550–1
biomass 552
consolidated bioprocessing 552,
554–5, 566–71
gasification 571
inhibitors 565–6
process improvement 560–1
SHF and SSF processing 561–5
fertilised oocytes, collection 394–5
Fibre FISH 149–50
fibre optic lactate sensor 536–7
field effect transistors 532–3
filtration 494
membrane 503–4
first generation transgenic crops 283
FISH see fluorescence in situ
hybridisation
fish freshness 525–6
flocculation 482
Flox mouse 406–7
fluorescence in situ hybridisation 64, 149
Fibre FISH 149–50
PNA-FISH 92–3
fluorescence resonance energy
transfer 85, 88–9, 226
fluorescent probes 222, 224–6
fluorochromes 130
flux-balance analysis 206–8
FMR-1 gene 57, 59
focused screening 321
food industry, biocatalysts in 488
forestry biotechnology 300
formulation 507–8
founder transgenics 396, 397
Fragile X Syndrome 57, 59
Freund-type adjuvants 347–8
fructans 297
fructose 551
fruit fly (Drosophila) 113, 391
fullerenes 319–20
fungal pathogens 287–8
engineering resistance to 290–1
furans 566
fusion proteins 37–44
purification-facilitating tags 38, 40–3
solubility-enhancing tags 37–40
G-protein-coupled receptors 176–7, 316
gas chromatography–mass spectrometry
209–10
gasification for ethanol 556, 571–2
gastroenteritis 101–2
gel electrophoresis
agarose 6–7
pulsed field 6, 94
2D 314
gel filtration chromatography 497,
498, 501–2
gene assembly PCR 421–2
gene discovery and localisation
bioinformatics approaches 150–2
laboratory approaches 149–50
gene expression data 312, 330–1
gene identification 114, 131–2
gene probes
derivation 11–12
hybridisation 10
labelling 12–15, 16, 17
gene rearrangement, in malignant
lymphomas 61–2
gene targeting 397–404
basic principles 398–9
conditional 404–10
knockout mouse generation 400–4, 405
Subject Index 593
genetic disorders 56, 57, 137
genetic engineering, secondary
metabolites 181–3
genetic mapping 131–2, 144–5
genetic polymorphism 132
microsatellites 136–7
RFLPs and minisatellites 132–6
single nucleotide polymorphisms
137–9
see also molecular markers
genetic polymorphism 132
genetics, molecular 55–9
genital mycoplasmas 103
genome analysis 114
gene mapping and identifying 131–2
genetic mapping tools 132–9
mutation detection 139–44
genome sequencing 558
crops 273
hierarchical shotgun sequencing 145–8
and metabolic engineering 197, 198
whole genome shotgun sequencing
145, 148
genomes
annotation 210
eukaryotes 113, 118, 145
re-engineering 170–6
from yeast 187–8, 189
see also Human Genome Project
genomics
chemogenomics 334
for drug discovery 310–13
library 120, 122
target validation 322–3
genotype, mouse 411
genotyping 89–90
germplasm ownership 301
glucose
from corn processing 550, 551
from enzymatic hydrolysis 553
glucose biosensors 516, 517, 522–5,
527–9
optical 537–8
glucose oxidase 234, 523, 524–5,
537–8
glycerol 560–1
glycosylation
humanising in Pichia pastoris 183–6
in yeast 169
GM crops see transgenic crops
gold nanoparticles 232–6, 240
Golgi complex 183–4, 186
gram-negative intestinal bacteria 105–6
green fluorescent protein 280
guanidinium thiocyanate 6
Haemophilus influenzae type b 340–1
hanging drop technology 372
hCG biosensor 541
healthcare, cost of 351–2
heart tissues 355, 373
heat treatment, antiviral 508
hematology 59–62
hematopoietic stem cells 359, 360
hemicellulases 553
hemicellulose 552–3, 561, 565–6,
568, 575
hepatitis 100–1
hepatitis B virus vaccine 341–2
hepatitis C virus 89, 100–0
herbicides 283–4
heteroduplexes 140–2
heterologous protein production see
recombinant protein production
heterozygous individuals 133, 134,
135, 138
hierarchical shotgun sequencing 145–8
Higgins–Selkov oscillator 200–2
high-fructose corn syrup 551
high-throughput screening 310, 312
His tags 40–1, 42, 500
HIV/AIDS 76, 103–4, 508
vaccines and 343, 345
holding pipette 395, 403
hollow-fiber bioreactors 370–1
home diagnosis and testing 517
homoduplexes 140–2
homologous recombination 398, 401–3,
408
homozygous individuals 133, 134
horseradish peroxidase 529–30, 537–8
‘Hot Start’ PCR 125

594 Subject Index
Humalog 435
human antibodies, recombinant 438–40
human brain receptor activity 176–7, 178
human diseases, yeast gene homologues
and 187–8
human genes 390
human genome 113–14
Human Genome Project 52, 120, 132,
136, 151, 152, 390
background 144
mapping and sequencing strategies
144–8
human papillomaviruses 89, 102
vaccines 342
human steroid receptor activity 177, 179
human tissues, as receptor targets 321–2
humanised antibodies 249–50, 255–6,
439–40, 442
humanised EPO 179–86
humulin 435
Huntingdon disease 137
hybrid poplar 575, 576
hybrid seed 292–3
hybridisation probes 10, 90, 92, 119, 121
hybridisation techniques 90–3, 558
clone identification 119, 121
Fibre FISH 149–50
FISH 64, 149
line probe assays 91, 92
PNA-FISH 92–3
sandwich hybridisation 90, 91–2
hybridoma technology 246, 247, 248
and phage display 261–2
hydrogen peroxide 523–4, 525, 526,
529–30
hydrolysis
enzymes 552–4
SHF 561–5
starch 550–1
hydrophilicity 477–8
hydrophobic interaction chromatography
497, 498, 501
hypersensitive response 287, 288
hypervariable minisatellites 133, 135
IgG antibodies 249, 250, 341, 436
imaging mass spectrometry 315
immobilisation 469–83
by adsorption 474–7
in biosensors 518–19
covalent binding 475, 477–9, 484, 519
cross-linking 475, 481–3
encapsulation 475, 480–1
entrapment 475, 479–80, 519
multienzyme complexes and 465–6
support materials 470–4
immune-stimulating complexes 347
immunisation, and phage display 262
immunoassays 539, 543–4
immunogenicity 248, 251, 254–6, 264
vaccines 341, 346, 348
immunotoxins 264
in silico research 18, 332–3
in vitro studies 332–3
tissue engineering 355–6, 361, 369–71
in vivo animal imaging 225
inactivated vaccines 339–40
inclusion bodies
formation 36, 39
material recovery from 495–6
indirect labelling 13
infectious agents 77
hybridisation assays of 92, 93
see also bacteria; viruses
infectious diseases
antibody therapy for 248
paradigm of 53–5
vaccination 337–49
infliximab 249, 254
injection pipette 395, 403
inorganic support materials 472
insect resistance 284–5
insecticides 284
insert capacity 24
insulins 434–5
intellectual property, plants and 300–1
interactome 315
interferon β-1b 434
internal controls, real-time qPCR 87–8
internal metabolites 205
International Human Genome
Sequencing Consortium 145, 148
Subject Index 595
international normalized ratio 66
Internet
CGAP website 63
resources available over the 11, 18
intestinal bacteria 105–6
introns 393, 394
Invitrogen’s Gateway system 43
ion exchange chromatography 497,
498, 499
ion-selective electrodes 531–3
ionotropic gelation 479
IPTG inducer 28–9, 120
irinotecan 69, 70
iron oxide, magnetism-engineered
228–31
isochromosome 56
kinases 316
kinetic modelling 198–202
kinomics 316
Klenow enzyme 14–15
knock-in approach 408
knockout mouse 323, 400–4, 405
conditional 406–9
labelling
DNA 3, 12–15, 16, 17
transgenic foods 302
lactate dehydrogenase 570
lactic acid 550, 568, 570
lambda bacteriophage vectors 117
laminin 363
large-scale manipulation,
mammalian/bacterial DNA 170–6
lead compounds
generation and validation 335
using biochips 330
leakage problem 475–6
leucine-rich repeats 288–9
library screening, in cloning 118–19
ligands
affinity 500–1
protein–ligand interactions 441–2
in sequence modification 428–30
light scattering 233
lignin 300, 552, 553, 565, 574–6
line probe assays 91, 92
linkage analysis 132, 138, 149
liposomes 347
liquid chromatography–mass
spectrometry 210, 314
listerial infections 344
live attenuated vaccines 338–9
live vectors, recombinant 343
liver
bioartificial 213–14
cells 355–6, 372
local resistance, pathogens 287
locus 132
loxP sites 404–10
LS9 Inc. 573
lymphomas, malignant 59–62
lysis, cell 494–5
M13 bacteriophage 238–9, 257
magic bullets 245, 264
magnetic domain structures 227
magnetic nanoparticles 226–32
magnetism, nanoscaling laws and
226–8, 229
magnetism-engineered iron oxide
228–31
magnetophoresis 231
MALDI-MS 314–15
male sterility, crops 292–3
malignant lymphomas 59–62
maltose-binding protein 38–9
mammalian DNA, manipulation of
170–6
mammalian tissues, in vitro growth
369–70
mannose 183, 184, 185
manual extraction kits 81
mass action kinetics 199, 200
mass spectrometry
GC–TOF–MS 209–10
LC–MS 210, 314
MALDI-MS 314–15
Matrigel 364
mature cells 361–2
Maxam and Gilbert sequencing 128
mediators 527, 528, 529–30
596 Subject Index
medical applications
biosensors 517
immobilised biocatalysts 488
melting curve analysis 88–9
membrane chromatography and
filtration 503–4
membrane entrapment 519, 520–1,
523–5
mesenchymal stem cells 359, 360
metabolic control analysis 202–6
metabolic engineering 196–215
examples in 211–14
experimental approaches 198, 208–11
metabolomics 209–11
tools for 208–9
theoretical approaches 197–208
elementary flux mode analysis
205–6
flux-balance analysis 206–8
kinetic modelling 198–202
metabolic control analysis 202–6
metabolic flux analysis
bioartificial liver and 213–14
elementary flux mode 205–6
flux-balance 206–8
metabolic instability 332
metabolic partitioning 297–8
metabolomes 188, 190, 209
metabolomics 209–11, 317–18, 563–4
metabonomics 317–18
metabotyping 317
metaplasia 361–2
methicillin-resistant S. aureus 104–5
Michaelis–Menten rate law 199
microarray technology 188
see also DNA microarrays
microfluidic card 58, 98–9
microfluidic systems 7
microinjected DNA 391–7
microorganisms
as biocatalysts 468
in biomass conversion 554–5, 556,
562–4, 567–71
as biosensors 542–3
see also bacteria; clinical micro-
biology; fungal pathogens; yeast
microsatellites 136–7, 275
microtissue spheroids 372–3
minisatellite variant repeats system 136
minisatellites 133, 135–6
miRNAs 329
MMR vaccine 339
model organisms 190
in drug discovery 333–4
target validation 322–3
transgenesis in 391, 412–13
molecular chaperones 36–7
molecular cloning 20–45, 115, 116, 248
molecular diagnostics 51–71
crops 277–8
genetics 55–9
hematology 59–62
infectious disease paradigm 53–5
oncology 62–4, 69–71
pharmacogenomics 65–71, 311–12
technologies 52–3
molecular evolution 426, 428–32
molecular maps, crops 273–4
molecular markers 274
biomarkers 320
marker-assisted selection 275–7
selectable marker genes 280
types of 274–5
see also genetic mapping
molecular microbial diagnostics 76–107
classical diagnosis 78–9
clinical nucleic acid-based diagnosis
99–106
genotyping 89–90
nucleic acid amplification 81–90
nucleic acid extraction 80–1
other techniques used in 90–9
sample collection and transport 79–80
monoclonal antibodies 246, 247, 248–50
monogenic (single gene) disorders 56, 57
monolith columns 505
mosaics 396
mouse
gene targeting in 397–404, 405
knockout mice 323, 400–4, 405,
406–9
as model organism 333, 391, 412–13
Subject Index 597
phenotypic analysis genetically
modified 411–12
see also murine antibodies;
transgenic mouse
MRI imaging 230
mRNA
display 430
isolation of 6
yeast molecules 165–6
MRSA 104–5
multienzyme complexes 462–6
apoptosomes 462–3
cellulosomes 464–5
future immobilisation technology
465–6
proteosomes 463–4
multilocus sequence typing 96–7
multiple cloning sites 115, 120
multiplex real-time PCR 88
multivalent drug design 318
murine antibodies 246, 247, 248, 251,
254–6
muscle 359
mutagenesis 208
in sequence modification 423–5
mutation detection 139–44
denaturing HPLC 140–2
DNA microarrays 143–4
single-stranded conformation
polymorphism 140, 141
Mycobacterium
M. bovis 338–9
M. tuberculosis 106, 338, 347–8
nanobiotechnology, in drug discovery
318–20
nanobodies 320
nanoparticles
drug candidates 319–20
magnetic 226–32
support materials 472–4
zerovalent noble metal 232–6
nanoscale 220–1
structures, making 236–40
nanoscaling laws, and magnetism
226–8, 229
nanotechnology 220
nanowires 220, 239
natural resistance genes 288–90
negative controls 87
negative selection cassettes 401, 402
Neisseria meningitidis 340–1
nematode pathogens 292
neomycin phosphotransferase gene 280
nested PCR 83
neutraceuticals 299
nick translation 15, 17
NMR spectroscopy, metabolic data
from 317
noble metal nanoparticles, zerovalent
232–6
non-Hodgkin lymphomas 60–2
non-specific binding problem 476
noroviruses 101–2
Northern blotting 10
novel biological reporter systems
human brain receptor activity 176–7,
178
human steroid receptor activity 177,
179
protein–protein interactions 177, 179,
180, 190
nucleic acid amplification techniques
79, 81–90
see also polymerase chain reaction
(PCR)
nucleic acid-based diagnosis
bacterial antibiotic resistance and
virulence factor genes 104–6
CNS disease 99–100
gastroenteritis 101–2
hepatitis 100–1
HIV/AIDS 103–4
respiratory infections 100
sexually-transmitted diseases 102–3
nucleic acids
analysis 8–11
databases 11, 18, 151
electrophoresis of 6–7
extraction 80–1
isolation and separation of 3–6
typing of bacteria 93–7
598 Subject Index
oestrogen receptor protein 177, 179
oils, plant 295–6
oligonucleotides 323, 324
CpG 348
in DNA mutagenesis 424, 425
in domain fusion 427
in gene assembly 422
oncology 62–4, 69–71, 248, 264
Ontak 436, 437
open reading frames 43–4
optical biosensors 516, 536–42
organ transplantation 351, 352
organic crystals 531
organic polymerisation 479–80
organic support materials 472
origin of replication, in plasmids 25–6
osmoprotectants 212–13
overexpression 391, 392–3
oxidoreductases 485
oxygen
electrode 522–3, 526
tissue growth and 369, 370
particle bombardment 281
patents 300–1
pathogen-derived resistance 285–6
pBAD expression system 28, 33–4, 35
pBR322 plasmid 25–7
PCR see polymerase chain reaction
(PCR)
pentose phosphate pathway 564–5
peptide–amphiphiles 240
peptide libraries 238–9, 428–31
peptide nucleic acids 324–5
perfect marker 276, 277
perfusion bioreactors 371
periplasmic space 254
pET expression system 30–3
Petri dish 370
petroleum-like products 573–4
phage display 257–62, 428–32
bypassing hybridoma technology
261–2
bypassing immunisation 262
phagemid vectors 259, 260, 429
phagocytosis 340–1
pharmacogenetics 311
pharmacogenomics 65–71, 311–12
phase separation 367
phenotype
identification 432
mouse 411–12
phosphorylation 316
photostability, quantum dots 222, 225
physical mapping 132, 144–5
phytochelatins 238
Pichia pastoris
expression vectors 164, 166
glycosylator 169
host cell 161–2
humanising glycosylation in 183–6
recombinant protein production 160
piezoelectric biosensors 516, 534–6
plants
bacterial pathogens 291
as bioreactors 298–9
cells 467–8
forestry biotechnology 300
fungal pathogen resistance 287–8,
290–1
intellectual property 300–1
metabolic engineering of 211–13
polymers and biodegradable plastics
298
viruses 285–6
yeast engineering of 181–3
see also biomass conversion; crops;
transgenic crops
plasma membrane calcium pump 4 393
plasmids
pBAD 28, 33–4, 35
pET 30–3
in protein expression 24–9
vectors 117
plasmon-resonant particles 232–3, 235
plasticity 360–1
platform technologies 510
pluripotency 398, 399
PNA-FISH 92–3
point mutations 434–5
polyacrylamide gel electrophoresis 6–7
polyclonal antibodies 248
Subject Index 599
polygenic (multifactorial) disorders
56, 57
polyketide synthases 438
polylinkers 115
polymerase chain reaction (PCR) 15–18,
81–2, 122–8
chimeric antibody design 251–3
contamination problem 82
gene deletion strategy 188, 189
in molecular diagnostics 61
nested PCR 83
PCR cycle sequencing 130
primer design and bioinformatics
125–6
reverse transcriptase 82–3, 100–2,
126
in sequence modification 421–2, 423,
425–6, 427
steps in the 123–5
transgenic mice identification 396
see also real-time PCR
polymers
plant 298
in tissue engineering 366–7, 371
polysaccharide supports 477–8
polysaccharide vaccines 340–1
pooled ORF expression technology 43
positional cloning 132
positive controls 87
positive selection cassettes 401, 402
post-translational modifications 467
potency, antibodies 264–5
potentiometric biosensors 516, 531–3
precipitation 498
in immobilisation 480
protein 496–7
pretreatment 552, 565–6
primary recovery 493–6
primer design 125–6
process integration 509
process validation 506–7
progenitor cells 357
proliferation-inducing transgenes 361
promoters 393–4
commercially available 30–4
for E. coli 23
protease inhibitors 313
protein A 500, 540
protein databases 11, 18, 151
protein engineering 418–47
applications
de novo design 442–3, 444–6
domain shuffling 435–41
point mutations 434–5
protein–ligand interactions 441–2
whole protein shuffling 441
approved chimeric antibodies 439–40
approved fusion products 437
tools for
analysis 433
production 432–3
sequence identification 420
sequence modification 421–32
structure determination and
modelling 420–1
see also recombinant protein
production
protein expression 20–45, 432–3
fusion proteins 37–44
host-related issues 21–4
mapping 314
other hosts 44
problems with 34–7
vectors 24–9
protein expression systems
cell-free 44–5
pBAD 33–4, 35
pET 30–3
protein–ligand interactions 441–2
protein–protein interactions 177, 179,
180, 190, 315–16
proteins 294–5
crystallisation 504
as drug targets 313
precipitation 496–7
scaffolds 442–3, 444–6
structures 419–21
see also enzymes
proteomes 188, 190
proteomics 558, 567–8
in drug discovery 313–16
with metabolomics 317
600 Subject Index
proteosomes 463–4
pseudo-pregnancy 396, 400
public acceptance, transgenic crops 301–2
pUC plasmid 28, 29
pUC18 plasmid 116–17
pulsed field gel electrophoresis 6, 94
purification-facilitating tags 38, 40–3
purification factor 498
pyrosequencing 97–8, 131
pyrrole 530–1
qdots 238, 239
semiconductor 222–6
qPCR 87–8
real-time 86–7, 126–8
quality by design 507
quality manipulation 294–8
metabolic partitioning 297–8
nutritional and technological 294–7
shelf-life 294
quantifications, absolute and relative 86–7
quantitative trait loci 276
quantum confinement effects 222–4
quantum dots see qdots
quantum wells 220
radiation hybrids 146–7
random amplified polymorphic DNA
94–5, 275
random primer labelling 14–15, 16
rapeseed 295–6, 550, 556
Rayleigh scattering 232
re-engineering, genomes 170–6
real-time PCR 52–3, 63, 64, 83–9
equipment 86
internal controls in 87–8
melting curve analysis 88–9
multiplex 88
qPCR 86–7, 87–8, 126–8
viral load determination 87
visualisation of amplification 84–5
receptor-based biosensors 543–5
receptor targets 321–2
recombinant protein production
in E. coli 213
by yeast 160, 161–70
appropriate structure and function
168–70
ensuring high levels of 166–8
recombinant vaccines
adenovirus 345
BCG 343–4
live vectors 343
protein 341–2
Salmonella vectors 344–5
vaccinia vectors 346
redox reactions, enzyme-catalysed
522–4, 527, 528
refractive index 538, 541
regeneration enzyme 486
relative quantification 86–7
relaxivity coefficient 229–30
replica plating 27, 28, 118–19
reporter genes 280
resistance genes 288–90
resolubilisation 495–6
resonance angle 541
resonant frequencies 535
respiratory infections 100
restriction endonucleases 1–3, 115–16
analysis 93, 133
restriction fragment length
polymorphism 8, 95, 132–6, 274
restriction mapping 8
restriction sites
digestion at 145, 146
for plasmids 25, 26, 28–9
reverse genetics 132
reverse transcriptase PCR 82–3, 126
diagnostic applications 100–2
Rhizomelic chondrodysplasia punctata
187, 188
ribonuclease protection assay 10–11
ribosomes 460
display 263, 430
ribotyping 96
ribozymes 323, 325–6, 459–60
rituximab 248–9, 254
RNA
blotting 10–11
as a drug target 325
isolation of 5–6
Subject Index 601
phage display 430
ribozyme cleavage of 326
16S rRNA gene 96
RNA interference 11, 326–9
assay development and 328
drug discovery and 328–9
microRNAs and 329
siRNA libraries and 327
robustness 507
rotating-wall bioreactors 371
16S rRNA gene 96
Sabin polio vaccine 339, 340
Saccharomyces cerevisiae 159, 333
comparative sequence analysis 187
expression vectors 164, 165
in fermentation 550, 560–1
genome 317
host cell 161
recombinant protein production 160
secondary metabolite production 181
secretion products 167
salicyclic acid 287
Salk polio vaccine 340
Salmonella vectors, recombinant 344–5
sample collection and transport 79–80
sandwich assay, nanohybrid 231
sandwich hybridisation 90, 91–2
Sanger sequencing 114, 128
SARS epidemic 76
saturation kinetics 519–20
saturation magnetisation 227–8
scaffold-assisted tissues 353, 369–71
scaffold-free tissues 353, 372–3
scaffolds
commercially available 368–9
see also extracellular matrix
scaledown methods 506
scFv antibody fragments 253, 258–60,
261–3
screening
drug discovery 309–10, 320–2
virtual 335
second generation transgenic crops 283
secondary metabolites 181–3
secretory pathway, yeast 167–8
selectable marker genes 280
self-assembly systems 367
semi-nested PCR 83
semiconductor nanoparticles 238
semiconductor quantum dots 222–6
semipermeable membranes 480–18
sensitivity analysis 202
sentinel lymph nodes 63
separate hydrolysis and fermentation
552, 561–5
serology 79, 100
serum therapy 245, 246, 248
sexually-transmitted diseases 102–3
shelf-life 294
Shine–Dalgarno (S–D) sequence 23
SHIRPA protocol 412
silaffins 237
‘silent’ genes 317
silicon chip biosensors 517, 530–1,
544–5
silver nanoparticles 232–3, 236
simple sequence repeats 275
single-locus probes 133, 135
single nucleotide polymorphisms 63,
65, 137–9
in drug discovery 311–12
single overlap PCR 425
single-stranded conformation
polymorphism 140, 141
siRNA libraries 327
skin cells 360
slot (dot) blotting 10
‘smart’ assays 84–5
SMS probe 319
solubility-enhancing tags 37–40
somatic cell hybridisation 149
Southern blot 9–10, 52, 61, 132–3,
134, 135, 274, 396
soybean oil 549, 556–7
specificity, enzymes 456–8
spinner flasks 370
splicesomes 460–1
SSCF (simultaneous saccharification
and cofermentation) 552, 561
SSF (simultaneous saccharification
and fermentation) 552, 561–5
602 Subject Index
stability, immobilised biocatalysts 483–4
Staphylococcus aureus 104–5
starch 550–1
manipulation 296–7
steady-state response 521, 527
stem cells 359, 360–1
characterisation of 358
pathways of 357
see also embryonic stem cells
stereospecificity 457
steroids, human, receptor activity
177, 179
stoichiometry matrix 199, 207
streptavidin aptamers 325
Streptococcus pneumoniae 340, 341
stress resistance, plants 212
substrate molecule 457, 458
subunit vaccines 340–2
sugarcane residues 575
summation theorems 203
superovulation 394
support materials
covalent binding and 477–9
immobilisation 470–4
surface acoustic wave devices 535–6
surface plasmon resonance 539, 540–2
surrogate females 396, 400
susceptibility, magnetic 226, 231
switchgrass 575, 576
SYBR Green 84, 127
synthetic implants 351
synthetic organisms, building 175–6
system biology tools 557–8, 563, 567
systemic resistance 287, 290
systems biology 190–1, 198
goal of 206
T-cell lymphoma 60–1
T7 RNA polymerase 31, 32
tags
purification-facilitating 38, 40–3
solubility-enhancing 37–40
tamoxifen 69, 70
Taq DNA polymerase 123, 125
TaqMan low-density arrays 85, 98–9, 127
target DNA 16, 123–4
target sequences, restriction
endonuclease recognition 2–3
target validation 311
for antisense 324
lead compounds 335
nanobiotechnology for 318
technologies 322–3
targeting vector 400–1, 402
targets
characterisation 311
drug 67–8, 69
identification 311
temperature-induced gelation 479
template DNA 16, 123–4
temporal-specific knockout mice 409
tendons 221, 359
terminal glycosylation 183, 185
tetanus toxin 342
tetracycline 25, 27
therapeutics see drugs
Thermoanaerobacterium
saccharolyticum 568
thermocyclers 86
third generation transgenic crops 283
threshold cycle 86
tissue engineering 351–73
artificial tissue cultivation 369–71
cell types 354–5, 356–62
commercially available scaffolds
368–9
definition 353
extracellular matrix 362–9
scaffold-free tissues 353, 372–3
treating disease through 353, 355–6
tissue plasminogen activator 441
tissue scaffolds 365
tissue screening 322
tissue-specific knockout mice 409
tolerance, abiotic stresses 293
toll-like receptor 9 348
‘Touchdown’ PCR 124
toxic payload 264
toxoid vaccines 342
transcript stability 165–6
transcriptional stop signal 394
transcriptomes 188, 190
Subject Index 603
transcriptomics 558, 563–4, 566, 569
transdifferentiation 360–1, 362
transesterification 556, 573
transformation, yeast 164–5
transformation-associated recombination
175–6
transgenes
construction of 392–4
proliferation-inducing 361
transgenesis 390–414
conditional gene targeting 404–10
by DNA pronuclear injection 391–7,
408
ethical and animal welfare
considerations 412–14
gene targeting 397–404
from gene to function 390–1
new large-scale projects 414
phenotypic analysis genetically
modified mice 411–12
transgenic crops 279–83
Agrobacterium-mediated
transformation 280
applications of technologies 281–3
bacterial pathogen resistance 291
herbicide resistance and 283–4
insect resistance 284–5
major companies involved in 282
particle bombardment 281
plant viruses and 285–6
public acceptance of 301–2
rapeseed 296
selectable marker and reporter genes
280
starches 296–7
see also crops; plants
transgenic line generation 396–7
transgenic mouse 172, 173, 391–7
fertilised oocyte collection 394–5
pronuclear DNA transgene injection
395–6
transgene construction 392–4
transgenic line generation 396–7
transition state 458
translation initiation 22–3
translation termination 23
translocation 56
transportation fuels 548, 572, 573–4
Trichoderma reesei 561
tuberculosis 106, 338–9, 342, 343
two-hybrid system 177, 180, 188
2D gel electrophoresis 314
ubiquitin 464
UGT enzymes 69, 70, 71
URA3 gene 172–5
urea sensor 533
ureaplasmas 103
US National Center for Biotechnology
Information 138
user developed assays 51
V genes 247, 251–6, 257–8, 261
vaccines 337–49
adjuvants 347–9
edible 298–9
main types of 338–42
need for new 342–3
new approaches to development 343–7
see also recombinant vaccines
vaccinia vectors, recombinant 346
validation 506–7
vancomycin-resistant enterococci 105
variant generation 426, 428
variety identification, crops 278
vascularisation 355, 363, 373
viral infectious disease tests 54
viral load 87, 508
viral vaccines 338
virosomes 347
virtual drug development 334–5
virtual screening 335
virulence factor genes 104–6
viruses
classical diagnosis 78
CNS disease 99
genomic analysis 114
magnetic nanoparticles detection of
230
plant 285–6
quantum dot visualisation of 224–5
sexually transmitted disease 102
visualisation, real-time PCR amplification
84–5
604 Subject Index
VNTRs 8, 133, 135–6
warfarin 66–7
websites see Internet
Western blotting 103
wet mill process 549, 550–1
wheat embryo system 45
wheat straw 575
whole cell biosensors 542–3
whole genome shotgun sequencing
145, 148
whole protein shuffling 441
wine 560, 565
worm (Caenorhabditis elegans) 113,
333–4, 391
X-gal 28–9, 119, 120
xylose 553, 564
yeast 159–60
display 262–3
ethanol production from 551
expression vectors 162–4
genome sequence 187–8, 189
genomic insights and 187–8, 189
humanising glycosylation in 183–6
mammalian/bacterial DNA, large-
scale manipulation of 170–6
novel biochemical products include
humanised EPO 179–86
novel biological reporter systems 176–9
recombinant protein production 160,
161–70
DNA constructs in 162–4
high mRNA levels 165–6
high protein levels 166–8
hosts 161–2
protein structure and function 168–70
transformation and selection 164–5
systems biology 190–1
transcriptomes, proteomes,
metabolomes and drug
development 188, 190
see also Pichia pastoris;
Saccharomyces cerevisiae
yeast artificial chromosomes 117–18,
170–2
building synthetic organisms 175–6
manipulating mammals 172–5
YSI (Yellow Springs) analysers 523–4
zebrafish 391
zerovalent noble metal nanoparticles
232–6
ZnS qdots 224, 239
Zoo blotting 10