
Molecular and chemical characterization of a Sphagnum...
10
Ecological Indicators 71 (2016) 388–397 Contents lists available at ScienceDirect Ecological Indicators jo ur nal ho me page: www.elsevier.com/locate/ ecolind Molecular and chemical characterization of a Sphagnum palustre clone: Key steps towards a standardized and sustainable moss bag technique A. Di Palma a , D. Crespo Pardo b , V. Spagnuolo b,∗ , P. Adamo a , R. Bargagli c , D. Cafasso b , F. Capozzi b,d , J.R. Aboal e , A.G. González f,g , O. Pokrovsky g,h,i , A.K. Beike j,k , R. Reski k,l,m , M. Tretiach d , Z. Varela n , S. Giordano b a Department of Agronomy, University of Naples Federico II, Via Università, 100, 80055 Portici (NA), Italy b Department of Biology, University of Naples Federico II, Campus Monte S. Angelo, Via Cinthia 4, 80126 Naples, Italy c Department of Physical Sciences, Earth and Environment, University of Siena, Via P.A. Mattioli 4, 53100 Siena, Italy d Department of Life Sciences, University of Trieste, Via L. Giorgieri 10, , 34127, Trieste, Italy e Department of Cellular Biology and Ecology, Faculty of Biology, University of Santiago de Compostela, 15782 Santiago de Compostela, Spain f Université de Bretagne Occidentale, LEMAR-UMR 6539, CNRS-UBO-IRD-IFREMER, Place Nicolas Copernic, 29280 Plouzané, France g GET (Géosciences Environnement Toulouse) UMR 5563 CNRS, 14 Avenue Edouard Belin, 31400 Toulouse, France h BIO-GEO-CLIM Laboratory, Tomsk State University, Tomsk, Russia i Institute of Ecological Problems of the North, RAS, Arkhangelsk, Russia j State Museum of Natural History, Rosenstein 1, 70191 Stuttgart, Germany k Plant Biotechnology, Faculty of Biology, University of Freiburg, Schänzlestraße 1, 79104 Freiburg, Germany l BIOSS—Centre for Biological Signalling Studies, 79104 Freiburg, Germany m FRIAS—Freiburg Institute for Advanced Studies, 79104 Freiburg, Germany n BIOVIA Consultor Ambiental, Edificio Emprendia, Campus Vida, 15782 Santiago de Compostela, Spain a r t i c l e i n f o Article history: Received 18 January 2016 Received in revised form 21 June 2016 Accepted 23 June 2016 Keywords: Atmospheric pollution Biomonitoring Moss bags Trace elements DNA molecular markers a b s t r a c t This work aimed to define the molecular and chemical signature of a S. palustre clone developed in the framework of the EU-FP7 Mossclone project to improve the standardization and reliability of the moss- bag technique. The molecular characterization was performed by a set of DNA molecular markers (RAPD, ISJ, PCR-RFLP, sequencing and microsatellites) to tag the clone produced within the project. Molecular characterization also provided new DNA markers that can be applied in systematic analyses of Sphag- num, and gave new insights to implement well established techniques. The elemental composition of the clone was measured by ICP-MS analysis of 54 major and trace elements, with and without commonly applied pre-exposure treatments (oven devitalization and EDTA washing). Concentrations of almost all analyzed elements were significantly lower (from 10 to 100 times) in the clone than in conspecific field moss, apart from some elements (K, Mo, P and Na) deriving from the culture medium or EDTA treatment. Oven devitalization and EDTA washing did not significantly affect the clone composition. A compari- son between the elemental composition of the clone with that of naturally growing Sphagnum species proved the particularly low elemental content of the clone. Therefore, in view of a rigorously standard- ized moss-bag protocol for the monitoring of persistent atmospheric pollutants, the use of the S. palustre clone, a biomaterial with very low and constant element composition, and homogenous morphological characteristics is strongly recommended. © 2016 Elsevier Ltd. All rights reserved. 1. Introduction Air pollution monitoring and management has been one of the main European scientific and political concerns since the ∗ Corresponding author. E-mail address: [email protected] (V. Spagnuolo). 1970s. Three directives were adopted by EU for air quality ass- esment and management (1999/30/EC, 2002/3/EC, 2004/107/EC and 2008/50/EC) relating to metals, polycyclic aromatic hydro- carbons, ozone, sulphur dioxide, nitrogen oxides and dioxide, particulate matter in ambient air. A Clean Air Policy Package (CCEP- COM/2013/0918) was adopted in December 2013, with new air quality objectives up to 2030. http://dx.doi.org/10.1016/j.ecolind.2016.06.044 1470-160X/© 2016 Elsevier Ltd. All rights reserved.
Transcript of Molecular and chemical characterization of a Sphagnum...
Mct
AFMa
b
c
d
e
f
g
h
i
j
k
l
m
n
a
ARRA
KABMTD
1
t
h1
Ecological Indicators 71 (2016) 388–397
Contents lists available at ScienceDirect
Ecological Indicators
jo ur nal ho me page: www.elsev ier .com/ locate / ecol ind
olecular and chemical characterization of a Sphagnum palustrelone: Key steps towards a standardized and sustainable moss bagechnique
. Di Palma a, D. Crespo Pardo b, V. Spagnuolo b,∗, P. Adamo a, R. Bargagli c, D. Cafasso b,. Capozzi b,d, J.R. Aboal e, A.G. González f,g, O. Pokrovsky g,h,i, A.K. Beike j,k, R. Reski k,l,m,. Tretiach d, Z. Varela n, S. Giordano b
Department of Agronomy, University of Naples Federico II, Via Università, 100, 80055 Portici (NA), ItalyDepartment of Biology, University of Naples Federico II, Campus Monte S. Angelo, Via Cinthia 4, 80126 Naples, ItalyDepartment of Physical Sciences, Earth and Environment, University of Siena, Via P.A. Mattioli 4, 53100 Siena, ItalyDepartment of Life Sciences, University of Trieste, Via L. Giorgieri 10, , 34127, Trieste, ItalyDepartment of Cellular Biology and Ecology, Faculty of Biology, University of Santiago de Compostela, 15782 Santiago de Compostela, SpainUniversité de Bretagne Occidentale, LEMAR-UMR 6539, CNRS-UBO-IRD-IFREMER, Place Nicolas Copernic, 29280 Plouzané, FranceGET (Géosciences Environnement Toulouse) UMR 5563 CNRS, 14 Avenue Edouard Belin, 31400 Toulouse, FranceBIO-GEO-CLIM Laboratory, Tomsk State University, Tomsk, RussiaInstitute of Ecological Problems of the North, RAS, Arkhangelsk, RussiaState Museum of Natural History, Rosenstein 1, 70191 Stuttgart, GermanyPlant Biotechnology, Faculty of Biology, University of Freiburg, Schänzlestraße 1, 79104 Freiburg, GermanyBIOSS—Centre for Biological Signalling Studies, 79104 Freiburg, GermanyFRIAS—Freiburg Institute for Advanced Studies, 79104 Freiburg, GermanyBIOVIA Consultor Ambiental, Edificio Emprendia, Campus Vida, 15782 Santiago de Compostela, Spain
r t i c l e i n f o
rticle history:eceived 18 January 2016eceived in revised form 21 June 2016ccepted 23 June 2016
eywords:tmospheric pollutioniomonitoringoss bags
race elementsNA molecular markers
a b s t r a c t
This work aimed to define the molecular and chemical signature of a S. palustre clone developed in theframework of the EU-FP7 Mossclone project to improve the standardization and reliability of the moss-bag technique. The molecular characterization was performed by a set of DNA molecular markers (RAPD,ISJ, PCR-RFLP, sequencing and microsatellites) to tag the clone produced within the project. Molecularcharacterization also provided new DNA markers that can be applied in systematic analyses of Sphag-num, and gave new insights to implement well established techniques. The elemental composition of theclone was measured by ICP-MS analysis of 54 major and trace elements, with and without commonlyapplied pre-exposure treatments (oven devitalization and EDTA washing). Concentrations of almost allanalyzed elements were significantly lower (from 10 to 100 times) in the clone than in conspecific fieldmoss, apart from some elements (K, Mo, P and Na) deriving from the culture medium or EDTA treatment.Oven devitalization and EDTA washing did not significantly affect the clone composition. A compari-
son between the elemental composition of the clone with that of naturally growing Sphagnum speciesproved the particularly low elemental content of the clone. Therefore, in view of a rigorously standard-ized moss-bag protocol for the monitoring of persistent atmospheric pollutants, the use of the S. palustreclone, a biomaterial with very low and constant element composition, and homogenous morphologicalcharacteristics is strongly recommended.. Introduction
Air pollution monitoring and management has been one ofhe main European scientific and political concerns since the
∗ Corresponding author.E-mail address: [email protected] (V. Spagnuolo).
ttp://dx.doi.org/10.1016/j.ecolind.2016.06.044470-160X/© 2016 Elsevier Ltd. All rights reserved.
© 2016 Elsevier Ltd. All rights reserved.
1970s. Three directives were adopted by EU for air quality ass-esment and management (1999/30/EC, 2002/3/EC, 2004/107/ECand 2008/50/EC) relating to metals, polycyclic aromatic hydro-carbons, ozone, sulphur dioxide, nitrogen oxides and dioxide,
particulate matter in ambient air. A Clean Air Policy Package (CCEP-COM/2013/0918) was adopted in December 2013, with new airquality objectives up to 2030.
al Indi
bra(Ieisttibadpeoeadidctoetaesftd(eaipai
npbcaEn
2
2
1t1IauttD
A. Di Palma et al. / Ecologic
Mosses, either used as native species or as transplants (mossags), can accumulate airborne inorganic and organic pollutants,epresenting a cost effective and reliable tool for air monitoring,lso combined with automatic devices and emission inventoriesAdamo et al., 2008a; Spagnuolo et al., 2013; Harmens et al., 2015;odice et al., 2016). The biomonitoring with moss bags allows tovaluate the atmospheric deposition of persistent air pollutantsn a well-constrained time period, in areas lacking native speciesuch as urban and industrial environments. It has the great advan-age that can be standardized at each step, from species selectiono post-exposure treatments. As a rule, the moss exposed in bagss harvested in pristine areas; however, significant differences inaseline element contents and in accumulation performance existmong different species and even in the same species grown inifferent habitats, or in the same area but collected in differenteriods (e.g. Zechmeister et al., 2003; Couto et al., 2004; Tretiacht al., 2011). The standardization of the moss bag technique is onef the most pressing and crucial concern of biomonitoring (Arest al., 2012) and an essential prerequisite is the morphologicalnd chemical homogeneity of the exposed material. In this sense,evitalizing and EDTA-washing treatments are recommended dur-
ng moss preparation (Ares et al., 2014). Devitalization by ovenrying prevents moss deterioration and enables the efficiency ofontaminant capture to remain constant, as capture is mainly dueo passive uptake processes that are independent of the vitalityf the moss (Adamo et al., 2007; Giordano et al., 2009; Fernándezt al., 2010). The use of chelating agents such as EDTA enhanceshe release of metals bound to cation exchange sites (Lodeniusnd Tulisalo, 1984). EDTA washing in moss transplants decreaseslement content in pre-exposure biomaterial, making it more sen-itive to environmental pollution inputs (Iodice et al., 2016). In theramework of the FP7 European project Mossclone, we firstly inves-igated the surface properties related to metal accumulation by fourevitalized moss species widely used for biomonitoring purposesGonzález and Pokrovsky, 2014). Sphagnum sp. showed the high-st uptake capability and afterwards, Beike et al. (2015) selectednd axenically cloned Sphagnum palustre L., a species allowingn photobioreactors the production of a suitable biomass for bagreparation. Recently, the Sphagnum clone was studied in terms ofdsorption capacity of Cu and Zn (González et al., 2016), revealingts promising use as biomaterial in moss-bag technique.
This work aimed to define (i) the molecular and (ii) chemical sig-ature of the S. palustre clone developed within the FP7 Europeanroject Mossclone. The molecular characterization was performedy a set of DNA molecular markers to tag the clone. The elementalomposition of the clone was estimated in relation to commonlypplied pre-exposure treatments, such as oven devitalization andDTA washing, and compared with that of naturally grown Sphag-um species.
. Materials and methods
.1. Molecular characterization
Two different lines of the cloned moss S. palustre named 2a and2a (Beike et al., 2015), and a reference field sample of S. palus-re (FS) collected in Posta Fibreno (central Italy, 41◦41′42.69′′N,3◦41′29.98′′E, 290 m a.s.l.; Terracciano et al., 2012) were analyzed.
n order to compose a clone-specific molecular tag we selectednd applied several techniques among those suggested for molec-
lar markers in mosses (e.g. Crespo Pardo et al., 2014). Althoughhe highly preserved DNA of Sphagnum involves some difficul-ies in the detection of polymorphisms at sub-specific levels, threeNA regions were selected among barcoding candidate sequencescators 71 (2016) 388–397 389
suggested for mosses (Liu et al., 2010); in addition, both unilocusand multilocus techniques were applied.
Total genomic DNA was extracted using Dneasy Plant Mini Kit(Quiagen) following the manufacturer instructions. The differentprocedures for each technique are described below.
2.1.1. RAPD (Random Amplified Polymorphic DNA) and ISJs(Intron-exon splice junctions)
RAPD amplifications were performed according to the protocolreported in Skotniki et al. (1999), modified for the annealing tem-perature (40 ◦C instead of 35 ◦C). Two 5′-FAM (blue fluorophore)labeled primers (ISJ 04 and ISJ 10, see Sawicki and Szczecinska,2007 for further details) were selected to obtain two character-istic multiband patterns. The reactions were performed in a finalvolume of 20 �l, containing 40 ng of genomic DNA, 1 U Taq poly-merase, 10xPCR buffer (Fermentas, USA), 200 �M of each dNTP and20 pmol of primer. The amplification protocol provided for a hotstart (1 min at 94 ◦C), followed by 44 cycles including the steps:denaturation at 94 ◦C for 1 min, annealing at 52 ◦C and 56 ◦C for1 min for the primers ISJ 04 and ISJ 10, respectively, and elonga-tion at 72 ◦C for 80 s. A further final extension at 72 ◦C for 5 mincompleted the PCR programme. Amplification products were sep-arated by capillary electrophoresis in an ABI Prism 3730 GeneticAnalyzer (Applied Biosystem); fragments were visualized as anelectropherogram profile and size determinations were made byGeneMapper ver. 3.1 Software (Applied Biosystem).
2.1.2. SequencesThe chloroplast regions matK, rbcL and trnH-psbA were ampli-
fied. The amplification products were purified (GFX PCR DNA andGel Band Purification Kit – Amersham Biosciences – and sequencedby BigDye Terminator ver. 3.1 Cycle Sequencing Kit (Applied Biosys-tems), according to the manufacturer’s instructions. Sequencereactions were run in an ABI Prism 3730 Genetic Analyzer (AppliedBiosystems); electropherograms were edited and aligned in Bioeditver. 7.1 to obtain consensus sequences. The GenBank accessionnumbers of the sequences are KJ865421, KJ865420 and KJ865419,respectively.
Five anonymous sequences were also developed by RAPD/ISJreliable amplification products. Amplified bands were excised fromthe agarose gel and purified with the GFX PCR DNA and Gel BandPurification Kit (Amersham Biosciences); fragments were ligatedinto a bacterial vector using TA Cloning Kit Dual Promoter – pCRII (Life Technologies) and used to transform Escherichia coli DH5�.After transformation, white colonies were picked and transferredto the PCR amplification mixtures (20 �l) and to a fresh LB plate fora replica.
2.1.3. MicrosatellitesFifteen primer pairs (Shaw et al., 2008), indicated as 1, 3, 4, 5, 9,
10, 14, 17, 18, 19, 20, 22, 28, 29 and 30, were used for microsatelliteamplifications. According to the different size range of the products,one of the primer for each pair was 5′-FAM or 5′-HEX labeled andfive different triple reactions were prepared and amplified follow-ing the experimental procedures described in Shaw et al. (2008).Amplification products were separated by capillary electrophore-sis in an ABI Prism 3730 Genetic Analyzer (Applied Biosystems);fragment profile was visualized as an electropherogram by Gen-eMapper ver. 3.1 Software (Applied Biosystems).
2.1.4. PCR-RFLP
The anonymous DNA region RAPDf was amplified using the F-F and F-R primers and following the protocol reported in Shawet al. (2003). The PCR products were purified by GFX PCR DNA andGel Band Purification Kit (Amersham Biosciences) and digested by
3 al Indicators 71 (2016) 388–397
atp
2
2
dtadsaadom
2wdtomo
2
itldpHtaAf2unwDe
2
wneTlCBmc
eapmotrt
90 A. Di Palma et al. / Ecologic
set of 17 restriction enzymes (Fermentas, Thermo Fisher Scien-ific) according to manufacturer’s instructions. Amplified/digestedroducts were visualized by electrophoresis on 1.5 agarose gels.
.2. Chemical characterization
.2.1. Moss materials and pre-treatmentsThe elemental composition of S. palustre clone (line 12a) pro-
uced in photobioreactors (Beike et al., 2015) was determined inriplicate after oven drying at 40 ◦C for 8 h (untreated clone, C-U)nd after the following treatments: (1) EDTA washing and ovenrying at 40 ◦C for 8 h (C-EDTA); (2) oven devitalization by con-ecutive 8 h-drying at 50, 80 and 100 ◦C (C-100); (3) EDTA washingnd devitalization (C-EDTA100). The EDTA washing was performeds follows: 1 wash for 20 min with 10 mM EDTA (disodium salti-hydrate, Panreac; 1 l EDTA/12.5 g d.w. of moss) and 3 washesf 20 min each with distilled water (1 l distilled water/10 g d.w. ofoss).
Field samples of S. palustre from Posta Fibreno (see paragraph.1) were also analyzed. Moss shoots were mixed and washedith Milli-Q water (18 M�, Millipore, Bedford, MA, USA) to remove
ebris and soil particles. Only the green shoots (about 3–4 cm fromhe apical parts) were selected for the analysis, discarding brownr senescent tissues. Three subsamples of the water-washed fieldoss were dried at 40 ◦C for 8 h (untreated field samples, FS-U) and
ther three were devitalized in oven as described above (FS-100).
.2.2. Analytical determinationsSphagnum palustre field and clone samples were acid digested
n a microwave (MARS 5 system CEM) in ISO 2 workstations inhe Géosciences Environnement Toulouse (G.E.T., Toulouse, France)aboratory cleaning room (class A 10,000). Moss samples (0.1 g.w. each) were mixed with 9 ml bi-distilled HNO3, 0.2 ml supra-ure HF (Merck KGaA, Darmstadt, Germany) and 1 ml suprapure2O2 (Merck KGaA, Darmstadt, Germany) in 20 ml Teflon con-
ainers (Savilex®). A one-stage digestion procedure consisting of 20 min-holding stage at 150 ◦C, 1600 W and 100 psi was applied.fter cooling, the mineralized solutions were evaporated at 70 ◦C
or 24 h on a hot plate and the residue dissolved by sonication in0 ml of 2% HNO3. The elemental analysis was carried out by ICP-MSsing an Agilent 7500 ce (Agilent Technologies, Santa Clara, Califor-ia, USA). The concentrations of 54 elements, including rare earths,ere evaluated as the mean of 100-times scanned measurements.etails about the entire analytical procedure are available in Vierst al. (2007, 2013) and Stepanova et al. (2015).
.2.3. Procedure controlMineralization solutions without moss samples (i.e. blanks)
ere used as negative control (1 blank every 8 samples) to ensureo contamination from the acid digestion. The concentrations of 16lements (Cd, Co, Dy, Eu, Ga, Gd, Hf, Ho, Lu, Mg, Na, Nb, Ni, P, Sn, Ta,h, Tl, Tm and W) in the blanks were always below the detection
imits. Erbium, Tb, U, Yb ranged between 0.1–1.0 ng/l. Beryllium, Ce,s, Ge, La, Nd, Pr, Sb, Sm, Y, Zr between 1.0–10 ng/l. Aluminium, As,, Ba, Ca, Cr, Cu, Fe, Li, Mn, Mo, Pb, Pr, Rb, Sr, Te, Ti, V, Zn > 10 ng/l. Ele-ent concentration data measured in moss samples were always
alculated by subtracting blank values.Reference standard material BCR-482 was employed (1 control
ach digestion batch) to check the accuracy and precision of thenalytical procedure. Data quality control was assessed by com-aring the certified and measured values for BCR 482 referenceaterial in terms of recovery (%), and by checking the precision
f ICP analysis by the relative percentage differences (RPD) andhe relative standard deviation (RSD) among the reference materialeplicates. For all the elements measured in the reference material,he recovery ranged between 71% (Cr) and 92% (Al) with only one
Fig. 1. RAPD amplification of the clone 12a; L = ladder 100 bp; lanes 2–5: DNA ampli-fications of 4 different shoots by OPB15 primer; lanes 6–9: DNA amplifications of 4different shoots by OPJ19 primer.
lower value for Cu (64%). The RPD was about 20% for most elements,with the exception of Sn (61%), Ta (53%) and W (49%). The preci-sion of ICP analysis was considered acceptable, with the RSD valueslower than 10%, apart for Te (about 30%).
2.3. Data processing
The element concentrations of all moss samples were evaluatedas the average of three replicates for each sample and reported ona dry weight basis. All data were processed using Microsoft Excel,STATISTICA ver. 7 and the free R software ver. 3.2.2.
The non-parametric Kruskal Wallis test was performed to checksignificant differences in chemical composition between materialsand treatments. The Nemenyi test was used as post hoc, accordingto Zar (2010), who suggests this test for comparison of groups withan equal number of data.
Multivariate exploratory analysis was applied to the elementconcentrations in moss samples. All the data were clustered afterstandardization of the variables.
3. Results and discussion
3.1. Moss clone molecular characterization
Comparisons among different DNA extractions of the Sphagnumclone 12a showed that some RAPD primers (OPB 15 and OPJ 19)provided reproducible multiband patterns (Fig. 1). The RAPD tech-nique is generally considered poorly reliable because the shortnessof the primers allows for the annealing to any DNA template even-tually contaminating the sample. However, this problem is stronglyreduced in axenic plant material; moreover, the used annealingtemperature of 40 ◦C (i.e. 5 ◦C higher than that in the originalamplification protocol proposed by Skotniki et al. (1999), greatly
enhanced the stringency of the reaction and produced very con-stant banding patterns.The amplification of S. palustre DNA from cloned and field mosssamples by ISJ primers provided the fragments reported in Table 1.

A. Di Palma et al. / Ecological Indicators 71 (2016) 388–397 391
Table 1ISJ analysis of the S. palustre clone (lines 2a and 12a) compared to the field sample.Fragment length is given in bp.
Primer 2a 12a FS
ISJ 4 44 44 –76 76 –132 132 132
ISJ 10 70 70 –110 110 –132 132 132166 166 –175 175 –187 187 –
Table 2Primer sequences of the SCAR markers; for each primer pair the annealing temper-ature (Tm) and the expected size (Es) of the amplification product are indicated.
Primer Sequence (5′-3′) Tm Es (bp)
S40 fw TTTTCCACATACACCACCGC 58.8 350S40 rv AGTTAACGTTACCCAGGCGA 59.0
S42 fw ACGTCGGCTCTCAGGTATTC 59.3 400S42 rv CTTCGTTGTGGGGTCTGTTG 59.1
S44 fw GCAGTAATTGATCTTGGCAACC 58.2 250S44 rv TGCACTGCCAAAAGTTTCAG 57.4
T31 fw ACCACCACCACGCATAGAG 59.4 430T31 rv AAATGTGTTGAAGACCCCATGA 58.2
Tg2lrcfiatcrf
a1paKaahssai
(rradipp
t
Fig. 2. Double digestion by Hind III/HinfI of RAPDf DNA region. L = ladder 100 bp; 2aand 12a are two different lines of S. palustre clone; FS = field shoots. Each digestionwas performed on a different DNA extractions.
Table 3Microsatellite analysis of the S. palustre clone (lines 2a and 12a) compared to thefield sample. Fragment length is given in bp and length polymorphism are in bold.
Locus (repeat motif) Sample
2a 12a FS
1 (CA) 244–254 244–254 244–2543 (CA) 169 169 1695 (GT) 192–198 192–198 188–1929 (CT) 159–174 159–174 169–18410 (GA) 233 233 23314 (AG) 228 228 21417 (AAG) 159 159 16219 (AAG) 246–267 246–267 246–26720 (TTC) 264–289 264–289 264–28922 (GAT) 99–102 99–102 99–10228 (AC) 225–237 225–235 225-235
T37 fw CGCATTCACAGGGCTCTAAC 59.0 580T37 rv AGCTTGTAACGAAGGGACCT 58.7
hese primers, already tested in mosses, including those of theenus Sphagnum (Sawicki et al., 2009; Sawicki and Szczecinska,011), clearly distinguished different taxa and at within-species
evel. The primers are designed partly complementary to DNAegion at the junction between intron and exon; as a consequence,hoosing specific primer pairs, introns or exons should be ampli-ed, at least in theory. But such characteristics do not avoid primernnealing in different regions, according to base pair complemen-arities. To counterbalance this drawback, fragment separation wasarried out by capillary electrophoresis in order to enhance theeliability of the procedure and to assign a precise length to eachragment.
In addition to matK, rbcL and trnH-psbA regions (GeneBankccession codes KJ865419, KJ865420, KJ865421 for S. palustre clone2a), five anonymous regions were developed and appropriaterimer pairs were designed and tested in the clone (GeneBankccession codes KP889208, KP889209, KP889210, KP965888,P965889). Primer sequences, with their annealing temperaturend the expected size of each region, are given in Table 2. BLASTnalysis against the GenBank database did not provide positiveits, confirming the anonymous nature of the five regions. Con-idering the highly conserved genome of Sphagnum, these novelequences should provide high resolution as SCAR (Sequence Char-cterized Amplified Region) markers, for detecting polymorphismsn systematic studies.
As for PCR-RFLP, a technique already applied in mossesVanderpoorten et al., 2003), several nuclear and plastid DNAegions (ITS, PsbC-TrnS and TrnF-V1) were tested by a set of 17estriction enzymes before the anonymous regions RAPDa, RAPDbnd RAPDf (Shaw et al., 2003), but no polymorphism was found. Theouble digestion of RAPDf with HinfI - HindIII derived in a character-
stic, reproducible band pattern for the clone (Fig. 2, see arrows). No
olymorphism and/or not reproducible multiband patterns wererovided by the other restriction endonucleases.Microsatellite analysis produced four polymorphisms betweenhe clone and field shoots (Table 3) at the loci 5, 9, 14 and 17; a
29 (AAG) 194–197 194–197 194–19730 (GAT) 139–142 139–142 139–142
polymorphism was also observed between the two clone lines ana-lyzed, at the locus 28.
3.2. Elemental signature of the clone and field samples
The exploratory multivariate analysis of the element concentra-tions in the field (FS) and in the clone (C) S. palustre samples (seeTable 4) revealed two main clusters (a and b) clearly separatingthem (Fig. 3). Both clusters were divided in sub-clusters generallyaccording to the different treatments, even if the between-groupvariance was not significant.
In general, regardless of treatment, most element concentra-
tions were significantly lower (p < 0.05) in the clone than in thefield moss (Table 4). Indeed, in the latter the concentrations of Al,Ba, Cs, Hf, Nb, Pb, Ta, Y and rare earth elements were two orders
392 A. Di Palma et al. / Ecological Indicators 71 (2016) 388–397
Table 4Mean elemental concentrations (mg kg−1 ± SD, n = 3) of S. palustre samples. FS = field moss; C = clone; U = untreated samples; 100 = devitalized samples; EDTA = EDTA-treatedmoss; n. d. = not determined; ≤d. l. = concentrations under detection limit.
FS-U FS-100 C-U C-100 C-EDTA C-EDTA100
Al 1017 ± 10 953 ± 57 4.9 ± 0.3 55.9 ± 0.7 6.4 ± 1.6 1.8 ± 0.3As 0.29 ± 0.02 0.25 ± 0.03 0.021 ± 0.003 0.018 ± 0.002 0.016 ± 0.002 0.015 ± 0.002B 2.8 ± 0.5 12.4 ± 0.3 6.9 ± 0.7 13.3 ± 0.3 1.8 ± 0.2 2.0 ± 0.2Ba 17.8 ± 1.0 17.8 ± 1.4 0.06 ± 0.01 0.199 ± 0.006 0.30 ± 0.08 0.28 ± 0.04Be 0.04 ± 0.003 0.035 ± 0.005 0.00169 ± 0.00001 0.0022 ± 0.0001 n. d. n. d.Cd 0.11 ± 0.01 0.07 ± 0.01 0.007 ± 0.001 0.006 ± 0.001 0.004 ± 0.001 0.003 ± 0.0002Co 0.32 ± 0.03 0.30 ± 0.04 0.31 ± 0.02 0.30 ± 0.02 0.010 ± 0.001 0.0096 ± 0.0004Cr 1.3 ± 0.1 1.3 ± 0.3 0.04 ± 0.01 0.22 ± 0.01 0.0383 ± 0.0004 0.07 ± 0.07Cs 0.23 ± 0.02 0.20 ± 0.04 0.00039 ± 0.00004 0.0026 ± 0.0001 0.003 ± 0.001 0.0016 ± 0.0001Cu 3.1 ± 0.2 3.0 ± 0.5 0.79 ± 0.08 0.79 ± 0.03 0.83 ± 0.08 0.82 ± 0.05Fe 442 ± 1 391 ± 27 109 ± 18 111 ± 7 79.8 ± 2.6 93.4 ± 0.7Ga 0.21 ± 0.01 0.19 ± 0.03 0.010 ± 0.001 0.01 ± 0.00 0.007 ± 0.004 0.0032 ± 0.0001Ge 0.024 ± 0.002 0.035 ± 0.005 0.0007 ± 0.0002 0.00056 ± 0.00004 0.0007 ± 0.0003 0.0009 ± 0.0002Hf 0.046 ± 0.003 0.04 ± 0.01 0.0010 ± 0.0002 0.0008 ± 0.0001 0.0005 ± 0.0002 0.00029 ± 0.00003Li 0.51 ± 0.04 0.43 ± 0.08 0.010 ± 0.001 0.032 ± 0.001 0.03 ± 0.02 0.0232 ± 0.0002Mn 60.3 ± 3.6 48.4 ± 5.9 109 ± 6 103 ± 5 6.5 ± 0.4 6.2 ± 0.2Mo 0.11 ± 0.01 0.09 ± 0.02 3.1 ± 0.6 2.95 ± 0.12 3.0 ± 0.4 2.8 ± 0.2Na 693 ± 1 656 ± 37 13.6 ± 1.0 20.2 ± 0.6 1867 ± 11 1845 ± 46Nb 0.23 ± 0.03 0.19 ± 0.05 0.0008 ± 0.0001 0.0006 ± 0.0001 0.0005 ± 0.0003 0.0003 ± 0.0001Ni 1.1 ± 0.1 1.0 ± 0.2 0.11 ± 0.03 0.16 ± 0.06 0.06 ± 0.03 0.55 ± 0.33Pb 2.0 ± 0.2 1.9 ± 0.4 0.016 ± 0.002 0.05 ± 0.02 0.02 ± 0.01 0.006 ± 0.001Rb 6.9 ± 0.5 5.2 ± 0.9 0.39 ± 0.03 0.38 ± 0.01 0.37 ± 0.02 0.36 ± 0.02Sb 0.16 ± 0.02 0.18 ± 0.02 0.006 ± 0.002 0.017 ± 0.003 0.004 ± 0.001 0.06 ± 0.03Sn 1.1 ± 0.2 0.58 ± 0.12 0.020 ± 0.003 0.013 ± 0.001 0.16 ± 0.01 0.17 ± 0.02Sr 24.5 ± 1.1 21.9 ± 3.5 1.7 ± 0.1 2.6 ± 0.1 1.55 ± 0.05 1.6 ± 0.1Ta 0.014 ± 0.002 0.011 ± 0.003 0.00013 ± 0.00002 0.00009 ± 0.00003 0.00009 ± 0.00004 0.00008 ± 0.00002Te ≤d. l. ≤d. l. n. d. ≤d. l. n. d. n. d.Ti 22.7 ± 1.8 18.6 ± 3.6 0.89 ± 0.11 0.81 ± 0.01 0.76 ± 0.06 0.68 ± 0.05Tl 0.025 ± 0.003 0.019 ± 0.004 0.013 ± 0.001 0.013 ± 0.004 0.010 ± 0.001 0.0113 ± 0.0003V 1.8 ± 0.1 1.5 ± 0.3 0.046 ± 0.004 0.061 ± 0.002 0.05 ± 0.02 0.040 ± 0.002W 0.030 ± 0.003 0.02 ± 0.01 0.006 ± 0.002 0.0047 ± 0.0005 0.004 ± 0.001 0.0037 ± 0.0004Zn 24.2 ± 1.2 20.6 ± 3.5 51.7 ± 3.1 51.0 ± 1.5 8.5 ± 0.3 9.2 ± 0.4Zr 1.6 ± 0.1 1.3 ± 0.2 0.05 ± 0.01 0.043 ± 0.003 0.03 ± 0.01 0.019 ± 0.003
macronutrientsCa 9121 ± 84 7140 ± 403 6950 ± 130 6719 ± 86 2446 ± 46 2245 ± 32K 2692 ± 42 2262 ± 160 12647 ± 159 12228 ± 267 9465 ± 78 9135 ± 289Mg 2069 ± 26 1443 ± 68 1095 ± 0.5 1.018 ± 40 887.5 ± 1.8 879 ± 12P 258.4 ± 10.5 292.3 ± 9.4 2175 ± 63 1931 ± 26 1716 ± 9 1543 ± 11
Actinoids and Rare EarthsCe 1.2 ± 0.1 1.0 ± 0.2 0.002 ± 0.001 0.0075 ± 0.0003 0.0012 ± 0.0001 0.0026 ± 0.0004Dy 0.07 ± 0.01 0.06 ± 0.01 0.00015 ± 0.00002 0.00055 ± 0.00007 0.00015 ± 0.00002 n. d.Er 0.034 ± 0.004 0.030 ± 0.005 0.00010 ± 0.00003 0.0002 ± 0.0001 0.00009 ± 0.00001 0.0001 ± 0.0001Eu 0.022 ± 0.002 0.018 ± 0.003 0.00005 ± 0.00003 0.00019 ± 0.00002 0.000059 ± 0.000004 0.0001 ± 0.0001Gd 0.09 ± 0.01 0.08 ± 0.02 n. d. 0.0008 ± 0.0002 0.00022 ± 0.00002 n. d.Ho 0.012 ± 0.001 0.011 ± 0.002 ≤d. l. 0.00008 ± 0.00003 ≤d. l. ≤d. l.La 0.64 ± 0.06 0.55 ± 0.10 0.002 ± 0.001 0.005 ± 0.001 0.0010 ± 0.0002 0.001 ± 0.001Lu 0.0044 ± 0.0004 0.004 ± 0.001 ≤d. l. 0.00006 ± 0.00002 ≤d. l. n. d.Nd 0.52 ± 0.05 0.67 ± 0.15 0.0016 ± 0.0002 0.0033 ± 0.0002 0.0006 ± 0.0001 0.001 ± 0.001Pr 0.15 ± 0.01 0.12 ± 0.02 0.0004 ± 0.0001 0.0009 ± 0.0001 0.00018 ± 0.00004 0.0002 ± 0.0001Sm 0.10 ± 0.01 0.09 ± 0.01 0.0004 ± 0.0001 0.0008 ± 0.0001 0.001 ± 0.001 0.0002 ± 0.0002Tb 0.012 ± 0.001 0.011 ± 0.002 0.00004 ± 0.00001 0.00010 ± 0.00002 ≤d. l. ≤d. l.Th 0.12 ± 0.03 0.122 ± 0.029 0.009 ± 0.004 0.013 ± 0.005 0.006 ± 0.002 0.009 ± 0.006Tm 0.0047 ± 0.0003 0.004 ± 0.001 n. d. 0.00005 ± 0.00002 0.00005 ± 0.00001 n. d.
otMmEimvt2rbf
U 0.05 ± 0.01 0.04 ± 0.01 0.003 ± 0.001
Y 0.33 ± 0.02 0.29 ± 0.05 0.0009 ± 0.0002
Yb 0.030 ± 0.002 0.027 ± 0.005 0.0002 ± 0.0001
f magnitude higher and more than 10 times higher for almost allhe other elements. The clone had significantly higher (p < 0.05) K,
o, P concentrations, likely due to their occurrence in the cultureedium, and higher Na concentrations in EDTA treated samples (C-
DTA and C-EDTA100; Table 4). The high content of these elementsn the clone tissues could interfere with the ability of the clone to
onitor their occurrence in the environment, especially at low orery low pollution levels. Nevertheless, element concentration inhe culture medium was established after several trials (Beike et al.,
015) and only further experiments might test the possibility toeduce them in the growing culture. Likely, an additional rinsingy distilled water might help to wash out the elements derivingrom culture medium.0.0030 ± 0.0001 0.003 ± 0.001 0.0032 ± 0.00040.0025 ± 0.0001 0.0006 ± 0.0001 0.0006 ± 0.00020.0003 ± 0.0001 n. d. 0.00016 ± 0.00002
The high concentrations of some typical soil elements (i.e., Al, Fe,Ti, Ca and Mg) in the field samples would suggest the contribution ofsoil dust to the moss chemical composition (Bargagli, 1998; Adamoet al., 2008b).
Devitalization is a very useful option for biomonitoring withmoss transplants because bryophytes maintain a remarkable metaluptake capability and the lack of metabolic activity during theexposure reduces the variability of the results (Adamo et al., 2007;Giordano et al., 2009; Fernández et al., 2010; Capozzi et al., 2016).
The oven devitalization, as well as the EDTA treatment, did not pro-duce any substantial changes in the elemental composition of themoss samples; no statistically significant difference was observedbetween FS-U and FS-100, and between C-U and C-100 or in the
A. Di Palma et al. / Ecological Indi
FS-
100
FS-
100
FS-
100
FS-
U
FS-
U
FS-
U
C-U
C-U
C-U
C-1
00
C-1
00
C-1
00
C-E
DT
A
C-E
DT
A10
0
C-E
DT
A10
0
C-E
DT
A10
0
C-E
DT
A
C-E
DT
A
-0.9
-0.7
-0.5
-0.3
-0.1
0.1
0.3
0.5
0.7
0.9
Sim
ilari
tyComplete Linkage
1-Pearson r
a b
Fn
SwccFeoOpvoc
tielnafAcpm
ig. 3. Cluster Analysis of the element concentration data related to FS and C Sphag-um samples. For the labels see paragraph 2.2.1.
. palustre clone with and without EDTA treatment. The treatmentith EDTA, a well-known chelating agent, useful to decrease metal
oncentrations in field mosses and to increase their cation exchangeapability before the exposure (e.g. Lodenius and Tulisalo, 1984;erreira et al., 2009; Chen et al., 2015; Iodice et al., 2016), had novident effect on the clone elemental composition, likely in virtuef the already very low element concentrations in the biomaterial.n the other hand, the EDTA washing added Na and induced mor-hological damages to the moss clone, making its shoots and leavesery fragile (see SEM micrographs in Fig. 4). On the base of thesebservations, we suggest to omit this treatment in the set-up oflone bags.
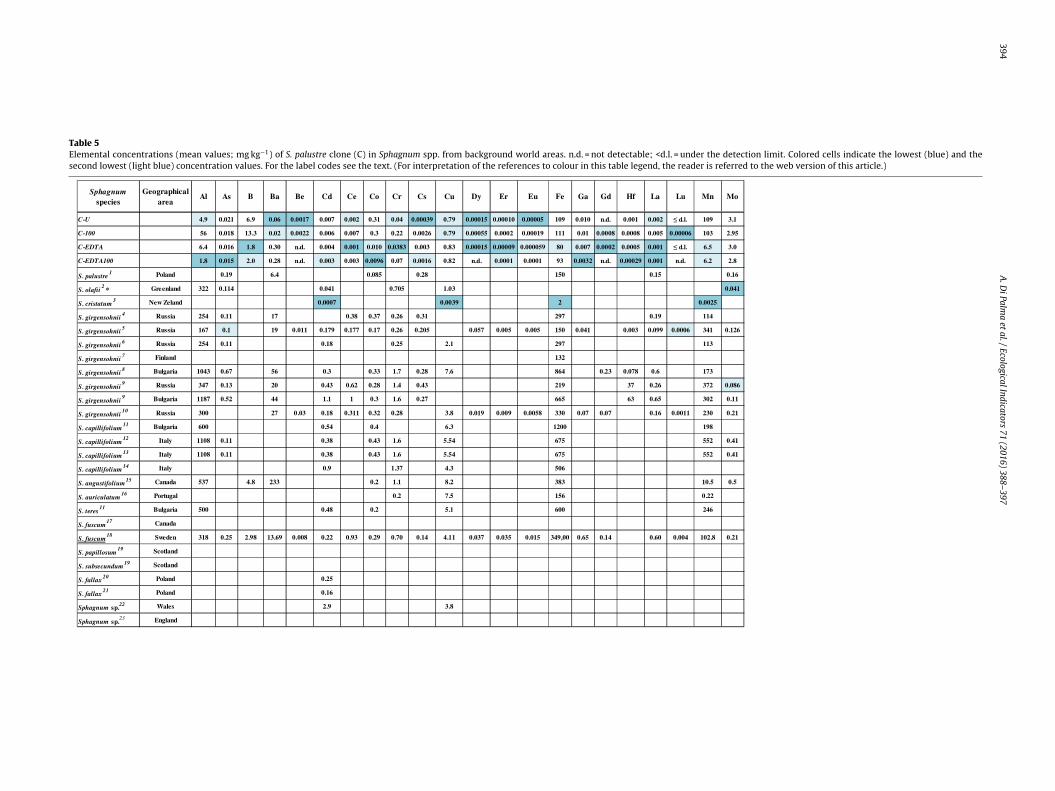
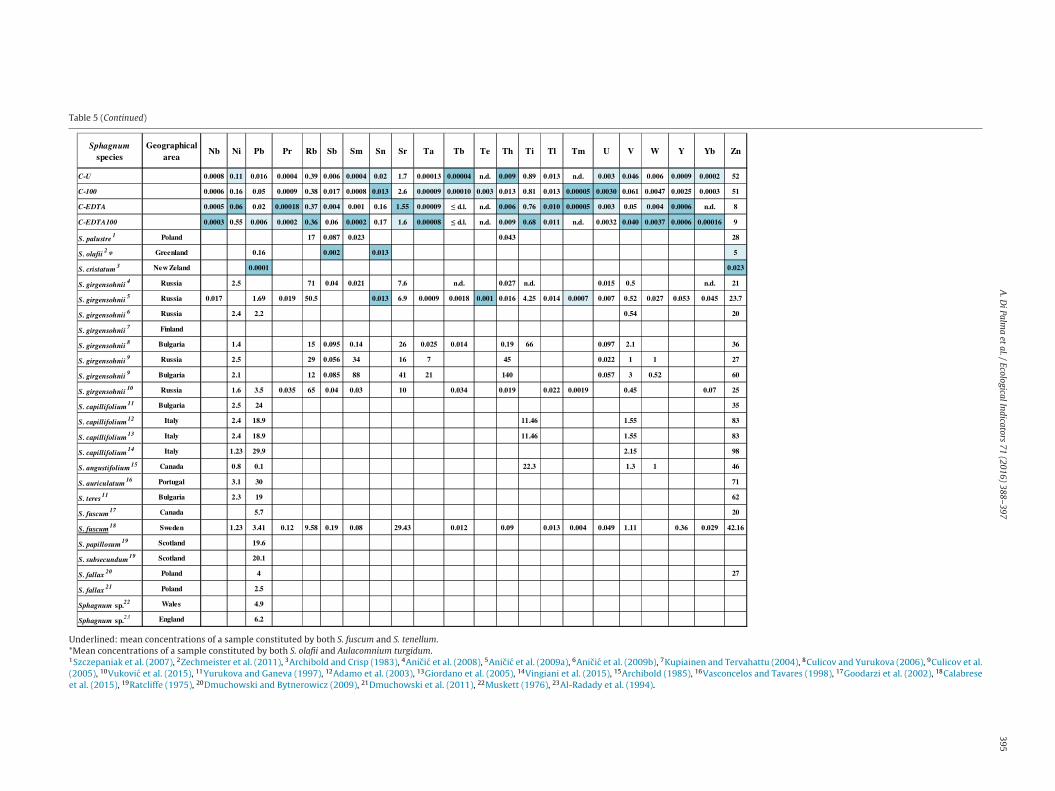
The comparison of the clone elemental composition with litera-ure data for other Sphagnum species is made difficult by differencesn sample preparation and chemical digestion procedures. Nev-rtheless, the treated and untreated clone samples had the sameevels or even lower element concentrations than other Sphag-um species collected for biomonitoring purposes from referencereas of the world (Table 5). The only exceptions were S. cristatumrom New Zealand (washed with conc. HNO3 before the exposure;
rchibold and Crisp, 1983), S. olafii from Greenland (moss specieshosen to provide a baseline element content useful for estimatingollution levels in Europe, according to the UNECE ICP Vegetationonitoring programme; Zechmeister et al., 2011) and S. girgensoniiFig. 4. Scanning electron micrographs of S. palustre
cators 71 (2016) 388–397 393
from Russia (Anicic et al., 2009a,b). The acid washing as moss devi-talizing treatment was criticized by recent studies (e.g. Adamo et al.,2007; Tretiach et al., 2007) recommending rather the use of othermethods making treated moss shoots less fragile and consequentlyreducing the loss of material during the exposure.
The moss clone grown in bioreactors with fixed temperature,pH, light and composition of the culture medium (Beike et al., 2015)had a much more homogenous chemical composition than the fieldmoss, exposed to changes in climatic conditions, element bioavail-ability, metabolic activity and growth rate (Bates, 2000; Stepanovaet al., 2015).
4. Conclusions
Molecular analyses based on unilocus and multilocus DNAmarkers characterized a S. palustre clone developed within theMossclone Consortium, with the intent to tag the clone. This stepalso provided new DNA markers that can be applied in system-atic analyses of Sphagnum, and gave new insights to implementwell known techniques for molecular analyses of mosses. Compar-isons among the elemental concentration of S. palustre naturallygrowing in background areas and that of differently treated clonesshowed that the latter have much lower and homogenous ele-ment concentrations, providing an excellent biomaterial for themonitoring of persistent air pollutants by moss-bags. The concen-trations of 54 elements were determined and only those of K, Moand P were higher in the clone; these elements derive from the cul-ture medium and their content can probably be reduced throughpre-exposure additional water rinsing. Due to very low elementconcentrations, near or under detection limits for rare earths, thisbiomaterial seems particularly suitable to monitor atmosphericdepositions also in low polluted environments and for short expo-sure periods. Although these properties are independent of theclone pre-treatments, we recommend the devitalization as a keypre-treatment step because it ensures a standardized biomaterial“ready to use”. By virtue of its peculiar physicochemical prop-erties (specific surface area, cationic exchange capacity, bindingsites) henancing metal uptake capacity (González and Pokrovsky,2014; González et al., 2016), this biomaterial proved an excellentbiomonitor compared to field grown Pseudoscleropodium purum in
a test with moss bags (unpublished results). Therefore, we encour-age the use of this biomaterial, with low and stable elementalsignature, in air pollution biomonitoring, in the view of a com-pletely standardized moss-bag protocol.clone before (a) and after EDTA treatment (b).
394
A.
Di
Palma
et al.
/ Ecological
Indicators 71
(2016) 388–397
Table 5Elemental concentrations (mean values; mg kg−1) of S. palustre clone (C) in Sphagnum spp. from background world areas. n.d. = not detectable; <d.l. = under the detection limit. Colored cells indicate the lowest (blue) and thesecond lowest (light blue) concentration values. For the label codes see the text. (For interpretation of the references to colour in this table legend, the reader is referred to the web version of this article.)
Sphagnu m species
Geographical area
Al As B Ba Be Cd Ce Co Cr Cs Cu Dy Er Eu Fe Ga Gd Hf La Lu Mn Mo
C-U 4.9 0.021 6.9 0.06 0.001 7 0.00 7 0.00 2 0.31 0.04 0.0003 9 0.79 0.0001 5 0.00 010 0.0000 5 109 0.010 n.d. 0.001 0.002 ≤ d.l. 109 3.1
C-100 56 0.018 13.3 0.02 0.002 2 0.00 6 0.00 7 0.3 0.22 0.002 6 0.79 0.0005 5 0.00 02 0.0001 9 111 0.01 0.0008 0.0008 0.005 0.000 06 103 2.95
C-EDTA 6.4 0.016 1.8 0.30 n.d. 0.00 4 0.00 1 0.01 0 0.038 3 0.00 3 0.83 0.0001 5 0.00 009 0.0000 59 80 0.007 0.0002 0.0005 0.001 ≤ d.l. 6.5 3.0
C-EDTA10 0 1.8 0.015 2.0 0.28 n.d. 0.00 3 0.00 3 0.009 6 0.07 0.001 6 0.82 n.d. 0.00 01 0.0001 93 0.0032 n.d. 0.0002 9 0.001 n.d. 6.2 2.8
S. pa lustre1 Poland 0.19 6.4 0.08 5 0.28 150 0.15 0.16
S. olafii2* Greenland 322 0.114 0.04 1 0.70 5 1.03 0.041
S. cristatum3 New Zeland 0.000 7 0.0039 2 0.0025
S. girgensohnii4 Russia 254 0.11 17 0.38 0.37 0.26 0.31 297 0.19 114
S. girgensohnii 5 Russia 167 0.1 19 0.01 1 0.17 9 0.17 7 0.17 0.26 0.20 5 0.05 7 0.005 0.005 150 0.041 0.003 0.099 0.0006 341 0.126
S. girgensohnii 6 Russia 254 0.11 0.18 0.25 2.1 297 113
S. girgensohnii 7 Finland 132
S. girgensohnii 8 Bulga ria 1043 0.67 56 0.3 0.33 1.7 0.28 7.6 864 0.23 0.078 0.6 173
S. girgensohnii9 Russia 347 0.13 20 0.43 0.62 0.28 1.4 0.43 219 37 0.26 372 0.086
S. girgensohnii9 Bulga ria 1187 0.52 44 1.1 1 0.3 1.6 0.27 665 63 0.65 302 0.11
S. girgensohnii10 Russia 300 27 0.03 0.18 0.31 1 0.32 0.28 3.8 0.01 9 0.009 0.0058 330 0.07 0.07 0.16 0.0011 230 0.21
S. capilli foli um11 Bulga ria 600 0.54 0.4 6.3 1200 198
S. capilli foli um12 Italy 1108 0.11 0.38 0.43 1.6 5.54 675 552 0.41
S. capilli foli um 13 Italy 1108 0.11 0.38 0.43 1.6 5.54 675 552 0.41
S. capilli foli um 14 Italy 0.9 1.37 4.3 506
S. angustifoli um 15 Canada 537 4.8 23 3 0.2 1.1 8.2 383 10.5 0.5
S. auriculatum16 Portuga l 0.2 7.5 156 0.22
S. teres11 Bulga ria 500 0.48 0.2 5.1 600 246
S. fuscum17 Canada
S. fuscum18 Sweden 318 0.25 2.98 13 .69 0.00 8 0.22 0.93 0.29 0.70 0.14 4.11 0.03 7 0.035 0.015 349,00 0.65 0.14 0.60 0.004 102.8 0.21
S. pa pill osum19 Scotland
S. subsecun dum 19 Scotland
S. fall ax 20 Poland 0.25
S. fall ax 21 Poland 0.16
Sphagnu m sp.22 Wales 2.9 3.8
Sphagnu m sp.23 England
A.
Di
Palma
et al.
/ Ecological
Indicators 71
(2016) 388–397
395
Table 5 (Continued)
Sphagnum species
Geographical area
Nb Ni Pb Pr Rb Sb Sm Sn Sr Ta Tb Te Th Ti Tl Tm U V W Y Yb Zn
C-U 0.0008 0.11 0.01 6 0.0004 0.39 0.006 0.0004 0.02 1.7 0.00 013 0.00004 n.d. 0.00 9 0.89 0.013 n.d. 0.003 0.046 0.00 6 0.0009 0.0002 52
C-100 0.0006 0.16 0.05 0.0009 0.38 0.017 0.0008 0.013 2.6 0.00 009 0.00010 0.003 0.01 3 0.81 0.013 0.00005 0.003 0 0.061 0.0047 0.0025 0.0003 51
C-EDTA 0.0005 0.06 0.02 0.00018 0.37 0.004 0.001 0.16 1.55 0.00 009 ≤ d.l. n.d. 0.00 6 0.76 0.010 0.00005 0.003 0.05 0.00 4 0.0006 n.d. 8
C-EDTA100 0.0003 0.55 0.00 6 0.0002 0.36 0.06 0.0002 0.17 1.6 0.00 008 ≤ d.l. n.d. 0.00 9 0.68 0.011 n.d. 0.003 2 0.040 0.0037 0.0006 0.000 16 9
S. palustre 1 Poland 17 0.087 0.023 0.04 3 28
S. olafii 2 * Greenland 0.16 0.002 0.013 5
S. cristatum 3 New Zeland 0.0001 0.023
S. girgensohnii 4 Russia 2.5 71 0.04 0.021 7.6 n.d. 0.02 7 n.d. 0.015 0.5 n.d. 21
S. girgensohnii 5 Russia 0.01 7 1.69 0.01 9 50.5 0.013 6.9 0.0009 0.0018 0.001 0.01 6 4.25 0.014 0.0007 0.007 0.52 0.02 7 0.05 3 0.04 5 23.7
S. girgensohnii 6 Russia 2.4 2.2 0.54 20
S. girgensohnii 7 Finland
S. girgensohnii 8 Bulgaria 1.4 15 0.095 0.14 26 0.025 0.014 0.19 66 0.097 2.1 36
S. girgensohnii 9 Russia 2.5 29 0.056 34 16 7 45 0.022 1 1 27
S. girgensohnii 9 Bulgaria 2.1 12 0.085 88 41 21 140 0.057 3 0.52 60
S. girgensohnii 10 Russia 1.6 3.5 0.03 5 65 0.04 0.03 10 0.034 0.01 9 0.022 0.0019 0.45 0.07 25
S. capilli foli um 11 Bulgaria 2.5 24 35
S. capilli foli um 12 Italy 2.4 18.9 11.46 1.55 83
S. capilli foli um 13 Italy 2.4 18.9 11.46 1.55 83
S. capilli foli um 14 Italy 1.23 29.9 2.15 98
S. angusti folium 15 Canada 0.8 0.1 22 .3 1.3 1 46
S. auriculatum 16 Portuga l 3.1 30 71
S. teres 11 Bulgaria 2.3 19 62
S. fuscum 17 Canada 5.7 20
S. fuscum 18 Sweden 1.23 3.41 0.12 9.58 0.19 0.08 29.43 0.012 0.09 0.013 0.004 0.049 1.11 0.36 0.02 9 42.16
S. papillosum 19 Scotland 19.6
S. subsecundum 19 Scotland 20.1
S. fall ax 20 Poland 4 27
S. fall ax 21 Poland 2.5
Sphagnum sp.22 Wales 4.9
Sphagnum sp.23 England 6.2
Underlined: mean concentrations of a sample constituted by both S. fuscum and S. tenellum.*Mean concentrations of a sample constituted by both S. olafii and Aulacomnium turgidum.1Szczepaniak et al. (2007), 2Zechmeister et al. (2011), 3Archibold and Crisp (1983), 4Anicic et al. (2008), 5Anicic et al. (2009a), 6Anicic et al. (2009b), 7Kupiainen and Tervahattu (2004), 8Culicov and Yurukova (2006), 9Culicov et al.(2005), 10Vukovic et al. (2015), 11Yurukova and Ganeva (1997), 12Adamo et al. (2003), 13Giordano et al. (2005), 14Vingiani et al. (2015), 15Archibold (1985), 16Vasconcelos and Tavares (1998), 17Goodarzi et al. (2002), 18Calabreseet al. (2015), 19Ratcliffe (1975), 20Dmuchowski and Bytnerowicz (2009), 21Dmuchowski et al. (2011), 22Muskett (1976), 23Al-Radady et al. (1994).

3 al Ind
A
Ptmc
R
A
A
A
A
A
A
A
A
A
A
A
A
B
B
B
C
C
C
C
C
C
C
96 A. Di Palma et al. / Ecologic
cknowledgements
This work was funded by FP7-ENV.2011.3.1.9-1 (MOSSCLONE).artial support from BIO-GEO-CLIM grant RF No. 14.B25.31.0001o O.P. is also acknowledged. We would dedicate this paper to the
emory of Stefano Terracciano, who contributed to the molecularharacterization of the S. palustre clone.
eferences
damo, P., Giordano, S., Vingiani, S., Castaldo Cobianchi, R., Violante, P., 2003. Traceelement accumulation by moss and lichen exposed in bags in the city of Naples(Italy). Environ. Pollut. 122, 91–103.
damo, P., Giordano, S., Minganti, V., Modenesi, P., Monaci, F., Pittao, E., Tretiach,M., Bargagli, R., 2007. Lichen and moss bags as monitoring device in urbanareas. Part II: Trace element content in living and dead biomonitors andcomparison with synthetic materials. Environ. Pollut. 146, 392–399.
damo, P., Bargagli, R., Giordano, S., Modenesi, P., Monaci, F., Pittao, E., Spagnuolo,V., Tretiach, M., 2008a. Natural and pretreatments induced variability in thechemical composition and morphology of lichens and mosses selected foractive monitoring of airborne elements. Environ. Pollut. 152, 11–19.
damo, P., Giordano, S., Naimo, D., Bargagli, R., 2008b. Geochemical properties ofairborne particulate matter (PM10) collected by automatic device andbiomonitors in a Mediterranean urban environment. Atm. Environ. 42,346–357.
l-Radady, A.S., Davies, B.E., French, M.J., 1994. Distribution of lead inside thehome: cases studies in the north of England. Sci. Total Environ. 145, 143–156.
nicic, M., Tasic, M., Frontasyeva, M.V., Tomasevic, M., Rajsic, S., Strelkova, L.P.,Popovic, A., Steinnes, E., 2008. Active biomonitoring with wet and dry moss: acase study in an urban area. Environ. Chem. Lett. 7, 55–60.
nicic, M., Tomasevic, M., Tasic, M., Rajsic, S., Popovic, A., Frontasyeva, M.V.,Lierhagen, S., Steinnes, E., 2009a. Monitoring of trace element atmosphericdeposition using dry and wet moss bags: accumulation capacity versusexposure time. J. Hazard. Mater. 171, 182–188.
nicic, M., Tasic, M., Frontasyeva, M.V., Tomasevic, M., Rajsic, S., Mijic, Z., Popovic,A., 2009b. Active moss biomonitoring of trace elements with Sphagnumgirgensohnii moss bags in relation to atmospheric bulk deposition in Belgrade,Serbia. Environ. Pollut. 157, 673–679.
rchibold, O.W., Crisp, P.T., 1983. The distribution of airborne metals in theIllawarra region of New South Wales, Australia. Appl. Geogr. 3, 331–344.
rchibold, O.W., 1985. The metal content of wind-blown dust from uraniumtailings in northern Saskatchewan. Water Air Soil Pollut. 24, 63–76.
res, A., Aboal, J.R., Carballeira, A., Giordano, S., Adamo, P., Fernández, J.A., 2012.Moss bag biomonitoring: a methodological review. Sci. Total Environ. 432,143–158.
res, A., Fernández, J.A., Carballeira, A., Aboal, J.R., 2014. Towards themethodological optimization of the moss bag technique in terms ofcontaminants concentrations and replicability value. Atmos. Environ. 94,496–507.
argagli, 1998. Trace elements in terrestrial plants. In: An EcophysiologicalApproach to Biomonitoring and Biorecovery. Springer-Verlag, Berlin, pp. 324.
ates, J.W., 2000. Mineral nutrition, substratum ecology, and pollution. In: Shaw,J.A., Goffinet, B. (Eds.), Bryophyte Biology. Cambridge University Press,Cambridge, pp. 248–311.
eike, A.K., Spagnuolo, V., Lüth, V., Steinhart, F., Ramos-Gomez, J., Krebs, M.,Adamo, P., Rey-Asensio, A.I., Fernàndez, J.A., Giordano, S., Decker, E.L., Reski, R.,2015. Clonal in vitro propagation of peat mosses (Sphagnum L.) as novel greenresources for basic and applied research. Plant Cell Tissue Organ Cult. 120 (3),1037–1049.
alabrese, S., D’Alessandro, W., Bellomo, S., Brusca, L., Martin, R.S., Saiano, F.,Parello, F., 2015. Characterization of the Etna volcanic emissions through anactive biomonitoring technique (moss-bags): part 1—major and trace elementcomposition. Chemosphere 119, 1447–1455.
apozzi, F., Giordano, S., Aboal, J.R., Adamo, P., Bargagli, R., Boquete, T., Di Palma, A.,Real, C., Reski, R., Spagnuolo, V., Steinbauer, K., Tretiach, M., Varela, Z.,Zechmeister, H., Fernandez, J.A., 2016. Best options for the exposure oftraditional and innovative moss bags: a systematic evaluation in threeEuropean countries. Environ. Pollut. 214, 362–373.
hen, Y.E., Cui, J.M., Yang, J.C., Zhang, Z.W., Yuan, M., Song, C., Yang, H., Liu, H.M.,Wang, C.Q., Zhang, H.Y., Zeng, X.Y., Yuan, S., 2015. Biomonitoring heavy metalcontaminations by moss visible parameters. J. Hazard. Mater. 296, 201–209.
outo, J.A., Fernández, J.A., Aboal, J.R., Carballeira, A., 2004. Active biomonitoring ofelement uptake with terrestrial mosses: a comparison of bulk and drydeposition. Sci. Total Environ. 324, 211–222.
respo Pardo, D., Terracciano, S., Giordano, S., Spagnuolo, V., 2014. Molecularmarkers based on PCR methods: a guideline for mosses. Cryptogam. Bryol. 35(3), 229–246.
ulicov, O.A., Yurukova, L., 2006. Comparison of element accumulation of differentmoss and lichen bags exposed in the city of Sofia (Bulgaria). J. Atmos. Chem. 55,1–12.
ulicov, O.A., Mocanu, R., Frontasyeva, M.V., Yurukova, L., Steinnes, E., 2005. Activemoss biomonitoring applied to an industrial site in Romania: relative
icators 71 (2016) 388–397
accumulation of 36 elements in moss-bags. Environ. Monit. Assess. 108,229–240.
Dmuchowski, W., Bytnerowicz, A., 2009. Long-term (1992–2004) record of lead.cadmium. and zinc air contamination in Warsaw, Poland: determination bychemical analysis of moss bags and leaves of Crimean linden. Environ. Pollut.157, 3413–3421.
Dmuchowski, W., Gozdowski, D., Baczewska, A.H., 2011. Comparison of fourbioindication methods for assessing the degree of environmental lead andcadmium pollution. J. Hazard. Mater. 197, 109–118.
Fernández, J.A., Ares, A., Rey-Asensio, A., Carballeira, A., Aboal, J.R., 2010. Effect ofgrowth on active biomonitoring with terrestrial mosses. J. Atmos. Chem. 63,1–11.
Ferreira, D., Ciffroy, P., Tusseau-Vuillemin, M.H., Garnier, C., Garnier, J.M., 2009.Modelling exchange kinetics of copper at the water-aquatic moss (Fontinalisantipyretica) interface: influence of water cationic composition (Ca, Mg, Naand pH). Chemosphere 74 (8), 1117–1124.
Giordano, S., Adamo, P., Sorbo, S., Vingiani, S., 2005. Atmospheric trace metalpollution in the Naples urban area based on results from moss and lichen bags.Environ. Pollut. 136, 431–442.
Giordano, S., Adamo, P., Monaci, F., Pittao, E., Tretiach, M., Bargagli, R., 2009. Bagswith oven-dried moss for the active monitoring of airborne trace elements inurban areas. Environ. Pollut. 157, 2798–2805.
González, A.G., Pokrovsky, O.S., 2014. Metal adsorption on mosses: toward auniversal adsorption model. J. Colloid Interface Sci. 415, 169–178.
González, A.G., Pokrovsky, O.S., Beike, K.A., Reski, R., Di Palma, A., Adamo, P.,Giordano, S., Fernàndez, J.A., 2016. Metal and proton adsorption capacities ofnatural and cloned Sphagnum mosses. J. Colloid Interface Sci. 461, 326–334.
Goodarzi, F., Sanei, H., Labonté, M., Duncan, W.F., 2002. Sources of lead and zincassociated with metal smelting activities in the Trail area British Columbia,Canada. J. Environ. Monit. 4, 400–407.
Harmens, H., Mills, G., Hayes, F., Norris, D.A., Sharps, K., 2015. Twenty eight years ofICP Vegetation: an overview of its activities. Annal. Bot. 5, 31–43.
Iodice, P., Adamo, P., Capozzi, F., Di Palma, A., Senatore, A., Spagnuolo, V., Giordano,S., 2016. Air pollution monitoring using emission inventories combined withthe moss bag approach. Sci. Total Environ. 541, 1410–1419.
Kupiainen, K., Tervahattu, H., 2004. The effect of traction sanding on urbansuspended particles in Finland. Environ. Monit. Assess. 93, 287–300.
Liu, Y., Yan, H.F., Cao, T., Ge, X.J., 2010. Evaluation of 10 plant barcodes in bryophyta(Mosses). J. Syst. Evol. 48, 36–46.
Lodenius, M., Tulisalo, E., 1984. Environmental mercury contamination around achlor-alkali plant. Bull. Environ. Contam. Toxicol. 32, 439–444.
Muskett, C.J., 1976. A survey of airborne heavy metals in a city environment usingbiological indicators. Environ. Health, 267–269.
Ratcliffe, J.M., 1975. An evaluation of the use of biological indicators in anatmospheric lead survey. Atmos. Environ. 9, 623–629.
Sawicki, J., Szczecinska, M., 2007. Semi-specific intron-exon splice junctionmarkers in bryophyte studies. Biodiv. Res. Conserv. 5 (8), 25–30.
Sawicki, J., Szczecinska, M., 2011. A comparison of PCR-based markers for themolecular identification of Sphagnum species of the section Acutifolia. ActaSoc. Bot. Pol. 80 (3), 185–192.
Sawicki, J., Plásek, V., Szczecinska, M., 2009. Molecular evidence does not supportthe current division of Orthotrichum subgenus Gymnoporus. Plant Syst. Evol.279 (1–4), 125–137.
Shaw, A.J., Cox, C.J., Boles, S.B., 2003. Polarity of peat moss (Sphagnum) evolution:who says Bryophytes have no roots? Am. J. Bot. 90 (12), 1777–1787.
Shaw, A.J., Cao, T., Wang, L.-S., Flatberg, K.I., Flatberg, B., Shaw, B., Zhou, P., Boles,S.B., Terracciano, S., 2008. Genetic variation in three Chinese peat mosses(Sphagnum) based on microsatellite markers, with primer information andanalysis of ascertainment bias. Bryologist 111 (2), 271–281.
Skotniki, M.L., Ninham, J.A., Selkirk, P.M., 1999. Genetic diversity and dispersal ofthe moss Sarconeurum glaciale on Ross Island, East Antarctica. Mol. Ecol. 8,753–762.
Spagnuolo, V., Giordano, S., Pérez-Llamazares, A., Area, A., Carballeira, A.,Fernández, J.A., Aboal, J.R., 2013. Distinguishing metal bioconcentration fromPM in moss tissue: testing methods of removing particles attached to the mosssurface. Sci. Total Environ 463–464, 727–733.
Stepanova, V.M., Pokrovsky, O.S., Viers, J., Mironycheva-Tokareva, N.P., Kosykh,N.P., Vishnyakova, E.K., 2015. Major and trace elements in peat profiles inWestern Siberia: impact of the landscape context, latitude and permafrostcoverage. Appl. Geochem. 53, 53–70.
Szczepaniak, K., Astel, A., Simeonov, V., Tsakovski, S., Biziuk, M., Bode, P., Przyjazny,a., 2007. Comparison of dry and living Sphagnum palustre moss samples indetermining their biocumulative capability as biomonitoring tools. J. Environ.Sci. Health Part A 42 (8), 1101–1115.
Terracciano, S., Giordano, S., Bonini, I., Miserere, L., Spagnuolo, V., 2012. Geneticvariation and structure in endangered populations of Sphagnum palustre L. inItaly: a molecular approach to evaluate threats and survival ability. Botany 90,966–975.
Tretiach, M., Adamo, P., Bargagli, R., Baruffo, L., Carletti, L., Crisafulli, P., Giordano,S., Modenesi, P., Orlando, S., Pittao, E., 2007. Lichen and mossbags asmonitoring devices in urban areas. Part I: influence of exposure on sample
vitality. Environ. Pollut. 146, 380–391.Tretiach, M., Pittao, E., Crisafulli, P., Adamo, P., 2011. Influence of exposure sites ontrace element enrichment in moss-bags and characterization of particlesdeposited on the biomonitor surface. Sci. Total Environ. 409, 822–830.

al Indi
V
V
V
V
V
V
Y
ZZ
?uri&9552;CELEX:32008L0050CCEP-COM/2013/0918:
A. Di Palma et al. / Ecologic
anderpoorten, A., Hedenas, L., Jacquemart, A.L., 2003. Differentiation in DNAfingerprinting and morphology among species of the pleurocarpous mossgenus, Rhytidiadelphus (Hylocomiaceae). Taxon 52 (2), 229–236.
asconcelos, M.T.S.D., Tavares, H.M.F., 1998. Atmospheric metal pollution (Cr, Cu,Fe, Mn, Ni, Pb and Zn) in Oporto city derived from results for low-volumeaerosol samplers and for the moss Sphagnum auriculatum bioindicator. Sci.Total Environ. 212, 11–20.
iers, J., Oliva, P., Sonke, J., Nonell, A., Freydier, R., Gainville, R., Dupré, B., 2007.Evidence of Zn isotopic fractionation in a soil-plant-system of a pristinetropical watershed (Nsimi, South Cameroon). Chem. Geol. 239, 124–137.
iers, J., Prokushkin, A.S., Pokrovsky, O.S., Kirdyanov, A.V., Beaulieu, E., Zouiten, C.,Oliva, P., Dupré, B., 2013. Seasonal and spatial variability of elementalconcentrations in boreal forest larch foliage of Central Siberia on continuouspermafrost. Biogeochemistry 113, 435–449.
ingiani, S., De Nicola, F., Purvis, W.O., Concha-Grana, E., Muniategui-Lorenzo, S.,López-Mahía, P., Giordano, S., Adamo, S., 2015. Active Biomonitoring of heavymetals and PAHs with mosses and lichens: a case study in the cities of Naplesand London. Water Air Soil Pollut. 226 (8), 240.
ukovic, G., Urosevic, M.A., Pergal, M., Jankovic, M., Goryainova, Z., Tomasevic, M.,Popovic, A., 2015. Residential heating contribution to level of air pollutants(PAHs, major, trace, and rare earth elements): a moss bag case study. Environ.Sci. Pollut. Res. Int. 22 (23), 18956–18966.
urukova, L., Ganeva, A., 1997. Active biomonitoring of atmospheric elementdeposition with Sphagnum species around a copper smelter in Bulgaria. J.Appl. Bot. 71, 14–20.
ar, J.H., 2010. Biostatistical Analysis, 5th ed. Prentice-Hall, Englewood Cliffs, NJ.echmeister, H.G., Hohenwallner, D., Riss, A., Hanus-Illnar, A., 2003. Variations in
the moss species Abietinella abietina (Hedw.) Fleisch. according to samplingtime, within site variability and increase in biomass. Sci. Total Environ. 301,55–65.
cators 71 (2016) 388–397 397
Zechmeister, H.G., Dullinger, S., Koellensperger, G., Ertl, S., Lettner, C., Reiter, K.,2011. Do metal concentrations in moss from the Zackenberg area, NortheastGreenland, provide a baseline for monitoring? Environ. Sci. Pollut. Res. 18,91–98.
Sitography
1999/30/EC:http://eur-lex.europa.eu/legal-content/EN/TXT/
?uri=celex%3A31999L00302002/3/EC:http://eur-ex.europa.eu/LexUriServ/LexUriServ.
do?uri&9552;OJ:L:2002:067:0014:0030:EN:PDF2004/107/EC:http://eur-lex.europa.eu/LexUriServ/LexUriServ.
do?uri&9552;OJ:L:2005:023:0003:0016:EN:PDF2008/50/EC:http://eur-lex.europa.eu/legal-content/en/ALL/
(http://eur-lex.europa.eu/legal-content/EN/TXT/?uri&9552;CELEX:52013DC0918).


