MOL Group, the petrol company, continues to lead the...
24
Page 1 of 24 MOL Group, the petrol company, continues to lead the ranking of Hungarian multinationals Report dated April 16, 2012 EMBARGO: The contents of this report cannot be quoted or summarized in any print or electronic media before April 17, 2012 2 p.m. Budapest, Hungary; 1 p.m. GMT; and 8:00 a.m. New York, United States. Budapest and New York, April 16, 2012: The ICEG European Center in Budapest, Hungary, and the Vale Columbia Center on Sustainable International Investment (VCC), a joint center of the Columbia Law School and the Earth Institute at Columbia University in New York, are releasing the results of a survey on outward investors today. 1 The survey is part of a long-term study of the rapid global expansion of multinational enterprises from emerging markets. The results released today focus on Hungarian multinationals in particular. The present survey, conducted in 2011, covers the period 2008-2010. Highlights The report includes a ranking of Hungarian multinationals based on their foreign assets (see table 1 below). The 20 multinationals ranked held more than USD 19 billion in foreign assets in 2010. The top-ranked firm, MOL Group (including TVK, majority-owned by MOL Group), accounted for almost USD 18 billion, or more than 91%, of these assets. The top 20 companies together registered foreign sales of more than USD 18 billion in 2010 and employed more than 40,000 workers abroad (table 2 below). In 2010, Hungary was the 23rd outward investor in terms of FDI stock among emerging markets 2 and the 27th largest in terms of outward FDI flows, well below the BRIC countries, but a large investor among the new Member States 3 of the European Union. 4 Outward investment by Hungarian companies went primarily into oil and gas exploration and production (mining and quarrying) and pharmaceuticals. Other investment areas included electronics, construction, transport, energy supply, building materials, plastics production, food products, medical precision instruments, logistics and IT, and other services. The 20 companies on the list have 172 affiliates in 37 countries, with a strong concentration in Europe, mainly in Central and Western Europe (122 affiliates). These are mainly located in neighboring or geographically close countries, such as Romania (28 affiliates), Slovakia (14), Ukraine (11), Germany (9), Poland (7), Bulgaria (6) and the Czech Republic (5). See annex table 2 and annex figure 2 for details. 1 This report was prepared by Magdolna Sass (external expert IE HAS) and Olivér Kovács (research fellow), both of them affiliated with the ICEG European Center. It is based on a survey of likely outward investors as well as on official company reports. 2 Understood as a group of countries including all developing and transition economies, as well as the 10 former economies in transition (Bulgaria, the Czech Republic, Estonia, Hungary, Latvia, Lithuania, Poland, Romania, Slovakia and Slovenia) that the United Nations has reclassified as “developed countries” after their entry in the European Union. 3 The new Member States of the European Union are those countries that joined the EU in 2004 and 2007: Cyprus, Bulgaria, the Czech Republic, Estonia, Hungary, Latvia, Lithuania, Malta, Poland, Slovakia, Slovenia, Bulgaria and Romania. See, for instance, on the European Commission’s Enlargement website, “From 6 to 27 members and beyond,” available at: http://ec.europa.eu/enlargement/the-policy/from-6-to-27-members/index_en.htm. 4 Ranking based on UNCTAD, World Investment Report, 2011 (New York and Geneva: United Nations, 2011) .
Transcript of MOL Group, the petrol company, continues to lead the...
Page 1 of 24
MOL Group, the petrol company, continues to lead the ranking of Hungarian multinationals
Report dated April 16, 2012
EMBARGO: The contents of this report cannot be quoted or summarized in any print or electronic media before April 17, 2012 2 p.m. Budapest, Hungary; 1 p.m. GMT; and 8:00 a.m. New York, United States.
Budapest and New York, April 16, 2012:
The ICEG European Center in Budapest, Hungary, and the Vale Columbia Center on Sustainable International Investment (VCC), a joint center of the Columbia Law School and the Earth Institute at Columbia University in New York, are releasing the results of a survey on outward investors today.1 The survey is part of a long-term study of the rapid global expansion of multinational enterprises from emerging markets. The results released today focus on Hungarian multinationals in particular. The present survey, conducted in 2011, covers the period 2008-2010.
Highlights
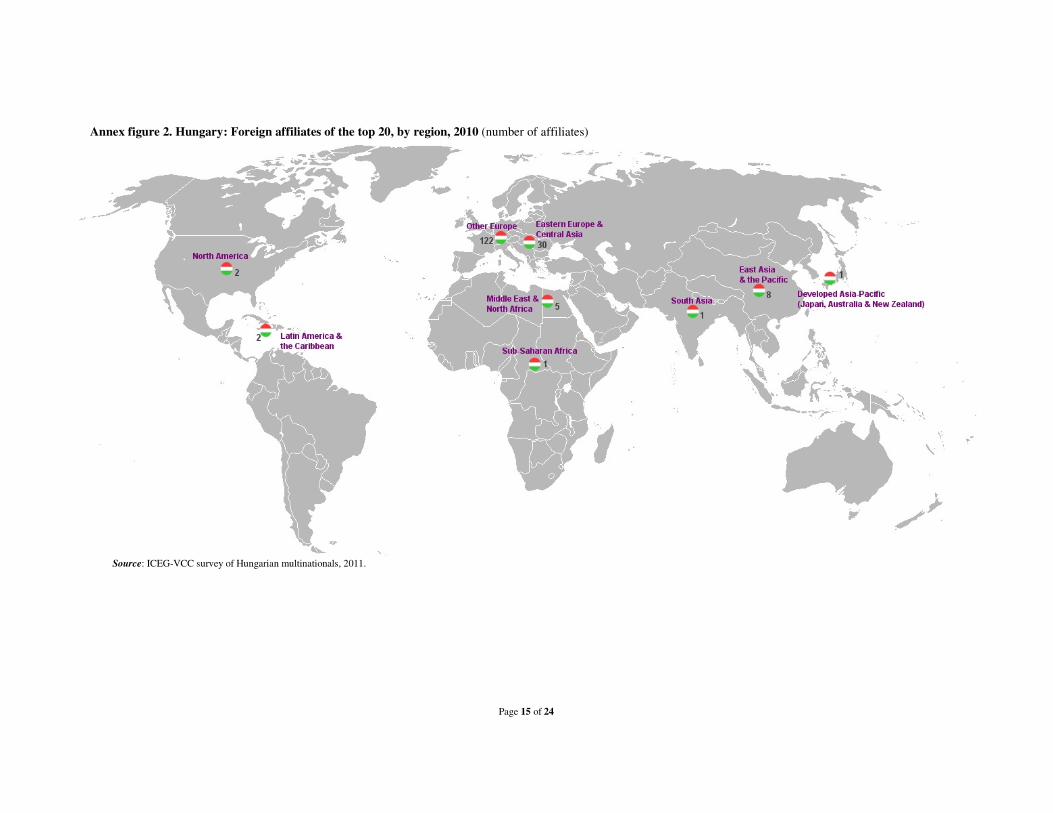
The report includes a ranking of Hungarian multinationals based on their foreign assets (see table 1 below). The 20 multinationals ranked held more than USD 19 billion in foreign assets in 2010. The top-ranked firm, MOL Group (including TVK, majority-owned by MOL Group), accounted for almost USD 18 billion, or more than 91%, of these assets. The top 20 companies together registered foreign sales of more than USD 18 billion in 2010 and employed more than 40,000 workers abroad (table 2 below). In 2010, Hungary was the 23rd outward investor in terms of FDI stock among emerging markets2 and the 27th largest in terms of outward FDI flows, well below the BRIC countries, but a large investor among the new Member States3 of the European Union.4 Outward investment by Hungarian companies went primarily into oil and gas exploration and production (mining and quarrying) and pharmaceuticals. Other investment areas included electronics, construction, transport, energy supply, building materials, plastics production, food products, medical precision instruments, logistics and IT, and other services. The 20 companies on the list have 172 affiliates in 37 countries, with a strong concentration in Europe, mainly in Central and Western Europe (122 affiliates). These are mainly located in neighboring or geographically close countries, such as Romania (28 affiliates), Slovakia (14), Ukraine (11), Germany (9), Poland (7), Bulgaria (6) and the Czech Republic (5). See annex table 2 and annex figure 2 for details.
1 This report was prepared by Magdolna Sass (external expert IE HAS) and Olivér Kovács (research fellow), both of them affiliated with the ICEG European Center. It is based on a survey of likely outward investors as well as on official company reports. 2 Understood as a group of countries including all developing and transition economies, as well as the 10 former economies in transition (Bulgaria, the Czech Republic, Estonia, Hungary, Latvia, Lithuania, Poland, Romania, Slovakia and Slovenia) that the United Nations has reclassified as “developed countries” after their entry in the European Union.3 The new Member States of the European Union are those countries that joined the EU in 2004 and 2007: Cyprus, Bulgaria, the Czech Republic, Estonia, Hungary, Latvia, Lithuania, Malta, Poland, Slovakia, Slovenia, Bulgaria and Romania. See, for instance, on the European Commission’s Enlargement website, “From 6 to 27 members and beyond,” available at: http://ec.europa.eu/enlargement/the-policy/from-6-to-27-members/index_en.htm. 4 Ranking based on UNCTAD, World Investment Report, 2011 (New York and Geneva: United Nations, 2011) .
Page 2 of 24
Table 1. The top 20 a non-financial Hungarian multinationals, by foreign assets b, 2010 (USD million) c
Rank Name Industry Statusd Foreign assets
1 MOL Group
(includingTVK) Oil and gas exploration, production, refining
and retail Listed (23.82%, 1
golden share) 17,719
2 Gedeon Richter Pharmaceutical products Listed (31.35%) 861
3 Videoton Manufacture of electrical equipment Unlisted (Nil) 288
4 KÉSZ Construction Unlisted (Nil) 74
5 Waberer’s Holding Transportation and storage Unlisted (Nil) 67
6 E-Star Alternatív Electricity, gas, steam and air conditioning
supply Listed (Nil) 64
7 Masterplast Building materials Listed (Nil) 39
8 Jász-Plasztik Plastics production Unlisted (Nil) 34
9 Fornetti Food products Unlisted (Nil) 31
10 Mediso Manufacture of medical, precision and
optical instruments Unlisted (Nil) 29
11 Abo Holding Food products Unlisted (Nil) 28
12 Cerbona Food products Unlisted (Nil) 27
13 MPF Holding Transportation and storage Unlisted (Nil) 25
14 Arcadom Construction Unlisted (Nil) 24
15 IKR Agricultural products and services Unlisted (Nil) 24
16 Synergon IT services Listed (Nil) 12
17 Kürt IT services Unlisted (Nil) 10
18 SMP IT services Unlisted (Nil) 8
19 Eurobus-Invest Professional, scientific and technical
activities Listed (Nil) 8
20 Matusz-Vad Food products Unlisted (Nil) 6
Total 19,379e
Source: ICEG-VCC survey of Hungarian multinationals, 2011. a Although we speak of the ‘top 20’ here, information was not available on all likely candidates for the top places, among other things because not all companies responded to our survey. The multinationals on this ranking may thus not be the largest outward investors from Hungary but they are certainly among the largest. b The foreign assets of a multinational enterprise are the current and fixed assets abroad that it controls. They are usually much larger than the multinational’s total outward FDI. c
The exchange rate used is the IMF rate of December 31, 2010: USD 1 = HUF 208.65 and USD 1 = EUR 0.74683. d The percentage in parentheses is the percentage of shares controlled by the state. e 19,379 is given by the rounding method; the concrete value is 19,378.55785 which is rounded up to 19,379.
Profile of the top 20
• Key drivers. Among the companies surveyed, the primary motive for investing abroad was to
find new markets. Thus Hungarian outward investment abroad is mainly of a market-seeking nature. There were a few efficiency-seeking investments that looked for lower factor costs,
Page 3 of 24
mainly lower wage costs, of which Videoton and most likely Jász-Plasztik are examples. There are cases of knowledge-seeking investments as well, such as Gedeon Richter”s investments in the Swiss PregLem and in the German Grünenthal GmbH.
• Concentration. The company in the first position, MOL Group, held more than 91% of the
total foreign assets of the top 20. This is larger than its share in 2009 (almost 89%). The first two companies on our list, MOL Group and Gedeon Richter, held almost 96% of the total foreign assets of the top 20. Another dominant investor is OTP Bank in financial services (not included in our research). Other dominant investors include Hungarian affiliates of foreign multinationals, such as M-Telekom (Deutsche Telekom), the Samsung Electronics Magyar Zrt. (Samsung) and MKB Bank (Bayerische Landesbank), which do not form part of the present research. Thus while the number of Hungarian companies investing abroad may be as high as 7,000, the overwhelming majority of the stock abroad is in the hands of a handful of companies. However, some smaller sized, quickly internationalizing companies, were also able to get into the top 20 (box 1).
• Size. In size, Hungarian multinationals clearly lag behind some of their emerging-market counterparts.5 Only the largest foreign investor, MOL Group, had close to USD 18 billion in foreign assets in 2010 and employed a significant number of people abroad (almost 29,000). Besides MOL Group, Gedeon Richter, the pharmaceutical company, also had substantial foreign employment of over 4,000; Waberer Group in transport employed more than 3,000 abroad and Videoton almost 2,000.
Box 1. Hungarian “born globals” A few companies on the list of the top 20 realized foreign direct investment very soon after their establishment. Mediso was established in 1990, and the firm set up its first foreign affiliate in Poland in 1996. Arcadom was established in 1996, and its first affiliate was founded in Romania in 1997. Eurobusz-Invest was established in 2000, and its first affiliate was founded in Slovakia in 2002. These companies can be considered as “born globals”, which start exporting and/or realize foreign direct investments soon after their establishment, and before strengthening their position in the domestic market. Their internationalization strategy is proactive. They are able to internationalize rapidly because they are generally innovative, knowledge-intensive and because they usually operate in a high tech sector or target a small market segment. These companies do not need to go through the stages of internationalization, because on the one hand they can learn from other companies, on the other hand, they can collect information about foreign markets easily in the era of informatics. They can even “borrow” or take experts from other companies. While Hungarian OFDI is usually realized in stages, in certain innovative sub-branches, especially in software development (Graphisoft, Onlinet), data management (Kürt), IT services (Interactive Net Design, Synergon), energy management (Pannergy, Genesis Energy) or production of medical precision instruments (3DHistech, Oncotherm),6 there are Hungarian small and medium-sized companies that internationalize very early in their life, mainly through exporting but also through realizing investments abroad. In that respect it is important to note that the phenomenon of “born globals” does not limit itself to developed countries; there are “emerging market born globals” as well. Source: ICEG-VCC survey of Hungarian multinationals, 2011.
• Changes in corporate players compared to 2009. Borsodchem, the company in the second
position in last year’s list7 of the top 19, was left out for 2010, because of a change in ownership. In June 2010, the Chinese Wanhua Group acquired 38% of the shares, and in February 2011 it increased its share to 96% through buying further shares from the two former owners, both private equity firms, Vienna Capital Partners (with headquarters in Vienna and Warsaw) and the German Permira Funds. Altogether Wanhua Group spent USD 1.647 billion on the transaction, including a capital injection of USD 188 million into the company. There
5 All of them were not present among the top 100 non-financial TNCs from developing and transition countries; and they are not present in the Fortune Global 500. 6 Please note that not all of these companies are included in our ranking; they are provided here as examples of the Hungarian “born globals” phenomenon. 7 Magdolna Sass and Olivér Kovács, “Hungary’s global players. A strong presence in their neighbourhood in 2009,” in Karl P. Sauvant, Vishwas P. Govitrikar and Ken Davies, eds., MNEs from Emerging Markets: New Players in the World FDI Market (New York: Vale Columbia Center on Sustainable International Investment, 2011), pp. 119-142, available at: http://www.vcc.columbia.edu/files/vale/content/EMGP_-_eBook_PDF_2_11.pdf.
Page 4 of 24
are five “newcomers” on our list: Mediso, MPF Holding, IKR, SMP and Matusz-Vad. These are mainly quickly expanding firms, which now target foreign markets as well besides the domestic one.
• Principal industries. The companies on the list are from 13 different industries. In terms of
foreign assets, the industry of the leading company, MOL Group, accounts for more than 91% of the total assets in table 1 above. MOL Group’s activities include oil and gas exploration, production, refining and retail. Pharmaceuticals come next, represented by Gedeon Richter (box 2). In terms of the number of firms, food products (4 firms) and IT services (3 companies) are the leading industries. Two firms operate in construction and in transportation and storage. The group as a whole is distributed fairly evenly between the sectors of manufacturing and services: there are eleven manufacturers and nine service providers.
Box 2. Gedeon Richter’s outward investments Gedeon Richter, the second company on our list, had a “busy” year in 2010 in terms of its outward investing and other international activities. In 2010, Gedeon Richter acquired the Swiss pharmaceutical firm, PregLem, altogether for approximately USD 462 million. Another important transaction by Gedeon Richter was the acquisition of the contraceptive product portfolio from Grünenthal GmbH, a German company, for approximately USD 334 million. Gedeon Richter is one of the largest pharmaceutical companies in Central and Eastern Europe. 31.35% of the shares are held by the Hungarian state. However, the company is majority foreign owned: 63% of the shares are owned by international investors, with three financial investors with an above 5% share: Aberdeen Asset Management Plc (United Kingdom, 12.63%), The Bank of New York Mellon (United States, 6.77%) and SkagenKon-Tiki Verdipaprifond (Norway, 5.20%). However, the company is in dispersed foreign ownership without any investor holding a controlling share, thus it is not foreign controlled. Its privatization was similar to that of MOL Group (or OTP); its shares were introduced on the Budapest Stock Exchange. By now, Gedeon Richter is without doubt a regional multinational, owning mainly producing affiliates and representative offices in neighboring or geographically close countries. The company also has affiliates in faraway locations (e.g., in India, Jamaica) and in developed countries. Altogether the company has 38 foreign affiliates (including representative offices and distribution agencies) in 21 countries. This is the company that is the most “spread” geographically, present in Asia, Europe, Eastern Europe and Central Asia, Latin-America and the Caribbean, and North America. Source: ICEG-VCC survey of Hungarian multinationals, 2011. The exchange rate used is the IMF rate of December 31, 2010: USD 1= EUR 0.74683.
• Foreign affiliates and geographic distribution. The 20 companies on the list have 172
affiliates in 37 countries, most of them in Europe (annex figure 2). The second company on our list, Gedeon Richter, has the largest number of affiliates, 38, in Europe and in Central Asia. The firm increased the number of its foreign affiliates by 8 in 2010. MOL Group has 36 foreign affiliates, mainly in Central and Western Europe, but it is present even in faraway locations, such as in Iraq, Oman and Pakistan. Masterplast, which produces building materials, comes third and has 23 affiliates, also mainly in Central and Western Europe. Affiliates of the top 20 are concentrated in “Other Europe”, and inside that, in Central Europe (annex figure 2). Like most of the affiliates of the top 20, most of the industries of these firms are concentrated in Central and Western Europe (annex figure 3). Oil and gas exploration, production, refining and retail (MOL Group) are also to be found in Eastern Europe and Central Asia (6), Middle East and North Africa (4) and sub-Saharan Africa (1). Another industry that is more “spread out” is the manufacturing of basic pharmaceutical products (Gedeon Richter), with affiliates in South Asia (1), developed Asia & Pacific (1) and Eastern Europe and Central Asia (8). (See box 2 and annex table 2.)
• Ownership and status. None of the companies on the list is a majority state-owned enterprise.
However, the state owns a special “B” share in MOL Group that gives it special voting rights (see Box 3). In 2010, state ownership grew significantly in the oil company, as indicated in box 3. The state also has a 31.35% stake in Gedeon Richter, which was privatized through the stock exchange. Of the 20 companies ranked, six are listed on the Budapest Stock Exchange. Three are also listed on foreign stock exchanges: MOL Group on the Luxembourg Stock Exchange and the Warsaw Stock Exchange, Gedeon Richter on the Luxembourg Stock Exchange, and the shares of E-Star Alternatív were introduced on the Warsaw Stock
Page 5 of 24
Exchange in 2011 (annex table 3). The last company on our list, Matusz-Vad, plans to introduce its shares on the Budapest Stock Exchange.
Box 3. Changes in the ownership structure of the leading outward investor, MOL8 During 2010, there have been significant changes in the ownership structure of MOL Group, though these did not affect the main characteristic of its ownership structure: it still has a dispersed ownership. In March 2010, 26.5% of the shares were held by a number of foreign institutional investors and 21.2% by the Russian oil and gas firm Surgutneftegas. Other shareholders, all of which hold less than 10%, include Oman Oil Ltd. (7%), the Czech group CEZ MH B.V. (7.3%) and Magnolia Finance Ltd. (5.7%) registered in Ireland. The Hungarian Government owns a voting preference share, which entitles it to veto certain strategic decisions, including those affecting the ownership changes in the company. None of the shareholders or groups of shareholders may exercise voting rights of more than 10%, as it is stated in the Articles of Association of MOL Group. Thus due to the dispersed foreign ownership and the specific rules in the Articles of Association − especially the 10% limit on voting rights and the veto right of the Government − all strategic decisions are taken by the company’s management, which is composed entirely of Hungarian nationals, residing in Hungary. Strategic planning regularly takes place at the Hungarian head office in Budapest. That is why MOL Group can be considered a Hungarian company. In May 2011, the government of Hungary purchased the MOL Group shares (21.22%) owned by the Russian company for USD 2.52 billion. Furthermore, due to the expropriation of private pension funds in Hungary in the same year, further shares landed in state hands. At present, the share of state ownership is 23.82%; the share of Hungarian shareholders (the state, OTP Bank, Hungarian institutional investors, Hungarian private persons and MOL Group’s own shares) is slightly more than 40%. Thus, on one hand, the share of the Hungarian state increased considerably in MOL Group, and on the other hand, the share of foreign ownership decreased significantly, though it is still dominant. Source: ICEG-VCC survey of Hungarian multinationals, 2011. The exchange rate used is the IMF rate of December 31, 2010 USD 1= EUR 0.74683.
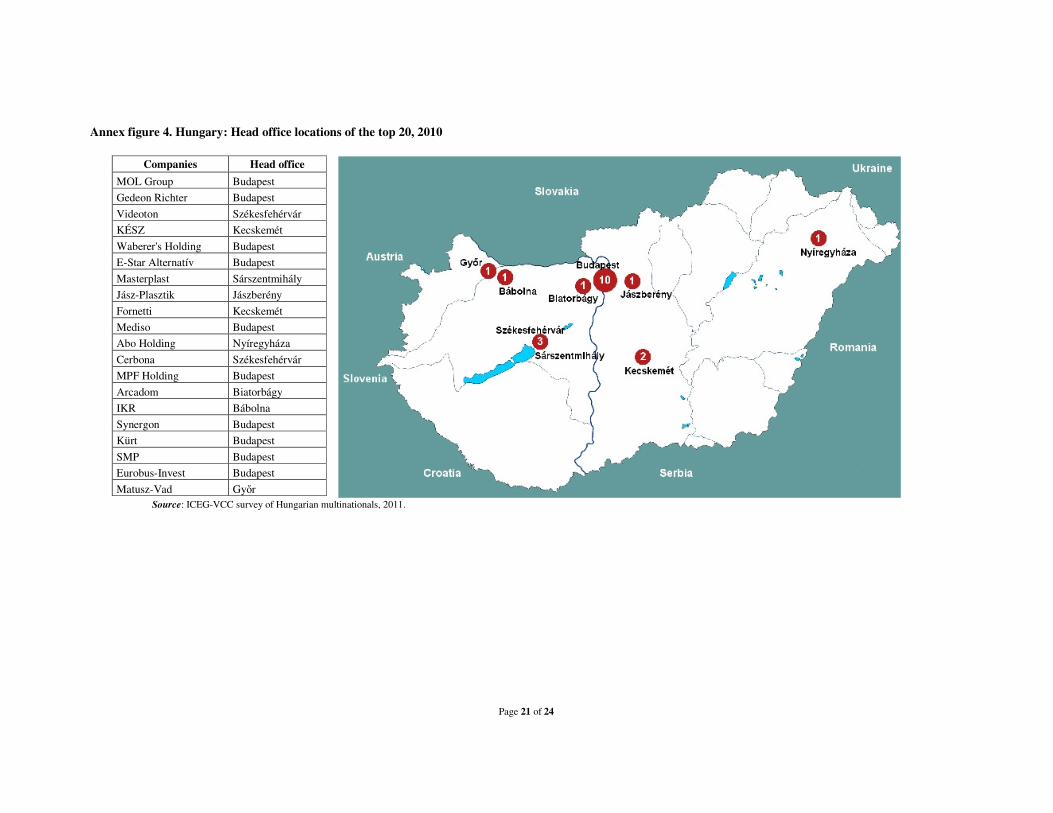
• Location of head offices. Ten companies have their head offices in Budapest, in the
capital city, which is the economic and cultural center of the country. The rest are concentrated in a few counties, predominantly in the Western part of Hungary. (See annex figure 4.)
• Nationality of management. As far as the nationality of the top management is
concerned, all of the 20 companies are led by Hungarian CEOs. The share of foreigners on the board of directors is relatively low (19%). Furthermore, managers reporting directly to the CEOs are predominantly Hungarians (97%). A brief look at the number of foreigners on the supervisory boards of the relevant companies leads us to the conclusion that the predominant part of the members is Hungarian (98%).
• Official languages. The official language of all the companies on the list is Hungarian.
However, at least one other language (mainly English; in some cases German) is used; for one company, Polish and Romanian are also indicated as secondary official languages.
• Transnationality Index (TNI). A number of Hungarian firms rank relatively high on the
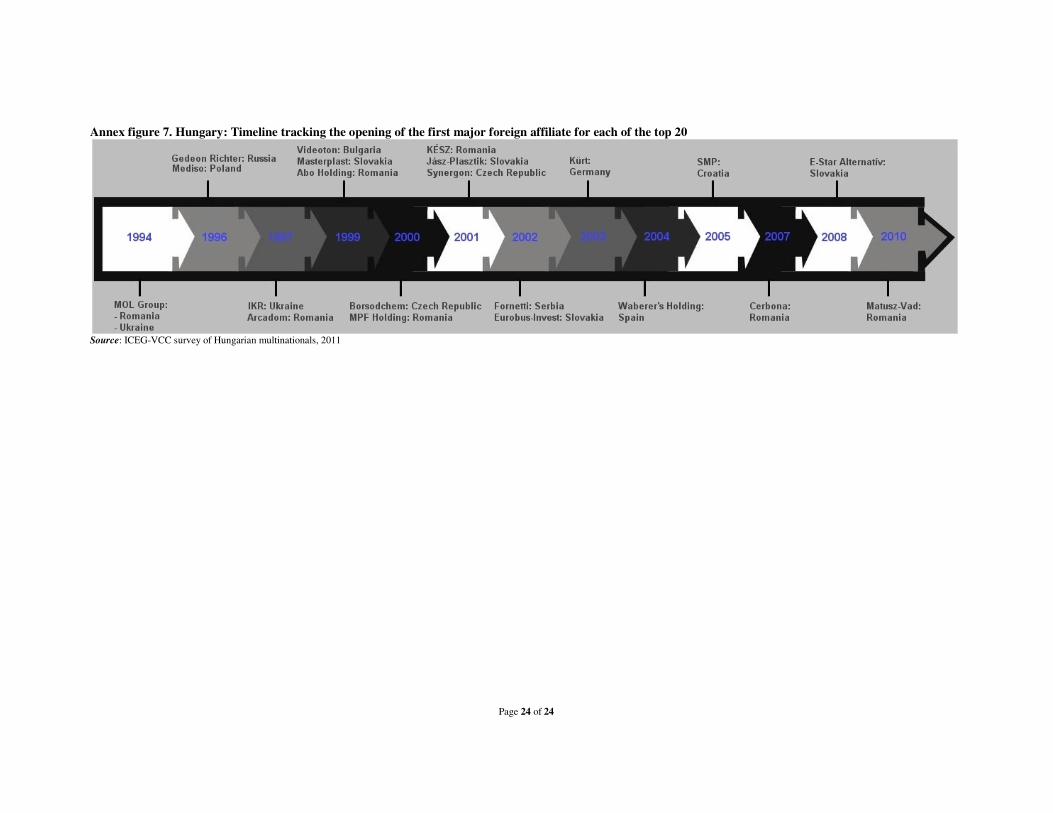
TNI (annex Table 1), with SMP in IT services scoring over 90%, MOL Group and Fornetti (food) over 80%, followed by E-Star (energy supply), Mediso (medical precision instruments) and Kürt (IT services) with an over 70% TNI. MOL Group was the first firm among the top 20 to establish a major foreign affiliate, in 1994. Gedeon Richter and Mediso followed in 1996, and IKR and Arcadom in 1997. Videoton, Masterplast and ABO Holding set up their first foreign affiliates in 1999. The affiliates of all the others were established in the 21st century. (See annex figure 7 for details.)
• Other characteristics. It appears that the majority of the top 20 outward investing
companies does not put special emphasis on gender equality in top management. They are usually not influenced in their investment decisions by local environmental regulations, except for certain sectors, which are more sensitive from that point of view (e.g. oil and gas exploration activities, renewable energy). All of them say that they are making continuous efforts to comply with international standards of responsible business conduct.
8 MOL Group, because last year we realised that TVK, another outward investor is majority owned and controlled by MOL, and thus we added its data to MOL’s.
Page 6 of 24
• Top mergers and acquisitions. The leading investors on our list, MOL Group and
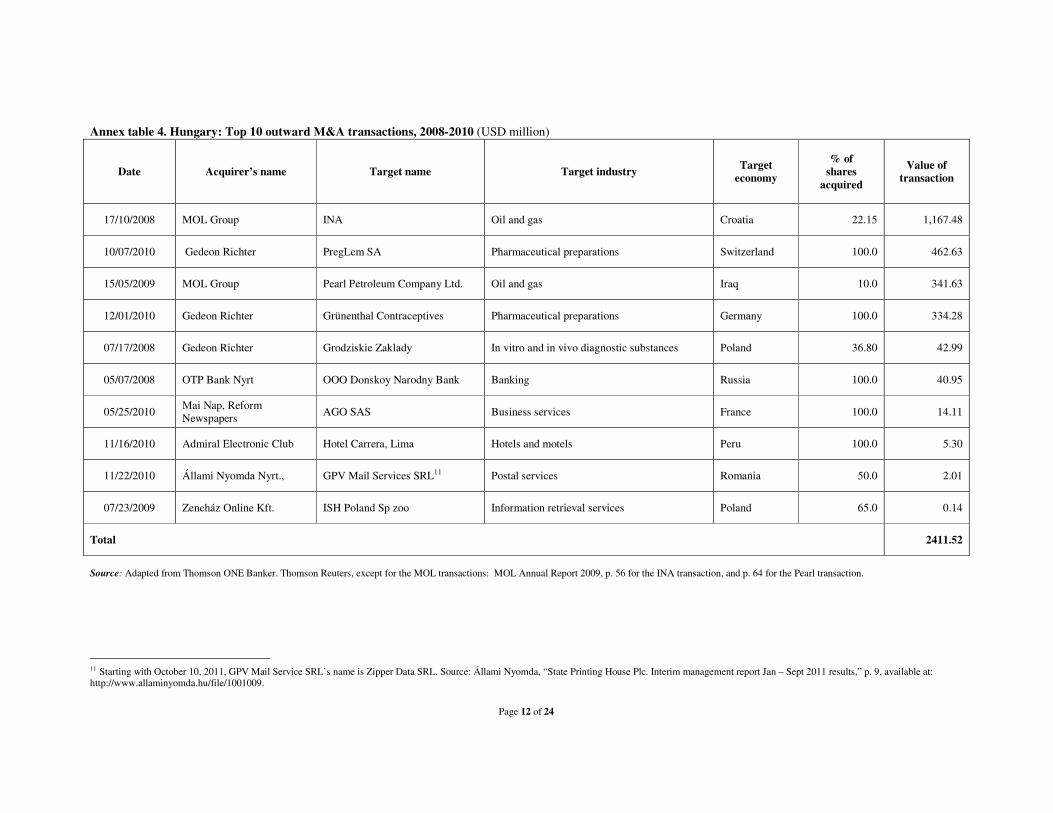
Gedeon Richter, were responsible for the most important M&A operations in the three-year period 2008-2010. The largest acquisition was carried out by MOL Group in 2008, the acquisition of a further share in INA (Croatia) for approximately USD 1,167 million. Another significant transaction was realised by MOL Group in Iraq, which was the third largest on our list. Gedeon Richter was the most active acquirer in 2010, with two large-scale transactions in Switzerland and Germany, with rounded values of USD 462 and 364 million, respectively; it also acquired a 36.8% stake in a Polish pharmaceutical company for almost USD 43 million in 2008. (See annex table 4.)
• Top greenfield announcements. Presumably because of the financial crisis, none of the
2010 greenfield projects could get into the top ten for the period 2008-10. The three largest transactions were realized by TriGránit. However, these transactions are not contained in the relevant data of the Hungarian balance of payments (see box 3 in the last year’s report9). MOL Group realised the fourth and fifth biggest projects, with more than half a billion US dollars invested in Croatia. (See annex table 5.)
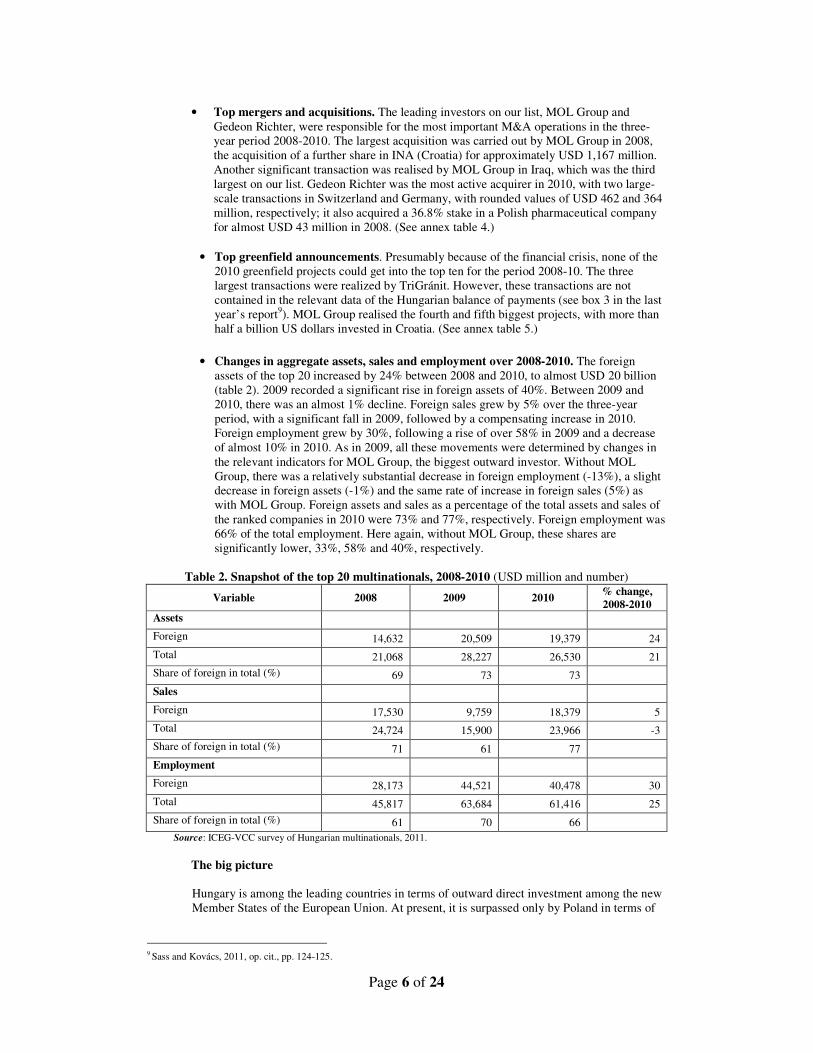
• Changes in aggregate assets, sales and employment over 2008-2010. The foreign
assets of the top 20 increased by 24% between 2008 and 2010, to almost USD 20 billion (table 2). 2009 recorded a significant rise in foreign assets of 40%. Between 2009 and 2010, there was an almost 1% decline. Foreign sales grew by 5% over the three-year period, with a significant fall in 2009, followed by a compensating increase in 2010. Foreign employment grew by 30%, following a rise of over 58% in 2009 and a decrease of almost 10% in 2010. As in 2009, all these movements were determined by changes in the relevant indicators for MOL Group, the biggest outward investor. Without MOL Group, there was a relatively substantial decrease in foreign employment (-13%), a slight decrease in foreign assets (-1%) and the same rate of increase in foreign sales (5%) as with MOL Group. Foreign assets and sales as a percentage of the total assets and sales of the ranked companies in 2010 were 73% and 77%, respectively. Foreign employment was 66% of the total employment. Here again, without MOL Group, these shares are significantly lower, 33%, 58% and 40%, respectively.
Table 2. Snapshot of the top 20 multinationals, 2008-2010 (USD million and number)
Variable 2008 2009 2010 % change, 2008-2010
Assets
Foreign 14,632 20,509 19,379 24
Total 21,068 28,227 26,530 21
Share of foreign in total (%) 69 73 73
Sales
Foreign 17,530 9,759 18,379 5
Total 24,724 15,900 23,966 -3
Share of foreign in total (%) 71 61 77
Employment
Foreign 28,173 44,521 40,478 30
Total 45,817 63,684 61,416 25
Share of foreign in total (%) 61 70 66 Source: ICEG-VCC survey of Hungarian multinationals, 2011.
The big picture Hungary is among the leading countries in terms of outward direct investment among the new Member States of the European Union. At present, it is surpassed only by Poland in terms of
9 Sass and Kovács, 2011, op. cit., pp. 124-125.
Page 7 of 24
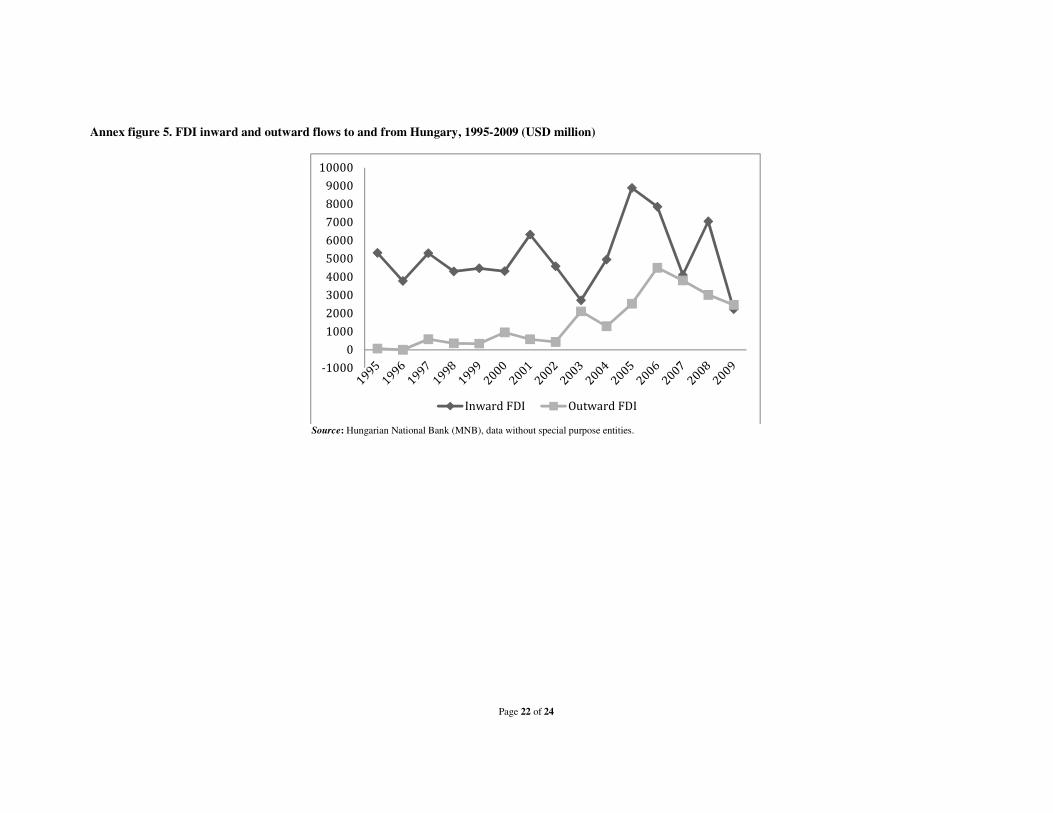
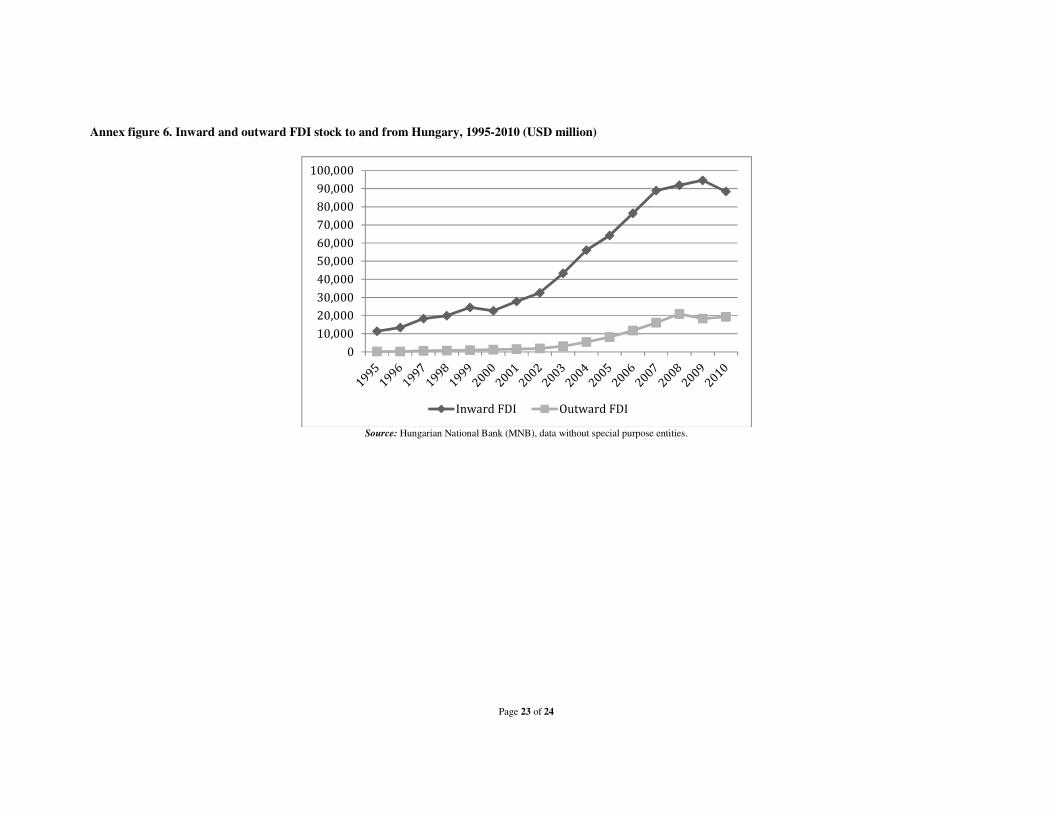
the absolute value of foreign OFDI stock, and by Estonia and Slovenia in terms of the OFDI stock/GDP or per capita OFDI stock. Outward investment from Hungary started to show meaningful values as early as 1997, and outflows exceeded USD 1 billion in 2003; since then, they remained above that level with some peak years of over USD 3 billion in 2006, 2007 and 2008. During the crisis year of 2009, both outflows and the stock of OFDI declined. Annual outflows are still dominated by a few large transactions, which underline the high concentration of OFDI in terms of the number of investing companies. The outward investors are on one hand Hungarian affiliates of large foreign multinationals, which for various reasons realize their foreign investment through their Hungarian affiliates. For example M-Telekom (owned by Deutsche Telekom) belongs to that group. On the other hand, there are a few “genuine” Hungarian, locally owned multinationals, as it is obvious from our report. Third, there are a few large, formerly state-owned companies that are in majority foreign ownership, though not under foreign control due to their dispersed ownership. We consider these companies Hungarian, as the Hungarian management takes all the strategic decisions. On our list, the two most important outward investors, MOL Group and Gedeon Richter, belong to that group; the leading investor in financial services, OTP Bank, can also be classified there. We can distinguish a fourth group of Hungarian firms investing abroad. As it is obvious from the list of the top greenfield investments, TriGránit is responsible for many enormous projects, but it is not on our list. While we can strongly presume that TriGránit is essentially a Hungarian-controlled investor, we could not find data in the balance sheets of the company about its foreign investments. The reason for that can be that it is owned by a Cyprus-based company (which in turn is majority owned by a Hungarian private person); thus it can be assumed that these foreign investments may be undertaken by the Cypriot parent company.10 The above grouping of foreign investors underlines the importance of the early start of Hungary in liberalizing its economy and welcoming foreign investors. Indirect investments were realized by foreign affiliates of large multinational companies in Hungary and locally owned companies could swiftly become competitive enough to invest abroad after the start of the transition process. This was partly due to the competitive pressure exercised by foreign affiliates and partly due to the enhanced productivity of the Hungarian firms through backward and forward linkages with them. As far as the sectoral composition of the stock of OFDI is concerned, the manufacturing sector is gradually gaining in importance. 2009 was the first year when more than half of the outward stock was in manufacturing. Within manufacturing, coke and refined petroleum and chemicals are the leading industries. Financial services and business services have been dominating the services sector. The geographical dispersion of Hungarian foreign investment has changed considerably. Neighboring and geographically close countries (especially Slovakia, Romania, Bulgaria, Croatia and Serbia) have always had a relatively large share in outflows. However, there are significant changes in the shares of certain European countries. For example, the share of the Netherlands, decreased considerably, while that of Luxembourg and Switzerland increased. These countries are “popular” among Hungarian outside investors mainly for tax optimisation purposes, however, Richter’s large deal also contributed to the increase in the share of Switzerland. One-off large transactions are responsible for the relatively large share of Central America and the Republic of Korea. The dominant entry mode of the Hungarian companies is acquisitions, especially those related to privatization in neighboring countries. This is understandable, as Hungarian companies have a clear competitive advantage based on their own experience in privatizing and restructuring formerly state-owned firms.
10 Sass and Kovács, 2011, op. cit., pp. 124-126.
Page 8 of 24
The policy environment can be considered as neutral toward foreign investment. The institutional framework has undergone significant changes in 2010. The Investment and Trade Development Agency of Hungary, an integrated agency, promoting inward and outward FDI, exports and SMEs, was closed down. A new institute, the Hungarian Investment and Trade Agency, was established to carry out the previous institution’s tasks.
For further information please contact:
ICEG European Center
Magdolna Sass
External Research Fellow IE HAS [email protected] +36-30-3974994
Olivér Kovács
Research Fellow [email protected] +36-1-2481160
Vale Columbia Center on Sustainable International Investment Lisa Sachs
Director [email protected]
+1(212) 854-0691
Victor Z. Chen
Ph.D. Candidate in Strategy and International Business Beedie School of BusinessSimon Fraser UniversityGlobal Coordinator and Editor Emerging Market Global Players Project [email protected]
Valentina Bratu
Manager and Editor Emerging Market Global Players Project [email protected]
Emerging Markets Global Players Project
This report on Hungarian multinationals was prepared in the framework of the Emerging Markets Global Players (EMGP) project, an international collaborative effort led by the Vale Columbia Center on Sustainable International Investment. It brings together researchers on FDI from leading institutions in emerging markets to generate annual reports on the leading multinationals in each participating country. Since 2007, reports have been published on 14 countries: Argentina, Brazil, Chile, China, Hungary, India, Israel, Republic of Korea, Mexico, Poland, Russia, Slovenia, Taiwan and Turkey. For further information, visit: http://www.vcc.columbia.edu/content/emerging-market-global-players-project.
ICEG European Center
The ICEG European Center is an independent economic research institute based in Budapest that was founded by Dr. Pál Gáspár in 2001. The Center focuses on research, policy advice and the dissemination of its research output through conferences and publications. The main research topics of the Center are: European macroeconomic issues, empirical and policy-oriented research on economic growth, competitiveness, and the role of multinationals and FDI. Another important research area is public economics with particular attention to the analysis of tax systems, healthcare and public administration. Finally, the Center also carries out research on regional economics and regional developments. For a full picture of the Center’s activities and publications, visit: http://www.icegec.hu.
Vale Columbia Center on Sustainable International Investment
The Vale Columbia Center on Sustainable International Investment (VCC), a joint center of Columbia Law School and the Earth Institute at Columbia University, is a leading forum for discussion by scholars, policy makers, development advocates, practitioners, and other stakeholders of issues related to FDI in the global economy, paying special attention to the impact of this investment on sustainable development. The VCC bridges education, scholarship and practice in the field of sustainable investment. Its objectives are to analyze important topical policy-oriented issues related to investment and to develop and disseminate practical approaches and solutions to promote development outcomes. For more information, visit http://www.vcc.columbia.edu.
Page 9 of 24
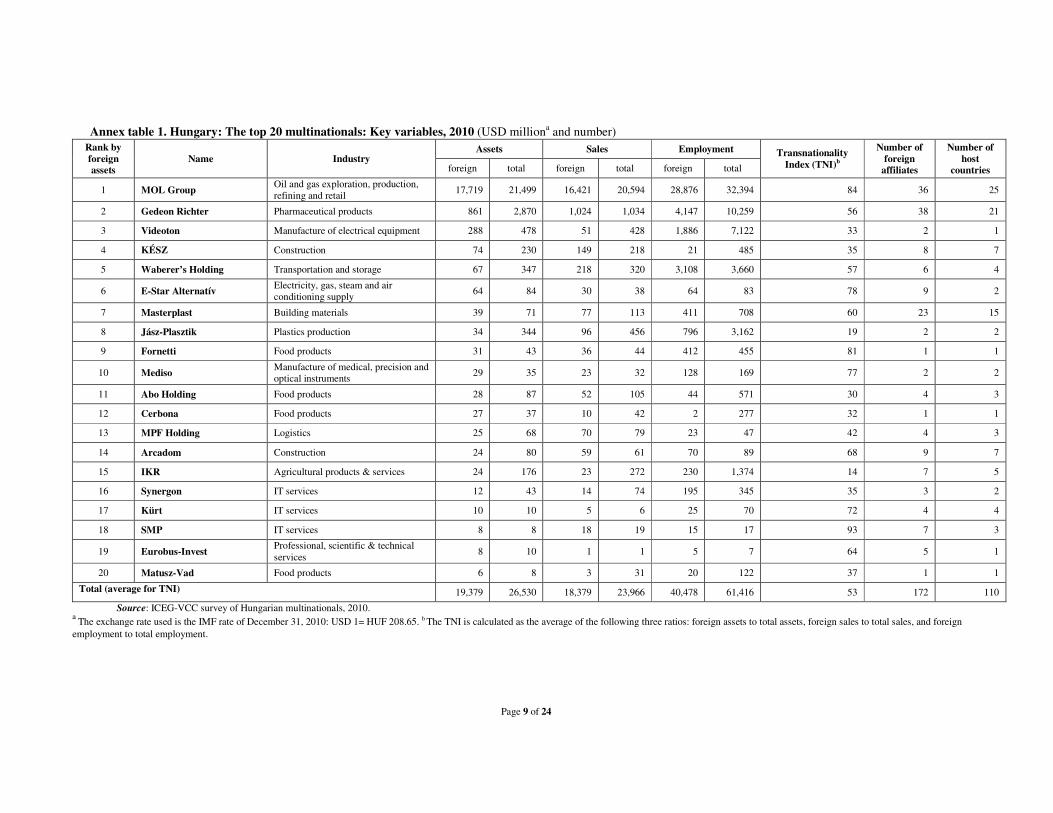
Annex table 1. Hungary: The top 20 multinationals: Key variables, 2010 (USD milliona and number) Rank by foreign assets
Name Industry Assets Sales Employment Transnationality
Index (TNI)b
Number of foreign
affiliates
Number of host
countries foreign total foreign total foreign total
1 MOL Group Oil and gas exploration, production, refining and retail
17,719 21,499 16,421 20,594 28,876 32,394 84 36 25
2 Gedeon Richter Pharmaceutical products 861 2,870 1,024 1,034 4,147 10,259 56 38 21
3 Videoton Manufacture of electrical equipment 288 478 51 428 1,886 7,122 33 2 1
4 KÉSZ Construction 74 230 149 218 21 485 35 8 7
5 Waberer’s Holding Transportation and storage 67 347 218 320 3,108 3,660 57 6 4
6 E-Star Alternatív Electricity, gas, steam and air conditioning supply
64 84 30 38 64 83 78 9 2
7 Masterplast Building materials 39 71 77 113 411 708 60 23 15
8 Jász-Plasztik Plastics production 34 344 96 456 796 3,162 19 2 2
9 Fornetti Food products 31 43 36 44 412 455 81 1 1
10 Mediso Manufacture of medical, precision and optical instruments
29 35 23 32 128 169 77 2 2
11 Abo Holding Food products 28 87 52 105 44 571 30 4 3
12 Cerbona Food products 27 37 10 42 2 277 32 1 1
13 MPF Holding Logistics 25 68 70 79 23 47 42 4 3
14 Arcadom Construction 24 80 59 61 70 89 68 9 7
15 IKR Agricultural products & services 24 176 23 272 230 1,374 14 7 5
16 Synergon IT services 12 43 14 74 195 345 35 3 2
17 Kürt IT services 10 10 5 6 25 70 72 4 4
18 SMP IT services 8 8 18 19 15 17 93 7 3
19 Eurobus-Invest Professional, scientific & technical services
8 10 1 1 5 7 64 5 1
20 Matusz-Vad Food products 6 8 3 31 20 122 37 1 1
Total (average for TNI) 19,379 26,530 18,379 23,966 40,478 61,416 53 172 110
Source: ICEG-VCC survey of Hungarian multinationals, 2010. a
The exchange rate used is the IMF rate of December 31, 2010: USD 1= HUF 208.65. b The TNI is calculated as the average of the following three ratios: foreign assets to total assets, foreign sales to total sales, and foreign employment to total employment.
Page 10 of 24
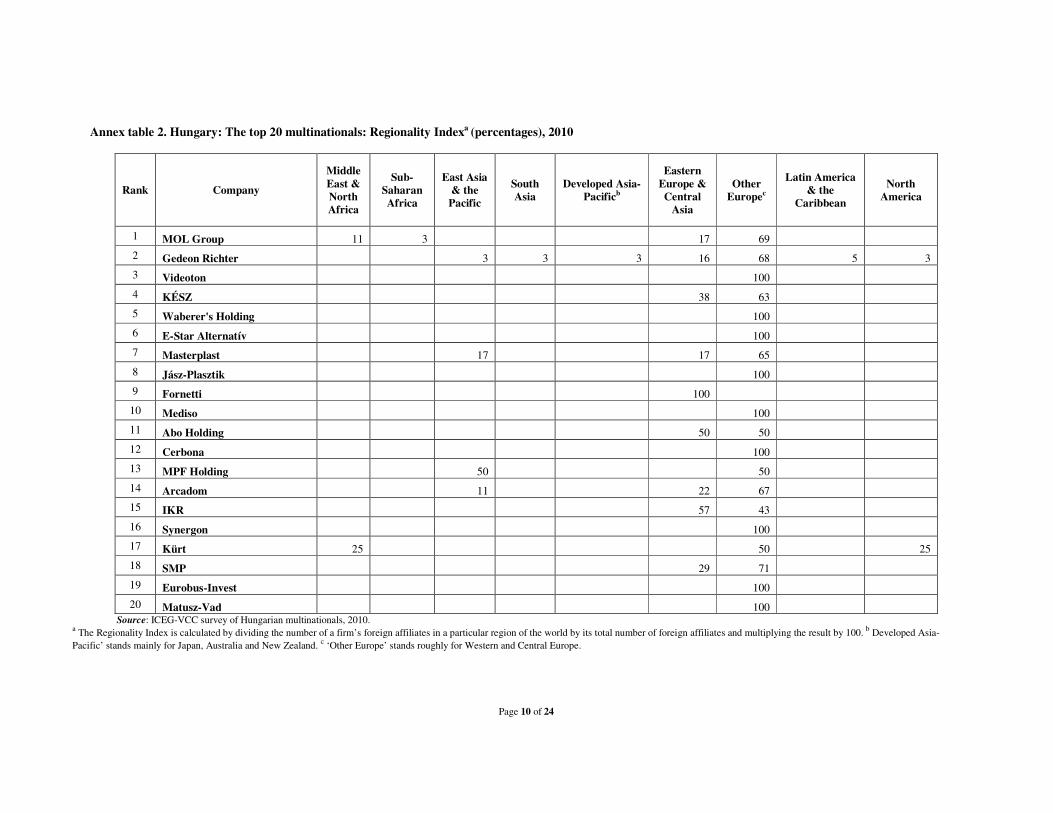
Annex table 2. Hungary: The top 20 multinationals: Regionality Indexa (percentages), 2010
Rank Company
Middle East & North Africa
Sub-Saharan Africa
East Asia & the Pacific
South Asia
Developed Asia-Pacificb
Eastern Europe & Central
Asia
Other Europec
Latin America & the
Caribbean
North America
1 MOL Group 11 3 17 69
2 Gedeon Richter 3 3 3 16 68 5 3
3 Videoton 100
4 KÉSZ 38 63
5 Waberer's Holding 100
6 E-Star Alternatív 100
7 Masterplast 17 17 65
8 Jász-Plasztik 100
9 Fornetti 100
10 Mediso 100
11 Abo Holding 50 50
12 Cerbona 100
13 MPF Holding 50 50
14 Arcadom 11 22 67
15 IKR 57 43
16 Synergon 100
17 Kürt 25 50 25
18 SMP 29 71
19 Eurobus-Invest 100
20 Matusz-Vad 100 Source: ICEG-VCC survey of Hungarian multinationals, 2010.
a The Regionality Index is calculated by dividing the number of a firm’s foreign affiliates in a particular region of the world by its total number of foreign affiliates and multiplying the result by 100. b Developed Asia-Pacific’ stands mainly for Japan, Australia and New Zealand. c ‘Other Europe’ stands roughly for Western and Central Europe.
Page 11 of 24
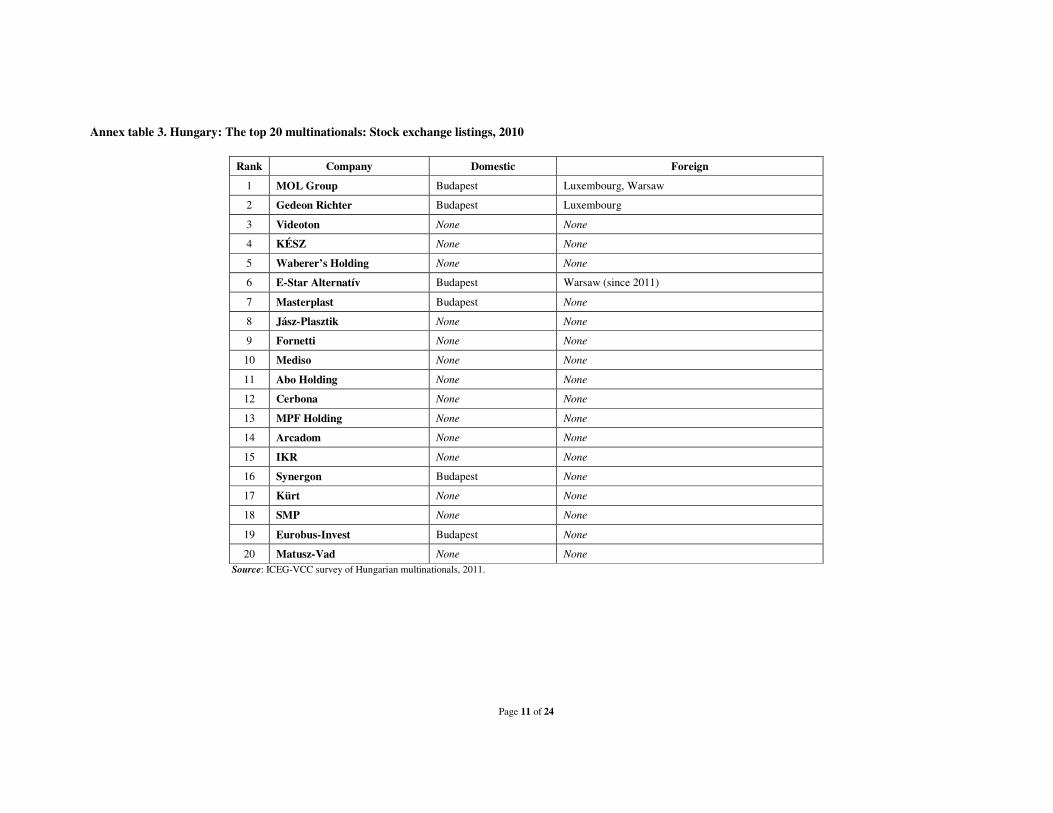
Annex table 3. Hungary: The top 20 multinationals: Stock exchange listings, 2010
Rank Company Domestic Foreign
1 MOL Group Budapest Luxembourg, Warsaw
2 Gedeon Richter Budapest Luxembourg
3 Videoton None None
4 KÉSZ None None
5 Waberer’s Holding None None
6 E-Star Alternatív Budapest Warsaw (since 2011)
7 Masterplast Budapest None
8 Jász-Plasztik None None
9 Fornetti None None
10 Mediso None None
11 Abo Holding None None
12 Cerbona None None
13 MPF Holding None None
14 Arcadom None None
15 IKR None None
16 Synergon Budapest None
17 Kürt None None
18 SMP None None
19 Eurobus-Invest Budapest None
20 Matusz-Vad None None
Source: ICEG-VCC survey of Hungarian multinationals, 2011.
Page 12 of 24
Annex table 4. Hungary: Top 10 outward M&A transactions, 2008-2010 (USD million)
Date Acquirer’s name Target name Target industry Target
economy
% of shares
acquired
Value of transaction
17/10/2008 MOL Group INA Oil and gas Croatia 22.15 1,167.48
10/07/2010 Gedeon Richter PregLem SA Pharmaceutical preparations Switzerland 100.0 462.63
15/05/2009 MOL Group Pearl Petroleum Company Ltd. Oil and gas Iraq 10.0 341.63
12/01/2010 Gedeon Richter Grünenthal Contraceptives Pharmaceutical preparations Germany 100.0 334.28
07/17/2008 Gedeon Richter Grodziskie Zaklady In vitro and in vivo diagnostic substances Poland 36.80 42.99
05/07/2008 OTP Bank Nyrt OOO Donskoy Narodny Bank Banking Russia 100.0 40.95
05/25/2010 Mai Nap, Reform Newspapers
AGO SAS Business services France 100.0 14.11
11/16/2010 Admiral Electronic Club Hotel Carrera, Lima Hotels and motels Peru 100.0 5.30
11/22/2010 Állami Nyomda Nyrt., GPV Mail Services SRL11 Postal services Romania 50.0 2.01
07/23/2009 Zeneház Online Kft. ISH Poland Sp zoo Information retrieval services Poland 65.0 0.14
Total 2411.52
Source: Adapted from Thomson ONE Banker. Thomson Reuters, except for the MOL transactions: MOL Annual Report 2009, p. 56 for the INA transaction, and p. 64 for the Pearl transaction.
11 Starting with October 10, 2011, GPV Mail Service SRL’s name is Zipper Data SRL. Source: Állami Nyomda, “State Printing House Plc. Interim management report Jan – Sept 2011 results,” p. 9, available at: http://www.allaminyomda.hu/file/1001009.

Page 13 of 24
Annex table 5. Hungary: Top 10 outward greenfield investments, 2008-2010 (USD million)
Date Company Destination Industry Value of
transaction
Oct-09 TriGranit Slovak Republic Real estate 2,230.35
Apr-08 TriGranit Romania Real estate 1,573.00
Mar-08 TriGranit Poland Real estate 781.80
Nov-09 MOL Group Croatia Coal, oil and natural gas 523.80a
Sep-08 MOL Group Slovak Republic Coal, oil and natural gas 449.50a
Sep-08 TriGranit Croatia Real estate 311.00a
Apr-08 TriGranit Russia Real estate 289.10a
Apr-08 TriGranit Russia Real estate 289.10a
Mar-08 Brixxon Austria Car manufacturing 236.40a
Jul-08 System Consulting Ukraine Renewable energy 197.30a
Total 6592.25
Source: Adapted from fDi Intelligence, a service from the Financial Times Ltd. a This is an estimated amount.
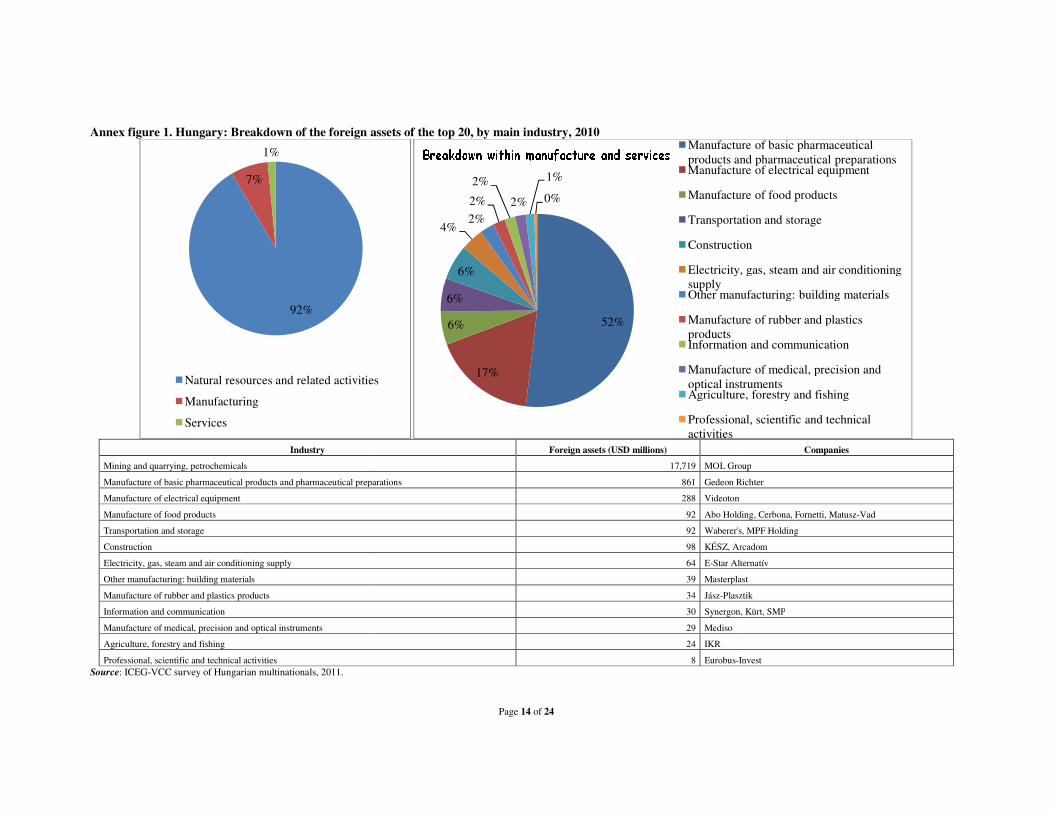
Annex figure 1. Hungary: Breakdown of the foreign assets of the top 20, by main industry, 2010
Industry
Mining and quarrying, petrochemicals
Manufacture of basic pharmaceutical products and pharmaceutical preparations
Manufacture of electrical equipment
Manufacture of food products
Transportation and storage
Construction
Electricity, gas, steam and air conditioning supply
Other manufacturing: building materials
Manufacture of rubber and plastics products
Information and communication
Manufacture of medical, precision and optical instruments
Agriculture, forestry and fishing
Professional, scientific and technical activities Source: ICEG-VCC survey of Hungarian multinationals, 2011.
92%
7%
1%
Natural resources and related activities
Manufacturing
Services
Page 14 of 24
Annex figure 1. Hungary: Breakdown of the foreign assets of the top 20, by main industry, 2010
Foreign assets (USD millions)
17,719 MOL Group
Manufacture of basic pharmaceutical products and pharmaceutical preparations 861 Gedeon Richter
288 Videoton
92 Abo Holding, Cerbona, Fornetti, Matusz
92 Waberer's, MPF Holding
98 KÉSZ, Arcadom
64 E-Star Alternatív
39 Masterplast
34 Jász-Plasztik
30 Synergon, Kürt, SMP
29 Mediso
24 IKR
8 Eurobus-Invest
Natural resources and related activities
52%
17%
6%
6%
6%
4%2%
2%
2%
2%
1%
0%
Manufacture of basic pharmaceutical products and pharmaceutical preparationsManufacture of electrical equipment
Manufacture of food products
Transportation and storage
Construction
Electricity, gas, steam and air conditioning supplyOther manufacturing: building materials
Manufacture of rubber and plastics productsInformation and communication
Manufacture of medical, precision and optical instrumentsAgriculture, forestry and fishing
Professional, scientific and technical activities
Companies
Group
Richter
Abo Holding, Cerbona, Fornetti, Matusz-Vad
Waberer's, MPF Holding
KÉSZ, Arcadom
Star Alternatív
Masterplast
Plasztik
Synergon, Kürt, SMP
Invest
Manufacture of basic pharmaceutical products and pharmaceutical preparationsManufacture of electrical equipment
Manufacture of food products
Transportation and storage
Construction
Electricity, gas, steam and air conditioning
Other manufacturing: building materials
Manufacture of rubber and plastics
Information and communication
Manufacture of medical, precision and optical instrumentsAgriculture, forestry and fishing
Professional, scientific and technical
Page 15 of 24
Annex figure 2. Hungary: Foreign affiliates of the top 20, by region, 2010 (number of affiliates)
Source: ICEG-VCC survey of Hungarian multinationals, 2011.
Page 16 of 24
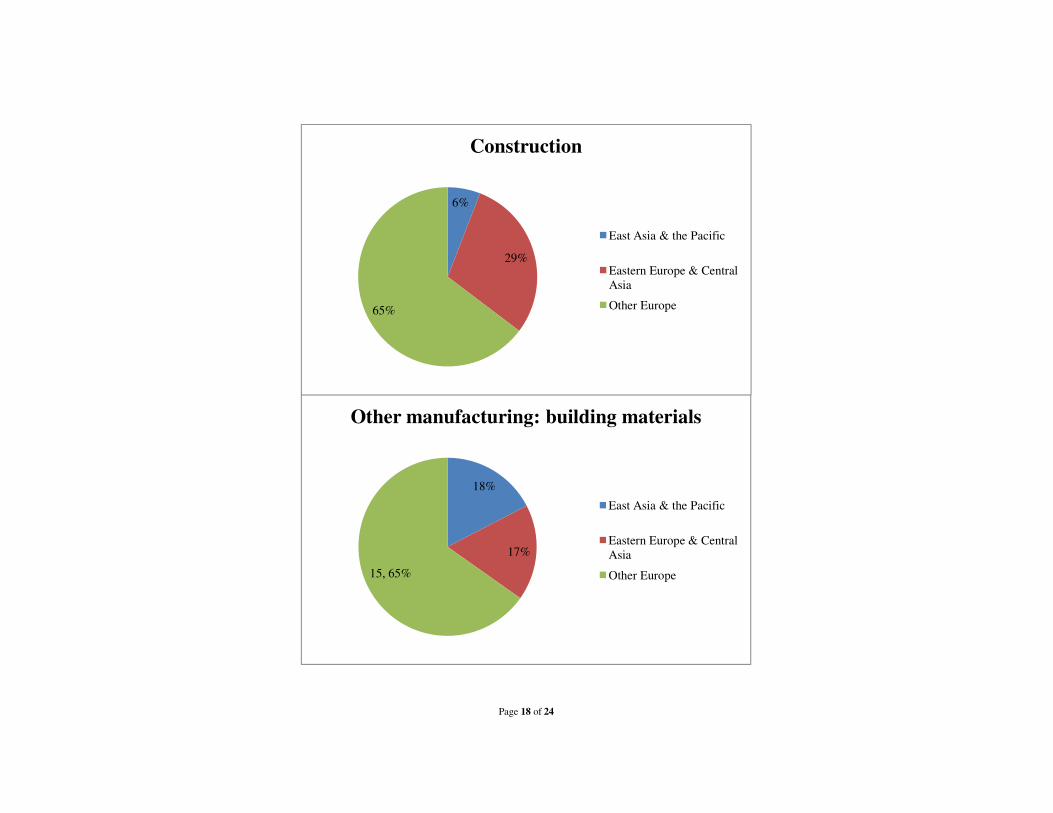
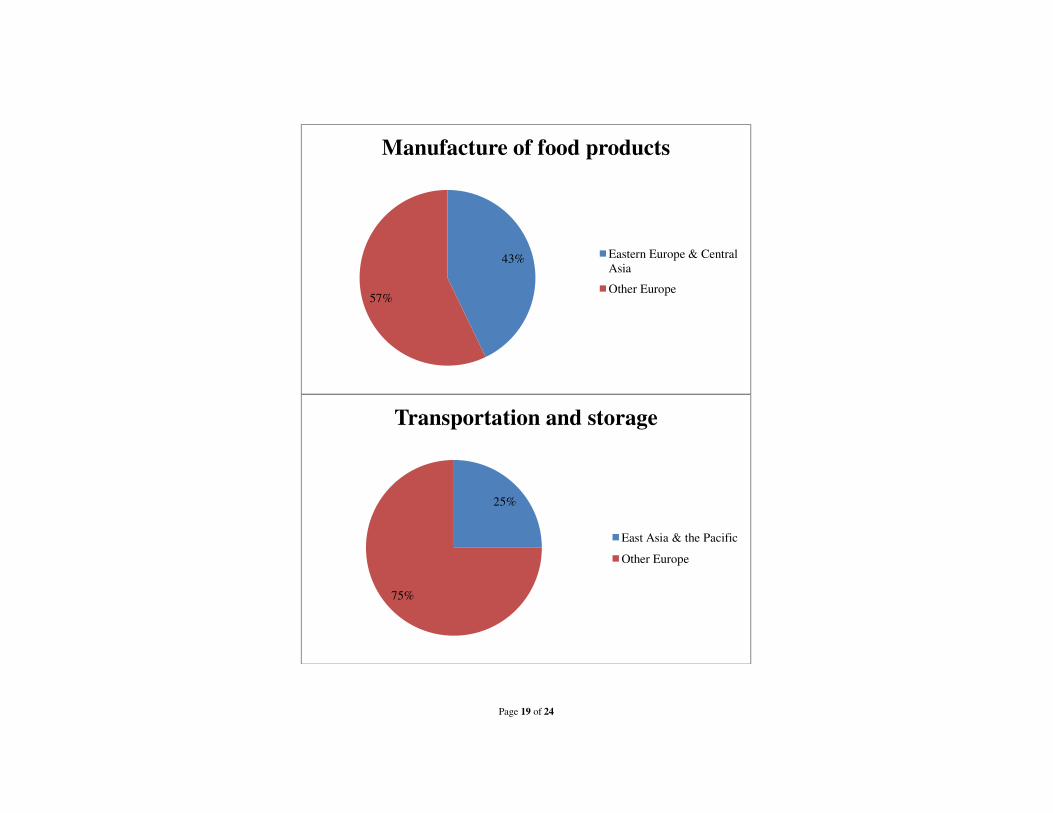
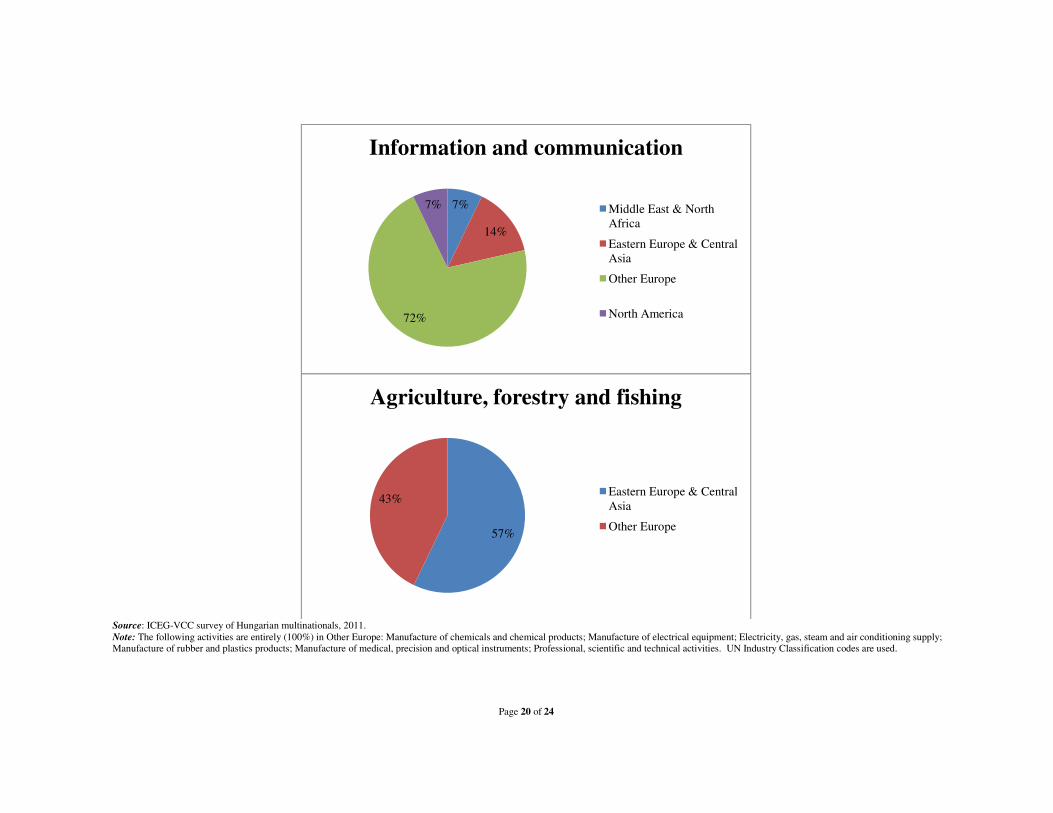
Annex figure 3. Hungary: Geographic distribution of the assets of the top 20 multinationals, by main industry, 2010
11% 3%
17%
69%
Mining and quarrying, petrochemicals
Middle East & North Africa
Sub-Saharan Africa
Eastern Europe & Central Asia
Other Europe
2% 3%3%
16%
68%
5%
3%
Manufacture of basic pharmaceutical products and pharmaceutical preparations
East Asia & the Pacific
South Asia
Developed Asia-Pacific (Japan, Australia & New Zealand)
Eastern Europe & Central Asia
Other Europe
Latin America & the Caribbean
North America
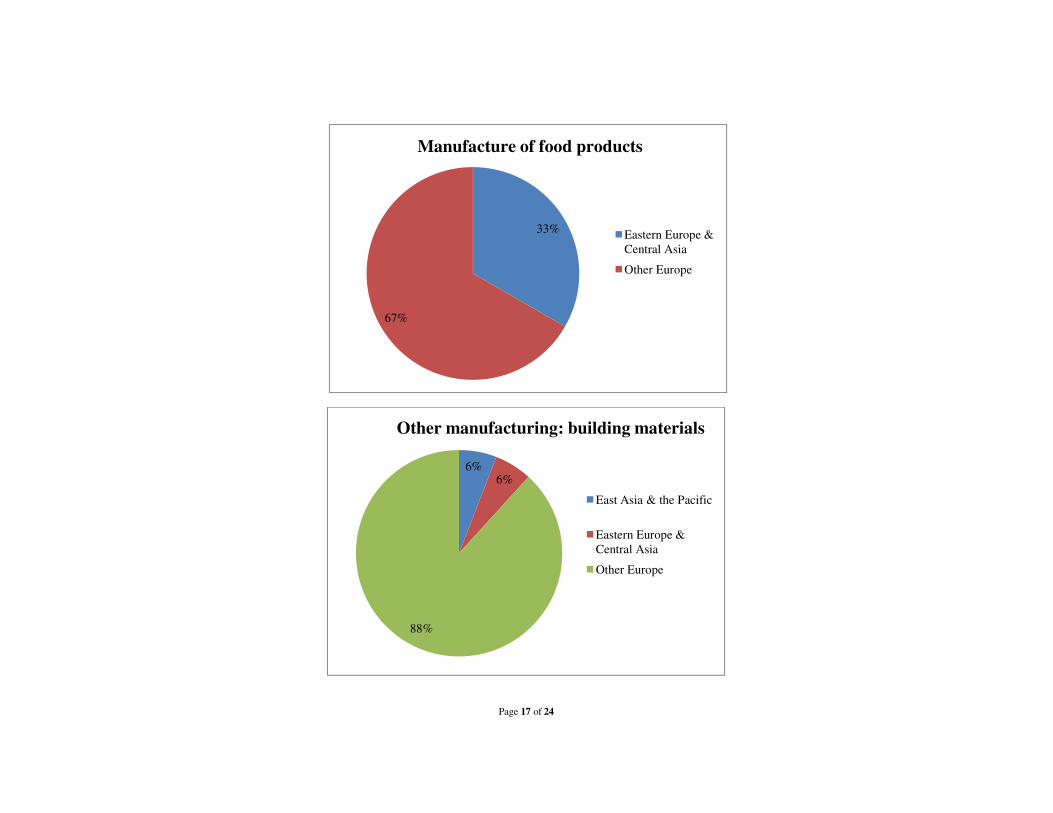
Page 17 of 24
33%
67%
Eastern Europe & Central Asia
Other Europe
Manufacture of food products
6%6%
88%
East Asia & the Pacific
Eastern Europe & Central Asia
Other Europe
Other manufacturing: building materials
Page 18 of 24
6%
29%
65%
Construction
East Asia & the Pacific
Eastern Europe & Central Asia
Other Europe
18%
17%
15, 65%
Other manufacturing: building materials
East Asia & the Pacific
Eastern Europe & Central Asia
Other Europe
Page 19 of 24
43%
57%
Manufacture of food products
Eastern Europe & Central Asia
Other Europe
25%
75%
Transportation and storage
East Asia & the Pacific
Other Europe
Page 20 of 24
Source: ICEG-VCC survey of Hungarian multinationals, 2011. Note: The following activities are entirely (100%) in Other Europe: Manufacture of chemicals and chemical products; Manufacture of electrical equipment; Electricity, gas, steam and air conditioning supply; Manufacture of rubber and plastics products; Manufacture of medical, precision and optical instruments; Professional, scientific and technical activities. UN Industry Classification codes are used.
7%
14%
72%
7%
Information and communication
Middle East & North Africa
Eastern Europe & Central Asia
Other Europe
North America
57%
43%
Agriculture, forestry and fishing
Eastern Europe & Central Asia
Other Europe
Page 21 of 24
Annex figure 4. Hungary: Head office locations of the top 20, 2010
Source: ICEG-VCC survey of Hungarian multinationals, 2011.
Companies Head office
MOL Group Budapest
Gedeon Richter Budapest
Videoton Székesfehérvár
KÉSZ Kecskemét
Waberer's Holding Budapest
E-Star Alternatív Budapest
Masterplast Sárszentmihály
Jász-Plasztik Jászberény
Fornetti Kecskemét
Mediso Budapest
Abo Holding Nyíregyháza
Cerbona Székesfehérvár
MPF Holding Budapest
Arcadom Biatorbágy
IKR Bábolna
Synergon Budapest
Kürt Budapest
SMP Budapest
Eurobus-Invest Budapest
Matusz-Vad Győr
Page 22 of 24
Annex figure 5. FDI inward and outward flows to and from Hungary, 1995-2009 (USD million)
Source: Hungarian National Bank (MNB), data without special purpose entities.
-1000
0
1000
2000
3000
4000
5000
6000
7000
8000
9000
10000
Inward FDI Outward FDI
Page 23 of 24
Annex figure 6. Inward and outward FDI stock to and from Hungary, 1995-2010 (USD million)
Source: Hungarian National Bank (MNB), data without special purpose entities.
0
10,000
20,000
30,000
40,000
50,000
60,000
70,000
80,000
90,000
100,000
Inward FDI Outward FDI
Page 24 of 24
Annex figure 7. Hungary: Timeline tracking the opening of the first major foreign affiliate for each of the top 20
Source: ICEG-VCC survey of Hungarian multinationals, 2011


![Untitled-2 [petrol-is.org.tr]petrol-is.org.tr/sites/default/files/akademi.pdf · PROTOKOL TARAFLAR A-Petrol- i; Sendikasl Türkiye Petrol Kimya Lastik i;çileri Sendikast "PETROL-i$](https://static.fdocuments.in/doc/165x107/5e032b70d9e2ea2f204214f9/untitled-2-petrol-isorgtrpetrol-isorgtrsitesdefaultfiles-protokol-taraflar.jpg)