Mohammad Reza Farzanegan
17
8938 2021 March 2021 The Effect of Public Corrup- tion on Covid-19 Fatality Rate: A Cross-Country Examination Mohammad Reza Farzanegan
Transcript of Mohammad Reza Farzanegan

8938 2021
March 2021
The Effect of Public Corrup-tion on Covid-19 Fatality Rate: A Cross-Country Examination Mohammad Reza Farzanegan

Impressum:
CESifo Working Papers ISSN 2364-1428 (electronic version) Publisher and distributor: Munich Society for the Promotion of Economic Research - CESifo GmbH The international platform of Ludwigs-Maximilians University’s Center for Economic Studies and the ifo Institute Poschingerstr. 5, 81679 Munich, Germany Telephone +49 (0)89 2180-2740, Telefax +49 (0)89 2180-17845, email [email protected] Editor: Clemens Fuest https://www.cesifo.org/en/wp An electronic version of the paper may be downloaded · from the SSRN website: www.SSRN.com · from the RePEc website: www.RePEc.org · from the CESifo website: https://www.cesifo.org/en/wp

CESifo Working Paper No. 8938
The Effect of Public Corruption on Covid-19 Fatality Rate: A Cross-Country Examination
Abstract This paper evaluates whether the level of public corruption influences COVID-19 case fatality rates. Using cross-section data, including 64 countries and multiple regression techniques, we find that the level of corruption is positively and significantly associated with COVID-19 human costs. These results are robust to control of other possible explanatory factors. JEL-Codes: I150, I180, D730, E020, H510. Keywords: Covid-19, case fatality rates, pandemic, corruption, trust, cross-country regression.
Mohammad Reza Farzanegan Center for Near and Middle Eastern Studies &
School of Business and Economics Philipps-Universität Marburg / Germany
I appreciate the helpful comments and suggestions by Sven Fischer and Jhoana Ocampo on earlier versions of this study.

1
The effect of public corruption on COVID-19 fatality rate: A cross-country examination
Mohammad Reza Farzanegan
Philipps-Universität Marburg, Center for Near and Middle Eastern Studies & School of Business and
Economics, Marburg, Germany1
1. Introduction
How can administrative corruption explain part of cross-country variation in COVID-19 fatalities
worldwide? There are lessons from literature which can help establish the link between COVID-19
fatalities across countries and their different levels of public corruption. Sommer (2020) shows that
cross-country variation of corruption explains the effectiveness of health expenditure at improving
infant and child health. According to Transparency International estimations, approximately 140,000
children die every year as a result of corruption in health systems. In monetary terms, Transparency
International estimates that of the total amount of $7.5 trillion spent globally on health each year, $500
billion is lost to corruption. At the individual level, the corruption perception surveys by Transparency
International shows that 1 in 5 people worldwide (17%) report they were forced to pay a bribe when
dealing with the medical sector.2 Distorting effects of corruption on government spending may also help
us establish the link to COVID-19 fatalities. Gupta et al (2001) show that corruption is associated with
higher military spending as a share of GDP, leaving fewer resources for non-military fields such as
health and education. Mauro (1998) and Gupta, et al (2002) show the negative effect of corruption on
healthcare and education services. Dincer and Teoman (2019) ask “Does Corruption Kill?” in their case
study of Turkey. Using corruption index based on the stories covered in a major Turkish newspaper
between the years 1960 and 2010, they show that corruption increases infant mortality in the long-run.
A recent detailed report by the World Health Organization (2020) on “Potential corruption risks in health
financing arrangements” suggests that “corruption in health systems represents a significant drain on
2 For more details see https://www.transparency.org/en/our-priorities/health-and-corruption#

2
national health resources and development assistance for health”. Based on estimations of Gee and
Button (2015), fraud in the healthcare sector leads to a global average loss rate of approximately 6% in
total healthcare spending, or $ 455 billion per year. Public corruption also undermines the degree of trust
by people in government and formal institutions. Decreasing public trust has a negative impact on
effective management of global pandemics, such as COVID-19, which needs the highest levels of
cooperation from its citizens. Corruption can increase the price and reduce the level of government
output and services (Shleifer and Vishny 1993), which can have implications for costs of health services
and goods. Furthermore, corruption has a negative impact on education and cognitive ability of
population (Ehrlich and Lui 1999, Farzanegan and Thum, 2020), which may also restrict the possibility
of containing global pandemics. Governments are better able to deal with negative shocks of COVID-
19 pandemic if they have the necessary financial reserves. Corruption is shown to reduce the income
capacity of the state (Shleifer and Vishny 1993; Hindriks et al. 1999) as tax evasion and smuggling is
more likely in corrupt countries (Buehn and Farzanegan, 2012 and Farzanegan, 2009). Gupta et al (2001)
show empirically that a high level of corruption has adverse consequences for a country’s child and
infant mortality rates, percent of low-birthweight babies in total births, and dropout rates in primary
schools. Corruption can also affect the COVID-19 fatalities through the channel of trust to the
government. Countries with higher levels of corruption are shown to have lower levels of social capital
and trust (e.g., Anderson and Tverdova, 2003) and social capital is suggested to be an important
determinant of health outcomes across countries (for a survey see Kawachi, Takao, and Subramanian,
2013).
Based on this body of literature, we argue that public corruption and its cross-country variation matters
for understanding the global experience of COVID-19 fatalities, controlling for other competing
hypotheses. The results add to the literature on consequences of corruption on the health status of people,
reminding us the costs of delays in controlling corruption.
2. Data and methodology
Our main hypothesis is that higher levels of corruption can explain a higher levels of COVID-19 case
fatality rates. Our main specification to test this hypothesis is as follows:
𝑐𝑓𝑟𝑖 = 𝑐𝑜𝑛𝑠 + 𝛽1. 𝑐𝑜𝑟𝑟𝑢𝑝𝑡𝑖𝑜𝑛𝑖 + 𝛽2. 𝑐𝑜𝑛𝑡𝑟𝑜𝑙𝑠𝑖 + 𝑢𝑖 (1)
We use cross-country regression analysis by ordinary least squares (OLS) and robust standard errors in
our estimation.
Dependent variable: case fatality rate (cfr)
The dependent variable is case fatality rate. It is calculated as the ratio of total COVID-19 deaths per
million and total COVID-19 cases per million of population (multiplied by 100). It is based on
3
cumulative numbers on 14 December 2020. The source of data is European Centre for Disease
Prevention and Control Data.3 Fatality rate varies from a minimum of 0.05% (Singapore) to a maximum
of 9.11 % (Mexico) in our estimation sample.
Independent variables
Corruption
Our main explanatory variable is the level of corruption in 2019 (the year before COVID-19 pandemic).
In the main analysis, the ICRG corruption index is used (ICRG, 2020). It is based on assessments by
country experts. It is shown that different subjective indicators of corruption are highly correlated
(Treisman, 2000) and often explain the real experience of corruption well (Fisman and Miguel, 2007
and Fisman and Wei, 2009). For robustness checks, we also use corruption indexes from World
Governance Indicators and Transparency International4.
The main focus of the ICRG index is corruption in the public sector by recording the “actual corruption
in the form of excessive patronage, nepotism, job reservations or quid pro quo deals, secret party
funding, and suspiciously close ties between politics and business.” The ICRG corruption index in our
sample ranges from 0.5 in Somalia and Sudan (most corrupt) to 5.5 in Denmark, Finland, New Zealand,
and Sweden (least corrupt). We have reversed the index from 0.5 (least corrupt) to 5.5 (most corrupt).
Control variables
In addition to our main variables of interest (i.e. corruption) and to reduce the risk of omitted variable
bias, we also control for a set of other drivers of COVID-19 fatality rate in our estimations. The source
for the control variables is the World Bank (2020) and to increase the sample, the average of explanatory
variables from 2017 to 2019 is used. In the following, we briefly explain their association with case
fatality rate:
Demographic factors: the role of age structure in cross country differences of COVID-19 fatality has
been examined in earlier studies. For example, Farzanegan (2020) shows that countries with higher share
of population beyond 65 in total population have experienced a higher number of deaths as a result of
the outbreak of SARS-CoV-2. He also shows that the final effect of old age structure on COVID-19
fatality depends on the health absorptive capacity of countries. Old-age demographic structures show a
weaker positive association with COVID-19 deaths in countries with higher healthcare absorptive
capacity. Dowd et al. (2020) also show that COVID-19 mortality rates would vary across countries due
to age structure. Palloni and Walter (2020) argue that both demography and biology are important in
3 https://www.ecdc.europa.eu/en/publications-data/download-todays-data-geographic-distribution-covid-19-cases-worldwide 4 For comparability, we use the corruption index in 2019 from https://www.transparency.org/en/cpi/2019/index/nzl and https://databank.worldbank.org/source/worldwide-governance-indicators#
4
explaining the patterns of deaths caused by the outbreak of SARS-CoV-2. The association between age
and mortality rate of COVID-19 also is mentioned by Blagosklonny (2020). To control for this factor,
we use the share of population ages 65 and more in total population.
We also control for population density, which is population divided by land area in square kilometers.
The association between population density and COVID-19 fatality is not straightforward. On one side,
the outbreak of SARS-CoV-2 may be higher and faster in densely populated countries. On the other
side, some studies have identified a reverse (or insignificant) association between population density
and COVID-19 fatality. For example, Hamidi et al. (2020) use structural equation modeling and examine
the impact of density on the COVID-19 infection and mortality rates for 913 U.S. metropolitan counties.
They find that county density is not significantly related to the infection rate after controlling for
metropolitan population. They link this finding to more adherence to social distancing guidelines in such
areas. They also find that counties with higher densities have lower mortality rates than areas with lower
density, possibly because of better healthcare systems. They conclude that connectivity among people
matters more than density in the expansion of the COVID-19 pandemic.
In another study, Carozzi et al (2020) also use regional data from the United States and examine the
causal effect of population density on COVID-19 cases and death rates, using instrumental variable
strategies. While they show that density has affected the timing of the outbreak in each county, there is
no empirical evidence on the effect of density on COVID-19 cases and deaths. They also explain the
possible mechanisms: there is a positive association between population density and proxies of social
distancing and a negative association with the age of the population. We use logarithm of population
density (people per sq. km of land area).
Health factors: Countries with better healthcare capacity and more affordable health systems, ceteris
paribus, are more able to manage the COVID-19 crisis. Farzanegan (2020) shows that early investments
in healthcare systems matter in lowering the number of COVID-19 death rates. The importance of health
system capacity is also mentioned by Khan et al. (2020), who used a binomial regression model to study
the association between COVID-19 case fatality and healthcare capacity index across countries. They
suggest “building effective multidimensional healthcare capacity is the most promising means to
mitigate future case fatalities”. Golinelli et al. (2017) also highlight the importance of earlier spending
on health systems for controlling the COVID-19 fatality in the case study of Italy. Following earlier
studies, we use the logarithm of hospital beds (per 1,000 people) to control for healthcare absorptive
capacity. In addition, the affordability of healthcare for the average population is an important factor for
increasing immunity against the coronavirus. We use per capita out-of-pocket expenditure. Out-of-
pocket payments are spending on health directly by households. Higher values of this variable show a
higher burden of healthcare costs on the individuals, which may hinder regular checkups and medical
controls, increasing the vulnerability of the population in confrontation with deadly viruses such as
SARS-CoV-2.

5
Global connections and mobility: the expansion of SARS-CoV-2 is more likely in countries with higher
levels of interaction with the rest of the world and more openness to international tourism. Farzanegan
et al. (2020a) provide empirical evidence on the positive association between international tourism and
the cumulated level of COVID-19 confirmed cases and deaths in a sample of 90 countries. The risk of
international tourism for global public health during a pandemic is also examined by Richter (2003).
Mallapaty (2020) refers to role of cruise tourism in the outbreak of COVID-19. In general, a higher
degree of globalization by countries is shown to be associated with higher outbreaks of COVID-19
(Farzanegan et al 2020b). We use the logarithm of number of arrivals and departures of international
tourism from the World Bank (2020).
Socio-economic development: we use two measures to control for socio-economic development of
countries: the logarithm of GDP per capita and the share of population who use internet. It is expected
that countries with higher income per capita are more prepared and equipped to control the pandemic
and reduce the human costs of COVID-19, recording lower fatality rates. Also, a higher share of internet
users in total population may capture the degree of internet penetration and thus easier implementation
of social distancing and work-at-home policies, which can reduce the risk of infection. Data on GDP
per capita and share of internet users in the population are from the World Bank (2020).
Table 1 provides summary statistics on the COVID-19 fatality rate on 14 December 2020 (as the
dependent variable) and ICRG corruption indicators (as the main independent variable) for the included
sample of countries in our estimation. There is considerable variation across countries.
For example, in 2019, the corruption index ranges from the lowest levels of 0.5 in Denmark, Finland,
New Zealand and Sweden to the highest level of 4.5 in Iran, Mexico, Nicaragua and Russia Federation.
COVID-19 fatality rates by the end of 2020 also exhibit considerable cross-country variation. For
instance, Bahrain, Cyprus, Denmark, Estonia, Iceland, Israel, Lithuania, Luxembourg, Norway,
Singapore, Slovak Republic, Sri Lanka, United Arab Emirates, and Uruguay all experienced fatality
rates less than 1% on 14 December 2020, while Bolivia, Bulgaria, China, Guatemala, Indonesia, Iran,
Italy, Mexico, Peru, Tunisia, United Kingdom all suffered fatality rates of more than 3% (the average
fatality rate in our sample of 64 countries is 2%). Thus, the dataset presents rich cross-country variation
for examining the link between COVID-19 fatality rate and corruption.
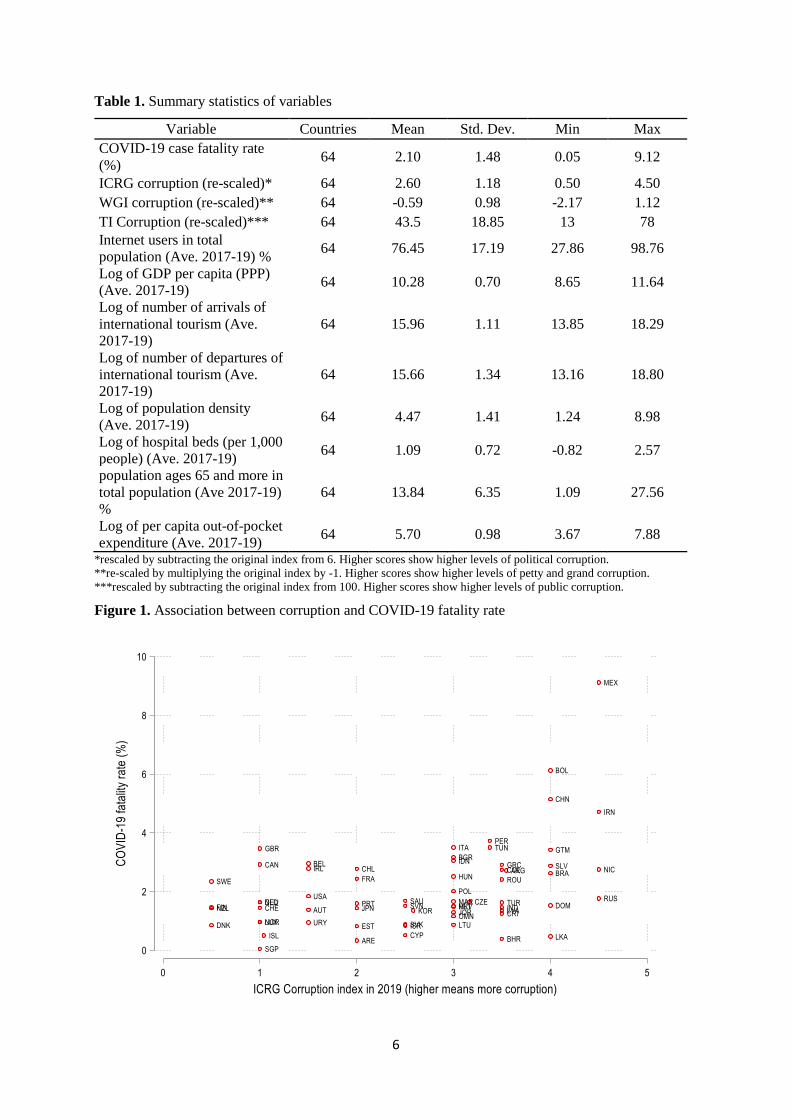
Figure 1 illustrates that by the end of 2020, countries with higher levels of corruption tend to suffer more
COVID-19 fatality rates than countries with lower levels of corruption level in 2019. There is a positive
and significant correlation of 0.41 between corruption and fatality rates. Certainly, other factors may
account for cross-country variation of COVID-19 fatalities besides corruption. Thus, we now turn to the
regression analyses where we control for an array of factors associated with COVID-19 fatalities and
also confront potential biases induced by omitted variables.
6
Table 1. Summary statistics of variables
Variable Countries Mean Std. Dev. Min Max
COVID-19 case fatality rate
(%) 64 2.10 1.48 0.05 9.12
ICRG corruption (re-scaled)* 64 2.60 1.18 0.50 4.50
WGI corruption (re-scaled)** 64 -0.59 0.98 -2.17 1.12
TI Corruption (re-scaled)*** 64 43.5 18.85 13 78
Internet users in total
population (Ave. 2017-19) % 64 76.45 17.19 27.86 98.76
Log of GDP per capita (PPP)
(Ave. 2017-19) 64 10.28 0.70 8.65 11.64
Log of number of arrivals of
international tourism (Ave.
2017-19)
64 15.96 1.11 13.85 18.29
Log of number of departures of
international tourism (Ave.
2017-19)
64 15.66 1.34 13.16 18.80
Log of population density
(Ave. 2017-19) 64 4.47 1.41 1.24 8.98
Log of hospital beds (per 1,000
people) (Ave. 2017-19) 64 1.09 0.72 -0.82 2.57
population ages 65 and more in
total population (Ave 2017-19)
%
64 13.84 6.35 1.09 27.56
Log of per capita out-of-pocket
expenditure (Ave. 2017-19) 64 5.70 0.98 3.67 7.88
*rescaled by subtracting the original index from 6. Higher scores show higher levels of political corruption.
**re-scaled by multiplying the original index by -1. Higher scores show higher levels of petty and grand corruption.
***rescaled by subtracting the original index from 100. Higher scores show higher levels of public corruption.
Figure 1. Association between corruption and COVID-19 fatality rate
7
3. Regression results
The results indicate a strong connection between the public corruption in 2019 and the level of COVID-
19 case fatality rates by the end of 2020. Table 2 summarizes the cross-sectional results for nine
regressions, where the key explanatory variable is the level of corruption. Models differ from each other
based on inclusion or exclusion of other determinants of COVID-19 fatality rates and continental
dummies. The included countries in all models are the same as in the most general specification (Model
8), which controls for all other variables besides corruption.
Model 1 does not control for any other determinants of COVID-19 fatalities except for the level of
corruption. It shows a positive correlation between the level of corruption in 2019 and the level of
fatalities in 2020. An increase of corruption by one unit (which ranges from 0.5 to 5.5) is associated
with an increase of COVID-19 case fatality rates by the end of 2020 by 0.5 percentage point (which
varies from 0.5% to 9% and a standard deviation of 1.1 percent). Thus, the effect of corruption is almost
half a standard deviation increase in COVID-19 fatality rate. The effect is statistically significant at 99%
confidence intervals. Model 2 acknowledges that COVID-19 fatalities may not only be explained by
corruption, and thus controls for other factors such as socio-economic and demographic determinants as
well as continental dummies. The adjusted R-squared increases from 15% in Model 1 to 41% in Model
2, showing a much higher predictive power of Model 2. More important is the robustness of estimated
coefficient of corruption in Model 2. The effect is even higher in this model, adjusting for other drivers
of COVID-19 fatality rates. It shows that a unit increase in corruption level is associated with 0.7
percentage point increase in case fatality rate, ceteris paribus. This is close to 60% of a standard deviation
in case fatality rate. Among control variables, only two drivers show statistically significant effects
which are also in line with our theoretical expectations. Countries with higher openness for international
tourism over the years of 2017-2019 are associated with higher levels of case fatality rates. This finding
is also shown by Farzanegan et al. (2020a). In addition, countries with larger numbers of hospital beds
(normalized by population) over the last couple of years show lower records of case fatality rates in
2020. This is also seen in other studies such as Farzanegan (2020). Models 3 to 7 replace corruption
with other institutional dimensions. For example, in Model 3, we control for risk of internal conflict
(higher values mean lower risk of internal conflict). It shows no statistically significant association with
case fatality rate. Model 4 checks government stability while Models 5, 6 and 7 examine the association
between law and order, democracy, bureaucratic quality. None of these aspects of governance, which
are taken from ICRG (2020), show a significant effect on case fatality rate. In Model 8, we include all
these other dimensions besides corruption, holding other variables constant. Model 8 shows the only
institutional dimensions which survive this horse competition is corruption, with estimated effect of 0.7,
which is statistically significant at 95% confidence interval. In Model 9, we exclude insignificant
variables in Model 8, keeping only two robust control variables, such as outbound tourism, hospital beds
and continental dummies. Model 9 also shows higher explanatory power as the adjusted R-squared in
8
Model 9 is 43% which is higher than in Model 8 (37%). Model 9 shows that a one unit increase in
corruption level is associated with an increase in case fatality rates by 0.6 percentage points, controlling
for tourism, hospital beds and continental dummies.
To put the estimated effect of corruption in perspective, if Iran reduced its corruption levels from 4.5
in 2019 to the level of Saudi Arabia’s (2.5), then based on Model 9, its expected level of COVID-19
fatality rates would be 1.2 percentage points lower in 2020 (0.6*2). This is a significant reduction, as
the standard deviation of case fatality rate in our sample is 1.4 percent.
To what extent are our results sensitive to alternative measures of corruption?
We examine this issue by using two other indicators of corruption: Control of Corruption from the World
Governance Indicators (WGI) and the Corruption Perception Index from Transparency International
(TI). We used 2019 data for both indexes in our analysis. WGI’s Control of Corruption, which ranges
from -2.17 (New Zealand) to 1.12 (Nicaragua) in our sample consider both petty and grand corruption
and “capture” of the state by private interests. We have re-scaled this index by multiplying it by -1.
Higher scores show higher degrees of corruption. The Transparency International index is an aggregate
reading of perceived public corruption (i.e. administrative and political) according to businesspeople
and country experts. It ranges from 0 (the highest level of perceived corruption) to 100 (the lowest level
of perceived corruption). We have also re-scaled this index by subtracting it from 100. In our sample of
64 countries, the re-scaled index of TI corruption ranges from 13 (Denmark & New Zealand) to 78
(Nicaragua). The correlation between the ICRG corruption index and the WGI and TI indexes is more
than 0.95. Tables A1 and A2 in the Appendix show the results using the WGI and TI indexes of
corruption, respectively.
Model 4 in Table A1, which has the highest explanatory power, shows that countries one unit higher in
the WGI corruption index (which ranges from -2.17 to 1.2 in our sample and a standard deviation of
0.98), are associated with 0.75 percentage point increase in COVID-19 case fatality rates. This is a
significant association, considering the average case fatality rate of 2% and standard deviation of 1.5%
in our sample. The estimated effect of corruption is also highly statistically significant.
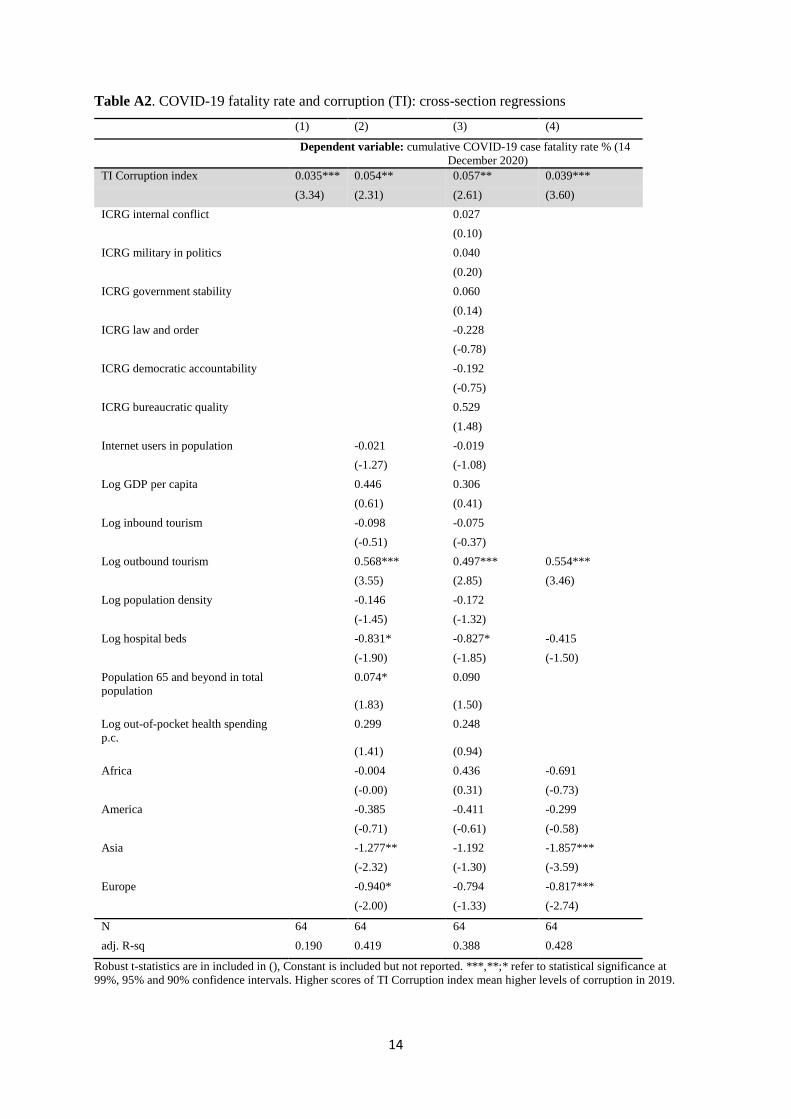
Using the TI Corruption Perceptions Index, which focuses more on public corruption, Model 4 in Table
A2 shows that countries 10 units higher in the index (ranging 13 to 78 in our sample and a standard
deviation of 18.8) are associated with approximately 0.4 percentage point higher case fatality rates in
2020. A shift from low to high corruption levels based on the interquartile range for TI corruption (33
in our sample) is associated with an increase of COVID-19 case fatality rates of 1.3 percentage points,
which is a substantial effect. The estimated effect is statistically significant at 99% confidence interval.

9
Table 2. COVID-19 fatality rate and ICRG corruption: cross-section regressions (1) (2) (3) (4) (5) (6) (7) (8) (9)
Dependent variable: cumulative COVID-19 case fatality rate % (14 December 2020)
ICRG Corruption 2019 0.521*** 0.734** 0.781** 0.609***
(2.85) (2.04) (2.25) (3.41)
ICRG Internal conflict 2019 0.016 0.055
(0.08) (0.21)
ICRG government stability 2019
0.291 0.016
(0.83) (0.04)
ICRG rule of law 2019 -0.336 -0.207
(-0.92) (-0.70)
ICRG democracy 2019 -0.255 -0.175
(-1.20) (-0.67)
ICRG bureaucratic quality
2019
-0.029 0.539
(-0.10) (1.43)
ICRG military in politics
2019
-0.017
(-0.07)
Internet users (% of
population) 2017-19
-0.023 -0.023 -0.021 -0.024 -0.023 -0.024 -0.019
(-1.32) (-1.29) (-1.17) (-1.37) (-1.27) (-1.38) (-1.09)
Log GDP per capita 2017-19 0.305 -0.684 -0.813 -0.355 -0.695 -0.654 0.151
(0.43) (-1.07) (-1.29) (-0.50) (-1.11) (-1.13) (0.20)
Log inbound tourism 2017-19 -0.061 0.150 0.095 0.093 0.073 0.139 -0.023
(-0.34) (0.58) (0.46) (0.44) (0.29) (0.55) (-0.12)
Log outbound tourism 2017-
19
0.571*** 0.435*** 0.443*** 0.434*** 0.465*** 0.439*** 0.505*** 0.570***
(3.56) (2.73) (2.96) (2.94) (3.30) (3.02) (2.94) (3.55)
Log population density 2017-
19
-0.154 -0.095 -0.119 -0.145 -0.068 -0.095 -0.177
(-1.49) (-1.00) (-1.22) (-1.29) (-0.73) (-1.00) (-1.33)
Log hospital beds 2017-19 -0.868* -0.208 -0.244 -0.430 -0.355 -0.225 -0.859* -0.537*
(-1.73) (-0.56) (-0.66) (-1.00) (-1.14) (-0.66) (-1.77) (-1.84)
Population 65 plus (% total
population) 2017-19
0.057 -0.026 -0.002 0.001 0.014 -0.023 0.067
(1.35) (-0.56) (-0.06) (0.02) (0.33) (-0.51) (1.18)
Log out of pocket per capital health spending 2017-19
0.282 0.229 0.213 0.343 0.308 0.243 0.207
(1.31) (1.04) (0.86) (1.19) (1.27) (0.85) (0.78)
Africa -0.025 -0.236 -0.264 0.268 -0.269 -0.269 0.410 -0.637
(-0.03) (-0.20) (-0.26) (0.22) (-0.24) (-0.25) (0.31) (-0.72)
America -0.425 0.391 0.353 0.009 0.250 0.364 -0.448 -0.375
(-0.72) (0.73) (0.67) (0.02) (0.50) (0.63) (-0.65) (-0.69)
Asia -1.451** -0.916 -1.146 -0.737 -1.251* -0.945* -1.342 -2.007***
(-2.34) (-1.39) (-1.62) (-1.46) (-1.91) (-1.68) (-1.42) (-3.45)
Europe -0.901* 0.021 -0.084 -0.065 -0.131 -0.015 -0.699 -0.886**
(-1.79) (0.06) (-0.28) (-0.24) (-0.51) (-0.05) (-1.15) (-2.62)
Countries 64 64 64 64 64 64 64 64 64
adj. R-sq. 0.159 0.414 0.313 0.330 0.337 0.338 0.313 0.376 0.429
Robust t-statistics are in included in (), Constant is included but not reported. ***,**;* refer to statistical significance at 99%, 95% and 90% confidence intervals.
10
4. Conclusion
This paper examines the association between COVID-19 case fatality rates and the level of public
corruption, controlling for other relevant determinants of fatality rates. We used a pure cross-sectional
data and ordinary least squares. The cross-sectional results tell a robust story:
The levels of public corruption in 2019 is positively associated with COVID-19 case fatality rates by
the end of 2020; specifically the large, positive link between corruption and COVID-19 fatality rates is
not due to potential biases generated by omitted variables, or reverse causation. We also show that
among different dimensions of governance, corruption which imposes the most significant human costs
across the countries. The paper's findings are consistent with the view that anticorruption reforms that
strengthen efficient allocation of government budgets in public goods and services, such as health and
education, and promoting transparency and the flow of information can boost the level of resistance
against pandemics such as COVID-19, significantly reducing the human costs. Future research may also
investigate how COVID-19 outbreak has provided new opportunities for rent-seeking and corruption
across countries.
References
Anderson, C. J., Tverdova, Y.V., 2003. Corruption, political allegiances, and attitudes toward
government in contemporary democracies. American Journal of Political Science 47, 91–109.
Blagosklonny, M. V., 2020. From causes of aging to death from COVID-19. Aging 12, 10004–21
Buehn, A., Farzanegan, M.R., 2012. Smuggling around the world: Evidence from structural equation
modeling. Applied Economics 44 (23), 3047-3064.
Carozzi, F., Provenzano, S., Roth, S., 2020. Urban density and COVID-19. IZA DP No. 13440, Bonn.
Dincer, O., Teoman, O., 2019. Does corruption kill? Evidence from half a century infant mortality data.
Social Science & Medicine 232, 332-339.
Dowd, J.B. et al., 2020. Demographic science aids in understanding the spread and fatality rates of
COVID-19. Proceedings of the National Academy of Sciences 117, 9696–98.
Ehrlich, I. Lui, F. T. 1999. Bureaucratic corruption and endogenous growth. Journal of Political
Economy 107, S270–93.
Farzanegan, M. R., Feizi, M., Gholipour, H. 2020b. Globalization and outbreak of COVID-19: an
empirical analysis. MAGKS Joint Discussion Paper Series No. 18-2020, Marburg.
Farzanegan, M. R., Gholipour, H. F., Feizi, M., Nunkoo, R., & Andargoli, A. E., 2020a. International
tourism and outbreak of coronavirus (COVID-19): A cross-country analysis. Journal of Travel
Research. https://doi.org/10.1177%2F0047287520931593
11
Farzanegan, M.R., 2009. Illegal trade in the Iranian economy: Evidence from structural equation model.
European Journal of Political Economy 25(4), 489-507.
Farzanegan, M.R., 2020. Ageing society and SARS-CoV-2 mortality: does the healthcare absorptive
capacity matter? Journal of Risk and Financial Management 13 (11), 277.
Farzanegan, M.R., Thum, M., 2020. Does oil rents dependency reduce the quality of education?
Empirical Economics 58, 1863–1911.
Fisman, R., Miguel, E., 2007. Corruption, norms, and legal enforcement: evidence from diplomatic
parking tickets. Journal of Political Economy 115, 1020–1048.
Fisman, R., Wie, S.-J., 2009. The smuggling of art, and the art of smuggling: uncovering the illicit
trade in cultural property and antiques. American Economic Journal: Applied Economics 1,
82–96.
Gee, J., Button, B., 2015. The financial cost of health care fraud 2015: what data from around the
world shows. London: PKF Littlejohn LLP.
Golinelli, D., et al., 2017. Health expenditure and all-cause mortality in the ‘galaxy’ of Italian regional
healthcare systems: A 15-year panel data analysis. Applied Health Economics and Health
Policy 15, 773–783.
Gupta, S., Davoodi, H., Alonso-Terme, R., 2002. Does corruption affect income inequality and poverty?
Economics of Governance 3, 23–45.
Gupta, S., Davoodi, H., Tiongson, E., 2001. Corruption and the provision of health care and education
services. In: Jain, A.K. (Ed.), The Political Economy of Corruption. Routledge, London, 111-
141.
Gupta, S., de Mello, L., Sharan, R., 2001. Corruption and military spending. European Journal of
Political Economy 17, 749-777.
Hamidi, S., Sabouri, S., Ewing, R., 2020. Does density aggravate the COVID-19 pandemic?, Journal
of the American Planning Association 86, 495-509.
Hindricks, J., Keen, M., Muthoo, A., 1999. Corruption, extortion and evasion. Journal of Public
Economics 74, 395–430.
ICRG, 2020. The International Country Risk Guide. The PRS Group.
Kawachi, I., Takao, S., Subramanian, S.V. (Eds.), 2013. Global Perspectives on Social Capital and
Health. Springer, New York.
Khan, J.R., et al., 2020. Healthcare capacity, health expenditure, and civil society as predictors of
COVID-19 case fatalities: A global analysis. Front Public Health 8, 1–10.

12
Mallapaty, S. 2020. What the cruise-ship outbreaks reveal about COVID-19. Nature 580, 18.
Mauro, P., 1998. Corruption and the composition of government expenditure. Journal of Public
Economics 69, 263–279.
Palloni, A., Walter, S., 2020. COVID-19: How can we explain differences in mortality? Berlin: Policy
Insights, Population Europe Secretariat.
Richter, L. K. 2003. International tourism and its global public health consequences. Journal of Travel
Research 41, 340–347.
Shleifer, A., Vishny, R. W., 1993. Corruption. Quarterly Journal of Economics 108, 599–617.
Sommer, J.M., 2020. Corruption and health expenditure: a cross-national analysis on infant and child
mortality. The European Journal of Development Research 32, 690–717.
Treisman, D., 2000. The causes of corruption: a cross-national study. Journal of Public Economics 76,
399–457.
World Bank, 2020. World Development Indicators, Washington DC.
World Health Organization, 2020. Potential corruption risks in health financing arrangements: report
of a rapid review of the literature. World Health Organization.
https://apps.who.int/iris/handle/10665/331819.

13
Table A1. COVID-19 fatality rate and corruption (WGI): cross-section regressions
(1) (2) (3) (4)
Dependent variable: cumulative COVID-19 case fatality rate % (14 December
2020)
WGI corruption 0.686*** 1.045** 1.129*** 0.758***
(3.39) (2.46) (2.76) (3.79)
ICRG internal conflict
0.022
(0.08)
ICRG military in politics
0.019
(0.09)
ICRG government stability
0.037
(0.09)
ICRG law and order
-0.189
(-0.64)
ICRG democratic accountability
-0.198
(-0.79)
ICRG bureaucratic quality
0.551
(1.53)
Internet users in population
-0.017 -0.014
(-1.06) (-0.83)
Log GDP per capita
0.459 0.307
(0.62) (0.41)
Log inbound tourism
-0.157 -0.135
(-0.81) (-0.65)
Log outbound tourism
0.606*** 0.537*** 0.551***
(3.76) (3.07) (3.49)
Log population density
-0.118 -0.136
(-1.26) (-1.13)
Log hospital beds
-0.833* -0.814* -0.411
(-1.93) (-1.85) (-1.48)
Population 65 and beyond in total
population
0.077* 0.092
(1.86) (1.57)
Log out-of-pocket health spending
p.c.
0.230 0.157
(1.14) (0.61)
Africa
0.013 0.372 -0.712
(0.01) (0.26) (-0.74)
America
-0.292 -0.288 -0.268
(-0.57) (-0.46) (-0.55)
Asia
-1.333** -1.286 -1.876***
(-2.40) (-1.42) (-3.71)
Europe
-0.957** -0.812 -0.827***
(-2.09) (-1.43) (-2.82)
N 64 64 64 64
adj. R-sq 0.194 0.424 0.392 0.438
Robust t-statistics are in included in (), Constant is included but not reported. ***,**;* refer to statistical significance at 99%,
95% and 90% confidence intervals. Higher scores of WGI corruption mean higher levels of corruption in 2019.
14
Table A2. COVID-19 fatality rate and corruption (TI): cross-section regressions
(1) (2) (3) (4)
Dependent variable: cumulative COVID-19 case fatality rate % (14
December 2020)
TI Corruption index 0.035*** 0.054** 0.057** 0.039***
(3.34) (2.31) (2.61) (3.60)
ICRG internal conflict
0.027
(0.10)
ICRG military in politics
0.040
(0.20)
ICRG government stability
0.060
(0.14)
ICRG law and order
-0.228
(-0.78)
ICRG democratic accountability
-0.192
(-0.75)
ICRG bureaucratic quality
0.529
(1.48)
Internet users in population
-0.021 -0.019
(-1.27) (-1.08)
Log GDP per capita
0.446 0.306
(0.61) (0.41)
Log inbound tourism
-0.098 -0.075
(-0.51) (-0.37)
Log outbound tourism
0.568*** 0.497*** 0.554***
(3.55) (2.85) (3.46)
Log population density
-0.146 -0.172
(-1.45) (-1.32)
Log hospital beds
-0.831* -0.827* -0.415
(-1.90) (-1.85) (-1.50)
Population 65 and beyond in total
population
0.074* 0.090
(1.83) (1.50)
Log out-of-pocket health spending
p.c.
0.299 0.248
(1.41) (0.94)
Africa
-0.004 0.436 -0.691
(-0.00) (0.31) (-0.73)
America
-0.385 -0.411 -0.299
(-0.71) (-0.61) (-0.58)
Asia
-1.277** -1.192 -1.857***
(-2.32) (-1.30) (-3.59)
Europe
-0.940* -0.794 -0.817***
(-2.00) (-1.33) (-2.74)
N 64 64 64 64
adj. R-sq 0.190 0.419 0.388 0.428
Robust t-statistics are in included in (), Constant is included but not reported. ***,**;* refer to statistical significance at
99%, 95% and 90% confidence intervals. Higher scores of TI Corruption index mean higher levels of corruption in 2019.