Module5 - Functional Performance of Ball Milling
85
The Metcom Engineering and Management System for Plant Grinding Operations MODULE #5: FUNCTIONAL PERFOMANCE OF BALL MILLING Metcom Consulting, LLC © 1992 GPD Co. Ltd. / Metcom Consulting LLC (Rev.4, 2005)
-
Upload
cristian-dosque-munoz -
Category
Documents
-
view
16 -
download
6
description
functional perfomance of ball milling
Transcript of Module5 - Functional Performance of Ball Milling
The Metcom Engineering and ManagementSystem for Plant Grinding Operations
MODULE #5:
FUNCTIONALPERFOMANCEOF BALL MILLING
Metcom Consulting, LLC© 1992 GPD Co. Ltd. / Metcom Consulting LLC (Rev.4, 2005)
FUNCTIONAL PERFORMANCE OF BALL MILLING
© 1992 GPD Co. Ltd. / Metcom Consulting LLC (Rev.4, 2005)
i
page
Objectives 1Introduction 2
PART I - The Elements of the Functional Performance Equation 11
Circuit output of fines 11Classification system efficiency 16Effective mill power draw 24Ball mill specific grinding rate 29Ball mill grinding efficiency 33Progress Review 1 39
PART II - Functional Performance Analysis 43
Using the functional performance equation 43Functional performance efficiency 47Relating design and operating variables to grinding,
classification, and circuit efficiencies 53Relative accuracy of functional performance parameters 62Progress Review 2 67
Closing word 77References 78
Appendix A - Selection of the grindability value to use in functional performance analysis 79
Glossary 81
TABLE OF CONTENTS
FUNCTIONAL PERFORMANCE OF BALL MILLING
© 1992 GPD Co. Ltd. / Metcom Consulting LLC (Rev.4, 2005)
ii
LIST OF FIGURES AND TABLES page
Figure 1. Elements contributing to the output of a ball mill circuit. 4
Figure 2. The "effective mill power draw". 6
Figure 3. The ball mill "specific grinding rate". 8
Figure 4. The output of a ball mill circuit. 9
Figure 5. The development of the functional performance equation. 38
Table 1. Estimates of the accuracy of functional performance parameters. 63
FUNCTIONAL PERFORMANCE OF BALL MILLING 1
© 1992 GPD Co. Ltd. / Metcom Consulting LLC (Rev.4, 2005)
OBJECTIVES
In this module, you will learn how to characterize the performance ofball mill circuits. Specifically, after completing this module, you willbe able to:
• List and describe the four elements of the functional performanceequation for ball mill circuits.
• Define and calculate the classification system efficiency of a ballmill circuit.
• Define and calculate the grinding efficiency of the ball mill in a ballmill circuit.
• Relate overall ball mill circuit output and circuit efficiency to specificdesign and operating variables.
• Compare sets of circuit survey data in terms of the elements of thefunctional performance equation.
The prerequisite module to this one is entitled: "Work Index Effi-ciency". You will need a calculator to complete this module. Theestimated time for completion is two and a half hours including aProgress Review at the end of each Part.
In this module, most terms and expressions included in the Glossarywill be identified as such in the Introduction.
FUNCTIONAL PERFORMANCE OF BALL MILLING 2
© 1992 GPD Co. Ltd. / Metcom Consulting LLC (Rev.4, 2005)
INTRODUCTION
In the prerequisite module entitled "Work Index Efficiency", you havelearned about work index analysis* to define overall grinding circuitefficiency. In rod milling, you can use work index analysis to relatedesign and operating variables to overall circuit efficiency. However,you cannot use work index analysis for the same purpose on ball millcircuits because of the complex interactions between grinding andclassification.
In this module, you will learn how to relate design and operatingvariables to ball mill circuit efficiency through functionalperformance analysis*.
This Introduction is seven pages long. It may seem rather lengthy;however, we feel that it is necessary to give you an overview of whatfunctional performance analysis is about so that you can more effi-ciently cover the contents of this module.
Let’s get started...
FUNCTIONAL PERFORMANCE OF BALL MILLING 3
© 1992 GPD Co. Ltd. / Metcom Consulting LLC (Rev.4, 2005)
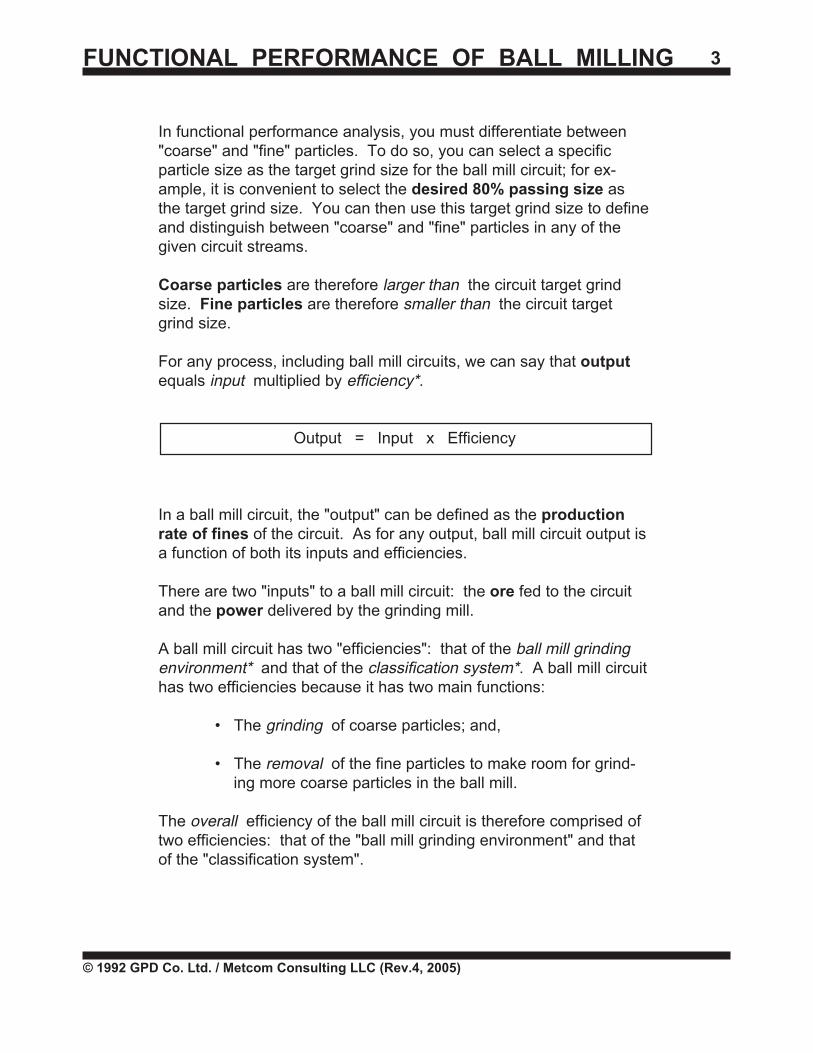
In functional performance analysis, you must differentiate between"coarse" and "fine" particles. To do so, you can select a specificparticle size as the target grind size for the ball mill circuit; for ex-ample, it is convenient to select the desired 80% passing size asthe target grind size. You can then use this target grind size to defineand distinguish between "coarse" and "fine" particles in any of thegiven circuit streams.
Coarse particles are therefore larger than the circuit target grindsize. Fine particles are therefore smaller than the circuit targetgrind size.
For any process, including ball mill circuits, we can say that outputequals input multiplied by efficiency*.
Output = Input x Efficiency
In a ball mill circuit, the "output" can be defined as the productionrate of fines of the circuit. As for any output, ball mill circuit output isa function of both its inputs and efficiencies.
There are two "inputs" to a ball mill circuit: the ore fed to the circuitand the power delivered by the grinding mill.
A ball mill circuit has two "efficiencies": that of the ball mill grindingenvironment* and that of the classification system*. A ball mill circuithas two efficiencies because it has two main functions:
• The grinding of coarse particles; and,
• The removal of the fine particles to make room for grind-ing more coarse particles in the ball mill.
The overall efficiency of the ball mill circuit is therefore comprised oftwo efficiencies: that of the "ball mill grinding environment" and thatof the "classification system".
FUNCTIONAL PERFORMANCE OF BALL MILLING 4
© 1992 GPD Co. Ltd. / Metcom Consulting LLC (Rev.4, 2005)
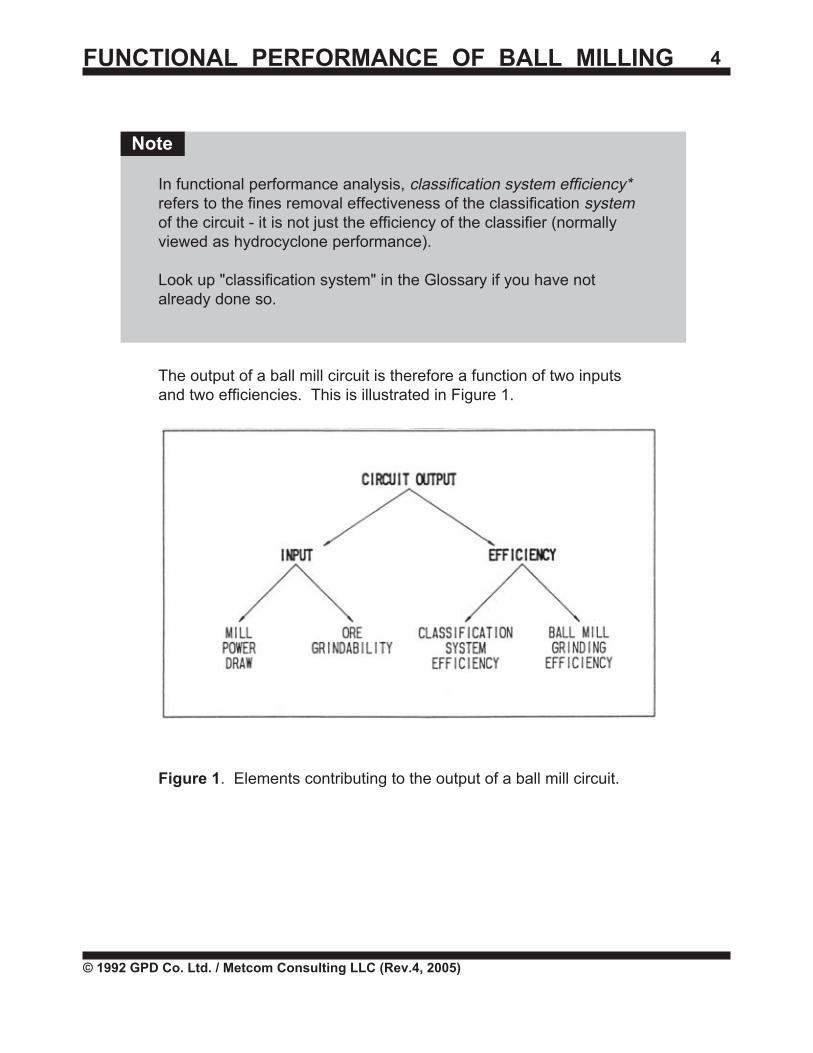
In functional performance analysis, classification system efficiency*refers to the fines removal effectiveness of the classification systemof the circuit - it is not just the efficiency of the classifier (normallyviewed as hydrocyclone performance).
Look up "classification system" in the Glossary if you have notalready done so.
The output of a ball mill circuit is therefore a function of two inputsand two efficiencies. This is illustrated in Figure 1.
Figure
Figure 1. Elements contributing to the output of a ball mill circuit.
Note
FUNCTIONAL PERFORMANCE OF BALL MILLING 5
© 1992 GPD Co. Ltd. / Metcom Consulting LLC (Rev.4, 2005)
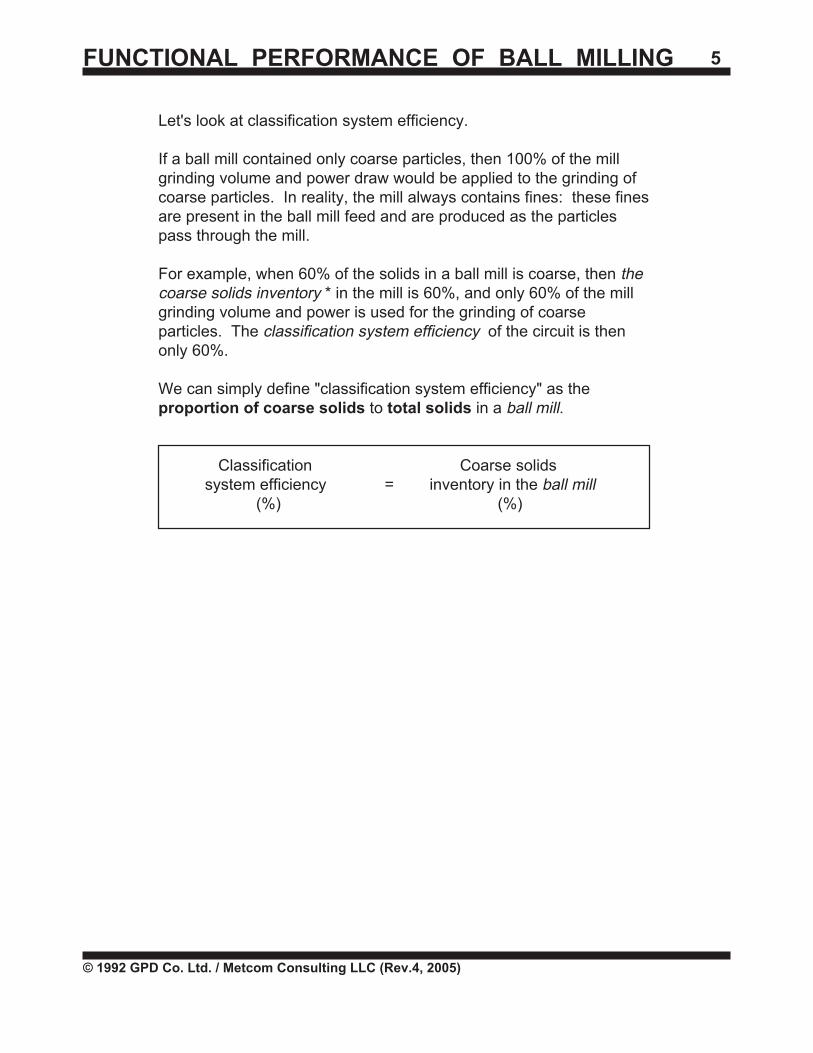
Let's look at classification system efficiency.
If a ball mill contained only coarse particles, then 100% of the millgrinding volume and power draw would be applied to the grinding ofcoarse particles. In reality, the mill always contains fines: these finesare present in the ball mill feed and are produced as the particlespass through the mill.
For example, when 60% of the solids in a ball mill is coarse, then thecoarse solids inventory * in the mill is 60%, and only 60% of the millgrinding volume and power is used for the grinding of coarseparticles. The classification system efficiency of the circuit is thenonly 60%.
We can simply define "classification system efficiency" as theproportion of coarse solids to total solids in a ball mill.
Classification Coarse solids system efficiency = inventory in the ball mill
(%) (%)
FUNCTIONAL PERFORMANCE OF BALL MILLING 6
© 1992 GPD Co. Ltd. / Metcom Consulting LLC (Rev.4, 2005)
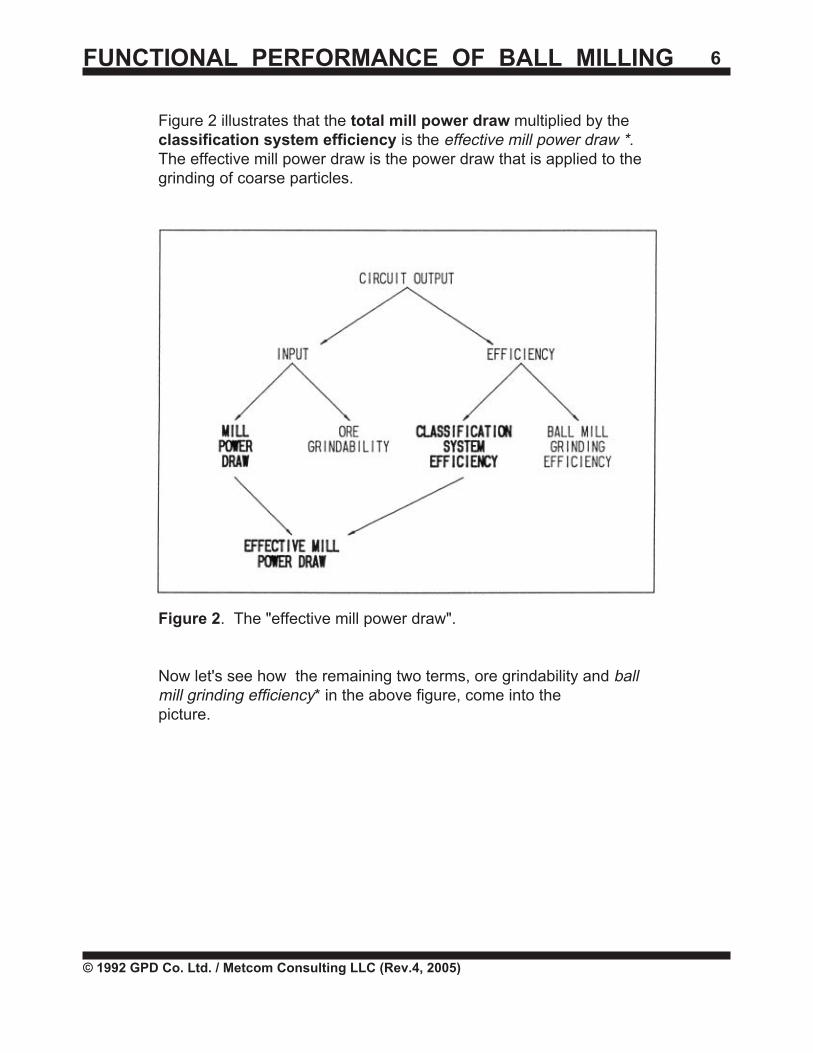
Figure 2 illustrates that the total mill power draw multiplied by theclassification system efficiency is the effective mill power draw *.The effective mill power draw is the power draw that is applied to thegrinding of coarse particles.
Figure 2. The "effective mill power draw".
Now let's see how the remaining two terms, ore grindability and ballmill grinding efficiency* in the above figure, come into thepicture.
FUNCTIONAL PERFORMANCE OF BALL MILLING 7
© 1992 GPD Co. Ltd. / Metcom Consulting LLC (Rev.4, 2005)
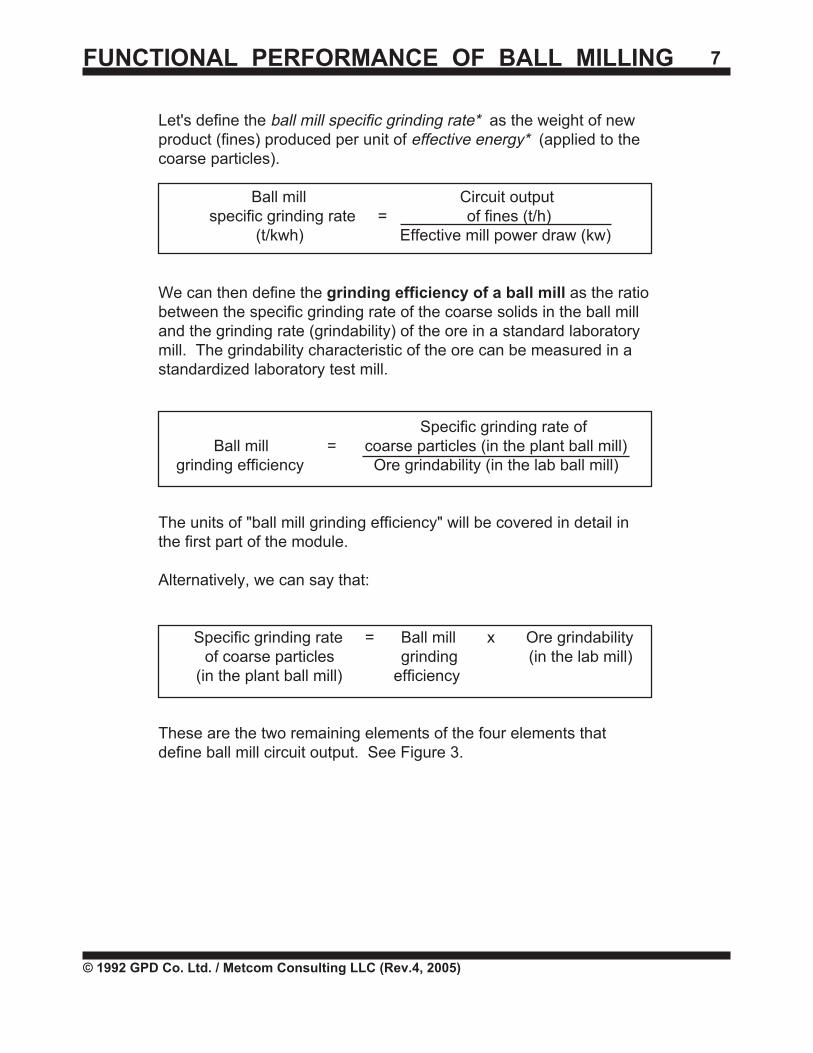
Let's define the ball mill specific grinding rate* as the weight of newproduct (fines) produced per unit of effective energy* (applied to thecoarse particles).
Ball mill Circuit output specific grinding rate = of fines (t/h)
(t/kwh) Effective mill power draw (kw)
We can then define the grinding efficiency of a ball mill as the ratiobetween the specific grinding rate of the coarse solids in the ball milland the grinding rate (grindability) of the ore in a standard laboratorymill. The grindability characteristic of the ore can be measured in astandardized laboratory test mill.
Specific grinding rate of Ball mill = coarse particles (in the plant ball mill)
grinding efficiency Ore grindability (in the lab ball mill)
The units of "ball mill grinding efficiency" will be covered in detail inthe first part of the module.
Alternatively, we can say that:
Specific grinding rate = Ball mill x Ore grindability of coarse particles grinding (in the lab mill)(in the plant ball mill) efficiency
These are the two remaining elements of the four elements thatdefine ball mill circuit output. See Figure 3.
FUNCTIONAL PERFORMANCE OF BALL MILLING 8
© 1992 GPD Co. Ltd. / Metcom Consulting LLC (Rev.4, 2005)
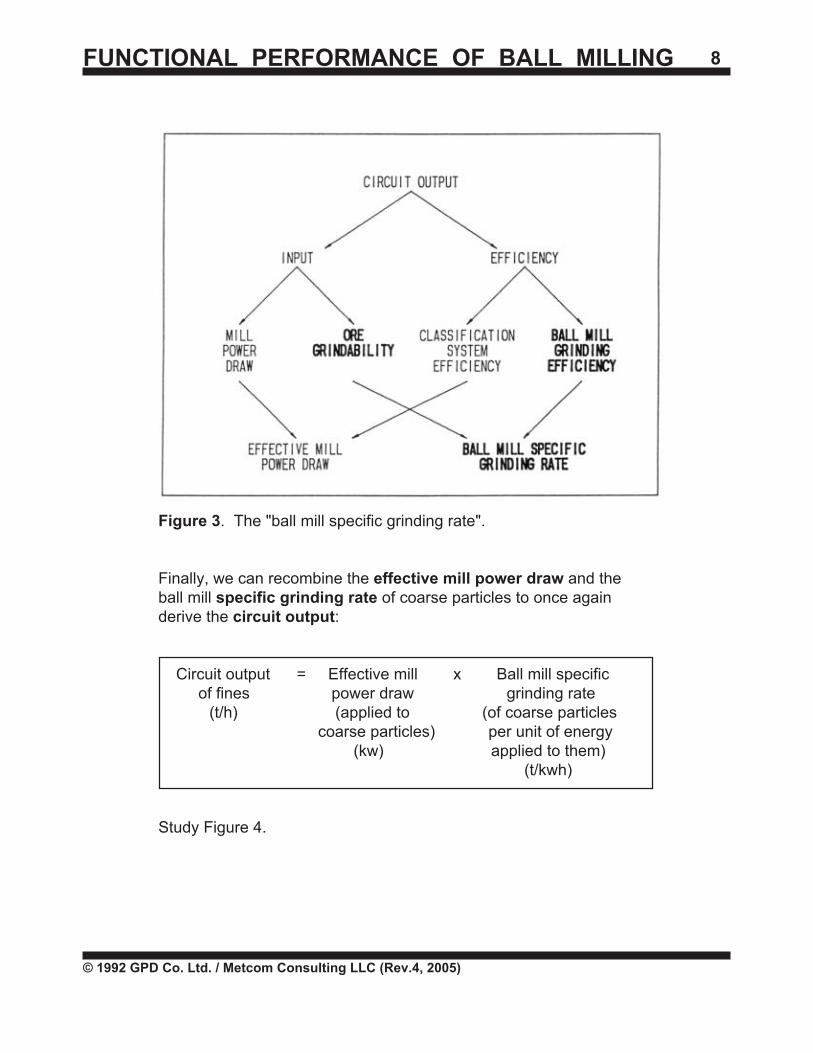
Figure 3. The "ball mill specific grinding rate".
Finally, we can recombine the effective mill power draw and theball mill specific grinding rate of coarse particles to once againderive the circuit output:
Circuit output = Effective mill x Ball mill specific of fines power draw grinding rate
(t/h) (applied to (of coarse particles coarse particles) per unit of energy (kw) applied to them)
(t/kwh)
Study Figure 4.
FUNCTIONAL PERFORMANCE OF BALL MILLING 9
© 1992 GPD Co. Ltd. / Metcom Consulting LLC (Rev.4, 2005)
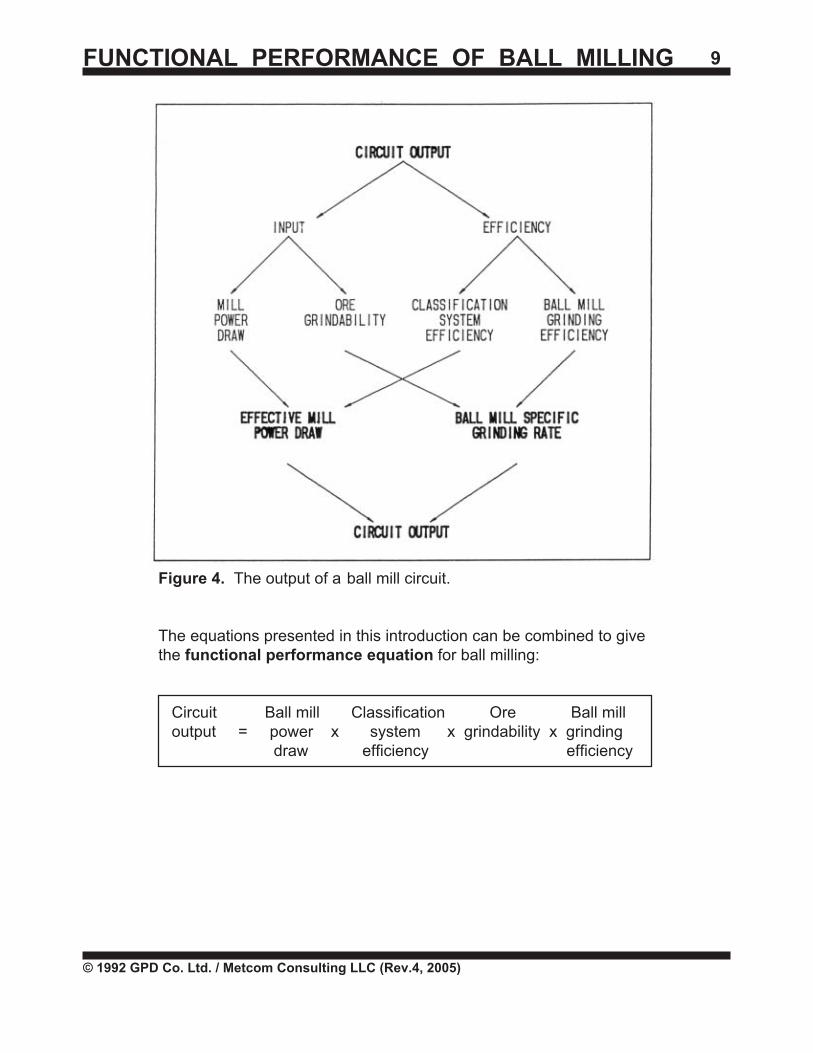
Figure 4. The output of a ball mill circuit.
The equations presented in this introduction can be combined to givethe functional performance equation for ball milling:
Circuit Ball mill Classification Ore Ball mill output = power x system x grindability x grinding
draw efficiency efficiency
FUNCTIONAL PERFORMANCE OF BALL MILLING 10
© 1992 GPD Co. Ltd. / Metcom Consulting LLC (Rev.4, 2005)
This concludes the introduction to functional performance analysis forball mill circuits.
You may wish to take a break at this time. In Part I of this module,you will learn how to evaluate or use each element of the functionalperformance equation from the operating data and laboratory resultsfrom circuit surveys.
FUNCTIONAL PERFORMANCE OF BALL MILLING 11
© 1992 GPD Co. Ltd. / Metcom Consulting LLC (Rev.4, 2005)
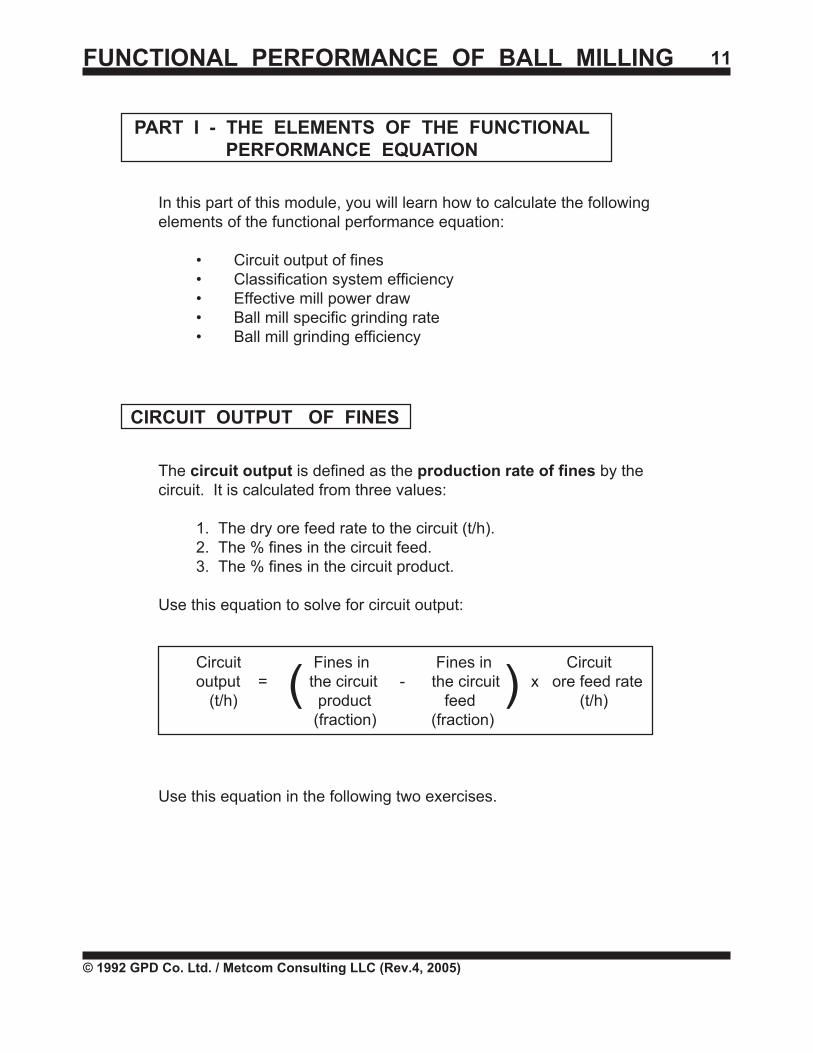
In this part of this module, you will learn how to calculate the followingelements of the functional performance equation:
• Circuit output of fines• Classification system efficiency• Effective mill power draw• Ball mill specific grinding rate• Ball mill grinding efficiency
The circuit output is defined as the production rate of fines by thecircuit. It is calculated from three values:
1. The dry ore feed rate to the circuit (t/h).2. The % fines in the circuit feed.3. The % fines in the circuit product.
Use this equation to solve for circuit output:
Circuit Fines in Fines in Circuitoutput = the circuit - the circuit x ore feed rate (t/h) product feed (t/h)
(fraction) (fraction)
Use this equation in the following two exercises.
PART I - THE ELEMENTS OF THE FUNCTIONAL PERFORMANCE EQUATION
CIRCUIT OUTPUT OF FINES
( )
FUNCTIONAL PERFORMANCE OF BALL MILLING 12
© 1992 GPD Co. Ltd. / Metcom Consulting LLC (Rev.4, 2005)
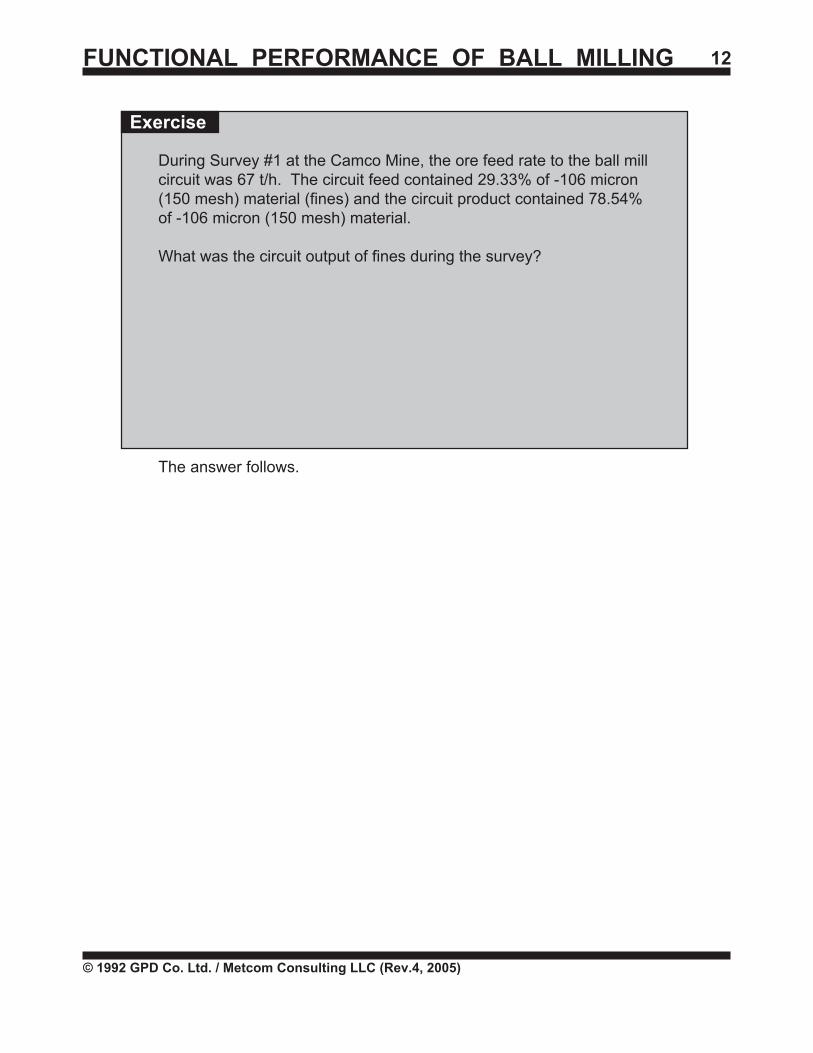
During Survey #1 at the Camco Mine, the ore feed rate to the ball millcircuit was 67 t/h. The circuit feed contained 29.33% of -106 micron(150 mesh) material (fines) and the circuit product contained 78.54%of -106 micron (150 mesh) material.
What was the circuit output of fines during the survey?
The answer follows.
Exercise
FUNCTIONAL PERFORMANCE OF BALL MILLING 13
© 1992 GPD Co. Ltd. / Metcom Consulting LLC (Rev.4, 2005)
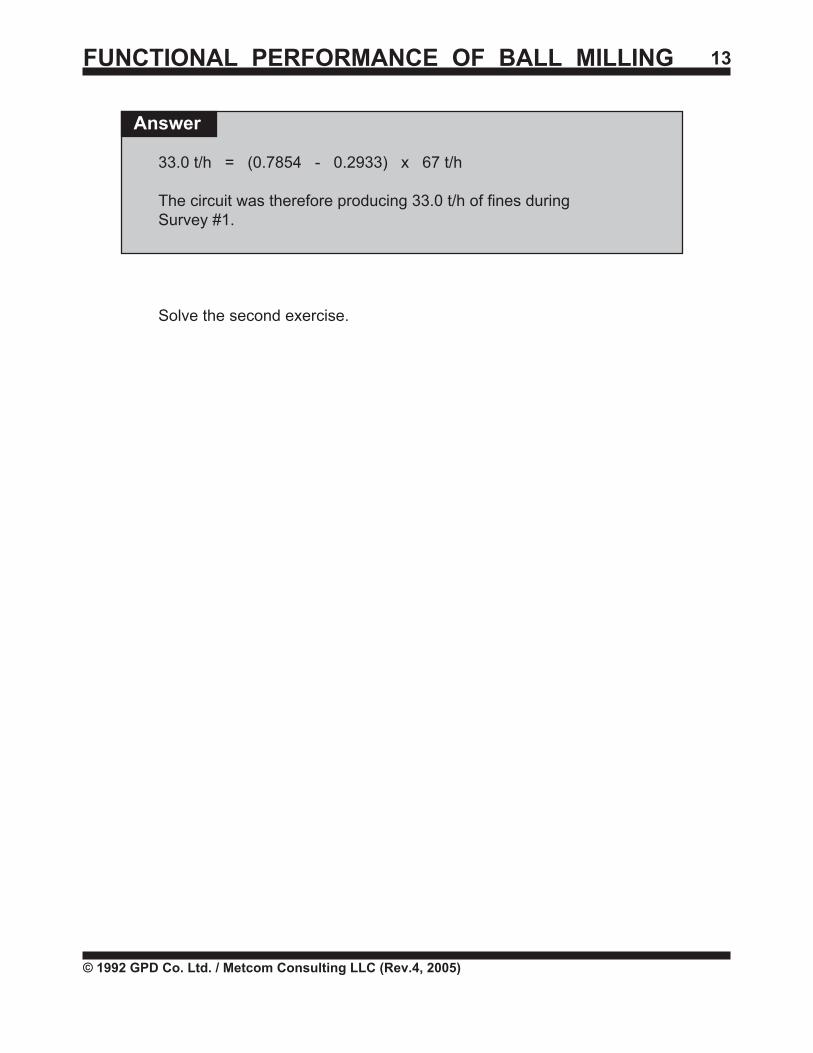
33.0 t/h = (0.7854 - 0.2933) x 67 t/h
The circuit was therefore producing 33.0 t/h of fines duringSurvey #1.
Solve the second exercise.
Answer
FUNCTIONAL PERFORMANCE OF BALL MILLING 14
© 1992 GPD Co. Ltd. / Metcom Consulting LLC (Rev.4, 2005)
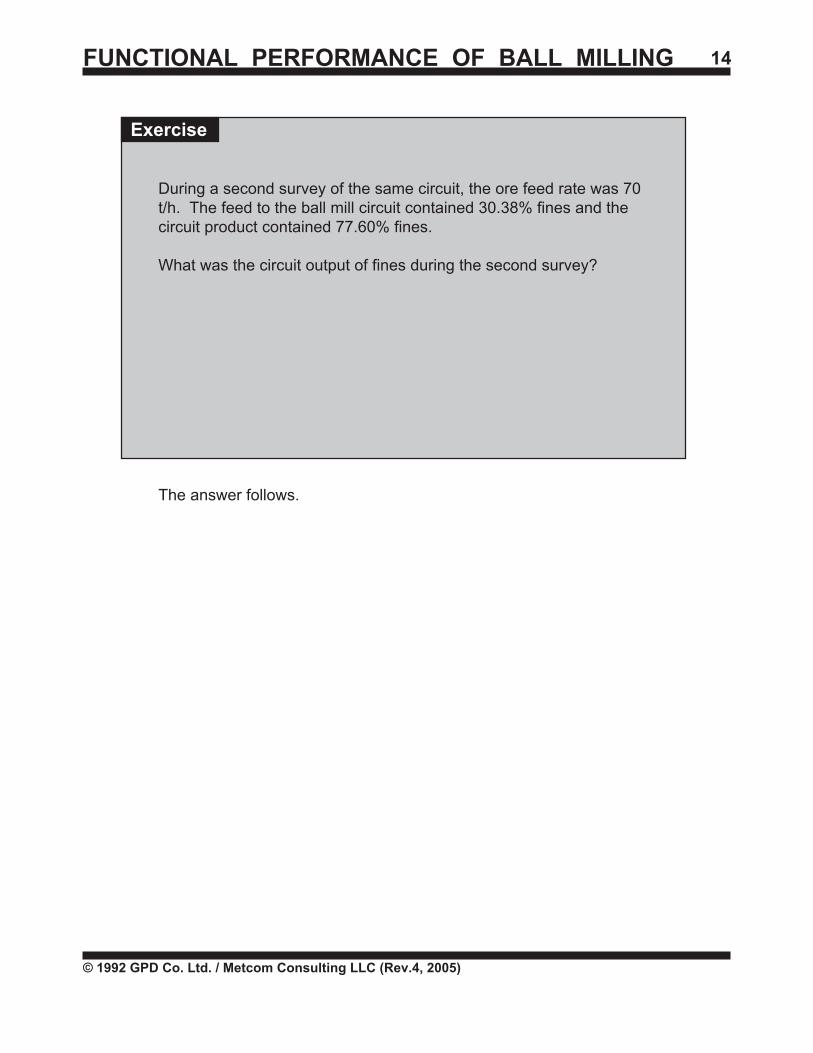
During a second survey of the same circuit, the ore feed rate was 70t/h. The feed to the ball mill circuit contained 30.38% fines and thecircuit product contained 77.60% fines.
What was the circuit output of fines during the second survey?
The answer follows.
Exercise
FUNCTIONAL PERFORMANCE OF BALL MILLING 15
© 1992 GPD Co. Ltd. / Metcom Consulting LLC (Rev.4, 2005)
Answer
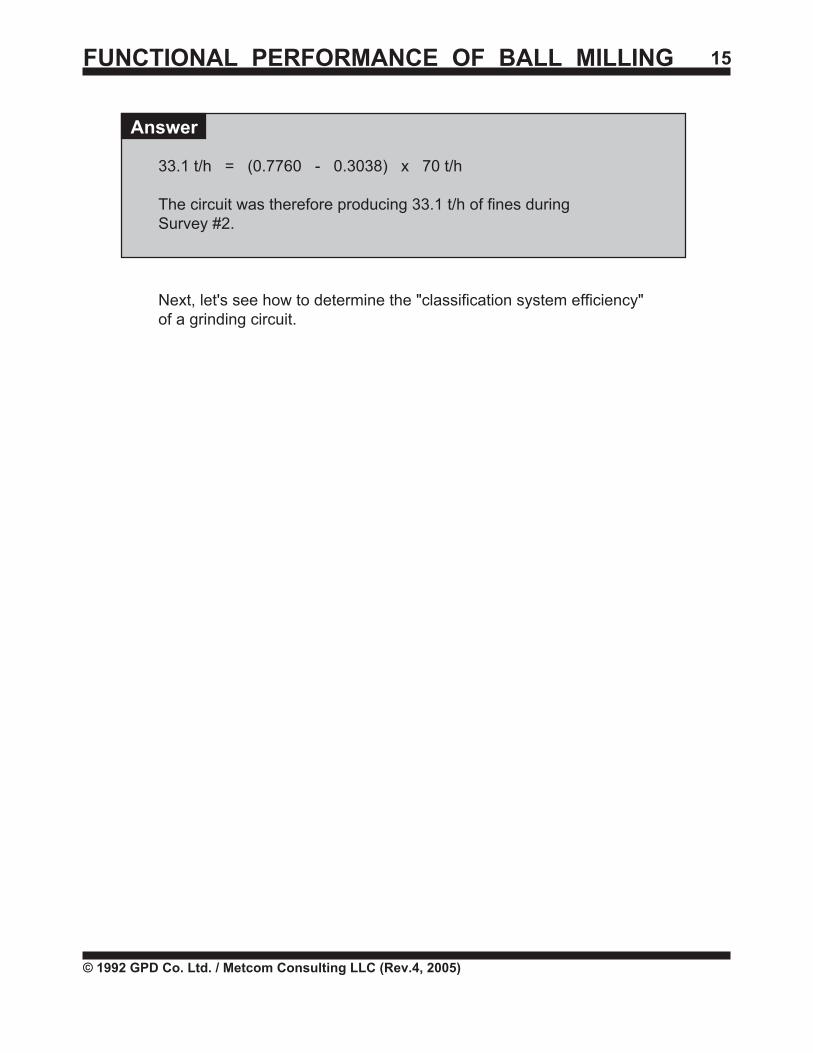
33.1 t/h = (0.7760 - 0.3038) x 70 t/h
The circuit was therefore producing 33.1 t/h of fines duringSurvey #2.
Next, let's see how to determine the "classification system efficiency"of a grinding circuit.
FUNCTIONAL PERFORMANCE OF BALL MILLING 16
© 1992 GPD Co. Ltd. / Metcom Consulting LLC (Rev.4, 2005)
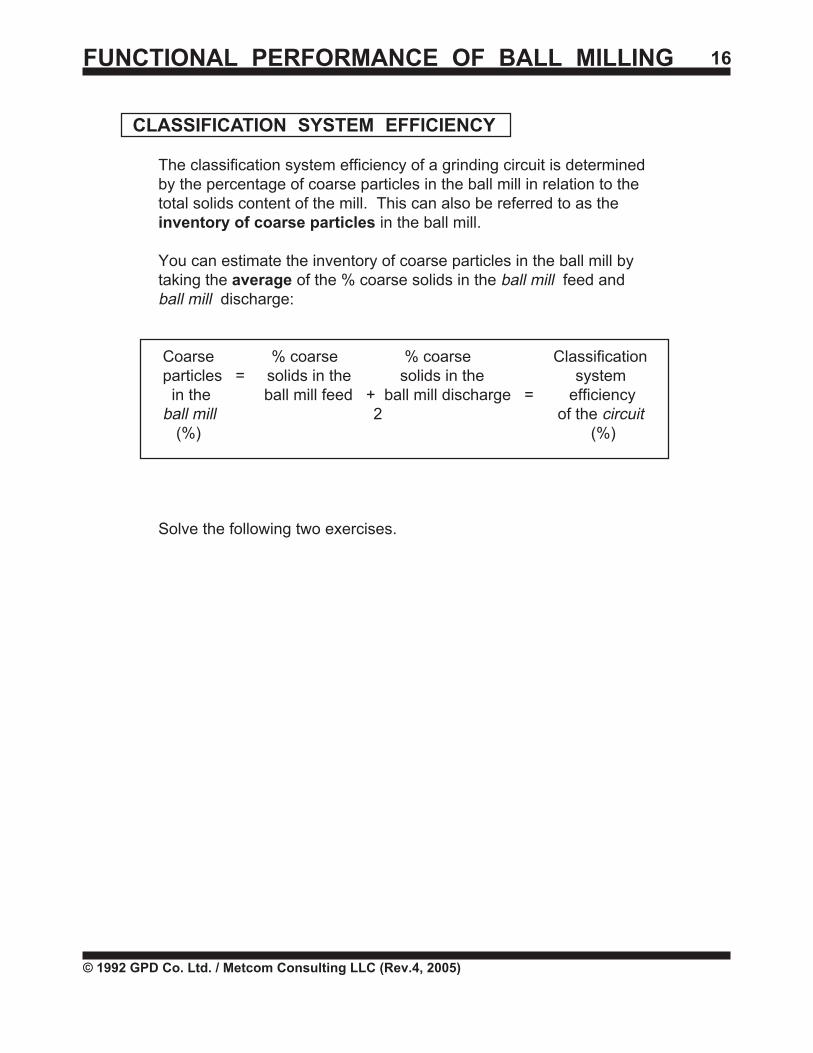
CLASSIFICATION SYSTEM EFFICIENCY
The classification system efficiency of a grinding circuit is determinedby the percentage of coarse particles in the ball mill in relation to thetotal solids content of the mill. This can also be referred to as theinventory of coarse particles in the ball mill.
You can estimate the inventory of coarse particles in the ball mill bytaking the average of the % coarse solids in the ball mill feed andball mill discharge:
Coarse % coarse % coarse Classification particles = solids in the solids in the system in the ball mill feed + ball mill discharge = efficiency ball mill 2 of the circuit (%) (%)
Solve the following two exercises.
omar
FUNCTIONAL PERFORMANCE OF BALL MILLING 17
© 1992 GPD Co. Ltd. / Metcom Consulting LLC (Rev.4, 2005)
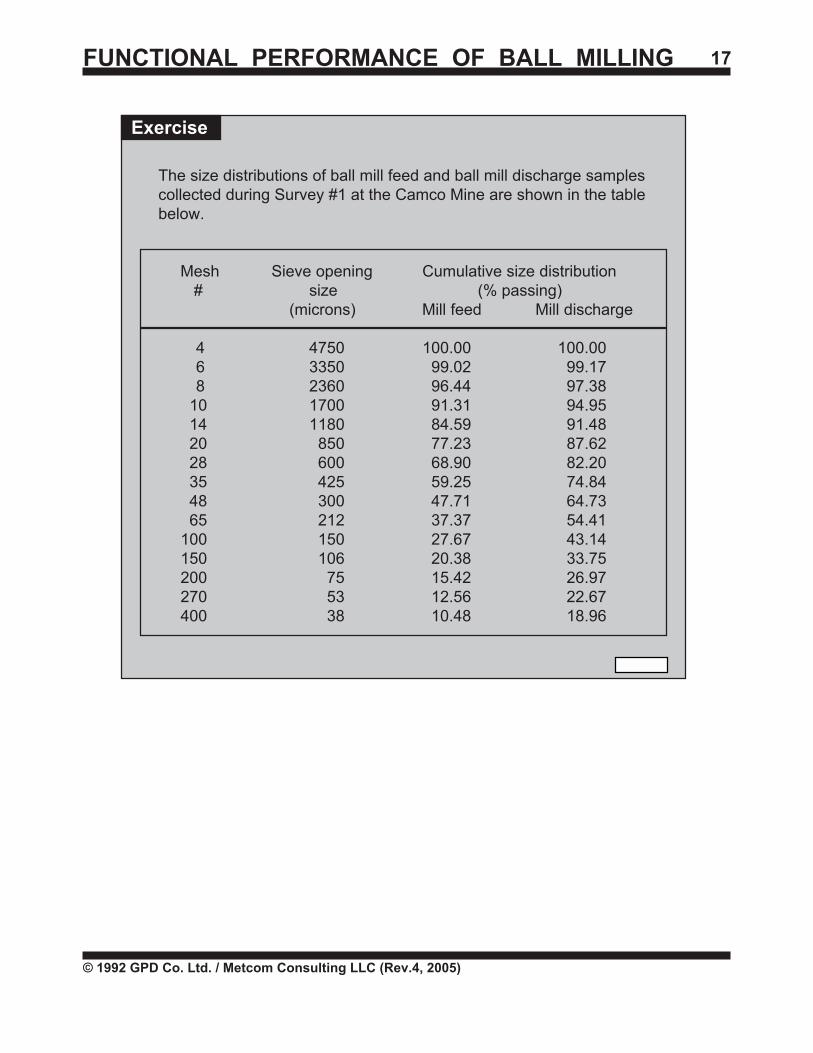
The size distributions of ball mill feed and ball mill discharge samplescollected during Survey #1 at the Camco Mine are shown in the tablebelow.
Mesh Sieve opening Cumulative size distribution # size (% passing)
(microns) Mill feed Mill discharge
4 4750 100.00 100.006 3350 99.02 99.178 2360 96.44 97.38
10 1700 91.31 94.95 14 1180 84.59 91.48 20 850 77.23 87.62 28 600 68.90 82.20 35 425 59.25 74.84 48 300 47.71 64.73 65 212 37.37 54.41 100 150 27.67 43.14 150 106 20.38 33.75 200 75 15.42 26.97 270 53 12.56 22.67 400 38 10.48 18.96
Exercise
FUNCTIONAL PERFORMANCE OF BALL MILLING 18
© 1992 GPD Co. Ltd. / Metcom Consulting LLC (Rev.4, 2005)
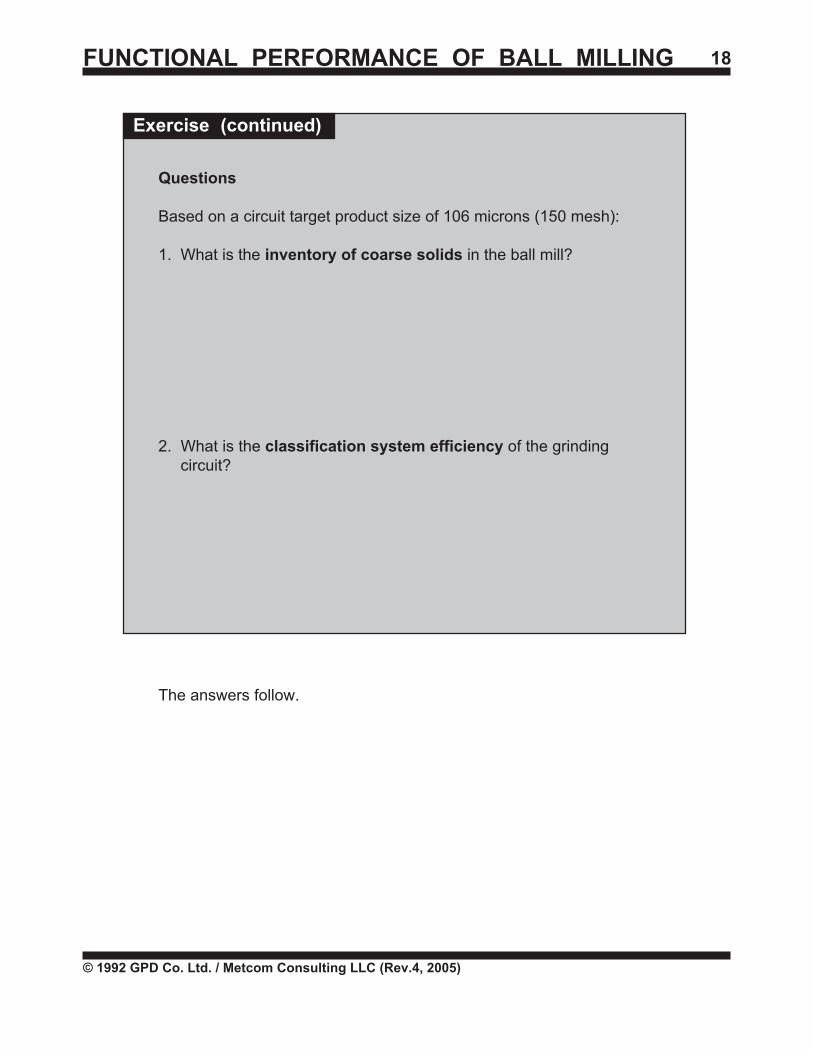
Questions
Based on a circuit target product size of 106 microns (150 mesh):
1. What is the inventory of coarse solids in the ball mill?
2. What is the classification system efficiency of the grinding circuit?
The answers follow.
Exercise (continued)
FUNCTIONAL PERFORMANCE OF BALL MILLING 19
© 1992 GPD Co. Ltd. / Metcom Consulting LLC (Rev.4, 2005)
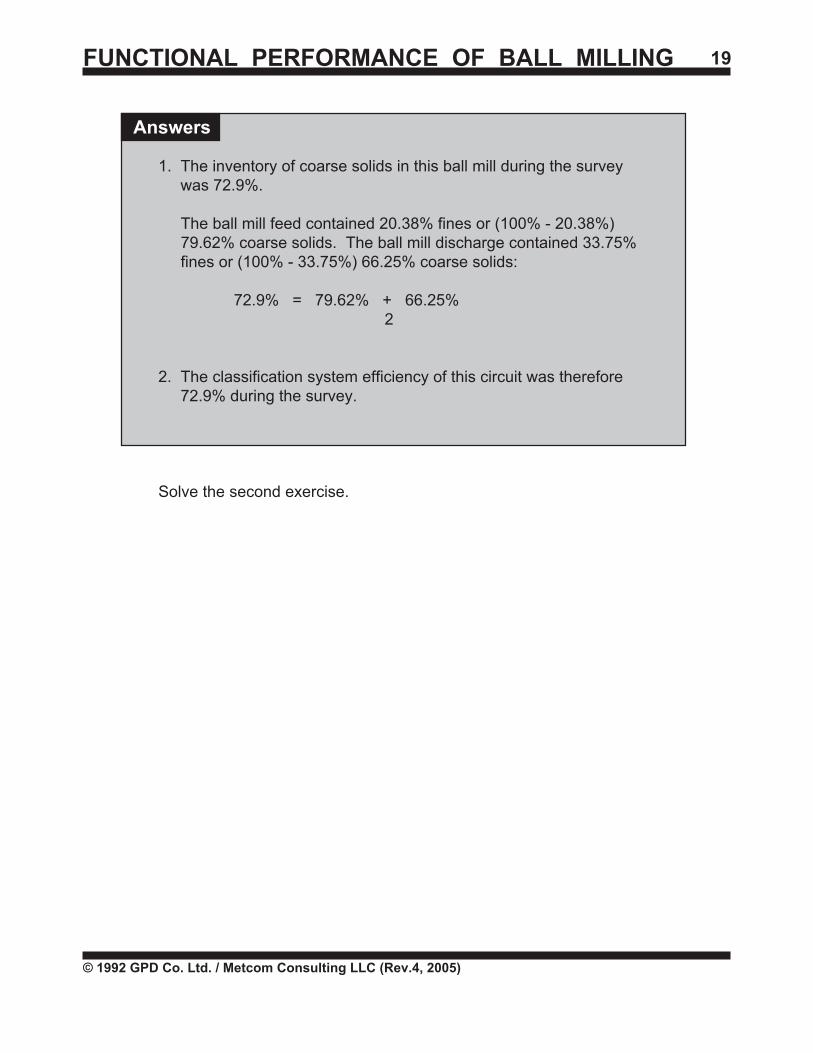
Answers
1. The inventory of coarse solids in this ball mill during the survey was 72.9%.
The ball mill feed contained 20.38% fines or (100% - 20.38%) 79.62% coarse solids. The ball mill discharge contained 33.75% fines or (100% - 33.75%) 66.25% coarse solids:
72.9% = 79.62% + 66.25%2
2. The classification system efficiency of this circuit was therefore 72.9% during the survey.
Solve the second exercise.
FUNCTIONAL PERFORMANCE OF BALL MILLING 20
© 1992 GPD Co. Ltd. / Metcom Consulting LLC (Rev.4, 2005)
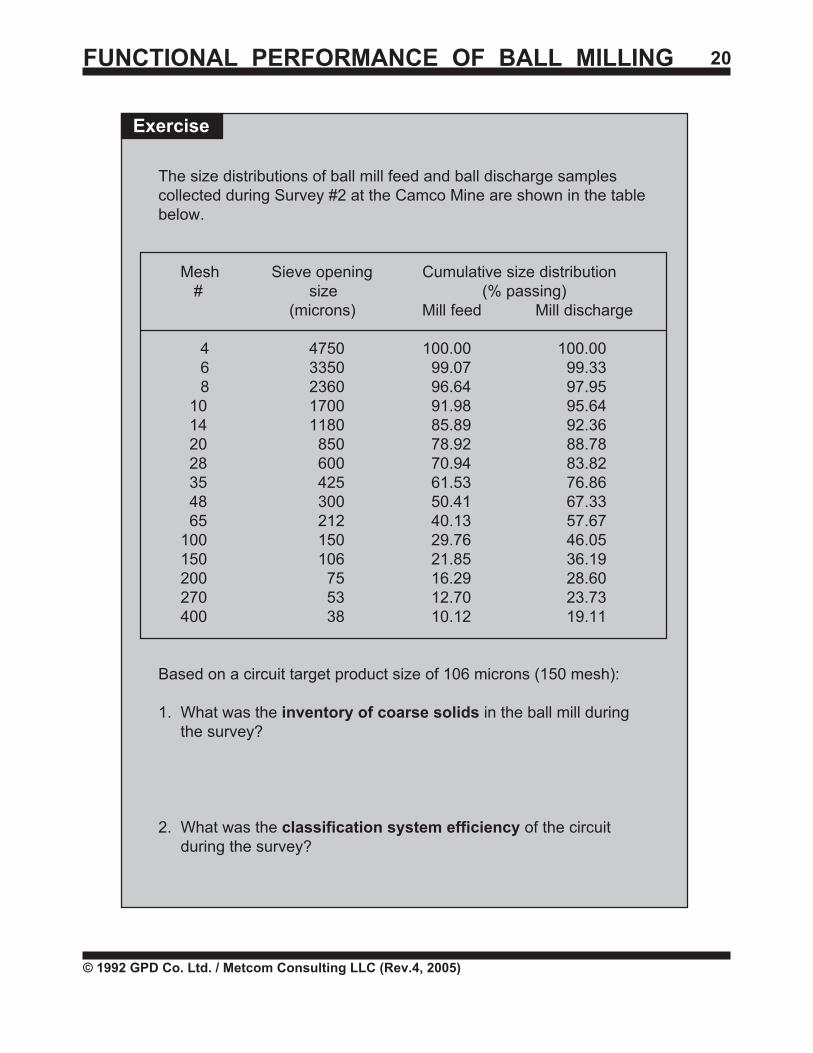
The size distributions of ball mill feed and ball discharge samplescollected during Survey #2 at the Camco Mine are shown in the tablebelow.
Mesh Sieve opening Cumulative size distribution # size (% passing)
(microns) Mill feed Mill discharge
4 4750 100.00 100.00 6 3350 99.07 99.33 8 2360 96.64 97.95
10 1700 91.98 95.64 14 1180 85.89 92.36 20 850 78.92 88.78 28 600 70.94 83.82 35 425 61.53 76.86 48 300 50.41 67.33 65 212 40.13 57.67 100 150 29.76 46.05 150 106 21.85 36.19 200 75 16.29 28.60 270 53 12.70 23.73 400 38 10.12 19.11
Based on a circuit target product size of 106 microns (150 mesh):
1. What was the inventory of coarse solids in the ball mill during the survey?
2. What was the classification system efficiency of the circuit during the survey?
Exercise
FUNCTIONAL PERFORMANCE OF BALL MILLING 21
© 1992 GPD Co. Ltd. / Metcom Consulting LLC (Rev.4, 2005)
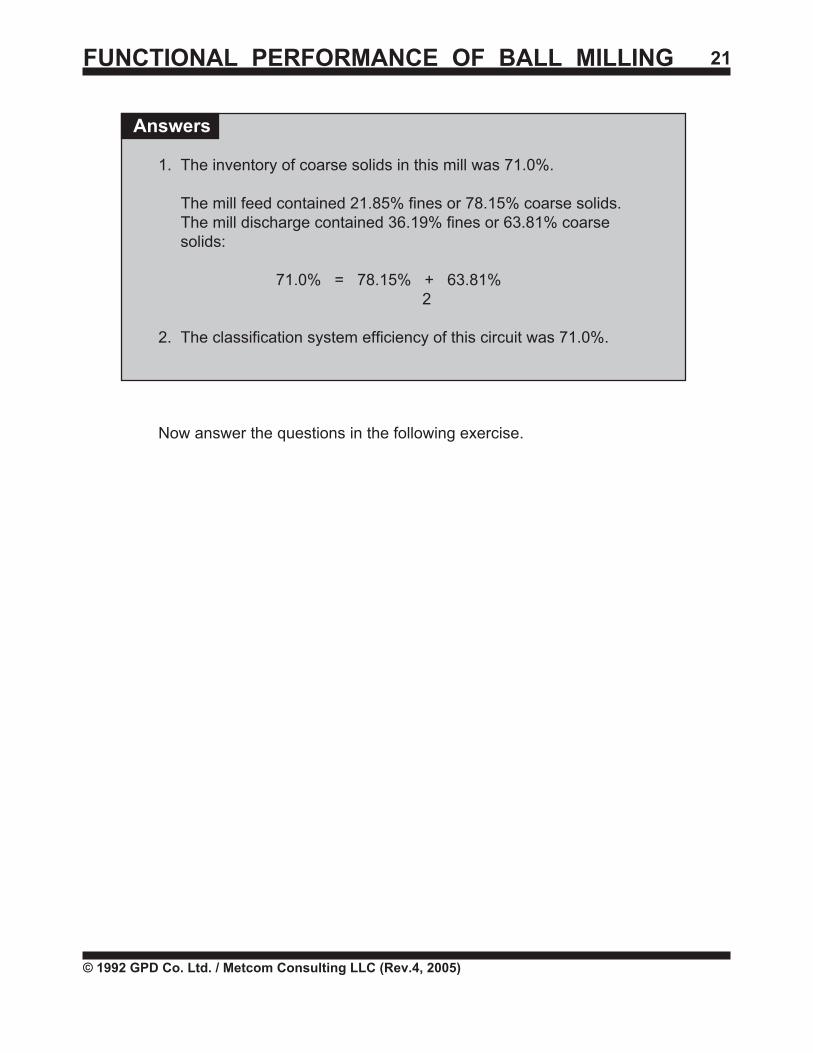
Answers
1. The inventory of coarse solids in this mill was 71.0%.
The mill feed contained 21.85% fines or 78.15% coarse solids. The mill discharge contained 36.19% fines or 63.81% coarse solids:
71.0% = 78.15% + 63.81%2
2. The classification system efficiency of this circuit was 71.0%.
Now answer the questions in the following exercise.
FUNCTIONAL PERFORMANCE OF BALL MILLING 22
© 1992 GPD Co. Ltd. / Metcom Consulting LLC (Rev.4, 2005)
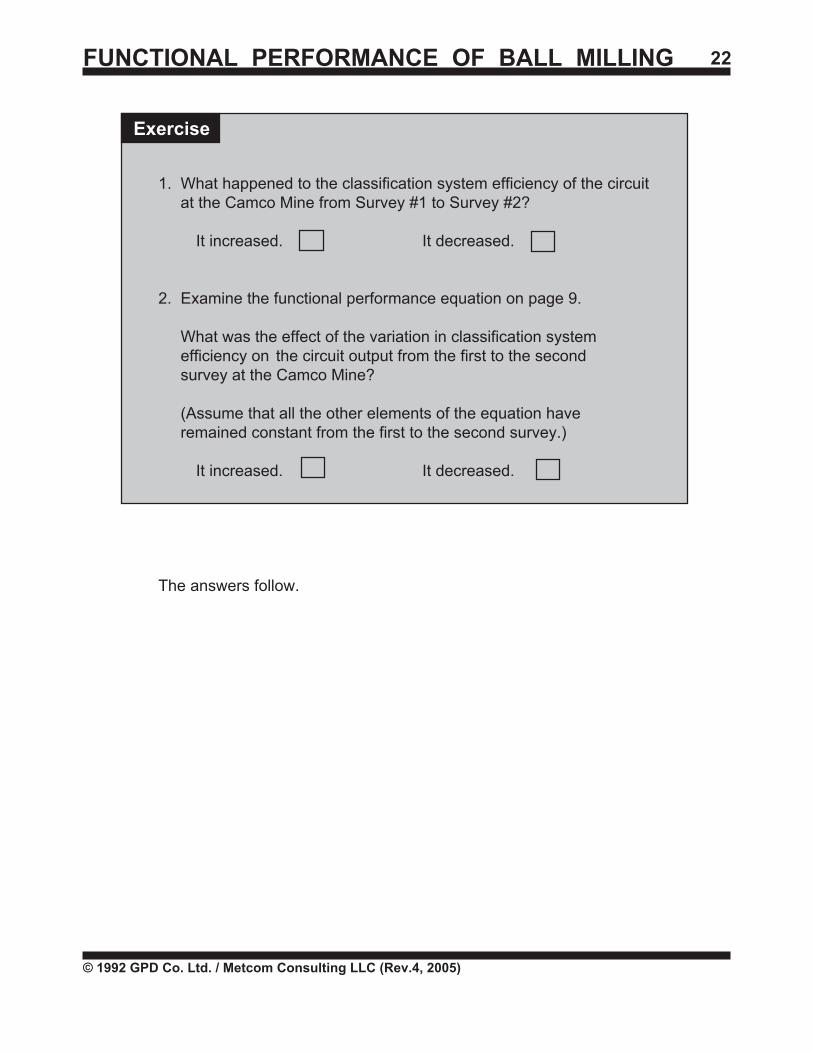
1. What happened to the classification system efficiency of the circuit at the Camco Mine from Survey #1 to Survey #2?
It increased. It decreased.
2. Examine the functional performance equation on page 9.
What was the effect of the variation in classification system efficiency on the circuit output from the first to the second survey at the Camco Mine?
(Assume that all the other elements of the equation have remained constant from the first to the second survey.)
It increased. It decreased.
The answers follow.
Exercise
FUNCTIONAL PERFORMANCE OF BALL MILLING 23
© 1992 GPD Co. Ltd. / Metcom Consulting LLC (Rev.4, 2005)
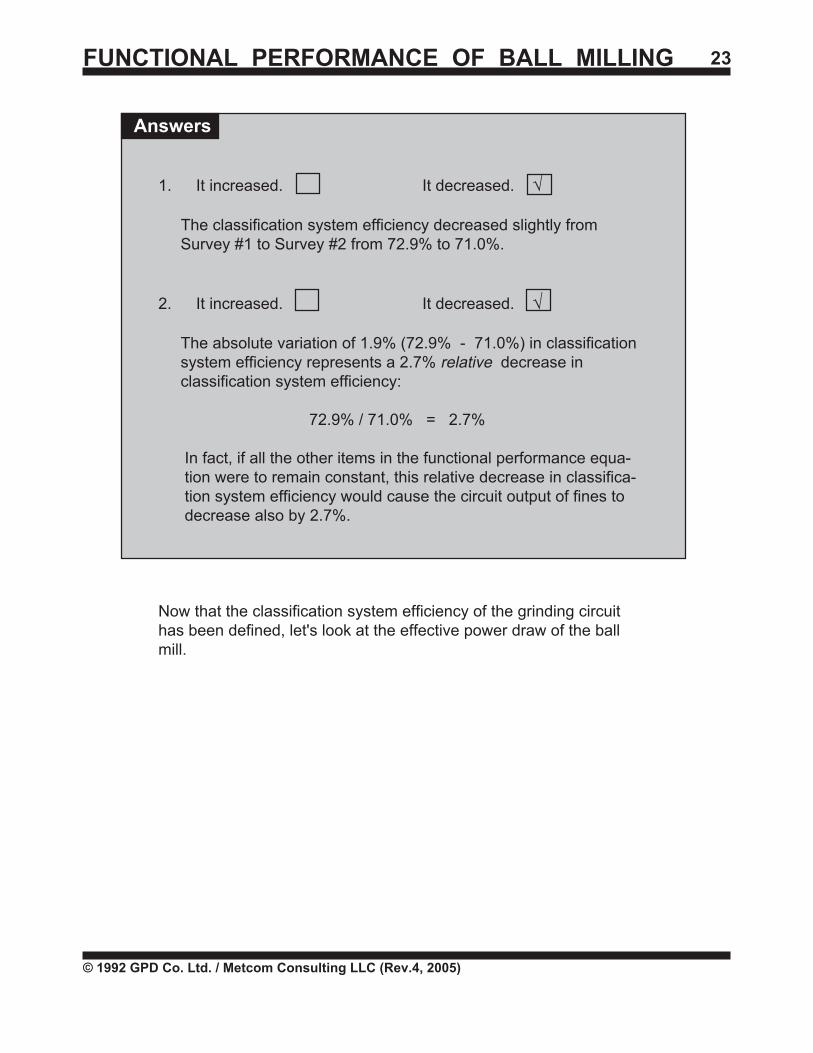
1. It increased. It decreased. š
The classification system efficiency decreased slightly from Survey #1 to Survey #2 from 72.9% to 71.0%.
2. It increased. It decreased. š
The absolute variation of 1.9% (72.9% - 71.0%) in classification system efficiency represents a 2.7% relative decrease in classification system efficiency:
72.9% / 71.0% = 2.7%
In fact, if all the other items in the functional performance equa-tion were to remain constant, this relative decrease in classifica-tion system efficiency would cause the circuit output of fines todecrease also by 2.7%.
Now that the classification system efficiency of the grinding circuithas been defined, let's look at the effective power draw of the ballmill.
Answers
FUNCTIONAL PERFORMANCE OF BALL MILLING 24
© 1992 GPD Co. Ltd. / Metcom Consulting LLC (Rev.4, 2005)
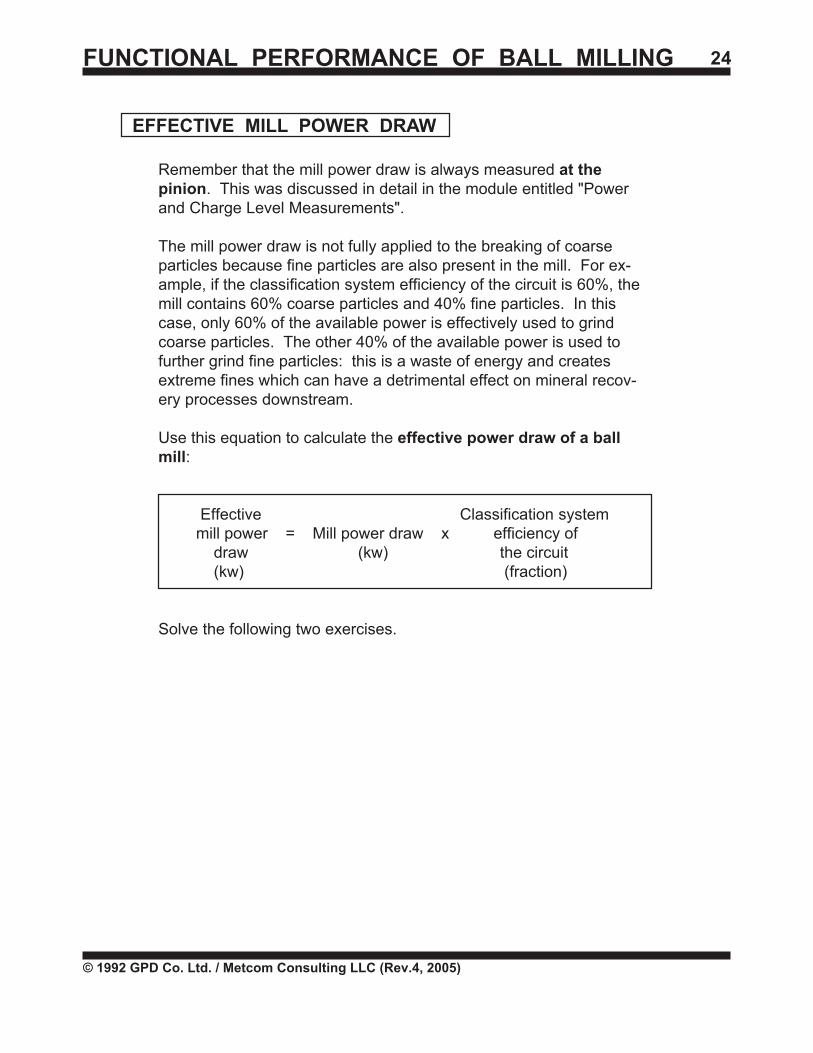
EFFECTIVE MILL POWER DRAW
Remember that the mill power draw is always measured at thepinion. This was discussed in detail in the module entitled "Powerand Charge Level Measurements".
The mill power draw is not fully applied to the breaking of coarseparticles because fine particles are also present in the mill. For ex-ample, if the classification system efficiency of the circuit is 60%, themill contains 60% coarse particles and 40% fine particles. In thiscase, only 60% of the available power is effectively used to grindcoarse particles. The other 40% of the available power is used tofurther grind fine particles: this is a waste of energy and createsextreme fines which can have a detrimental effect on mineral recov-ery processes downstream.
Use this equation to calculate the effective power draw of a ballmill:
Effective Classification systemmill power = Mill power draw x efficiency of draw (kw) the circuit (kw) (fraction)
Solve the following two exercises.
FUNCTIONAL PERFORMANCE OF BALL MILLING 25
© 1992 GPD Co. Ltd. / Metcom Consulting LLC (Rev.4, 2005)
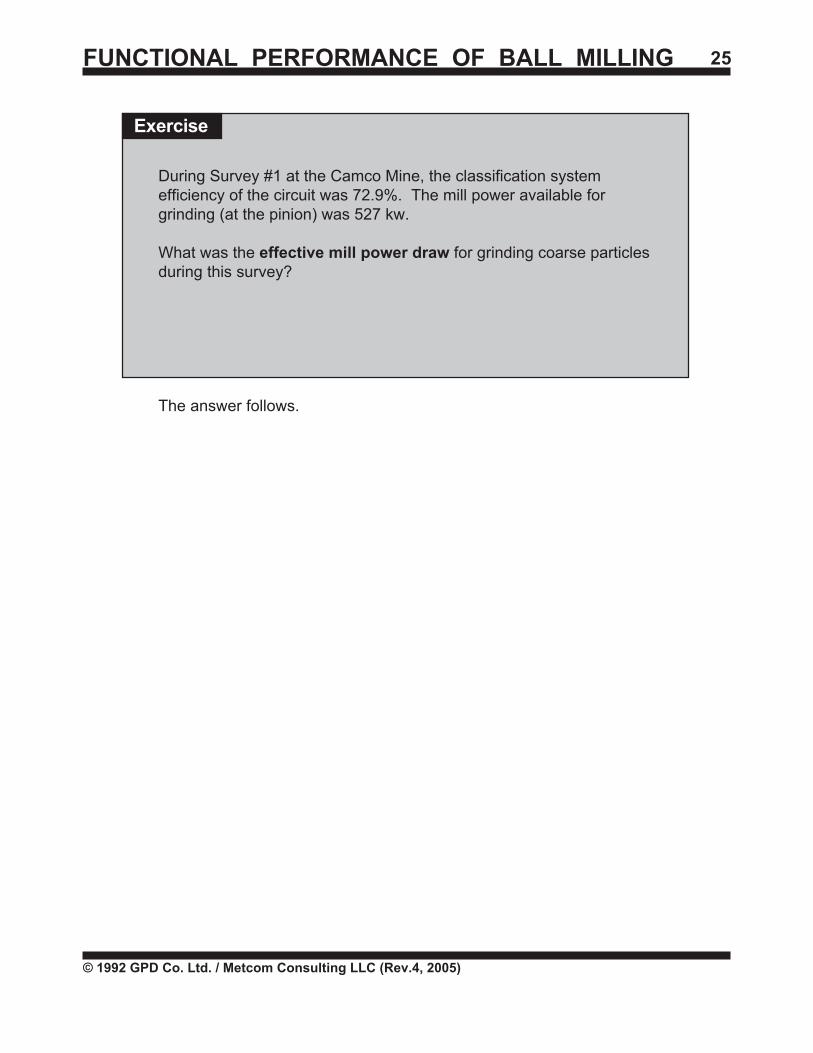
During Survey #1 at the Camco Mine, the classification systemefficiency of the circuit was 72.9%. The mill power available forgrinding (at the pinion) was 527 kw.
What was the effective mill power draw for grinding coarse particlesduring this survey?
The answer follows.
Exercise
FUNCTIONAL PERFORMANCE OF BALL MILLING 26
© 1992 GPD Co. Ltd. / Metcom Consulting LLC (Rev.4, 2005)
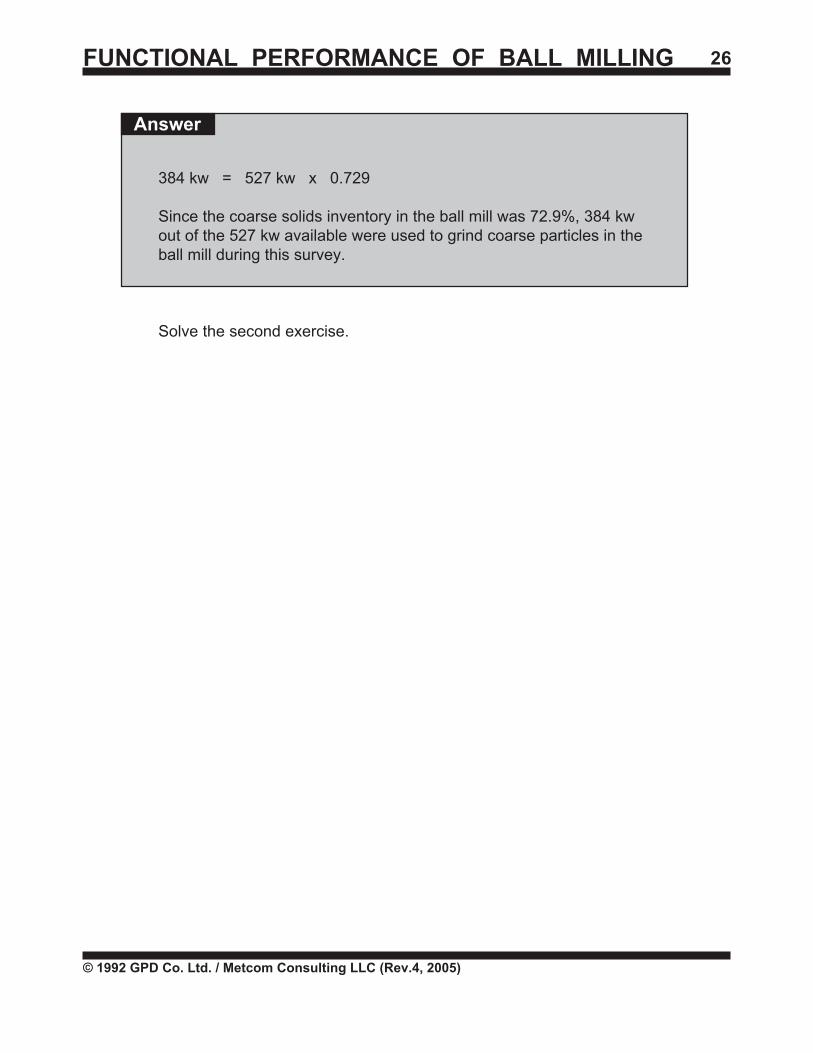
384 kw = 527 kw x 0.729
Since the coarse solids inventory in the ball mill was 72.9%, 384 kwout of the 527 kw available were used to grind coarse particles in theball mill during this survey.
Solve the second exercise.
Answer
FUNCTIONAL PERFORMANCE OF BALL MILLING 27
© 1992 GPD Co. Ltd. / Metcom Consulting LLC (Rev.4, 2005)
Exercise
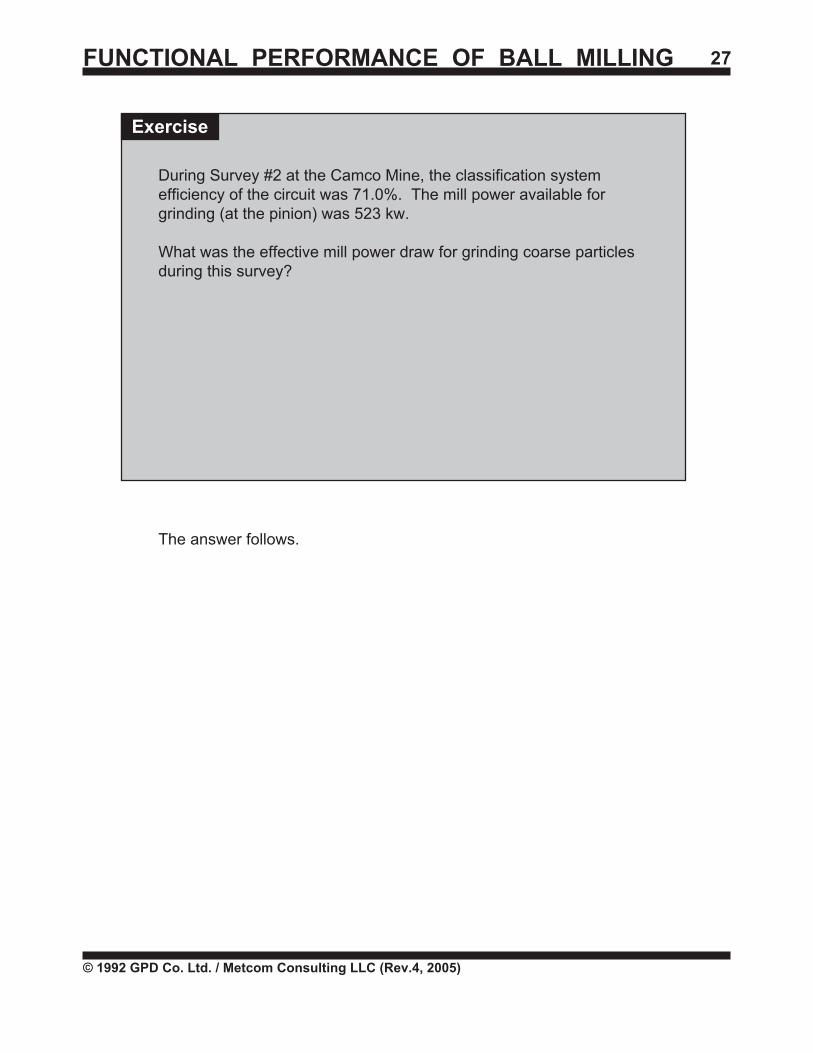
During Survey #2 at the Camco Mine, the classification systemefficiency of the circuit was 71.0%. The mill power available forgrinding (at the pinion) was 523 kw.
What was the effective mill power draw for grinding coarse particlesduring this survey?
The answer follows.
FUNCTIONAL PERFORMANCE OF BALL MILLING 28
© 1992 GPD Co. Ltd. / Metcom Consulting LLC (Rev.4, 2005)
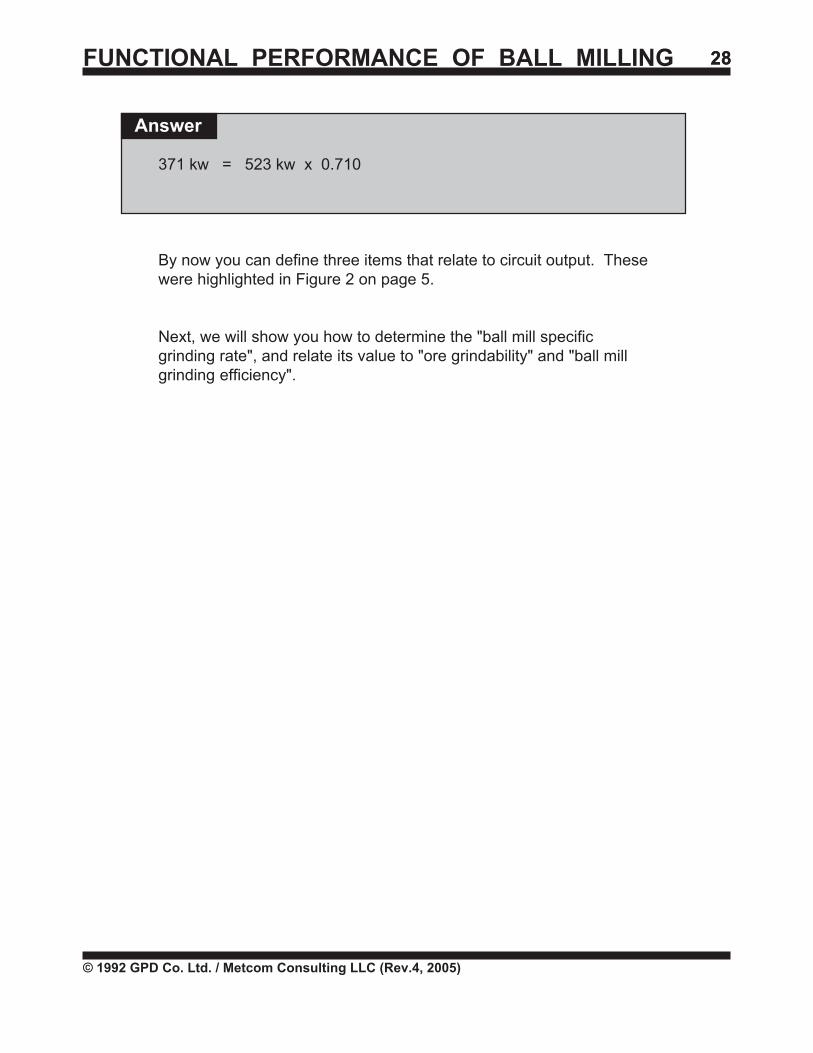
Answer
371 kw = 523 kw x 0.710
By now you can define three items that relate to circuit output. Thesewere highlighted in Figure 2 on page 5.
Next, we will show you how to determine the "ball mill specificgrinding rate", and relate its value to "ore grindability" and "ball millgrinding efficiency".
28
FUNCTIONAL PERFORMANCE OF BALL MILLING 29
© 1992 GPD Co. Ltd. / Metcom Consulting LLC (Rev.4, 2005)
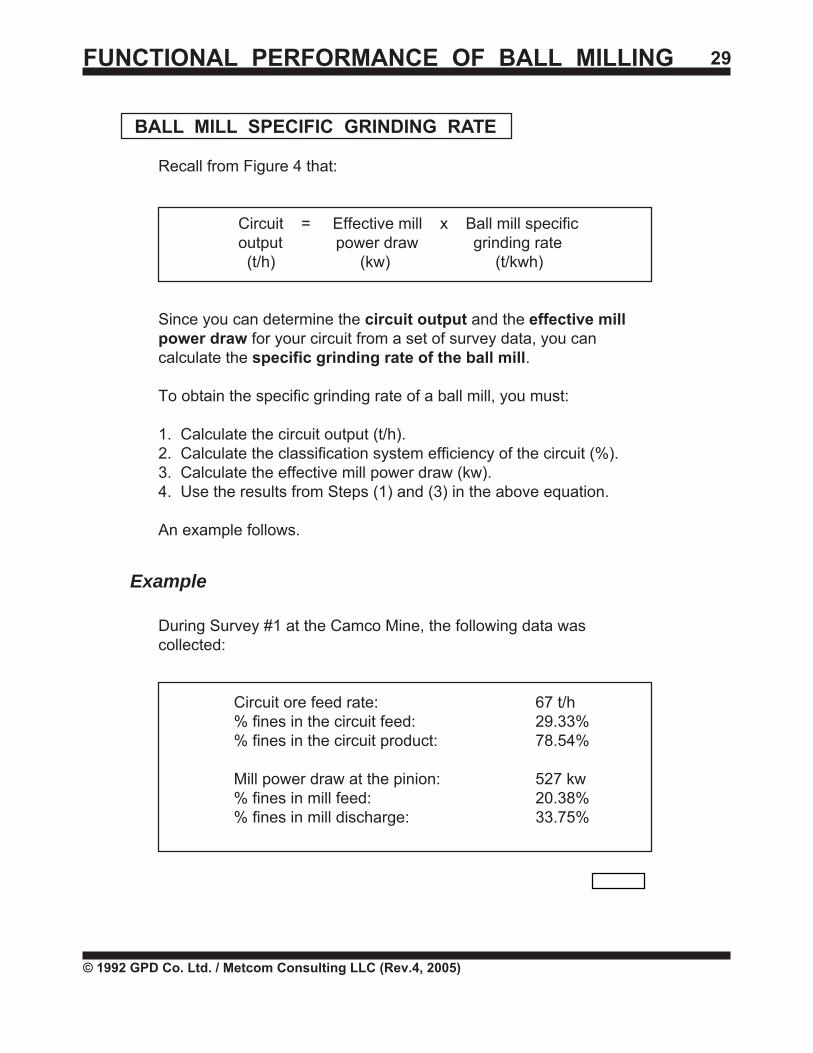
BALL MILL SPECIFIC GRINDING RATE
Recall from Figure 4 that:
Circuit = Effective mill x Ball mill specific output power draw grinding rate
(t/h) (kw) (t/kwh)
Since you can determine the circuit output and the effective millpower draw for your circuit from a set of survey data, you cancalculate the specific grinding rate of the ball mill.
To obtain the specific grinding rate of a ball mill, you must:
1. Calculate the circuit output (t/h).2. Calculate the classification system efficiency of the circuit (%).3. Calculate the effective mill power draw (kw).4. Use the results from Steps (1) and (3) in the above equation.
An example follows.
During Survey #1 at the Camco Mine, the following data wascollected:
Circuit ore feed rate: 67 t/h% fines in the circuit feed: 29.33%% fines in the circuit product: 78.54%
Mill power draw at the pinion: 527 kw% fines in mill feed: 20.38%% fines in mill discharge: 33.75%
Example
FUNCTIONAL PERFORMANCE OF BALL MILLING 30
© 1992 GPD Co. Ltd. / Metcom Consulting LLC (Rev.4, 2005)
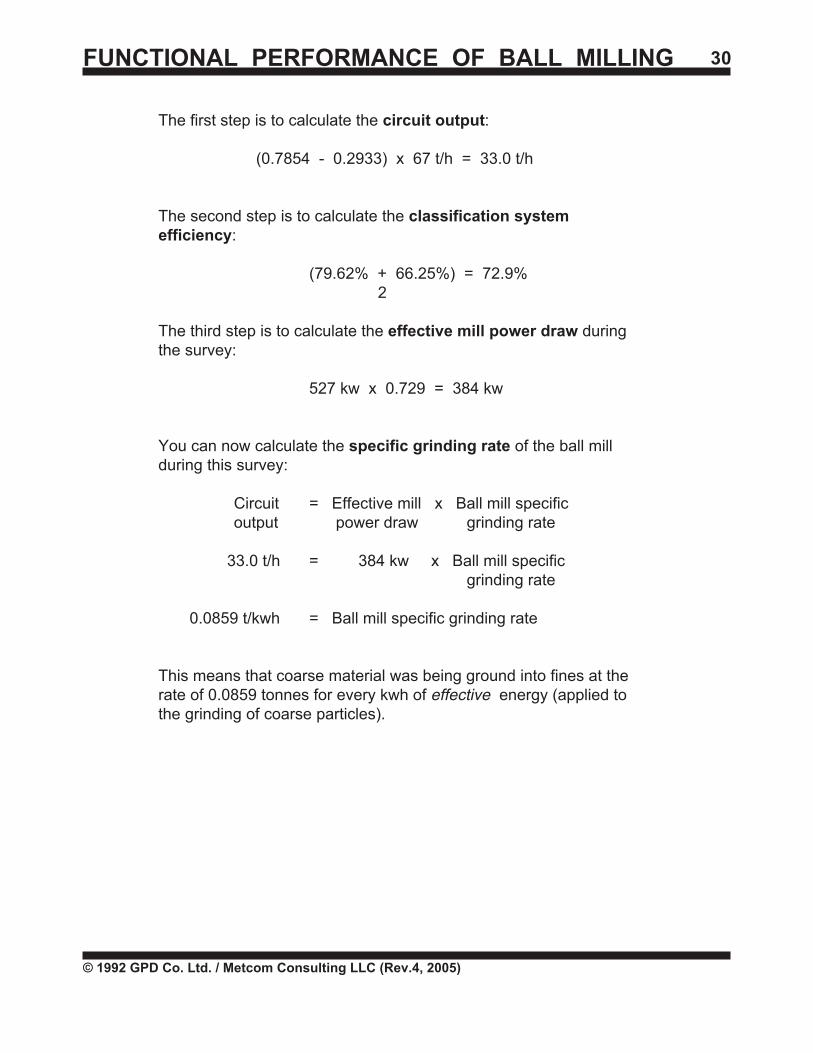
The first step is to calculate the circuit output:
(0.7854 - 0.2933) x 67 t/h = 33.0 t/h
The second step is to calculate the classification systemefficiency:
(79.62% + 66.25%) = 72.9% 2
The third step is to calculate the effective mill power draw duringthe survey:
527 kw x 0.729 = 384 kw
You can now calculate the specific grinding rate of the ball millduring this survey:
Circuit = Effective mill x Ball mill specificoutput power draw grinding rate
33.0 t/h = 384 kw x Ball mill specific grinding rate
0.0859 t/kwh = Ball mill specific grinding rate
This means that coarse material was being ground into fines at therate of 0.0859 tonnes for every kwh of effective energy (applied tothe grinding of coarse particles).
FUNCTIONAL PERFORMANCE OF BALL MILLING 31
© 1992 GPD Co. Ltd. / Metcom Consulting LLC (Rev.4, 2005)
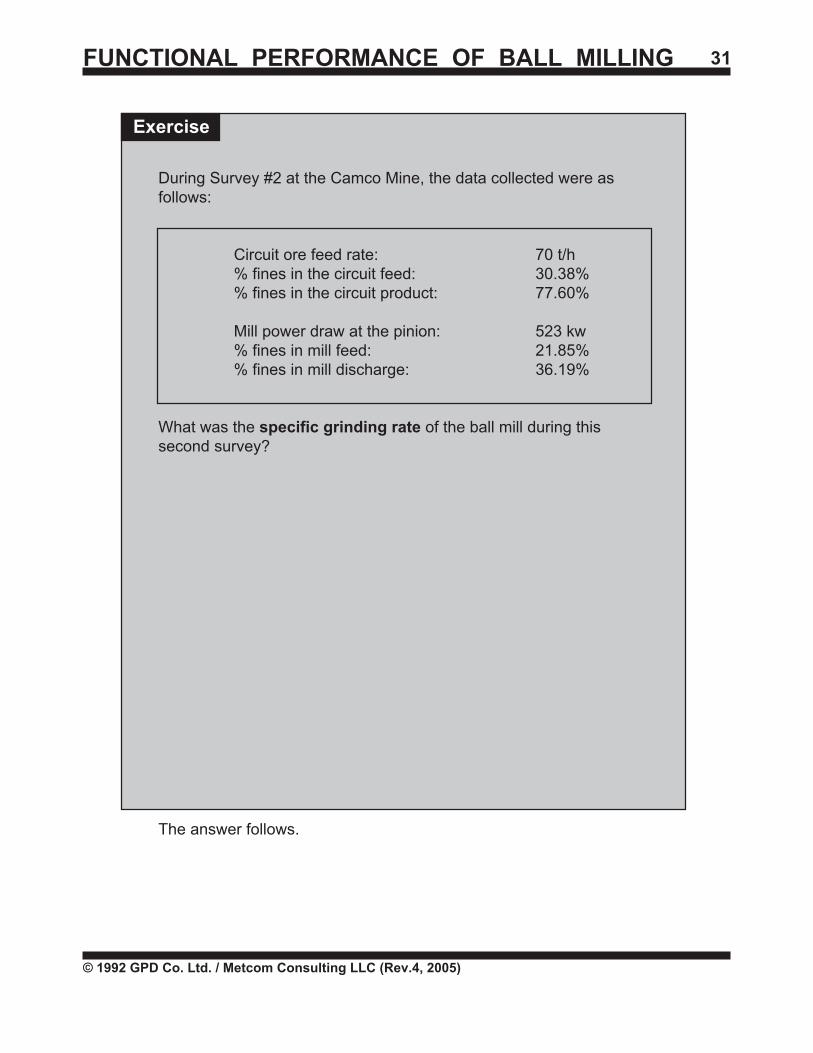
During Survey #2 at the Camco Mine, the data collected were asfollows:
Circuit ore feed rate: 70 t/h% fines in the circuit feed: 30.38%% fines in the circuit product: 77.60%
Mill power draw at the pinion: 523 kw% fines in mill feed: 21.85%% fines in mill discharge: 36.19%
What was the specific grinding rate of the ball mill during thissecond survey?
The answer follows.
Exercise
FUNCTIONAL PERFORMANCE OF BALL MILLING 32
© 1992 GPD Co. Ltd. / Metcom Consulting LLC (Rev.4, 2005)
Answer
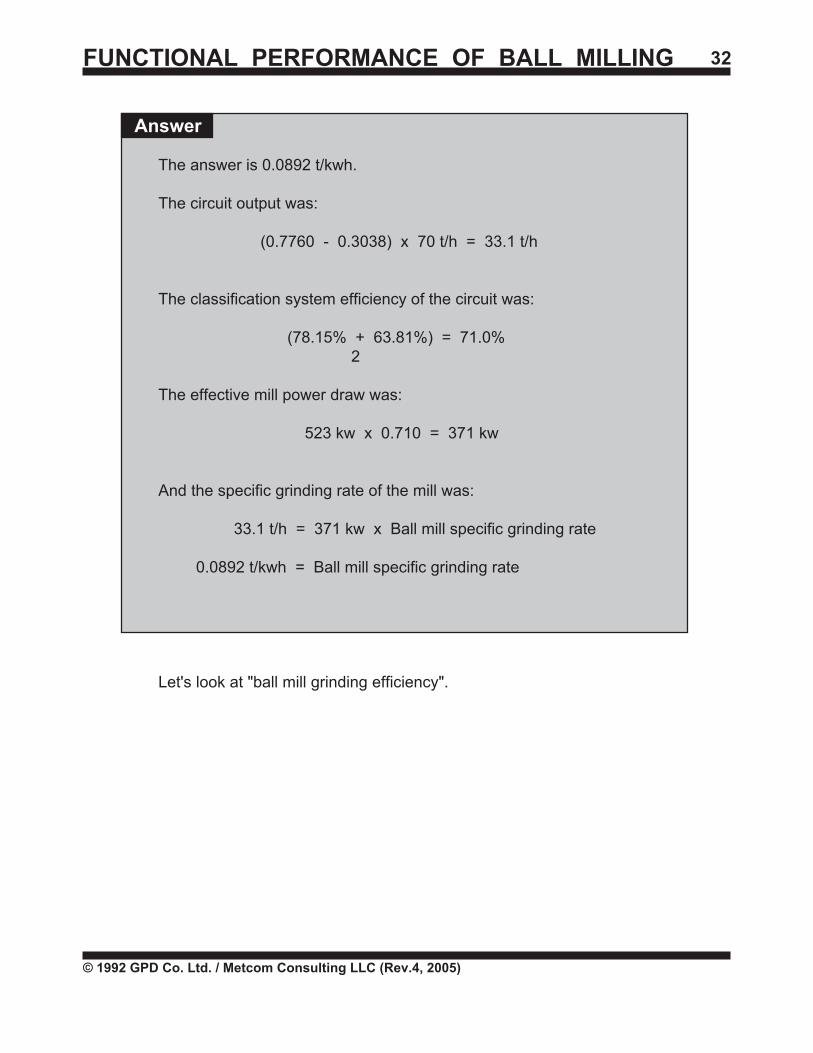
The answer is 0.0892 t/kwh.
The circuit output was:
(0.7760 - 0.3038) x 70 t/h = 33.1 t/h
The classification system efficiency of the circuit was:
(78.15% + 63.81%) = 71.0% 2
The effective mill power draw was:
523 kw x 0.710 = 371 kw
And the specific grinding rate of the mill was:
33.1 t/h = 371 kw x Ball mill specific grinding rate
0.0892 t/kwh = Ball mill specific grinding rate
Let's look at "ball mill grinding efficiency".
FUNCTIONAL PERFORMANCE OF BALL MILLING 33
© 1992 GPD Co. Ltd. / Metcom Consulting LLC (Rev.4, 2005)
BALL MILL GRINDING EFFICIENCY
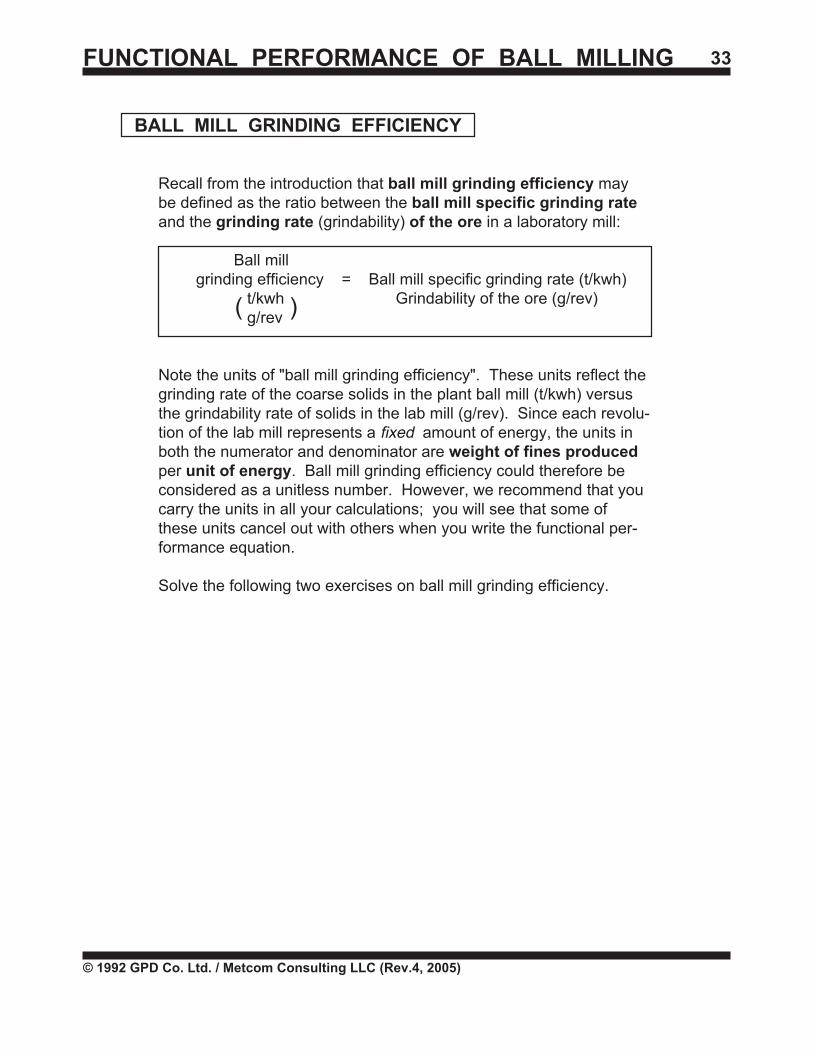
Recall from the introduction that ball mill grinding efficiency maybe defined as the ratio between the ball mill specific grinding rateand the grinding rate (grindability) of the ore in a laboratory mill:
Ball millgrinding efficiency = Ball mill specific grinding rate (t/kwh)
t/kwh Grindability of the ore (g/rev) g/rev
Note the units of "ball mill grinding efficiency". These units reflect thegrinding rate of the coarse solids in the plant ball mill (t/kwh) versusthe grindability rate of solids in the lab mill (g/rev). Since each revolu-tion of the lab mill represents a fixed amount of energy, the units inboth the numerator and denominator are weight of fines producedper unit of energy. Ball mill grinding efficiency could therefore beconsidered as a unitless number. However, we recommend that youcarry the units in all your calculations; you will see that some ofthese units cancel out with others when you write the functional per-formance equation.
Solve the following two exercises on ball mill grinding efficiency.
( )
FUNCTIONAL PERFORMANCE OF BALL MILLING 34
© 1992 GPD Co. Ltd. / Metcom Consulting LLC (Rev.4, 2005)
Exercise
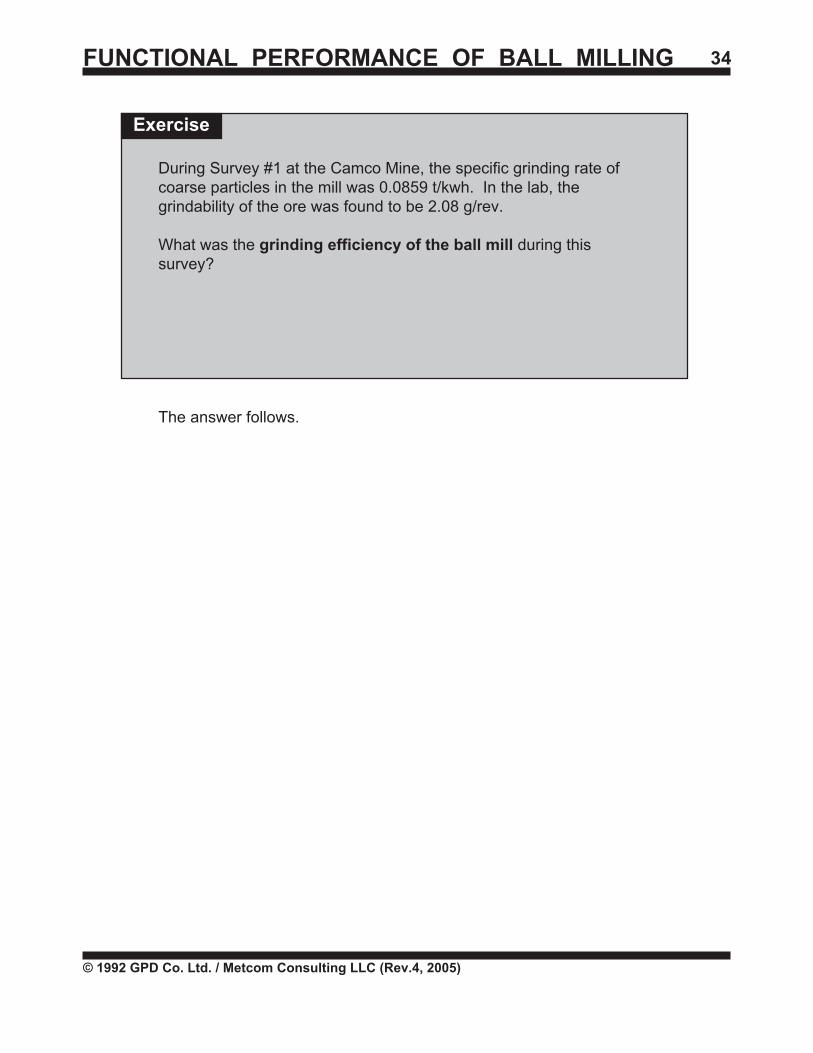
During Survey #1 at the Camco Mine, the specific grinding rate ofcoarse particles in the mill was 0.0859 t/kwh. In the lab, thegrindability of the ore was found to be 2.08 g/rev.
What was the grinding efficiency of the ball mill during thissurvey?
The answer follows.
FUNCTIONAL PERFORMANCE OF BALL MILLING 35
© 1992 GPD Co. Ltd. / Metcom Consulting LLC (Rev.4, 2005)
0.0413 t/kwh = 0.0859 t/kwh g/rev 2.08 g/rev
The grindability of the ore can be determined through different typesof standard laboratory test procedures as discussed in the moduleentitled "Introduction to Grindability Testing".
Whether you should use the grindability (g/rev) measured in a Bondwork index test or in an on-site batch grindability test is discussed inAppendix A of this module. You should read this appendix after youhave covered the main contents of this module. In the followingexample and exercises, the Bond ball mill grindability values areused.
Solve this second exercise.
Answer
FUNCTIONAL PERFORMANCE OF BALL MILLING 36
© 1992 GPD Co. Ltd. / Metcom Consulting LLC (Rev.4, 2005)
Exercise
During Survey #2 at the Camco Mine, the specific grinding rate of theball mill was 0.0892 t/kwh. This time, the grindability of the ore was2.31 g/rev.
1. What was the ball mill grinding efficiency for this secondsurvey?
2. What happened to the ball mill grinding efficiency from the firstto the second survey?
The answers follow.
FUNCTIONAL PERFORMANCE OF BALL MILLING 37
© 1992 GPD Co. Ltd. / Metcom Consulting LLC (Rev.4, 2005)
1. 0.0386 t/kwh = 0.0892 t/kwh g/rev 2.31 g/rev
2. Between the two surveys carried out at the Camco Mine, theball mill grinding efficiency fell from 0.0413 to 0.0386. Thegrinding efficiency of the ball mill fell by 7%:
0.0413 / 0.0386 = 7.0%
Answers
FUNCTIONAL PERFORMANCE OF BALL MILLING 38
© 1992 GPD Co. Ltd. / Metcom Consulting LLC (Rev.4, 2005)
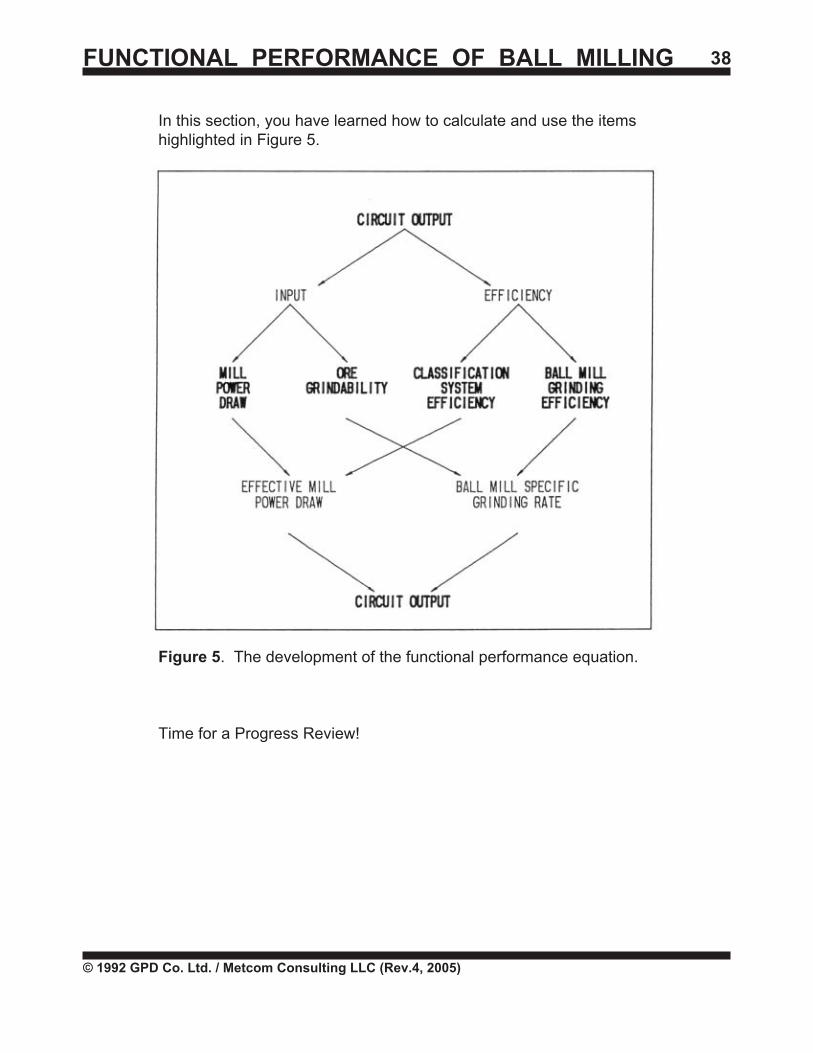
In this section, you have learned how to calculate and use the itemshighlighted in Figure 5.
Figure 5. The development of the functional performance equation.
Time for a Progress Review!
FUNCTIONAL PERFORMANCE OF BALL MILLING 39
© 1992 GPD Co. Ltd. / Metcom Consulting LLC (Rev.4, 2005)
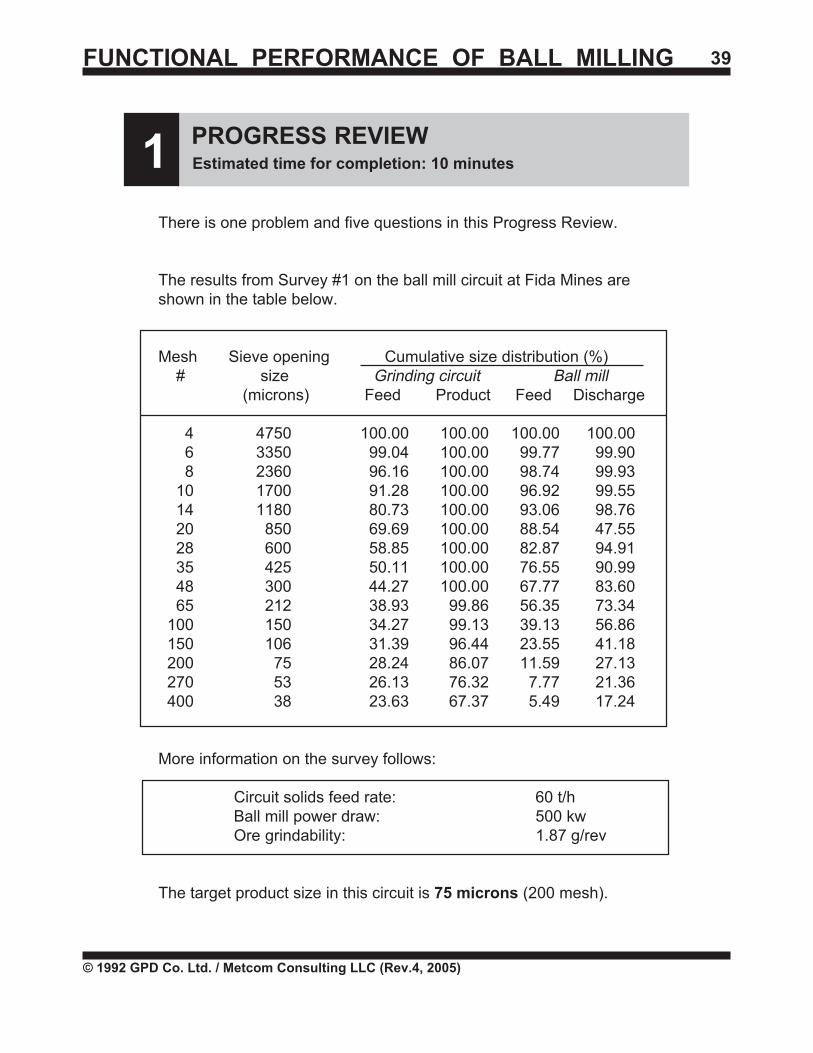
There is one problem and five questions in this Progress Review.
The results from Survey #1 on the ball mill circuit at Fida Mines areshown in the table below.
Mesh Sieve opening Cumulative size distribution (%) # size Grinding circuit Ball mill
(microns) Feed Product Feed Discharge
4 4750 100.00 100.00 100.00 100.00 6 3350 99.04 100.00 99.77 99.90 8 2360 96.16 100.00 98.74 99.93 10 1700 91.28 100.00 96.92 99.55 14 1180 80.73 100.00 93.06 98.76 20 850 69.69 100.00 88.54 47.55 28 600 58.85 100.00 82.87 94.91 35 425 50.11 100.00 76.55 90.99 48 300 44.27 100.00 67.77 83.60 65 212 38.93 99.86 56.35 73.34 100 150 34.27 99.13 39.13 56.86 150 106 31.39 96.44 23.55 41.18 200 75 28.24 86.07 11.59 27.13 270 53 26.13 76.32 7.77 21.36 400 38 23.63 67.37 5.49 17.24
More information on the survey follows:
Circuit solids feed rate: 60 t/hBall mill power draw: 500 kwOre grindability: 1.87 g/rev
The target product size in this circuit is 75 microns (200 mesh).
1 PROGRESS REVIEWEstimated time for completion: 10 minutes
FUNCTIONAL PERFORMANCE OF BALL MILLING 40
© 1992 GPD Co. Ltd. / Metcom Consulting LLC (Rev.4, 2005)
1 PROGRESS REVIEW(continued)
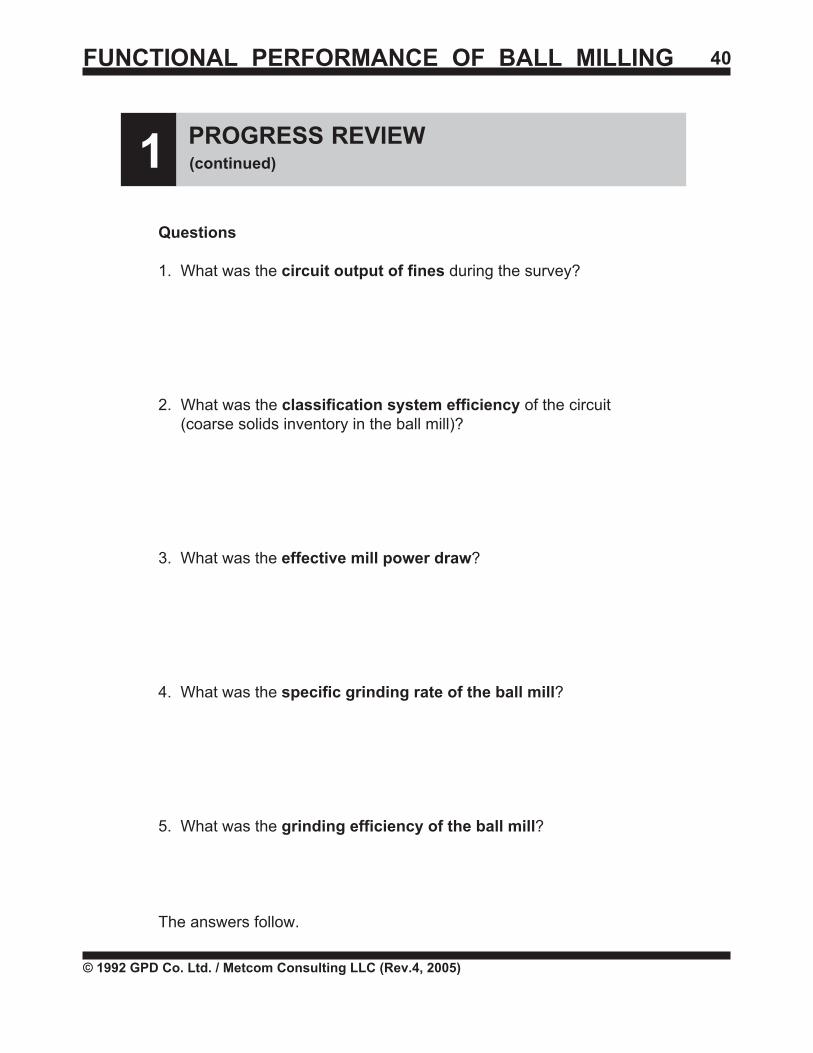
Questions
1. What was the circuit output of fines during the survey?
2. What was the classification system efficiency of the circuit (coarse solids inventory in the ball mill)?
3. What was the effective mill power draw?
4. What was the specific grinding rate of the ball mill?
5. What was the grinding efficiency of the ball mill?
The answers follow.
FUNCTIONAL PERFORMANCE OF BALL MILLING 41
© 1992 GPD Co. Ltd. / Metcom Consulting LLC (Rev.4, 2005)
1 PROGRESS REVIEW(continued)
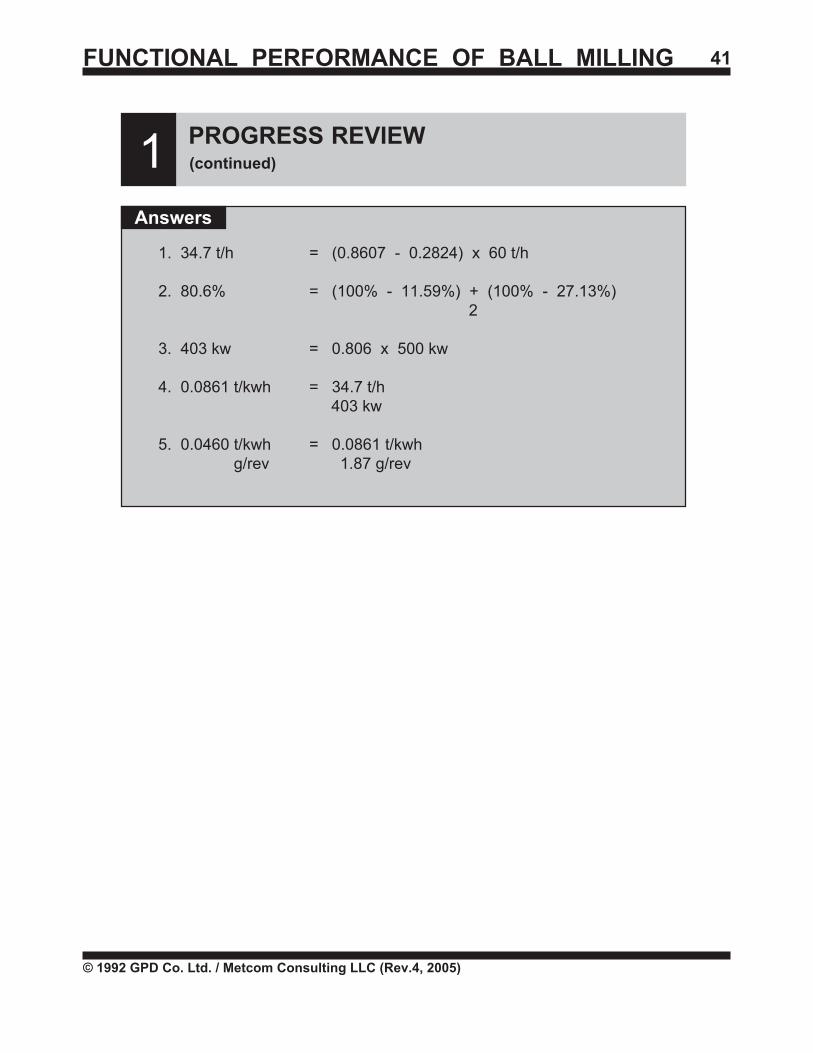
Answers
1. 34.7 t/h = (0.8607 - 0.2824) x 60 t/h
2. 80.6% = (100% - 11.59%) + (100% - 27.13%) 2
3. 403 kw = 0.806 x 500 kw
4. 0.0861 t/kwh = 34.7 t/h 403 kw
5. 0.0460 t/kwh = 0.0861 t/kwhg/rev 1.87 g/rev
FUNCTIONAL PERFORMANCE OF BALL MILLING 42
© 1992 GPD Co. Ltd. / Metcom Consulting LLC (Rev.4, 2005)
How did you do? If you scored 100%, good work!
Take a break before moving on to Part II of this module.
FUNCTIONAL PERFORMANCE OF BALL MILLING 43
© 1992 GPD Co. Ltd. / Metcom Consulting LLC (Rev.4, 2005)
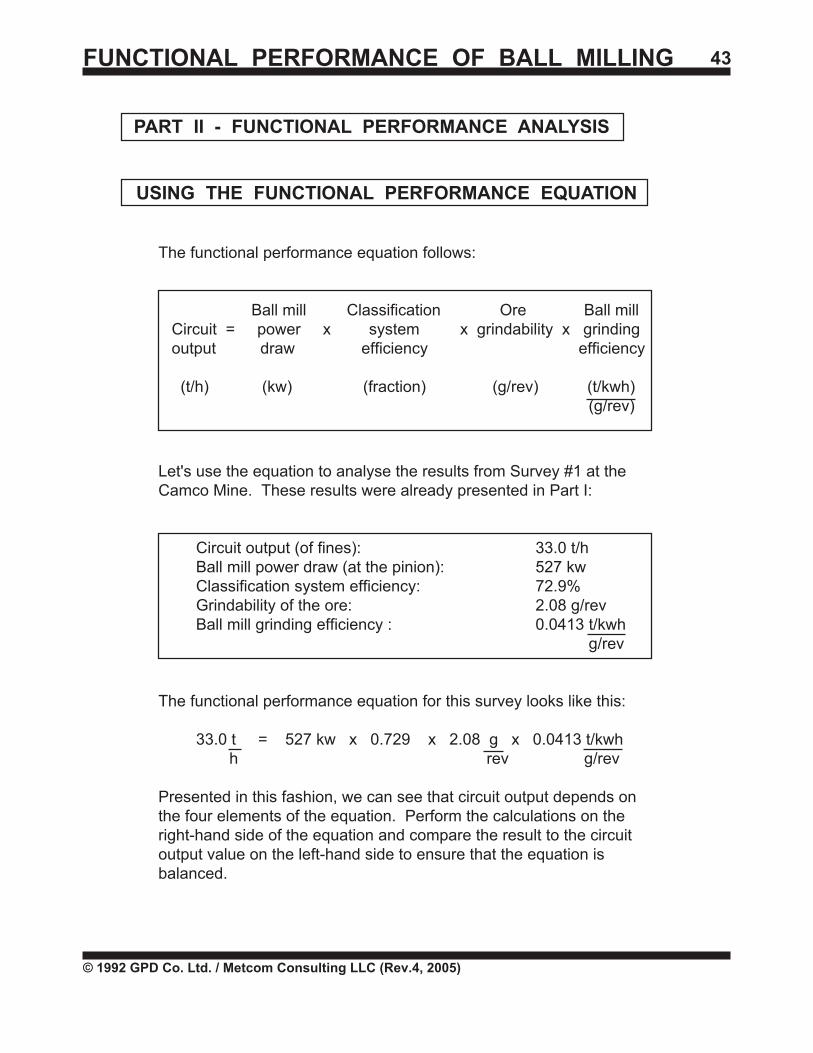
Let's use the equation to analyse the results from Survey #1 at theCamco Mine. These results were already presented in Part I:
Circuit output (of fines): 33.0 t/hBall mill power draw (at the pinion): 527 kwClassification system efficiency: 72.9%Grindability of the ore: 2.08 g/revBall mill grinding efficiency : 0.0413 t/kwh
g/rev
The functional performance equation for this survey looks like this:
33.0 t = 527 kw x 0.729 x 2.08 g x 0.0413 t/kwh h rev g/rev
Presented in this fashion, we can see that circuit output depends onthe four elements of the equation. Perform the calculations on theright-hand side of the equation and compare the result to the circuitoutput value on the left-hand side to ensure that the equation isbalanced.
The functional performance equation follows:
Ball mill Classification Ore Ball mill Circuit = power x system x grindability x grinding output draw efficiency efficiency
(t/h) (kw) (fraction) (g/rev) (t/kwh) (g/rev)
PART II - FUNCTIONAL PERFORMANCE ANALYSIS
USING THE FUNCTIONAL PERFORMANCE EQUATION
FUNCTIONAL PERFORMANCE OF BALL MILLING 44
© 1992 GPD Co. Ltd. / Metcom Consulting LLC (Rev.4, 2005)
You can see that the output of new product (fines) of a ball mill circuitdepends on:
a) The power draw of the ball mill.b) The classification system efficiency.c) The grindability of the ore.d) The ball mill grinding efficiency.
The elements of the functional performance equation can be readilyobtained from a circuit survey and through standard laboratory analy-ses of the samples collected during the survey; all but the last term ofthe equation (the ball mill grinding efficiency) are directly determinedfrom survey information and laboratory analyses.
The efficiency of the ball mill grinding environment can be calculatedfrom the functional performance equation when all the other valuesare known. In the intermediate steps, the effective mill power drawand the ball mill specific grinding rate are also calculated.
Practice using the functional performance equation in the followingexercise.
FUNCTIONAL PERFORMANCE OF BALL MILLING 45
© 1992 GPD Co. Ltd. / Metcom Consulting LLC (Rev.4, 2005)
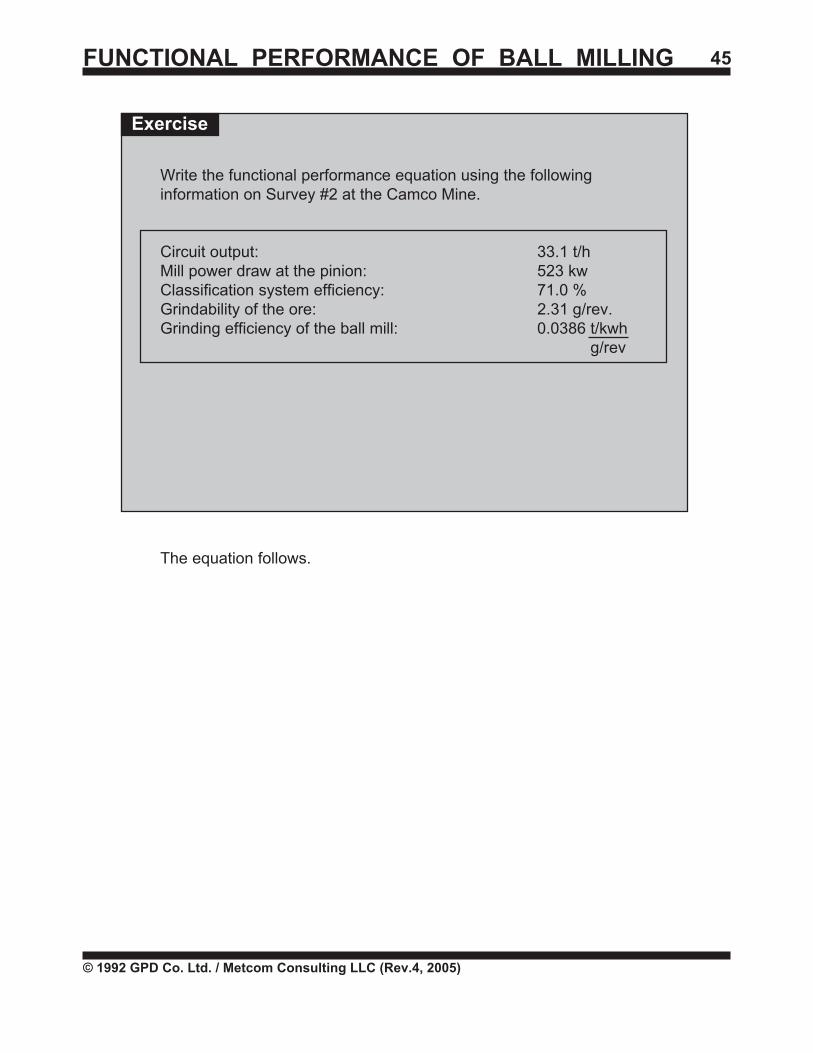
Write the functional performance equation using the followinginformation on Survey #2 at the Camco Mine.
Circuit output: 33.1 t/hMill power draw at the pinion: 523 kwClassification system efficiency: 71.0 %Grindability of the ore: 2.31 g/rev.Grinding efficiency of the ball mill: 0.0386 t/kwh
g/rev
The equation follows.
Exercise
FUNCTIONAL PERFORMANCE OF BALL MILLING 46
© 1992 GPD Co. Ltd. / Metcom Consulting LLC (Rev.4, 2005)
Answer
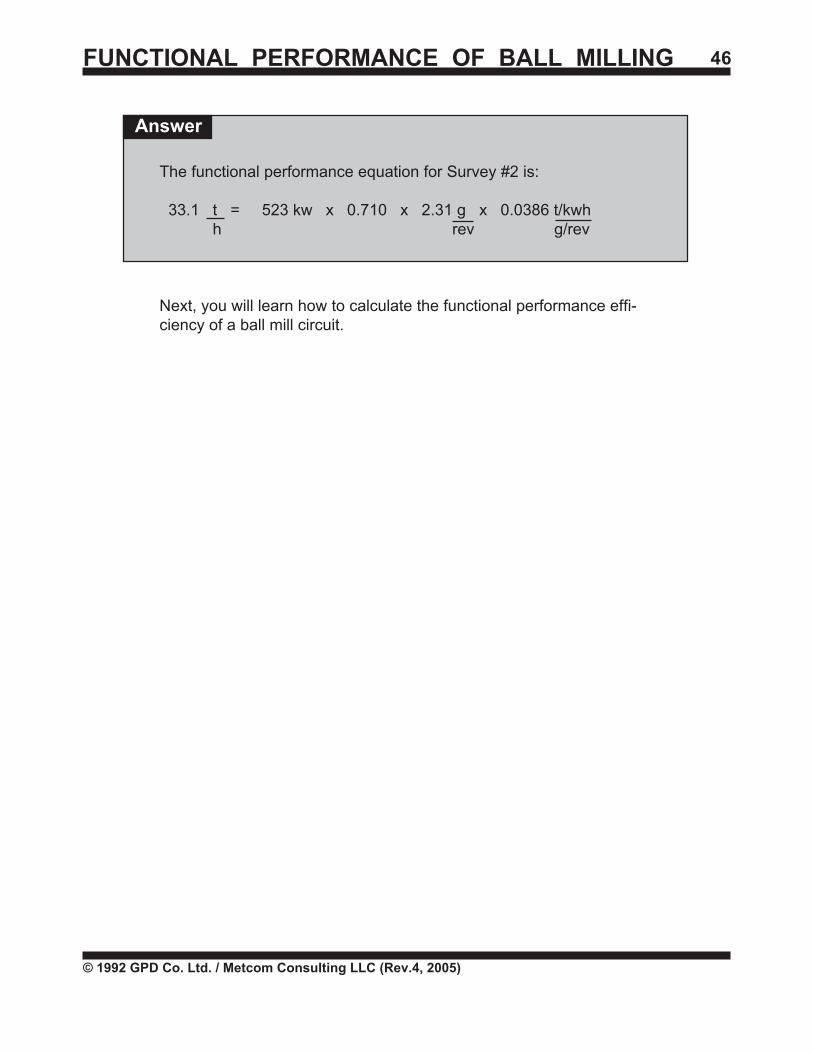
The functional performance equation for Survey #2 is:
33.1 t = 523 kw x 0.710 x 2.31 g x 0.0386 t/kwh h rev g/rev
Next, you will learn how to calculate the functional performance effi-ciency of a ball mill circuit.
FUNCTIONAL PERFORMANCE OF BALL MILLING 47
© 1992 GPD Co. Ltd. / Metcom Consulting LLC (Rev.4, 2005)
FUNCTIONAL PERFORMANCE EFFICIENCY
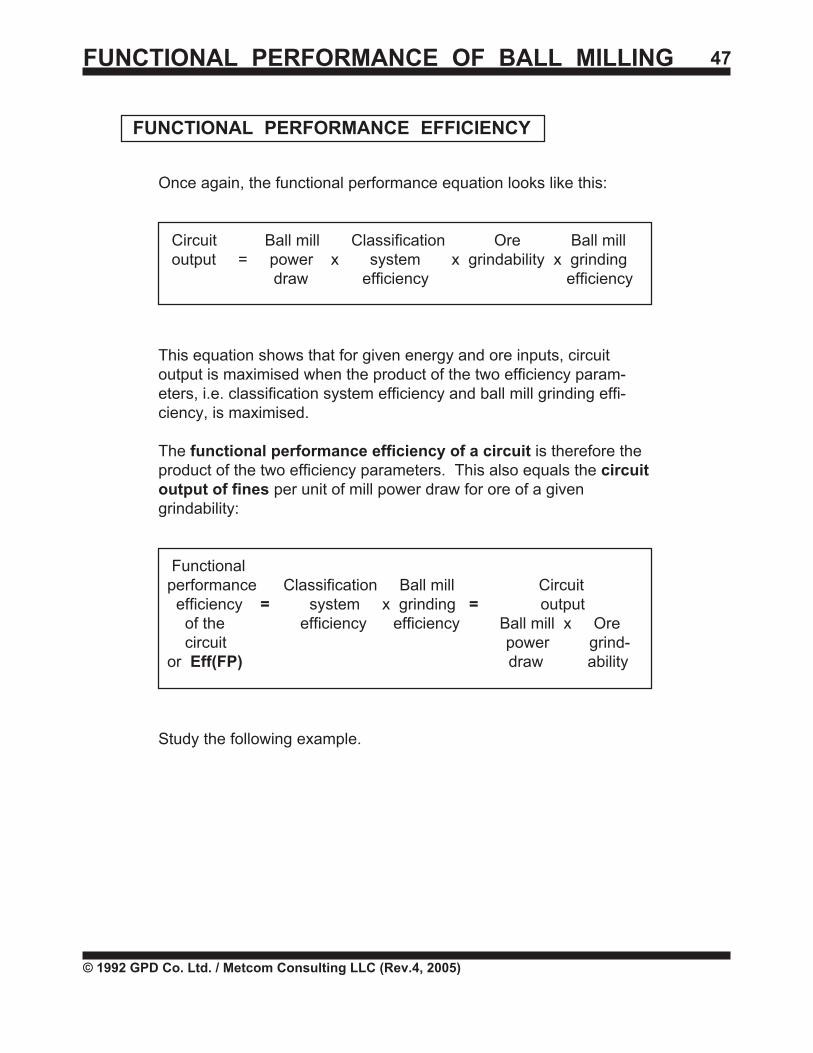
Once again, the functional performance equation looks like this:
Circuit Ball mill Classification Ore Ball mill output = power x system x grindability x grinding
draw efficiency efficiency
This equation shows that for given energy and ore inputs, circuitoutput is maximised when the product of the two efficiency param-eters, i.e. classification system efficiency and ball mill grinding effi-ciency, is maximised.
The functional performance efficiency of a circuit is therefore theproduct of the two efficiency parameters. This also equals the circuitoutput of fines per unit of mill power draw for ore of a givengrindability:
Functional performance Classification Ball mill Circuit efficiency = system x grinding = output . of the efficiency efficiency Ball mill x Ore circuit power grind- or Eff(FP) draw ability
Study the following example.
FUNCTIONAL PERFORMANCE OF BALL MILLING 48
© 1992 GPD Co. Ltd. / Metcom Consulting LLC (Rev.4, 2005)
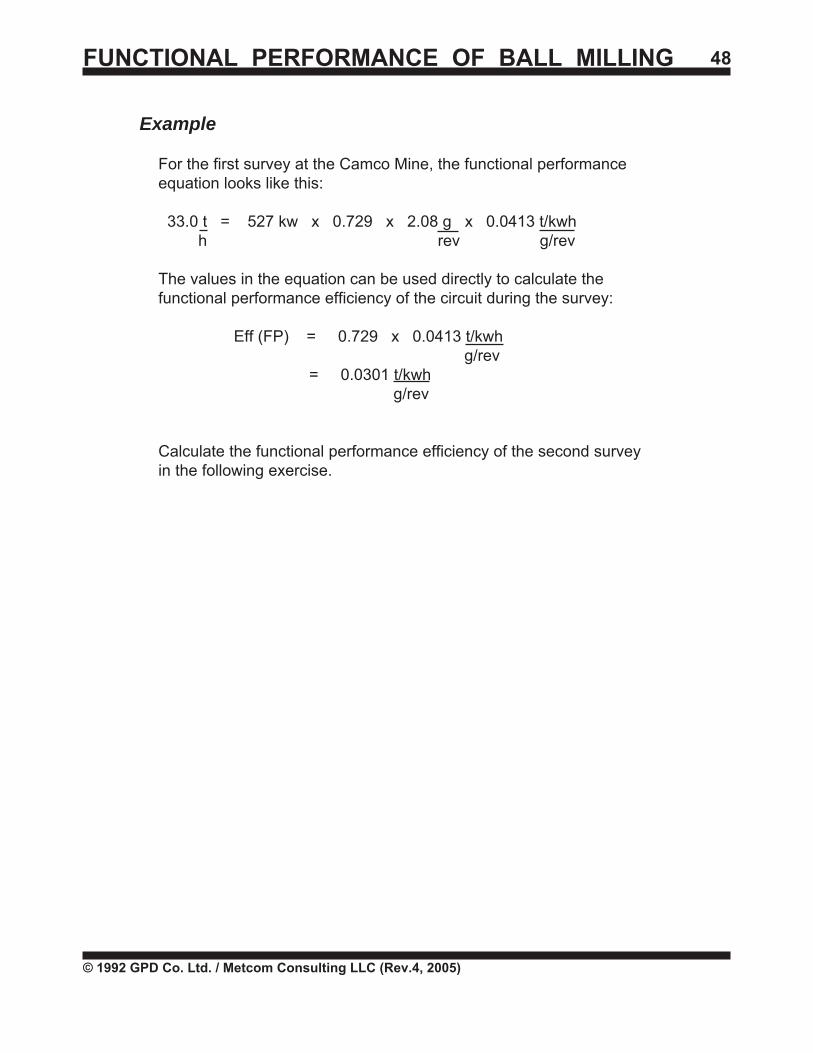
Example
For the first survey at the Camco Mine, the functional performanceequation looks like this:
33.0 t = 527 kw x 0.729 x 2.08 g x 0.0413 t/kwh h rev g/rev
The values in the equation can be used directly to calculate thefunctional performance efficiency of the circuit during the survey:
Eff (FP) = 0.729 x 0.0413 t/kwh g/rev
= 0.0301 t/kwh g/rev
Calculate the functional performance efficiency of the second surveyin the following exercise.
FUNCTIONAL PERFORMANCE OF BALL MILLING 49
© 1992 GPD Co. Ltd. / Metcom Consulting LLC (Rev.4, 2005)
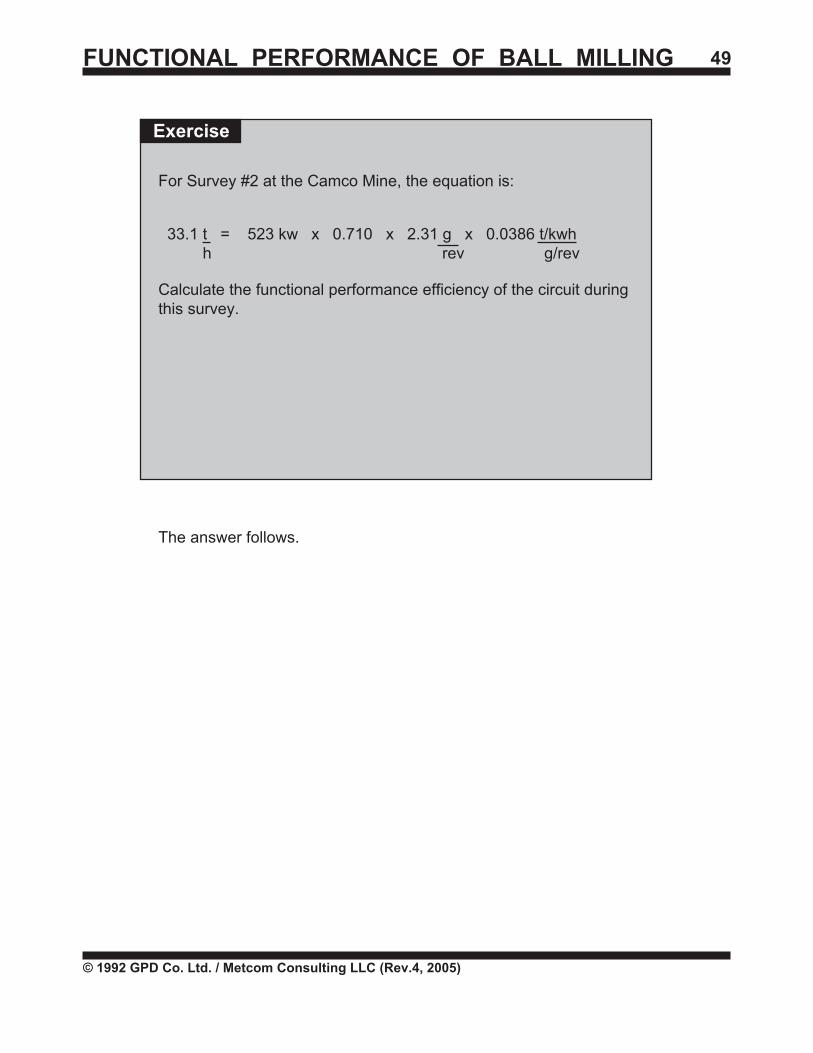
Exercise
For Survey #2 at the Camco Mine, the equation is:
33.1 t = 523 kw x 0.710 x 2.31 g x 0.0386 t/kwh h rev g/rev
Calculate the functional performance efficiency of the circuit duringthis survey.
The answer follows.
FUNCTIONAL PERFORMANCE OF BALL MILLING 50
© 1992 GPD Co. Ltd. / Metcom Consulting LLC (Rev.4, 2005)
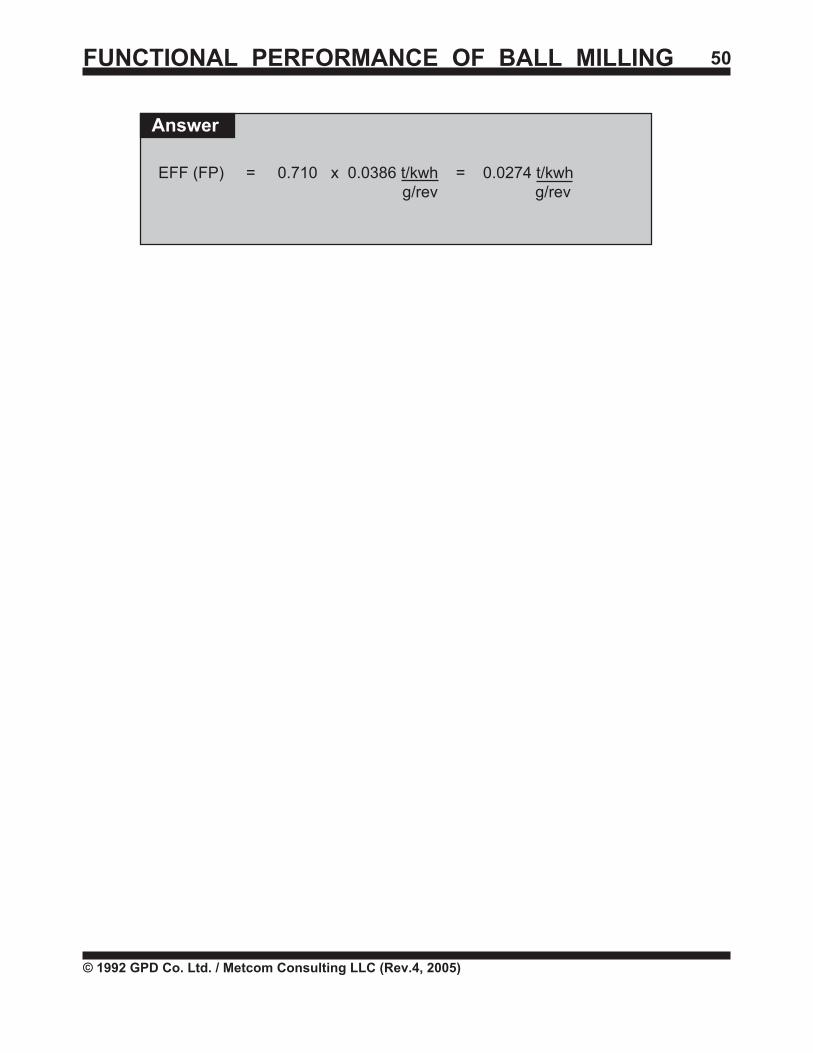
Answer
EFF (FP) = 0.710 x 0.0386 t/kwh = 0.0274 t/kwh g/rev g/rev
FUNCTIONAL PERFORMANCE OF BALL MILLING 51
© 1992 GPD Co. Ltd. / Metcom Consulting LLC (Rev.4, 2005)
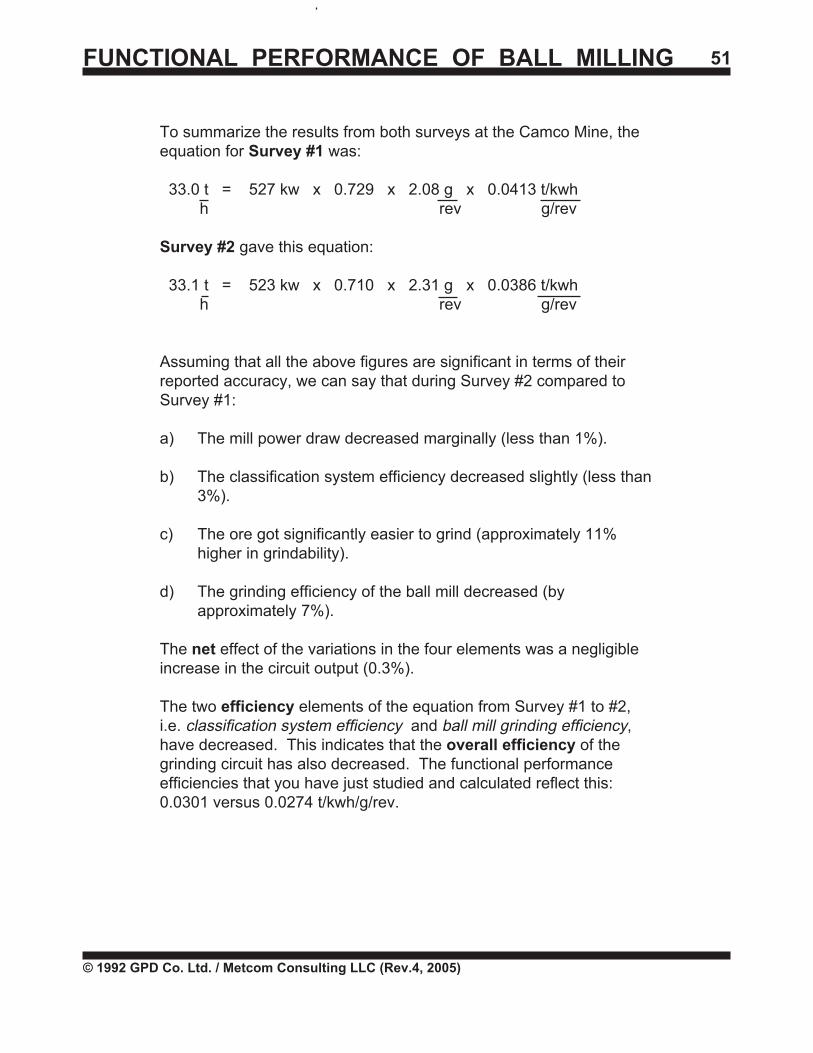
To summarize the results from both surveys at the Camco Mine, theequation for Survey #1 was:
33.0 t = 527 kw x 0.729 x 2.08 g x 0.0413 t/kwh h rev g/rev
Survey #2 gave this equation:
33.1 t = 523 kw x 0.710 x 2.31 g x 0.0386 t/kwh h rev g/rev
Assuming that all the above figures are significant in terms of theirreported accuracy, we can say that during Survey #2 compared toSurvey #1:
a) The mill power draw decreased marginally (less than 1%).
b) The classification system efficiency decreased slightly (less than3%).
c) The ore got significantly easier to grind (approximately 11%higher in grindability).
d) The grinding efficiency of the ball mill decreased (byapproximately 7%).
The net effect of the variations in the four elements was a negligibleincrease in the circuit output (0.3%).
The two efficiency elements of the equation from Survey #1 to #2,i.e. classification system efficiency and ball mill grinding efficiency,have decreased. This indicates that the overall efficiency of thegrinding circuit has also decreased. The functional performanceefficiencies that you have just studied and calculated reflect this:0.0301 versus 0.0274 t/kwh/g/rev.
FUNCTIONAL PERFORMANCE OF BALL MILLING 52
© 1992 GPD Co. Ltd. / Metcom Consulting LLC (Rev.4, 2005)
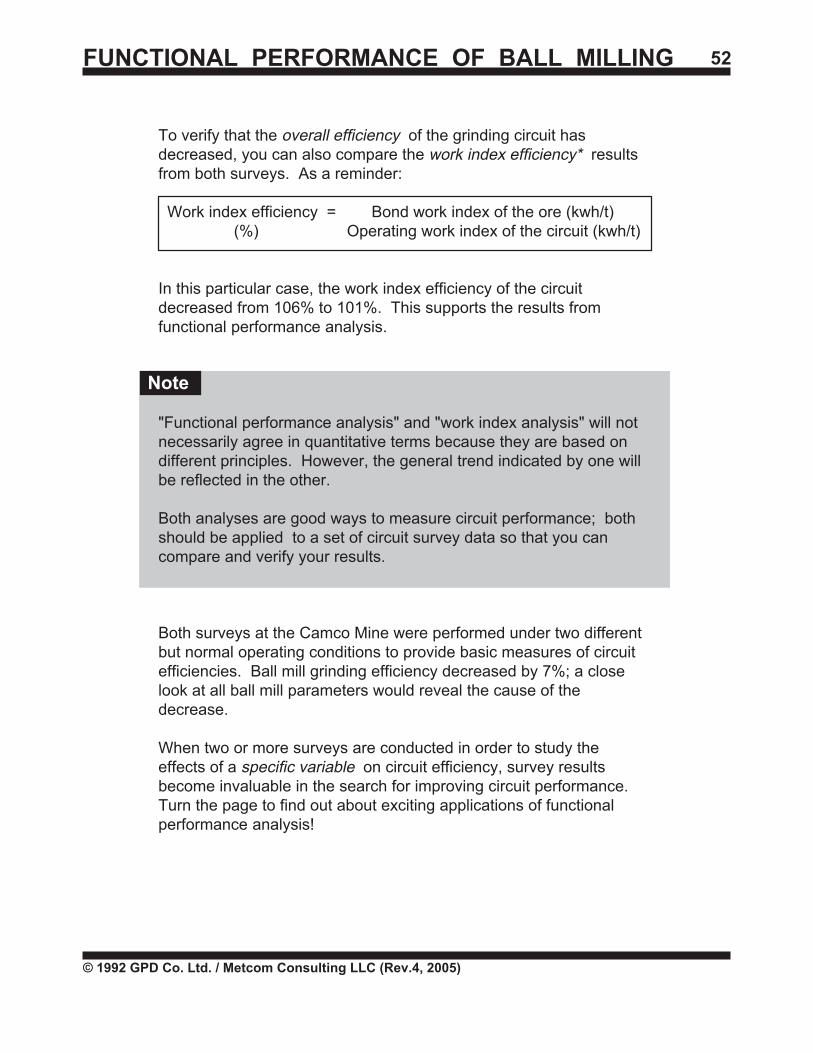
To verify that the overall efficiency of the grinding circuit hasdecreased, you can also compare the work index efficiency* resultsfrom both surveys. As a reminder:
Work index efficiency = Bond work index of the ore (kwh/t) .(%) Operating work index of the circuit (kwh/t)
In this particular case, the work index efficiency of the circuitdecreased from 106% to 101%. This supports the results fromfunctional performance analysis.
"Functional performance analysis" and "work index analysis" will notnecessarily agree in quantitative terms because they are based ondifferent principles. However, the general trend indicated by one willbe reflected in the other.
Both analyses are good ways to measure circuit performance; bothshould be applied to a set of circuit survey data so that you cancompare and verify your results.
Both surveys at the Camco Mine were performed under two differentbut normal operating conditions to provide basic measures of circuitefficiencies. Ball mill grinding efficiency decreased by 7%; a closelook at all ball mill parameters would reveal the cause of thedecrease.
When two or more surveys are conducted in order to study theeffects of a specific variable on circuit efficiency, survey resultsbecome invaluable in the search for improving circuit performance.Turn the page to find out about exciting applications of functionalperformance analysis!
Note
Administrator
Line
FUNCTIONAL PERFORMANCE OF BALL MILLING 53
© 1992 GPD Co. Ltd. / Metcom Consulting LLC (Rev.4, 2005)
The goal of the Metcom System is to improve grinding efficiency in yourplant. By comparing the results of two or more surveys usingfunctional performance analysis, you can establish which design and/or operating variables can be manipulated to improve circuitefficiency.
From now on, you can plan circuit surveys to study the effect ofspecific variables on circuit efficiency.
An example follows.
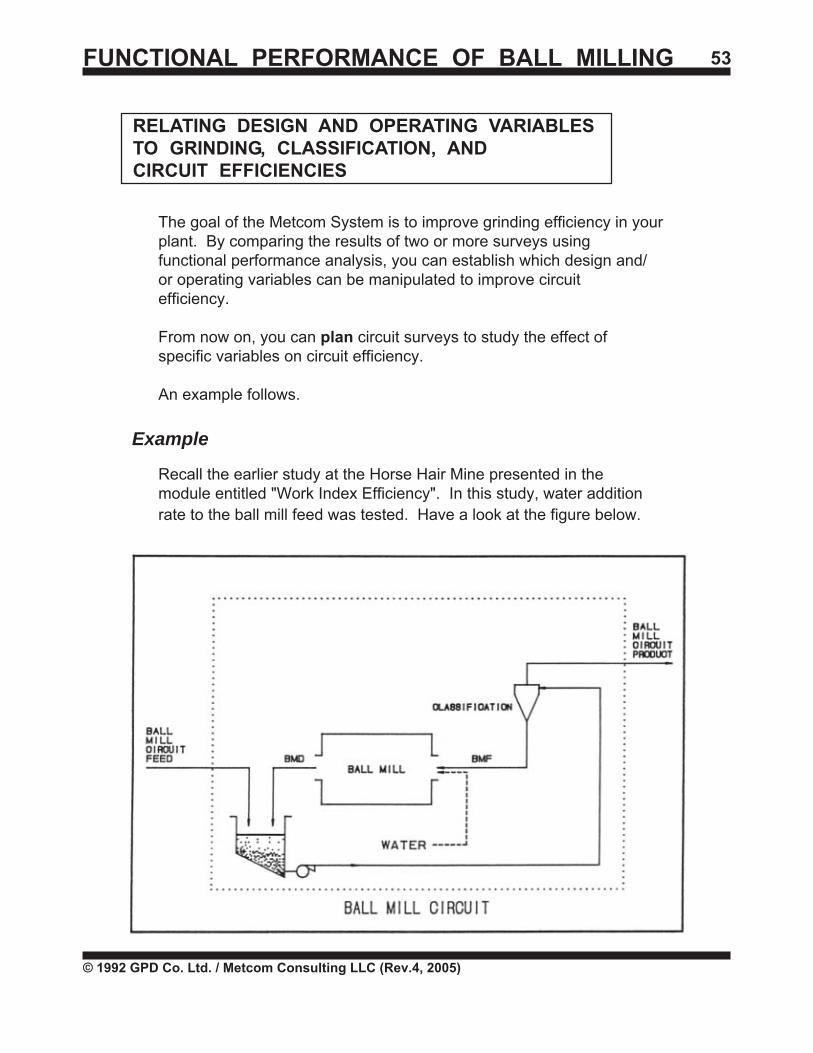
Recall the earlier study at the Horse Hair Mine presented in themodule entitled "Work Index Efficiency". In this study, water additionrate to the ball mill feed was tested. Have a look at the figure below.
RELATING DESIGN AND OPERATING VARIABLESTO GRINDING, CLASSIFICATION, ANDCIRCUIT EFFICIENCIES
Example
Figure
FUNCTIONAL PERFORMANCE OF BALL MILLING 54
© 1992 GPD Co. Ltd. / Metcom Consulting LLC (Rev.4, 2005)
Work index analysis indicated a net loss in the overall efficiency ofthe circuit from the first to the second survey: 92% versus 89%. (Asyou know, this change was not significant.) However, work indexanalysis could not indicate how and by how much grinding efficiencyand classification system efficiency were affected.
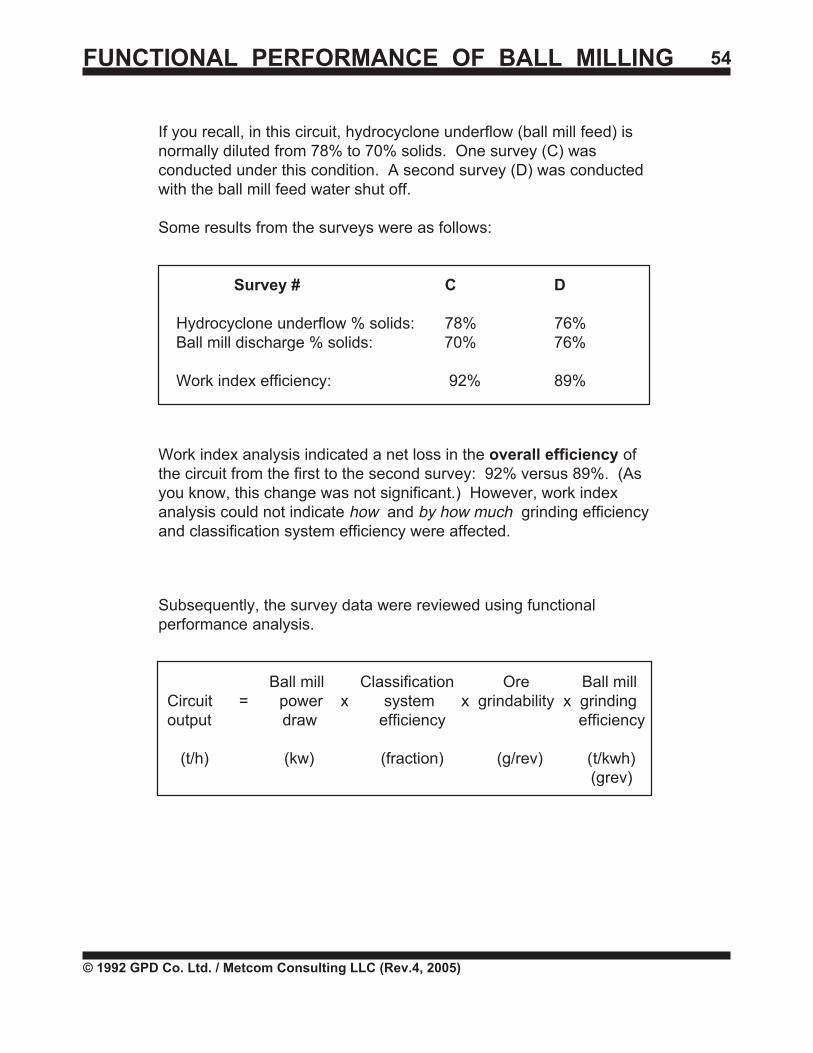
If you recall, in this circuit, hydrocyclone underflow (ball mill feed) isnormally diluted from 78% to 70% solids. One survey (C) wasconducted under this condition. A second survey (D) was conductedwith the ball mill feed water shut off.
Some results from the surveys were as follows:
Survey # C D
Hydrocyclone underflow % solids: 78% 76% Ball mill discharge % solids: 70% 76%
Work index efficiency: 92% 89%
Subsequently, the survey data were reviewed using functionalperformance analysis.
Ball mill Classification Ore Ball mill Circuit = power x system x grindability x grinding output draw efficiency efficiency
(t/h) (kw) (fraction) (g/rev) (t/kwh) (grev)
FUNCTIONAL PERFORMANCE OF BALL MILLING 55
© 1992 GPD Co. Ltd. / Metcom Consulting LLC (Rev.4, 2005)
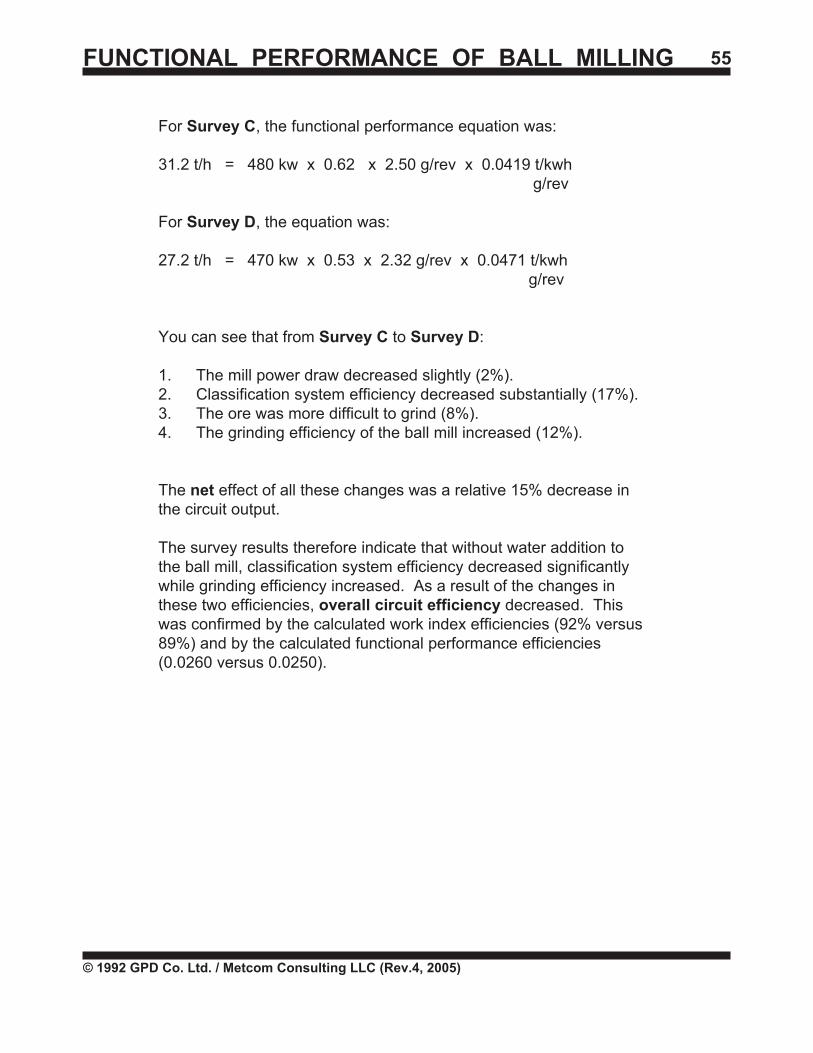
For Survey C, the functional performance equation was:
31.2 t/h = 480 kw x 0.62 x 2.50 g/rev x 0.0419 t/kwh g/rev
For Survey D, the equation was:
27.2 t/h = 470 kw x 0.53 x 2.32 g/rev x 0.0471 t/kwh g/rev
You can see that from Survey C to Survey D:
1. The mill power draw decreased slightly (2%).2. Classification system efficiency decreased substantially (17%).3. The ore was more difficult to grind (8%).4. The grinding efficiency of the ball mill increased (12%).
The net effect of all these changes was a relative 15% decrease inthe circuit output.
The survey results therefore indicate that without water addition tothe ball mill, classification system efficiency decreased significantlywhile grinding efficiency increased. As a result of the changes inthese two efficiencies, overall circuit efficiency decreased. Thiswas confirmed by the calculated work index efficiencies (92% versus89%) and by the calculated functional performance efficiencies(0.0260 versus 0.0250).
FUNCTIONAL PERFORMANCE OF BALL MILLING 56
© 1992 GPD Co. Ltd. / Metcom Consulting LLC (Rev.4, 2005)
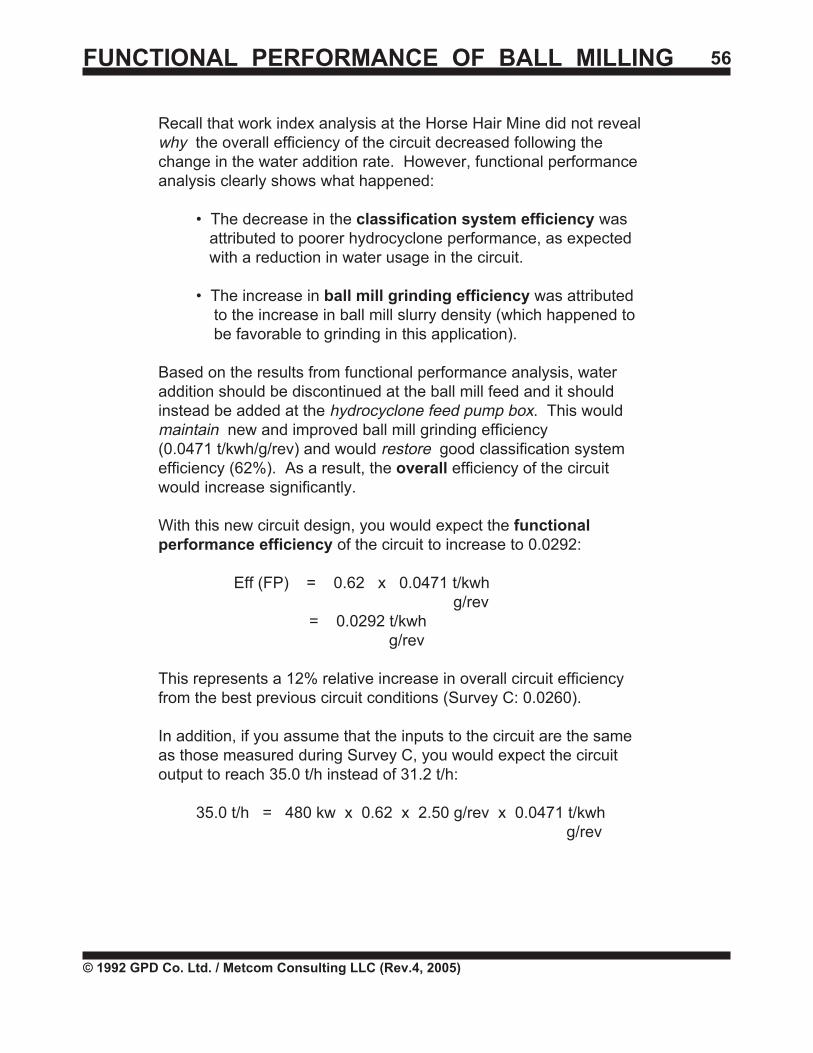
Recall that work index analysis at the Horse Hair Mine did not revealwhy the overall efficiency of the circuit decreased following thechange in the water addition rate. However, functional performanceanalysis clearly shows what happened:
• The decrease in the classification system efficiency was attributed to poorer hydrocyclone performance, as expected with a reduction in water usage in the circuit.
• The increase in ball mill grinding efficiency was attributed to the increase in ball mill slurry density (which happened to be favorable to grinding in this application).
Based on the results from functional performance analysis, wateraddition should be discontinued at the ball mill feed and it shouldinstead be added at the hydrocyclone feed pump box. This wouldmaintain new and improved ball mill grinding efficiency(0.0471 t/kwh/g/rev) and would restore good classification systemefficiency (62%). As a result, the overall efficiency of the circuitwould increase significantly.
With this new circuit design, you would expect the functionalperformance efficiency of the circuit to increase to 0.0292:
Eff (FP) = 0.62 x 0.0471 t/kwh g/rev
= 0.0292 t/kwh g/rev
This represents a 12% relative increase in overall circuit efficiencyfrom the best previous circuit conditions (Survey C: 0.0260).
In addition, if you assume that the inputs to the circuit are the sameas those measured during Survey C, you would expect the circuitoutput to reach 35.0 t/h instead of 31.2 t/h:
35.0 t/h = 480 kw x 0.62 x 2.50 g/rev x 0.0471 t/kwh g/rev
FUNCTIONAL PERFORMANCE OF BALL MILLING 57
© 1992 GPD Co. Ltd. / Metcom Consulting LLC (Rev.4, 2005)
This means that a simple change in the selection of the wateraddition point can increase the efficiency and output of this circuit by12%. Parameters such as hydrocyclone adjustments and balldiameter have not even yet been explored!
So far, we have presented you with only one example of how to studythe effect of a variable on overall circuit efficiency through functionalperformance analysis. With the results from properly conducted plantsurveys, you can explore many ways in which to run your grindingcircuit more efficiently, thanks to the functional performance equation!
Solve the following exercise.
FUNCTIONAL PERFORMANCE OF BALL MILLING 58
© 1992 GPD Co. Ltd. / Metcom Consulting LLC (Rev.4, 2005)
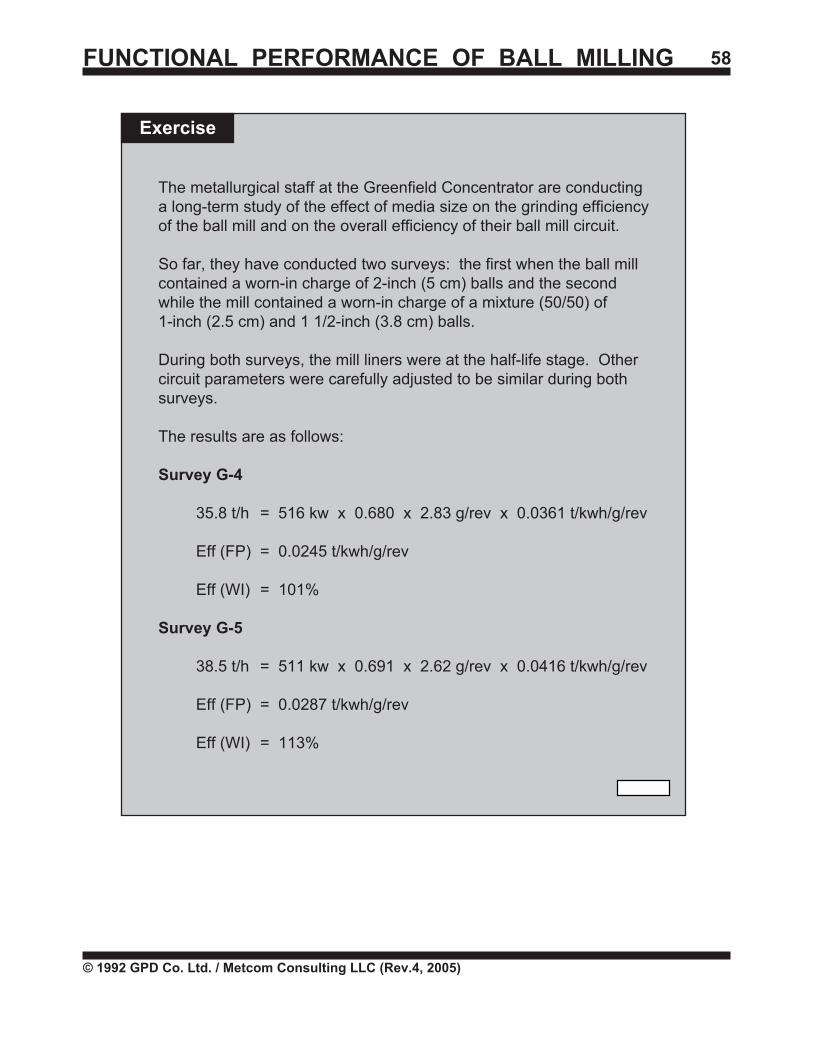
The metallurgical staff at the Greenfield Concentrator are conductinga long-term study of the effect of media size on the grinding efficiencyof the ball mill and on the overall efficiency of their ball mill circuit.
So far, they have conducted two surveys: the first when the ball millcontained a worn-in charge of 2-inch (5 cm) balls and the secondwhile the mill contained a worn-in charge of a mixture (50/50) of1-inch (2.5 cm) and 1 1/2-inch (3.8 cm) balls.
During both surveys, the mill liners were at the half-life stage. Othercircuit parameters were carefully adjusted to be similar during bothsurveys.
The results are as follows:
Survey G-4
35.8 t/h = 516 kw x 0.680 x 2.83 g/rev x 0.0361 t/kwh/g/rev
Eff (FP) = 0.0245 t/kwh/g/rev
Eff (WI) = 101%
Survey G-5
38.5 t/h = 511 kw x 0.691 x 2.62 g/rev x 0.0416 t/kwh/g/rev
Eff (FP) = 0.0287 t/kwh/g/rev
Eff (WI) = 113%
Exercise
FUNCTIONAL PERFORMANCE OF BALL MILLING 59
© 1992 GPD Co. Ltd. / Metcom Consulting LLC (Rev.4, 2005)
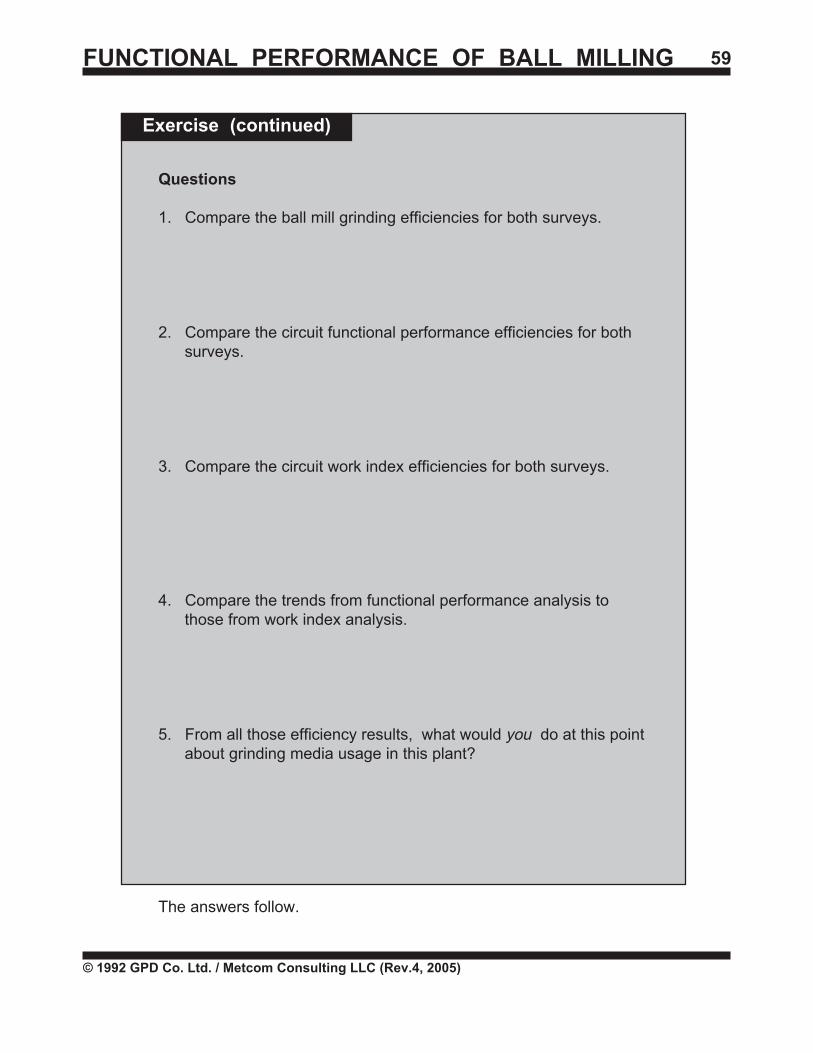
Questions
1. Compare the ball mill grinding efficiencies for both surveys.
2. Compare the circuit functional performance efficiencies for bothsurveys.
3. Compare the circuit work index efficiencies for both surveys.
4. Compare the trends from functional performance analysis tothose from work index analysis.
5. From all those efficiency results, what would you do at this pointabout grinding media usage in this plant?
The answers follow.
Exercise (continued)
FUNCTIONAL PERFORMANCE OF BALL MILLING 60
© 1992 GPD Co. Ltd. / Metcom Consulting LLC (Rev.4, 2005)
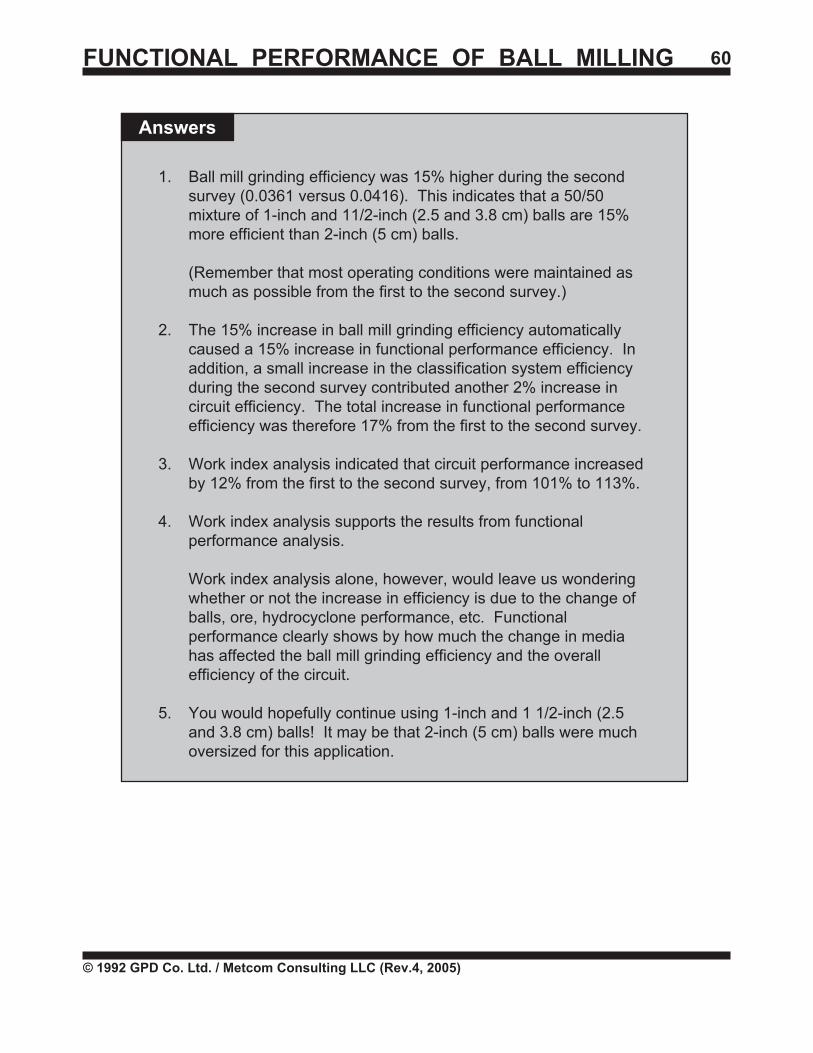
1. Ball mill grinding efficiency was 15% higher during the secondsurvey (0.0361 versus 0.0416). This indicates that a 50/50mixture of 1-inch and 11/2-inch (2.5 and 3.8 cm) balls are 15%more efficient than 2-inch (5 cm) balls.
(Remember that most operating conditions were maintained asmuch as possible from the first to the second survey.)
2. The 15% increase in ball mill grinding efficiency automaticallycaused a 15% increase in functional performance efficiency. Inaddition, a small increase in the classification system efficiencyduring the second survey contributed another 2% increase incircuit efficiency. The total increase in functional performanceefficiency was therefore 17% from the first to the second survey.
3. Work index analysis indicated that circuit performance increasedby 12% from the first to the second survey, from 101% to 113%.
4. Work index analysis supports the results from functionalperformance analysis.
Work index analysis alone, however, would leave us wonderingwhether or not the increase in efficiency is due to the change ofballs, ore, hydrocyclone performance, etc. Functionalperformance clearly shows by how much the change in mediahas affected the ball mill grinding efficiency and the overallefficiency of the circuit.
5. You would hopefully continue using 1-inch and 1 1/2-inch (2.5and 3.8 cm) balls! It may be that 2-inch (5 cm) balls were muchoversized for this application.
Answers
FUNCTIONAL PERFORMANCE OF BALL MILLING 61
© 1992 GPD Co. Ltd. / Metcom Consulting LLC (Rev.4, 2005)
Of course, economics plays a major role in decision making whetherit is for selecting media size, changing equipment, boosting tonnage,etc. In the following module entitled "Grinding and Plant Economics",you will learn how to deal with economic issues.
How accurate are your functional performance values? Find out inthe following section.
FUNCTIONAL PERFORMANCE OF BALL MILLING 62
© 1992 GPD Co. Ltd. / Metcom Consulting LLC (Rev.4, 2005)
As discussed in the module entitled "Work Index Efficiency", thereare variations in the accuracy of all measured and calculatedperformance parameters due to sampling, plant and laboratorymeasurements, and circuit instability.
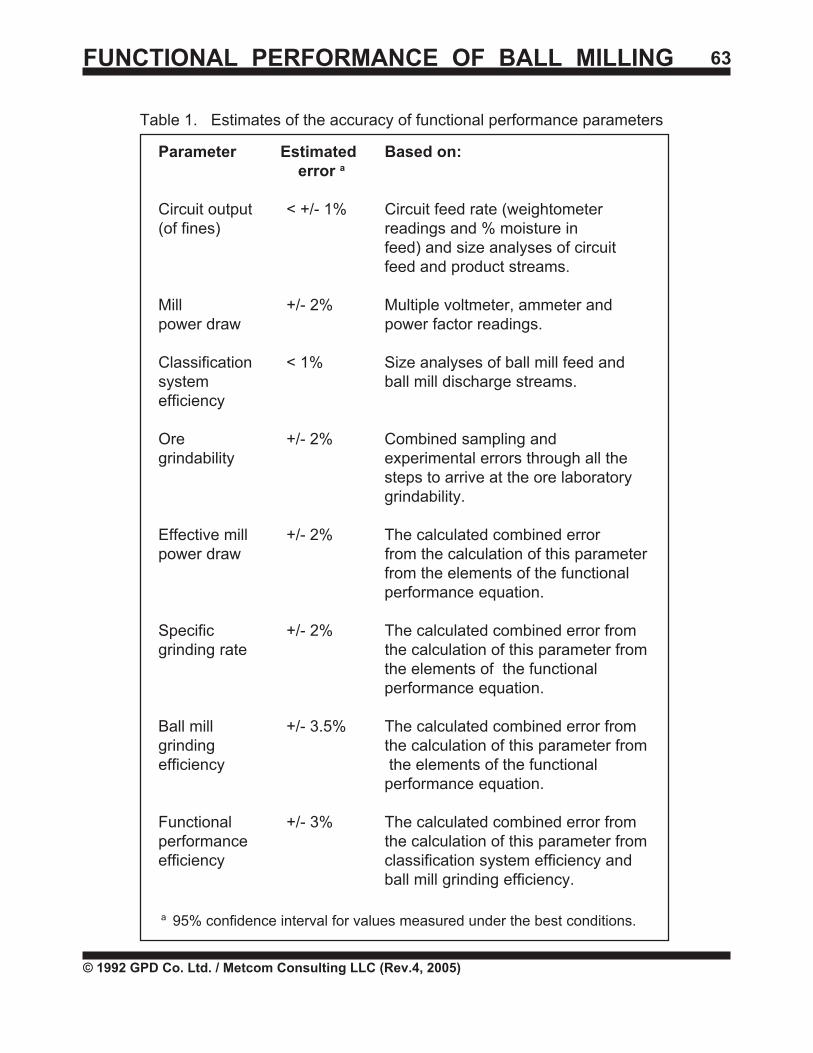
Table 1 provides estimates of the accuracy (roughly, the 95%confidence interval* ) in the relative values of ball mill circuitfunctional performance parameters as determined under the bestconditions.
The "best conditions" imply that:
• Comparisons are made between two sets of data collected on thesame circuit.
• Circuit stability has been verified in each case.
• All sampling and analysis were carried out using the sameequipment (including a rotary splitter for sample division) andprocedures.
RELATIVE ACCURACY OF FUNCTIONALPERFORMANCE PARAMETERS
FUNCTIONAL PERFORMANCE OF BALL MILLING 63
© 1992 GPD Co. Ltd. / Metcom Consulting LLC (Rev.4, 2005)
Table 1. Estimates of the accuracy of functional performance parameters
Parameter Estimated Based on: error a
Circuit output < +/- 1% Circuit feed rate (weightometer(of fines) readings and % moisture in
feed) and size analyses of circuitfeed and product streams.
Mill +/- 2% Multiple voltmeter, ammeter andpower draw power factor readings.
Classification < 1% Size analyses of ball mill feed andsystem ball mill discharge streams.efficiency
Ore +/- 2% Combined sampling andgrindability experimental errors through all the
steps to arrive at the ore laboratorygrindability.
Effective mill +/- 2% The calculated combined errorpower draw from the calculation of this parameter
from the elements of the functionalperformance equation.
Specific +/- 2% The calculated combined error fromgrinding rate the calculation of this parameter from
the elements of the functionalperformance equation.
Ball mill +/- 3.5% The calculated combined error fromgrinding the calculation of this parameter fromefficiency the elements of the functional
performance equation.
Functional +/- 3% The calculated combined error fromperformance the calculation of this parameter fromefficiency classification system efficiency and
ball mill grinding efficiency.
a 95% confidence interval for values measured under the best conditions.

FUNCTIONAL PERFORMANCE OF BALL MILLING 64
© 1992 GPD Co. Ltd. / Metcom Consulting LLC (Rev.4, 2005)
Note
Recall that the accuracy (approximate 95% confidence interval) ofrelative work index efficiency determinations is +/- 3% whendetermined under the best conditions.
Since it is simpler to calculate "functional performance efficiency"than to calculate "work index efficiency", functional performanceefficiency is statistically more accurate than work index efficiency.
The difference between parameters evaluated from two circuitsurveys must exceed the values listed in Table 1 for them to bestatistically different. An example follows.
Power draw readings for a ball mill during two surveys were 958 and931 kw respectively. For these two values to be statistically different,they must vary by more than 2% (use the average of the two valuesat the denominator):
958 - 931 kw = 2.9% 945 kw
This calculation indicates that the two values of power draw arestatistically different.
Solve the following exercise using the information in Table 1.
Example
FUNCTIONAL PERFORMANCE OF BALL MILLING 65
© 1992 GPD Co. Ltd. / Metcom Consulting LLC (Rev.4, 2005)
Exercise
The answer follows.
Determine if the two values of ball mill grinding efficiency, 0.0452and 0.0466, are statistically different.
FUNCTIONAL PERFORMANCE OF BALL MILLING 66
© 1992 GPD Co. Ltd. / Metcom Consulting LLC (Rev.4, 2005)
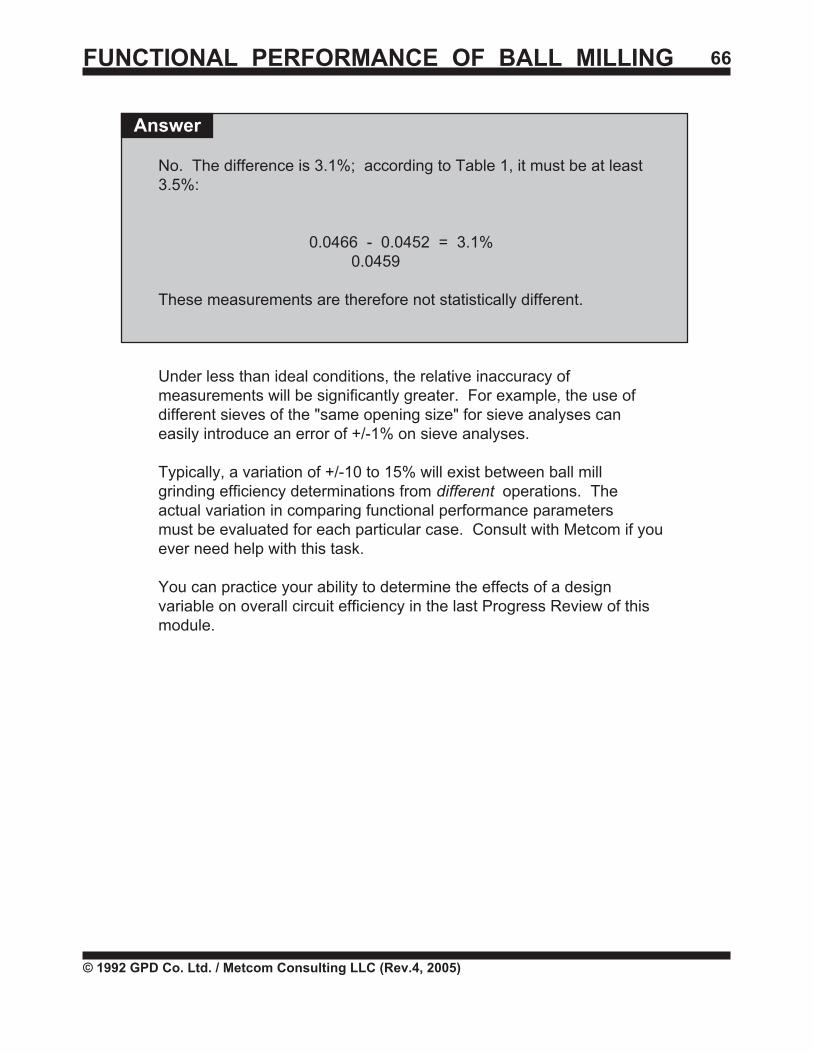
No. The difference is 3.1%; according to Table 1, it must be at least3.5%:
0.0466 - 0.0452 = 3.1% 0.0459
These measurements are therefore not statistically different.
Under less than ideal conditions, the relative inaccuracy ofmeasurements will be significantly greater. For example, the use ofdifferent sieves of the "same opening size" for sieve analyses caneasily introduce an error of +/-1% on sieve analyses.
Typically, a variation of +/-10 to 15% will exist between ball millgrinding efficiency determinations from different operations. Theactual variation in comparing functional performance parametersmust be evaluated for each particular case. Consult with Metcom if youever need help with this task.
You can practice your ability to determine the effects of a designvariable on overall circuit efficiency in the last Progress Review of thismodule.
Answer
FUNCTIONAL PERFORMANCE OF BALL MILLING 67
© 1992 GPD Co. Ltd. / Metcom Consulting LLC (Rev.4, 2005)
There is only one problem in this Progress Review. Refer back to thefunctional performance equation presented on page 36 if necessary.
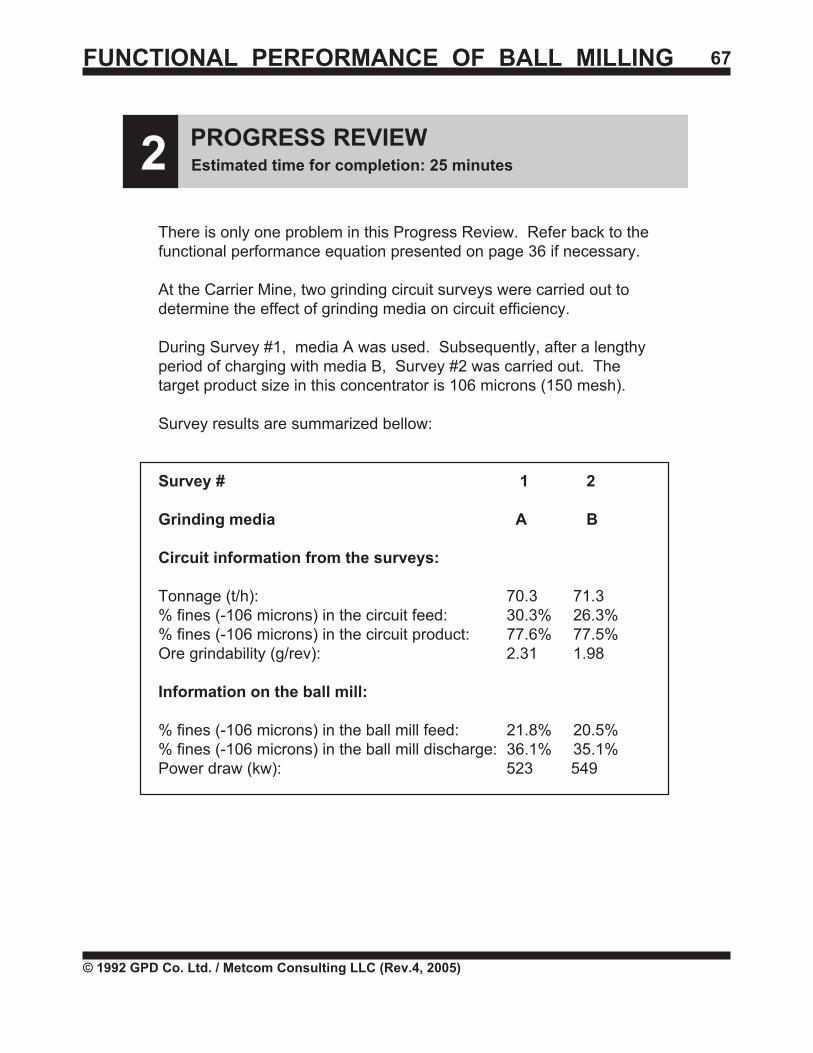
At the Carrier Mine, two grinding circuit surveys were carried out todetermine the effect of grinding media on circuit efficiency.
During Survey #1, media A was used. Subsequently, after a lengthyperiod of charging with media B, Survey #2 was carried out. Thetarget product size in this concentrator is 106 microns (150 mesh).
Survey results are summarized bellow:
Survey # 1 2
Grinding media A B
Circuit information from the surveys:
Tonnage (t/h): 70.3 71.3% fines (-106 microns) in the circuit feed: 30.3% 26.3%% fines (-106 microns) in the circuit product: 77.6% 77.5%Ore grindability (g/rev): 2.31 1.98
Information on the ball mill:
% fines (-106 microns) in the ball mill feed: 21.8% 20.5%% fines (-106 microns) in the ball mill discharge: 36.1% 35.1%Power draw (kw): 523 549
2 PROGRESS REVIEWEstimated time for completion: 25 minutes
FUNCTIONAL PERFORMANCE OF BALL MILLING 68
© 1992 GPD Co. Ltd. / Metcom Consulting LLC (Rev.4, 2005)
2 PROGRESS REVIEW(continued)
Questions
1. What was the circuit output during each survey?
Survey #1:
Survey #2:
2. What was the classification system efficiency during each survey?
Survey #1:
Survey #2:
3. What was the effective mill power draw during each survey?
Survey #1:
Survey #2:
4. What was the specific grinding rate of the mill during eachsurvey?
Survey #1:
Survey #2:
FUNCTIONAL PERFORMANCE OF BALL MILLING 69
© 1992 GPD Co. Ltd. / Metcom Consulting LLC (Rev.4, 2005)
5. What was the ball mill grinding efficiency during eachsurvey?
Survey #1:
Survey #2:
6. Write the functional performance equation for each survey.
Survey #1:
Survey #2:
7. What was the functional performance efficiency of the circuitduring each survey?
Survey #1:
Survey #2:
2 PROGRESS REVIEW(continued)
FUNCTIONAL PERFORMANCE OF BALL MILLING 70
© 1992 GPD Co. Ltd. / Metcom Consulting LLC (Rev.4, 2005)
8. Comment on an increase or decrease of the following itemsfrom Survey #1 to Survey #2.
Increased Decreased
Circuit output
Ball mill power draw
Classification system efficiency
Effective mill power draw
Ore grindability
Ball mill specific grinding rate
Ball mill grinding efficiency
Functional performance efficiency
2 PROGRESS REVIEW(continued)
FUNCTIONAL PERFORMANCE OF BALL MILLING 71
© 1992 GPD Co. Ltd. / Metcom Consulting LLC (Rev.4, 2005)
9. Assuming that all the comparative data were generated under ideal conditions, select the items which varied enough to be statistically different. Use the space below for your calculations.
Circuit output
Ball mill power draw
Classification system efficiency
Effective mill power draw
Ore grindability
Ball mill specific grinding rate
Ball mill grinding efficiency
Functional performance efficiency
2 PROGRESS REVIEW(continued)
FUNCTIONAL PERFORMANCE OF BALL MILLING 72
© 1992 GPD Co. Ltd. / Metcom Consulting LLC (Rev.4, 2005)
10. What do you conclude about the effect of using media B over media A on the ball mill grinding efficiency of this circuit from this testwork?
_______________________________________
The answers follow.
2 PROGRESS REVIEW(continued)
FUNCTIONAL PERFORMANCE OF BALL MILLING 73
© 1992 GPD Co. Ltd. / Metcom Consulting LLC (Rev.4, 2005)
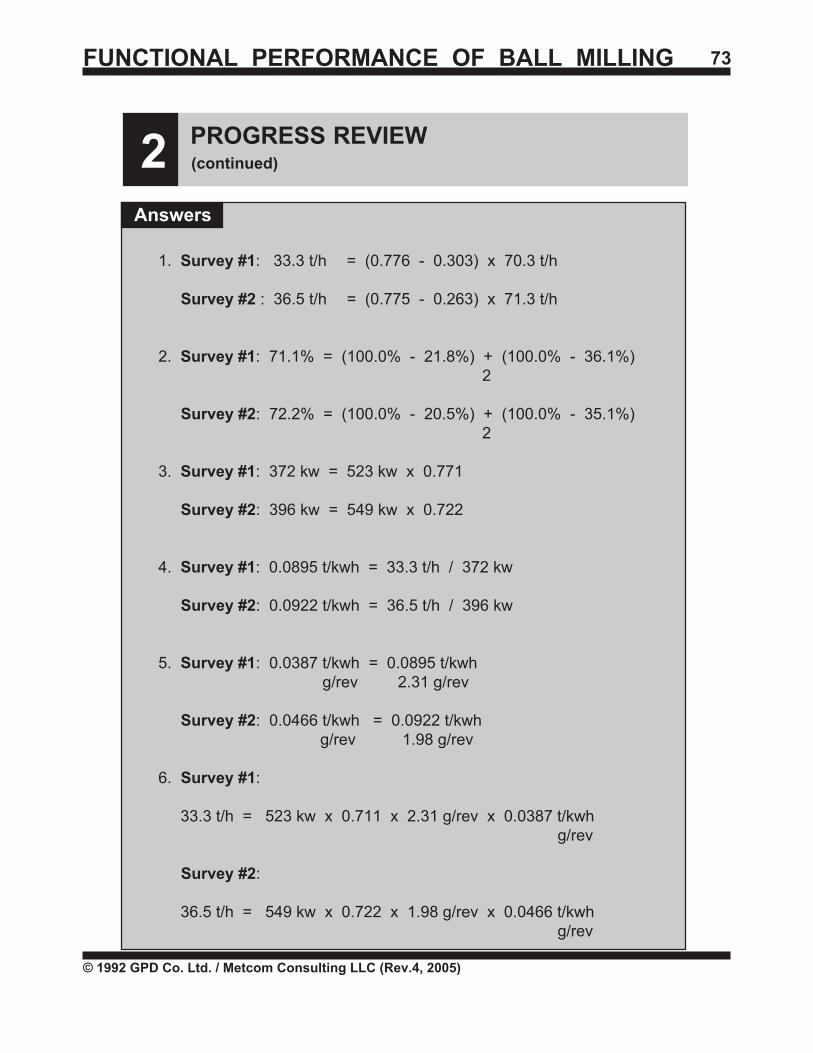
Answers
1. Survey #1: 33.3 t/h = (0.776 - 0.303) x 70.3 t/h
Survey #2 : 36.5 t/h = (0.775 - 0.263) x 71.3 t/h
2. Survey #1: 71.1% = (100.0% - 21.8%) + (100.0% - 36.1%) 2
Survey #2: 72.2% = (100.0% - 20.5%) + (100.0% - 35.1%) 2
3. Survey #1: 372 kw = 523 kw x 0.771
Survey #2: 396 kw = 549 kw x 0.722
4. Survey #1: 0.0895 t/kwh = 33.3 t/h / 372 kw
Survey #2: 0.0922 t/kwh = 36.5 t/h / 396 kw
5. Survey #1: 0.0387 t/kwh = 0.0895 t/kwh g/rev 2.31 g/rev
Survey #2: 0.0466 t/kwh = 0.0922 t/kwh g/rev 1.98 g/rev
6. Survey #1:
33.3 t/h = 523 kw x 0.711 x 2.31 g/rev x 0.0387 t/kwh g/rev
Survey #2:
36.5 t/h = 549 kw x 0.722 x 1.98 g/rev x 0.0466 t/kwh g/rev
2 PROGRESS REVIEW(continued)
FUNCTIONAL PERFORMANCE OF BALL MILLING 74
© 1992 GPD Co. Ltd. / Metcom Consulting LLC (Rev.4, 2005)
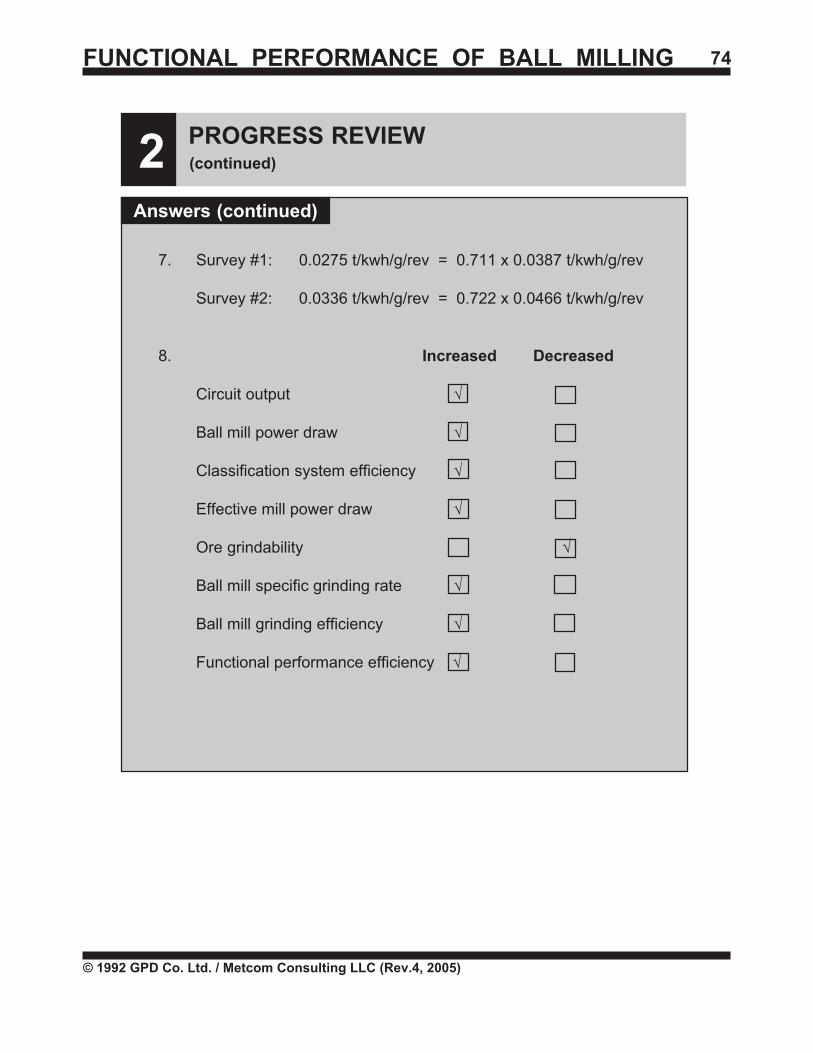
7. Survey #1: 0.0275 t/kwh/g/rev = 0.711 x 0.0387 t/kwh/g/rev
Survey #2: 0.0336 t/kwh/g/rev = 0.722 x 0.0466 t/kwh/g/rev
8. Increased Decreased
Circuit output š
Ball mill power draw š
Classification system efficiency š
Effective mill power draw š
Ore grindability š
Ball mill specific grinding rate š
Ball mill grinding efficiency š
Functional performance efficiency š
2 PROGRESS REVIEW(continued)
Answers (continued)
FUNCTIONAL PERFORMANCE OF BALL MILLING 75
© 1992 GPD Co. Ltd. / Metcom Consulting LLC (Rev.4, 2005)
2 PROGRESS REVIEW(continued)
Answers (continued)
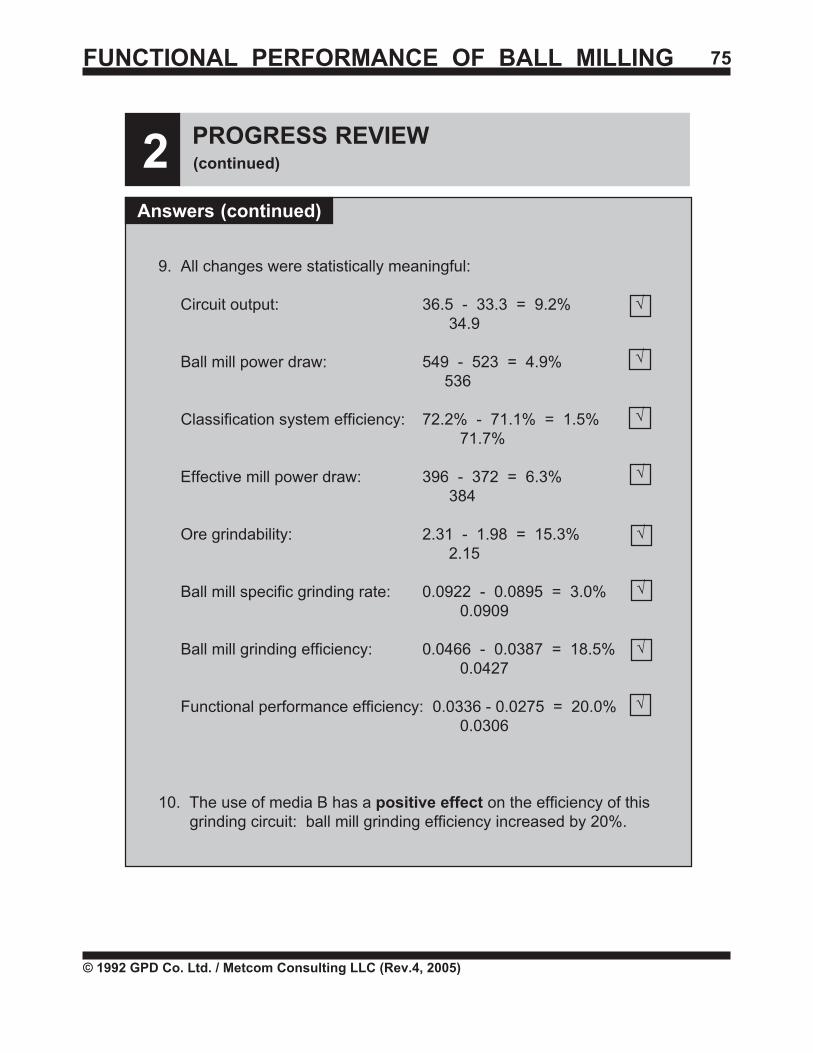
9. All changes were statistically meaningful:
Circuit output: 36.5 - 33.3 = 9.2% 34.9
Ball mill power draw: 549 - 523 = 4.9% 536
Classification system efficiency: 72.2% - 71.1% = 1.5%71.7%
Effective mill power draw: 396 - 372 = 6.3% 384
Ore grindability: 2.31 - 1.98 = 15.3% 2.15
Ball mill specific grinding rate: 0.0922 - 0.0895 = 3.0%0.0909
Ball mill grinding efficiency: 0.0466 - 0.0387 = 18.5%0.0427
Functional performance efficiency: 0.0336 - 0.0275 = 20.0%0.0306
10. The use of media B has a positive effect on the efficiency of this grinding circuit: ball mill grinding efficiency increased by 20%.
š
š
š
š
š
š
š
š
FUNCTIONAL PERFORMANCE OF BALL MILLING 76
© 1992 GPD Co. Ltd. / Metcom Consulting LLC (Rev.4, 2005)
The circuit work index efficiency during the two surveys presented inthis Progress Review was also calculated: the results showed thatwork index efficiency increased from 101% to 112%. This supportsthe trend of increased efficiency observed through functionalperfomance analysis.
Note that the (112% - 101%) 11% change in work index efficiencydoes not identify the cause(s) of the improvement in overall circuitefficiency in this study. Many things changed from the first to thesecond survey (the ore, the circulating load, hydrocycloneperformance, etc.) which could affect overall circuit efficiency. Onlythrough functional performance analysis was it possible to identify anincrease in the efficiency of the breakage environment of the ball mill,and thus relate the increase in overall circuit efficiency to the changein grinding media.
How did you do in this Progress Review?
• Well? Fantastic!• Not so well? It may take some time and practice on information from your own plant before you can really feel comfortable with the new terms of functional performance analysis.
You have completed all the work in the module. Congratulations!
FUNCTIONAL PERFORMANCE OF BALL MILLING 77
© 1992 GPD Co. Ltd. / Metcom Consulting LLC (Rev.4, 2005)
CLOSING WORD
We hope that you have enjoyed completing this module. We alsohope you will successfully use functional performance analysis (andwork index analysis) on the grinding circuit(s) in your plant.
Before quitting, go to Appendix A where a short review on theselection of the appropriate grindability test for functionalperformance analysis is presented.
FUNCTIONAL PERFORMANCE OF BALL MILLING 78
© 1992 GPD Co. Ltd. / Metcom Consulting LLC (Rev.4, 2005)
REFERENCES
McIvor, R.E., "Classification Effects in Wet Ball Milling Circuits",Mining Engineering, August 1988, pp. 815-820.
McIvor, R.E., Lavallée, M.L., Wood, K.R., Blythe, P.M. and Finch,J.A., "Functional Performance of Ball Milling", MiningEngineering, March 1990, pp. 269-276.
McIvor, R.E., "Technoeconomic Analysis of Plant GrindingOperations", Ph. D. Thesis, McGill University, Montreal,1989.
FUNCTIONAL PERFORMANCE OF BALL MILLING 79
© 1992 GPD Co. Ltd. / Metcom Consulting LLC (Rev.4, 2005)
APPENDIX A
SELECTION OF THE GRINDABILITY VALUE TO USEIN FUNCTIONAL PERFORMANCE ANALYSIS
The topic of "grindability" will be covered in detail in the moduleentitled "Introduction to Grindability Testing".
What you need to know at this point in time is that "grindability" isexpressed in grams per revolution (of fines or new product) createdin a laboratory test mill. "Grindability" can be determined byperforming either a:
• Bond ball mill work index (locked-cycle) test on circuit feed (ore).• On-site grindability test (single batch) on the coarse solids in the ball mill feed.
Throughout this module on functional performance analysis, wecompare the grinding rate of the material in the plant ball mill to thegrindability of the circuit feed in a Bond ball mill test to obtain "ball millgrinding efficiency":
Ball mill grinding Ball mill efficiency = specific grinding rate (t/kwh) t/kwh Ore grindability (g/rev)
g/rev
To date, the Metcom System has almost exclusively used the grindabilityof circuit feeds measured in a Bond ball mill work index test forfunctional performance analysis since the Bond work index test hasbeen traditionally performed on circuit feeds from detailed plantsurveys. (The Bond work index of the ore is needed for work indexanalysis.)
( )
FUNCTIONAL PERFORMANCE OF BALL MILLING 80
© 1992 GPD Co. Ltd. / Metcom Consulting LLC (Rev.4, 2005)
However, you can always use the grindability of the plant ball millfeed as measured in an on-site batch grindability test. Thisgrindability value reflects the ease of grind of the coarse particlesthat actually go into the ball mill. On-site batch grindability istherefore the ideal parameter for determining ball mill grindingefficiency. Simply be aware that the value in the functionalperformance equation would not be "ore grindability" but rather "ballmill feed grindability".
To compare two or more functional performance equations, thevalues of "ore grindability" must be of the same origin: from a Bondball mill test or on-site batch grindability test.
In addition, if you use the Bond grindability of ore (circuit feed) foryour comparisons, circuit feeds in the analyses must be similar insize (K80).
FUNCTIONAL PERFORMANCE OF BALL MILLING 81
© 1992 GPD Co. Ltd. / Metcom Consulting LLC (Rev.4, 2005)
GLOSSARY
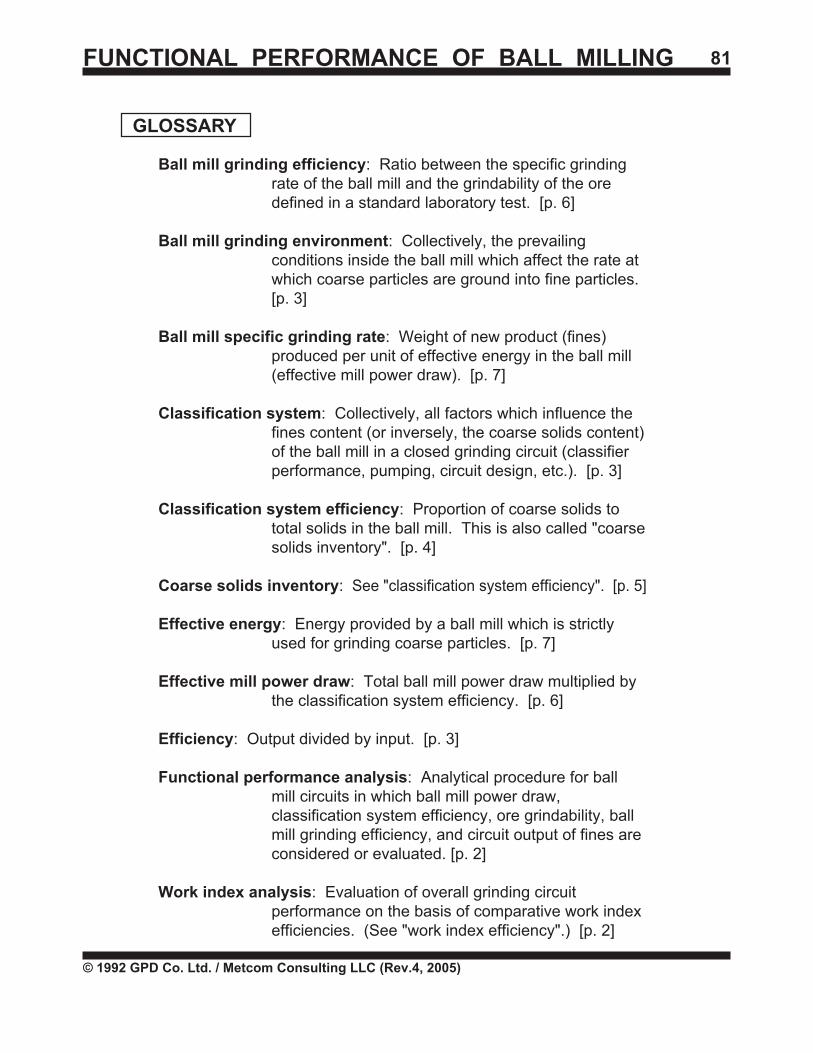
Ball mill grinding efficiency: Ratio between the specific grindingrate of the ball mill and the grindability of the oredefined in a standard laboratory test. [p. 6]
Ball mill grinding environment: Collectively, the prevailingconditions inside the ball mill which affect the rate atwhich coarse particles are ground into fine particles.[p. 3]
Ball mill specific grinding rate: Weight of new product (fines)produced per unit of effective energy in the ball mill(effective mill power draw). [p. 7]
Classification system: Collectively, all factors which influence thefines content (or inversely, the coarse solids content)of the ball mill in a closed grinding circuit (classifierperformance, pumping, circuit design, etc.). [p. 3]
Classification system efficiency: Proportion of coarse solids tototal solids in the ball mill. This is also called "coarsesolids inventory". [p. 4]
Coarse solids inventory: See "classification system efficiency". [p. 5]
Effective energy: Energy provided by a ball mill which is strictlyused for grinding coarse particles. [p. 7]
Effective mill power draw: Total ball mill power draw multiplied bythe classification system efficiency. [p. 6]
Efficiency: Output divided by input. [p. 3]
Functional performance analysis: Analytical procedure for ballmill circuits in which ball mill power draw,classification system efficiency, ore grindability, ballmill grinding efficiency, and circuit output of fines areconsidered or evaluated. [p. 2]
Work index analysis: Evaluation of overall grinding circuitperformance on the basis of comparative work indexefficiencies. (See "work index efficiency".) [p. 2]
FUNCTIONAL PERFORMANCE OF BALL MILLING 82
© 1992 GPD Co. Ltd. / Metcom Consulting LLC (Rev.4, 2005)
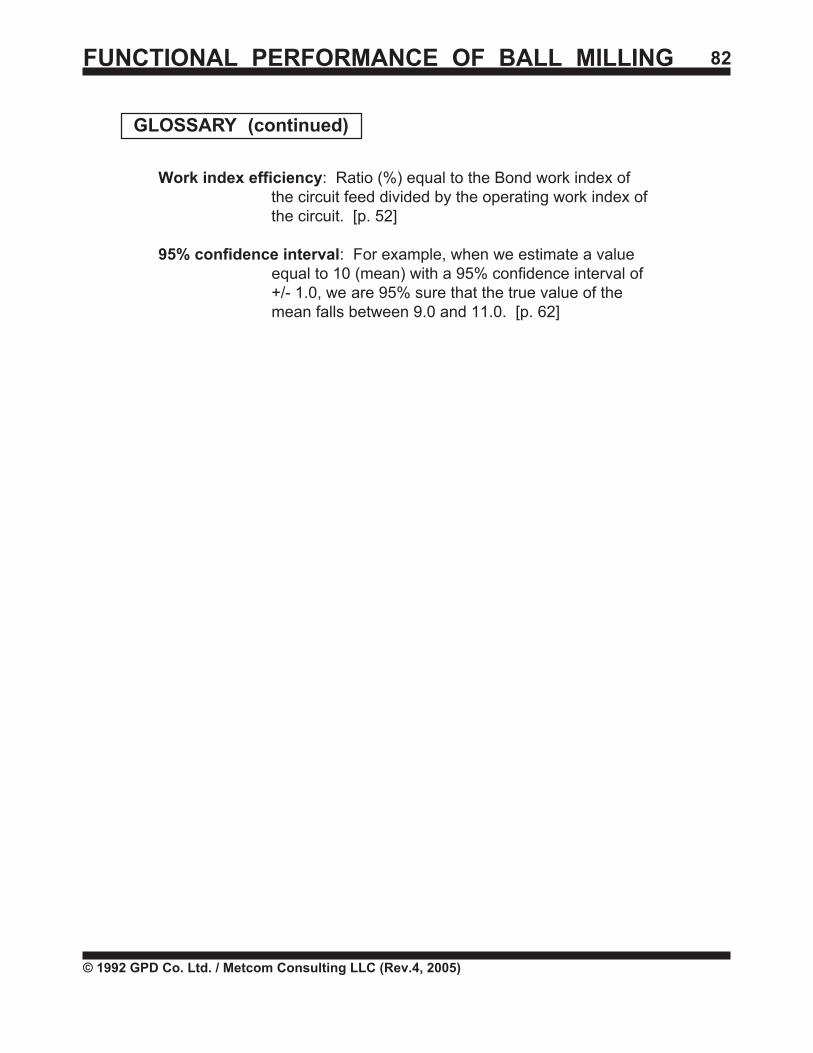
Work index efficiency: Ratio (%) equal to the Bond work index ofthe circuit feed divided by the operating work index ofthe circuit. [p. 52]
95% confidence interval: For example, when we estimate a valueequal to 10 (mean) with a 95% confidence interval of+/- 1.0, we are 95% sure that the true value of themean falls between 9.0 and 11.0. [p. 62]
GLOSSARY (continued)