MODULE 6 HANDOUTS STRATEGIC MANAGEMENT · 2015-10-12 · Strategic management--the process of...
16
MODULE 6 HANDOUTS STRATEGIC MANAGEMENT
Transcript of MODULE 6 HANDOUTS STRATEGIC MANAGEMENT · 2015-10-12 · Strategic management--the process of...
MODULE 6 HANDOUTS
STRATEGIC MANAGEMENT
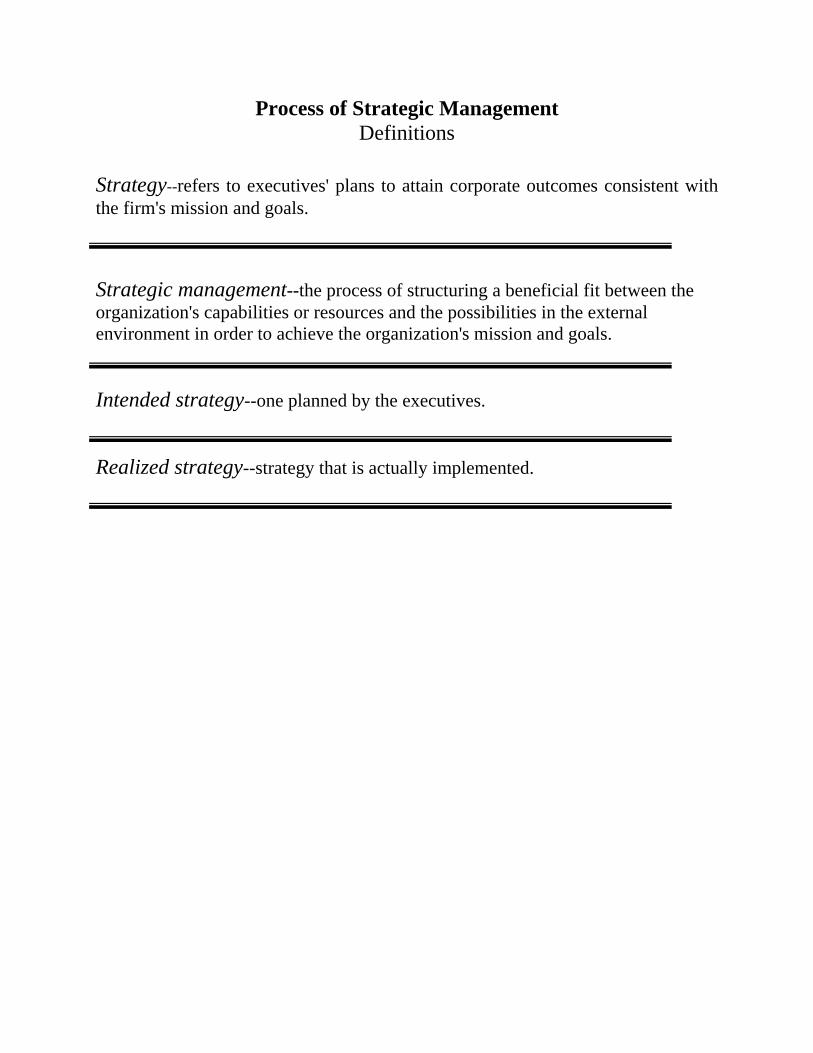
Process of Strategic Management Definitions
Strategy--refers to executives' plans to attain corporate outcomes consistent with the firm's mission and goals. Strategic management--the process of structuring a beneficial fit between the organization's capabilities or resources and the possibilities in the external environment in order to achieve the organization's mission and goals. Intended strategy--one planned by the executives. Realized strategy--strategy that is actually implemented.

Levels of Strategy
Strategy can be conceived at three levels: Corporate, strategic business unit (SBU), or functional.
Corporate Strategy Defines in what businesses or industries the
firm will operate over the long term (5 years or more)..
Strategic business unit Defines how the SBUs that make up the firm will compete in the businesses or industries chosen and achieve sustainable competitive
advantage.
Functional strategies Each SBU has functional areas such as
finance, marketing, operations, and human resources. It is here where core competencies
are likely to be created and maintained. Functional strategies involve developing plans for each functional area that will facilitate the
SBU achieving a competitive advantage.

Corporate Strategy
Corporate Strategy involves portfolio analysis: the process of systematically assessing the different businesses in an M-form (multibusiness) enterprise to help executives formulate corporate strategy.
THE ORIGINAL BCG GROWTH/SHARE MATRIX--developed by the Boston Consulting Group (BCG) to help managers conduct portfolio analysis.
Basic Elements of the BCG Matrix:
1. Market-growth rate--represents the relative attractiveness of the market an SBU is in; usually rated "high" or "low," depending upon the product market growth relative to the economy.
2. Relative market-share position--comparison of SBU's market share to its largest rival's market share; thus, reflects an SBU's market strength.
3. The experience curve, which is a key element in the relationship between market share and performance, states that as accumulated production volume increases, costs per unit decrease.
The Boston Consulting Group’s Findings:
1. Firms should try to gain a high share of their market very early in the product life cycle since the total per unit cost of production decrease by 20 percent to 30 percent on a constant dollar basis every time total product experience doubles for the industry as a whole.
2. The producer who fails to reduce costs along the characteristic experience curve will
eventually be non-competitive.
3. The producer with the largest cumulative market share (for the given product) should always be able to maintain the lowest cost.
4. New products must nearly always be sold at price below costs until volume builds up, and
the producer moves out along the experience curve.
5. Price must eventually go down as fast as costs, if there is any competition at all in the industry.
6. Market share is unstable until one producer clearly dominates the market and its prices are
low enough to inhibit growth in the relative market share of any significant competitor, or until growth stops. See Figure 1.

Figure 1 *
*Circle size defines the size of each of the firm's SBU's relative to its others in terms of revenues. Stars and Cash Cows have achieved high relative market share positions and have thus led their industry down the experience curve. By doing so, these SBUs have achieved a cost leadership position. Question Marks and Dogs have not achieved significant market share relative to competitors and thus have not moved out on the experience curve relative to the competition, and therefore have high cost structures.
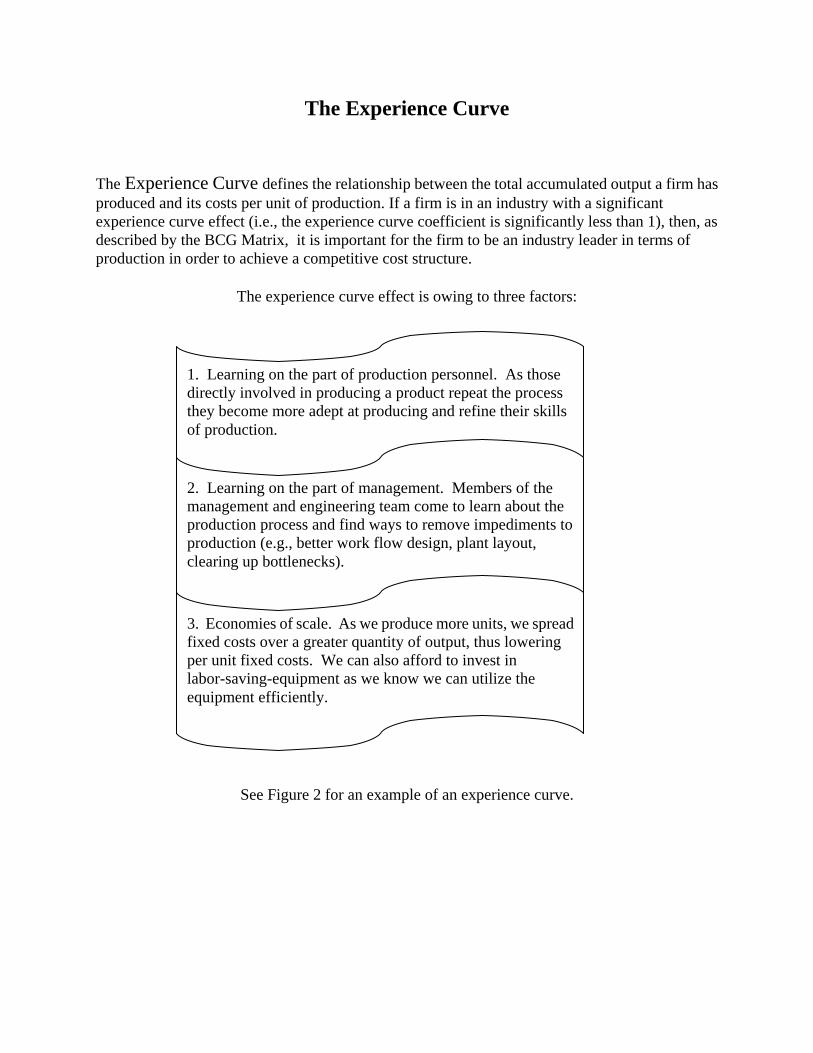
The Experience Curve
The Experience Curve defines the relationship between the total accumulated output a firm has produced and its costs per unit of production. If a firm is in an industry with a significant experience curve effect (i.e., the experience curve coefficient is significantly less than 1), then, as described by the BCG Matrix, it is important for the firm to be an industry leader in terms of production in order to achieve a competitive cost structure.
The experience curve effect is owing to three factors:
See Figure 2
1. Learning on the part of production personnel. As those directly involved in producing a product repeat the process they become more adept at producing and refine their skills of production.
3. Economies of scale. As we produce more units, we spread fixed costs over a greater quantity of output, thus lowering per unit fixed costs. We can also afford to invest in labor-saving-equipment as we know we can utilize the equipment efficiently.
2. Learning on the part of management. Members of the management and engineering team come to learn about the production process and find ways to remove impediments to production (e.g., better work flow design, plant layout, clearing up bottlenecks).
See Figure 2 for an example of an experience curve.

Figure 2
An 85% Experience Curve
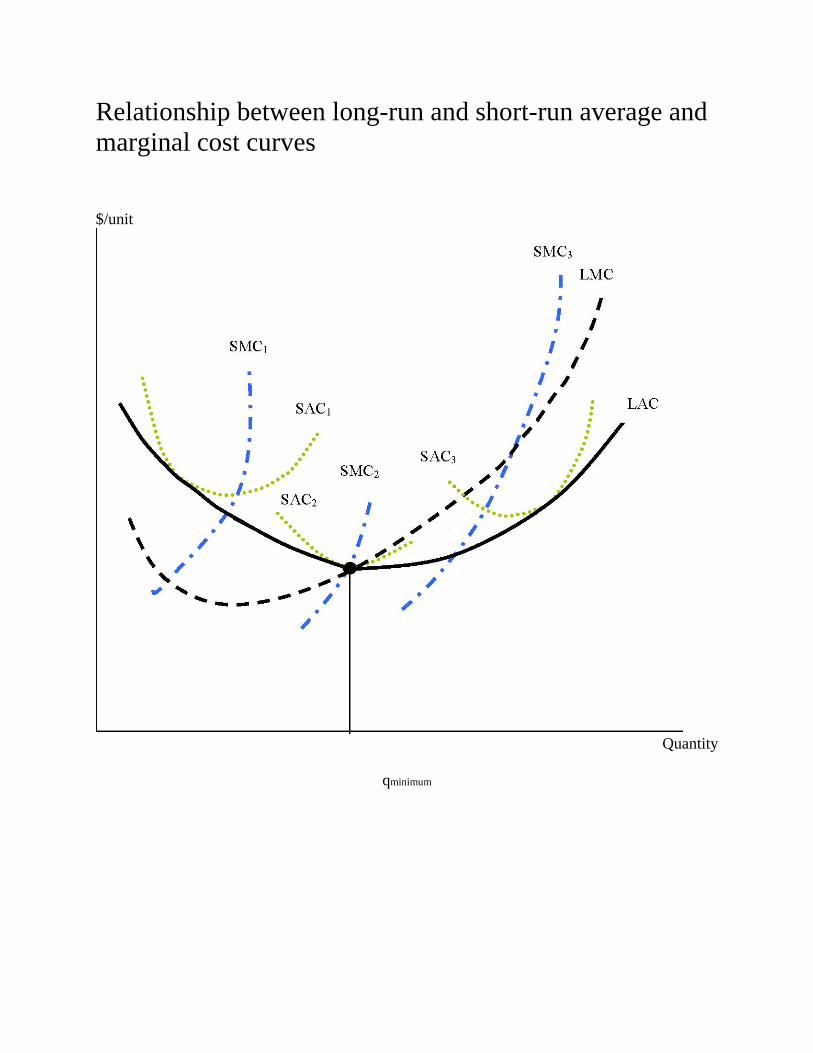
Relationship between long-run and short-run average and marginal cost curves
$/unit
Quantity
qminimum

Economies of Size
A firm is said to be subject to economies of size or scale when its LAC decreases as its output increases. Similarly, when LAC increases with output, the firm is said to be subject to diseconomies of size or scale.

SBU Categories in the BCG Model

Assessment of the original BCG matrix: Figure 3
Limitations to the original BCG Matrix approach include the fact that concepts like market share and growth rate are not easy to measure and that the dividing line between being judged "high" and "low" is arbitrary. In addition, some industries are not highly experience curve sensitive. It is also possible for small niche players to survive in industries that are highly experience curve sensitive.
A revised matrix includes the possibility that smaller businesses without substantial growth prospects can also be highly profitable. The revised matrix adds three types of businesses that should be supported--volume, specialization, and profitable fragmented businesses.
Figure 3 The Revised BCG Matrix
MAINTAIN AND SUPPORT DIVEST
Volume (emphasize market share leadership)
Stalemate
(regardless of relative market share)
Specialization
(emphasize maintenance of low market share)
Unprofitable Fragmented (regardless of relative market share) Profitable Fragmented
(do not emphasize market share)
Source: STRATEGIC MANAGEMENT, 3/E, by Wright/Kroll/Parnell, 1996. Adapted by permission of Prentice-Hall, Inc., Upper Saddle River, NJ.

Corporate Strategy Options
Basic choices on how to build and shape corporate portfolio
1. CONCENTRATION STRATEGY--firm devotes resources and attention to one dominant business; used by McDonald's, Coca-Cola, Campbell Soup Co., most major airlines, and retailers.
2. VERTICAL-INTEGRATION STRATEGY--could be forward-vertical integration (example:
manufacturer buys retail stores as outlets for its production) or backward-vertical integration (example: manufacturer buys source of raw materials or starts making parts needed that it used to buy from suppliers).
Forward: to gain control of customers and capture profits that might have been forgone. Risk: may not know what you're doing. Backward: to insure supply, and maybe convert cost center into a profit source. But again, may not know what you're doing.
3. DIVERSIFICATION STRATEGY--can be related (J.P. Morgan Chase buys Bear Sterns) or unrelated (Berkshire Hathaway buys part of Wrigley’s). May wish to enter new and more attractive markets, better growth prospects, get out of a declining industry, or to diversify risks.
Two forms: Concentric: related fields Conglomerate: unrelated Relationship between diversification and performance
Performance
Level of diversification
4. TURNAROUND/RETRENCHMENT STRATEGY— Steps: 1. Reduce fixed costs in order to lower the firm's break-even point.
2. Sell non-core assets in order to raise money to finance turnaround.
3. Launch new products/services in order to grow revenues. 5. DIVESTITURE STRATEGY--sale of some component of the portfolio, but as a going
concern.

6. LIQUIDATION STRATEGY--"last resort" strategy; typically means the firm is unable to use retrenchment or divestiture strategies; must sell the individual assets of the firm, and discontinue as a going concern.
Generic Strategies for Business Units
Low-cost, low-price strategy:
--Producing basic, no-frills outputs as inexpensively as possible, doing little in the way of promotion, but charging a modest price.
Differentiation strategy:
-- Producing products or services that are distinguished by quality features and amenities superior inputs are used, and known by brand names, thus commanding higher prices; usually supported with significant advertising and promotion.
Niche strategy:
--Producing a product or service, which meets the unique needs of a relatively small segment of a larger market with needs, which are not being met by products available in the market provided by karger competitors.
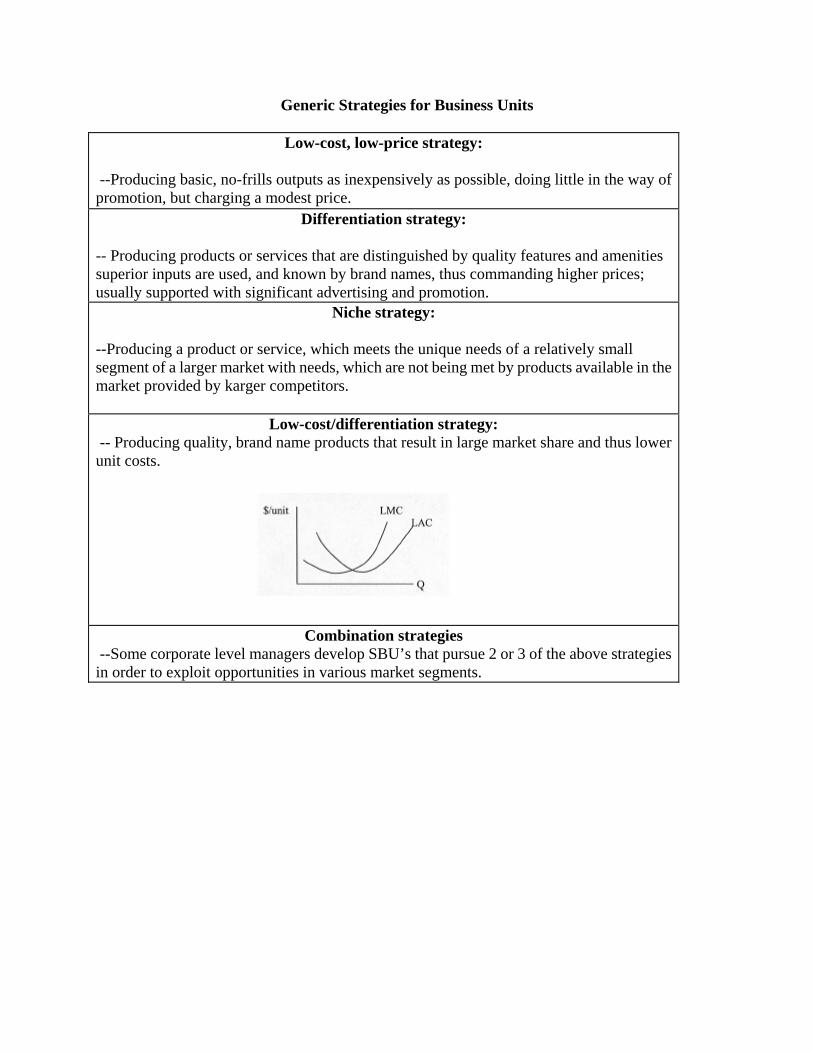
Low-cost/differentiation strategy: -- Producing quality, brand name products that result in large market share and thus lower unit costs.
Combination strategies --Some corporate level managers develop SBU’s that pursue 2 or 3 of the above strategies in order to exploit opportunities in various market segments.

Product-Market Strategies
1. DEFENDER STRATEGY--firm tries to maintain a secure niche in relatively stable product/service area, usually with limited product line and competitive prices.
2. PROSPECTOR STRATEGY--firm values being first with new products and is
constantly searching for new market opportunities (example: Apple Computer).
3. ANALYZER STRATEGY--firm maintains stable product/service line while
monitoring competitors for innovations, thus allowing firm to be "second in" with more cost-efficient products/services (example: IBM)
4. BALANCER STRATEGY--firm uses multiple product-market spheres combining
the three previous strategies (example: Philips--manufacturer of electronic products).
5. REACTOR STRATEGY--nonstrategy--firm does not have a consistent
product/market orientation (example: utility firms because of regulations).

Functional Strategies
Typically, core competencies which provide the firm with sustainable competitive advantage reside at the functional level. Developing core competencies involve development of a firm's knowledge, skills, and abilities in an area of technology with the intent of employing those resources in various product markets. Building sustainable competitive advantage through a RESOURCE-BASED THEORY APPROACH -- we are likely to achieve such an advantage by developing our organizational resources and organizational culture. There are some things we can do to facilitate that: 1. RECOGNIZE THE LIMITS OF ENVIRONMENTAL ANALYSIS: All firms usually have equal
access to environmental information. 2. RECOGNIZE THE LIMITS OF PHYSICAL RESOURCES: They can usually be duplicated, and
they lose value, as environments become increasingly dynamic. 3. FOCUS ON INTANGIBLE RESOURCES: They are less subject to imitation, and they cannot
usually be purchased on the open market. 4. ACCENTUATE THE ORGANIZATION'S HERITAGE: Understanding an organization's heritage
can instill a sense of pride and help motivate its members. 5. CULTIVATE A STRONG CULTURE--but one that embraces change: This process helps
develop a collective identity among the organization's members, helps members work together toward the same goals, and helps the organization attain it s strategies even in a changing environment.
6. IMPLEMENT INNOVATIVE STRATEGIES: Creative strategies can take competitors by
surprise and lead to a sustained advantage. 7. LEAD BY EXAMPLE: The CEO should serve as a role model and convey the message that
"we're all in this together." 8. INVEST IN TRAINING: Training builds skills, conveys a sense of permanence to employees,
enhances individual self-efficacy, and opens the door to greater participation and decentralization.
9. EMPOWER THE ORGANIZATION'S MEMBERS: Expand power by sharing it; empowerment
increases creativity, motivation, satisfaction, commitment, skill level, and decision quality.
Source: C. Pringle & M. Kroll. "Lessons in Resource-based Theory from the Royal Navy." Academy of Management Executive, 1998.


![Debtwire India Insolvency Summit 2018 transcript.pdf · Debt Restructuring] or SDR [Strategic Debt Re-structuring] or S4A [Scheme for Sustainable Structuring of Stressed Assets];](https://static.fdocuments.in/doc/165x107/5e9557b9c1264d323c2c17a7/debtwire-india-insolvency-summit-2018-transcriptpdf-debt-restructuring-or-sdr.jpg)