Module 14 Processing and Pitfalls
25
Processing Pitfalls 1 Module 14 Processing Pitfalls and Quality Assurance Learning Objectives Awareness: • Pitfalls associated with processing problems • Quality control steps in seismic processing
-
Upload
fauzan-basyith -
Category
Documents
-
view
26 -
download
2
Transcript of Module 14 Processing and Pitfalls
Processing Pitfalls
1
Module 14
Processing Pitfalls and Quality Assurance
Learning Objectives
Awareness:• Pitfalls associated with processing problems • Quality control steps in seismic processing

Processing Pitfalls
2
Topics
• Pitfalls of seismic exploration– Processing Pitfalls– Interpreting Pitfalls
• Seismic Processing Quality Assurance– Geometry setup– Amplitude scaling, trace editing– Pre-stack parameter selection– Velocity analysis– Post-stack processing
Processing Pitfalls
3
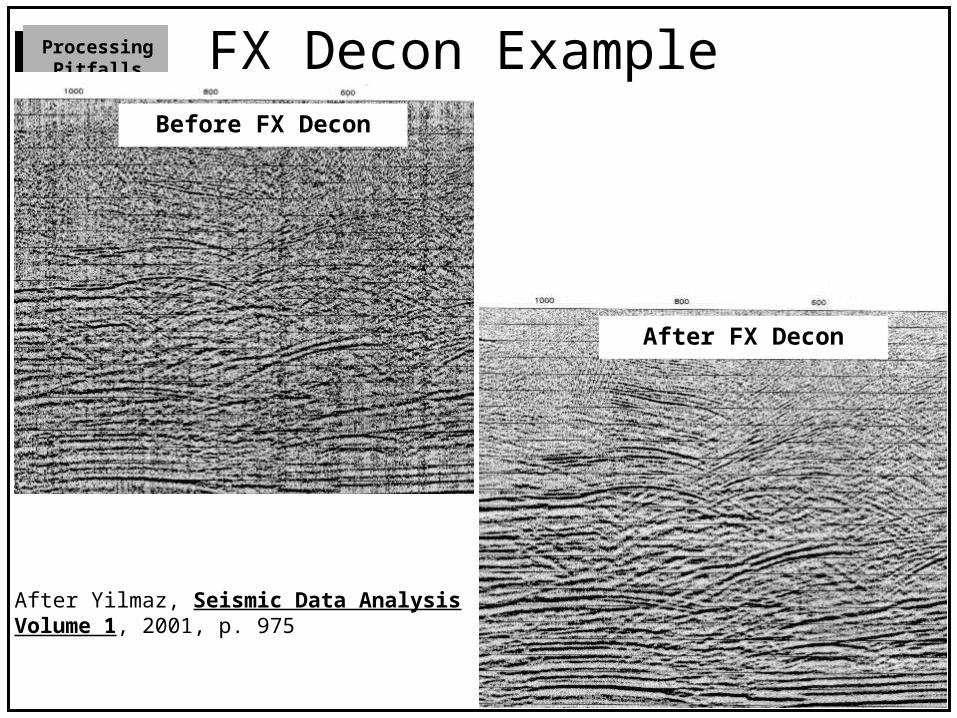
FX Decon Example
After FX Decon
Before FX Decon
After Yilmaz, Seismic Data Analysis Volume 1, 2001, p. 975

Processing Pitfalls
4
FX Decon• Benefit
– Enhances coherent signal
– Improves S/N
• Detriment– False alignments
– Mixed wormy appearance
– Distorts static effects
– Phase and amplitude effects
Processing Pitfalls
5
Processing Pitfalls
Processing Pitfalls
6
Why Avoiding Pitfalls is Important
• Save time and money
• More reliable seismic interpretations
• Obtain best quality data
• Translates to more E&P business success
• Avoid drilling based on artifacts and processing errors
• Application of vigorous quality assurance focused on travel time, amplitude and phase accuracy, is a major competitive advantage

Processing Pitfalls
7
The addition of a data processor to exploration team will help prevent many of the current pitfalls
Geophysicist Structural Geologist
Data ProcessorSe
ism
ic G
eolo
gist
Prod
uctio
n G
eolo
gist
Stra
tigra
pher
Res
ervo
ir En
gine
er
Pitfall: No data processor on exploration team

Processing Pitfalls
8
The subwater layer may be just as complex as onshore low velocity layer
Pitfall: Assuming that marine data never require static corrections.
Water Bottom
Normal Velocity
Low Velocity Fill
Uncorrected Reflection
Corrected Reflection
Water Surface
BuriedErosionalSurface
Processing Pitfalls
9
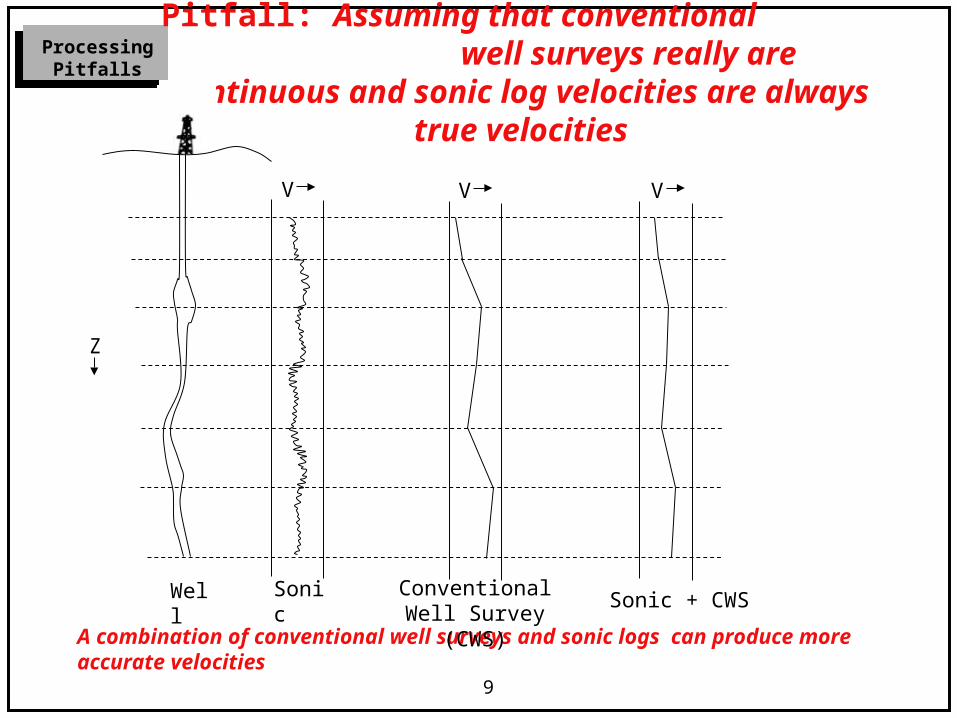
A combination of conventional well surveys and sonic logs can produce more accurate velocities
Pitfall: Assuming that conventional well surveys really are continuous
and sonic log velocities are always true velocities
V V V
Well
Z
Sonic Conventional Well Survey (CWS)
Sonic + CWS

Processing Pitfalls
10
Pitfall: Doing velocity analyses at regular intervals without regard to structure.
Regularly–spaced velocity Velocity analysis locations that disclose analysis locations structurally-related velocity variations
Interpolation from points of structural discontinuities will give better values than across them.
Processing Pitfalls
11
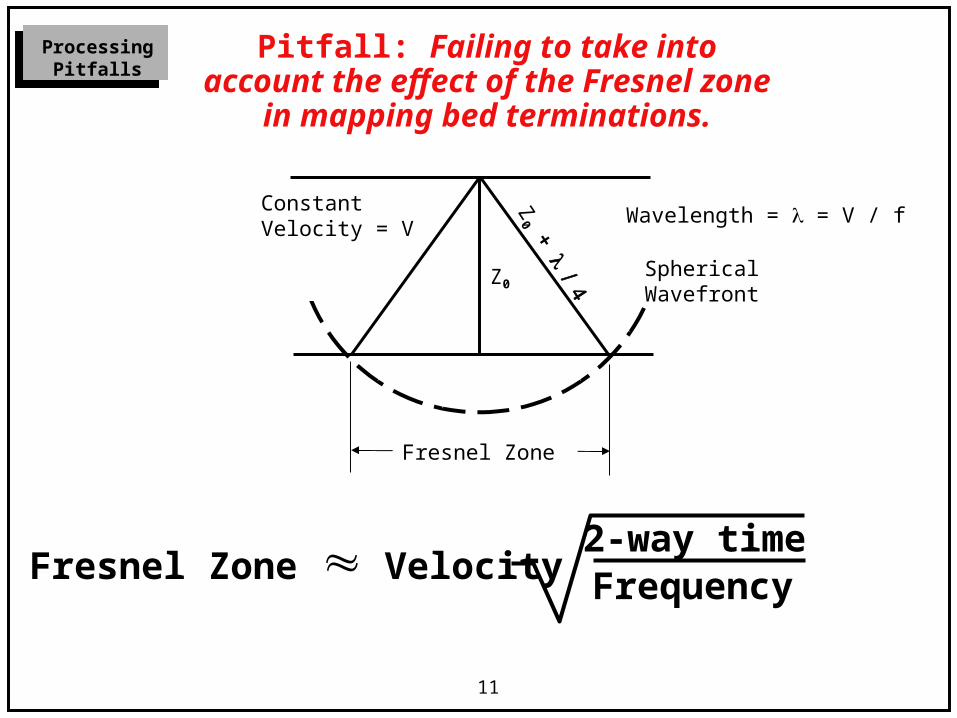
Pitfall: Failing to take into account the effect of the Fresnel zone in
mapping bed terminations.
SphericalWavefront
ConstantVelocity = V
Z0
Z0 +
Wavelength = = V / f
Fresnel Zone
Fresnel Zone Velocity Frequency2-way time

Processing Pitfalls
12
Pitfall: Routine application of spiking deconvolution
Earth’s Reflectivity
* =Wavelet Input Seismic Trace
White Earth Reflectivity: Good Spiking Deconvolution
Output Seismic TraceOutput WaveletDecon whitens input trace to match earth’s
reflectivity
* =Output Wavelet
Earth’s Reflectivity Input Wavelet Input Seismic Trace
Output Seismic Trace
Non-White Earth Reflectivity: Bad Spiking Deconvolution
Decon whitens input trace which distorts earth’s reflectivity

Processing Pitfalls
13
Pitfall: Overstacking.
• Data quality improves dramatically as the initial traces are summed into the stack, but eventually a point of diminishing return is reached.
• Stacking additional traces beyond this point produces an overstacked result that may be less suitable for interpretation and more expensive to produce than lower fold data.
• Overstacking may change or eliminate curved or dipping reflections and diffractions that are important to fault mapping.
• Stratigraphic interpretation may be hampered because overstacking may attenuate high frequencies resulting in poor temporal resolution.
• Compare well-processed single‑fold sections or near-trace gathers to help judge the effectiveness of the stack and reveal a different view of the geology.
• The fold of the stack should be determined by exploration objectives, not by how homogenous or “pretty” it looks.

Processing Pitfalls
14
Filter 1 Filter 2
Phase change produces apparent fault.
Pitfall: Making changes in shooting and processing parameters without documenting these changes.

Processing Pitfalls
15
• Seismic velocity calculations have been used to:
– Determine abrupt changes in subsurface velocity
– Estimate lithology, sand percent and fluid content
– Determine burial history and depositional environment
– Locate over-pressured areas
Seismic velocities are truly an important geologic tool.
• Stacking velocity is rarely the acoustic velocity of the rocks, and may not have geologic significance.
• Stacking velocities are used to optimally align primary reflections on CMP traces They are really correction numbers used in the stacking process and may vary as much as twice the acoustic velocities because of dip or other irregularities. If DMO is not applied, their geologic value is questionable.
• Dr. Hewitt Dix showed (1954) how to determine interval velocities between two reflecting horizons. Interval velocities have true geologic significance.
Pitfall: Misusing seismic derived velocities

Processing Pitfalls
16
• Interpretation of Migration artifact as a true seismic signal
• Failure to recognize out-of-plane reflections in 2-D processing
• Failure to recognize wave images that do not meet3-D P-wave acquisition and processing assumptions(e.g. reflected refractions, shear waves)
And MORE
Processing Pitfalls
17
Discussion
What other pitfalls have you encountered?
Processing Pitfalls
18
Processing Quality Assurance

Processing Pitfalls
19
Data Initialization• Make sure all relevant data are in hand
– Seismic data tapes • Parameter tests – dynamite hole depth, charge size, etc.• Instrument tests• Prime shooting and in-fill shooting• Seismic acquisition reports by QC representatives (“bird-dogs”)• Results from any previous processing
– Survey/Navigation• Processed results – Shell SPS format, UKOOA, etc.• Navigation processing and QC reports
– Maps• Topographic maps to tie data to elevation or cultural features• Geologic maps that indicate surface lithology which may affect
data quality• Aerial photographs may show vegetation changes that may
correspond to surface conditions that affect data quality
– Documentation• Geologic setting, well logs – especially sonic and check shots• Exploration targets• Project parameters – costs, deadlines, etc.
Processing Pitfalls
20
Data Initialization• Display shot records, looking for problems
– Impractical to display all shots except for small 2-D surveys
– Use brute stack and amplitude measurements• Map surface consistent amplitudes to find potential problem areas• Source amplitudes locate bad shots• Receiver amplitudes locate bad traces and surface noise sources
– Time-slice preliminary 3-D stack or near trace cube to find geometry or navigation problems
• Analyze first arrivals with linear moveout to detect bad trace distances – geometry errors
• Some refraction statics and tomographic statics programs help detect and correct geometry problems during model building
• Be careful accepting data-derived geometry corrections because trace delays can come from many sources other than bad geometry
• Plot source and receiver locations for land surveys• Plot boat track and cable feather for marine surveys• Plot CMP fold with and without in-fill shooting
Processing Pitfalls
21
Amplitude Recovery and Processing
• Make sure bad traces (excessively noisy and very low amplitude) are eliminated from data volume
– Use histograms of trace amplitude to set automatic editing parameters– Evaluate the effect of trace editing on CMP fold– Use maps of amplitude to identify areas of high noise
• Make sure all reversed polarity traces are corrected and all traces are despiked
– Common receiver stacks help locate reversed traces– Some statics programs find reversed traces– Find the spikes with amplitude analysis
• Use amplitude attribute displays to check effect of amplitude processing (geometric spreading correction, gain)
– Use graphs for 2-D and maps for 3-D– Also use average frequency, peak frequency, etc.
• Display some shot records after each stage of amplitude processing

Processing Pitfalls
22
Pre-Stack Parameter Selection
• Determine optimum method of attenuating source-generated noise, if present, by applying processes to selected shot records and comparing displays
• Display brute stacks with noise attenuation applied; compare before and after
• Evaluate deconvolution parameters by comparing filtered displays of selected CMPs with one parameter at a time changed
• Display brute stacks and time slices with deconvolution applied; compare before and after; evaluate need for further phase correction to zero-phase
Processing Pitfalls
23
Velocity and Residual Statics Analysis
• Evaluate velocities via iso-velocity and iso-time plots and maps
– Velocities should be consistent with structure and stratigraphy
• Evaluate effect of revised velocities by comparing before and after displays of:
– Inline and crossline CMP stacks
– Time slices in target zone
– Every 20th, or so, CMP gather corrected for NMO
• Evaluate effect of revised statics by comparing before and after displays of:
– Inline and crossline CMP stacks
– Time slices in target zone
– Every 20th, or so, CMP gather corrected for NMO
• Do these things after each velocity and residual statics analysis stage

Processing Pitfalls
24
Post-Stack Processing
• Perform filter analysis via filter scans and select time variant filter (TVF) parameters
• Apply TVF to all QC outputs but not to data passed from one process to another
• Evaluate effect of each process by comparing before and after displays of:
– Inline and crossline CMP stacks
– Time slices in target zone
– Run suites of test migration velocities (e.g 90%-110%) and evaluate over and under migration effects

Processing Pitfalls
25
Summary
• Pitfalls abound in seismic processing and interpretation -- so be careful
• Most pitfalls result from accepting data at face value
– Know the assumptions of processing steps and avoid misuse
– Look behind the scenes at tests and preliminary results to judge the quality and faithfulness of the final result
– Add an experienced processor to your exploration team to obtain expert advice
• Analyzing data plots at every step is too impractical, inefficient and ineffective for all but the smallest survey
– Look for ways to map diagnostic parameters so that problem areas get the detailed analysis they need
– Relate data problems to surface conditions, cultural activity, topography, geology, etc. whenever possible because this builds your knowledge base for planning future acquisition and processing work
– Document your work for later reference


![Module 3 - Word Processing [ Word ]](https://static.fdocuments.in/doc/165x107/577daecc1a28ab223f915bf5/module-3-word-processing-word-.jpg)