Modulation of the stability of the Salmonella fourU-type ...
13
Modulation of the stability of the Salmonella fourU-type RNA thermometer Jo ¨ rg Rinnenthal 1 , Birgit Klinkert 2 , Franz Narberhaus 2 and Harald Schwalbe 1, * 1 Institute for Organic Chemistry and Chemical Biology, Center for Biomolecular Magnetic Resonance, Johann Wolfgang Goethe-University, Max-von-Laue-Strasse 7, D-60438 Frankfurt/Main and 2 Microbial Biology, Ruhr-Universita ¨ t Bochum, Universita ¨ tsstrasse 150, NDEF06/783, 44780 Bochum, Germany Received February 9, 2011; Revised and Accepted April 19, 2011 ABSTRACT RNA thermometers are translational control elements that regulate the expression of bacterial heat shock and virulence genes. They fold into complex secondary structures that block translation at low temperatures. A temperature increase releases the ribosome binding site and thus permits translation initiation. In fourU-type RNA thermometers, the AGGA sequence of the SD region is paired with four consecutive uridines. We investigated the melting points of the wild-type and mutant sequences. It was decreased by 5 C when a stabilizing GC basepair was exchanged by an AU pair or increased by 11 C when an internal AG mismatch was converted to a GC pair, respectively. Stabilized or destabilized RNA structures are directly correlated with decreased or increased in vivo gene expression, respectively. Mg 2 + also affected the melting point of the fourU thermometer. Variations of the Mg 2 + concentration in the physio- logical range between 1 and 2 mM translated into a 2.8 C shift of the melting point. Thus, Mg 2 + binding to the hairpin RNA is regulatory relevant. Applying three different NMR techniques, two Mg 2 + binding sites were found in the hairpin structure. One of these binding sites could be identified as outer sphere binding site that is located within the fourU motif. Binding of the two Mg 2 + ions exhibits a positive cooperativity with a Hill coefficient of 1.47. Free energy values "G for Mg 2 + binding determined by NMR are in agreement with data determined from CD measurements. INTRODUCTION The maintenance of the intracellular metal ion concentra- tion is an indispensable requirement for the viability of eukaryotic and prokaryotic cells. Cells exhibit high intracellular K + and Mg 2+ concentrations while cytosolic Na + and especially Ca 2+ concentrations are kept low (1). By varying the K + concentration, cells adopt the intracel- lular to the extracellular osmolality (2). K + acts as counterion for nucleic acids (DNA, RNA) (3,4) and has been found to stabilize the structure of cytosolic proteins. Mg 2+ is prominent for binding and activating ATP (5) as well as intracellular enzymes (1). In addition to K + , it is the most important cation acting as counterion of nucleic acids (1,4). It is involved in the maintenance of the struc- tural integrity of the plasma membrane (6) and stabilizes proteins. In gram-negative bacteria, Mg 2+ binding to lipo- polysaccharides stabilizes the periplasmic membrane (7). Most importantly, it is strictly required for rRNA folding, ribosome assembly and ribosome function (8,9). The importance of Mg 2+ ions for the viability of pro- karyotic cells has some important implications. First, Mg 2+ starvation leads to growth arrest of bacterial cultures (10). Second, although the amount of Mg 2+ within a prokaryotic cell may vary by a factor of three, the RNA[kg]:Mg 2+ [kg] ratio (&68) is almost constant under differing environmental conditions (10). Escherichia coli cells that enter the stationary phase reduce the concentration of ribosomes and thus reduce their Mg 2+ content (11). Third, E. coli cells react on Mg 2+ starvation by the synthesis of polyamines including spermidine and putrescine which are able to substitute for Mg 2+ in many cases. For instance, the spermidine/Mg 2+ ratio bound to the ribosomal fraction of E. coli cells reduces with increasing extracellular Mg 2+ concentration (12). Due to the diversity of different Mg 2+ binding part- ners and the multitude of different intracellular Mg 2+ binding sites, most of the intracellular Mg 2+ is present in a bound form, albeit transiently. E. coli cells in the expo- nential growth phase have a Mg 2+ content of 90–110 mM (13), while only a small fraction of 1–2 mM is present in the physiologically active free form (14). In addition, most of the bound Mg 2+ fraction is in fast exchange with the free Mg 2+ in the cytosol (14,15) and a 20–30% loss of Mg 2+ is sufficient for cell-growth arrest (14). Due to this rapid exchange between free and bound Mg 2+ , also the *To whom correspondence should be addressed. Tel: 69 7982 9737; Fax: 69 7982 9515; Email: [email protected] 8258–8270 Nucleic Acids Research, 2011, Vol. 39, No. 18 Published online 4 July 2011 doi:10.1093/nar/gkr314 ß The Author(s) 2011. Published by Oxford University Press. This is an Open Access article distributed under the terms of the Creative Commons Attribution Non-Commercial License (http://creativecommons.org/licenses/ by-nc/3.0), which permits unrestricted non-commercial use, distribution, and reproduction in any medium, provided the original work is properly cited.
Transcript of Modulation of the stability of the Salmonella fourU-type ...

Modulation of the stability of the SalmonellafourU-type RNA thermometerJorg Rinnenthal1, Birgit Klinkert2, Franz Narberhaus2 and Harald Schwalbe1,*
1Institute for Organic Chemistry and Chemical Biology, Center for Biomolecular Magnetic Resonance,Johann Wolfgang Goethe-University, Max-von-Laue-Strasse 7, D-60438 Frankfurt/Main and 2Microbial Biology,Ruhr-Universitat Bochum, Universitatsstrasse 150, NDEF06/783, 44780 Bochum, Germany
Received February 9, 2011; Revised and Accepted April 19, 2011
ABSTRACT
RNA thermometers are translational controlelements that regulate the expression of bacterialheat shock and virulence genes. They fold intocomplex secondary structures that block translationat low temperatures. A temperature increasereleases the ribosome binding site and thuspermits translation initiation. In fourU-type RNAthermometers, the AGGA sequence of the SDregion is paired with four consecutive uridines. Weinvestigated the melting points of the wild-type andmutant sequences. It was decreased by 5�C when astabilizing GC basepair was exchanged by an AUpair or increased by 11�C when an internal AGmismatch was converted to a GC pair, respectively.Stabilized or destabilized RNA structures aredirectly correlated with decreased or increasedin vivo gene expression, respectively. Mg2+ alsoaffected the melting point of the fourU thermometer.Variations of the Mg2+ concentration in the physio-logical range between 1 and 2 mM translated into a2.8�C shift of the melting point. Thus, Mg2+ bindingto the hairpin RNA is regulatory relevant. Applyingthree different NMR techniques, two Mg2+ bindingsites were found in the hairpin structure. One ofthese binding sites could be identified as outersphere binding site that is located within the fourUmotif. Binding of the two Mg2+ ions exhibits apositive cooperativity with a Hill coefficient of 1.47.Free energy values "G for Mg2+ binding determinedby NMR are in agreement with data determined fromCD measurements.
INTRODUCTION
The maintenance of the intracellular metal ion concentra-tion is an indispensable requirement for the viability ofeukaryotic and prokaryotic cells. Cells exhibit high
intracellular K+ and Mg2+ concentrations while cytosolicNa+ and especially Ca2+ concentrations are kept low (1).By varying the K+ concentration, cells adopt the intracel-lular to the extracellular osmolality (2). K+ acts ascounterion for nucleic acids (DNA, RNA) (3,4) and hasbeen found to stabilize the structure of cytosolic proteins.Mg2+ is prominent for binding and activating ATP (5) aswell as intracellular enzymes (1). In addition to K+, it isthe most important cation acting as counterion of nucleicacids (1,4). It is involved in the maintenance of the struc-tural integrity of the plasma membrane (6) and stabilizesproteins. In gram-negative bacteria, Mg2+binding to lipo-polysaccharides stabilizes the periplasmic membrane (7).Most importantly, it is strictly required for rRNA folding,ribosome assembly and ribosome function (8,9).
The importance of Mg2+ ions for the viability of pro-karyotic cells has some important implications. First,Mg2+ starvation leads to growth arrest of bacterialcultures (10). Second, although the amount of Mg2+
within a prokaryotic cell may vary by a factor of three,the RNA[kg]:Mg2+[kg] ratio (&68) is almost constantunder differing environmental conditions (10).Escherichia coli cells that enter the stationary phasereduce the concentration of ribosomes and thus reducetheir Mg2+ content (11). Third, E. coli cells react onMg2+ starvation by the synthesis of polyamines includingspermidine and putrescine which are able to substitute forMg2+ in many cases. For instance, the spermidine/Mg2+
ratio bound to the ribosomal fraction of E. coli cellsreduces with increasing extracellular Mg2+ concentration(12). Due to the diversity of different Mg2+ binding part-ners and the multitude of different intracellular Mg2+
binding sites, most of the intracellular Mg2+ is present ina bound form, albeit transiently. E. coli cells in the expo-nential growth phase have a Mg2+ content of 90–110mM(13), while only a small fraction of 1–2mM is present inthe physiologically active free form (14). In addition, mostof the bound Mg2+ fraction is in fast exchange with thefree Mg2+ in the cytosol (14,15) and a 20–30% loss ofMg2+ is sufficient for cell-growth arrest (14). Due to thisrapid exchange between free and bound Mg2+, also the
*To whom correspondence should be addressed. Tel: 69 7982 9737; Fax: 69 7982 9515; Email: [email protected]
8258–8270 Nucleic Acids Research, 2011, Vol. 39, No. 18 Published online 4 July 2011doi:10.1093/nar/gkr314
� The Author(s) 2011. Published by Oxford University Press.This is an Open Access article distributed under the terms of the Creative Commons Attribution Non-Commercial License (http://creativecommons.org/licenses/by-nc/3.0), which permits unrestricted non-commercial use, distribution, and reproduction in any medium, provided the original work is properly cited.

concentration of the free form has to be controlled tightlyby the cell itself to assure cell viability. Indeed, Mg2+ ionshave been found to be actively transported among othersin E. coli (15–19), Bacillus subtilis (20) and Salmonellatyphimurium (21) and the Mg2+ transport mechanisms ofS. typhimurium and E. coli are equivalent to each other(1,14,18,21–25).
Ions are important for stabilizing RNA tertiary struc-ture (3,9,26). Most often, K+ and Mg2+ cations serve thistask although Mn2+ ions and polyamines such as spermi-dine have the potential to substitute for some of the K+
and Mg2+ binding sites. Mn2+ ions are able to substitutefor 76% of the bound Mg2+ ions in E. coli without im-pairing viability of the cells (18). These findings providesupport for using Mn2+ ions to map Mg2+ binding siteswithin an RNA molecule (27–30).
Due to its small size and divalent charge, the Mg2+ ionhas a notably high charge density. Therefore, the firstwater hydration sphere is more stable than for any otherphysiologically relevant cation (31). Mg2+ coordinates sixwater molecules with octahedral geometry. Mg2+ ions areable to bind to RNA with different binding modes.Generally, ‘inner sphere’ and ‘outer sphere’ contacts canbe distinguished (9). In an ‘outer sphere’ complex, watermolecules of the Mg(H2O)2+6 complex but not the Mg2+
ion itself make contacts to the functional groups of theRNA. In contrast, inner sphere contacts are characterizedby at least one direct contact of the Mg2+ion to functionalgroups of the RNA. Inner sphere contacts can be classifiedby the number of inner sphere ligands other than H2O(type I, type II, type III, etc.), while ‘type 00 is identicalto an outer sphere contact (9). Klein et al. (9) modeledMg2+ ions into the structure of the large ribosomalsubunit from Haloarcula marismortui and found that65% of the bound Mg2+ ions are outer spherecoordinated. Within the remaining inner sphere contacts,most contacts belong to the classes type I or type IIawhere inner sphere ligands are orthogonally oriented toeach other. Most of these Mg2+ ions (type I and typeIIa) are coordinated to either one or both non-bridgingoxygens of the phosphate backbone. Outer spherecoordinated Mg2+ ions are most often located within themajor groove of the RNA helices and make indirect,water-mediated contacts to the heteroatoms of thenucleobases (9,27,32).
Mg2+ has a profound effect on the structure andfunction of riboswitches (33–35). Riboswitches are biosen-sors that control gene expression in response to cellularmetabolites that they bind with high affinity and specifi-city (36,37). RNA thermometers are capable of sensingtemperature. They control translation initiation of heatshock and virulence genes by sequestration of the Shine–Dalgarno (SD) sequence at low temperatures (38). Athigher temperatures, the hairpin structure melts in azipper-like manner allowing translation initiation tooccur (39). Helix stability in simple synthetic RNA therm-ometers is directly correlated to gene expression levels ofthe downstream gene (40).
We recently investigated the structure, function andmelting mechanism of the Salmonella fourU RNAthermometer, which controls expression of the heat
shock gene agsA (39,41). In the present work, weexamined the in vitro and in vivo effects of a pointmutation that weakens an extraordinarily stable GCbase pair, which had been shown to prevent unfolding ofthe wild-type RNA at lower temperatures (39) (Figure 2).Furthermore, we highlight the Mg2+binding properties ofthe fourU RNA thermometer. Using NMR spectroscopy,we identified and localized two Mg2+ binding sites anddetermined their dissociation constants as well asthe cooperativity between these binding sites. Mg2+-dependent changes in thermal stability of the fourURNA thermometer were determined by CD spectroscopy.Our study provides first evidence for Mg2+ binding of anRNA thermometer and its relevance for RNA thermom-eter function.
MATERIALS AND METHODS
NMR spectroscopy
NMR measurements were performed on a 600MHz(14.09T) Bruker NMR spectrometer equipped with a5-mm xyz-gradient probe and a 900-MHz (21.14T)Bruker NMR spectrometer equipped with a 5-mm cryo-genic HCN z-gradient probe. Spectra were recorded andprocessed using the Bruker TopSpin 2.0/2.1 software.Processed spectra were analyzed with Sparky 3.1.1.3.
MgCl2 titration experiments
Mg2+ titration experiments of the 4U-hp2-wt RNA wereperformed in NMR buffer (see RNA preparation section)at a temperature of 10�C. [1H-15N]-HSQC experimentswere recorded at a B0 field strength of 900MHz (21.14T) using a standard pulse sequence (42) (Topspin 2.1pulse program library: fhsqcf3gpph) with a hardWatergate pulse train for water suppression (43). Spectrawere recorded with a spectral width of 30 ppm in the15N-dimension and 22 ppm in the 1H-dimension. A totalof 240 increments were recorded in the 15N-dimension and4096 points in the 1H-dimension. [1H,15N]-HSQC spectrawere recorded at the following MgCl2 concentrations: 0,0.3, 0.5, 0.7, 1.0, 1.5, 2.0, 3, 5 and 7mM.Overall chemical shift perturbations (CSPs) were
calculated from the CSPs of the 15N and the1H-dimension (44) according to the following equation:
CSP ¼
ffiffiffiffiffiffiffiffiffiffiffiffiffiffiffiffiffiffiffiffiffiffiffiffiffiffiffiffiffiffiffiffiffiffiffiffiffiffiffiffiffiffiðCSPHÞ
2+ðCSPN=5Þ2
2
sð1Þ
Since association and dissociation of the Mg2+ ions fromthe target RNA are fast on the NMR timescale, CSPs canbe related to the Mg2+ concentration within the sampleaccording to the following equation:
fðxÞ ¼b
2� x+1+að Þ �
ffiffiffiffiffiffiffiffiffiffiffiffiffiffiffiffiffiffiffiffiffiffiffiffiffiffiffiffiffiffiffiffix+1+að Þ
2�4x
� �q� �ð2Þ
Equation (2) is derived from the mass action law for anRNA/Mg2+ equilibrium with the RNA having one Mg2+
binding site. In Equation (2) f(x) is the CSP of an individ-ual imino signal at a given x=[Mg2+]/[RNA] ratio, a is
Nucleic Acids Research, 2011, Vol. 39, No. 18 8259

the ratio between dissociation constant (KD) and RNAconcentration and b is the maximum CSP at infiniteMg2+concentration. During the fitting procedure, the par-ameters a and b were allowed to adjust freely.CSP curves that showed biphasic behavior and could
not be fitted by Equation (2) were fitted by a modelassuming two different binding sites (Figure 1). Such amodel is characterized by two macroscopic (K1, K2) andfour microscopic (K1,2, K1,3, K2,4, K3,4) dissociation con-stants that connect four different RNA states (I, II, III,IV). Considering a particular imino group, two differentstates with only one Mg2+ ion bound (states II and IIIin Figure 1) can have different or equal (degenerated)chemical shifts. Such model predicts that biphasiccurves only depend on the macroscopic dissociationconstants K1 and K2. Monophasic curves, in contrast,detect either macroscopic or microscopic dissociationconstants, depending on which chemical shifts of thefour states are degenerated for a particular imino group.Microscopic and macroscopic dissociation constantsare related to each other by the equations depicted inFigure 1.Biphasic CSP curves can be fitted by Equations (3–5),
if the two binary complexes have different chemical shifts.
CSP ¼ a��ðBA2Þ+b��ðABÞ ð3Þ
�ðABÞ ¼K1K2 � ½A�
K1,3ðK1K2+K2½A�+½A�2Þ
ð4Þ
�ðBA2Þ ¼½A�2
ðK1K2+K2½A�+½A�2Þ
ð5Þ
Biphasic CSP curves can be fitted by Equation (5–7), if thecomplexes [AB] and [BA] are degenerated.
CSP ¼ a��ðBA2Þ+ðb=2Þ��ðAB+BAÞ ð6Þ
�ðAB+BAÞ ¼K2 � ½A�
ðK1K2+K2½A�+½A�2Þ
ð7Þ
Whether chemical shifts are degenerated in the binarycomplexes or not, influences only the parameter b in theEquations (3) and (6). In Equations (3) and (4), the con-stants b and K1,3 cannot be fitted independently and cantherefore be summarized to one constant.
In Equations (3)–(7), [A] is the concentration ofMg2+-ions, �(AB) and �(BA) are the populations of thetwo different binary (RNA*Mg2+)-complexes and �(AB2)
is the population of the ternary (Mg2+*RNA*Mg2+)-complex. Parameters a and b are fitting parameters thatmodulate the CSP amplitude. K1, K2 are the macroscopicand K1,2, K1,3, K2,4, K3,4 the microscopic dissociation con-stants of the Mg2+ binding model which assumes twoMg2+ binding sites (Figure 1). During the fitting proced-ure, the parameters a, b, K1 and K2 were allowed to adjustfreely.
In some cases, three out of four RNA states havedegenerated chemical shifts and only one state has a dif-fering chemical shift. For some of these cases, this resultsin monophasic CSP curves. For example, if state I has adiffering chemical shift, the macroscopic dissociationconstant K1 is detected. If state IV has a differingchemical shift from states I, II and III, the macroscopicdissociation constant K2 is detected. In the special case ofequal microscopic dissociation constants (K1,2, K1,3, K2,4,
Figure 1. Mg2+ binding model assuming two distinct Mg2+ binding sites on the RNA. The RNA can adopt four different states (I, II, III, IV).Transitions between these states are described by microscopic dissociation constants (K1,2, K1,3, K2,4, K3,4). Transitions between free RNA, binary andternary complex are described by macroscopic dissociation constants (K1, K2). In addition, equations describing interdependencies of the differentdissociation constants are given. K1 and K2 as well as K1,2, K1,3, K2,4 and K3,4 are thermodynamic constants that describe the RNA-[Mg2+]n complexesunder equilibrium conditions.
8260 Nucleic Acids Research, 2011, Vol. 39, No. 18

K3,4) the macroscopic dissociation constant K2 is fourtimes larger than the macroscopic dissociation constantK1 (K2=4*K1).
MnCl2 PRE experiments
Paramagnetic relaxation enhancement (PRE) effectscaused by paramagnetic Mn2+ ions were analyzed forthe observable imino groups within the 4U-hp2-wtRNA. [1H-15N]-HSQC spectra of the imino region of a4U-hp2-wt RNA sample were recorded in NMR bufferin the presence of 5mM MgCl2 at MnCl2 concentrationsof 0 and 4 mM. Experiments were performed at a tempera-ture of 10�C and a B0 field strength of 900MHz (21.14T).The recycling delay was set to 3 s. Remaining acquisitionparameters were identical to the MgCl2 titration experi-ments. PRE effects were quantified by intensity and linewidth analysis. Line width analysis was performed for theindirect 15N-dimension. Intensities and line widths wereanalyzed with Sparky 3.1.1.3. For the PRE analysis weplotted ln (I[0 mM]/I[4 mM]) for each observable iminosignal and compared the results with the change in linewidth (u[4mM]– u[0 mM]).
Co(NH3)3+
6 NOESY experiment
To identify and localize Mg2+outer sphere binding sites, aNOESY spectrum of a 4U-hp2-wt RNA sample in NMRbuffer was recorded in the presence of 5mM Co(NH3)
3+6.
Measurements were performed at a temperature of 10�Cand a B0 field strength of 600MHz (14.09T) with a mixingtime Tm of 150ms. The spectrum was recorded with aspectral width of 15 ppm in the indirect dimension and22 ppm in the direct dimension. A total of 896 incrementswere recorded in the t1 dimension and 2048 points in the t2-dimension. Each increment was recorded with 128 scans.
RNA preparation
Unlabeled and 15N-labeled RNA oligonucleotides weresynthesized by in vitro transcription with T7 RNA poly-merase from linearized plasmid DNA templates andpurified as described previously (45). 15N-labeled nucleo-tides were purchased from Silantes (Munich, Germany),unlabeled nucleotides were purchased from Sigma Aldrich(St. Louis, MO, USA).
RNAs were desalted using Vivaspin 20 concentratorswith a molecular weight cutoff (MWCO) of 3000Dafrom Sartorius stedim biotech (Aubagne Cedex, France).RNA refolding was achieved by denaturing for 10min at aconcentration of 0.25mM and a temperature of 95�Cfollowed by 20-fold dilution with ice cold water and sub-sequent incubation at 0�C for another 30min. RNAs wereconcentrated and exchanged to NMR buffer usingVivaspin 20 concentrators (MWCO=3000 Da). TheNMR buffer contained 15mM KxHyPO4 (pH 6.5),25mM KCl, 90% H2O and 10% D2O. Correct RNAfolding was verified by native polyacrylamide gelelectrophoresis.
Native gel electrophoresis
The 5� loading buffer was composed of 87% glycerole,0.1%(w/v) xylene cyanoleFFand0.1%(w/v) bromophenolblue. The 1� running buffer contained 50mMTris–acetateand50mMsodiumphosphate (pH8.3).Gelswere cast using15% acrylamide with an acrylamide:bisacrylamide ratio of37.5:1. Running conditions were set as follows: U=70V,P< 0.5W for 4 h, water cooling to prevent heating. Gelswere stained with ethidium bromide.
CD spectroscopy
CD melting and refolding curves were recorded with aJASCO spectropolarimeter J-810 at a wavelength of258 nm. The RNA concentration was adjusted to 25 mM.Buffer conditions: 15mM KxHy(PO4), 25mM KCl, pH6.5. Melting curves were recorded with a temperatureslope of 1�C/min (4U-hp2-wt: 5-90�C; 4U-hp2-G14A-C25U-mutant: 2-80�C; 4U-hp2-A8C-mutant: 10-90�C)and refolding curves with a temperature slope of �1�C/min (4U-hp2-wt: 90-5�C; 4U-hp2-G14A-C25U-mutant:80-2�C; 4U-hp2-A8C-mutant: 90-10�C). CD melting andrefolding curves were normalized according to Equation(9) and thermodynamic parameters (�Hunf, �Sunf, �Gunf
and Tm) were derived from Equations (10) to (12).Assuming the RNA to be either folded or unfolded
(two-state model), the fraction of unfolded RNA can beexpressed by
�ðTÞ ¼ 1�RNAfoldedðTÞ½ �
RNAtotal½ �ð8Þ
The fraction of unfolded RNA a is varying with tem-perature. This temperature dependence of a can bedetermined from the temperature dependence of the ellip-ticity at a wavelength of 258 nm according to Equation (9)
�ðTÞ ¼ 1��ðTÞ � �unfoldedðTÞ
�foldedðTÞ � �unfoldedðTÞð9Þ
In Equation (9), �(T) is the measured temperature-dependent ellipticity, �unfolded(T) and �folded(T) are theellipticities of the unfolded and the folded state of theRNA, respectively. �unfolded(T) and �folded(T) are alsoslightly temperature-dependent and are therefore approxi-mated linearly. From the resulting �(T) dependence, themolar unfolding enthalpy �Hunf can be calculated (46)according to Equation (10). The melting point Tm isdefined as the temperature at which 50% of the RNA isunfolded (�=0.5). In case of perfect sigmoidality, theslope of the �(T) curve is maximal at this temperature
�Hunf ¼ 4RT2m
@�
@T
� �T¼Tm
ð10Þ
In Equation (11), R is the gas constant, Tm the meltingtemperature, � the fraction of unfolded RNA and �Hunf
the molar unfolding enthalpy of the RNA. From �Hunf,the molar unfolding entropy �Sunf can be calculated ac-cording to Equation (11)
�Sunf ¼�Hunf
Tmð11Þ
Nucleic Acids Research, 2011, Vol. 39, No. 18 8261

From the Gibbs–Helmholtz Equation (12), the molar freeenergy �Gunf can be calculated, if one assumes �Hunf and�Sunf to be temperature-independent
�Gunf ¼ �Hunf � T�Sunf ð12Þ
Mg2+-dependence of the RNA melting point Tm
The RNA melting point Tm can be determined by CDspectroscopy. Assuming Tm([Mg]) to be linearly depend-ent on the fraction of RNA bound to Mg2+ [Equation(13)], the free energy �GCD of Mg2+ binding to theRNA can be calculated according to Equation (14):
Tmð½Mg2+�Þ ¼TnoMgm +�Tm ¼ TnoMg
m
+�Tm,max½RNAbound�=½RNAtotal�ð13Þ
Tm Mg2+ � �
¼TnoMgm +
�Tm,max Mg2+
exp �GCD= RTð Þð Þ+Mg2+
¼ TnoMgm +
�Tm,max Mg2+
KCD+Mg2+
ð14Þ
In Equation (14), Tm is the melting point of the RNA,TnoMgm is the melting point in the absence of Mg2+ ions,
�Tm,max is the maximal change in Tm caused by Mg2+,[Mg2+] is the Mg2+ concentration, KCD is the RNA:Mg2+
dissociation constant and �GCD is the free energy of Mg2+
binding.
bgaB reporter gene assay
Three different translational fusion constructs have beenused to study the temperature dependence of gene expres-sion in E. coli using the ß-galactosidase gene bgaB asreporter. Constructs were designed by introducing thetemperature sensitive hairpin 2 of the 50-UTR of theSalmonella agsA gene in front of the heat stableß-galactosidase gene bgaB utilizing an EcoRI restrictionsite (underlined in the sequences).The 4U-hp2-wt construct contains the second hairpin of
the fourU (4U) RNA thermometer (41) in an optimizedvector. Sequence: aGCGTTGAACTTTTGAATAGTGATTCAGGAGGTTAATGATGGCAGAATTC�bgaB.The 4U-hp2-A8C-mutant construct differs from thewild-type construct by an A to C mutation (highlightedboldly). Sequence: aGCGTTGACCTTTTGAATAGTGATTCAGGAGGTTAATGATG GCAGAATTC�bgaB.In the 4U-hp2-G14A-C25U-mutant the G14-C25 basepair is exchanged to an A14-U25 base pair (highlightedboldly). Sequence: aGCGTTGAACTTTTAAATAGTGATTTAGGAGGTTAATGATGGCAGAATTC�bgaB.An amount of 25ml LB-Amp (150mg/ml), pre-warmed ina shaker to 30�C were inoculated with 1.5ml over nightculture (5ml grown at 30�C) of DH5a cells containing theplasmids. Cells were grown to an optical density (OD600)of 0.5. After induction of transcripts with 25 ml L-arabin-ose (10%), 8ml of the culture were shifted to twopre-warmed, shaking flasks at different temperatures, re-spectively. After 30min cells were used for the enzymaticassay as described before (47). To compare the different
measurements the expression value for the wt at 30�C wasset to 1, respectively.
RESULTS AND DISCUSSION
Hairpin stability of the fourU thermometer inverselycorrelates with gene expression
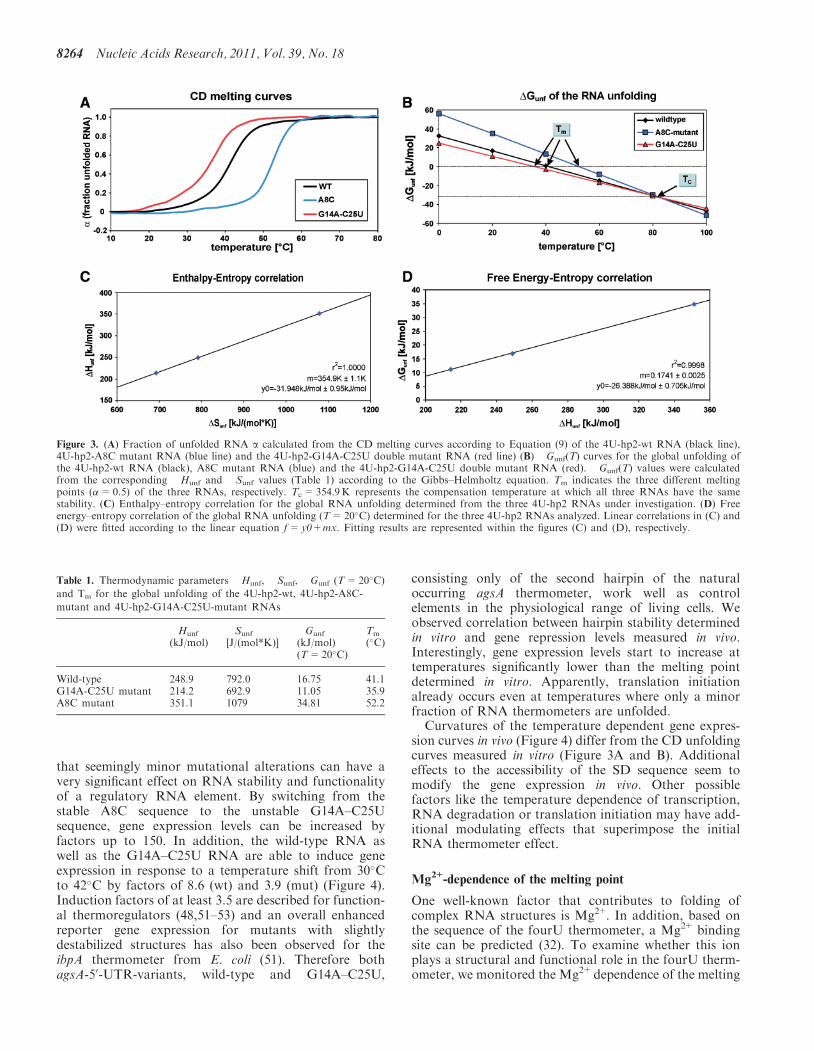
In our previous study, we determined base-pair stabilitiesof hairpin 2 (4U-hp2-wt, Figure 2B), which represents thetemperature responsive hairpin of the Salmonella fourUthermometer, in comparison with a stabilized pointmutant (4U-hp2-A8C-mutant), in which the AGmismatch of the wt structure was replaced by a CG pair(Figure 2A). From this study, we concluded that the G14–C25 base pair is by far the most stable base pair in thethermometer hairpin and has a stabilizing effect on thesecondary structure of the entire RNA helix (39). Thus,substitution of this stable GC base pair into a less stableAU base pair (Figure 2C) is predicted to result in a sig-nificant reduction of the thermal stability of the 4U-hp2RNA. CD unfolding curves recorded on the G14A–C25Udouble mutant indeed confirmed the expected behavior(Figure 3A). The GC to AU exchange resulted in amelting point Tm of 35.9�C, which is 5.2�C lower thanthe Tm value of the wild-type RNA and 16.3�C lowerthan the 4U-hp2-A8C mutant RNA (Figure 3A and B).Tm values for the three RNAs under investigation aregiven in Table 1.
Reversible melting and refolding of an RNA thermom-eter has recently been shown to be physiologically import-ant for fitness of a cyanobacterium (48). CD unfoldingand refolding curves demonstrated a similar full reversibil-ity of the unfolding transition of all three fourU hairpinsinvestigated in the current study since start and endpoints of unfolding and refolding curves are identical(Supplementary Figures S1–S3). However, unfolding andrefolding curves slightly differ due to disturbance of theequilibrium caused by the continuous temperature changeduring the temperature scan. For the subsequent analysis,melting and refolding curves were averaged (the averagedcurve will be referred to as unfolding curve from now on)to derive the unfolding curve under equilibrium condi-tions. Unfolding curves were normalized according toEquation (9) and �(T) values were determined assuminga two–state model (folded; unfolded) for RNA unfolding.The thermodynamic parameters �Hunf, �Sunf and �Gunf
were derived according to Equations (10–12) from the�(T) curves shown in Figure 3A. �Hunf, �Sunf, �Gunf
and Tm values for the three RNAs under investigationare given in Table 1.
From the �Hunf and �Sunf values, the corresponding�Gunf(T) curves can be calculated according to theGibbs–Helmholtz equation. These �Gunf(T) curves areillustrated for the wild-type RNA and the two mutantsin Figure 3B. Remarkably, all three �Gunf(T) curvesexhibit an intersection point at Tc=81.8�C. At this tem-perature, the three RNAs possess the same stability�Gunf(81.8
�C)=�31.94 kJ/mol. At Tc, the unfoldedRNA is almost exclusively populated since it is thenmuch more stable than the folded conformation. The
8262 Nucleic Acids Research, 2011, Vol. 39, No. 18

existence of an intersection point of the �Gunf(T) curves isa consequence of the linear enthalpy–entropy correlationof the global unfolding transition which is depicted inFigure 3C. The slope of the �Hunf(�Sunf) correlation isequal to m=354.9K and the ordinate intercept wasdetermined to be y0=�31.95±0.95 kJ/mol. Linearenthalpy–entropy correlations for global unfolding transi-tions have been reported earlier by Searle and Williams(49) and by Petruska (50) for DNA duplexes. There is alsoa strong linear correlation between �Gunf and �Hunf
(Figure 3D) in the fourU RNA thermometer. The slopeof this correlation is temperature-dependent and isillustrated for a temperature of 20�C.
Insertion of the enthalpy–entropy correlation into theGibbs–Helmholtz equation results in the followingequation:
�Gunf ¼ m� Tð Þ ��Sunf+y0 ð15Þ
At the compensation temperature (Tc=m), enthalpy andentropy contributions of the RNA-solvent interactioncancel each other and only the RNA–RNA interactionsremain and equal y0.
Helix unfolding can be approximated according toSearle and Williams (49) by the following equation
�Gunf � �Hstacking � T��Srotation ð16Þ
At Tc, this leads to the following relation
�Gunf Tcð Þ ¼ y0 � �Hstacking � T��Srotation ð17Þ
�Gunf(Tc) is affected by the increase in entropy upon un-folding, mainly caused by the gain of rotational freedomin the RNA backbone �Srotation and the loss of stackinginteractions between neighboring nucleobases �Hstacking.At the compensation temperature Tc, the absolutevalue of the entropy term T*�S exceeds by far theabsolute value of the enthalpy term �Hstacking. Thus, theRNA is almost completely unfolded at Tc
(�Gunf Tcð Þ ¼ y0 ¼ �31:95kJ=mol 0:95kJ=mol).In order to test whether the in vitro observations correl-
ate with translational control in vivo, the 4U-hp2-wt RNA,the 4U-A8C RNA and the 4U-G14A-C25U RNA wereanalyzed in the bgaB reporter gene assay as described pre-viously (41). The 50-UTRs were cloned 50-upstream of thebgaB reporter gene downstream of an arabinose-induciblepromoter and transformed into E. coli DH5a cells.Transcription was initiated with 0.01% (w/v) of L-arabin-ose and translation at various temperatures was followedby determination of b-galactosidase activity. Expressionlevels were normalized to the expression of the4U-hp2-wt sequence at 30�C. The gene expression curveswere consistent with the in vitro data in that the leaststable G14A–C25U mutant led to derepressed, perman-ently elevated reporter gene expression even at low tem-peratures (Figure 4). The wild-type 50-UTR allowedintermediate gene expression at elevated temperatureswhereas the stable A8C mutant blocked gene expressioncompletely. The combined in vivo and in vitro results show
Figure 2. Sequence and secondary structure of hairpin 2 of the Salmonella fourU RNA thermometer and mutants used in this study. (A) Secondarystructure of the 4U-hp2-A8C mutant RNA. (B) Secondary structure of the 4U-hp2-wt RNA. (C) Secondary structure of the 4U-hp2-G14A-C25Umutant RNA.
Nucleic Acids Research, 2011, Vol. 39, No. 18 8263
that seemingly minor mutational alterations can have avery significant effect on RNA stability and functionalityof a regulatory RNA element. By switching from thestable A8C sequence to the unstable G14A–C25Usequence, gene expression levels can be increased byfactors up to 150. In addition, the wild-type RNA aswell as the G14A–C25U RNA are able to induce geneexpression in response to a temperature shift from 30�Cto 42�C by factors of 8.6 (wt) and 3.9 (mut) (Figure 4).Induction factors of at least 3.5 are described for function-al thermoregulators (48,51–53) and an overall enhancedreporter gene expression for mutants with slightlydestabilized structures has also been observed for theibpA thermometer from E. coli (51). Therefore bothagsA-50-UTR-variants, wild-type and G14A–C25U,
consisting only of the second hairpin of the naturaloccurring agsA thermometer, work well as controlelements in the physiological range of living cells. Weobserved correlation between hairpin stability determinedin vitro and gene repression levels measured in vivo.Interestingly, gene expression levels start to increase attemperatures significantly lower than the melting pointdetermined in vitro. Apparently, translation initiationalready occurs even at temperatures where only a minorfraction of RNA thermometers are unfolded.
Curvatures of the temperature dependent gene expres-sion curves in vivo (Figure 4) differ from the CD unfoldingcurves measured in vitro (Figure 3A and B). Additionaleffects to the accessibility of the SD sequence seem tomodify the gene expression in vivo. Other possiblefactors like the temperature dependence of transcription,RNA degradation or translation initiation may have add-itional modulating effects that superimpose the initialRNA thermometer effect.
Mg2+-dependence of the melting point
One well-known factor that contributes to folding ofcomplex RNA structures is Mg2+. In addition, based onthe sequence of the fourU thermometer, a Mg2+ bindingsite can be predicted (32). To examine whether this ionplays a structural and functional role in the fourU therm-ometer, we monitored the Mg2+dependence of the melting
Figure 3. (A) Fraction of unfolded RNA a calculated from the CD melting curves according to Equation (9) of the 4U-hp2-wt RNA (black line),4U-hp2-A8C mutant RNA (blue line) and the 4U-hp2-G14A-C25U double mutant RNA (red line) (B) �Gunf(T) curves for the global unfolding ofthe 4U-hp2-wt RNA (black), A8C mutant RNA (blue) and the 4U-hp2-G14A-C25U double mutant RNA (red). �Gunf(T) values were calculatedfrom the corresponding �Hunf and �Sunf values (Table 1) according to the Gibbs–Helmholtz equation. Tm indicates the three different meltingpoints (�=0.5) of the three RNAs, respectively. Tc=354.9K represents the compensation temperature at which all three RNAs have the samestability. (C) Enthalpy–entropy correlation for the global RNA unfolding determined from the three 4U-hp2 RNAs under investigation. (D) Freeenergy–entropy correlation of the global RNA unfolding (T=20�C) determined for the three 4U-hp2 RNAs analyzed. Linear correlations in (C) and(D) were fitted according to the linear equation f= y0+mx. Fitting results are represented within the figures (C) and (D), respectively.
Table 1. Thermodynamic parameters �Hunf, �Sunf, �Gunf (T=20�C)
and Tm for the global unfolding of the 4U-hp2-wt, 4U-hp2-A8C-
mutant and 4U-hp2-G14A-C25U-mutant RNAs
�Hunf
(kJ/mol)�Sunf
[J/(mol*K)]�Gunf
(kJ/mol)(T=20�C)
Tm
(�C)
Wild-type 248.9 792.0 16.75 41.1G14A-C25U mutant 214.2 692.9 11.05 35.9A8C mutant 351.1 1079 34.81 52.2
8264 Nucleic Acids Research, 2011, Vol. 39, No. 18

point Tm of the 4U-hp2-wt RNA by CD spectroscopy.The Tm(Mg2+) dependence was fitted by Equation (14)(Figure 5) and �GCD, �Tm,max and TnoMg
m values werederived (Table 2).
The Tm(Mg2+) dependence can be described by a modelwhich assumes only a single binding site. NMR experi-ments, however, provide evidence for two Mg2+ bindingsites (see below). Since Mg2+ binding to these sites is co-operative (see below), the 4U-hp2-wt RNA exists mostprominently in either the free form or the ternarycomplex ([Mg2+*RNA*Mg2+]) but rarely in one of thebinary complexes ([Mg2+*RNA] or [RNA*Mg2+]). Thus,the Tm(Mg2+) curve exhibits hyperbolic shape and the�GCD value determined from the Tm(Mg2+)-dependence
represents the free binding energy between free RNA andternary [Mg2+*RNA*Mg2+] complex. In addition, we canshow that the temperature dependence of Tm is caused byspecific and not by diffuse Mg2+ binding (SupplementaryData: Evidence for defined Mg2+ binding). The fact thatthe temperature dependence is dominated by definedMg2+binding does not rule out the possibility of addition-al diffuse binding. However, according to our data theeffects of diffuse Mg2+ binding are small in comparisonto the effects caused by specific binding, at least in theconcentration range observed here (0–7mM).The Mg2+ dependence of Tm observed in vitro indicates
a potential effect of fluctuating Mg2+ concentrationswithin the cell on expression levels of genes under thecontrol of the fourU RNA thermometer. According tothe literature, the free intracellular Mg2+ concentrationmay vary between 1 and 2mM (14,18). Such a shift inMg2+ concentration causes a shift of the Tm value of the4U-hp2-wt RNA by 2.8�C (Figure 5). Thus, varying Mg2+
concentration will most probably have a modulatingtemperature-independent effect on RNA-thermometer-controlled gene expression in vivo.
Localization of the Mg2+ binding sites
We applied different NMR methods to identify Mg2+
binding sites in the 4U-hp2-wt RNA. First, a NOESYexperiment of a 4U-hp2-wt RNA sample in the presenceof ½CoðNH3Þ6�
3+ ions was performed to identify andlocalize ½CoðNH3Þ6�
3+ binding sites. ½CoðNH3Þ6�3+ ions
serve as mimic for hexahydrated Mg2+ ions and thereforemap binding sites for outer sphere coordinated Mg2+ ions(28,29,32). Second, we analyzed the PRE effects of theimino signals occurring upon the addition of paramagnet-ic Mn2+ ions to the 4U-hp2-wt RNA sample (28,29). Thefact that substoichiometric amounts of Mn2+are sufficientto cause significant line broadening of imino signals inclose proximity to Mg2+ binding sites reveals that Mg2+
ions are in rapid exchange with free divalent ions. The useof Mn2+ as probe for Mg2+ is supported by the observa-tion that 76% of the intracellular Mg2+ ions in prokary-otes (E. coli) can be substituted by Mn2+ ions withoutseverely impairing viability of the cells (18). Third, wefollowed CSPs of the imino signals during Mg2+ titrationexperiments (28,29). Fitting of the obtained CSP curveswas performed to derive KD values for Mg2+ binding. Bytaking the results of these three complementary techniquesinto account, it became possible to unravel the differenteffects on how Mg2+ ions interact with the 4U-hp2-wtRNA. Combination of the information yields a consistentoverall picture on the effects of Mg2+ ions on the4U-hp2-wt RNA.The imino region of the 2D-1H-1H NOESY spectrum of
the 4U-hp2-wt RNA in the presence of 5mM½CoðNH3Þ6�
3+ ions is given in Figure 6. Protons from½CoðNH3Þ6�
3+ exhibit strong cross peaks to the iminoprotons of the nucleobases U11, U12, G27 and/or G28and weak cross peaks to the imino protons of theadjacent nucleobases U10 and U13. Thus, a binding sitefor ½CoðNH3Þ6�
3+ is located in close proximity to thenucleobases U11, U12, G27 and G28, most probably in
Figure 4. Temperature dependent expression of the agsA-(4U-hp2)-bgaB fusion in DH5a E. coli cells. Following RNA constructs wereinvestigated: 4U-hp2-wt (filled diamonds), 4U-hp2-A8C-mutant (opentriangles), 4U-hp2-G14A-C25U (filled triangles). Expression levels werereferenced to the respective expression level of the 4U-hp2-wt at 30�Cwhich was set to 1.
Figure 5. Tm melting point dependence of the 4U-hp2-wt RNA on theMgCl2 concentration. Data points are given as filled diamonds whilethe fit according to Equation (14) is illustrated as continuous line.
Table 2. Fitting results of the Tm(Mg2+) dependence of the
4U-hp2-wt RNA according to Equation (14)
4U-hp2-wt TnoMgm
(�C)�Tm,max
(�C)KCD
(mM)�GCD
(kJ/mol)
41.77±0.22 16.93±0.25 899a±47.9 �18.860±0.14
aKCD was calculated for a temperature of 50.24�C. Errors are derivedfrom the fit.
Nucleic Acids Research, 2011, Vol. 39, No. 18 8265

the major groove of the RNA helix very similar to thebinding site described for the structure of the P5bhairpin of the group I intron by Kieft and Tinoco (32).PRE effects of the imino signals caused by the addition
of Mn2+ ions were analyzed in order to reveal divalentcation binding sites. For that purpose, [1H,15N]-HSQCsof the imino region of the 4U-hp2-wt RNA sample wererecorded and line shapes and intensities of the imino
signals were analyzed to quantify the PRE effects.Changes in line widths and signal intensities caused bythe addition of 4 mM Mn2+ are given in Figure 7. LargePRE effects were observed for the nucleobases U11 andU12 within the RNA helix. In addition, the nucleobasesU13, G14 and U33 also show significant PRE effects,while the imino signal of nucleobase U10 exhibits only avery weak PRE effect. Interestingly the G27/G28 doublesignal only shows a moderate PRE effect in comparison toU11, U12 and U13 which is consistent with binding of½CoðNH3Þ6�
3+ in the major groove.Taken together, the PRE analysis reveals the existence
of a Mn2+ binding site within the 4U-hp2-wt RNA whichis located in close proximity to the nucleobases U11, U12and U13. This Mn2+binding site represents a strong indi-cation for the existence of a Mg2+ binding site at exactlythe same position within the 4U-hp2-wt RNA.Furthermore, PRE analysis and ½CoðNH3Þ6�
3+ NOESYdata reveal binding sites in the same region of the RNAleading to the conclusion that there is one specific outersphere Mg2+ binding site within the fourU motif of the4U-hp2-wt RNA. Moderate PRE effects of thenucleobases G27/G28 are in agreement with localizationof this binding site within the major groove.
Finally, we titrated 4U-hp2-wt RNA with Mg2+ ionsand analyzed the occurring CSPs of the imino groupregion within the [1H,15N]-HSQC spectra. CSP([Mg2+])curves were fitted according to Equation (2) and KD
values were derived. Figure 8 shows Mg2+-dependentCSPs of the imino groups with their respective fits(continuous lines). In Figure 8D, the shifting signals ofthe imino groups U5 and U13 within the [1H-15N]-HSQC during the titration of the RNA with MgCl2are shown exemplarily. Fitting results are summarizedin Supplementary Table S1. Interestingly, different
Figure 7. PRE of the imino resonances of the 4U-hp2-wt RNA observed upon the addition of 4 mM MnCl2. Changes in line widths �n [Hz] in the15N-dimension are illustrated as filled triangles (continuous line) with the corresponding scale on the left hand side of the diagram and changes inintensity (ln(I[0 mM]/I[4 mM]) [a.u.]) are illustrated as open squares (dotted line) with the corresponding scale on the right hand side. U32 and G31 donot give rise to any observable imino signals and the imino signals of G30 and U4 are too weak to be analyzed.
Figure 6. Section from the 2D-1H NOESY experiment performed ona 0.9-mM 4U-hp2-wt RNA sample in the presence of 5mM[(Co(NH3)6]
3+. Assignments of cross signals between protons of the½CoðNH3Þ6�
3+ and the imino protons of the RNA are given withinthe spectrum. On top of the NOESY spectrum, the correspondingimino region of the 1H-1D NMR spectrum is given. Buffer conditions:15mM KxHyPO4 (pH 6.5), 25mM KCl, 90% H2O and 10% D2O.
8266 Nucleic Acids Research, 2011, Vol. 39, No. 18
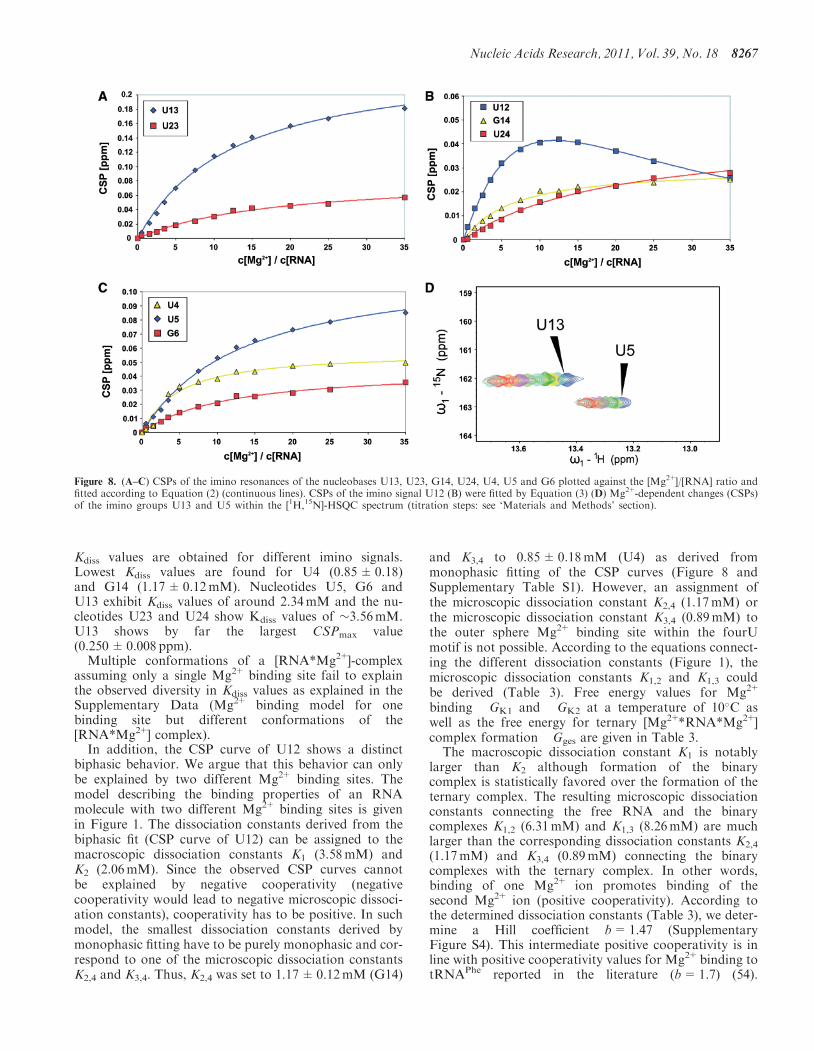
Kdiss values are obtained for different imino signals.Lowest Kdiss values are found for U4 (0.85±0.18)and G14 (1.17±0.12mM). Nucleotides U5, G6 andU13 exhibit Kdiss values of around 2.34mM and the nu-cleotides U23 and U24 show Kdiss values of �3.56mM.U13 shows by far the largest CSPmax value(0.250±0.008 ppm).
Multiple conformations of a [RNA*Mg2+]-complexassuming only a single Mg2+ binding site fail to explainthe observed diversity in Kdiss values as explained in theSupplementary Data (Mg2+ binding model for onebinding site but different conformations of the[RNA*Mg2+] complex).
In addition, the CSP curve of U12 shows a distinctbiphasic behavior. We argue that this behavior can onlybe explained by two different Mg2+ binding sites. Themodel describing the binding properties of an RNAmolecule with two different Mg2+ binding sites is givenin Figure 1. The dissociation constants derived from thebiphasic fit (CSP curve of U12) can be assigned to themacroscopic dissociation constants K1 (3.58mM) andK2 (2.06mM). Since the observed CSP curves cannotbe explained by negative cooperativity (negativecooperativity would lead to negative microscopic dissoci-ation constants), cooperativity has to be positive. In suchmodel, the smallest dissociation constants derived bymonophasic fitting have to be purely monophasic and cor-respond to one of the microscopic dissociation constantsK2,4 and K3,4. Thus, K2,4 was set to 1.17±0.12mM (G14)
and K3,4 to 0.85±0.18mM (U4) as derived frommonophasic fitting of the CSP curves (Figure 8 andSupplementary Table S1). However, an assignment ofthe microscopic dissociation constant K2,4 (1.17mM) orthe microscopic dissociation constant K3,4 (0.89mM) tothe outer sphere Mg2+ binding site within the fourUmotif is not possible. According to the equations connect-ing the different dissociation constants (Figure 1), themicroscopic dissociation constants K1,2 and K1,3 couldbe derived (Table 3). Free energy values for Mg2+
binding �GK1 and �GK2 at a temperature of 10�C aswell as the free energy for ternary [Mg2+*RNA*Mg2+]complex formation �Gges are given in Table 3.The macroscopic dissociation constant K1 is notably
larger than K2 although formation of the binarycomplex is statistically favored over the formation of theternary complex. The resulting microscopic dissociationconstants connecting the free RNA and the binarycomplexes K1,2 (6.31mM) and K1,3 (8.26mM) are muchlarger than the corresponding dissociation constants K2,4
(1.17mM) and K3,4 (0.89mM) connecting the binarycomplexes with the ternary complex. In other words,binding of one Mg2+ ion promotes binding of thesecond Mg2+ ion (positive cooperativity). According tothe determined dissociation constants (Table 3), we deter-mine a Hill coefficient b=1.47 (SupplementaryFigure S4). This intermediate positive cooperativity is inline with positive cooperativity values for Mg2+binding totRNAPhe reported in the literature (b=1.7) (54).
Figure 8. (A–C) CSPs of the imino resonances of the nucleobases U13, U23, G14, U24, U4, U5 and G6 plotted against the [Mg2+]/[RNA] ratio andfitted according to Equation (2) (continuous lines). CSPs of the imino signal U12 (B) were fitted by Equation (3) (D) Mg2+-dependent changes (CSPs)of the imino groups U13 and U5 within the [1H,15N]-HSQC spectrum (titration steps: see ‘Materials and Methods’ section).
Nucleic Acids Research, 2011, Vol. 39, No. 18 8267
A description how two Mg2+ binding sites may lead tothe observed variety of monophasic CSP curves is givenin the Supplementary Data (Qualitative explanation of theobserved CSP curves using a two binding site model).From the Mg2+ dependence of the melting point Tm
determined by CD spectroscopy (Figure 5 and Table 2),the free energy for Mg2+ binding �GCD at a temperatureof 50.24�C was determined. Assuming that Mg2+ onlybinds to the folded but not to the unfolded RNA �GCD
is equal to �Gges. From the difference of �Gges
(T=10�C) and �GCD (T=50.24�C), �Hges
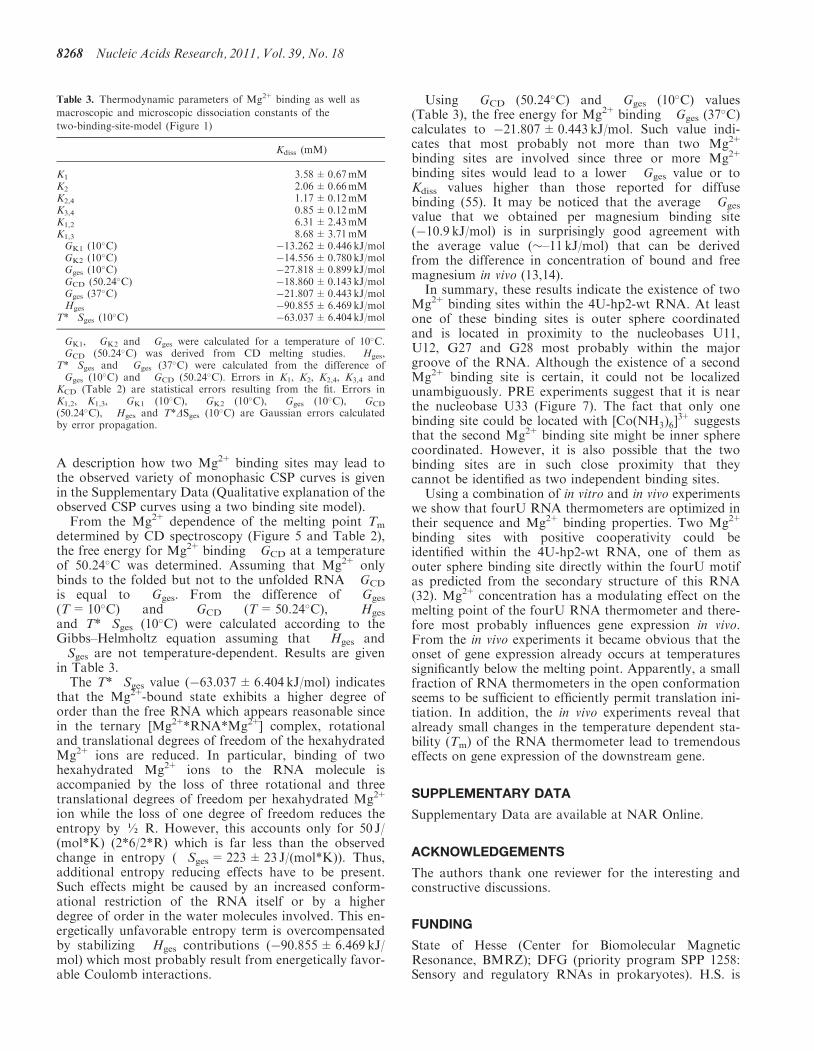
and T*�Sges (10�C) were calculated according to theGibbs–Helmholtz equation assuming that �Hges and�Sges are not temperature-dependent. Results are givenin Table 3.The T*�Sges value (�63.037±6.404 kJ/mol) indicates
that the Mg2+-bound state exhibits a higher degree oforder than the free RNA which appears reasonable sincein the ternary [Mg2+*RNA*Mg2+] complex, rotationaland translational degrees of freedom of the hexahydratedMg2+ ions are reduced. In particular, binding of twohexahydrated Mg2+ ions to the RNA molecule isaccompanied by the loss of three rotational and threetranslational degrees of freedom per hexahydrated Mg2+
ion while the loss of one degree of freedom reduces theentropy by ½ R. However, this accounts only for 50 J/(mol*K) (2*6/2*R) which is far less than the observedchange in entropy (�Sges=223±23 J/(mol*K)). Thus,additional entropy reducing effects have to be present.Such effects might be caused by an increased conform-ational restriction of the RNA itself or by a higherdegree of order in the water molecules involved. This en-ergetically unfavorable entropy term is overcompensatedby stabilizing �Hges contributions (�90.855±6.469 kJ/mol) which most probably result from energetically favor-able Coulomb interactions.
Using �GCD (50.24�C) and �Gges (10�C) values(Table 3), the free energy for Mg2+ binding �Gges (37
�C)calculates to �21.807±0.443 kJ/mol. Such value indi-cates that most probably not more than two Mg2+
binding sites are involved since three or more Mg2+
binding sites would lead to a lower �Gges value or toKdiss values higher than those reported for diffusebinding (55). It may be noticed that the average �Gges
value that we obtained per magnesium binding site(�10.9 kJ/mol) is in surprisingly good agreement withthe average value (�–11 kJ/mol) that can be derivedfrom the difference in concentration of bound and freemagnesium in vivo (13,14).
In summary, these results indicate the existence of twoMg2+ binding sites within the 4U-hp2-wt RNA. At leastone of these binding sites is outer sphere coordinatedand is located in proximity to the nucleobases U11,U12, G27 and G28 most probably within the majorgroove of the RNA. Although the existence of a secondMg2+ binding site is certain, it could not be localizedunambiguously. PRE experiments suggest that it is nearthe nucleobase U33 (Figure 7). The fact that only onebinding site could be located with ½CoðNH3Þ6�
3+ suggeststhat the second Mg2+ binding site might be inner spherecoordinated. However, it is also possible that the twobinding sites are in such close proximity that theycannot be identified as two independent binding sites.
Using a combination of in vitro and in vivo experimentswe show that fourU RNA thermometers are optimized intheir sequence and Mg2+ binding properties. Two Mg2+
binding sites with positive cooperativity could beidentified within the 4U-hp2-wt RNA, one of them asouter sphere binding site directly within the fourU motifas predicted from the secondary structure of this RNA(32). Mg2+ concentration has a modulating effect on themelting point of the fourU RNA thermometer and there-fore most probably influences gene expression in vivo.From the in vivo experiments it became obvious that theonset of gene expression already occurs at temperaturessignificantly below the melting point. Apparently, a smallfraction of RNA thermometers in the open conformationseems to be sufficient to efficiently permit translation ini-tiation. In addition, the in vivo experiments reveal thatalready small changes in the temperature dependent sta-bility (Tm) of the RNA thermometer lead to tremendouseffects on gene expression of the downstream gene.
SUPPLEMENTARY DATA
Supplementary Data are available at NAR Online.
ACKNOWLEDGEMENTS
The authors thank one reviewer for the interesting andconstructive discussions.
FUNDING
State of Hesse (Center for Biomolecular MagneticResonance, BMRZ); DFG (priority program SPP 1258:Sensory and regulatory RNAs in prokaryotes). H.S. is
Table 3. Thermodynamic parameters of Mg2+ binding as well as
macroscopic and microscopic dissociation constants of the
two-binding-site-model (Figure 1)
Kdiss (mM)
K1 3.58±0.67mMK2 2.06±0.66mMK2,4 1.17±0.12mMK3,4 0.85±0.12mMK1,2 6.31±2.43mMK1,3 8.68±3.71mM�GK1 (10�C) �13.262±0.446 kJ/mol�GK2 (10�C) �14.556±0.780 kJ/mol�Gges (10
�C) �27.818±0.899 kJ/mol�GCD (50.24�C) �18.860±0.143 kJ/mol�Gges (37
�C) �21.807±0.443 kJ/mol�Hges �90.855±6.469 kJ/molT*�Sges (10
�C) �63.037±6.404 kJ/mol
�GK1, �GK2 and �Gges were calculated for a temperature of 10�C.�GCD (50.24�C) was derived from CD melting studies. �Hges,T*�Sges and �Gges (37�C) were calculated from the difference of�Gges (10�C) and �GCD (50.24�C). Errors in K1, K2, K2,4, K3,4 andKCD (Table 2) are statistical errors resulting from the fit. Errors inK1,2, K1,3, �GK1 (10�C), �GK2 (10�C), �Gges (10�C), �GCD
(50.24�C), �Hges and T*DSges (10�C) are Gaussian errors calculatedby error propagation.
8268 Nucleic Acids Research, 2011, Vol. 39, No. 18

member of the DFG-funded Cluster of Excellence:Macromolecular complexes. Funding for open accesscharge: DFG.
Conflict of interest statement. None declared.
REFERENCES
1. Walker,G.M. (1994) The roles of magnesium in biotechnology.Crit. Rev. Biotechnol., 14, 311–354.
2. Wood,J.M. (2007) Bacterial osmosensing transporters.Meth. Enzymol., 428, 77–107.
3. Shiman,R. and Draper,D.E. (2000) Stabilization of RNA tertiarystructure by monovalent cations. J. Mol. Biol., 302, 79–91.
4. Pyle,A.M. (2002) Metal ions in the structure and function ofRNA. J. Biol. Inorg. Chem., 7, 679–690.
5. Merlevede,W., Vandenheede,J.R., Goris,J. and Yang,S.D. (1984)Regulation of ATP-Mg-dependent protein phosphatase.Curr. Top. Cell. Regul., 23, 177–215.
6. Brock,T.D. (1962) Effects of magnesium ion deficiency onEscherichia coli and possible relation to the mode of action ofNovobiocin. J. Bacteriol., 84, 679–682.
7. Hughes,M.N. and Poole,R.K. (1989) Metals and Microorganisms.Chapman and Hall, London.
8. Meers,J.L. and Tempest,D.W. (1969) The influence ofextracellular products on the behaviour of mixed microbialpopulations in magnesium-limited chemostat cultures.J. Gen. Microbiol., 52, 309–317.
9. Klein,D.J., Moore,P.B. and Steitz,T.A. (2004) The contributionof metal ions to the structural stability of the large ribosomalsubunit. RNA, 10, 1366–1379.
10. Tempest,D.W. and Strange,R.E. (1966) Variation in content anddistribution of magnesium, and its influence on survival, inAerobacter aerogenes grown in a chemostat. J. Gen. Microbiol.,44, 273–279.
11. Webb,M. (1968) The influence of certain trace metals on bacterialgrowth and magnesium utilization. J. Gen. Microbiol., 51,325–335.
12. Hurwitz,C. and Rosano,C.L. (1967) The intracellularconcentration of bound and unbound magnesium ions inEscherichia coli. J. Biol. Chem., 242, 3719–3722.
13. Moncany,M.L. and Kellenberger,E. (1981) High magnesiumcontent of Escherichia coli B. Experientia, 37, 846–847.
14. Alatossava,T., Jutte,H., Kuhn,A. and Kellenberger,E. (1985)Manipulation of intracellular magnesium content in polymyxinB nonapeptide-sensitized Escherichia coli by ionophore A23187.J. Bacteriol., 162, 413–419.
15. Lusk,J.E. and Kennedy,E.P. (1969) Magnesium transport inEscherichia coli. J. Biol. Chem., 244, 1653–1655.
16. Lusk,J.E., Williams,R.J. and Kennedy,E.P. (1968) Magnesiumand the growth of Escherichia coli. J. Biol. Chem., 243,2618–2624.
17. Silver,S. (1969) Active transport of magnesium in Escherichia coli.Proc. Natl Acad. Sci. USA, 62, 764–771.
18. Silver,S. and Clark,D. (1971) Magnesium transport in Escherichiacoli. J. Biol. Chem., 246, 569–576.
19. Nelson,D.L. and Kennedy,E.P. (1972) Transport of magnesiumby a repressible and a nonrepressible system in Escherichia coli.Proc. Natl Acad. Sci. USA, 69, 1091–1093.
20. Scribner,H., Eisenstadt,E. and Silver,S. (1974) Magnesiumtransport in Bacillus subtilis W23 during growth and sporulation.J. Bacteriol., 117, 1224–1230.
21. Hmiel,S.P., Snavely,M.D., Miller,C.G. and Maguire,M.E. (1986)Magnesium transport in Salmonella typhimurium:characterization of magnesium influx and cloning of atransport gene. J. Bacteriol., 168, 1444–1450.
22. Hmiel,S.P., Snavely,M.D., Florer,J.B., Maguire,M.E. andMiller,C.G. (1989) Magnesium transport in Salmonellatyphimurium: genetic characterization and cloning of threemagnesium transport loci. J. Bacteriol., 171, 4742–4751.
23. Snavely,M.D., Florer,J.B., Miller,C.G. and Maguire,M.E. (1989)Magnesium transport in Salmonella typhimurium: expression
of cloned genes for three distinct Mg2+ transport systems.J. Bacteriol., 171, 4752–4760.
24. Snavely,M.D., Florer,J.B., Miller,C.G. and Maguire,M.E. (1989)Magnesium transport in Salmonella typhimurium: 28Mg2+
transport by the CorA, MgtA, and MgtB systems. J. Bacteriol.,171, 4761–4766.
25. Snavely,M.D., Gravina,S.A., Cheung,T.T., Miller,C.G. andMaguire,M.E. (1991) Magnesium transport in Salmonellatyphimurium. Regulation of mgtA and mgtB expression.J. Biol. Chem., 266, 824–829.
26. Basu,S., Rambo,R.P., Strauss-Soukup,J., Cate,J.H., Ferre-D’Amare,A.R., Strobel,S.A. and Doudna,J.A. (1998) A specificmonovalent metal ion integral to the AA platform of the RNAtetraloop receptor. Nat. Struct. Biol., 5, 986–992.
27. Butcher,S.E., Allain,F.H. and Feigon,J. (2000) Determination ofmetal ion binding sites within the hairpin ribozyme domains byNMR. Biochemistry, 39, 2174–2182.
28. Feigon,J., Butcher,S.E., Finger,L.D. and Hud,N.V. (2001)Solution nuclear magnetic resonance probing of cation bindingsites on nucleic acids. Meth. Enzymol., 338, 400–420.
29. Gonzalez,R.L. Jr and Tinoco,I. Jr (2001) Identification andcharacterization of metal ion binding sites in RNA.Meth. Enzymol., 338, 421–443.
30. Furtig,B., Richter,C., Wohnert,J. and Schwalbe,H. (2003) NMRspectroscopy of RNA. Chembiochem, 4, 936–962.
31. Martin,R.B. (1990) In Dekker,M. (ed.), Metal Ions in BiologicalSystems, New York.
32. Kieft,J.S. and TinocoI.Jr (1997) Solution structure of ametal-binding site in the major groove of RNA complexed withcobalt (III) hexammine. Structure, 5, 713–721.
33. Jack,K.D., Means,J.A. and Hines,J.V. (2008) Characterizingriboswitch function: identification of Mg2+ binding site inT box antiterminator RNA. Biochem. Biophys. Res. Comm., 370,306–310.
34. Buck,J., Noeske,J., Wohnert,J. and Schwalbe,H. (2010) Dissectingthe influence of Mg2+ on 3D architecture and ligand-binding ofthe guanine-sensing riboswitch aptamer domain. Nucleic AcidsRes., 38, 4143–4153.
35. Ramesh,A. and Winkler,W.C. (2010) Magnesium-sensingriboswitches in bacteria. RNA Biol., 7, 77–83.
36. Winkler,W.C. and Breaker,R.R. (2005) Regulation of bacterialgene expression by riboswitches. Annu. Rev. Microbiol., 59,487–517.
37. Schwalbe,H., Buck,J., Furtig,B., Noeske,J. and Wohnert,J. (2007)Structures of RNA switches: insight into molecularrecognition and tertiary structure. Angew. Chem. Int.E. Engl., 46, 1212–1219.
38. Narberhaus,F. (2010) Translational control of bacterial heatshock and virulence genes by temperature-sensing mRNAs. RNABiol., 7, 84–89.
39. Rinnenthal,J., Klinkert,B., Narberhaus,F. and Schwalbe,H. (2010)Direct observation of the temperature-induced melting process ofthe Salmonella fourU RNA thermometer at base-pair resolution.Nucleic Acids Res., 38, 3834–3847.
40. Neupert,J., Karcher,D. and Bock,R. (2008) Design of simplesynthetic RNA thermometers for temperature-controlled geneexpression in Escherichia coli. Nucleic Acids Res., 36, e124.
41. Waldminghaus,T., Heidrich,N., Brantl,S. and Narberhaus,F.(2007) FourU: a novel type of RNA thermometer in Salmonella.Mol. Microbiol., 65, 413–424.
42. Bodenhausen,G. and Ruben,D.J. (1980) Natural abundancenitrogen-15 NMR by enhanced heteronuclear spectroscopy.Chem. Phys. Lett., 69, 185–189.
43. Sklenar,V., Piotto,M., Leppik,R. and Saudek,V. (1993)Gradient-tailored water suppression for 1H-15N HSQCexperiments optimized to retain full sensitivity. J. Magn. Reson.,Series A, 102, 241–245.
44. Noeske,J., Schwalbe,H. and Wohnert,J. (2007) Metal-ion bindingand metal-ion induced folding of the adenine-sensing riboswitchaptamer domain. Nucleic Acids Res., 35, 5262–5273.
45. Stoldt,M., Wohnert,J., Ohlenschlager,O., Gorlach,M. andBrown,L.R. (1999) The NMR structure of the 5 S rRNAE-domain-protein L25 complex shows preformed and inducedrecognition. EMBO J., 18, 6508–6521.
Nucleic Acids Research, 2011, Vol. 39, No. 18 8269

46. Marky,L.A. and Breslauer,K.J. (1987) Calculating thermodynamicdata for transitions of any molecularity from equilibrium meltingcurves. Biopolymers, 26, 1601–1620.
47. Gaubig,L.C., Waldminghaus,T. and Narberhaus,F. (2011)Multiple layers of control govern expression of the Escherichiacoli ibpAB heat shock operon. Microbiology, 157, 66–76.
48. Kortmann,J., Sczodrok,S., Rinnenthal,J., Schwalbe,H. andNarberhaus,F. (2011) Translation on demand by asimple RNA-based thermosensor. Nucleic Acids Res., 39,2855–2868.
49. Searle,M.S. and Williams,D.H. (1993) On the stability of nucleicacid structures in solution: enthalpy-entropy compensations,internal rotations and reversibility. Nucleic Acids Res., 21,2051–2056.
50. Petruska,J. and Goodman,M.F. (1995) Enthalpy-entropycompensation in DNA melting thermodynamics. J. Biol. Chem.,270, 746–750.
51. Waldminghaus,T., Gaubig,L.C., Klinkert,B. and Narberhaus,F.(2009) The Escherichia coli ibpA thermometer is comprised ofstable and unstable structural elements. RNA Biol., 6, 455–463.
52. Morita,M.T., Tanaka,Y., Kodama,T.S., Kyogoku,Y., Yanagi,H.and Yura,T. (1999) Translational induction of heat shocktranscription factor sigma32: evidence for a built-in RNAthermosensor. Genes Dev., 13, 655–665.
53. Nocker,A., Hausherr,T., Balsiger,S., Krstulovic,N.P., Hennecke,H.and Narberhaus,F. (2001) A mRNA-based thermosensor controlsexpression of rhizobial heat shock genes. Nucleic Acids Res., 29,4800–4807.
54. Labuda,D., Nicoghosian,K. and Cedergren,R. (1985)Cooperativity in low-affinity Mg2+ binding to tRNA. J. Biol.Chem., 260, 1103–1107.
55. Laing,L.G., Gluick,T.C. and Draper,D.E. (1994) Stabilization ofRNA Structure by Mg Ions - Specific and Nonspecific Effects.J. Mol. Biol., 237, 577–587.
8270 Nucleic Acids Research, 2011, Vol. 39, No. 18