Modular, Portable, and Reconfigurable Wireless … calibration and validation, preliminary...
21
Sin Ming Loo, Michael Owen, Josh Kiepert, Arlen Planting, Michael Pook, Derek Klein National Air Transportation Center of Excellence for Research in the Intermodal Transport Environment Boise State University Boise, ID 83725 Byron Jones, Jeremy Beneke National Air Transportation Center of Excellence for Research in the Intermodal Transport Environment Kansas State University Manhattan, KN 66506 Jean Watson Office of Aerospace Medicine Federal Aviation Administration Washington, DC 20591 September 2009 Final Report Modular, Portable, and Reconfigurable Wireless Sensing System for the Aircraft Cabin DOT/FAA/AM-09/18 Office of Aerospace Medicine Washington, DC 20591 OK-09-0434-JAH Federal Aviation Administration
Transcript of Modular, Portable, and Reconfigurable Wireless … calibration and validation, preliminary...

Sin Ming Loo, Michael Owen, Josh Kiepert, Arlen Planting, Michael Pook, Derek KleinNational Air Transportation Center of Excellence for Research in the Intermodal Transport EnvironmentBoise State UniversityBoise, ID 83725
Byron Jones, Jeremy BenekeNational Air Transportation Center of Excellence for Research in the Intermodal Transport EnvironmentKansas State UniversityManhattan, KN 66506
Jean WatsonOffice of Aerospace MedicineFederal Aviation AdministrationWashington, DC 20591
September 2009
Final Report
Modular, Portable, and Reconfigurable Wireless Sensing System for the Aircraft Cabin
DOT/FAA/AM-09/18Office of Aerospace MedicineWashington, DC 20591
OK-09-0434-JAH
Federal AviationAdministration

NOTICE
This document is disseminated under the sponsorship of the U.S. Department of Transportation in the interest
of information exchange. The United States Government assumes no liability for the contents thereof.
___________
This publication and all Office of Aerospace Medicine technical reports are available in full-text from the Civil Aerospace Medical Institute’s publications Web site:
www.faa.gov/library/reports/medical/oamtechreports

i
Technical Report Documentation Page
1. Report No. 2. Government Accession No. 3. Recipient's Catalog No.
DOT/FAA/AM-09/18 4. Title and Subtitle 5. Report Date
September 2009 Modular, Portable, and Reconfigurable Wireless Sensing System for the Aircraft Cabin 6. Performing Organization Code 7. Author(s) Loo SM,1 Owen M,1 Kiepert J,1 Planting CA,1 Pook M,1 Klein D,1 Jones B,2 Beneke J,2 Watson J3
8. Performing Organization Report No.
9. Performing Organization Name and Address 10. Work Unit No. (TRAIS) 1Boise State University Boise, ID 83725
2Kansas State University Manhattan, KS 66506
3FAA Office of Aerospace Medicine 800 Independence Avenue, S.W. Washington, DC 20591
11. Contract or Grant No. Co-Op Agrmt No. 07-C-RITE-BSU
12. Sponsoring Agency name and Address Office of Aerospace Medicine Federal Aviation Administration 800 Independence Ave., S.W. Washington, DC 20591
13. Type of Report and Period Covered
14. Sponsoring Agency Code 15. Supplemental Notes Work was accomplished under Public law 108-76
16. Abstract This paper describes the design and prototyping of a modular, portable, reconfigurable, and wireless multipurpose sensor system for monitoring and recording environmental conditions in aircraft cabins. The objective of this small, portable embedded sensing system is to record aircraft cabin conditions on flights of convenience to generate a large database for determination of normal conditions. By designing a sensor system that can be easily reconfigured for different needs (with the ability and flexibility to accommodate different/extra sensors), the system can be used to measure parameters that meet multiple research requirements. Through design considerations such as generalized signal interface and hierarchical code structure that can be easily reworked for new sensors, this sensor system has been developed for optimum usefulness in aircraft environment research. In the current setup, the system is configured with temperature, humidity, sound level, carbon dioxide, and pressure sensors. The system has been calibrated in the laboratory without the use of a pressure chamber. Data from six flights are presented in this report.
17. Key Words 18. Distribution Statement
Sensor System, Wireless, Monitoring, Portable, Removable Storage, Modular, Reconfigurable
Document is available to the public through the Defense Technical Information Center, Ft. Belvoir, VA 22060; and the National Technical Information Service, Springfield, VA 22161
19. Security Classif. (of this report) 20. Security Classif. (of this page) 21. No. of Pages 22. Price Unclassified Unclassified 18
Form DOT F 1700.7 (8-72) Reproduction of completed page authorized


iii
ABBREVIATIONS
As used in this report, the following abbreviations/acronyms have the meanings indicated
AbbreviAtion MeAning
ACER ----------- Airliner Cabin Environment Research
ASCENT ------- Airliner Sensor Cabin Environment NeTwork
ASHRAE ------- American Society of Heating, Refrigerating and Air-Conditioning Engineers, Inc.
CFR ------------- Code of Federal Regulations
dBA -------------- Decibels with A-weight filtering
EMC ------------ Electromagnetic Compatibility
EMI ------------- Electromagnetic Interference
FAA -------------- Federal Aviation Administration
I/O --------------- Input/Output
I2C -------------- Inter-Integrated Circuit
OSHA ----------- Occupational Safety and Health Administration
ppm ------------- Parts Per Million
SPI --------------- Serial Peripheral Interface
TSA -------------- Transportation Security Administration


v
CONTENTS
IntroductIon . . . . . . . . . . . . . . . . . . . . . . . . . . . . . . . . . . . . . . . . . . . . . . . . . . . . . . . . . . . . . . . . . 1
AIrlIner cAbIn envIronment . . . . . . . . . . . . . . . . . . . . . . . . . . . . . . . . . . . . . . . . . . . . . . . . . . . . . 1
desIgnIng for flexIbIlIty . . . . . . . . . . . . . . . . . . . . . . . . . . . . . . . . . . . . . . . . . . . . . . . . . . . . . . . . 2
Hardware . . . . . . . . . . . . . . . . . . . . . . . . . . . . . . . . . . . . . . . . . . . . . . . . . . . . . . . . . . . . . . . . . . . 2
Software . . . . . . . . . . . . . . . . . . . . . . . . . . . . . . . . . . . . . . . . . . . . . . . . . . . . . . . . . . . . . . . . . . . 4
Calibration . . . . . . . . . . . . . . . . . . . . . . . . . . . . . . . . . . . . . . . . . . . . . . . . . . . . . . . . . . . . . . . . . 5
vAlIdAtIon . . . . . . . . . . . . . . . . . . . . . . . . . . . . . . . . . . . . . . . . . . . . . . . . . . . . . . . . . . . . . . . . . . . . 6
dAtA results And dIscussIon . . . . . . . . . . . . . . . . . . . . . . . . . . . . . . . . . . . . . . . . . . . . . . . . . . . . . 8
conclusIons . . . . . . . . . . . . . . . . . . . . . . . . . . . . . . . . . . . . . . . . . . . . . . . . . . . . . . . . . . . . . . . . . 12
references . . . . . . . . . . . . . . . . . . . . . . . . . . . . . . . . . . . . . . . . . . . . . . . . . . . . . . . . . . . . . . . . . . . 12

1
ModulAr, PortAble, And reconfigurAble Wireless sensing systeM for the AircrAft cAbin
INTROduCTION
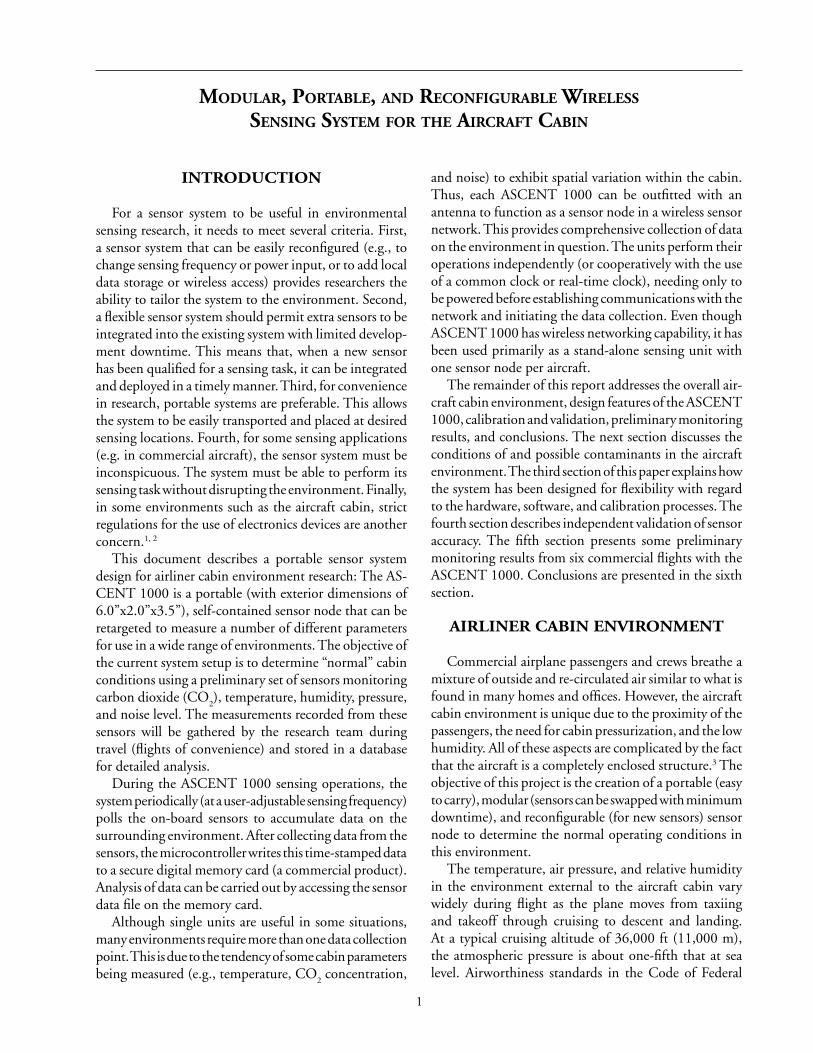
For a sensor system to be useful in environmental sensing research, it needs to meet several criteria. First, a sensor system that can be easily reconfigured (e.g., to change sensing frequency or power input, or to add local data storage or wireless access) provides researchers the ability to tailor the system to the environment. Second, a flexible sensor system should permit extra sensors to be integrated into the existing system with limited develop-ment downtime. This means that, when a new sensor has been qualified for a sensing task, it can be integrated and deployed in a timely manner. Third, for convenience in research, portable systems are preferable. This allows the system to be easily transported and placed at desired sensing locations. Fourth, for some sensing applications (e.g. in commercial aircraft), the sensor system must be inconspicuous. The system must be able to perform its sensing task without disrupting the environment. Finally, in some environments such as the aircraft cabin, strict regulations for the use of electronics devices are another concern.1, 2
This document describes a portable sensor system design for airliner cabin environment research: The AS-CENT 1000 is a portable (with exterior dimensions of 6.0”x2.0”x3.5”), self-contained sensor node that can be retargeted to measure a number of different parameters for use in a wide range of environments. The objective of the current system setup is to determine “normal” cabin conditions using a preliminary set of sensors monitoring carbon dioxide (CO
2), temperature, humidity, pressure,
and noise level. The measurements recorded from these sensors will be gathered by the research team during travel (flights of convenience) and stored in a database for detailed analysis.
During the ASCENT 1000 sensing operations, the system periodically (at a user-adjustable sensing frequency) polls the on-board sensors to accumulate data on the surrounding environment. After collecting data from the sensors, the microcontroller writes this time-stamped data to a secure digital memory card (a commercial product). Analysis of data can be carried out by accessing the sensor data file on the memory card.
Although single units are useful in some situations, many environments require more than one data collection point. This is due to the tendency of some cabin parameters being measured (e.g., temperature, CO
2 concentration,
and noise) to exhibit spatial variation within the cabin. Thus, each ASCENT 1000 can be outfitted with an antenna to function as a sensor node in a wireless sensor network. This provides comprehensive collection of data on the environment in question. The units perform their operations independently (or cooperatively with the use of a common clock or real-time clock), needing only to be powered before establishing communications with the network and initiating the data collection. Even though ASCENT 1000 has wireless networking capability, it has been used primarily as a stand-alone sensing unit with one sensor node per aircraft.
The remainder of this report addresses the overall air-craft cabin environment, design features of the ASCENT 1000, calibration and validation, preliminary monitoring results, and conclusions. The next section discusses the conditions of and possible contaminants in the aircraft environment. The third section of this paper explains how the system has been designed for flexibility with regard to the hardware, software, and calibration processes. The fourth section describes independent validation of sensor accuracy. The fifth section presents some preliminary monitoring results from six commercial flights with the ASCENT 1000. Conclusions are presented in the sixth section.
AIRlINER CABIN ENVIRONmENT
Commercial airplane passengers and crews breathe a mixture of outside and re-circulated air similar to what is found in many homes and offices. However, the aircraft cabin environment is unique due to the proximity of the passengers, the need for cabin pressurization, and the low humidity. All of these aspects are complicated by the fact that the aircraft is a completely enclosed structure.3 The objective of this project is the creation of a portable (easy to carry), modular (sensors can be swapped with minimum downtime), and reconfigurable (for new sensors) sensor node to determine the normal operating conditions in this environment.
The temperature, air pressure, and relative humidity in the environment external to the aircraft cabin vary widely during flight as the plane moves from taxiing and takeoff through cruising to descent and landing. At a typical cruising altitude of 36,000 ft (11,000 m), the atmospheric pressure is about one-fifth that at sea level. Airworthiness standards in the Code of Federal

2
Regulations (CFR Title 14 part 25.841) require the pres-surization system to “provide a cabin pressure at altitude of not more than 8000 ft (2,440 m)” under normal operating conditions.3 This is approximately equal to an air pressure of 75 kiloPascals (kPa). At this pressure, the partial pressure of oxygen is 74% of that at sea level. Muhm et al. recently published a paper on the effect of aircraft cabin altitude on passenger discomfort.4 In their work, the subjects were in a pressure chamber and were asked to complete comfort surveys at a set interval. For this project, we measure the environmental conditions during routine aircraft operation. These measurements can be used in conjunction with the research published by Muhm et al. to monitor and adjust cabin pressure to maintain a comfortable environment.
The outside air is free of most pollutants at cruising altitudes and requires no additional cleaning.3 However, the outside air near ground level could contain a wide variety of contaminants from industrial and urban sources. With a substantial number of contaminants that one may wish to measure, the need for flexibility becomes very apparent. Integrating enough sensors to measure all possible parameters in a single, compact unit would be impractical. Therefore, a good design solution must be able to accommodate the ability to integrate or swap several different types of sensors with minimum develop-ment time to alter the configuration. We have designed the ASCENT 1000 sensor node to meet this level of flexibility, both in hardware and software.
dESIgNINg fOR flExIBIlITy
HardwareTo facilitate flexibility in the system, the ASCENT 1000
has been implemented with a Microchip PIC18F8722 (Microchip Technology Inc., Chandler, AZ). The PIC18F8722 is an 80-pin microcontroller with 128 kilobytes of program memory and nearly four kilobytes of data memory. The microcontroller also has 70 digital I/O pins with the ability to implement a 12-channel, 10-bit analog-to-digital converter (at 3.3V, the resolution is 3.22mV), I2C, and SPI. I2C and SPI are particularly useful, as they are common serial data communication protocols. This memory size and pin variety allows the system to implement a large variety and number of sensors.5 Microcontrollers such as Atmel AVR and other Microchip models were considered for the design, but further research determined that the PIC18F8722 provided the most features with the least amount of development time for this application.
The current design has five onboard sensors: tempera-ture, humidity, pressure, CO
2, and sound level. In addition
to the environmental sensors, the design provides some
internal sensing capabilities for system status, including system battery voltage level sensing. To further enhance flexibility, the system employs two different methods for outputting data. Every ASCENT 1000 has a secure digital flash memory card (a commercial product) slot for storing sensor measurements and an interface for a Maxstream XBee wireless modem, which can broadcast the sensor measurements to a PC or other sensor nodes. Several images of the ASCENT 1000 sensor module are shown in Figures 1a through 1e. Figure 1b shows the sensor board (green printed-circuit board) and the main board (blue printed-circuit board).
Temperature and humidity are sensed by a Sensirion SHT15 sensor module that measures relative humidity from 0 to 100 %RH (± 1 %RH) and temperature from -40 to 257 °F (± 0.9 °F). The pressure sensing is accomplished with a VTI Technologies SCP1000 sensor module that measures absolute pressure ranging from 30 to 120 kPa (± 200 Pa). Carbon dioxide levels are determined with a Telaire 6004 sensor that measures CO
2 concentration in
a range of 0 to 2000 ppm (± 40 ppm + 3% of reading). Though this sensor will not be able to measure the limit set by the Federal Aviation Administration (5000ppm), the narrower range provides better accuracy for the lower levels more likely to be encountered. Because pressure has some effect on any gas reading, the actual concentration of carbon dioxide is calculated from air pressure and CO
2
measurements. This calculation is done in real-time by the sensor once it receives the pressure measurement. Therefore, no post-processing is necessary. Finally, sound level is measured with a custom-built sensor module. The sound sensor is capable of measuring a range from 48 to 110 dBA (± 2 dBA for readings above 60 dBA; ± 5 dBA for readings below 60 dBA).
The ASCENT 1000 can also meet a variety of power requirements for future sensors. The system has two MAX710 step-up/step-down, dc-dc converters to meet the most common requirements of 3.3V and 5V.6 Ef-ficiency is one of the primary benefits of this power supply configuration, as it provides voltage regulation at efficiencies above 80%. The ASCENT 1000 also imple-ments a MAX642 step-up switching regulator that can be configured to provide a voltage from 1.5V to 16.5V.6 This is expected to cover most situations that may arise. Currently, the MAX642 is configured to provide 9V (com-mon supply requirement for some sensors). In addition to these supply voltages, there is an additional on-board, dc-dc converter that can be populated and configured as needed. These dc-dc converters were selected based on a survey of the working voltage ranges and current needs of many common sensors. It should be noted that similar specification dc-dc converters are available from several different manufactures.

3
Figure 1a: Side View of ASCENT 1000
Figure 1b: Interior View of ASCENT 1000
Figure 1c: Front End View of ASCENT 1000
Figure 1d: Rear End View of ASCENT 1000
Figure 1e: Bottom View of ASCENT 1000

4
Long-term battery tests have been conducted on the ASCENT 1000 sensor node to characterize its power consumption. The system is designed to draw power from four AA alkaline batteries arranged in two sets each with two batteries connected in series (standard consumer product battery holder without battery pack; see Figure 1e). This battery arrangement results in a capacity of 4200 mAh at 3V with standard alkaline batteries. In the current sensor configuration with five sensors (CO
2, pres-
sure, temperature, humidity, and sound level), testing has proven that the entire system could run for more than 15 hours at 60-second sensing intervals. At about 15 to 20 hours, high current or high voltage (above 9V) sensors such as the CO
2 would cease functioning because the
batteries could not provide enough current to allow the dc-dc converters to boost the voltage. However, the rest of the sensors would continue to function for a total of 20-24 hours. Even at the 15-hour mark, where the high-power sensors drop out, this provides more than enough time for even the longest flights. In actual flight tests, the power sub-system performed as expected.
A large bank of I/O pins (including analog, I2C, SPI, and strictly digital) is routed from the main board of the ASCENT 1000 by a header to a secondary board that can be reconfigured for the needs of the application. Thus, the main board can remain unchanged when different parameters need to be measured.
The ASCENT 1000 sensor node has the flexibility to accommodate many different sensors to match a variety of circumstances. Thus, the ASCENT 1000 sensor node can be deployed wherever environmental measurements are needed and can provide a standardized data collec-tion system for all manner of research and commercial applications.
SoftwareThe ASCENT 1000 sensor system also incorporates
important software design considerations to allow for a flexible system that can be easily adjusted and repro-grammed using a computer. With a system that could have many different and unknown sensors, there could
potentially be a large amount of code maintenance to ensure that each type of sensor is handled properly. Each sensor will require different interface and data conversion codes. This type of code maintenance is unavoidable. However, the program can be structured so that changes only need to be made on a low level, leaving the high-level code unchanged.
The code is arranged in a hierarchical manner where the upper levels handle the general, unchanging opera-tions of the sensor system. The lowest level of the system contains code specific to the individual sensors. In be-tween is a code structure for translating general code into specific sensor calls. Figure 2 shows the basic structure for performing this translation. This structure defines the addresses of the functions that need to be called to communicate with an individual sensor.
An array of these structures defines the configuration of the system, and the high-level code need only iterate through this list, calling the general names of the func-tions that reference the addresses to run the specific code. When a new sensor is added to the system, a new instance of this software structure is needed, but no modification is required to the basic structure. The software sensor configuration is shown in Figure 3. This is simply a list of sensor structures that contain the function pointers for each sensor in the system. New sensors can be added by adding extra entries to this list.
When writing to the secure digital memory card, all data from the sensors are converted into a form that can be explicitly understood by a generic graphing program on the data server. This specific data format enables the
Figure 2: Structure for Holding Sensor Reference Data
struct sensor { char desc[20]; void (*identify)(char buff[]); unsigned int (*measure)(void); float (*convert)(unsigned int); float calibration; };
Figure 3: Array of Sensors with Function Addresses
rom struct sensor sensors[] = { { "Fibonacci", fib_identify, fib_measure, fib_convert, 0.0 }, { "Temperature", SHT75_temp_identify, SHT75_temp_measure, SHT75_temp_convert, 1.0 }, { "Humidity", SHT75_hum_identify, SHT75_hum_measure, SHT75_hum_convert, 2.0 }, { "Pressure", pressure_identify, pressure_measure, pressure_convert, 4.0}, { "CO2", CO2_identify, CO2_measure, CO2_convert, 5.0 }, { "Sound_Level" , sound_identify, sound_measure, sound_convert, 4.0 }, { "Altitude", altitude_identify, altitude_measure, altitude_convert, 3.0 }, { "Case_Temperature", temperature_identify, temperature_measure, temperature_convert, 3.0}, { "Battery_Level", BTest_identify, BTest_measure, BTest_convert, 6.0 }, };

5
post-processing server to graph the collected data, regard-less of the type of sensor used. This format utilizes two types of data strings: identify strings and measurement strings. When the unit is switched on, identify strings are written that give pertinent information about the sensors such as name, model number, and measurement units for the sensors. It also assigns an identification number to each sensor. When measurements are taken, measurement strings are written that record the value measured by the sensor. These strings use the same sensor identification number assigned in the identify string. This allows the data to be associated with the correct sensor in post-processing analysis. The format of these strings and how they are related can be seen in Figure 4.
CalibrationWith the integration of multiple sensors of varying
accuracy, the ability to individually calibrate each sensor is a necessity. Additionally, since this system is to be flexible, the calibration process should be as simple as possible. This section will describe how this is accomplished for each sensor on the ASCENT 1000.
The temperature and humidity sensors are calibrated using a simple offset in the code. This offset is stored in a calibration file on the secure digital memory card and read from the card on startup. This makes it easier to adjust the calibration offsets. The offsets are calculated by placing the ASCENT 1000 in a closed container with a TSI Q-Trak indoor air quality monitor. The closed container is used to keep the moisture and temperature fluctuations to a minimum. This setup is monitored for several hours. The resulting measurements are then compared using a spreadsheet, and the average difference is calculated. The average difference is used as the calibration offset.
Due to its reliability, it is not necessary to calibrate the pressure sensor, but it is tested for each unit. The procedure for testing the pressure sensor is similar to the process used for calibrating temperature and humidity sensors. The ASCENT 1000 is placed next to a TSI Q-Trak indoor air quality monitor, and the conditions are recorded for several hours. The outputs of both are compared to ensure that the pressure sensor is calibrated correctly.
The CO2 sensor is calibrated using the zero-calibration
feature (using N2 gas) on the Telaire 6004. Using this
feature requires that a special command sequence be transmitted to the device by the microcontroller. There-fore, a special program was written for the PIC18F8722 to perform this task, and this program is downloaded to the ASCENT 1000 to calibrate the CO
2 sensor. Then,
the CO2 sensor is hooked up to a continuous supply of
pure N2. The ASCENT 1000 is turned on for over 5
minutes to ensure that the CO2 sensor has had sufficient
time to stabilize. After being turned off at the end of the calibration routine, the ASCENT 1000 is immediately reprogrammed with normal operational software to en-sure that the CO
2 sensor is not inadvertently recalibrated
with ambient air. After calibrating the aforementioned sensors, the
entire system is tested inside the chamber with the TSI Q-Trak. Any sensor not within the tolerance indicated by its datasheet is recalibrated using the same process.
The method for calibrating the sound sensor is slightly more involved than the methods used for the other sen-sors. First, the ASCENT 1000 is placed in a closed con-tainer with a speaker and a Center 325 Mini sound-level meter. The amplitude of the 1kHz signal broadcasted by the speaker is adjusted until the Center 325 Mini reads the desired dBA level. Then, the analog reading on the
Figure 4: Data Format and Relation Between Identify String (Top) and Measurement String (Bottom)

6
sound sensor is recorded for 20 samples. The outliers are ignored, and the average is calculated to be used as the reference value for that dBA range. This process is repeated at dBA levels of 48 and multiples of 5 for 50 through 110. The average analog readings for each dBA range are then hard coded into an array of values in the software. This array is used to calculate the actual dBA values in real-time, based on analog measurements from the sound sensor. The ASCENT 1000 is then tested again to confirm that the sound sensor values are within 2 dBA of the Center 325 Mini readings for values greater than 60d BA (5 dBA for values less than 60 dBA).
VAlIdATION
Once calibrated, several units were independently tested against laboratory standards over their operating range to verify accuracy, repeatability, and reliability. These tests were conducted at the Institute for Environ-mental Research at Kansas State University. Tests were conducted for all variables except sound. The validation of pressure and carbon dioxide (CO
2) measurements are
reviewed here.A small altitude chamber was constructed from PVC
plastic pipe fittings (see Figure 5). The chamber is con-nected to a vacuum pump through a water column vacuum regulator to provide a stable, precisely controlled vacuum. Conditions from ambient up to a cabin altitude of 10,000 ft can be simulated. The laboratory elevation is approximately 1000 ft, and ambient atmospheric pressure is measured with a precision barometer (see Figure 6) that is verified periodically against a precision mercury barometer.
Pressure inside the altitude chamber is measured with a 10-foot water manometer. Thus, all pressure
measurements are based on first principles or directly related to them in order to minimize the potential for errors in the reference pressure (altitude) used when testing a unit. An example of pressure test results is presented in Figures 7a and 7b. Overall, there is a slight, but acceptable, sensitivity shift. Repeatability is good. Each data point in Figure 7a averages at least 15 minutes of data. The pressure sensor has an inher-ent fluctuation a little greater than +1 kPa (Figure 7b), which is acceptable for this application.
Carbon dioxide measurements were validated using commercial, bottled calibration gasses that provide dry air with a known CO
2 concentration. Several different
concentrations were used to span the range from 500 ppm to 2000 ppm (the expected operating range of the sensor when used in an aircraft). The calibration gas was fed directly to the CO
2 sensing port on the unit at a
low flow rate so as to avoid pressurization of the sensor. Test were conducted at ambient pressure and at reduced pressure, using the altitude chamber described above. The altitude chamber was fitted with connections so that the calibration gas bottle was outside the chamber during tests. This allowed different calibration gasses to be fed to the unit while it is held at reduced pressure. An example of CO
2 test results is shown in Figure 8.
In this test, there was an offset of approximately 400 ppm. This offset was later corrected in other units using the zero-calibration described in the previous section. The accuracy (except for the offset) and re-peatability are reasonable for this type of measurement. The reduced pressure tests shown in this figure were conducted at an equivalent cabin altitude of 7000 to 8000 ft. There was no evidence of sensitivity to pres-sure over the range of 0 to 8000 ft cabin altitude for which the unit is intended.
Figure 5. Altitide Chamber With CO2 Calibration Gas
Figure 5: Altitude Chamber With CO2 Calibration Gas
Figure 6: Precision Barometer for Measuring Ambient Pressure

7
a. Results From 3 Pressure Tests
b. Sensor Fluctuation
Figure 7: Example of Data From Unit 16 Pressure Tests

8
dATA RESulTS ANd dISCuSSION
All of these design considerations contribute to a system with sufficient flexibility for meeting the various requirements of the aircraft environment. The ASCENT 1000 has been EMI/EMC-tested and approved (by Boeing Electromagnetic Effect Laboratory according to Boeing D6-16050-4, Rev D, Electromagnetic Interfer-ence Control Requirements). It is now being used to collect preliminary data on commercial flights. As of this writing, data have been collected from more than 70 flights in various aircraft models (e.g., CRJ 100, CRJ 200, CRJ 900, B737, B757, B767, A319, A320, MD80, MD88, MD90, EMB 145, EMB 170, and EMB 190) since mid-August 2007. Figures 10 through 13 show a sampling of the data collected from these flights from March 30 to April 6, 2009. Since these flights were of varying duration, the time axis has been normalized to permit comparison. The system is turned on near 10,000 ft (aircraft altitude) while ascending (when permission was given) and turned off on descent around 10,000 ft, as required during landing. In a few cases, we graphed only a portion of the six flights to ensure that the figures would be more readable.
The cabin pressure data measured from six commercial flights can be seen in Figure 9. Generally speaking, the cabin pressure drops on take-off, reaches a steady level at cruise altitude, then rises again as the aircraft descends for a landing. The conversion from cabin pressure to altitude can be computed using the equation:
E=-312.5P+31434.375 (2) The symbol E represents the elevation in ft and P is
the cabin pressure in kilopascals. Equation (2) gives an approximation for the elevation in an open-air environ-ment where the given cabin pressure would be measured.8
The data from the six flights show that the cabin altitude stays below 8000 ft, taking into account the sensor ac-curacy (±200 ft).
Figure 10 compares the cabin sound levels measured for six commercial flights. In this figure, the data were processed and graphed with a 6-point moving average. The measured sound level of the cabin was typically around 86 dBA (± 2 dBA). This is above the level at which permanent hearing damage can occur (>80 dBA) over long periods of time.9 However, this is below OSHA’s limit of 90 dBA for an 8-hour duration.10
Figure 11 shows the CO2 concentrations for nine dif-
ferent flights. The concentrations of carbon dioxide for these flights typically fell between 900 and 1700 ppm (on average ±79 ppm) with only occasional measurements registering higher values. The carbon dioxide concentra-tions never rose to the FAA regulation limit of 5000 ppm.
On most of the flights, the cabin temperature ranged from 68 to 77ºF (± 0.9 °F), see Figure 12. On a few flights, such as the flight from March 31, the temperature measured consistently on the higher end of the range (approximately 77ºF). The data recorded on April 6 showed low temperatures for the duration of the flight (ranging between 68 and 72ºC). Data would be needed from more flights to establish any correlations between
Figure 8: Example Data From Unit 16 CO2 Tests

9
75000
80000
85000
90000
95000
100000
105000
Time
Pres
sure
(Pa)
31-March 01-April 03-April06-April 27-March 30-March
a. Cabin Air Pressure. The sensor system records the cabin air pressure in Pascal units. Each line shows the cabin pressure at different stages of a flight (ground, ascent, cruising, descent,
and ground).
-1000
0
1000
2000
3000
4000
5000
6000
7000
8000
Time
Alti
tude
(fee
t)
31-March 01-April 03-April06-April 27-March 30-March
b. Equivalent Cabin Altitude. The altitude data were calculated from data in Figure 9a using Equation (1).
Figure 9: Cabin Air Pressure and Equivalent Cabin Altitude Data From Six Commercial Flights (Time Normalized)

10
Figure 10: Aircraft Cabin Sound Level Data From Six Commercial Flights. Six flights are presented (Time Normalized). The levels through all flights are below the limits set by National Institute on Deafness and Occupational Safety & Health Administration.
500
700
900
1100
1300
1500
1700
1900
Time
CO
2 (p
pm)
31-March 01-April 03-April06-April 27-March 30-March
Figure 11: Carbon Dioxide Data (Time Normalized)

11
temperature and other factors. One suspicion is that the temperature sensor may be sensitive to cabin pressure (even though the sensor manufacturer indicates that this should not be the case); this will be verifi ed when the system is chamber-tested.
For the most part, the humidity data (see Figure 13) demonstrated a trend of starting at around 35-
50% (± 1% RH) relative humidity at the beginning of the fl ight and dropping to around 10-25% (± 1% RH) as the fl ight progresses. On the fl ight that logged lower temperatures, the humidity did not drop down quite as far, but all fl ights showed a trend of reduced humidity levels.
Figure 12: Temperature Data (Time Normalized)
0
10
20
30
40
50
60
Time
Hum
idity
(%)
31-March 01-April 03-April06-April 27-March 30-March
Figure 13: Humidity Data (Time Normalized)

12
CONCluSIONS
We designed a portable sensing system (ASCENT 1000) that can be part of carry-on luggage to ensure that sensing tasks can be easily performed without heavy and troublesome equipment. Use of the system can take advantage of flights of convenience, thus adding no extra cost to the project. The sensing system can also be reconfigured for different sensing tasks when a new sen-sor has been identified, requiring only minor modifica-tion to the software (add necessary code to control and collect data from a sensor) and adding the sensor to the sensor board (add sensor power and control wires). The microcontroller’s memory is flash-based, and it can be reconfigured in a matter of minutes. ASCENT 1000 is also modular. Different sensor boards can be connected to the main printed-circuit board. The wireless feature, which can be installed and removed as necessary, also adds to the unit’s modularity.
Based on the data from the six domestic flights pre-sented in this paper, we provide the following observations:• Cabin altitude typically remains below the 8000 ft
specified in Federal Aviation Regulation 25.841• Carbon dioxide levels are normally below 1700 ppm,
which is less than the FAA limit of 5000 ppm• Cabin temperature and humidity are in the range of
68°F to 77°F, and 10% to 50%, respectively• Sound level averages 86 dBA: less than the 90 dBA
level allowed by OSHA
The limited amount of data collected at this point should be noted. The question still exists as to whether this is representative of normal cabin conditions. When all the sensors have been pressure chamber-tested to char-acterize the effect of pressure on the sensors, additional data will be collected as part of an ongoing project. The ultimate goal is to collect data on thousands of flights.
This small, portable sensor system was designed for use in recording conditions on flights of convenience. It cannot replace extensive systems, as described in ASHRAE research project 1262 Phase I.11 In Phase I, there were four flights in the study. Phase II is ongoing as of the writing of this manuscript with the number of flights in the double-digits. An arrangement has been made to take the sensor system described in this manuscript along in Phase II. With this cross-instrument correlation, we can verify the effectiveness of this portable system. This can provide us with a broader view of the normal aircraft conditions.
One other potential development for this project is that the system can potentially be an open source platform for other research in this field. As the system currently exists, once a new sensor has been identified, it can be soldered into the printed-circuit board. Minor coding will be required for interfacing the sensor to the system electronics for controlling and data collection.
In addition to the sensor system described in this pa-per, an Internet infrastructure has been built to manage the data. A database server has been prototyped so that data can be uploaded and graphed. If desired, the data can be converted to a format that can be graphed using standard graphing software.
REfERENCES
1. Federal Aviation Administration. “91.21 Portable Electronic Devices.” Federal Code of Regulations Title 14: Aeronautics and Space, Part 91 – General Operating and Flight Rules. September 19, 2007.
2. Boeing. “Electromagnetic Interference Control Re-quirements.” D6-16050-4, Rev D. July 24, 2002.
3. “The Airliner Cabin Environment and the Health of Passengers and Crew.” Washington, DC: National Academy Press, 2002.
4. J. Michael Muhm, Paul B. Rock, Dianne L. McMul-lin, et al. “Effect of Aircraft-Cabin Altitude on Passenger Discomfort.” The New England Journal of Medicine, 2007;357:18-27.
5. “PIC18F8722 Family Data Sheet.” Microchip Tech-nology Inc., April 2, 2009, www.microchip.com, 2004.
6. “3.3V/5V or Adjustable, Step-Up/Down DC-DC Converters.” Maxim Integrated Products, April 2009, www.maxim-ic.com, Rev. 0, July 1997.
7. Michael Owen. “Portable Wireless Multipurpose Sensor System for Environmental Monitoring.” Master’s Thesis, Electrical and Computer Engineer-ing Department, Boise, ID: Boise State University, December 2007.
8. “Atmospheric Pressure at Site Elevation.” Universal In-dustrial Gases, Inc., 2004. Retrieved September 23, 2007, from www.uigi.com/Atmos_pressure.html.