Modular Hydride Beds for Mobile Applications
48
SANDIA REPORT SAND97-8289 UC-406 Unlimited Release Printed September 1997 Modular Hydride Beds for Mobile Applications RECEIVED SEP 3 6 1443 OSTI M. E. Malinowski and K. D. Stewart Preparedby Sandia National Laboratories Albuquerque, New Mexico 871 85 and Livermore, California 94550
Transcript of Modular Hydride Beds for Mobile Applications

SANDIA REPORT SAND97-8289 UC-406 Unlimited Release Printed September 1997
Modular Hydride Beds for Mobile Applications
RECEIVED SEP 3 6 1443 O S T I
M. E. Malinowski and K. D. Stewart
Prepared by Sandia National Laboratories Albuquerque, New Mexico 871 85 and Livermore, California 94550

Issued by Sandia National Laboratories, operated for the United States Department of Energy by Sandia Corporation. NOTICE: This report was prepared as an account of work sponsored by a n agency of the United States Government. Neither the United States Govern- ment nor any agency thereof, nor any of their employees, nor any of their contractors, subcontractors, or their employees, makes any warranty) express or implied) or assumes any legal liability or responsibility for the accuracy, completeness, or usefulness of any information, apparatus, prod- uct, or process disclosed, or represents tha t its use would not infringe pri- vately owned rights. ]Reference herein to any specific commercial product, process, or service by trade name, trademark, manufacturer) or otherwise, does not necessarily constitute or imply its endorsement, recommendation, or favoring by the United States Government, any agency thereof, or any of their contractors or subcontractors. The views and opinions expressed herein do not necessarily state or reflect those of the United States Govern- ment) any agency thereof, or any of their contractors.
Printed in the United States of America. This report has been reproduced directly from the best available copy.
Available to DOE and DOE contractors from Office of Scientific and Technical Information P.O. Box 62 Oak Ridge, TN 37831
Prices available froin (615) 576-8401, FTS 626-8401
Available to the public from National Technical Information Service U.S. Department of Commerce 5285 Port Royal Rd Springfield, VA 22l61
NTIS price codes Printed copy: A03 Microfiche copy: A0 1


SAND974289 Unlimited Release
Printed August 1997
Distribution Category UC-406
Modular Hydride Beds For Mobile Applications
M. E. Malinowski and K. D. Stewart Sandia National Laboratories
Livermore, CA 94550
Abstract
Design, construction, initial testing and simple thermal modeling of modular, metal hydride beds (“modules”) have been completed. Originally designed for supplying hydrogen to a fuel cell on a mobile vehicle, the complete bed design consists of 8 modules and is intended for use on the Palm Desert Vehicle (PDV) under development at the Schatz Energy Center, Humbolt State University. Each module contains approximately 2 kg of a commercially available, low temperature, hydride-forming metal alloy. Waste heat from the fuel cell in the form of heated water is used to desorb hydrogen from the alloy for supplying feed hydrogen to the fuel cell. In order to help determine the performance of such a modular bed system, six modules were constructed and tested. The design and construction of the modules is described in detail. In laboratory testing, the modules meet or exceed all design criteria: Initial testing of the modules both individually and as a group showed that each module can store -30 g of hydrogen (at 165 PSIA fill pressure, 17 “C), could be filled with hydrogen in 6 minutes at a nominal, 75 standard literdmin (slm) fueling rate, and could supply hydrogen during desorption at rates of 25 slm, the maximum anticipated hydrogen fuel cell input requirement. Tests made of 5 modules as a group indicated that the behavior of the group run in parallel both in fueling and gas delivery could be directly predicted from the corresponding, single module characteristics by using an appropriate scalinz factor. Simple thermal modeling of a module as an array of cylindrical, hydride-filled tubes was performed. The predictions of the model are in good agreement with experimenatal data, and indicate that the following key thermal characteristics are consistent with observed module thermal behavior: (1) the hydride tubes in each module have a thermal response time - 41 s; (2) the hydride has a thermal conductivity -0.4 W/m-K; and (3) the temperatures in the core of the hydride tubes, T,,,, are related to the fueling rates, F, of the modules by T,,, (“C) -- T,,, + 1.45*F(slm), with Tw = the cooling water temperature.
3

Acknowledgments
We acknowledge the support of G. J. Thomas, and the help of both Steve Guthrie in collaborative, first module testing, and Abby Sieber in initial technical assistance. The continuing collaboration of the SERC team with us in applying the modular bed system to use on their PDV platform has been essential to the progress of this work. Advice from Frank Lynch of Hydrogen Components, Incorporated formed a critical ingredient of our modular bed design. Informative discussions with both Dr. Meinharld Aits,, GfE, and Dr. G. Sandrock, are also acknowledged.
4

cc g "C @m J kg K m
slm W
S
Abreviations/Symbols
cubic centimeters &rams degrees centigrade gallons/minute Joules kilogram Kelvin meters seconds standard literdminute Watts
a A B CH CW 6 E (or F j JL(4 k
L N P QH r P Ri S t T T W W
K
hydride tube radius (m) hydride tube surface area constant in steady state, parabolic temperature distribution (Urn2) hydride specific heat ( -0.47 J/g-K) water specific heat (- 4.184 J/g-K) hydride tube wall thickness average energy densitykime deposited into (or removed from) hydride tube during fueling gas supply) (J/m3-s = W/m3) hydride fueling rate (standard literslmin, slm) energy flux w/m2) Bessel function of first kind, order L hydride thermal conductivity (W/m-K, assumed to be 0.4 W/m-K) hydride thermal diffusivity (m2/s) hydride tube length (m) number of hydride tubes ( 9/module in current construction) power (W) heat of C 15 hydride formation, 34 kJ/ mole of H2 radial distance measured from center of hydride tube hydride density in bed, (g/m3) ith root (or zero) of the equation Jo(Ri) = 0 total surface area of all hydride tubes in a module, A*N, (m2) time (s) temperature ("C) module cooling water temperature ("C) water flow through module (gallondminute, gpm)
5

Intentionally Left Blank
6
1. Introduction
Fuel cells are emerging as attractive sources of power for electric vehicles because of their low emissions and quiet operation. Air (or oxygen) and hydrogen are the feed gases for these cells, and various types of hydrogen supplies such as high pressure hydrogen tanks, liquid hydrogen, hydrogen reformers, and metal hydrides have either been used or planned for use with fuel cells. Examples of vehicular systems include a 250 W phosphoric acid fuel cell supplied by a hydride bed and powering a golf cart (Shindo, 1993), 15 kW fuel cells used in different “green” vehicles and fueled with hydrogen from high pressure tanks (Nadal, 1996), and small scale, conceptual systems for railroad locomotives powered by fuel cell - hydride bed combinations (Hasegawa, 1995). Fuel cells for submarine use (Brighton, 1994) have been proposed . It is clear that fuel cell applications abound, and that the best choice for the hydrogen supply will depend critically on the exact configuration and requirements of the he1 cell system.
This current work describes the design, construction, and initial laboratory testing of a metal hydride bed system which was designed to supply hydrogen to a nominal 5 kW fuel cell made by the Schatz Energy Research Center (SERC), Humboldt State University, Arcata, CA and used in SERC’s Palm Desert Vehicle (PDV). Although the design and construction of the bed system was dictated by the performance and constructional requirements of the SERC fuel cell PDV, it is likely that the general design features used to make the present hydride bed could be incorporated in future bed systems serving other fuel cells. Primary goals in this work were to make a practical hydride system which satisfied all hydrogen supply requirements of the PDV fuel cell system, and could be built with existing hydride bed fabrication techniques and commercially available, metal hydride-forming alloys. It was the intent of this work to make a hydride bed system which would be prototype, working device, for use in the PDV. It is expected that working experience with this bed system both in the laboratory and, eventually, in a working vehicle, will lead to the development and manufacture of less expensive bed system with improved performance characteristics.
2. Design and Construction
The primary, SERC PDV requirements for a hydride bed used as a hydrogen supply are given in Table 1. These requirements were determined by combining the performance statistics of compressed hydrogen tanks currently used on the PDV with anticipated operational conditions using a hydride bed. Note that some of the requirements are rather arbitrary: For instance, the refueling time of I 10 minutes is long compared to a typical “tanking up” at a gasoline station (I 2 minutes), but was considered an acceptable time to refill the hydride bed. (Bed refueling times are only relevant to the refueling scenario where gas is put back into the beds at a drive-up refueling station. It may be that a complete bed changeoutlexchange in the end is the best means for “refueling.”). The environmental requirement, operating temperatures of -5 OC to - 65 “C, is one which has not been actually measured but, rather, is an estimate of the temperatures which the hydnde bed might experience.
7

Table 1. Hydride Bed Requirements for the SERC PDV
Requirement Amount
Hydrogen Supply Total hydrogen stored -160 grams Maximum delivery rate -25 slm Refuelinp time 5 10 minutes
Environmental Temperature Range -5 OC to - 65 “C Overall Size Bed Heating
Fit in space - 3” x 20” x 21’’
water, fuel cell waste heat (12.5 kW max.) “normal,” steady state operation startup batteries,l2 - 36 V, - 600- 1000 kJ max
2.1 Modular Bed Details
A “modular” hydride bed is one made up of several, smaller beds configured so that the overall hydrogen capacity is the sum of the: smaller (modular) individual bed capacities. Hydrogen Components, Inc. (HCI), Littleton, CO, has experience in construction of similar beds (HCIFrank Lynch, 1993), and it has also developed effective techniques to control unwanted hydride swelling. Therefore, we decided to design a modular bed based on HCI’s proven bed construction techniques and to have HCI build the modular beds based on our design requirements.
A modular, prototype system was chosen primarily because it should best utilize the small amounts of waste heat available from the fuel cell (discussed below), would fit in the space available, could be mounted in the PDV so that the bed modules would be readily accessible, and, if necessary, could be reconfigured to be used in different hydrogen-delivery gas manifolds. However, a modular design is most likely not optimized from a capacity standpoint, and would also involve more gas and water coimections than a single, larger bed with the same amount of hydride alloy.
A drawing of one of the proposed modular beds is shown in Figure 1, and a photograph of a finished module is shown in Figure 2. The entire bed assembly would consist of 8 such beds, and one possible, planar arrangement of these beds in the PDV space is shown in Figure 3 (The gas plumbing for the beds is not shown in this Figure). The space available for the entire bed assembly is located underneath the fuel cell and above the belly pan of the PDV, and is basically a volume - 20” x 21” x 3” in size:. Other components necessary for interfacing the metal hydride bed system to the fuel cell water coolingheating system, such as heat exchanger, water pump, etc., would fit in other available space in the PDV.

Even though each of the eight modules looks the same as the others, there are actually two types of modules with different hydride-forming alloys:
0 “Main Module.” This is the primary bed module and there would be 7 such modules in the bed. Each main module contains approximately 1900 g of Hydralloy C15 (Aits, 1995), a commercially available (made by G E in Nuremberg, FRG) hydride-forming alloy with the following composition (numbers in moVo): Mn, 48.13; Ti, 24.6; V,13.85; Zr, 8.27; Fe,3.37; and Ni, 1.77 (Pechloff, 1996). C15 was chosen because, when hydrided, it had hydrogen overpressures which were in the proper range, - 1 - 15 bar. The module consists of 9, hydride- containing tubes approximately 0.69” in diameter. The C15 is loaded in the tubes to a packing density of -3 g/cc; the loading of the material is done such that the 15” length of each tube is physically partitioned into separate zones, each of which is approximately 0.75” long (this technique is called the “bar stool” arrangement by HCI). In addition, a fritted gas tube runs the entire length of each of the hydride tubes. The hydrogen outputs of the tubes are connected in parallel internally in the bed in a plenum (see Figure 1 , “Side View”). Connections to the plenum consist of a single, manual valve, for external gas delivery, and a pressure relief valve, set at a nominal 250 PSIG. All the hydride tubes are encased in a water-cooled, stainless steel jacket. Lexan rods, with either square or triangular cross sections and running the length of the module, are inserted between the hydride tubes in order to reduce the cross-sectional water flow area , a strategy employed to increase the water flow velocity in the module and to promote turbulent flow for improved heat transfer inside the module. Materials with lower heat capacities than Lexan could be used but were not tried in these first module beds. On the ends of the jacket are welded brackets which will be used to attach each module to the angle-iron frame of the PDV.
“Cold Start Module.” There is one such module, and it will contain an alloy which is less stable (higher hydrogen pressure at the same temperature) than C 15. The main purpose of this module was to provide higher output pressure than the C 15 during “cold start” ( temperatures below -20 “C) starting conditions. The alloy used in the system which was made is Ergenics Hy-Stor 208 (Huston, 1980).
Six modules were built by HCI and their specifications are given in Table 2. Note that the first five modules (1.1-1 through 1.1-4 and 3.1-1) contain C15, while the sixth module has Hy-Stor 208. As shown in Table 2, each module weighs about 4 kilograms, of which -45-50% is hydride alloy weight. Also given in the last column are the predicted weights of hydrogen stored in the alloys for 1.5 weight per cent (w/o) loading and the overall, effective w/o of hydrogen storage in the module. This last number underscores the necessity of considering an often-neglected component in hydride systems - the container. The wlo figures quoted for many alloy systems must always be put into practical perspectives by including container weights. As indicated above, it was not the intent of the current study to achieve optimum w/o figures with the modular system.
9

Table 2. Module Specifications
Weights (g)
S.S. Lexan w/o water H , 1.5 parts rods alloy wlo
192 46.42 92.00 29.05 192 44.89 92.00 27.3:
4060 2239 192 44.86 92.00 27.3; 192 44.87 92.00 27.3:
41 14 2292 192 44.30 92.00 27.3L
192 49.57 92.00 32.8: T 2228
248961 1142j 134761 I I 1 171.:
41491 190:31 2246) 192.00) 45.82) 92.00) 28.5f
Overall H wlo
(1.5 wlo in alloy)
0.70 0.67 0.67 0.67 0.66
0.74
0.69
2.2 Available Energy and System Design
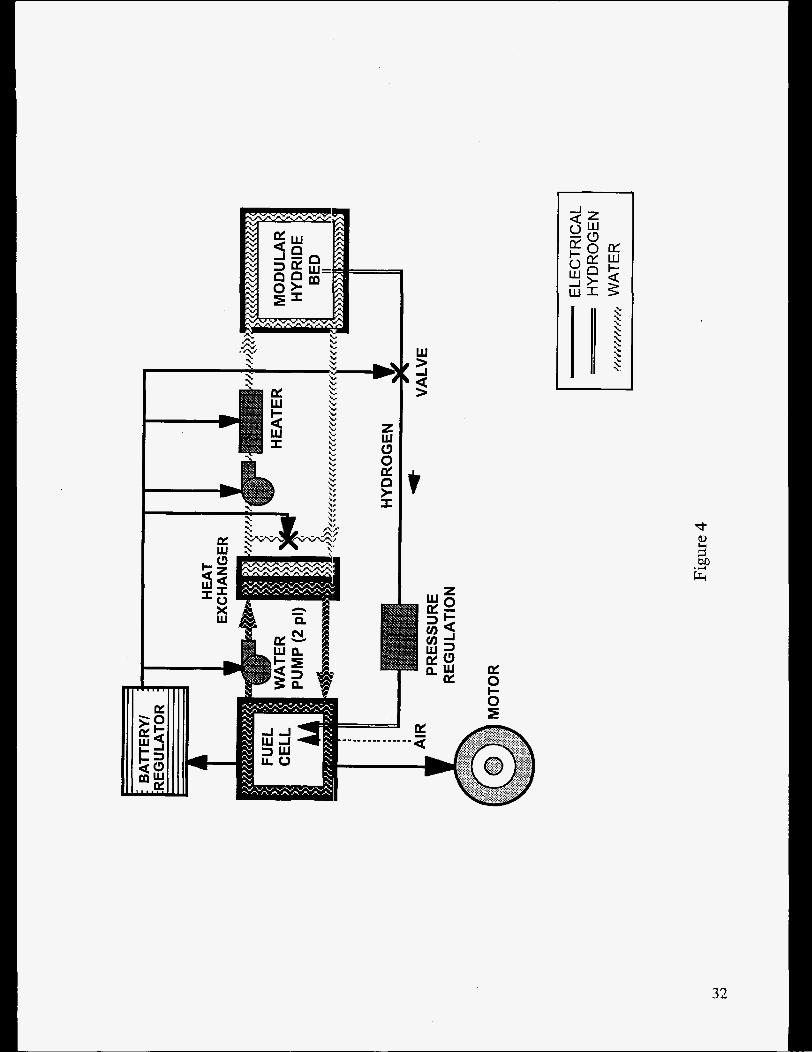
A simplified, block diagram of the assumed functional relationship of the modular bed with the fuel cell is shown in Figure 4. There are two water loops in this system: one water loop cools the fuel cell; the second loop heats the modular hydride bed. Energy is transferred from the first water circuit to a second by a heat exchanger. An onboard battery/ regulator system provides power to run such items as the water pumps, valves, and electrical heater. This heater is located in the bed water circuit and is used to heat the water when reject heat from the fuel cell is insufficient to heat the hydride bed., a situation which would occur most often during “cold start” conditions, those times when the fuel cell is first used and the ambient bed temperature is not high enough to satisfy energy demimds for hydrogen desorption.
There are two basic modes of opertation for the fuel cellkydride bed system: “steady state,” and “startup,” or transient operation . During steady state operation, all system components are at the nominal operating temperature, and the only energy required for hydride bed operation is the amount necessary to supply the hegat of desorption of hydrogen from the metal hydride alloy: Since the maximum anticipated use of hydrogen by the fuel cell is about 25 slm (-0.0186 moles hydrogeds), and the heat of desorption of hydrogen in C15 is about 34 kJ/mole hydrogen (Pechoff, 1996), during steady state desorption of hydrogen from the hydride, a heat input of -0.01 86.34 -0.6 kW, is required.
10

In principle, the reject heat from the fuel cell should be more than this 0.6 kW, since the fuel cell used in the PDV has a maximum power rating of - 5 kW and is - 50% efficient. Thus, 5 2.5 kW could be reject heat and available for transfer to the hydride bed heating loop. Although the exact amount of available heat depends on the load on the fuel cell and can vary, there should be enough waste heat generated by the fuel cell for maintaining desorption of hydrogen from the hydride. It is also important to recognize that high hydrogen demand is coupled with high load on the fuel cell. The high load produces more available heat, but the availability of this heat will lag the demand by times determined by the thermal transfer characteristics of the water heating/cooling system.
These steady state estimates, however, do not take into consideration the amount of energy necessary to heat the hydride bed to operating temperatures, a situation which would occur during “cold start” conditions. In this case, when insufficient reject (“useful”) heat is available from the operating fuel cell, an electric immersion heater powered by onboard batteries would be used to heat the water in the bed water loop. Estimates of the maximum amount of energy available from the 3 x 12V = 36 V onboard batteries range from about 36 V x 5-8 amp-hours (P. Berger and R. Chamberlain, 1996).
In order to maximize the effectiveness of these small amounts of energy available in the PDV, energy should not be used to heat components which do not directly contribute to the production of necessary hydrogen fuel. This suggests that the bed system heat capacity should be lowered, if possible. One way of doing this is to divide the bed into smaller beds, or modules, and to heat one bed module at a time, as needed, for hydrogen supply. Heating one bed module at a time also decreases the time required to reach operating temperatures, an important consideration in cold start situations. Even though a modular system has more complex plumbing and control than a single, monolithic bed, the potential improvement in response times and energy economy would seem to more than justify the added system complexity . In this current work, it was therefore decided to design and build a bed system based on this modular concept.
An estimate of the bed heating required in transient or start up conditions can be made if the heat capacities of the main components of the bed module system are known. Estimates of these heat capacities are given in Table 3 below. Using these values, the total heat capacity per module is approximately 3 LJK. To compute the amount of energy to heat up a bed to temperature, however, the total amount of water and other equipment in the module water loop also must be considered: For instance, this must include at least the heat capacity of the water, water pump, and heater. If there were - 2 liters of water in this loop (not an exceptionally large amount), the heat capacity of the water would be about 4 kJK, slightly larger than that of a single module. The water pump, heater and other plumbing connections could easily add to this value to increase the heat capacity of the loop system external to a single module to -6 kJ / K, about twice that of a single module. Using these estimates, therefore, the total heat capacity of a single module system would be - 10 kJ / K, while that for an 8 module system would be -30 kJ / K.
11

Table 3. Heat Capacities of A Typical Bed Module with 1.5 w/o Hydrogen
MODULE PART SPECIFIC HEAT HEAT Yo OF TOTAL 1 (J/g-K) CAPACITY(JIK)
hydrogen 14.226 406.15 13.9 stainless steel 0.460 945.29 32.4
C15 0.470 894.64 30.6 water 4.184 384.93 13.2
Lesan rods 1.5 288.00 9.9
1 TOTALS I I 2919.01 I 100.00 I
Thus, based on these estimates, a single module system would require no more than 1/3 the power than a full module system to have a given time-temperature heating cycle, and that - 200 kJ would be required to raise the temperature of a single module system 20 "C. If a 1 kW heater in the fuel cell loop were present, it would take - 3.5 minutes to heat up the system, If , on the other hand, all eight modules were: heated, - GOO kJ (the approximate maximum energy available from onboard batteries) energy and - 10 minutes heating time would be necessary. These considerations illustrate the advantage of minimizing the heat capacity of the bed system, and form the rational basis for adopting a modular bed design for the PDV. These estimates also underscore the fact that the actual performance of the bed heating system will depend on the exact system details and amount of heat capacity in the fuel cell-hydride bed water loops.
3. Module Testing
The performance characteristics of the six modules were determined using the Hydride Bed Testing Laboratory (HBTL) located at SandiaLivermore. Initially one module alone ( Module 1.1-1, Table 2) was tested. That module was then sent to SERC for collaborative testing on one of their test stands. In parallel with that activity, the remaining 5 modules were put on the HBTL and tested both individually and as a group. The results discussed in this section were taken from this group of 5 modules; the first module (1.1-1) had characteristics essentially identical to the other CIS-containing modules except that it contained more C15 alloy ( - 1940 g vs. 1820 g ), the result of having smaller diameter gas delivery tubes in the hydride tubes.
12

3.1 The Test System
A simplified schematic of the HBTL module test system is shown in Figure 5. This figure shows the arrangement for one module; when 5 modules were tested the hydrogen outputs from the modules were connected in parallel and the input and output water lines could likewise be connected to in parallel. A water bath heater/circulator, with approximately 11 liters water inventory, was used to heat or cool the bed module by circulating water through the module water jacket; water flows up to approximately 1.2 gallons per minute (gpm ) could be achieved in one module when using the circulator. The input and output water temperatures were measured with sheathed chromel-alumel thermocouples directly in the water flow. Water temperatures from 11 "C to 70 "C could be routinely produced using the current bath/circulator configuration.
When testing a module, the main module valve, labeled V1 in Figure 5, was opened. To hydride, or fuel, a bed, 99.995% pure hydrogen from external tanks was supplied to a pressure regulator. In most tests discussed in the current work, the output pressure of the regulator was set to -165 PSIA. The fueling of the module was performed by opening valve V2 and controlling the hydrogen flow, Fill , into the module by manually adjusting valve V2. The hydrogen mass flowmeter (MFM) had a range of 0 - 400 standard liters/ minute (400 slm). During this process, the hydrogen mass flow controller (MFC) shown in the figure was kept closed. The bed pressure was measured by a strain gage pressure transducer, PoLlt , while the supply pressure to valve V2 was measured by a similar transducer, Pi, . All data from the pressure gauges, thermocouples, flowmeter and hydrogen mass flow controller were recorded and display using a computer-based acquisition system.
During gas delivery from the bed, valve V2 would be closed, the bed heated and the hydrogen vented through a mass flow controller, which has a range of 0 - 50 slm. In many desorption/ hydrogen delivery data runs, the mass flow controller would be set to a constant value; when the bed started running out of hydrogen, the bed temperature would be increased to a maximum of 70 "C to desorb all hydrogen.
Since the bed fueling was determined with the 400 slm W M , while the gas delivery measured with the MFC, there was typically a discrepancy of - 2% in integrated amounts between absorption and desorption of a module. This is much less than the manufacturer's quoted +_ 1% of full scale accuracy (k 4.4 slm total) of the MFM/MFC combination.
3.2 Results: Single Module
PCT Data
Figure 6a shows the predicted mid-plateau hydrogen pressures for both the C15 and Hy-Stor 208 alloys. These data, which were derived from PCT taken on C 15 and from literature parameters for a material similar in composition to Hy-Stor 208 (Huston, 1980), show that Hy-Stor does

have a higher overpressure than the C 15, the primary basis for choosing Hy-Stor 208 as the “cold start” bed material. As a check on the actual behavior of each different alloys, 15 “C isotherms were measured in two different modules (1.1-4 for the C 15,2.1- 1 for the Hy-Stor 208). The data are shown in Figure 6b as a function of the total amounts of hydrogen stored in the two different modules; absorption and desorption isotherms are indicated by the different arrows on the graph.
The experimental results shown in .Figure 6b indicate the following:
hydrogen. In addition, the Hy-Stor has less hysteresis and flatter plateau pressures than the C15.
C15 module corresponds to - 1.8 PJ/O storage, while the -27 g stored in the Hy-Stor 208 module corresponds to -1.1 w/o storage. Note that these total amounts stored in the modules are higher than the amounts reversibly available: in the case of C15, the amount reversibly available in the current experimental setup is - 30 g, which corresponds to - 1.64 w/o, while in the Hy-Stor, the reversibly available amount is - 25 g. The “reversibly available amounts” are defined as those amounts of hydrogen which can be desorbed from the alloys by heating the alloys to -70 OC and venting the hydrogen at -1 bar, coniditions which are relevant to PDV operation and used in the HBTL testing of the modules.
1. The Hy-Stor 208 has a higher overpressure than the C15 at any given amount of stored
2. In a given module, the C 15 has a higher capacity. The -34 g stored hydrogen in the
These data indicate that the Hy-Stor module will have a higher overpressure, but lower capacity than the C 15 modules. These characteristics will be important when discussing hydrogen delivery characteristics below.
Module Fueling
Figure 7a gives the fueling results fix a C 15 module, Figure 7b, for the Hy-Stor 208 module. In each graph, the mass of hydrogen absorbed by the module is shown as a function of time for different, nominal fueling rates. All the data presented were acquired with water flows of 0.6 gallons/minute (gpm) through the miodules. Data were also acquired with module cooling of 1.2 gpm and were essentially identical to the data shown in the figures for the lower water flow of 0.6 gpm.
The fueling rates indicated on the graphs were maintained as long as possible and correspond to the linear fueling response shown in these figures. Beyond a certain time in fueling a module, the difference between the supply pressure, which was -1 65 PSIA, and the module overpressure became too low to support the original flow. At this point, the fueling rate decreases and results in the deviation from linearity observed in all curves. This deviation is probably directly related to the heating of the modules (and, hence, increase in the effective equilibrium overpressure) caused by the absorption of hydrogen by the alloys. Modeling of this heating is described in Section 4. below. The amounts of h:ydrogen fueled and shown in these figures are reversibly available from the modules by heating the modules to temperatures 2 60 OC.
14

Note that in both types of modules, (1) the fueling characteristics of both modules are very similar; (2) the times required to fuel the module to 95% of capacity decreased with increased fueling rates; (3) the modules could be fueled to 95% in less than 10 minutes, one of the design requirements ( a minimum fueling time of - 5-6 minutes is observed for the C 15 module); (4) the storage capacity of a C15 module is -30 g at 17 OC; and (5) fueling at rates in excess of - 50-75 slm did not result in significantly reduced times to achieve 95% fueling.
Module Gas Delivery
Figures 8a and 8b show the results of a series of gas delivery experiments with a C15 module and a Hy-Stor 208 module. Figure 8a shows gas delivery from fully loaded modules ( - 34 g in the C15,27 g in the Hy-Stor 208), while Figure 8b shows delivery from modules that were intentionally filled to approximately 50 % capacity. In both figures, the initial temperature of the modules was approximately 11 OC, the lowest temperature achievable in the existing experimental test stand. This starting temperature approximates a “cold start” condition for the modules. In all the results graphed, at the time corresponding to t= 0 minutes, the modules were heated at nominally the same rate. Simultaneously with the start of heating, gas was withdrawn from the modules at rates determined by the mass flow controller (MFC - see Figure 5). In each separate figure, the delivery rate -time profile for the C15 and Hy-Stor modules were the same: For instance, in Figure 8a, for the first 3 minutes 10 slm were delivered, after which, 25 slm, the maximum required delivery rate, was delivered as long as each module could supply the gas. A similar delivery-time schedule was followed in the data of Figure 8b. In both figures, the module pressures and inlet water temperatures are also plotted.
As both Figures show, the modules are capable of supplying hydrogen at 25 slm, one of the design requirements. Figure 8a shows that this rate can be sustained for about 12 minutes with a C15 module, and for about 9 minutes with a Hy-Stor 208 module and directly demonstrates the higher capacity of the C 15 module. When, however, the modules are half loaded, the Hy-Stor can supply hydrogen at the maximum rate for about twice the length of time than that with the C15 module. This is because of the higher overpressure in the Hy-Stor 208.
Thus, the initial module hydrogen gas content and temporal variations of both the module temperature and the gas delivery demand all influence the observed performance of the modules. The data present in Figures 8a and 8b suggest that, for fully loaded modules, there may be no advantage to a “cold start” bed, while in partially loaded modules, the cold start bed would be able to supply gas at higher rates for longer lengths of time than with the C15 modules. Heating the modules more quickly, which could occur in systems with water heating loops with lower volumes than the 10 liters of the current work, could also improve the performance of both modules. These results further demonstrate that there is more to employing a cold start bed than might be expected on plateau overpressure considerations (Figures 6a, 6b) alone, and they suggest that minimizing water loop inventories to improve module thermal response will be an important ingredient in vehicular applications of this modular system.
15
3.3 Results: Multiple Modules
Fueling and delivery tests were ruri with two, different module groupings: 3 of the C15 modules as a group and all five modules - 4 C15 and 1 Hy-Stor 208- as a second group. In both cases, the two different groupings were fueled in parallel and the gas delivered from the groups in parallel. This arrangement is equivalent to running the modules as one bed, and one would expect that the fueling and delivery of such an arrangement would be directly predicted from the corresponding characteristics of a single module.
Figure 9a shows the fueling characteristics of the first group (3 - C15 modules). The fueling rate for this group was 150 slm. For comparison, the fueling - time behavior of a single C 15 bed fueled at 50 slm ( see Figure 7a, 501 slm curve) is multiplied X3 and plotted on the same graph. As the data indicate, parallel fueling behavior of a group can be directly scale from the characteristics of a single module. A similar result was obtained when fueling the five module group.
The delivery from the second group (4 - C15 modules, 1 - Hy-Stor 208 module) is shown in Figure 9b. As indicated, the maximum delivery rate of 25 slm can be sustained for about an hour, which is about a factor of 5 greater than the delivery time at maximum rate observed in a single module (Figure Sa). Note, in addition, that a steady state temperature of only about 40 O C is necessary to maintain this rate and that the total amount of gas available from this six module system is about 145 g, which is the sum of the total amounts available from four C15 (4 x 30 =120 g ) and one Hy-Stor 208 (25 g) modules. These results show that when a 6 module bed system is used and fueled at 17 "C, a total of 175 g would be available from the complete system. This exceeds the capacity requirement of 160 g., even though only 6, and not 8 beds as originally planned, are used.
4. Thermal Modeling
4.1 Introduction
Figure 5 showed the schematic of the diagnostics on a typical module. As indicated, the measured quantities in the current experiments include the input and output water temperatures (Ti, and Tout, respectively), the water flow, W, the fueling rate, F, of the hydride bed, and the bed pressures, P. Internal bed temperatures were not measured, since the beds were not intended as experimental devices and they were: built without internal diagnostics.
Although it was not the intent of the current work to perform detailed thermal measurements on hydride beds as has been done previously (e.g., Suda, 1980, 1983a, 1983b), it is instructive to determine the amount of informatioin which can be derived through a combination of existing, experimental module diagnostics combined with a simple model regarding the heat flow in the hydride bed modules. A complete thermal analysis of the modules requires a three-dimensional, finite element analysis, a treatment which is planned for the future but which is beyond the scope
16

of the current work. The results obtained from such an analysis combined with experimental data obtained from working modular beds will further the design of future hydride beds. Note that the modeling done below concerns only the fueling of a module, a situation where heat is added to the system.
4.2 The model and assumptions
As described in the section above on the construction of the modular bed, each bed consists of 9, cylindrical, hydride-containing tubes, all surrounded by a water jacket and all having a common hydrogen gas input/output connection. It is important to explicitly define assumptions made in the modeling in order to improve on the model in future calculations. In the calculations done below, the following assumptions were made:
The internal construction of the hydride tubes is ignored. That is, the presence of the fritted gas tube and the compartment-forming “ b a r ~ t o ~ l ~ ” are ignored, and each tube is considered to consist of hydride packed to a constant density (Q) throughout each cylindrical hydride tube.
Only the innerportion of the module is modeled. The outer portions of the module - the 2” nominal square jacket, Lexan rods, ends caps are ignored. In fact, these components are kept at essentially isothermal conditions because of water cooling, and the temperature increases of the hydride tubes (and inner components) above the average water temperatuer are much higher (by an estimated >10 X) than cooling water temperature changes.
End effects are neglected. All heat flow in the tubes is assumed to be radial. This is a reasonable assumption, since the length to radius ratio of the tubes is high (-15”/(0.69/2)” - 44).
0 The hydride is uniformly hydrided or dehydrided. This is equivalent to assuming that during fueling (or during dehydriding) the energy supplied (or removed) to (from) the interior of the tubes is uniform. It may be physically more reasonable to assume that there is some radial dependence to this heat generation and that the fuelingldehydriding rates are related somehow by a reaction coefficient to the local overpressure at individual points in the bed: For instance, If the hydriding rate of the bed module alloy were dependent on the difference between the hydriding pressure and the equilibrium overpressure, then the rates will depend on the “local” module bed equilibrium pressure. Since this overpressure varies with temperature, and the since the temperature in a bed module will vary, primarily in a radial direction, the hydridingldehydriding rates in the bed will vary with position. Thus, for instance, conditions could be reached in a bed where hotter regions are desorbing hydrogen, while cooler regions are absorbing hydrogen. However, this degree of sophistication was not felt to be warranted in the current work considering the simple and relatively few bed diagnostics present.
either to the air surrounding the modules or to water or gas module plumbing.
water temperature of each module is not the same as the bed temperature at any given time because of the finite bed thermal conductivity. In all the measurements with the modules, the time interval between data points was 2 s and the temperature resolution was 0.125 OC. Note that the finite water velocity in the bed should not limit measurement of measured temperature
No heat is lostfrom the system All heat transfer is adiabatic and no heat is conducted
The transit time of water through the modules is neglected. As will be shown below, the
17

transients: Since the volume of cooling water in a module has been measured as - 92 cc, at a bed water flow of 0.6 gpm (-2.3 l/minute), the transit time of the water in the bed is -2.5 s, approximately equal to the acquisition time interval. If thermal effects in the bed module were occurring over time scales of approximately this amount, one might expect that flow effects would have to be considered in the formalism. Data described below indicate that the thermal time constants are at least a factor of 10 greater than this water transit time, so one would expect that this neglect of water flow effects would lead to a error in time constants of no more than - lo%, not a significant amount considering the simplicity of the model and the few system diagnostics.
thermal boundary resistances at the hydride -hydride cylinder and hydride cylinder-water interfaces are small compared to the thermal impedance of the hydride bed itself.
This is the most simplifying of all assumptions and is the least physical, since, if the temperature in the hydride in a tube at r=a (tube radius) is the same as the water temperature (see discussion below), then the hydride temperature near the water output in the module should be at about the same temperature as the water at the output. Output temperatures of -10 OC higher than input water temperatures have been observed at the higher fueling rates. However, this temperature increase is less than -10% of the hydride temperature increase, and the assumption is consistent with the degree of sophistication of the current calculation.
AZZphysicaZproperties are constant. All quantities, such as thermal conductivities, heat capacities, densities, do not change with temperature or pressure.
No energy is added to, or removed from, the bed module byflowing hydrogen gas. All energy exchanges occur between the bed and the water cooling loop by thermal conduction.
Nu energy is Zost through radiation. Since the maximum bed temperature is <70 "C during operation, this is a reasonable assumption.
There are no thermal boundary impedances. This is equivalent to assuming that the
The hydride temperature is independent of z, the distance along the module tube axis.
It is useful to examine the assumption listed above dealing with low thermal boundary resistances. Figure 10 is a sketch which qualitatively depicts the radial dependence of the temperature in this boundary region in steady state; note that the sketch is not to scale
If the tube wall is of thickness 6, the temperature drop across the tube, ATtubc, is given by
1. P A T u b e = - S '
ktuhe 2 where P = q.S = the power .transported through the tubes into the water.
( Note that All symbols are defined on the page of this report prior to Section 1 .)
The hydride tubes are made of stainless steel and are about 0.5 mm thick. Based on published data, ktubc = kshjnlcss steel = 40 W/ m-K:. Nine tubes have a surface area of - 1.88 x lo3 cm2 ~
18
During fueling at a rate of 75 slm( one of the higher fueling rates tested in the modules), the total power deposited into the water is about 1.89 x lo3 W, or an energy flux of - 1 W/ cm2 . With these inputs, we find ATtubc= 0.13 OC, a small temperature difference compared to the temperature changes which we will predict from the center to the outside of the hydride material inside the tube. Note that if the tube were made of copper, with a thermal conductivity approximately 10 x higher than that of stainless steel, the temperature drop would be 10 x less. In either case, if the outside of the tube is completely immersed in water and there are no large thermal boundary impedances inside or outside of the tube, then it doesn't matter if the tube is made of stainless or copper- the temperature drop across the tube should be small. We will later see that, at 75 slm fueling, the predicted core temperature inside the hydride is greater than 100 "C higher than the outside, about lo3 greater than the drop across the tube. Thus, in all calculations below, the boundary condition on the cylindrical tubes is that temperature at r=a (tube radius) in the hydride is equal to the water temperature. We further assume that the input water temperature is constant. In practice, the input water temperature increased by about 1°C during fueling at 75 slm; this temperature change is also small compared to the temperature change across the tube.
The problem of the heat flow in a single, hydride tube then reduces to the well-know one of heat flow described by Poisson's equation with a source term:
In cylindrical coordinates, if the only variation of T is in the radial direction, and E is independent of r, (1) becomes
1 d a ( r , t ) 1 aT(r t ) E( t ) r dr dr K d t k 2a. -. - ( r . )--.A=-- or,
d2T(r,t) 1 a ( r , t ) 1 &(r t ) E(t) + _.---. -=-- at2 r dr K & k
2b.
The solutions to this equation for selected boundary conditions and for certain cases of when E(t) z0 have been determined (Carslaw and Jaeger, 1995). In the sections below, the applications of these solution results to experimental, hydride module results are discussed.
4.3 Steady state fueling
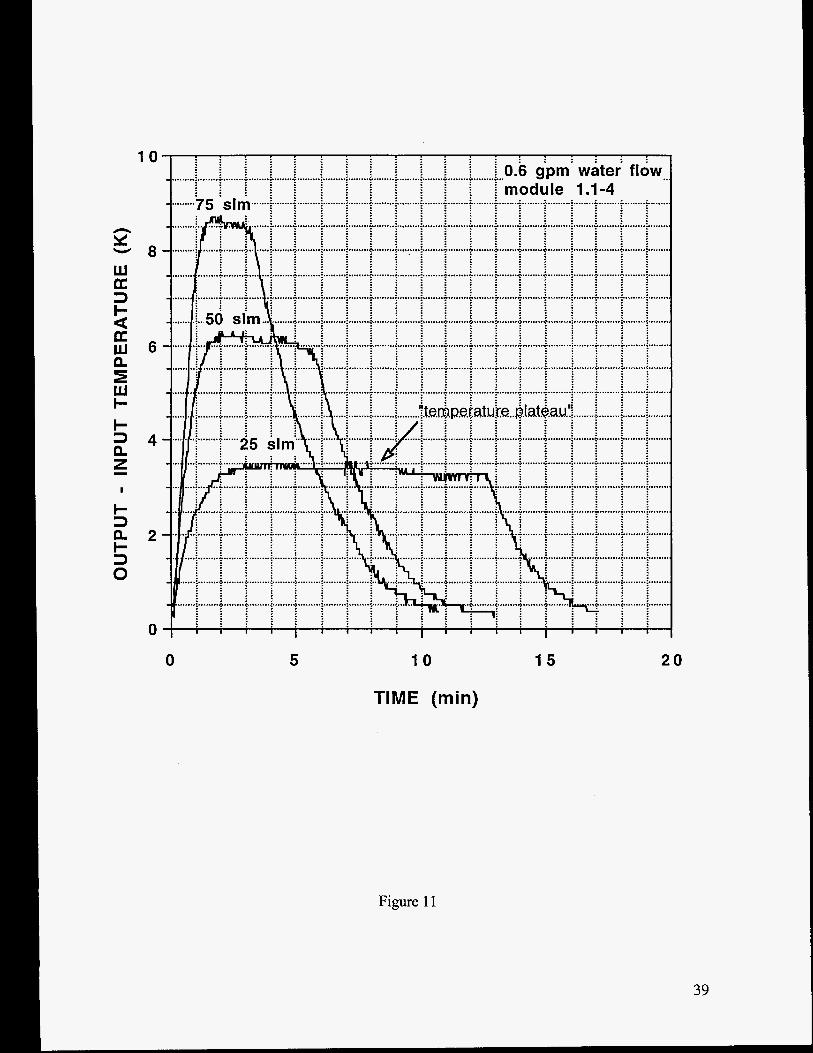
Experimentally measured temperature ch nges in the output b ter lines are shown in Figure 11, data taken at 0.6 gpm water flow in a C15-containing module. Data taken with 1.2 gpm water flows were similar, except that the peak output water temperatures were lower than in the 0.6 gpm case. In all cases, the fueling rate was kept constant as long as the input pressure
19

supply could maintain the necessary pressure for supply. After some time in each fueling case, this rate started dropping off, and these times corresponded to the drop in temperatures observed. In every case tested, there was a temperature plateau, a time during the fueling when steady state conditions were achieved: as is evident from the data shown in figure 11, the temporal extent of these “flattops” decreased with increased fueling rates.
During these steady state conditions, there is an energy balance between the energy input into the hydride due to hydriding and the einergy removed by the input water. This condition can be expressed by the following equation:
where d = a conversion factor between experimental, engineering units (slm, gpm, etc.) and tabulated data (e.g., kcal/mole hydride formation energy, etc.).
Figure 12 shows the predicted temperature differences (lines) together with the experimentally measured differences (data symbols) in the steady state region for three different fueling rates and two different water flows; there are: no adjustable parameters in the lines. Considering the assumptions made, agreement between predicted and measured results is good, especially in the case of the higher water flow (1.2 gpm). There is, however a deviation of -0.5 OC from predicted values in the lower water flow rate data. The reason for this difference is not known at this time, but these results demonstrate that there is remarkably good agreement between predicted and observed temperature differences.
During steady state fueling, with E-a constant in 2b above, the following temperature profile in the hydride tubes is predicted:
T(r ) = T , , for r>a, where
, and a* T, = E . - 4 . k
Given a heling rate F and the current module construction, the power density deposited into the hydride can be related to the fueling; rate as follows:
5. E[WIrn3] = 3.475~10~ -F[sZm]
The temperature distribution is thus, parabolic, with a maximum temperature on the central axis of the hydride tubes. In order to evaluate the peak temperature, it is necessary to use a value of
20
the bed thermal conductivity. In the calculations below, it is assumed that this conductivity kH = 0.4 W/m-K . This is an approximate bed thermal conductivity (Suda 1980, 1983b) and, as shown in a section below, is consistent with the module transient, temperature response data. Combining equations (4) and (5) yields the following relation between the peak, on axis temperature and the fueling rate:
5a. T',["C] = Tw["C]+1.45.F[sZm]
Thus, during fueling , the core temperature in the hydride tubes can be significantly higher than the cooling water temperature, a direct result of the low hydride thermal conductivity. For instance, during fueling at 75 slm), the core temperature is predicted to be - 110 "C above the water temperature. As a comparison, the rise observed in the output water temperatures at 75 slm (see Figure 12) were less than 9 "C at a water flow rate of 0.6 gpm. This shows that the water temperature is an indirect indicator of the bed temperature.
For a parabolic temperature distribution in a cylindrical geometry with maximum axial temperature T, and temperature equal to 0 "C at r=a, straightforward integration of the temperature distribution yields an average temperature of TJ2. The following experiment was performed as a rough check on this result, with the data shown in Figure 13: A module was fueled at rate of 25 slm; according to equation 5a. above, T, should be - 36 "C above the water temperature. Before the bed was completely fueled, the fueling was stopped. When this occurred, the overpressure dropped from approximately 165 PSIA to 80 PSIA. The bed temperatures and pressures were allowed to equilibrate. Then, the temperature of the bed was raised in steps, as indicated in the figure, until a temperature was reached where the pressure over the module was equal to that when the fueling was stopped, 165 PSIA. One would expect that the average temperature in the bed during fueling just prior to fueling cessation would be equal to the total rise in step temperatures. Indeed, the total increase in step temperatures was found to be between 18 "C to 19 "C, approximately 1/2 of the predicted, initial 36 "C. These results show that the concept of a parabolic temperature distribution is consistent with experimental observations. However, only direct measurements of bed temperatures can determine if this agreement confirms a parabolic temperature distribution. Logarithmic variations of temperature with distance, for instance, are predicted and have been observed in hydride beds with cylindrical, annular geometries (Suda, 1983a, 1983b).
The dependence of T,n on the radius ( a2) of the cylinder indicates that making the hydride tubes significantly larger than currently used would lead to much higher temperatures in the hydride interior. Reducing the tube diameters, on the other hand, should result in faster hydriding because of significantly reduced core temperatures. However, there is a practical limit on reducing tube diameters which is related to the number of tubes required and the accompanying increase in plumbing complexity which could result from a larger array of smaller, hydride tubes. Geometries other than tubes (e.g., planar hydrde arrays) may ultimately provide the best arrangement for a hydride module. An evaluation of such arrangements, however, is beyond the intended scope of the present, simple modeling work.
21

4.4 Transient behavior
In the hydride bed modules, the only measurement of the hydride bed temperature and thermal response is an indirect one, namely the change in water temperature with time. By determining solutions of the heat equation in the current geometry (equation 2b above), one could then derive the power input into the cooling water. This is the approach taken in the following discussion, and this approach was directly linked to particular experimental situations which should produce the correct starting boundary conditions. These conditions are those occurring during steady state fueling when, as predicted above, a parabolic temperature distribution is established in the bed because of the uniform power (density deposition in the bed. At a certain time, chosen to correspond to t = 0 in the model, tlhe fueling is stopped. Thus, solving the heat equation (2b) reduces to solving Laplace's equation in cylindrical geometry with the boundary condition at t= 0 being a parabolic temperature distribution; the temperature at r = a (tube radius) is assumed to be constant and equal to 0.
The solution to these conditions ha!; been determined (Carslaw and Jaeger,1995, p199,7.6, eqn 7) and is the following:
where a, are the inverse dis.tances which correspond to the positive roots of Jo(aq,) = 0.
The energy flux into the hydride tube at r=a at time t is given by
t> 7. j ( r = a,t> = -k, dr
We assume that this same flux enters the water stream. This is equivalent to the boundary condition used by other investigators of hydride beds (Suda, 1983b) of
This corresponds physically to assuming that the energy input into the tube from the hydride is predominantly conducted to the water, with little energy expended to heat up the tube.
Differentiating 6. and using 7. , the following expression for the flux results:
22

The total power transferred to the water is given by
10. P ( t ) = j ( r = a , t ) - A
Figure 14 shows P as a function of time, t, for two cases, namely for the summation evaluated through n=50 and for the case of n=l, the first term in the sum only. Both are evaluated for a fueling rate of 75 slm. As can be seen from the comparison of these two expressions in this figure, the 50 term sum can be approximated to better than 10% accuracy by the first term in the series for times 25 s. From equations 9 and 10, the expression for the power using only this first term is
where aa l =2.4048, the first nonzero root of Jo(aa,) = 0. This can be recast into the following format:
P(t ) t P, z
l l a (-) = exp(--) ,
Experimental support for the approximate value of this time constant is shown in Figure 15, where the decays in measured temperature differences between the output and input water lines on the module are shown. The experimental situation created corresponds exactly to that required to establish a parabolic temperature distribution, namely a constant fueling rate followed by immediate cessation of fueling. As described above, these conditions were assumed in derivation of eqns. 11 and 1 l a above. The time immediately following cessation of fueling at two constant rates are shown as t=O for the 75 slrn case; the zero in time for the 25 slm fueling, which has a smaller temperature rise than the 75 slm case, was adjusted so it would mesh with the 75 slm data and could be plotted in the same graph. Both fuelings were done with 0.6-0.7 gpm water flow; the results with the higher water flows would be the same, except that the magnitudes of the temperature increases would be lower. The straight line shown in the graph corresponds to exp(-th), with 'I: = 41.2 s, the value calculated above. It is clear from the graph that there is good agreement with the predicted decay time. Note that there is increased noise and apparent deviation from the predicted behavior at low values of temperature differences. This situation is probably caused by the finite resolution (-0.125 "C) of the the temperature channels in the data acquistion system.
It is essential to realize that the 41.2 s time constant (z) determined above pertains to the thermal behavior of the hydride tubes only, as described in the section about with the model
23

“assumptions.” A longer decay time would be expected for the entire module if all the module, including water jacket, Lexan and other parts were considered in the analysis. Such a longer time would be observed during gas desorption from the module, a situation where all of the module is heated by the water. This is unlike refueling, where the heating is primarily localized to the hydride-containing tubes and the remainder of the module is cooled by the water flowing in the jacket volume around the tubes and kept at essentially constant temperature.
5. Summary
In the current work, a modular, hydride beds for supplying hydrogen to a fuel cell have been designed, constructed, and subjected to initial testing. Based on experimental data, this bed system consisting of 8 modules would have a usable hydrogen capacity of about 235 grams when fueled at 17°C and 165 PSIA, a capacity which exceeds the original design goal of 160 grams of hydrogen. Fueling at higher temperatures would lower the stored amount of hydrogen, while fueling at higher pressures would raise it. The exact amount of hydrogen which would be stored onboard a vehicle will depend on the particular operating temperatures expected and the fueling scenario chosen. In spite of these variables, the current work shows that the modular system built should meet or exceed capacity requirements.
The results directly demonstrate thlat the requirement of module refueling times of less than 10 minutes are satisfied: 95% refueling times of - 5 - 6 minutes with the current module design were demonstrated at fueling rates of 50 - 75 slm I module and cooling water flows of 0.6 gpm / module. Ongoing thermal modeling of the modular system indicates that the basic limitation on fueling times is related to neither hydrogen fueling rate nor water flow, but rather to the low thermal conductance of the hydride within the hydride tubes.
Gas delivery rates of 25 slm were readily achievable at bed temperatures of -3 5-40 “C. The data comparing the C15 module with th.e Hy-Stor 208 module indicate that, in order to make the modular concept work and provide a thermal response advantage over a larger single bed, the water inventory in the heating cooling loop must be reduced from the amount used in these tests. The arguments presented in Section 2.2 (available energy considerations) indicate that amounts as low as possible should be used and suggest an inventory of -2 liters would make a desirable goal for use with an 8 module system.
Using a simplified model of module construction, the predicted thermal behavior of a module during and after fueling is in good agreement with experimentally observed results. Although a complete, more complicated, finite element modeling of a module must be performed to predict all thermal response behavior, the agreement between theory and experiment in the simple model suggests that the essential thermal behavior of the module is correctly simulated. This model uses the sizes of the tubes and manufacturer’s quoted values for the specific heats and heat of hydride formation. With these inputs, a value of the hydride bed conductivity of - 0.4 Wlm-K is found to provide the good agreement between predicted and observed transient thermal behavior after fueling. Further, core hydride temperatures of > 110 “C above the water

temperatures are predicted at fueling rates of 75 slm. It is likely that such internal heating in the hydride is the primary limitation on the reduction of fueling times by increased fueling rates.
Overall, the modules have met or exceeded all design goals, and should be excellent candidates for deployment in a prototypical hydride bed - fuel cell test vehicle. When so used, the next step in this bed work is the design and testing of the bed system, that is, the interconnection, control and end use of the separate modules operating as a group. This future work must compare the characteristics of a hydrogen supply system based on such a hydride beds to one using compressed, gaseous hydrogen storage. The flexibility offered by the modularity of a hydride system based on the current modular devices make it an ideal prototypical test bed for the implementation of metal hydrides in mobile applications requiring hydrogen delivery to fuel cells.
25

List of References
Meinhard Aits, GfE Metalle und Materialien, private communication (March 28, 1995)
P. Berger and C. Chamberlain, Schatz Energy Research Center, private communication (August 20, 1996).
D. R. Brighton, P. L. Mart, G. A. IClark and M. J. M. Rowan, Journal of Power Sources 51,375 (1 994).
HCI/Frank Lynch, “Metal Hydride Heat Pump Engineering Demonstration and Evaluation Model,” NASA Report NAS9- 178 19 (October, 1993)
H. Hasegawa and Y . Ohki, “Development of a Model of On-Board PEMFC Powered Locomotive with a Metal Hydride Cylinder,” in Materials for Electrochemical Energy Storage and Conversion - Batteries, Capacitors and Fuel Cells, D. H. Doughty, Brijesh Vyas, T. Takamura, and J. R. Huff (eds.), Materials Research Society, Pittsburgh, PA (1995).
E. L. Huston and G. D. Sandrock, “‘Engineering Properties of Metal Hydrides,” J. Less-Common Metals 74,435 (1980).
M. Nadal and F. Barbir, “Development of a Hybrid Fuel Cell/ Battery Powered Electric Vehicle,” Int. J. Hydrogen Energy 21,497 (1996).
R. Pechloff, GfE Metalle und Materialien, private communication (November 22, 1996)
K. Shindo, A. Watanabe, M. Nishioka, M. Tsutsumi, M. Fujiwara and T. Itoh, “The Phosphoric Acid Fuel CellBattery for Golf Cart Applications,” in Proceedings of the Batteries and Fuel Cells for Stationary and Electric Vehicle Applications, 183rd Meeting of the Electrochemical Society (1 993).
S. Suda, N. Kobayashi, K. Yoshida, Y . Ishido, and S. Ono, J. Less-Common Metals 74, 127 (1 980).
S. Suda, Y . Komazaki, and N. Kobayashi, J. Less-Common Metals 89,3 17 (1983). “1983a”
S. Suda, N. Kobayashi, E. Morishita, and N. Takemoto, J. Less-Common Metals 89, 325 (1983). “ 1993b”
H. S. Carslaw and J. C. Jaeger, Conduction of Heat in Solids, Clarendon Press (Oxford University Press, Oxford, 1995).
26

Figure Captions
Figure 1. Drawings of a single, hydride bed module. The module cross-section in the upper left hand side of the drawing shows the internal module construction.
Figure 2. Photograph of a finished module. The ruler is graduated in inches.
Figure 3. A sketch of the volume on the PDV where an 8 bed, module-based hydride system could fit.
Figure 4. Simplified schematic of a fuel cell- hydride bed system.
Figure 5. Simplified schematic of the experimental system used to test the modules.
Figure 6. Selected static properties of C15 and Hy-Stor 208, the alloys used in the hydride modules.
Figure 6a (upper). Mid-plateau overpressures of the two alloys. Figure 6b (lower). 15 OC isotherms for the two alloys; isotherms measured using actual modules.
Figure 7. Dynamic, fueling properties of single, C15 and Hy-Stor 208 modules. Figure 7a(upper). Fueling of C 15 module. Figure 7b(lower). Fueling of Hy-Stor 208 module.
Figure 8. Hydrogen delivery from single, C15 and Hy-Stor 208 modules. Figure 8a (upper). Delivery from fully fueled modules. Figure 8b (lower). Delivery from half-fueled modules.
Figure 9. Hydrogen fueling and delivery from groups of modules. Figure 9a (upper). Fueling behavior of a group of 3, C 15 modules fueled and water- cooled in parallel. Figure 9b (lower). Delivery from a group of 4, C15 + 1, Hy-Stor 208 modules heated in parallel and delivering gas in parallel.
Figure 10. Hypothetical radial temperature profile in a hydride tube in a bed module. The hydride alloy fills a tube with a nominal radius a , and wall thickness 6, with 6 <<a. Water at a temperature Tw is outside the tube.
Figure 1 1. Difference in temperatures between output and input cooling water in a C15-filled module during fueling at 3 different rates. The module was cooled with water at - 17 "C and flowing at - 0.6 gpm.
27
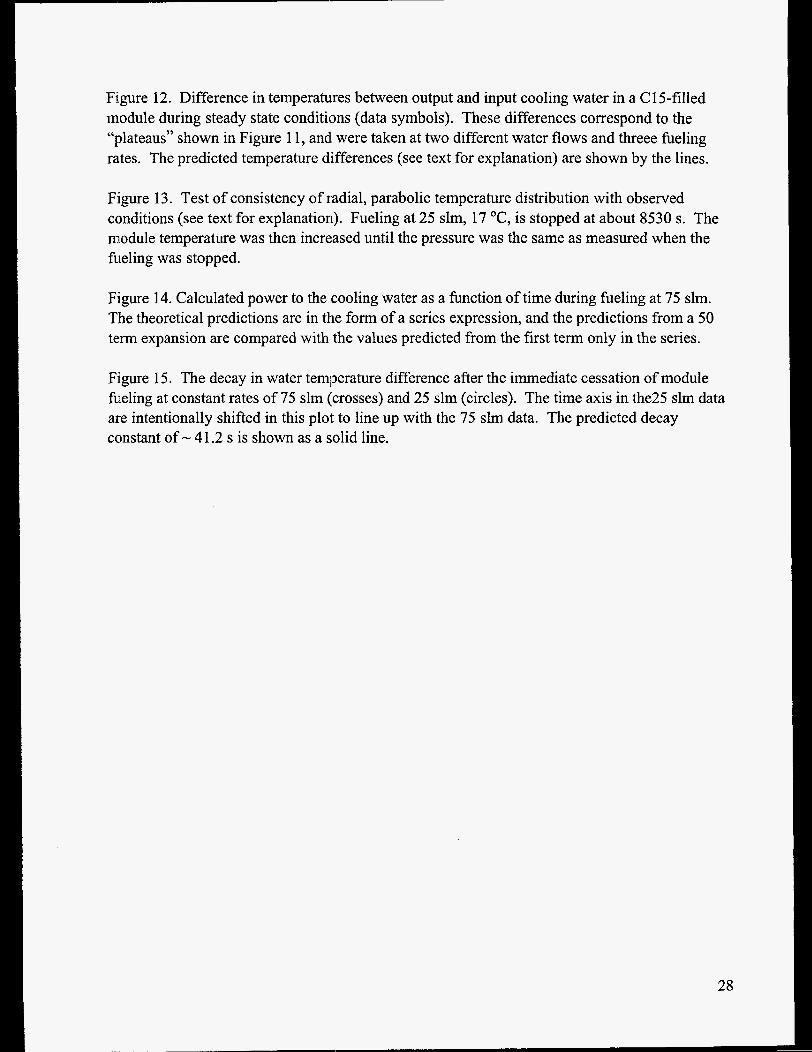
Figure 12. Difference in temperatures between output and input cooling water in a C 15-filled module during steady state conditions (data symbols). These differences correspond to the “plateaus” shown in Figure 1 1, andl were taken at two different water flows and threee fueling rates. The predicted temperature differences (see text for explanation) are shown by the lines.
Figure 13. Test of consistency of radial, parabolic temperature distribution with observed conditions (see text for explanation). Fueling at 25 slrn, 17 “Cy is stopped at about 8530 s. The module temperature was then incre:ased until the pressure was the same as measured when the fueling was stopped.
Figure 14. Calculated power to the cooling water as a function of time during fueling at 75 slm. The theoretical predictions are in the form of a series expression, and the predictions from a 50 term expansion are compared with the values predicted from the first term only in the series,
Figure 15 The decay in water temperature difference after the immediate cessation of module heling at constant rates of 75 slm (crosses) and 25 slm (circles). The time axis in the25 slm data are intentionally shifted in this plot to line up with the 75 slrn data. The predicted decay constant of - 4 1.2 s is shown as a solid line.
28

nominal 0.25" dia fritted gas supply tube (eccentrically mounted, runs length of hydride
/ ,water ~ U U I I I I ~ shroud 0.6875" dia x 0.020" wall tube filled with 3 g/cc GfE C15 alloy \
Lexan rods (run length of hydride tube)
typical water flow channel
Section C-C
pressure relief valve I \
A section A-4 /'
FRONT VIEW
" dia inlet water tube
SIDE VIEW, section B-B
Figure 1

30

31
t
32

W 4 3 n 0 a n W m LLI n z n >. I
33

0 2 0 4 0 6 0 a o 1 0 0
T e c ,
1 n cn Y
W K 3 u) u) W K n
0 5 1 0 1 5 2 0 2 5 3 0 3 5
H p MASS (SI
Figure 6a (upper) and Figure 6b (lower)
34

h
Y m n w J W 3 U
3 5
3 0
2 5
2 0
1 5
1 0
5
0
0 5 1 0 1 5 2 0
TIME (min)
3 0
2 5
2 0
1 5
1 0
0 5 1 0 1 5 2 0
TIME (min)
Figure 7a (upper) and Figure 7b (lower)
35

3 0
starting module temp. = 11 2 5
1 2 0
1 5
1 1 0
5
5 0
- 5
0 - 1 0
h
E - v)
W c v
a a a 2 n
* W
-I W
0 1 0 2 0
TIME (min)
3 0 4 0
3 0
2 5
2 0
1 5
- 1
5
0
5
0 0 1 0 2 0
TIME (min)
3 0 4 0
Figure I3a (upper) and Figure 8b (lower)
36

1 0 0
8 0
h
v m n 6 0 W m 9: s: 2 4 0
(v I
2 0 tal water flow
0
0 5 1 0 1 5
TIM E( mi n)
5 0 300
2 5 0
s D
0 0 2 0 0 2 - J J Z $! - I m
r n m 150-
5 0 1 oon m
0 5 0 -
0 0
2 0 4 0 6 0 8 0 100
TIME (min)
Figure 9a (upper) and Figure 9b (lower)

TmF W
3
4 Lu e z W I-
d
0 0
T. 2 in
a RADIAL DISTANCE
w T
#
Figure 10
38
n Y
W
3
v
a
a Lu e I Lu I- + 3
z
2
e I
I
+ 3 e + 3 0
I U
8
6
4
2
0
0 5 1 0 1 5 2 0
TIME (min)
Figure 11
39

0
N 0
P 0
ul 0
0
00 0
TEMPERATURE DIFFERENCE (OC) 19
0 P 00 0
P 0

. . . . . . . . . . . . . . . . . . . . - .......... " ...... -. i if . . . . . - ... :...:..+..:..a. . . . . . . . . . . . . . . . . . . . . . . . . . . . . . . . . . . . . . . . . . . . . . . . . . . . . . . . . . . . . . . . . . . . . . . . . . . . . . . . . . . . . . . . . . . . . . . . . . . . . . . . . . . . . . . . . . . .
- .......... - ...... -. - . .......... " ...... -.
. . . . . . . . . . . . . . . . . . . . - ... :...:..;...:..a. I)$g&[ . . . . . - ...)... :..*...I..*. . . . . . . . . . . . . . . . . . . . . . . . . . . . . . . . . . . . . . . . . . . . . . . . . . . . . . . . . . . . . . . . . . . . . . . . . . . . - ......... .- ...... -. - ... j...:..;...;..;. . . . . . . . . . . . . . . . . . . . . . . . . . . . . . .
. . . . . . . . . . . . . . . . . . . . . . . . . - .. ::...:...,...;..*. . . . . . . . . . . . . . . . . . . . . . . . . . . . . . . . . . . . - ...:...:..*...:..*. . . . . . . . . . . . . . . . . . . . . . . . . . . . . . . . . . . . - ... j...:..;...:..;. . . . . . . . . . . . . . . . . . . . . . . . . . . . . . . . . . . . - ... ,... :...> ...,.. 0. . . . . . . . . . . . . . . . . . . . . . . . . . . . . . . 8 0- ..&..i..<..<..& . . . . . . . . . .
8000
. . . . . . . . . . . . . . . . . . . . . . . . . . . . . . . . . . . . . . . . . . . . . . . . . . . . . . . . . . . . . . . . . . . . . . . . . . . . . . . . ......... - .................. -.."..".. 1; StCidpi€id ; ; . . . . . . . . . . .. :...:..;...:...:...:...;..L...C...:..
.............. ".."..".."..
. . . . . . . . . . . . . . . . . . . . . . . . . . . . . . . . . . . . . . . . . . . . .
. . . . . . . . . . ........................................ . . . . . . . . . . . . . . . . . . . . . . . . . . . . . . . . . . . . . . . . . . . . . . . . . . . . . . . . . . . . . . . . . . . . . . ......... - .............. .... ".."..".. . . . . . . . . . . . . . . . . . . . . . . . . . . . . . . . . . . . . . . . . . . . . . . . . . . . . . . . . . . . . . . . . . . . . . . . . . . . . . . . . .. ,...:..*...,...:...>..,..*..*...).. . . . . . . . . . . . . . . . . . . . . . . . . . . . . . . . . . . . . . . . . . . . . . . . . . . . . . . . . . . . . . . . . . . . . . . ........ .. ................. ..* ...... tqvppr#qrp . . . . . . . . . . . . . . . . . . . . ...................................... . . . . . . . . . . ........._.. I .............. ..-.. - . . . . . . . . . . . . . . . . . . . . . . . . , ...... .- ........................ ".. . . . . . . . . . . . . . . . . . . . . . . . . . . . . . . . . . . . . . . . . . . . . . . . . ..:...: . . . i.fG&Ng . . . . . . . . . . . . . . . . . . . . . . . . . . . . . . . . . . . . . . . . . . . . . . . . . . . . . . . . . . . . . . . . . ....... .-.... .......... -......-...... . . . . . . . . . . . . . . . . . . . . . . . . . . . . . . . . . . . . . . . . . . . . . . . . . . . . . . . . . . . .
9000
- . . . . . . . . . . . . . . .. :...:. . . . . . . . . . . . . . . 1.2; - . . . . . . . . . . . . . . . . . . . . . . . . . . . . ...... " .. :...z 3 + . . . . . . . . . . . . . . . . . . . .
.. :...5
.. :...e. . . . . . . . . . . . . . . . . . . . . . . . . . . . . . .
........
.. :...:. . . . . . . . . . . . . _ . .. :...e. . . . . . . . . . . . . . . .. :...e. . . . . . . . . . . . . . . ..:".(' . . . . . . . . . . . . . . .. :...:. _ . . . . . . . . . . . J
.... e. : : . . . . . . . . . . . . . . . . . . . . . . . . . . . . . . . . _ . . . . . . . . .
........
........
.. :...C' . . . . . . . . . . . . . .
. . . . . . ........ - . . . . . . . . . . . . .. :...:a ..ig
=P
. . . . . . . . . . . . . . . . . . . . . . ........
. . . . . . . . . . . . . . . . . . . . . . . . . . . . . . . . . . . . . . . . . . . . . . . . . . . . . . . . . . . . . . . . ."..., .......... " ............. . . . . . . . . . . . . . . . . . . . . . . . . . . . . . . . . . . . . . . . . . . . . . . . . . . . . . . . . .&..C...:...:..&..:...:...:. !I I t j&~&~l . . . . . . . .
b . . . . . . . . . . . . . . . . . . . . . . . . . . . . . . . . . . . . . . . . . . . . . . . . . . . . . . . . . . . . . . . . ."....... ....... ...... ......... . . . . . . . . . . . . . . . . . . . . . . . . . . . . . . . . . . . . . . . . . . . . . . . . . . . . . . . . . . . . . . . . ."..., ........ ....... .......... +***+*** . . . . . . . . . . . . . . . . . . . . . . . . .a...C...;...:...%...>...:...:. . . . . . . . . . . . . . . . . . . . . . . . . . . . . . . . . . . . . . . . . . . . . . . . . . . . . . . . . 4 0 . . *.., :...:..*... ,... :...:. . . . . . . . . . . . . . . . . . . . . . . . . . . . . . . . . . . . . . . . . . . . . . . . . . . . . . . . . . . . . . . . . . . . . . .
. . . . . . . . . . . . . . . . . . . . . . . . . . . .
. . . . . . . .
. . . . . . . . . . . . . . . . . . . . . . . . . . . . . . ..... ̂ .......... ...... ......... . . . . . . . . . . . . . . . . . . . . . . . . . . . . . . . . . . . . . . . . . . . . . . . . . . . . . . . . . . . . . . . . .-..- .......... - ............. . . . . . . . . . . . . . . . . c
.i..&..;...:..i..i...:...:.
. . . . . . . . . . . . . . . . . . . . . . . . . . . . . . . . . . . . . . . . . . . . . . . . . . . . . . . . . . . . . . . . . . . . . . . . 6 ..; ...j...i...j...j...j...;.
. . . . . jbec
-+i-i+Y 10000
. . . . . . . . . . . . . . . . . . . . . . . . . . . . . . . . . . .-..- .......... .. ............. . . . . . . . . . . . . . . . . . . . . . . . . . . . . . . . . . . . . . . . . . . . . . . . .
TIME@)
Figure 13
. . . . . . . . . . : : : : : : : : : : 6 . . . . . . . . . . . . . . . . . . . . . . . . . . . . . . . . . . . . . . . . .. ..................................... - . . . . . . . . . . . . . . . . . . . . . . . . . . . . . . . . . . . . . . . . . . . . . . . . . . . . . . . . . . . . . . . . . . . . . . .. :..a...:...:...:...L..:..;...:...:... - ... - . . . . . . . . . . . . . . . . . . . . . . . . . . . . . . . . . . . . . . . . . . . . . . . . . .
. . . . . . . . . . . . . . . . . . . . . I i i ! i i . . . . . . ,.."...I"' -
. . . . . . . . : : ; i d ; i .. .................................... - : : : : : I f ! : : . . . . . . . . . : : f i r : . . . . . .
.. i..i...j...I...;...c..t..l..d...i... -
..... ".... ........... - ..... . . . . . . . . . . . . . . . . . . . . . . . . . . . . . . . . . . . . . . . . . . . . . . . . . . . . . . . . . . .. 4 l..j...;...t...5..L..t..l...j...i... - . . . . . . . . . . . . . . . . . . . . . . . . .
. . . . . . . . . . ..:..* ...,... :...:. .e...:..*...).*:...- . . . . . . . . . . . . . . . . . . . . . . . . : : : : : : . . . . . . A T = 3 .. :..,...:...:I..:' .O . . . . . . . . . . . . . . . . ..... . . . : : . . . . . : i ; 120 o c
; ; i . . . AT';:; . . . .
C....:...:...:. ." . . . . . . . . . . . . . . . . . . . . . . . . . . . . . . . . . . . . . . . . . . . . . . . . . . . . . . . . . . . . . . . . . . . . . . . . . . . . . . . . . . . . . . . ..... - ............. ." ..... -...- ...... - ..:..* ...).. ,. .:... - . . . . . . . . . 0 i i ..:..e...:.. i i ; 1 8 C :, . . . . . . . . . . . . . . . . . . . . . . . . . . . . . . . . . . . . . . . . . . . . . . . . . . . . . . . . . . . . . . . . . . . . . . . . . . . . . . . . . . . . . . . . . . . . . . . . . . . . . . . . . . . . . . . . . . . . . . . . . . . . . . . . . . . . . . . . . . . . . . . ..... - ..................... .̂.?. .:...
. . . . . . . . . . . . . . . . . . . . .. :..i...:...:...:...&..:..i..i...:... - . . . . . . . . . . . . . . . . . . . . . . . . . . . . . . . . . . . . . . . . . . . . . . . . . . . . . . . . . . . . . . . . . . . . . . . . . . . . . . . . ..................................... - . . . . . . . . . . 16-6-9711 /data ..... -...- ....... -..._ ..... ".._ ....... " . . . . . . . . . . . . . . . . . . . . . . . . . . . . . . . . . . . . . . . . . . . . . . . . . . . . . . . . . . . .
1 1 1 1 1 1 1 1 -; 1 11 000 I r .- .- .. P-. 7
s D -I rn m -I rn z W rn m D -I c m rn n
0 0 U
I 41

0 5 0 100 1 5 0
TIME(s)
-
...... : ....... ..............
...... : .......
..............
...... : .......
...... : .......
..............
...... : .......
..............
..............
..............
..............
...... : .......
..............
...... : .......
..............
*.....:......I
..............
\ --i-
200
Figure 14
42

1 0
.....
..... -....
-....
-....
1 -.... ..... -.... -.... -.... w...
0.1 I 0
. . . . . . . . . . . . . . . . . . . . . . . . . . . . . . . . . . . . . . . . ... I ..................... .. ................. - .......... -... . . . . : . - . r z t : : :
... t. + 7 5 s l m i .... i ..... i... :- tau - 41.2 s
. . . . . . . . . . . . . . . . ... (.,... . .....,..... .................. , ..... ... .... < ..... t.... ... &. . . . . . . . . . . . . . . . . . . . . : : : : : :
25 slm .... i ..... i... ' 0 . . . . . . . , . . . . . . . . . . . . .
...G .... : ..... > .... . . . . . . . . . . . . . . . . . . . . . . . . . . . . . . . . . . . . . . , . . . . . . . . . . . . . . , . . . . . . . . . . . . . . . . . . . . . . . . . . . . . . . . . . . . . . . . . , . . . . . . . . . . . . . . . . . . . . . . . . . . . . . , . . . . . . . . , . . . . . . . . . . . . . . . . . . . . , . . . . _ . . . . . . . . . , . . . . . . . . . . . . . . . . . . . . . . . . . . . . . . . . . . . .
...- ...............
.............. " ....
...e ......... .. ....
..... ......... " ....
... <.....:....*....
... : ..... : .... L.... . . . . . . . . . . _ . . . . . . . . . . . . . . . . . . , . . . . . , . . . . . . . . . . . .
...& .... : ..... 5 ....
...e .... : ..... ).... . . . . . . . . . . . . . . . . . . . . , . . . . . . . . . . . . . . . . . . . . . . . . . . . . . . . . . . . .
... c.......... Q ....
...e ....: .... .... . . . . . . . . . . . . . . . . . . . - . . . . . . . . . . . . . . . . . . . . . . . . . . . . . - . ... : ..... : ..... 5 .... . . . . . . . . . . . . . . . w . . . . . , . . . . . . . . . . . . . . . . . . . . . . . . . . . - . . . . . . . , . . . . . . *
. . . . . _ . . . . . . . . . . . . . . . . . . . . . . . . . . . . . . . . . . . . . . . . . . . . . . . . . . . . . . . . . . . . . . . . . . . . . . . . . .
... i ..... * .... : ..... c...
...? .... ̂ .... .... ̂... . . . . . . . . . . . . . . . . . . . . . . . . . . . . . . . . . . . . . . . . . . . . . . . . . . . . . . . . . . . . . . . . ... : ..... L .... : ..... L.... . . . . . . . . . . . . . . . . . . . . . . . . . . . . . . . . . . . . . . . . . . . . . . . . . . . . . . . . . . . . . . . . . . . . . . . . . . . . . . . . . . . . . . . . . . . . . . . . . . . . . . . . . . . . . . . . . . . . . . . . . . . . . . . . . . . . . . . . . . . . ......... - .......... -.., . . . . . . . . . . . . . . . .
......... .. .......... .....
... c..... e....: ..... e..,
... : ..... i .... : ..... j... . . . . . . . . . . . . . . . . . . . . . . . . . . . . . . . . . . . . . . . . . . . . . . . . . . . . . . . . . . . . . . . .
... i ..... c .... i ..... e...
... (..... 0 .... t..... +... . . . . . . . . . . . . . . . . . . . . . . . . . . . . . . . . ... (..... .... i'.... e... : : : : : : : :
...i'.... + .... (. .... +",
. . . . . . . . . . . .
. . . . . . . . . . . . . . . . . . . . . . . . . . . . . . . . . . . . . . . . . . . . . . . . . . . . . . . . . . . . . . . . . . . . . . . . . . . . . . . . . . . . ... :.....e .... i ..... C.., . . . . . . . . . . . . . . . . . . . . . . . . . . * j ; . . . . . . . . . . . . . . . . . . . . . . . . . . . . . . . . . . . . . . . . . . . . . . . . . . . . . . . . . . . . . . . . tt-i--i-
5 0 100 1 5 0 2 0 0 250 300
TIME(s)
Figure 15

DISTRIBUTION:
P
1
1
1
1
1
1
1
Sigmund Gronich Hydrogen Program US Dept. of Energy 1000 Independence Av nu Washington, DC 20585
sw
Neil Rossmeissl Office of Solar Thermal, Biomass & Hydrogen US Dept. of Energy, EE-13 1000 Independence Avenue, S W Washington, DC 20585
Cathy Gregoire-Padro NREL 1617 Cole Boulevard Golden, CO 80401-3393
Dr. James M. Ohi NREL 161 7 Cole Boulevard Golden, CO 80401-3393
Dr. Scott Hynek A. D. Little, Inc. Acorn Park, Room 20/520 Cambridge, MA 02140
Dr. Raulf Loutfy MER Corporation 7960 S . Kolb Road Tucson, AZ 85706
Frank E. Lynch Hydrosen Consultants, Inc. 12420 North Dumont Way Littleton, CO 80125
Richard E. Rocheleau University of Hawaii/ Natural Energy Institute 2540 Dole Street Honolulu, HI 96822
44

DISTRIBUTION:
1
1
1
1
1
1
1
1
Gary Sandrock SunaTech, Inc. 113 Kraft Place Ringwood, NJ 07456
Dr. Krishna Sapru Energy Conversion Devices, Inc. 1675 West Maple Road Troy, MI 48084
Dr. Ned T. Stetson Energy Conversion Devices, Inc. 1675 West Maple Road Troy, MI 48084
Dr. William Summers Westinghouse Savannah River Company
Aiken, SC 29808 BIdg. 773-41A
Dr. Sandy C. E. Thomas Directed Technologies, Inc. 4001 N. Fairf'ax Drive, Suite 775 Arlington, VA 22203
Dr. Peter A. Lehman Schatz Energy Research Center Humboldt State University Arcata, CA 95521-8299
Glenn D. Rambach Desert Research Institute 5625 Fox Avenue P.O. Box 60220 Reno, NV 89506-0220
Alan Lloyd Desert Research Institute 5625 Fox Avenue P.O. Box 60220 Reno, NV 89506-0220
45

DISTRIBUTION:
1 Douglas J. Wheeler International Fuel Cells 195 Governors Highway P-0. Box 739 South Windsor, CT 06074
MS 0451 MS 0806 MS 0806 MS 0806 L. Stans, 4615 MS 1436 LDRD Office MS 9001 Attn: J. B. Wright, 2200
T. D. Tarman, 9417 M. 0. Vahle, 4616 S. A. Gossage, 4616
T. 0. Hunter, 8000
J. F. Ney (A), 5200 M. E. John, 8100 L. A. West, 8200 W. J. McLean, 8300 R. C . Wayne, 8400 P. N. Smith, 8500 P. E. Brewer, 8800
1 MS 9003 1 MS 9011 1 MS 9011 1 MS 9011 10 MS 9011 1 MS 9011 1 MS 9011 1 MS 9011 1 MS 9011 1 MS9012 1 MS9012 1 MS 9019 1 MS 9053 1 MS 9053 1 MS 9402 20 MS9402 1 MS 9403
D. L. Crawford, 8900 R. E. Palmer, 8901 P. W. Dean, 8910 J. M. Brandt, 8910 H. Y. Chen, 8910 J. A. Hutchins, 8910 R. Tsang, 8910 J. Meza, 8950 D. B. Hall, 8970 J. E. Costa, 8920 S. C. Gray, 8930 B. A. Maxwell, 8940 J. Keller, 8362 S. Vosen, 8362 M. E. Malinowski, 8715 G. J. Thomas, 8715 S. E. Guthrie
46

1 MS 9405 T. M. Dyer, 8700 Attn: M. I. Baskes, 8712
J.C. F. Wang, 8713 K. L. Wilson, 8716 W. G. Wolfer, 8717 E-P Chen, 8742 P.E. Nielan, 8743 W. A. Kawahara, 8746
3 4 1 2
MS 9018 Central Technical Files, 8940-2 MS 0899 Technical Library, 4916 MS 9021 Technical Communications Dept., 881 Snechnical Library, 4916 MS 9021 Technical Communications Dept., 88 15 For DOE/OSTI
47/48