Modification and Optimization of a Gaussian Noise ...
26
Southern Illinois University Carbondale OpenSIUC Research Papers Graduate School 2013 Modification and Optimization of a Gaussian Noise Generation System for the Study of Noise- Induced Hearing Loss Kelly Wepsiec Southern Illinois University Carbondale, [email protected] Follow this and additional works at: hp://opensiuc.lib.siu.edu/gs_rp is Article is brought to you for free and open access by the Graduate School at OpenSIUC. It has been accepted for inclusion in Research Papers by an authorized administrator of OpenSIUC. For more information, please contact [email protected]. Recommended Citation Wepsiec, Kelly, "Modification and Optimization of a Gaussian Noise Generation System for the Study of Noise-Induced Hearing Loss" (2013). Research Papers. Paper 433. hp://opensiuc.lib.siu.edu/gs_rp/433
Transcript of Modification and Optimization of a Gaussian Noise ...

Southern Illinois University CarbondaleOpenSIUC
Research Papers Graduate School
2013
Modification and Optimization of a GaussianNoise Generation System for the Study of Noise-Induced Hearing LossKelly WepsiecSouthern Illinois University Carbondale, [email protected]
Follow this and additional works at: http://opensiuc.lib.siu.edu/gs_rp
This Article is brought to you for free and open access by the Graduate School at OpenSIUC. It has been accepted for inclusion in Research Papers byan authorized administrator of OpenSIUC. For more information, please contact [email protected].
Recommended CitationWepsiec, Kelly, "Modification and Optimization of a Gaussian Noise Generation System for the Study of Noise-Induced Hearing Loss"(2013). Research Papers. Paper 433.http://opensiuc.lib.siu.edu/gs_rp/433

i
MODIFICATION AND OPTIMIZATION OF A GAUSSIAN NOISE GENERATION SYSTEM FOR THE
STUDY OF NOISE-INDUCED HEARING LOSS
by
Kelly Wepsiec
B.S., Southern Illinois University, 2005
A Research Paper
Submitted in Partial Fulfillment of the Requirements for the
Master of Engineering.
Department of Biomedical Engineering
in the Graduate School
Southern Illinois University Carbondale
August 2013

RESEARCH PAPER APPROVAL
MODIFICATION AND OPTIMIZATION OF A GAUSSIAN NOISE GENERATION SYSTEM FOR THE
STUDY OF NOISE-INDUCED HEARING LOSS
By
Kelly Wepsiec
A Research Paper Submitted in Partial
Fulfillment of the Requirements
for the Degree of
Master of Engineering
in the field of Biomedical Engineering
Approved by:
Dr. Jun Qin, PhD, Chair
Dr. Nazeih Botros, PhD
Graduate School
Southern Illinois University Carbondale
July 12, 2013

i
TABLE OF CONTENTS
CHAPTER PAGE
LIST OF FIGURES ............................................................................................................................... ii
RESEARCH PAPER ............................................................................................................................ 1
REFERENCES .................................................................................................................................. 18
VITA ........................................................................................................................................... 21

ii
LIST OF FIGURES
FIGURE PAGE
Figure 1 ........................................................................................................................................... 2
Figure 2 ........................................................................................................................................... 7
Figure 3 ........................................................................................................................................... 9
Figure 4 ........................................................................................................................................... 9
Figure 5 ......................................................................................................................................... 11
Figure 6 ......................................................................................................................................... 12
Figure 7 ......................................................................................................................................... 15
Figure 8 ......................................................................................................................................... 16
1
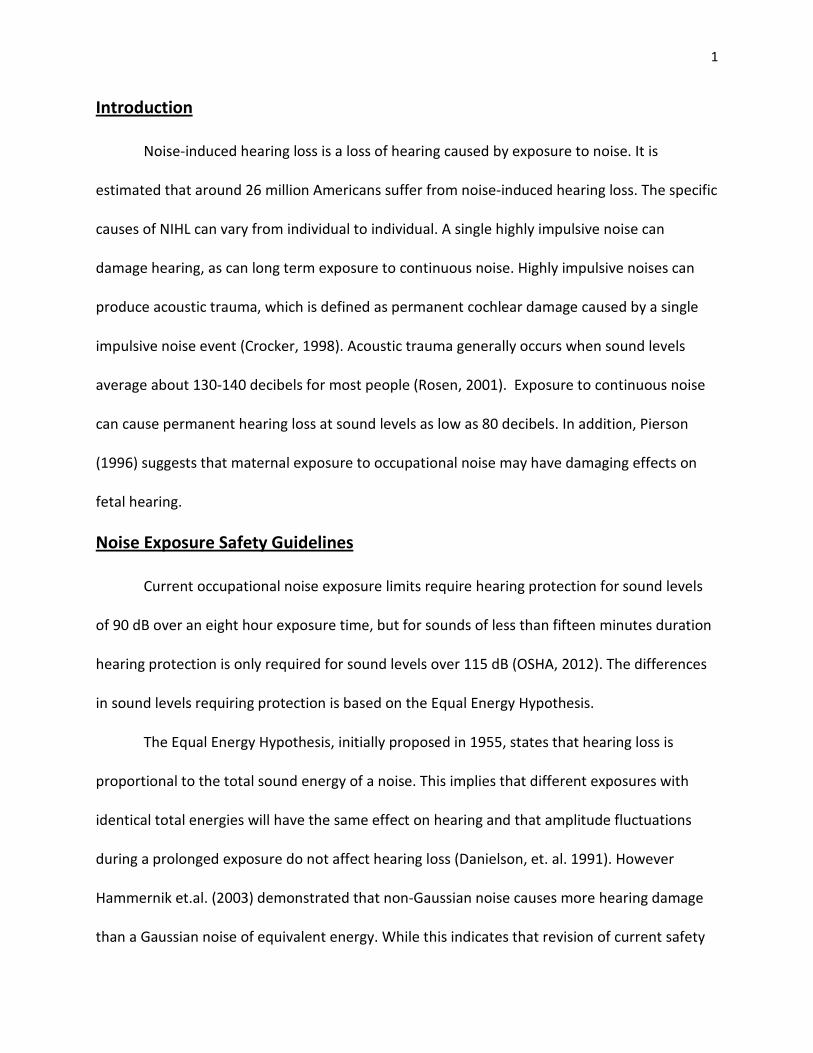
Introduction
Noise-induced hearing loss is a loss of hearing caused by exposure to noise. It is
estimated that around 26 million Americans suffer from noise-induced hearing loss. The specific
causes of NIHL can vary from individual to individual. A single highly impulsive noise can
damage hearing, as can long term exposure to continuous noise. Highly impulsive noises can
produce acoustic trauma, which is defined as permanent cochlear damage caused by a single
impulsive noise event (Crocker, 1998). Acoustic trauma generally occurs when sound levels
average about 130-140 decibels for most people (Rosen, 2001). Exposure to continuous noise
can cause permanent hearing loss at sound levels as low as 80 decibels. In addition, Pierson
(1996) suggests that maternal exposure to occupational noise may have damaging effects on
fetal hearing.
Noise Exposure Safety Guidelines
Current occupational noise exposure limits require hearing protection for sound levels
of 90 dB over an eight hour exposure time, but for sounds of less than fifteen minutes duration
hearing protection is only required for sound levels over 115 dB (OSHA, 2012). The differences
in sound levels requiring protection is based on the Equal Energy Hypothesis.
The Equal Energy Hypothesis, initially proposed in 1955, states that hearing loss is
proportional to the total sound energy of a noise. This implies that different exposures with
identical total energies will have the same effect on hearing and that amplitude fluctuations
during a prolonged exposure do not affect hearing loss (Danielson, et. al. 1991). However
Hammernik et.al. (2003) demonstrated that non-Gaussian noise causes more hearing damage
than a Gaussian noise of equivalent energy. While this indicates that revision of current safety

2
guidelines is needed, more research is necessary to determine how to classify complex noises
and assess the damage potential before new guidelines can be introduced.
One of the emerging methods for predicting the level of hearing loss caused by a noise
is the kurtosis metric (Qui, et. al. 2006; Hammernik et. al. 2003; Goley et. al 2010; Davis et. al.
2009; Zhao et. al 2010). The kurtosis statistic is used to determine the deviation of non-
Gaussian noise from the Gaussian. Because non-Gaussian noise is more damaging than
Gaussian noise, this can help determine how much more damaging a noise is to hearing
compared to Gaussian noise of equal energy. By using both the total sound energy and the
kurtosis value a more accurate assessment of potential hearing damage can be made. Hopefully
applicable industrial guidelines can be drafted from research results.
Anatomy and physiology of the ear
Figure 1: Detailed anatomy of the human ear

3
The ear has three main parts: the outer, middle and inner ear. The outer ear consists of
the pinna and the ear canal. The tympanic membrane lies at the end of the ear canal, and
serves as the boundary between the outer ear and the middle ear. The tympanic membrane is
attached in turn to the three bones in the middle ear. These bones, the ossicles, are called the
malleus, the incus, and the stapes. The inner ear consists of the cochlea, the cochlear vestibule,
and the semicircular canals. The cochlea itself is divided into three tubes, the scala tympani, the
scala media and the scala vestibuli, which all run the length of the cochlea. The stapes is
connected to the scala vestibuli by way of the oval window. The scala tympani connected to the
middle ear through the membrane of the round window.
The scala media is lined on one side by the basilar membrane, upon which lies the organ
of corti. The organ of corti contains the inner and outer hair cells, which are the means by
which sound pressure waves are converted into electrical signals and transmitted to the brain
by the auditory nerve. There are three rows of outer hair cells and a single row of inner hair
cells. Each hair cell has group of stereovilli projecting upward into the scala media. The
stereovilli of each hair cell are graduated in length, and the longest stereovilli on the outer hair
cells contact the tectorial membrane, which is a gelatinous membrane that lies just above the
organ of corti (Boron & Boulpaep, 2009).
Sound pressure waves are directed down the ear canal by the shape of the pinna, where
they cause the tympanic membrane to vibrate. The vibration is transmitted to the bones of the
middle ear, and then to the inner ear through the oval and round windows. During the
compression phase of the sound wave the tympanic membrane is pushed inward which causes
the middle ear bones to push the oval window inward. This increases pressure within the scala

4
vestibuli which places pressure on the scala tympani and causes the round window to bulge
outward into the middle ear. In the rarefaction phase of a sound wave, the tympanic
membrane is pulled outward. The bones of the middle ear then pull the oval window outward
which pushes the round window inward.
The movement of the round and oval windows disturbs the perilymph fluid in the scala
vestibuli and the scala tympani. Movement of the oval window outward causes the basilar
membrane to lift. This creates a shear force between the outer hair cells and the tectorial
membrane (Boron & Boulpaep, 2009). The stereovilli bundles tilt in the direction of the longer
stereovilli. This opens transduction channels in the outer hair cells and depolarizes them.
Depolarization of the outer hair cells causes contraction which amplifies the movement of the
basilar membrane. When the basilar membrane lifts, it also pushes endolymph fluid from
beneath the tectorial membrane. The movement of the fluid sweeps the inner hair cell bundles
toward the lower stereovilli. This opens transduction channels in the inner hair cells and
depolarizes them. Voltage gated Ca2+
channels then open and trigger release of glutamate
which fires an action potential in the afferent neurons connected to the inner hair cells. These
processes reverse when the oval window moves inward.
When discussing NIHL, the most common hearing loss occurs at higher frequency ranges,
as well as frequencies around 4 kHz (Crocker, 1998). Different frequencies cause vibrations to
concentrate at different places along the basilar membrane within the cochlea. Each area of the
cochlea is sensitive to a different frequency, with low frequencies at one end and high
frequencies at the other. This is the result of the shape and stiffness of the basilar membrane.
When the cochlea is uncoiled, a triangular shape of the basilar membrane can be seen. The
5
point of the triangular shape lies at the beginning of the coil and is 100 times stiffer than it is at
the wide end (Boron & Boulpaep, 2009).
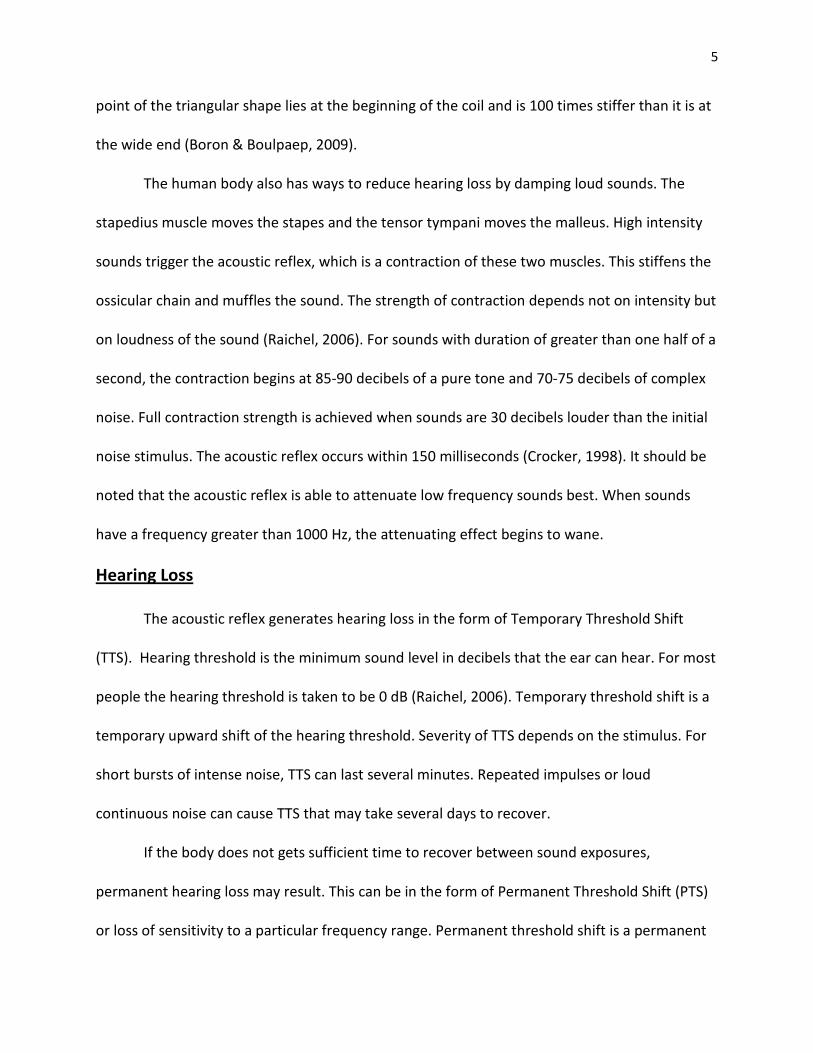
The human body also has ways to reduce hearing loss by damping loud sounds. The
stapedius muscle moves the stapes and the tensor tympani moves the malleus. High intensity
sounds trigger the acoustic reflex, which is a contraction of these two muscles. This stiffens the
ossicular chain and muffles the sound. The strength of contraction depends not on intensity but
on loudness of the sound (Raichel, 2006). For sounds with duration of greater than one half of a
second, the contraction begins at 85-90 decibels of a pure tone and 70-75 decibels of complex
noise. Full contraction strength is achieved when sounds are 30 decibels louder than the initial
noise stimulus. The acoustic reflex occurs within 150 milliseconds (Crocker, 1998). It should be
noted that the acoustic reflex is able to attenuate low frequency sounds best. When sounds
have a frequency greater than 1000 Hz, the attenuating effect begins to wane.
Hearing Loss
The acoustic reflex generates hearing loss in the form of Temporary Threshold Shift
(TTS). Hearing threshold is the minimum sound level in decibels that the ear can hear. For most
people the hearing threshold is taken to be 0 dB (Raichel, 2006). Temporary threshold shift is a
temporary upward shift of the hearing threshold. Severity of TTS depends on the stimulus. For
short bursts of intense noise, TTS can last several minutes. Repeated impulses or loud
continuous noise can cause TTS that may take several days to recover.
If the body does not gets sufficient time to recover between sound exposures,
permanent hearing loss may result. This can be in the form of Permanent Threshold Shift (PTS)
or loss of sensitivity to a particular frequency range. Permanent threshold shift is a permanent

6
loss of sensitivity to low sound levels. Damage to particular cochlear regions will result in loss of
hearing in the frequency range detected by the damaged region. It is thought some hearing loss
is from excessive vibration causing mechanical damage to the hair cells. Hearing protective
devices can dampen the sound, lessening the vibration and preventing damage that leads to
permanent hearing loss.
There are three main types of physical hearing protection devices: ear plugs, ear muffs,
and helmets (Crocker, 1998). Ear plugs have been used for thousands of years. In Homer’s
Odyssey, Odysseus uses ear plugs to evade the song of the sirens. Ear plugs are small devices,
usually made of foam or a similar material that fit into the ear canal. Unfortunately, while ear
plugs are small and convenient to use, some people find the pressure in their ear canals
uncomfortable. In that case ear muffs are another option. Ear muffs encompass the entire ear
and are easier to fit than ear plugs. Helmets combine head protection with earmuffs for a
streamlined fit.
Other studies have shown that there is a biochemical component to NIHL. Systemic
effects of loud noises include pupil dilation in the eyes, vasoconstriction, and increased heart
rate. Within the ear exposure to noise can increase mitochondrial activity and free radical
formation, reduce cochlear blood flow, and cause necrotic and apoptotic cell death in the organ
of corti (Le Prell et. al. 2007). Free radicals include reactive oxygen species (ROS) and reactive
nitrogen species (RNS). Both are highly reactive substances that can damage lipid membranes,
proteins and DNA within the cell. They also serve to upregulate apoptotic pathways which
increases cellular death.

7
Ohlemiller et.al. (1999) probed hydroxyl radical levels in the cochlea and showed that
hydroxyl levels increase four fold after noise exposure. Hydroxyl radicals initiate lipid
peroxidation which damages cell membranes. Because of the damaging effects of free radicals,
many studies have been done researching the use of antioxidants to protect hearing. Ohinata et.
al. (2000) studied the effects of glutathione and found it reduced PTS. Other antioxidants
shown to reduce noise-induced hearing loss are salicylate, N-L-acetylcysteine, pravastatin, and
1-3-[2-(1-Benzothiophen-5-yl)ethoxy]propylazetidin-3-ol (T-817MA) (Kopke et. al. (2000); Park
et.al. (2012); Yamashita et. al. (2008). Dr. Kathleen Campbell at the Southern Illinois University
School of Medicine has studied the use of D-methionine as an otoprotective agent (Campbell
et.al. 2007). The noise generation system described here has been developed specifically for
her research needs. Other drugs, such as methylprednisolone, have been shown to reduce hair
cell loss (Sendowski 2006). Finally, while not an antioxidant; inducing hypoxia can also
potentiate PTS (Chen & Liu 2005).
Acoustic Review
Figure 2: A-duration wave (Chan, Ho, Kan & Stuhmiller, 2001)

8
There are three types of noise that are typically studied in relation to noise induced hearing loss.
They are impulse noise, Gaussian or white noise, and complex noise. Impulse noise consists of
short duration, high energy noises. They are characterized by an A-duration waveform with a
positive peak time of less than 200 ms (Johnston, 2012). The strength of impulse noise can
quickly cause acoustic trauma and permanent hearing loss. In fact, Rabinowitz (2000)
considered a single impulse of 140-179 dB to be equal in sound energy to forty hours of
exposure to continuous noise at 90 dB A-duration waves are used to represent the sound of
firearms when studying military hearing loss (Johnston, 2012). This wave can be represented by
the Friedlander equation, where PS is the peak pressure amplitude and t* is the time when the
wave crosses the x-axis.
P(t) = PSet/t*
(1 –t/t*)
Gaussian noise is a type of continuous noise based on a normal distribution curve. In
LabVIEW the set of random numbers is generated with µ=0 and an adjustable standard
deviation (Schlag, 2012). Gaussian noise can accurately be used to simulate continuous
environmental noise. Complex noise is simple combination of continuous and impulse noise. It
is difficult to simulate in a research environment without knowing the various individual
components.

9
Figure 3: Continuous Gaussian Noise waveform
Figure 3: Gaussian Probability density

10
Noise Generation System
National Instruments' LabVIEW was used to create a virtual instrument (VI) that
generates noise. The VI generates the signal, controls the signal's output and input, and
monitors the signal during noise exposure experiments. The generated signal is sent by
LabVIEW to an NI PCI-6251 multifunction data acquisition board. The data acquisition unit is
equipped with two analog output channels with 2.86 MS/s update rate and 16 bit resolutions
and sixteen analog input channels with sampling rate of 1.25 MS/s and 16 bit resolution. The
digital signal generated by LabVIEW is converted to analog by the data acquisition unit and sent
via output channel to a 750 Watt Yamaha 8Ω/Bridge P 2500 S power amplifier. This is a
commercially available amplifier which allows for easy duplication of the system without
needing to build all components in the lab. The amplifier's power bandwidth of 10 Hz - 40 KHz is
more than sufficient for various noise generation needs.
The compression driver chosen when initially building this system is the JBL 2446 H/J
compression driver. It has a 150 Watt power capacity on a continuous program and a frequency
range of 500 Hz-20 kHz. Because it is a commercial compression driver, it has exceptional
durability qualities which allow for transport and disassembling/reassembling the system as
needed. The compression driver is connected to a 2" diameter shock tub with 1/2" thick acrylic
walls. The system allows for varying lengths of shock tube to be used. At the end of the shock
tube was placed a JBL 2380A flat front horn to distribute the sound evenly without distortion.
The final component of the system is the monitoring microphone. For calibration
purposes a PCB 426B03 pressure field microphone was chosen because it can detect high
pressure short duration noises accurately. It is also sufficient to detect differences in highly

11
random continuous noise. This creates for a very precise and accurate picture of the signal at
the subject level of the system. For simple monitoring of long duration signals, an Audio-
Technica ATR-3350 omnidirectional lavaliere microphone was chosen. Because this microphone
is omnidirectional, it can be clipped to a subject cage in any orientation and still pick up the
signal. It is also inexpensive, which allows for easy replacement in case of animal related
damage. It is also not necessary to have a highly precise microphone for monitoring because
the purpose is to verify the continuity of the signal rather than any particular characteristic of
the signal.
Figure 5: System Schematic

12
The compression driver and horn are both mounted on acrylic plates measuring
12"x12"x1". These shock tube connects these two plates. Framing made of T-slotted aluminum
supports the acrylic plates as well as the subject cage. The corner posts are cut from 2"x2"
aluminum while the cross supports, upon which rest the acrylic plates and subject cage are
made of 1"x2" or 1"x1" aluminum. The entire frame is situated within a portable sound booth.
The monitoring microphone cord and the stereo wire connecting the compression driver to the
amplifier run through an access hole in the side of the booth. All other components are set up
Figure 4: Noise generation system assembled at the SIU School of
Medicine

13
on a wheeled cart, allowing the entire system to be moved without disassembling the
components.
Modification of a Gaussian Noise System
Schlag (2012) designed a Gaussian noise generation system compatible with physical
apparatus designed by Johnston (2012). Unfortunately, there were several issues that needed
to be corrected before the system could be installed at the SIU School of Medicine in Dr.
Kathleen Campbell’s lab. Schlag’s program was ideal for calibration but was cumbersome for
research use. The LabVIEW front panel interface was busy and confusing with eleven graphic
displays and numerous input options. While the system was intended for extended exposures
of six hours, the program ran into memory use issues and froze after two hours of continuous
operation. The input time was also faulty. The “run time” input did not refer to time but rather
to loop iterations in the programming. Because it takes the computer longer than one second
to run the loop once, entering a time of six hours did not result in a noise generation duration
of six hours. The final problem that needed to be resolved was the lack of a simple monitoring
system. The microphone used for calibration of the system is expensive and needs a signal
conditioner to properly relay the signal.
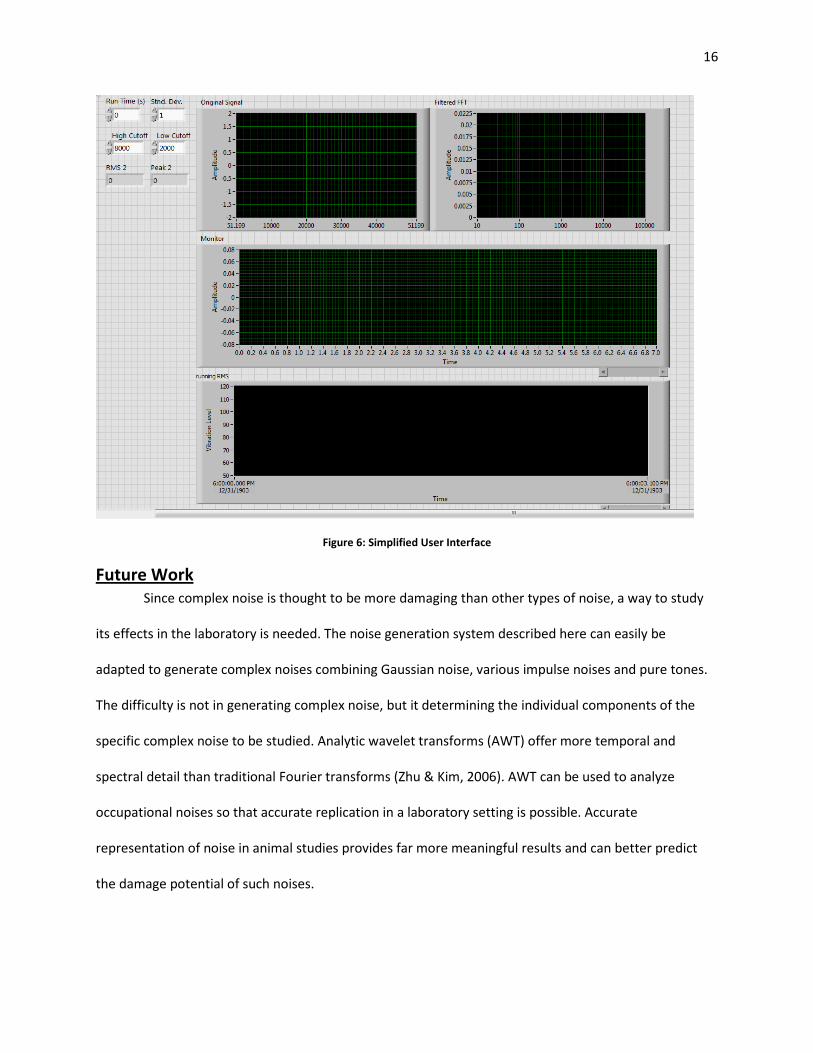
Resolving the busy user interface was as simple as removing unnecessary aspects of the
program. While these features were needed to determine proper programming regarding
frequency spectrum and octave band of the noise generated, once this information was known
the programming became superfluous. Researchers at the SIU School of Medicine needed only
a graph of the original signal, a graph of the fast Fourier transform of that signal, a graph

14
displaying the monitoring microphone’s signal, and a chart displaying the running root-mean-
square calculation of the signal averaged over one second intervals.
The original signal and the FFT were displayed for signal verification purposes. This way
researchers can see that the signal generated is indeed the desired signal. The running RMS
value is the square root of the arithmetic mean of the squares of the individual values. This
produced a non-zero average for a set of data that includes both positive and negative values. It
is valuable for rapidly fluctuating signals and allows researchers to verify the constancy of the
signal and determine how long, if at all, the signal was lost. The monitoring signal displays the
monitoring microphone’s waveform and demonstrates that the signal research subjects are
exposed to matches the profile of the original signal. As it turns out, the data acquisition unit
was unnecessary for the monitoring signal. Instead the microphone was plugged into the
computer and LabVIEW accessed the signal from the computer’s sound card. This removed the
need for a signal conditioner.
Memory problems were solved both by simplifying the program and by adjusting
sampling rates. While the program can continuously sample the signal it generates, this uses up
memory and causes errors in the program. Instead, a sampling rate of 52,600 samples per
second was chosen for the output signal. The computer’s sound card is restricted to 48,000
samples per second so that is the rate used for the monitoring signal. These sampling rates do
not overload the memory and still give researchers a complete picture of the noise generated
by the system.
The timing problems were actually simple to solve. A series of test runs were timed and
the information used to determine a divisor for the “run time” input. By timing the system

15
duration when values of 30, 60, 90, 120, 1800, 3600, and 21600 were entered into the “run
time” input a calibration curve could be generated. The slope of the linear regression was used
as the divisor. This way the value entered in seconds actually determines the number of
seconds the system will run. Unfortunately, the three computers tested all had slightly different
processing times, so the timing calibration must be carried out for each computer the program
is run on.
By solving these problems the Gaussian noise generation system was completed and
transported to Springfield, IL for use in live animal studies. Problems that initially seemed to be
complicated required only ingenuity and patience to solve. The result is an optimized
streamlined noise generation system.
Figure 5: user interface designed by Schlag (2012)
16
Figure 6: Simplified User Interface
Future Work
Since complex noise is thought to be more damaging than other types of noise, a way to study
its effects in the laboratory is needed. The noise generation system described here can easily be
adapted to generate complex noises combining Gaussian noise, various impulse noises and pure tones.
The difficulty is not in generating complex noise, but it determining the individual components of the
specific complex noise to be studied. Analytic wavelet transforms (AWT) offer more temporal and
spectral detail than traditional Fourier transforms (Zhu & Kim, 2006). AWT can be used to analyze
occupational noises so that accurate replication in a laboratory setting is possible. Accurate
representation of noise in animal studies provides far more meaningful results and can better predict
the damage potential of such noises.

17
Conclusion
Current hearing protective guidelines are based on the Equal Energy Hypothesis. Unfortunately
different types of noise produce different amounts of hearing loss even when the total sound energy is
the same. The Kurtosis statistic used in conjunction with sound energy level could provide a much better
system with which to evaluate the damaging potential of a noise. Using analytic wavelet transforms to
break complex noises into their various components could help researchers replicate complex noises to
determine the extent of hearing damaged caused by those noises.
Once the damage capability of a noise has been determined, various physical and chemical
methods to reduce permanent threshold shift can be developed. The optimized Gaussian noise
generation system described can be easily modified to produce complex noises of varying composition.

18
REFERENCES
Boron, W.F. & Boulpaep, E.L. (2009). Medical physiology, a cellular and molecular approach.
(2nd
ed., pp. 389-399). Philadelphia: W B Saunders Co.
Campbell, C.K., Meech, R.P., Klemens, J.J, M, G.T., Dyrstad, S.S., Larsen, D.L., Hughes, L.F. (2007)
Prevention of noise- and drug-induced hearing loss with d-methionine. Hearing
Research. 226 (1-2). 92-103.
Chan. P.C., Ho, K.H., Kan, K.K., & Stuhmiller, J.H. (2001). Evaluation of impulse noise criteria
using human volunteer data. Acoustical Society of America. 110(4), 1967-1997.
Crocker, M. J. (1998). Handbook of acoustics. Hoboken, NJ: Wiley-Interscience.
Danielson, R., Henderson, D., Gratton, M.A., Bianchi, L., Salvi, R. (1991). The importance of
“temporal pattern” in traumatic impulse noise exposures. Buffalo, NY: SUNY Buffalo.
Davis, R.I., Qiu, W., Hammernik, R.P. (2009). Role of the kurtosis statistic in evaluating complex
noise exposures for the protection of hearing. Ear and Hearing. 30 (5). 628-634.
Goley, G.S., Song, W.J., Kim, J.H. (2010). Kurtosis corrected sound pressure level as a noise
metric for risk assessment of occupational noises. Journal of the Acoustical Society of
America, 129 (3), 1475-1481.
Hammernik, R.P., Qiu, W., Davis, B. (2003). The effects of the amplitude distribution of equal
energy exposures on noise-induced hearing loss: the kurtosis metric. Journal of the
Acoustical Society of America, 114 (1), 386-395.
Johnston, A.M. (2012). Noise exposure system for noise induced hearing loss. (Master’s Thesis).
Available from ProQuest Dissertations and Theses database. (UMI No. 1514224)
Kopke, R.D., Weisskopf, P.A., Boone, J.L., Jackson, R.L., Wester, D.C., Hoffer, M.E., Lambert,
D.C., Charon, C.C., Ding, D.L., McBride, D. (2000). Reduction of noise-induced hearing
loss using L-NAC and salicylate in the chinchilla. Hearing Research. 149 (2000) 128-146.
Le Prell, C.G., Yamashita, D., Minami, S.B., Yamasoba, T., Miller, J.M., (2007). Mechanisms of
noise-induced hearing loss indicate multiple methods of prevention. Hearing Research.
226, 22-43.

19
Netter, F.H. (Artist). Pathway of Sound Reception [illustration], Retrieved June 21, 2013, from:
http://www.netterimages.com/image/4635.htm
Ohinata, Y., Yamasoba, T., Schacht, J., Miller, J.M. (2000). Glutathione limits noise-induced
hearing loss. Hearing Research. 146 (2000). 28-34.
Ohlemiller, K.K., Wright, J.S., Dugan, L.L., (1999). Early elevation of cochlear reactive oxygen
species following noise exposure. Audiol. Neurootol. 4, 229–236.
Park, J.S., Kim, S.W., Park, K., Choung, Y.H., Jou, I., Park, S.M. (2012). Pravastatin attenuates
noise-induced cochlear injury in mice. Neuroscience. 208 (2012) 123-132.
Pierson, L.L. (1996). Hazards of noise exposure on fetal hearing. Seminars in Perinatology. 20:1,
21-29.
Qiu. W, Hammernik, R.P., Davis, B. (2006). The kurtosis metric as an adjunct to energy in the
prediction of trauma from continuous, nonGuassian noise exposures. Journal of the
Acoustical Society of America, 120 (6), 3901-3906.
Rabinowitz, P. (2000). Noise-Induced Hearing Loss. Am Fam Physician, 61(9), 2749-2756.
Raichel, D. R. (2006). The science and applications of acoustics. New York, NY: Springer
Science+Business Media
Rosen, E.J. (2001). Noise induced hearing loss. Retrieved from University of Texas Medical
Branch website: http://www.utmb.edu/otoref/Grnds/Hear-Loss-Noise-000110/Hear-
Loss-Noise.htm
Schlag, A.W. (2012). Development and modification of a gaussian and non-gaussian noise
exposure system. (Master’s Thesis). Available from ProQuest Dissertations and Theses
database. (UMI No. 1533617)
Sendowski, I., Abaamrane, L., Raffin, F., Cros, A., Clarencon, D. (2006). Therapeutic eficacy of
intra-cochlear administration of methylprednisolone after acoustic trauma caused by
gunshot noise in guinea pigs. Hearing Research. 221 (2006). 119-127.
United States. Department of Labor. Occupational Safety and Health Administration. (2012).
Occupational Safety and Health Standards; Occupational Health and Environmental
Control; Occupational Noise Exposure. Standard 1910.95. Retrieved 21 June 2013 from

20
United States Department of Labor website:
http://www.osha.gov/pls/oshaweb/owadisp.show_document?p_table=standards&p_id
=9735
Yamashita, D., Shiotani, A., Kanzaki, S., Nakagawa, M., Ogawa, K. (2008). Neuroprotective
effects of T-817MA against noise-induced hearing loss. Neuroscience Research. 61
(2008). 38-42.
Zhao, Y., Qiu, W., Zeng., Chen, S., Cheng, X., Davis, R.I., Hammernik, R.P. (2010) Application of
the kurtosis statistic to the evaluation of the risk of hearing loss in workers exposed to
high-level complex noise. Ear and Hearing. 31 (4). 527-532.
Zhu, X., & Kim, J. (2006). Application of analytic wavelet transform to analysis of highly
impulsive noises. Journal of Sound and Vibration. 294(2006). 841-855

21
VITA
Graduate School
Southern Illinois University
Kelly Wepsiec
[email protected] (permanent email address after graduation)
Southern Illinois University Carbondale
Bachelor of Science, Physics, August 2005
Research Paper Title:
Modification and Optimization of a Gaussian Noise Generation System for the study
of Nosie-Induced Hearing Loss
Major Professor: Jun Qin