MODEST, SECURE AND INFORMED: … · of Southern California. Any opinions, findings, and conclusions...
39
NBER WORKING PAPER SERIES MODEST, SECURE AND INFORMED: SUCCESSFUL DEVELOPMENT IN CONFLICT ZONES Eli Berman Joseph Felter Jacob N. Shapiro Erin Troland Working Paper 18674 http://www.nber.org/papers/w18674 NATIONAL BUREAU OF ECONOMIC RESEARCH 1050 Massachusetts Avenue Cambridge, MA 02138 January 2013 We thank Morris Breitbart, Mathilde Emeriau and L. Choon Wang for outstanding research assistance and Aila Matanock for comments. Carrie Lee shared data on troop strength. We thank Michael Meese for discussion at the ASSA session “Economics of National Security.” Seminar participants provided helpful comments at the University of Warwick, the Department for International Development (London), LUISS University, the Einaudi Institute, IFPRI (Addis Ababa), UNOUA(Addis Ababa), Tel Aviv University, the Hebrew University (Jerusalem), and the University of Haifa. This material is based upon research supported by the Air Force Office of Scientific Research (AFOSR) under Award No. FA9550-09-1-0314, and the Department of Homeland Security (DHS) under award 2010ST-061-RE0001 through the Center for Risk and Economic Analysis of Terrorism Events (CREATE) at the University of Southern California. Any opinions, findings, and conclusions or recommendations expressed in this publication are those of the authors and do not necessarily reflect those of any institution or of the National Bureau of Economic Research. NBER working papers are circulated for discussion and comment purposes. They have not been peer- reviewed or been subject to the review by the NBER Board of Directors that accompanies official NBER publications. © 2013 by Eli Berman, Joseph Felter, Jacob N. Shapiro, and Erin Troland. All rights reserved. Short sections of text, not to exceed two paragraphs, may be quoted without explicit permission provided that full credit, including © notice, is given to the source.
Transcript of MODEST, SECURE AND INFORMED: … · of Southern California. Any opinions, findings, and conclusions...

NBER WORKING PAPER SERIES
MODEST, SECURE AND INFORMED:SUCCESSFUL DEVELOPMENT IN CONFLICT ZONES
Eli BermanJoseph Felter
Jacob N. ShapiroErin Troland
Working Paper 18674http://www.nber.org/papers/w18674
NATIONAL BUREAU OF ECONOMIC RESEARCH1050 Massachusetts Avenue
Cambridge, MA 02138January 2013
We thank Morris Breitbart, Mathilde Emeriau and L. Choon Wang for outstanding research assistanceand Aila Matanock for comments. Carrie Lee shared data on troop strength. We thank Michael Meesefor discussion at the ASSA session “Economics of National Security.” Seminar participants providedhelpful comments at the University of Warwick, the Department for International Development (London),LUISS University, the Einaudi Institute, IFPRI (Addis Ababa), UNOUA(Addis Ababa), Tel AvivUniversity, the Hebrew University (Jerusalem), and the University of Haifa. This material is basedupon research supported by the Air Force Office of Scientific Research (AFOSR) under Award No.FA9550-09-1-0314, and the Department of Homeland Security (DHS) under award 2010ST-061-RE0001through the Center for Risk and Economic Analysis of Terrorism Events (CREATE) at the Universityof Southern California. Any opinions, findings, and conclusions or recommendations expressed inthis publication are those of the authors and do not necessarily reflect those of any institution or ofthe National Bureau of Economic Research.
NBER working papers are circulated for discussion and comment purposes. They have not been peer-reviewed or been subject to the review by the NBER Board of Directors that accompanies officialNBER publications.
© 2013 by Eli Berman, Joseph Felter, Jacob N. Shapiro, and Erin Troland. All rights reserved. Shortsections of text, not to exceed two paragraphs, may be quoted without explicit permission providedthat full credit, including © notice, is given to the source.

Modest, Secure and Informed: Successful Development in Conflict ZonesEli Berman, Joseph Felter, Jacob N. Shapiro, and Erin TrolandNBER Working Paper No. 18674January 2013JEL No. F52,F63,F68,H41,H56,K42,N45,O1,O17,Z1,Z12
ABSTRACT
Most interpretations of prevalent counterinsurgency theory imply that increasing government serviceswill reduce rebel violence. Empirically, however, development programs and economic activity sometimesyield increased violence. Using new panel data on development spending in Iraq, we show that violencereducing effects of aid are greater when (a) projects are small, (b) troop strength is high, and (c) professionaldevelopment expertise is available. These findings are consistent with a "hearts and minds" model,which predicts that violence reduction will result when projects are secure, valued by community members,and implementation is conditional on the behavior of non-combatants.
Eli BermanDepartment of Economics, 508University of California, San Diego9500 Gilman DriveLa Jolla, CA 92093and [email protected]
Joseph FelterCISAC and Hoover InstitutionStanford UniversityEncina Hall, C222Stanford CA [email protected]
Jacob N. ShapiroWoodrow Wilson School of Public Policyand International AffairsPrinceton UniversityRobertson HallPrinceton, NJ [email protected]
Erin TrolandUniversity of CaliforniaSan Diego Department of Economics9500 Gilman Drive #0508La Jolla, CA [email protected]

1
Theeconomicanalysisofcivilwarsandinsurgencieshasbecomeatopicofgrowing
interestinboththeacademicandpolicycommunities(BlattmanandMiguel2010;
WorldDevelopmentReport2011).Accordingtothe2011WorldDevelopment
Report(WDR),abillionandahalfpeopleliveincountriesaffectedbyfragility,
conflictorviolence,thelastbeingaseriousimpedimenttolong‐runeconomic
development(WDR2011).2Inthosecontexts,developmentprogramsarenowoften
taskednotonlywithimprovinghumanwelfareandenablingdevelopment,butalso
withhelpinglocalgovernmentsstabilizeinsecureenvironments(Berrebiand
Olmstead2011).3
Mostinterpretationsofprevailingcounterinsurgencytheoryimplythat
increasingthequantityorqualityofgovernmentserviceswillreduceviolence(U.S.
Army2007).Yettheoppositeeffectisalsoplausible:increasedeconomicactivityin
poorlycontrolledspacesmightraisethereturnstopredatoryviolence,therefore
motivatingevenmoreviolence(Hirshleifer1989;Collier2000).Bothanecdotaland
empiricalevidencearemixed.Suddendropsinaidflowscorrelatewithincrease
violenceacrosscountries(Nielsenet.al.2011)andcertainkindsofaidappeartobe
violencereducing(Berman,Shapiro,andFelter2011,hereafterBSF).Yet,exogenous
increasesineconomicactivityhavealsobeenshowntoleadtoincreasedviolence
againstcivilians(VandenEynde2012,Bermanet.al.2012)andevendevelopment
programssometimesyieldincreasedviolence,eitherbycreatingrentstocaptureor
bydisturbingthedistributionofpowerwithincommunities(Crost,Felter,and
Johnston2012a).Theliteraturehassofarnotexploredthequestionofoptimal
developmentprogramdesignforviolence‐reduction.Asstablegovernments
2Thelinkbetweenpropertyrights,security,andlong‐rungrowthineconomicsdatesbacktoatleastthepioneeringworkofDouglassNorth(1981).Svensson(1998),forexample,extendedNorth’sworkbymodelingtheeffectsofpoliticalinstabilityonpropertyrightsand,inturn,oninvestmentrates.Gradstein(2004)arguesthattheenforcementofpropertyrightsandeconomicgrowthareself‐reinforcing.GuillaumontandChauvet(20037‐10,16)findthataideffectivenessdeclineswithpoliticalinstability.Buildingonthisandrelatedresearch,theWDRhasemphasizedthecrucialroleofimprovedgovernanceinsecuringpeopleandpropertyifgrowthistobeachieved(WDR2001,1).3Forinstance,USAID’stoptenbenefitingcountriesin2012(obligations)wereAfghanistan($2.2B),Pakistan(0.9B),Jordan(0.5B),Ethiopia(0.4B),Haiti,KenyaandIraq(0.3Beach),DRCongo,UgandaandTanzania(0.2Beach)(USAID,2013).

2
graduateoutoftheclassofcountriesrequiringdevelopmentassistance,an
increasingshareofaidwillpredictablybespentinfragilestates,includingconflict
andpost‐conflictzones,sothisgapinknowledgeisdeeplyproblematic.
InthispaperweusedetailednewdataondevelopmentspendinginIraqto
beginclosingthatgap.Usingpaneldataondevelopmentassistanceandviolent
incidentscoveringthefirstfiveyearsoftheIraqwar,wecomparetheeffectsofU.S.
governmentspendingacrossseveraldevelopmentprograms,eachwithdifferent
characteristics.Weareguidedbythepredictionsofaninformation‐centric,or
“heartsandminds”theoryofcounterinsurgencyinlookingforcharacteristicsof
effectivedevelopmentprogramdesign.Weestimateinfirstdifferencesallowingfor
variouscontrolstoaccountforendogeneityandselectionintheprovisionof
developmentassistance(BSF,FloresandNooruddin,2009).
Consistentwiththetheory’spredictions,wefindthattheviolencereducing
effectsofaidaregreaterwhen(a)individualprojectsaresmall,(b)troopstrengthis
high,and(c)professionaldevelopmentexpertiseisavailable.Controllingforthe
presenceofcombattroopsandProvincialReconstructionTeams(PRT),thesmall9‐
15personteamswhichprovideddevelopmentexpertisetomilitaryunitsinIraq,an
additional$50percapitainspendingonaidprojectsbymilitaryunitsthroughthe
Commander’sEmergencyResponseProgram(CERP)predictedaboutsixlessviolent
incidentper100,000residentsoverthecourseofahalf‐yearintheaveragedistrict,
whichisequivalenttothesamplemean,orapproximatelyhalfthesamplemedianin
districtswithongoingfighting.4ForsmallCERPprojects(<$50,000inproject
spending)thatviolence‐reducingeffectissixtimesstronger(i.e.,$8/capitato
reduceviolencebythesamplemean).Incontrast,mostotherdevelopment
assistanceprograms,includingthosewithlargeinfrastructureprojects,showno
evidenceofviolence‐reduction,withtheexceptionofUSAID’ssmall‐scale
CommunityStabilizationProgram(CSP).
Aspredictedbythetheory,smallscalespendingandforcelevelscomplement
eachother;foreveryadditionalmaneuverbattalion(approx.800soldiers)present4Theseareobservations(i.e.,districts/half‐years)withnonzeromeasuredviolence.

3
inadistricttheviolence‐reducingeffectofsmallCERPprojectsisroughlydoubled.
Developmentexpertisealsocomplementstheviolence‐reducingeffectofsome
developmentprograms.ThepresenceofaPRTamplifiesviolencereductionofCERP
andCSPspendingbybetween50and200percent,dependingontheprogram.
Ourfindingsshouldbeusefulinthedesignofdevelopmentprogramsin
conflictandpost‐conflictenvironmentsandmayextendtofragilestatesingeneral,
whereassistancemaybecaptured,extorted,ordestroyed.
I.Theory:ComplementarityofServiceProvisionandSecurityinCounterinsurgencyThissectionexploreswhataninformation‐centricmodelofcounterinsurgency
impliesaboutthecomplementaritybetweenpublicserviceprovisionandsecurity
provisioningeneratingstability.Thatcomplementarityisintuitive:government
servicesshouldbeofmorevalueinasecureenvironmentandsecuritywillbeeasier
toprovideifthelocalpopulationgivesinformationtosecurityforces,whichismore
likelyifthegovernmentprovidesbasicservices.Toillustratehowthe
complementarityemergeswebuildonthethree‐sidedgamebetweengovernment,
rebels,andacommunity,presentedinBSF.Wefirststatetheassumptionsand
equilibrium,referringtotheoriginalformotivationandproofs,andthendevelop
theresultsoncomplementarity.
A.Assumptions
1.PlayersandActions
Thegovernment,G,seekstoreduceviolencethroughcounterinsurgencyeffortand
serviceprovision.Arebelgroup,R,seekstoimposecostsongovernmentby
attackingit.Autilitymaximizingcommunity,C,canhelpdelivercontrolofterritory
togovernmentbyanonymouslysharinginformationaboutrebels.
2.SequenceofPlay
InformationsharingbythecommunityrequiresnopreparationsoweassumethatC
moveslast.Playproceedsinfourstages.

4
(1)Naturedrawscommunitynormsfavoringrebelcontroloftheirterritory,
n,fromauniformdistributionU[nL,nU];nisprivatetoC.
(2)Gchoosesalevelofpublicgoodstoprovide,g,andalevelof
counterinsurgencyeffort,m.Rsimultaneouslychoosesalevelofviolence,v,
toattemptagainstG.(AssumenLandnUspanenoughofthereallinetoallow
nL≤v+g≤nU.)
(3)Cdecideshowmuchinformation,i,tosharewithG,havingobservedthe
actionsofGandR.
(4)Uncertaintyregardingcontrolofterritory,a,isresolved,andpayoffs
occur.
3.Technologyofcontrol
Controlofterritoryisabinarystate.Thevariable,a,isoneifthegovernment
controlstheterritory,andzeroiftheterritoryiscontrolledbyrebels.The
probabilityofgovernmentcontrolis
P(a=1)=h(m)i,
wheremiscounterinsurgencyeffortbyG,(m≥0),h(m):R+→[0,1]isa
monotonicallyincreasing,concavecontestsuccessfunction,withh(0)=0andh→1
asm→∞.HereiisthelevelofinformationthatCchoosestosharewithG,(1≥i≥0).
(Allvariablesarerealnumbersunlessotherwisespecified.)
4.Payoffs
Community:Communityutilityisgivenby
UC(a,g,n,v)=u(c+g–n)a+u(c–v)(1‐a).
Ifa=1(governmentcontrol)thenthecommunityconsumesc≥0,andbenefitsfrom
governmentservices,g≥0,soitattainsutilityUC=u(c+g–n),whereu(.)is
continuouslydifferentiableandmonotonicallyincreasing.Servicesarelocalpublic
goodssuchaspolicing,disputeresolution,education,healthclinics,utilities,and
infrastructure.Communitynorms,n,generatedisutilitywhengovernmentisin
control.

5
Alternatively,ifa=0,rebelsmaysuccessfullycarryoutviolence,v≥0,against
governmenttargets.InthatcasecommunitymemberswillattainutilityUC=u(c–v).
Rebelviolence,v,isnotdirectedagainstcommunitymembersperse,butweassume
thattheysufferfromitnonetheless,becausetheyareaccidentallyaffectedby
crossfire,empathizewithgovernmentemployees,orvaluegovernmenttargets.In
thecaseofrebelcontrolthecommunitydoesnotbenefitatallfromgovernment
services,g,eitherbecausethegovernmentwithdrawsserviceswhenitcannot
protectitsemployeesandcontractors,orbecauseitconditionslocalpublicgood
provisiononcontrol,ascollectivepunishment.Conditionalitywouldbeunusualfora
socialwelfaremaximizinggovernmentbutisU.S.militarypolicyinadministering
CERP(U.S.Army,2006).SurveyevidencerevealsthatamajorityofCERP
implementersinAfghanistanpracticeconditionality.5Thisassumptionisclearly
extreme;itcannotfullyapplytoalltypesofservices,suchasroadswhichcannotbe
easilywithdrawn.Itcouldfullyapplytoservicessuchaspolicingandjustice,and
mightwellpartiallyapplytoservicessuchashealthandeducation.Wediscussthe
implicationsofrelaxingconditionalitybelow.
IncorporatingtheuncertaintythatCfacesabouta,C’sexpectedpayoffis
(1) EUC(g,v,n,p)n=u(c+g–n)h(m)i+u(c–v)(1‐h(m)i).
Rebels:Rebelsuseviolencetoimposecostsongovernment,eitherinanattemptto
extractconcessions,orinanefforttooverthrowthegovernmentaltogether(Tilly,
1978).IntheIraqicontexttheseattackswouldbemostlyimprovisedexplosive
device(IED)anddirectfireattacksagainstIraqigovernmentorCoalitionforces.Let
G’scostofrebelviolencebe
A(v)(1‐a),whichaccountsforthedamagecausedbyanattack.R’sbenefitfrom
violenceisthenUR=A(v))(1‐a),whereweassumethatA(0)=0andthatAisan
increasing,concavefunction.Rebels’costofviolenceisB(v),whichisincreasingand
convex.(Henceforth,allfunctionsareassumedtobetwicecontinuously
differentiable.)SoR’sexpectedpayoffis
5SeeBSFfordetails.

6
(2) EUR(v,a)=E[A(v)(1‐a)–B(v)]=A(v)(1‐p)–B(v),
wherep≡h(m)E(i).
Notethatp=P(a=1)forrebels,forwhomiisarandomvariable.
Government:Thegovernmentbearsthecostsofviolenceaswellasthecostsof
violencemitigation(counterinsurgency),m,andofserviceprovision,g,andgets
expectedutility
(3) ECG(v,m,g,a)=E[A(v)(1‐a)+D(m)+H(g)]=A(v)(1‐p)+D(m)+H(g).
WeassumethatD(0)=H(0)=0,thatcostfunctionsD(.)andH(.)aremonotonically
increasing,andthatA(nU)>D'(0),sothatthefixedcostsofmareneversohighthat
communitiesmaximallypredisposedtonotshareinformationarenevercost
effectiveforGtoengage.
B.Equilibrium
WefocusonsubgameperfectNashequilibriuminpurestrategies,solvingby
backwardsinduction,startingwiththecommunity(step#3).
Community:Thecommunitychoosesiontheclosedinterval[0,1]tomaximize,
max EUC(i,g,n,v,m)n=u(c+g–n)p(m,i)+u(c–v)(1‐p(m,i)).
Anticipatingresultsoncomplementarity,notethatsincetheprobabilityofcontrolis
proportionaltoinformationshared,publicgoodprovisionandinformationare
complements,asarecounterinsurgencyeffortandinformation.SinceCchoosesi
=h(m),so
0≥ u(c+g–n)h(m)‐u(c–v)h(m),
whichimpliesthateitherm=0orthatthebestresponsefunctionofthecommunity
is
4 ∗ 0ifu u ↔ 1ifu u ↔
.
Consumptionisneutral;itoccurswhetherinformationissharedornot.Norms
favoringrebelcontrolreduceincentivestoprovidei.

7
Recallingourdiscussionofconditionality,wecannowseewhyitmatters.
HigherginducesCtoshareinformationin(4).Intheabsenceofconditionalityg
wouldbeenjoyedunderbothgovernmentandrebelcontrol,andwouldprovideno
incentiveforinformationsharing(i.e., ∗ 1 ↔ ).Sointheabsenceof
conditionality,gwillhavenoeffectoninformation‐sharing,andthereforenorolein
themodel.Inthecontextofthemodel’sassumptions,then,anyestimatedeffectswe
findofgareevidenceofconditionality.
Definep*≡p(i*,m),theprobabilityofgovernmentcontrolanticipating
optimalinformationsharingbythecommunity.Ifm>0thenE(i*)=P(i*=1)=P(n<
g+v)=F(g+v)=(g+v‐nL)f,wheref= ,thedensityoftheuniformdistribution,
sothat
(5) p*=(g+v‐nL)fh(m)ifm>0,p*=0ifm=0
Government:Continuingbackwardsthroughthesequenceofplay,thegovernment
anticipates(4)andsolves
min,
ECG(v,m,g,p*)=A(v)[1‐p*]+D(m)+H(g).
G’sfirstorderconditionformis0≤ ‐A(v)(g+v‐nL)fh'(m)+D'(m).Underthe
mildassumptionthatA(nU)>D'(0)m=0cannotbeaNashequilibrium,which
simplifiestheanalysisasitimpliesthatp*>0in(5).SeeBSFforproof.
Turningtoasolutionform*, ‐A(v)(g+v‐nL)fh''(m)+D''(m)>0,so
mhasauniqueinteriorsolutionforsomem*>0,givenvandg,definingabest
responsefunctionm*(v,g).
Thegovernmentalsochoosesalevelofservices,g*,thatsolvesthefirstorder
condition0≤ ‐A(v)fh(m)+H'(g). H''(g)>0,whichensuresa
uniqueinteriorsolutionatsomeg*>0,definingabestresponsefunctiong*(v,m).
SolvingcrosspartialsandinvokingtheimplicitfunctiontheoremBSFshow
thatbestresponsefunctionsareupwardslopinginviolence:∗ >0,and
∗ >0.

8
Rebels:Rebelssimultaneouslychoosealevelofviolencetomaximizeexpected
violencecostsimposedongovernment,anticipatingoptimalbehaviorofC,asin(4).
max EUR(v,g,m,p*)=A(v)[1‐p*]–B(v).
Solvingthefirstorderconditionforv,0≥ A'(v)[1‐p*]–A(v)fh(m)–B'(v).
Thesecondordercondition, A''(v)[1‐p*]–2A'(v)fh(m)‐B''(v)<0,sothat
v*isauniquemaximum,givengandv,thusthefirstorderconditiondefinesR’sbest
responsefunctionv*(g,m).
R’schoiceofviolenceisdecreasinging.( =‐A'(v)fh(m)<0,
whichimpliesthat∗ <0bytheimplicitfunctiontheorem.)BSFconfirmthat
partialequilibriumpredictionempirically,aresultthatwewillrevisitbelow.R’s
choiceofviolencealsodecreasesinm,(since∗ <0,since =‐A'(v)(
g+v‐nL)fh'(m)‐A(v)fh'(m)<0).
Existence:Assemblingresults,wehaveaclosedformsolutionforoptimal
informationsharingbyCinstage#3,andthreeequationsinthreeunknownsthat
determinebestresponsefunctionsm*(v,g)andg*(v,m)forG,andv*(g,m)forRin
stage#2:
4 ∗ 0ifu u ↔ 1ifu u ↔
;
(5) 0= ‐A(v)(g+v‐nL)fh'(m)+D'(m*),
0= ‐A(v)f+H'(g*),and
0= A'(v*)[1‐p*]–A(v*)fh(m)–B'(v).
Inthegeneralcasewecannotsolveforclosedformsolutionsform*,g*andv*,but
theconcavityofEURandtheconvexityofECGensureexistenceofauniqueNash
equilibrium(i,v,c,g).6
6SeeMas‐Colleletal,proposition8.D.3.
9
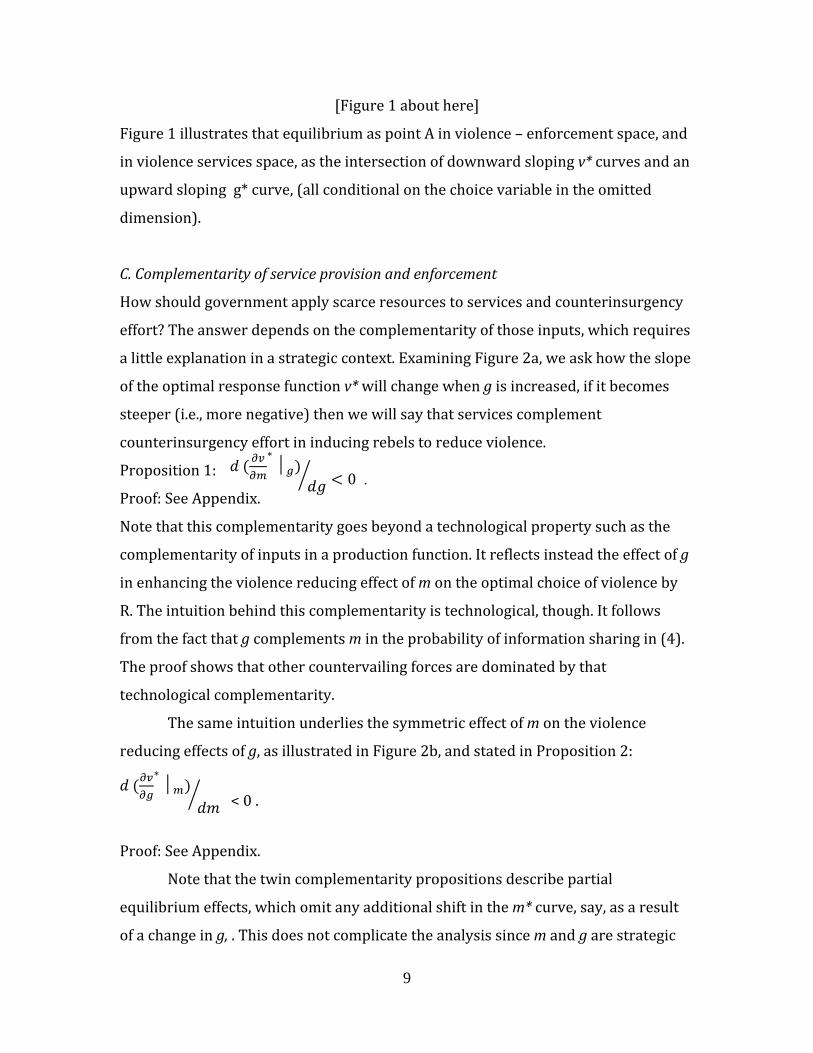
[Figure1abouthere]
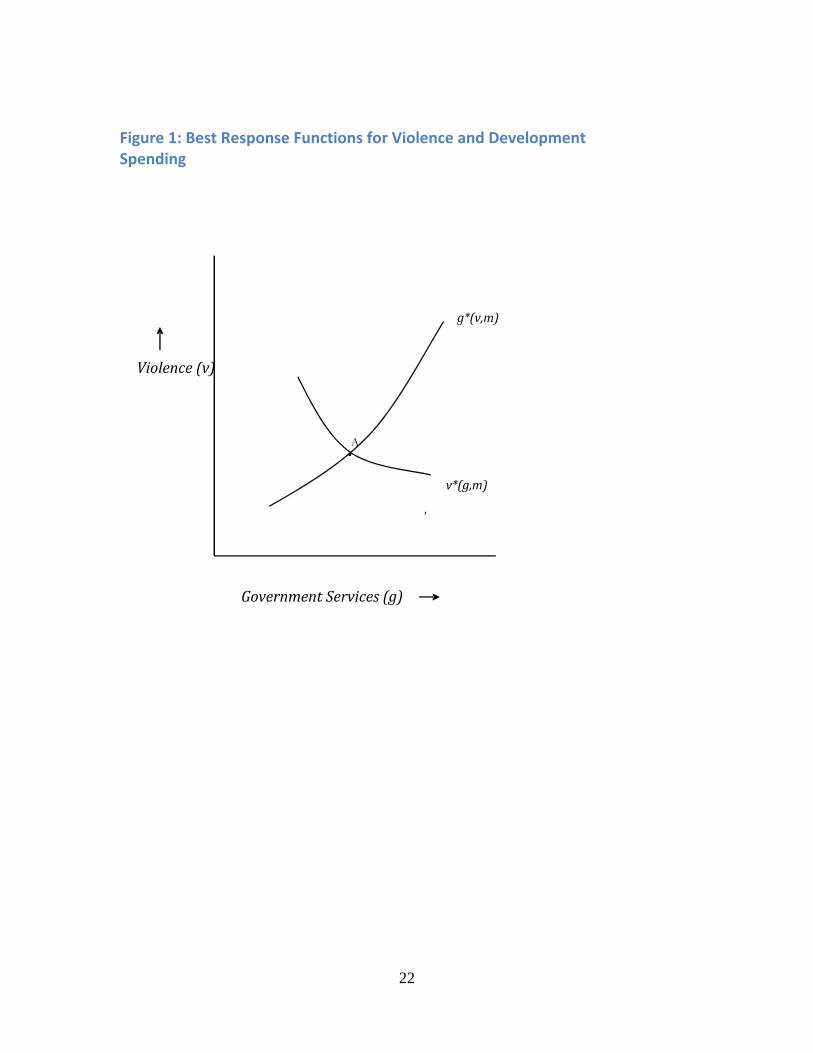
Figure1illustratesthatequilibriumaspointAinviolence–enforcementspace,and
inviolenceservicesspace,astheintersectionofdownwardslopingv*curvesandan
upwardslopingg*curve,(allconditionalonthechoicevariableintheomitted
dimension).
C.Complementarityofserviceprovisionandenforcement
Howshouldgovernmentapplyscarceresourcestoservicesandcounterinsurgency
effort?Theanswerdependsonthecomplementarityofthoseinputs,whichrequires
alittleexplanationinastrategiccontext.ExaminingFigure2a,weaskhowtheslope
oftheoptimalresponsefunctionv*willchangewhengisincreased,ifitbecomes
steeper(i.e.,morenegative)thenwewillsaythatservicescomplement
counterinsurgencyeffortininducingrebelstoreduceviolence.
Proposition1:
Proof:SeeAppendix.
Notethatthiscomplementaritygoesbeyondatechnologicalpropertysuchasthe
complementarityofinputsinaproductionfunction.Itreflectsinsteadtheeffectofg
inenhancingtheviolencereducingeffectofmontheoptimalchoiceofviolenceby
R.Theintuitionbehindthiscomplementarityistechnological,though.Itfollows
fromthefactthatgcomplementsmintheprobabilityofinformationsharingin(4).
Theproofshowsthatothercountervailingforcesaredominatedbythat
technologicalcomplementarity.
Thesameintuitionunderliesthesymmetriceffectofmontheviolence
reducingeffectsofg,asillustratedinFigure2b,andstatedinProposition2:
∗
<0.
Proof:SeeAppendix.
Notethatthetwincomplementaritypropositionsdescribepartial
equilibriumeffects,whichomitanyadditionalshiftinthem*curve,say,asaresult
ofachangeing,.Thisdoesnotcomplicatetheanalysissincemandgarestrategic
∗
0 .

10
complements(inthegovernment’scostminimization).Thus,thegeneral
equilibriumeffectofanexogenousincreaseingisafurtherreductioninviolence,v,
duetotheinducedincreaseinm,andthesameistrueofanexogenousincreasein
m.
Returningtothequestionofoptimalallocationofresourcesforgovernment,
theproblemisanalogoustothatofaproductionpossibilitycurve,inwhichthe
violentstrategicresponseofrebelsisconsiderednegativeproduct.Ifwerecastthe
government’sproblemasmaximizingstability(negativeviolence)atminimalcost,
Figure3reflectstheiroptimumatpointA.Complementarityimpliesthatthe
productionpossibilitycurveisconcavetotheorigin:neitherenforcementnorservice
provisionwouldeveroptimallybeprovidedalone,butalwaystogether.7
Thisresultisquitegeneral.Alessrestrictivesocialwelfarefunctionmight
includedirectutilityfromserviceprovisionandutility(ordisutility)from
enforcement,whichwouldgeneralizeourlinearindifferencecurveinFigure3by
addingsomecurvature.Graphically,aslongasthatcurveisnottooconcavetothe
origin(diminishingreturnswouldimplyconvexity)thebasicresultholds:
enforcementandserviceprovisionshouldalwaysoptimallyappearincombination.
InsectionIIIbelow,wejointlytestthosetwopropositionsusingdataon
troopstrengthanddevelopmentspendingduringtheIraqwar.
II.DataandInstitutionsDevelopmentassistancewasprovidedbyanunusuallywiderangeofU.S.
governmentactorsinIraq,mostofwhoseactivitiesarecapturedinourdata.We
measureaidspendingusingdatafromtheU.S.ArmyCorpsofEngineersGulfRegion
Division’sIraqReconstructionManagementSystem(IRMS).Theseunclassifieddata
includethestartdate,enddate,projectdescription,fundingsource,andamount
spentfor62,966aidprojectsprojectsawardedthroughDecember2008.They
includeapproximately$23billioninaidprojectsfundedunderavarietyof
7Giventheprincipleofcomplementarity,theoptimalratioofenforcementandserviceprovisionwillreflectlocalconditions,varyingacrosstimeandspace.

11
programs,includinglarge‐scalereconstructionspendingthroughDODadministered
programssuchastheCERP,theIraqReliefandReconstructionFund(IRRF),and
variousStateDepartmentprogramsincludingUSAIDactivitiesfundedthroughthe
EconomicSupportFund(ESF).8
TheU.S.militaryallocatedroughly$3BinaidthroughitsCERPprogram.
CERPfundswereallocatedinsmallamounts,mostlybyunitsatthebrigadelevel
(approx.3,000soldiers)andbelow,withoutlayersofsubcontractingthatmadethe
relationshipbetweendollarsspentandworkdonetenuousforotherreconstruction
spendingprogramsinIraq.CERPspendingwasdesignedtoworklikeginour
model,byprovidingmilitarycommanderswithresourcestoengageinsmall‐scale
projectstomeettheneedsoflocalcommunities,withtheaimofgarneringthe
population’ssupportandcooperation.Inpractice,CERPfundswereusedtofunda
broadrangeofprojects,fromsalarypaymentstomajorinfrastructureprojects,
thoughthemajoritywenttosmall‐scalelocalpublicgoods.Incontrast,non‐CERP
projectswereoftenquitelarge,withatypicalprojectbeinginfrastructureforwater
andsanitation,ortransportation.9
BesidesDOD,theU.S.AgencyforInternationalDevelopment(USAID)also
providedsmall‐scaleaidfundsinIraq,throughtwomainprograms,the$560M
CommunityActionProgram(CAP)andthe$644MCommunityStabilization
Program(CSP).CAPranfromMay2003throughMarch2010andfacilitatedthe
creationandtrainingoflocalcommunitygroupswhichthenidentifiedsmall
infrastructureprojectssuchascreatingpotablewaterstoragetanks,wastewater
andirrigationsystems,andsmallconstructionprojects,averagingapproximately
$101kinspendingover91days.Thetheorybehindtheprogramwasthat
communitieswithweakcivicinstitutionsweremorevulnerabletoinsurgent
influenceandlessabletodemandtheservicestheyneededfromthegovernment.
CSPranfromMay2006throughAugust2009andfocusedonfundingjobcreation
throughtrainingandsmallinfrastructureprojectsinkeycities,withtheaverage
projectcosting$77k,andlasting238days.Importantly,CSPcontractorstriedto8SeeBSFforfulldetails.9Formoreinformationondatasources,seeBSF.

12
brandtheirprojectsasbeingconductedbythelocalgovernment,notbyUSAIDor
theforeignNGOthatimplementedtheprogram.Whilenotexplicitlytiedtothe
militarycampaign,aswasCERP,CAPandCSPrepresentedthecivilian‐administered
programsmostlikeCERPintermsofprojectsizeandduration.
Ourkeydependentvariableistheintensityofinsurgentactivitymeasuredas
therateofattackspercapitaagainstCoalitionandIraqigovernmentforces.The
attackdataisbasedon‘significantactivity’(SIGACT)reportsbyCoalitionforcesthat
captureawidevarietyofinformationabout“…executedenemyattackstargeted
againstcoalition,IraqiSecurityForces(ISF),civilians,Iraqiinfrastructureand
governmentorganizations.”10Thesedataprovidethelocationanddateofattack
incidentsbetweenFebruary2004andFebruary2009.
WehavedataonforcelevelsfromtheLee(2011)OrderofBattleDataset,
whichidentifiesthenumberofmaneuverbattalions(a.k.a.forcesthatare
responsiblefordefinedphysicalterritory)presentinadistrictforeachmonthfrom
February2004throughDecember2008.Lee’sdatawerecompiledusingpress
reportsandaredescribedindetailinLee(2012).ForceallocationdecisionsinIraq
weredrivenbyacombinationofstrategicimperativesandpracticalconstraints.At
thestrategiclevelcommandersmovedbattalionsforanumberofreasons,including
removingthemfromareasdeemedtobepacified.Forinstance,afterthelarge3rd
ArmoredCavalryRegiment(approx.4,700soldiers)reducedtheviolenceinTalAfar
fromspring‐2005throughspring‐2006itwasreplacedbyacavalrysquadron
(approx.800soldiers).Alternatively,battalionsweremovedtoareasdeemedtobe
morestrategicallyvital,aswhentheadditionalforcessenttoIraqaspartofthe
2007SurgeweredeployedinBaghdadandneighboringdistricts.Tounderstandthe
possibleendogeneityofforcelevelsinaparticulardistrictxhalfyear,it’simportant
tonoteorganizationalconstraints.Whiletherewassurelyanintentiontoallocate
battalionsdynamicallytotheareaofgreatestneed,thecombinationoftroop
rotationschedules,andanorganizationalinterestinmaintainingunitcohesionand
10GAO(2007),DOD(2008).TheinformationprovidedintheUnclassifiedSIGACTdataarelimitedtothefactofandtypeofterrorist/insurgentattacks(includingIED's)andtheestimateddateandlocationtheyoccurred.SeeBSFforfulldetails.

13
developinglocalknowledgeamongdeployedbattalionswouldtightlyconstraina
commanders’abilitytoreallocatetroopsingroupsoflessthanabout800.Thus,in
thecontextofourmodelthemarginalcostofadditionalmtoadistrictwasquite
high.
ProvincialReconstructionTeamlocationsarecodedusinginformation
gatheredfromasetofmapsprovidedbytheStateDepartmentPRToffice.USPRTs
werefirstestablishedinlate2005,andthatnumberrosetotwentybythesecond
halfof2008,eachinaseparatedistrict.WedonotcountPRTsofotherCoalition
forces,assumingthattheywouldbelessrelevantforUSdevelopmentprogram
spending.
AppendixTable1providesdescriptivestatistics.
III.ResultsOurempiricalstrategyisastraightforwardfirst‐differencesdesigninwhichwe
regresschangesonconflictonchangesinvariouskindsofaidspending,controlling
forlaggedchangesinviolenceandchangesinCoalitionforcelevels.
Ourbasicestimatingequationis:
, , , , , , , , , ,
where , isthenumberofinsurgentattacks(incidents)indistrictiinperiodt, ,
istheamountofdevelopmentspendingofagiventype, isayearfixedeffectto
accountforthebroadseculartrendsinthewar,and , capturesthenumberof
maneuverbattalionsindistrictiinperiodt.Thelaggedchangeinviolence, , ,is
includedtoaccountforshortterm,district‐specifictrends.Sincebroadtrendsin
violencedifferedforSunniareas,wealsoincludeaseparateyearfixedeffect
interactedwiththeproportionofSunnivoters.11
Ourempiricalstrategywillidentifythecausalimpactofchangesinaid
spendingifeithertheomittedvariableslinkingaidspendingtoinsurgentviolence
areentirelyafunctionofunit‐specifictrendsoriftheirinfluenceonaidspendingis
accountedforbypastchangesinviolenceandchangesintrooplevels.Themajor
11SeeBSF(2011)foramoredetaileddiscussion.

14
challengeisthepossibilityofapositiveendogeneitybiasif,conditionalontrends
andothercontrols,increasesinresidualviolenceareanticipatedandrespondedto
byapplicationofmoregorm,inahalf‐yearinterval.Thatwouldcauseour
estimatestounderstatetheviolence‐reducingeffectsofbothgandm.Thelogistic
constraintsandlagsbuiltintotheallocationandimplementationofboth
developmentspendingandeffectivepatrolstoadistrictmakethattypeofrapid
response(withinahalf‐year)difficultbutnotimpossible.Forthatreasonwetried
specificationswithvariouscontrolstoinvestigaterobustness.
Table1describesourfirstsetofresults,showingthatsmallscale
reconstructionspendingisviolencereducingonaverage( <0)butothertypesof
reconstructionspendingareoftennot.Column(1)replicatesthemainempirical
resultofBSF,thatCERPisviolence‐reducing.Column(2)demonstratesthatthe
CERPcoefficientisrobusttoincludingtroopstrength(m)ontherighthandside,
whichBSFdidnot,indicatingthatviolence‐reductionisnotduetoCERPspending
actingasaproxyforthepresenceofcoerciveforce,m.Notethatthecoefficienton
troopstrengthdoesnotindicateviolencereduction–ifanythingthepositive
coefficientoncontemporaneoustroopstrengthindicatesthattroopsincrease
violence,whichisinconsistentwiththepredictionsofourtheory.Wedon’tthink
thatthisfindingoverturnsthevalidityofthetheoryfortworeasons:First,the
incidentdataarereportedbythetroopsthemselves,sothatthereisabuiltin
upwardbiasinlocationswhichhavetroopspresent.Second,thereappearstobea
shorttermincreaseinviolenceonarrivalwhichfadesafterabouthalfayear,which
wesuspectisduetoashorttermlearningprocessinwhichnewtroopsareinitially
challengedbyinsurgents,whothenwithdrawasthetroopsdevelopsituational
awarenessintheirareaofoperations.Thesumofthecoefficienton
contemporaneoustroopstrengthandthatonthelagisalmostalwaysstatistically
zero,andwillbenegativeinsomeofthespecificationsreportedbelow.Thus,once
theupwardreportingbiasisaccountedfor,andallowingforapositiveendogeneity
bias–asdescribedabove,thecumulativeeffectoftroopstrengthappearstobe
violencereduction(byanunknownamount)afteraboutsixmonths.(Includinga

15
third–oneyear—lagoftroopstrengthdoesnotsubstantivelyalteranyofthose
conclusions.)
Returningtoourdiscussionofdevelopmentspending,columns(3)and(4)
replicateanothermainresultofBSF,thatsmallCERPissixtimesasviolence‐
reducingperdollarspentthanislargeCERP,anddemonstratethatthoseresultsare
alsorobusttotheinclusionoftroopstrength.Theremainingcolumnsreportthe
effectofotherprograms,showingthatonlyoneofthem,theCommunity
StabilizationProgram(CSP),showsevidenceofbeingviolence‐reducing.Neither
changesinlargenon‐CERPreconstructionproject,changesinsmallnon‐CERP
reconstructionprojects,changesinUSAIDspendingthroughtheCAPprogram,nor
changesinoverallUSAIDspendingaresignificantlycorrelatedwithchangesin
insurgentattacks.Whilenoneofthoseprograms(non‐CERPlargeorsmall,CAPor
USAIDspendingingeneral)showeffectsthatarestatisticallydifferentfromzero,
withtheexceptionofCSP,theyareallstatisticallylessviolence‐reducingthanis
smallCERP(atα=.05),includinglarge‐CERP(asreportedinthefinalrowofTable
1).
WhyareCERPandCSPviolence‐reducingwhileotherprogramsarenot,and
whyissmallCERPespeciallyso?Firstly,it’sworthnotingthatthiscontrastreflects
thelargerliterature,inwhicheconomicactivity,andevenaidprograms,are
sometimesassociatedwithincreasedviolence(i.e.,predation,asBermanetal2012
findinthePhilippines,forexample)andsometimeswithdecreasedviolence,asthe
theoryinsectionIIpredicts.Recallingthedrivingforcesofthattheory:programs
mustbeconductedinterritorysecureenoughtobeimplementable,theirdesign
mustbesufficientlyinformedaboutlocalpreferencestobenefitthelocal
community;andtheymustbeconditionaloncooperation(i.e.,informationsharing).
ThosecriteriaareconsistentwiththepatternofresultsinTable1.CERPprograms
areunusualinthattheyaresecurebydesign,astheyareadministeredbymilitary
unitsoperatinginthearea.SmallerprogramssuchasCSP,CAPandCERPtendtobe
betterinformed,becausetheyaremorelikelydesignedinconsultationwiththe
localcommunity.Andsmallerprogramsaremoreeasilyconditionedonthe
cooperationofcommunities,incontrasttolargeinfrastructureprojects(suchas

16
buildingawaterorseweragesystem)whichcannoteasilyberevoked.Moreover,
surveyevidencefromAfghanistanrevealsthatCERPwasgenerallyimplemented
conditionally(seeBSF,footnote11),incontrasttohowadevelopmentagencysuch
asUSAIDwouldtypicallyimplementprograms,inaccordancewithadevelopment
objectiveratherthanasecurityobjective.
HavingdiscussedhowthosecriteriacanrationalizetheresultsinTable1,we
turnnowtotestingtheimplicationsofthattheory.Weexaminewhethersecurity
anddevelopmentexpertisecomplementprogramsforwhichwehaveevidenceof
effectivenessfromTable1,namelyCERPandCSP.
Table2teststhehypothesisthatsecurityanddevelopmentarecomplements,
atthedistrictlevel.Recallthattheseareactuallytwoconceptuallydistinct
hypotheses(Propositions1and2),sinceinthecontextofmodelcomplementarity
neednotbesymmetric.Notwithstandingthatsubtlety,wecantestthesehypotheses
onlyjointly,byestimatingthecoefficientγontheinteractionofmandginthe
followingestimatingequation.
, , , , , , , ,
, , , , , .
Shouldbothpropositionsholdthenγ1willbenegative.
Beforeturningtoresults,anissueofmeasurementrequiresattention.The
modelprovidesnoguidanceastohowmshouldbemeasured(anddoctrineisalso
unclear).Whatweseekisthecapacityofthegovernmenttoapplycoerciveforcein
ordertosuppressrebelactivity.Untilnowwe’vemeasuredtroopstrengthin
battalionsperdistrict,whichwouldbeanadequateapproximationiftroopsper
physicalareawereappropriate,followingthelogicoftheresponsetimetoatipor
incidentbeingcritical.Alternatively,troopspercapitawouldbeagood
approximationoftheabilityofthegovernmenttopoliceandprotectindividuals.In
Table2wereportresultsusingbothapproaches.12
12TheresultsinTables1and3arequalitativelyrobusttoreplacingbattalionsperdistrictwithbattalionspercapita,asreportedinAppendixTables2and3.

17
TheleftpanelofTable2reportsbothmainandinteractioneffectsof
spendingonsmallCERP,largeCERPandCSP(columns(1),(2)and(3)).As
predictedbythecomplementaritypropositions,theestimatedinteractiontermis
negativeineachcase.Allthreecoefficientsarepreciselyenoughestimatedtoreject
thehypothesisofazerocoefficientinfavorofthealternativeofcomplementarity.
Therightpanelchecksrobustnesstomeasuringtroopstrengthinbattalionsper
capita(asopposedtoperdistrict),againforeachofthethreeprograms.The
evidenceforcomplementarityinthiscaseisweaker,butconsistentwiththe
previousresults:twoofthethreecoefficientsarenegative,andtheonewhichis
statisticallysignificant(theCSPxtroopstrengthinteractionincolumn(6))is
negativeaspredicted.Theidealmeasureofmwouldsomehowaveragetroop
densityoverphysicalareaandpopulation,soaroughaveragingofthethree
preciselyestimatednegativecoefficientsintheleftpanelwiththethreeestimates
ontheright(twonegativeandoneimpreciselyestimatedpositive)indicatestous
fairlyrobustevidenceofcomplementarity.Recallingourdiscussionofthepossible
endogeneityofbothgandm,sinceanyendogeneitybias(despiteourbestefforts)
wouldbepositive,theseestimates,ifanything,understatecomplementarity.This
evidenceofcomplementaritybetweendevelopmentspendingandtroopstrengthis
illustratedinFigure4,whichplotsthepredictedmarginaleffectsestimatedfor
smallandlargeCERP(inacombinedregression)accordingtothenumberof
battalionspresent.Spendingbecomesmoreviolence‐reducingasthenumberof
battalionsperdistrictincreases.Thedensityofbattalionsisalsoplottedinarug
plot,toillustratethepredictedeffectforatypicaldistrict.
Afinaltestableimplicationofthemodelconcernstheroleofdevelopment
expertise.Hereourinterestisindistinguishingthemechanisminthemodel–which
reliesondeliveringaservice,g,ofvaluetothecommunity,fromaclassof
“opportunitycost”modelsthatinjectwagesandemploymentintothecommunity
regardlessofwhetheraserviceofvalueisgenerated.13Inotherwords,fora
13Bermanetal(2012)distinguishesbetweentheseargumentsinthecontextofanomnibusmodel.
18
programtobesuccessfulatreducingviolence,itmustbeadevelopmentsuccessas
well,bydeliveringdesiredservicestocommunitymembers.14
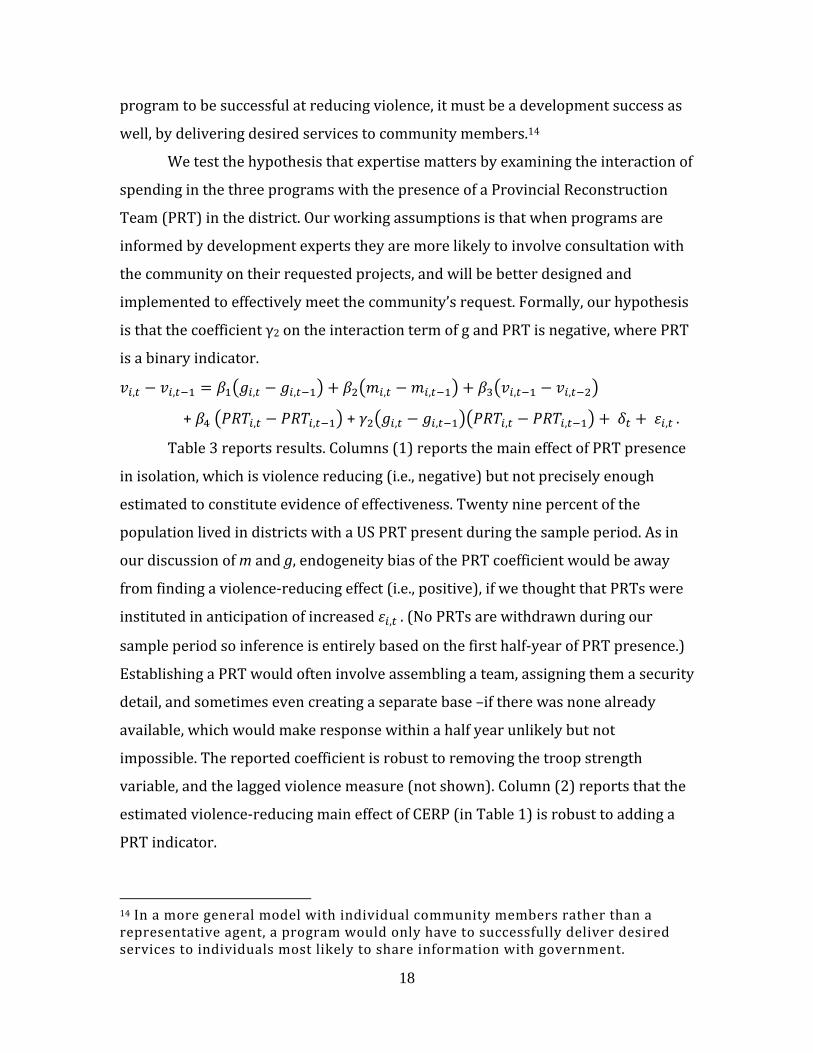
Wetestthehypothesisthatexpertisemattersbyexaminingtheinteractionof
spendinginthethreeprogramswiththepresenceofaProvincialReconstruction
Team(PRT)inthedistrict.Ourworkingassumptionsisthatwhenprogramsare
informedbydevelopmentexpertstheyaremorelikelytoinvolveconsultationwith
thecommunityontheirrequestedprojects,andwillbebetterdesignedand
implementedtoeffectivelymeetthecommunity’srequest.Formally,ourhypothesis
isthatthecoefficientγ2ontheinteractiontermofgandPRTisnegative,wherePRT
isabinaryindicator.
, , , , , , , ,
+ , , + , , , , , .
Table3reportsresults.Columns(1)reportsthemaineffectofPRTpresence
inisolation,whichisviolencereducing(i.e.,negative)butnotpreciselyenough
estimatedtoconstituteevidenceofeffectiveness.Twentyninepercentofthe
populationlivedindistrictswithaUSPRTpresentduringthesampleperiod.Asin
ourdiscussionofmandg,endogeneitybiasofthePRTcoefficientwouldbeaway
fromfindingaviolence‐reducingeffect(i.e.,positive),ifwethoughtthatPRTswere
institutedinanticipationofincreased , .(NoPRTsarewithdrawnduringour
sampleperiodsoinferenceisentirelybasedonthefirsthalf‐yearofPRTpresence.)
EstablishingaPRTwouldofteninvolveassemblingateam,assigningthemasecurity
detail,andsometimesevencreatingaseparatebase–iftherewasnonealready
available,whichwouldmakeresponsewithinahalfyearunlikelybutnot
impossible.Thereportedcoefficientisrobusttoremovingthetroopstrength
variable,andthelaggedviolencemeasure(notshown).Column(2)reportsthatthe
estimatedviolence‐reducingmaineffectofCERP(inTable1)isrobusttoaddinga
PRTindicator.
14Inamoregeneralmodelwithindividualcommunitymembersratherthanarepresentativeagent,aprogramwouldonlyhavetosuccessfullydeliverdesiredservicestoindividualsmostlikelytoshareinformationwithgovernment.

19
Columns(3),(4),(5)and(6)reportourinteractiontests.Inallcases(CERP,
smallCERP,largeCERPandCSP)theinteractionofPRTwithdevelopmentspending
yieldsanegativecoefficient,indicatingthattheviolence‐reducingeffectsofthese
programsareenhancedbyPRTpresence.Thoseinteractionseffectsarestatistically
significantatthe10%forlargeCERP,andatthe1%levelforsmallCERP.Small
CERPprojectsarealmostthreetimesasviolence‐reducing(‐.067+‐0.36vs.‐.036)
whenaPRTispresentinthedistrict.Thatpatternofcomplementarityisillustrated
inFigure5,whichshowstheincreaseinviolencereduction(theslope)whenaPRT
ispresent.
TakingtheevidenceinTables1‐3together,wecandrawsomeconclusions.
Developmentspendingismostviolence‐reducingwhenitissecure,whichaddresses
thepuzzleposedbyTable1bytherelativeeffectivenessofsmallCERPprograms.
Developmentspendingisalsomoreviolencereducingwhenitisinformedbylocal
developmentexperts.Smallprojectsaremorelikelytobeviolence‐reducing,which
mayreflectthefactthattheyarebetterinformed,ormaybeduetotheirlending
themselvesmorereadilytoconditionalimplementation.15Conversely,troop
strengthismoreviolence‐reducing(oratleastlessviolence‐increasing,as
measured)whensmall‐scaledevelopmentspendingispresent.Finally,thedata
suggestthatsmallerprojectsshowstrongercomplementaritieswithexpertiseand
withsecurity,whichmayreflectafurthercomplementaritybetweenconditionality
andbothsecurityontheonehandandexpertiseontheother.
IV.ConclusionOveralltheevidencefromIraqsuggeststhat,inaccordancewiththeinformation‐
centric(or“HeartsandMinds”)frameworklaidout,aidspendingwhichissmall,
conditional,secure,andeffectiveasadevelopmentprogramcreatesincentivesfor
15InresultsnotreportedwefindnostatisticallysignificantcomplementaritiesbetweeneithertroopstrengthorPRTsontheonehand,andanyoftheotherprogramsmeasuredinTable1ontheother.Wecautiouslyinterpretthatasevidencethattheconditionalityandsecuritythatsmallprojectsallowisanecessaryconditionforviolence‐reductionindevelopmentspending.

20
cooperationwithgovernmentthatlarge,lesssecureandlessinformedprojectsdo
not.
Moregenerally,ourtheoreticalperspectivesuggestsanumberofpractical
lessonsforaidprograms.Complementarity,asillustratedbyFigure3,indicatesthat
agovernmentwishingtosuppressviolenceatminimalcostwouldmixtheuseof
developmenteffortsandcoerciveforce,ratherthanexclusivelyuseoneortheother.
Evidencesuggeststhatmostrebelgroupsrecognizethatlogicandlikewisemix
governanceinitiativeswithcoercion.16
TheseinsightsaredrawnfromtheU.S.andCoalitionexperienceinIraqasan
occupyingforce,andthenlaterinsupportofadomesticgovernmentcombatinga
veryviolentinsurgency.Yetbasedonourexperienceapplyingthesamemodelto
otherfragileenvironments,wehypothesizethattheselessonsmaywellapplymore
generallytodomesticgovernmentsortointernationalassistancetolocalallies.
Sufficientconditionsfordevelopmentassistancetobestabilityenhancinginplaces
wherearebelofcriminalelementcancaptureordestroyprojectsareapparently
these:theyshouldbemodest,secure,conditional,andinformedbylocal
preferences.Moreoverengagingdevelopmentexpertise,ratherthansimply
spendingfunds,augmentsthestabilizationeffect.Forinstance,keeping
developmentexpertshunkereddownfarfromprojectssitesisunlikelytobe
violence‐reducing.Alogicalcorollaryofcomplementaritybetweendevelopmentand
securityprovisionisthatforeignassistancetogovernmentsfightinginsurgencies
willbemoreeffectivewhenitincludescapacitybuildinginbothgandm.Investing
intrainingsecurityforcesisastandardcomponentof“smallfootprint”intervention,
yetgovernanceassistanceistypicallylimitedtotrainingforthosewhowillmanage
governmentagencies.Ouranalysissuggeststhattrainingthosewhowould
implementlocalserviceprovisionmayhaveagreaterimmediateviolence‐reduction
effect.Inthesamevein,securityforces,oncetrained,willbemoreeffectiveif
redeployedoutoflarge,insulatedbasesandinsteadengagingthelocalpopulationin
awaythatcomplementsdevelopmentefforts.
16SeeBSFfordiscussion.

21
Finally,itisworthputtingtheseresultsincontext.Modest,secure,informed
andconditionalshouldbethoughtofassufficientconditionsforviolence‐reduction.
Furtherresearchisrequiredtoestablishwhereandtowhatextenttheyareall
necessary.Furtherresearchmayalsorevealtheextenttowhichamixofcapacity
buildinginbothcoerciveandbenigngovernancecangeneratemediumandlongrun
stabilization–beyondahalf‐yearoroneyearhorizon.Theiso‐stabilitylinesof
Figure3aredrawnforagivensetofnormsandexpectations.Asexpectationsof
qualityofgovernanceimprove,includingpoliticaldevelopmentandrepresentation,
enhancedlegitimacyshouldimprovenormsofcooperationwithgovernment‐‐
ratherthanwithrebelsorcriminals.Thatwouldshiftiso‐stabilitylinestolower
levelsofviolenceatthesamecosttogovernmentinthemediumandlongterm,and
allowgovernments(andallies)theoptionofshiftingspendingawayfromcoercive
forceandtowardtraditionaldevelopmentprograms.
22
Figure 1: Best Response Functions for Violence and Development Spending
Violence(v)
GovernmentServices(g)
v*(g,m)
g*(v,m)
A •
'

23
Figure 2a: Services Complement Enforcement
Note:Increasinggtog’makestheslopedv*/dm|gmorenegative.
Violence(v)
Enforcement(m)
v*(g,m)
m*(v,g)
A •
v*(g’,m)'

24
Figure 2b: Enforcement Complements Services
Note:Increasingmtom’makestheslopedv*/dg|mmorenegative.Thisisnotthesamecross‐partialeffectasinFigure2aabove,asthederivativesareconditionedondifferentvariables.Thechangeintheslopeofdv*/dm|gisactuallylarger.
Violence(v)
GovernmentServices(g)
v*(g,m)
g*(v,m)
A •
'
v*(g,m’)

25
Figure 3: Complementarity in Stability Production
Enforcement (m)
GovernmentServices(g)
A •
StabilityIsoquantA(v0)
Iso‐Cost Curve

26
Figure 4: Troop Strength Complements Development Spending

27
Figure 5: Development Expertise Complements Spending

28
Table 1: Development Programs and Violence Suppression – Alternative Programs DependentVariable: (1) (2) (3) (4) (5) (6) (7) (8) (9) VariableIncidentspercapita MeanCERP ‐0.0122** ‐0.0122** $10.07
(0.00548) (0.00562)CERP<$50K ‐0.0639*** $1.32
(0.0186)CERP>$50K ‐0.0108* $8.75
(0.00559)NonCERP>$100K 0.000899 $33.18
(0.000565)NonCERP<$100K 0.00636 $0.31
(0.0228)CSP ‐0.0470* $0.44
(0.0242)CAP ‐0.0118 $0.18
(0.0279)USAID ‐0.00248 $12.51
(0.00334)TroopStrength 0.0489 0.0479 0.0451 0.0386 0.0349 0.0466 0.0354 0.0301 1.12
(0.0399) (0.0349) (0.0400) (0.0325) (0.0337) (0.0328) (0.0333) (0.0339)LaggedTroopStrength
‐0.0255 0.0162 ‐0.0373 ‐0.0411 ‐0.0421 ‐0.0205 ‐0.0424 ‐0.0400 1.13
(0.0675) (0.0602) (0.0704) (0.0729) (0.0732) (0.0705) (0.0728) (0.0731)LaggedIncidents 0.177** 0.173* 0.172* 0.173* 0.173* 0.172* 0.157 0.171* 0.172* 0.589
(0.0883) (0.0893) (0.0957) (0.0904) (0.0973) (0.0979) (0.0980) (0.0971) (0.0969)Constant 0.0907** 0.0969** 0.0720* 0.0897** 0.0557 0.0585 0.0604 0.0574 0.0560
(0.0436) (0.0427) (0.0376) (0.0416) (0.0359) (0.0370) (0.0364) (0.0363) (0.0365) Observations 824 824 824 824 824 824 824 824 824R‐squared 0.213 0.215 0.222 0.204 0.180 0.179 0.194 0.179 0.180EqualitywithCERP<$50Kslope(pvalue)
‐ ‐ ‐ .0002*** .0002*** .002*** .338 .030** .0004***
Notes:Anobservationisadistrict(N=103)xhalfyear.DistrictKarkh isexcludedasnationalCSPprogramsareconfoundedwithlocalthere.Meansareforlevels(NT=927)thoughregressionsareestimatedinfirstdifferences(NT=824).Incidentsaremeasuredper1000population.Theirmeanis0.587.Troopstrengthismeasuredinbattalionsperdistrict.Regressionsareweightedbypopulationandincludeyeareffects,andSunnivote‐yearinteractions.***p<0.01,**p<0.05,*p<0.1.Standarderrorsareclusteredatthedistrictlevel.

29
Table 2: Complementarity of Development Spending with Troop Strength
DependentVariable: (1) (2) (3) (4) (5) (6)Incidentspercapita TroopLevels Troopspercapita CERP<$50K ‐0.0145 ‐0.0447***
(0.0262) (0.0157)CERP<$50KxTroops ‐0.0120** ‐0.0140
(0.00542) (0.0155)CERP>$50K 0.000353 ‐0.0122**
(0.00438) (0.00565)CERP>$50KxTroops ‐0.00639*** 0.00120
(0.00228) (0.000752)CSP 0.0325* 0.0146
(0.0172) (0.0187)CSPxTroops ‐0.0291*** ‐0.102**
(0.00480) (0.0422)
Troops 0.0655* 0.136** 0.0746* 0.229 0.112 0.245(0.0389) (0.0517) (0.0393) (0.284) (0.270) (0.252)
LaggedTroops 0.0106 ‐0.0335 ‐0.0164 ‐0.493 ‐0.537 ‐0.613*(0.0607) (0.0684) (0.0693) (0.370) (0.370) (0.355)
Laggedincidents 0.188* 0.190** 0.162 0.181* 0.177* 0.165(0.0992) (0.0934) (0.0993) (0.0998) (0.0940) (0.103)
Constant 0.0669* 0.0842** 0.0629* 0.0615 0.0832* 0.0519(0.0382) (0.0380) (0.0364) (0.0412) (0.0460) (0.0399)
Observations 824 824 824 824 824 824R‐squared 0.231 0.231 0.217 0.234 0.223 0.225Notes:Anobservationisadistrict(N=103)xhalfyear.DistrictKarkhisexcludedasnationalCSPprogramsareconfoundedwithlocalthere.Incidentsaremeasuredper1000population.Theirmeanis0.587.Troopstrengthismeasuredinbattalionsperdistrictintheleftpanel(columns(1)‐(3))withmean1.12.Troopstrengthismeasuredinbattalionsper100Kpopulationintherightpanel(columns(4)‐(6))withmeanof0.22.Regressionsareweightedbypopulationandincludeyeareffects,andSunnivote‐yearinteractions.***p<0.01,**p<0.05,*p<0.1.Standarderrorsareclusteredatthedistrictlevel.

30
Table 3: Expertise Complements Development Programs
DependentVariable: (1) (2) (3) (4) (5) (6) VariableIncidents Mean CERP ‐0.0122** ‐0.00672 $10.07
(0.00561) (0.00472)CERPxPRT ‐0.0172* $3.84
(0.00912)CERP<$50K ‐0.0357** $1.32
(0.0174)CERP<$50KxPRT ‐0.0667*** $0.42
(0.0176)CERP>$50K ‐0.00594 $8.75
(0.00476)CERP>$50KxPRT ‐0.0164* $3.42
(0.00958)CSP ‐0.0222 $0.44
(0.0152)CSPxPRT ‐0.0354 $0.31
(0.0397)PRT ‐0.0136 ‐0.0228 0.137 0.0750 0.109 ‐0.00337 0.29
(0.0829) (0.0822) (0.131) (0.0885) (0.121) (0.0840)Troops 0.0345 0.0480 0.0751* 0.0731* 0.0638 0.0496 0.22
(0.0327) (0.0400) (0.0449) (0.0414) (0.0410) (0.0338)LaggedTroops ‐0.0424 ‐0.0260 ‐0.0168 0.00877 ‐0.0286 ‐0.0185 0.23
(0.0741) (0.0687) (0.0669) (0.0613) (0.0703) (0.0731)LaggedIncidents 0.171* 0.173* 0.154* 0.170* 0.155* 0.156 0.59
(0.0971) (0.0895) (0.0889) (0.0964) (0.0903) (0.0986)Constant 0.0594* 0.100** 0.0887** 0.0701** 0.0838** 0.0614*
(0.0328) (0.0382) (0.0354) (0.0316) (0.0353) (0.0335)Observations 824 824 824 824 824 824R‐squared 0.179 0.216 0.233 0.236 0.217 0.196 Notes:Anobservationisadistrict(N=103)xhalfyear.DistrictKarkhisexcludedasnationalCSPprogramsareconfoundedwithlocalthere.Meansareforlevels(NT=927)thoughregressionsareestimatedinfirstdifferences(NT=824).Incidentsaremeasuredper1000population.Theirmeanis0.587.Troopstrengthismeasuredinbattalionsperdistrict.Regressionsareweightedbypopulationandincludeyeareffects,andSunnivote‐yearinteractions.***p<0.01,**p<0.05,*p<0.1.Standarderrorsareclusteredatthedistrictlevel.

31
References Berman,Eli,JosephFelter,EthanKapsteinandErinTroland.2012.“Predation,
EconomicActivityandViolence:EvidencefromthePhilippines.”NBERWP#18375.
Berman,Eli,JacobN.ShapiroandJosephH.Felter.2011.“CanHeartsandMindsbeBought?TheEconomicsofCounterinsurgencyinIraq,”JournalofPoliticalEconomy,119(4).
Berrebi,ClaudeandSarahOlmstead.2011.“EstablishingFavorableEconomicConditions,”inPaulK.,Davis(ed.)DilemmasofIntervention:SocialScienceforStabilizationandReconstruction,RAND,SantaMonica.
Blattman,ChristopherandEdwardMiguel.2010.“CivilWar.”JournalofEconomicLiterature,48(1).
Gradstein,Mark.2004.“GovernanceandGrowth,”JournalofDevelopmentEconomics,73.
Guillaumont,Lisa,andPatrickChauvet.2003."AidandGrowthRevisited:Policy,EconomicVulnerability."CERDI.
Collier,PaulandAnkeHoeffler.2004.“GreedandGrievanceinCivilWar”OxfordEconomicPapers,56(4).
Crost,Benjamin,JosephH.FelterandPatrickJohnston.2012.“AidUnderFire:DevelopmentProjectsandCivilConflict,”U.ofColorado,Denvermimeo,January.
Flores,ThomasEdward,andIrfanNooruddin.2009."FinancingthePeace:EvaluatingWorldBankPost‐ConflictAssistancePrograms."ReviewofInternationalOrganizations4(1):1‐27.
Guillaumont,PatrickandRachidLaajaj.2006."Wheninstabilityincreasestheeffectivenessofaidprojects,"PolicyResearchWorkingPaperSeries#4034.TheWorldBank.
Hirshleifer,Jack.1989."ConflictandRent‐SeekingSuccessFunctions:Ratiovs.DifferenceModelsofRelativeSuccess."PublicChoice,63.
Lee,Carrie,“BattalionDatasetCodebook,”StanfordUniversity,September2011.Lee,Carrie,“HoldingHeartsandMinds:TheEffectofBootsontheGroundinIraq,”
StanfordUniversity,March2012.Nielsen,Richard,A.MichaelG.Findley,ZacharyS.Davis,TaraCandland,DanielL.
Nielson.2011.“ForeignAidShocksasaCauseofViolentArmedConflict,”AmericanJournalofPoliticalScience,55(2).
Mas‐Collel,Andreu,MichaelD.WhinstonandJerryR.Green.1995.MicroeconomicTheory,NewYork:Oxford.
Svensson,Jakob.2003.“Whyconditionalaiddoesnotworkandwhatcanbedoneaboutit?.”JournalofDevelopmentEconomics,70.
U.S.AgencyforInternationalDevelopment,“WhereDoestheMoneyGo?”(spreadsheet),http://www.usaid.gov/results‐and‐data/budget‐spending/where‐does‐money‐go,downloadedJanuary9,2013.
U.SArmy.2007.FieldManual3‐24,CounterinsurgencyFieldManual.Chicago:Univ.ofChicagoPress.

32
VandenEynde,Oliver.2012.“TargetsofViolence:EvidencefromIndia’sNaxaliteConflict,”ParisSchoolofEconomics,mimeo.
WorldBank,2011.WorldDevelopmentReport2011:Conflict,SecurityandDevelopment.WorldBankGroup,WashingtonDC.

33
Appendix: Proofs of Propositions 1 and 2
The proofs of both propositions rely on partial differentiation of the slopes of the optimal
response functions of R in choosing v*.
Proposition 1:
∗
0 .
Proof: ∗ = - / and by the implicit function theorem,
= - [-A'(v)( g + v - nL )f h'(m) -A(v)f h'(m)] / A''(v)[1-p*] – 2A'(v)f h(m) - B''(v) .
Denoting the numerator Δ and the denominator Ω,
∗
∆ < 0 ,
since Δ' = A'(v)f h'(m) >0 , Ω <0, Δ > 0, and Ω' = -A''(v)f h(m) >0 , and Ω2 >0.
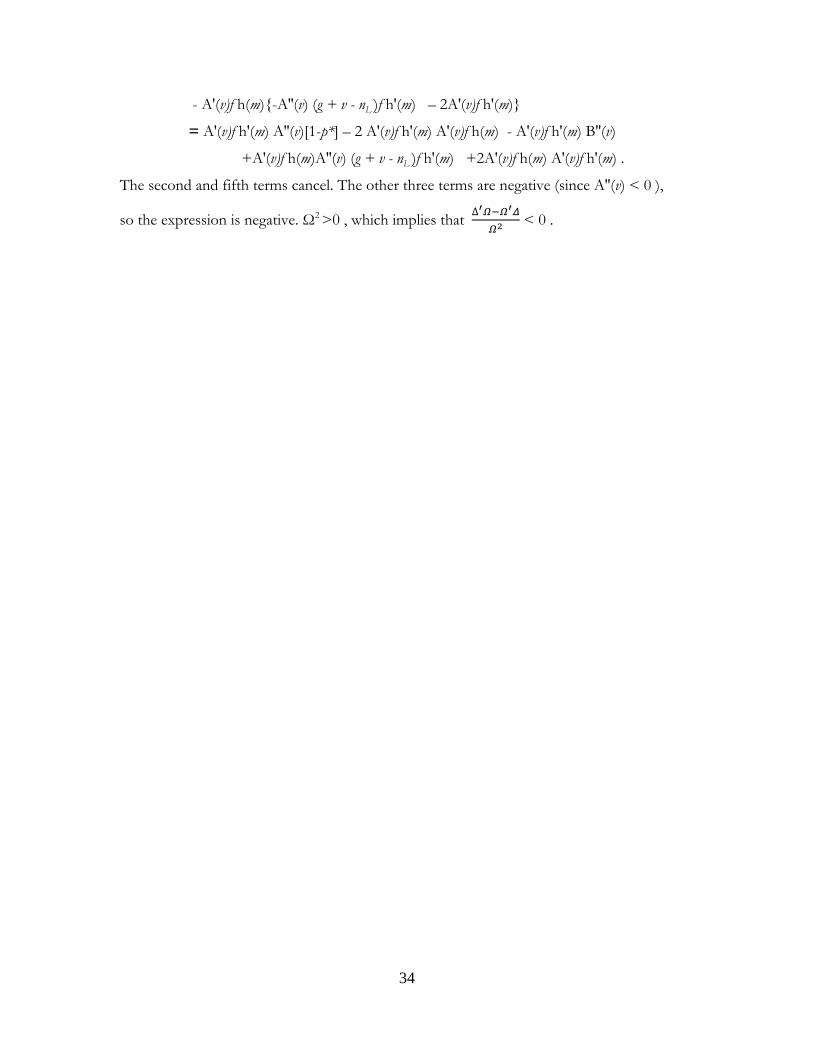
Proposition 2: :
∗
< 0 .
Proof: ∗ = - / by the implicit function theorem,
= - (-)A'(v)f h(m) / A''(v)[1-p*] – 2A'(v)f h(m) - B''(v) .
Denoting the numerator Δ and the denominator Ω,
∗
∆ .
Δ'Ω - Ω'Δ = A'(v)f h'(m) A''(v)[1-p*] – 2A'(v)f h(m) - B''(v)
34
- A'(v)f h(m)-A''(v) (g + v - nL )f h'(m) – 2A'(v)f h'(m)
= A'(v)f h'(m) A''(v)[1-p*] – 2 A'(v)f h'(m) A'(v)f h(m) - A'(v)f h'(m) B''(v)
+A'(v)f h(m)A''(v) (g + v - nL )f h'(m) +2A'(v)f h(m) A'(v)f h'(m) .
The second and fifth terms cancel. The other three terms are negative (since A''(v) < 0 ),
so the expression is negative. Ω2 >0 , which implies that ∆ < 0 .

35
Appendix Table 1: Summary Statistics (Changes)
Observations Weight Mean Std.Dev. Min Max
Incidents 927 246754372 ‐0.0025253 0.7192714 ‐14.30548 9.791145
LaggedIncidents 824 221459256 0.0246278 0.7529446 ‐14.30548 9.791145
CERP 927 246754372 0.8975824 11.75703 ‐252.7587 264.7626
CERP<$50K 927 246754372 0.0978531 2.637987 ‐43.8516 34.17538
CERP>$50K 927 246754372 0.7997293 10.81382 ‐252.7587 302.5766
NonCERP 927 246754372 ‐2.044234 79.77404 ‐10735.33 892.7099
NonCerp<$100,000 927 246754372 ‐0.1364265 1.977181 ‐45.27344 14.09699
NonCERP>$100,000 927 246754372 ‐1.907807 79.62294 ‐10724.78 892.3289
CAP 927 246754372 0.0339391 0.6284991 ‐8.891963 16.47236
CSP 927 246754372 0.0539443 2.029424 ‐18.23231 29.00582
USAID 927 246754372 ‐1.833554 72.81415 ‐10757.88 66.87154
PRT 927 246754372 0.0503777 0.2188411 0 1
TroopStrength 927 246754372 ‐0.008259 0.6462308 ‐3 2.333333
LaggedTroopStrength 824 221459256 ‐0.0033438 0.645426 ‐3 2.333333
CERPxTroopStrength 927 246754372 1.71061 37.70935 ‐512.5932 725.2957
CERP<$50,000xTroopStrength 927 246754372 0.1375683 12.52012 ‐165.8702 93.96977
CERP>$50,000xTroopStrength 927 246754372 1.573042 29.48188 ‐482.8429 729.1677
CSPxTroopStrength 927 246754372 0.0700144 7.186853 ‐74.87498 77.8888
CERP<$50,000xPRT 927 246754372 0.0390839 1.764686 ‐25.60038 18.19453
CERP>$50,000xPRT 927 246754372 0.4654902 6.177386 ‐80.17256 58.67921
CSPxPRT 927 246754372 0.0228998 1.721804 ‐13.36795 14.78048
Notes:Anobservationisadistrict(N=103)xhalfyear.DistrictKarkhisexcludedasnationalCSPprogramsareconfoundedwithlocalthere.Meansareinchanges,weightedbypopulation.RegressionsincludeNT=824observations.Incidentsaremeasuredper1000population,spendingvariablesarepercapita.Troopstrengthismeasuredinbattalionsperdistrict.

36
Appendix Table 2: Robustness of Table 1 results to inclusion of per capita troop strength DependentVariable: Incidentspercapita (1) (2) (3) (4) (5) (6) (7) (8) (9)
CERP ‐0.0122** ‐0.0116**(0.00548) (0.00560)
CERP<$50K ‐0.0569***(0.0197)
CERP>$50K ‐0.0103*(0.00557)
NonCERP<$100K 0.00436(0.0213)
NonCERP>$100K 0.000677(0.000611)
CSP ‐0.0443*(0.0227)
CAP ‐0.0151(0.0281)
USAID ‐0.00223(0.00295)
TroopStrengthPerCapita 0.207 0.165 0.200 0.157 0.161 0.179 0.159 0.150(0.265) (0.272) (0.263) (0.249) (0.248) (0.250) (0.250) (0.250)
LaggedTroopStrengthPerCapita ‐0.534 ‐0.472 ‐0.569 ‐0.617* ‐0.610* ‐0.583 ‐0.619* ‐0.612*(0.364) (0.361) (0.359) (0.349) (0.349) (0.354) (0.348) (0.349)
LaggedIncidents 0.177** 0.177* 0.178* 0.176* 0.177* 0.177* 0.163 0.177* 0.177*(0.0883) (0.0938) (0.1000) (0.0948) (0.102) (0.101) (0.103) (0.101) (0.101)
Constant 0.0907** 0.0869* 0.0627 0.0805* 0.0508 0.0485 0.0520 0.0500 0.0493(0.0436) (0.0465) (0.0412) (0.0454) (0.0405) (0.0394) (0.0404) (0.0398) (0.0400)
Observations 824 824 824 824 824 824 824 824 824R‐squared 0.213 0.231 0.233 0.221 0.198 0.199 0.212 0.198 0.199Notes:Anobservationisadistrict(N=103)xhalfyear.DistrictKarkh isexcludedasnationalCSPprogramsareconfoundedwithlocalthere.Meansareforlevels(NT=927)thoughregressionsareestimatedinfirstdifferences(NT=824).Incidentsaremeasuredper1000population.Theirmeanis0.587.Troopstrengthismeasuredinbattalionsperdistrictpercapita.Regressionsareweightedbypopulationandincludeyeareffects,andSunnivote‐yearinteractions.***p<0.01,**p<0.05,*p<0.1.Standarderrorsareclusteredatthedistrictlevel.

37
Appendix Table 3: Robustness of Table 3 (PRTs and Spending) to inclusion of per capita troop strength Dependent Variable: (1) (2) (3) (4) (5) Incidents
CERP ‐0.0116**
(0.00559) CERP < $50K ‐0.0266
(0.0168) CERP < $50K x PRT ‐0.0705***
(0.0171) CERP > $50K ‐0.00572
(0.00451) CERP > $50K x PRT ‐0.0155*
(0.00931) CSP ‐0.0222
(0.0151) CSP x PRT ‐0.0313
(0.0378) PRT ‐0.0419 ‐0.0542 0.0346 0.0649 ‐0.0395
(0.0843) (0.0813) (0.0808) (0.115) (0.0842) Troop Strength per Capita 0.156 0.206 0.237 0.227 0.188
(0.250) (0.265) (0.266) (0.278) (0.252) Lagged Troop Strength per Capita ‐0.621* ‐0.538 ‐0.519 ‐0.559 ‐0.577
(0.351) (0.366) (0.358) (0.366) (0.359) Lagged Incidents 0.176* 0.176* 0.175* 0.160* 0.162
(0.101) (0.0942) (0.100) (0.0954) (0.103) Constant 0.0564* 0.0951** 0.0644** 0.0788** 0.0582*
(0.0338) (0.0402) (0.0321) (0.0362) (0.0347)
Observations 824 824 824 824 824 R‐squared 0.198 0.231 0.249 0.233 0.214 Notes:Anobservationisadistrict(N=103)xhalfyear.DistrictKarkh isexcludedasnationalCSPprogramsareconfoundedwithlocalthere.Meansareforlevels(NT=927)thoughregressionsareestimatedinfirstdifferences(NT=824).Incidentsaremeasuredper1000population.Theirmeanis0.587.Troopstrengthismeasuredinbattalionsperdistrictpercapita.Regressionsareweightedbypopulationandincludeyeareffects,andSunnivote‐yearinteractions.***p<0.01,**p<0.05,*p<0.1.Standarderrorsareclusteredatthedistrictlevel.