Modernizing Mapping Organizations' Workflow - · PDF fileGIS BEST PRACTICES 3 Introduction...
49
GIS Best Practices Modernizing Mapping Organizations’ Workflow March 2007
Transcript of Modernizing Mapping Organizations' Workflow - · PDF fileGIS BEST PRACTICES 3 Introduction...
GIS Best Practices
Modernizing MappingOrganizations’ Workflow
March 2007
Table of Contents
i
What Is GIS? 1
Introduction 3
Workfl ow and Job Management 5
Source Capture and Compilation 9
Data Management 19
Data Production 25
Cartographic Production 31
Cartographic and Data Dissemination through Map Data 39
Cartographic and Data Dissemination on the Web 47
Data Maintenance and Quality Assurance 51
GIS BEST PRACTICES 1 WWW.ESRI.COM/MAPS
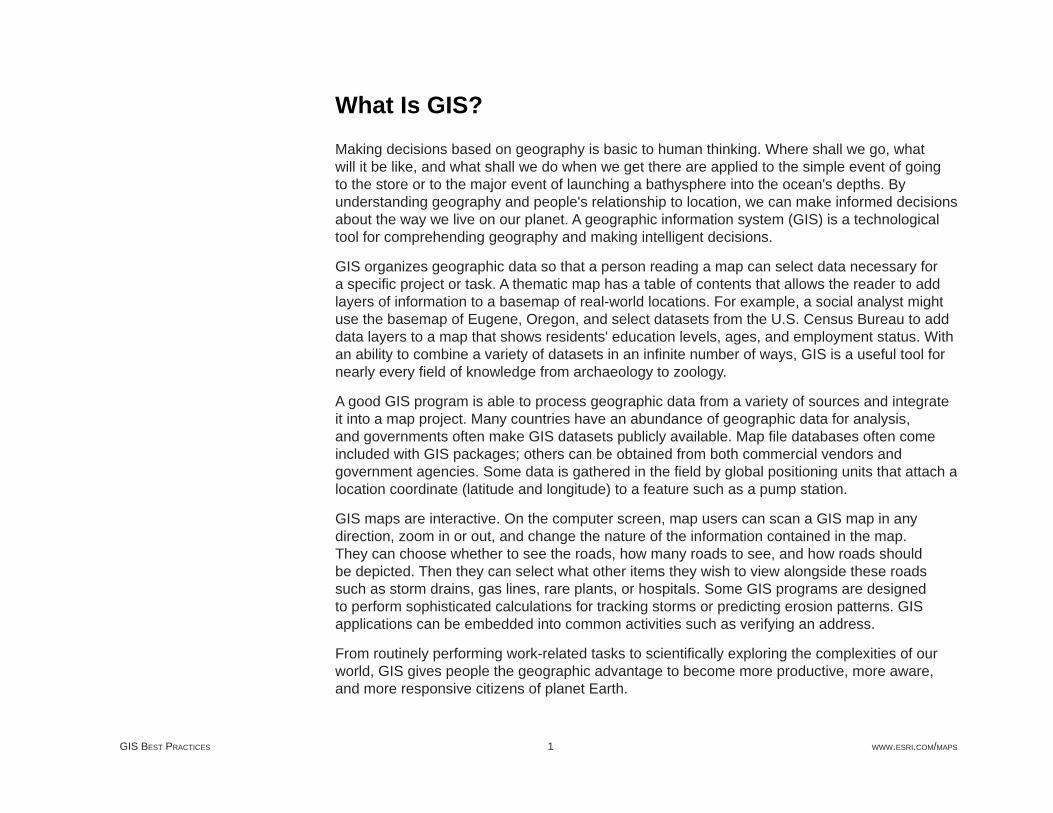
What Is GIS?Making decisions based on geography is basic to human thinking. Where shall we go, what will it be like, and what shall we do when we get there are applied to the simple event of going to the store or to the major event of launching a bathysphere into the ocean's depths. By understanding geography and people's relationship to location, we can make informed decisions about the way we live on our planet. A geographic information system (GIS) is a technological tool for comprehending geography and making intelligent decisions.
GIS organizes geographic data so that a person reading a map can select data necessary for a specifi c project or task. A thematic map has a table of contents that allows the reader to add layers of information to a basemap of real-world locations. For example, a social analyst might use the basemap of Eugene, Oregon, and select datasets from the U.S. Census Bureau to add data layers to a map that shows residents' education levels, ages, and employment status. With an ability to combine a variety of datasets in an infi nite number of ways, GIS is a useful tool for nearly every fi eld of knowledge from archaeology to zoology.
A good GIS program is able to process geographic data from a variety of sources and integrate it into a map project. Many countries have an abundance of geographic data for analysis, and governments often make GIS datasets publicly available. Map fi le databases often come included with GIS packages; others can be obtained from both commercial vendors and government agencies. Some data is gathered in the fi eld by global positioning units that attach a location coordinate (latitude and longitude) to a feature such as a pump station.
GIS maps are interactive. On the computer screen, map users can scan a GIS map in any direction, zoom in or out, and change the nature of the information contained in the map. They can choose whether to see the roads, how many roads to see, and how roads should be depicted. Then they can select what other items they wish to view alongside these roads such as storm drains, gas lines, rare plants, or hospitals. Some GIS programs are designed to perform sophisticated calculations for tracking storms or predicting erosion patterns. GIS applications can be embedded into common activities such as verifying an address.
From routinely performing work-related tasks to scientifi cally exploring the complexities of our world, GIS gives people the geographic advantage to become more productive, more aware, and more responsive citizens of planet Earth.
GIS BEST PRACTICES 3 WWW.ESRI.COM/MAPS
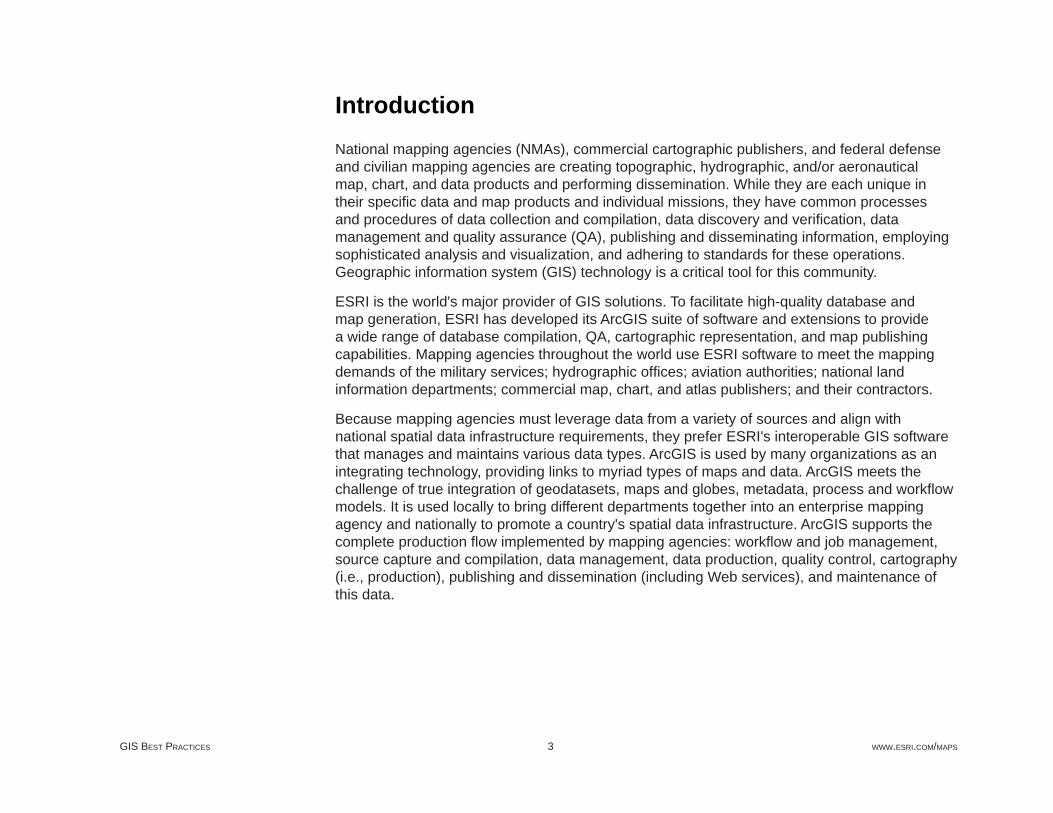
IntroductionNational mapping agencies (NMAs), commercial cartographic publishers, and federal defense and civilian mapping agencies are creating topographic, hydrographic, and/or aeronautical map, chart, and data products and performing dissemination. While they are each unique in their specifi c data and map products and individual missions, they have common processes and procedures of data collection and compilation, data discovery and verifi cation, data management and quality assurance (QA), publishing and disseminating information, employing sophisticated analysis and visualization, and adhering to standards for these operations. Geographic information system (GIS) technology is a critical tool for this community.
ESRI is the world's major provider of GIS solutions. To facilitate high-quality database and map generation, ESRI has developed its ArcGIS suite of software and extensions to provide a wide range of database compilation, QA, cartographic representation, and map publishing capabilities. Mapping agencies throughout the world use ESRI software to meet the mapping demands of the military services; hydrographic offi ces; aviation authorities; national land information departments; commercial map, chart, and atlas publishers; and their contractors.
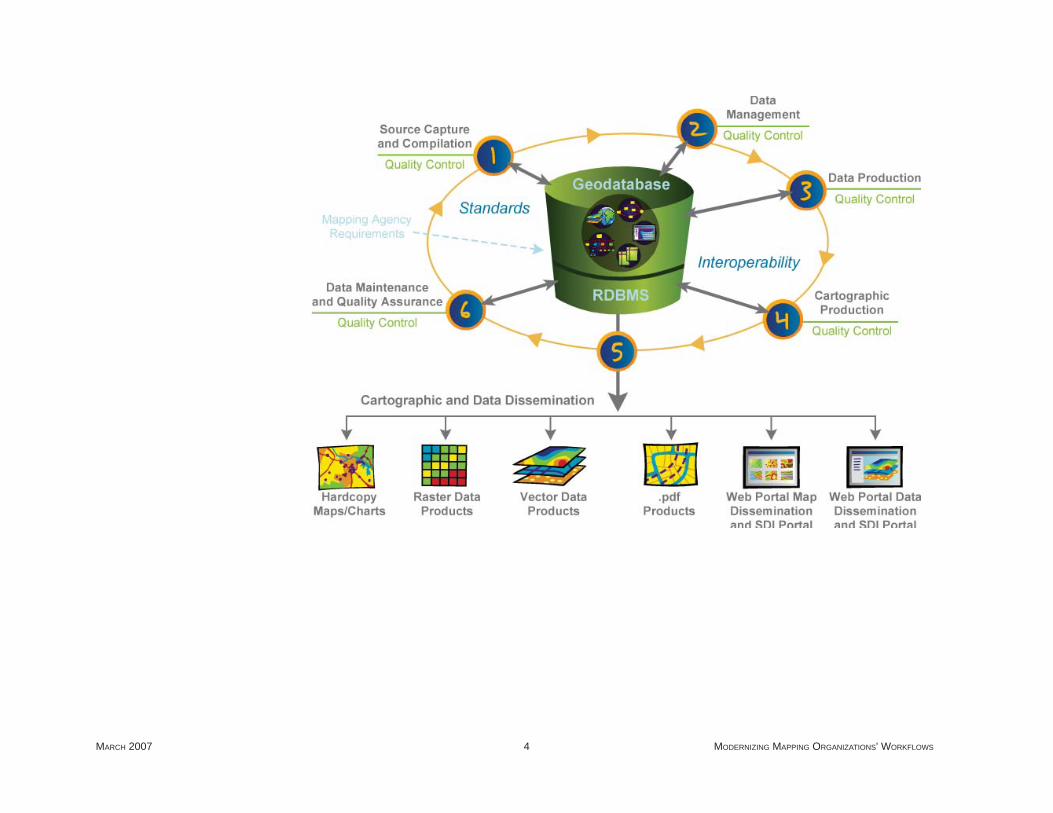
Because mapping agencies must leverage data from a variety of sources and align with national spatial data infrastructure requirements, they prefer ESRI's interoperable GIS software that manages and maintains various data types. ArcGIS is used by many organizations as an integrating technology, providing links to myriad types of maps and data. ArcGIS meets the challenge of true integration of geodatasets, maps and globes, metadata, process and workfl ow models. It is used locally to bring different departments together into an enterprise mapping agency and nationally to promote a country's spatial data infrastructure. ArcGIS supports the complete production fl ow implemented by mapping agencies: workfl ow and job management, source capture and compilation, data management, data production, quality control, cartography (i.e., production), publishing and dissemination (including Web services), and maintenance of this data.
MARCH 2007 4 MODERNIZING MAPPING ORGANIZATIONS' WORKFLOWS
GIS BEST PRACTICES 5 WWW.ESRI.COM/MAPS
Workfl ow and Job ManagementMap, chart, and data production organizations require workfl ows and tools that create an effi cient and cost-effective production line. Workfl ows facilitate tasks such as compiling, editing, controlling quality, and job tracking.
ESRI ArcGIS has the right tools for map, chart, and data production organizations to minimize button clicks, increasing effi ciency and meeting the demand of production schedules.
GIS BEST PRACTICES 7 WWW.ESRI.COM/MAPS
Job Tracking for ArcGIS (JTX) Improves Integration with ArcGIS Spatial ToolsModel Real-World Workfl ows
Job Tracking for ArcGIS (JTX) is a solution-based extension to ArcGIS that provides an integration framework for ArcGIS multiuser geodatabase environments. It simplifi es and automates many aspects of job management and tracking and streamlines the workfl ow, resulting in improved effi ciency and signifi cant time savings for any enterprise GIS project (e.g., data maintenance and commercial mapping).
Features of Job Tracking for ArcGIS (JTX) include
Integration with ArcGIS spatial tools, advanced query and visualization tools
Options and tools for creating jobs (e.g., bulk job creation, jobs from existing data, users in many groups)
Ability to model and graphically interact with advanced, real-world workfl ows that include branching, looping, decision points, and more
Built-in e-mail notifi cation capability with confi gurable subscribers, subject, and body for when certain actions are performed in Job Tracking for ArcGIS (JTX)
Tools to allow relationships to be established between jobs
Support for annotation feature classes
Extended API for custom functionality, and enhanced confi gurability
MARCH 2007 8 MODERNIZING MAPPING ORGANIZATIONS' WORKFLOWS
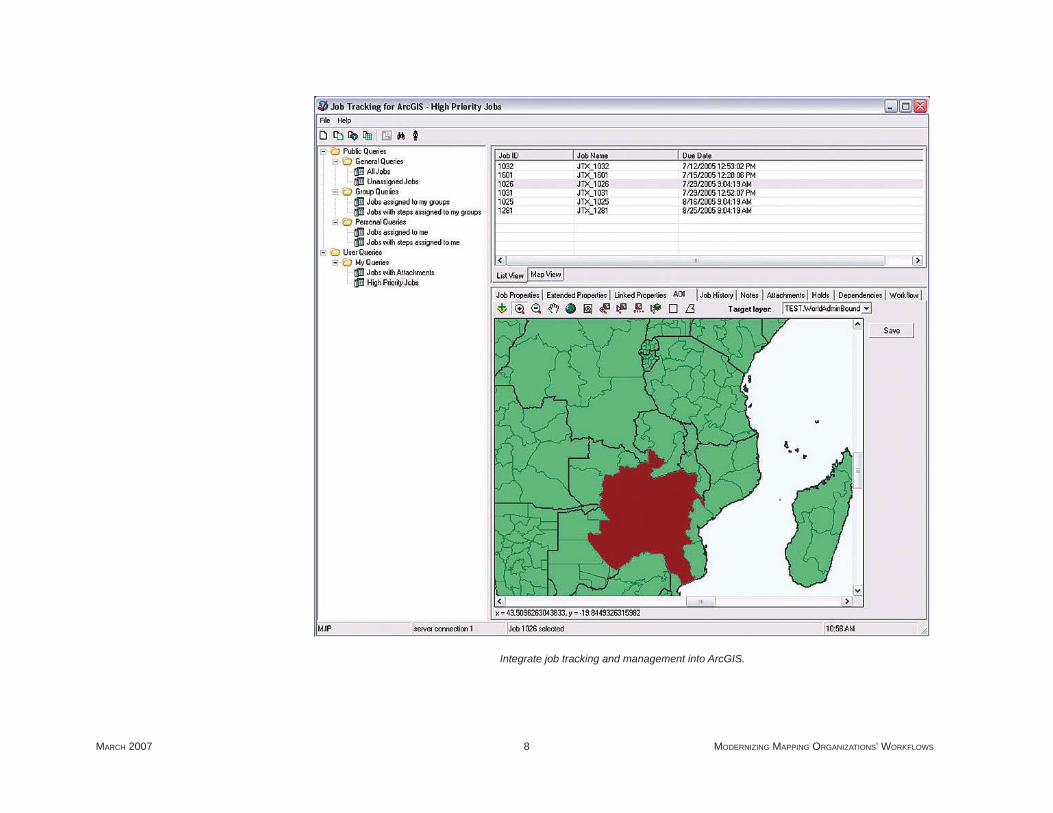
Integrate job tracking and management into ArcGIS.
GIS BEST PRACTICES 9 WWW.ESRI.COM/MAPS
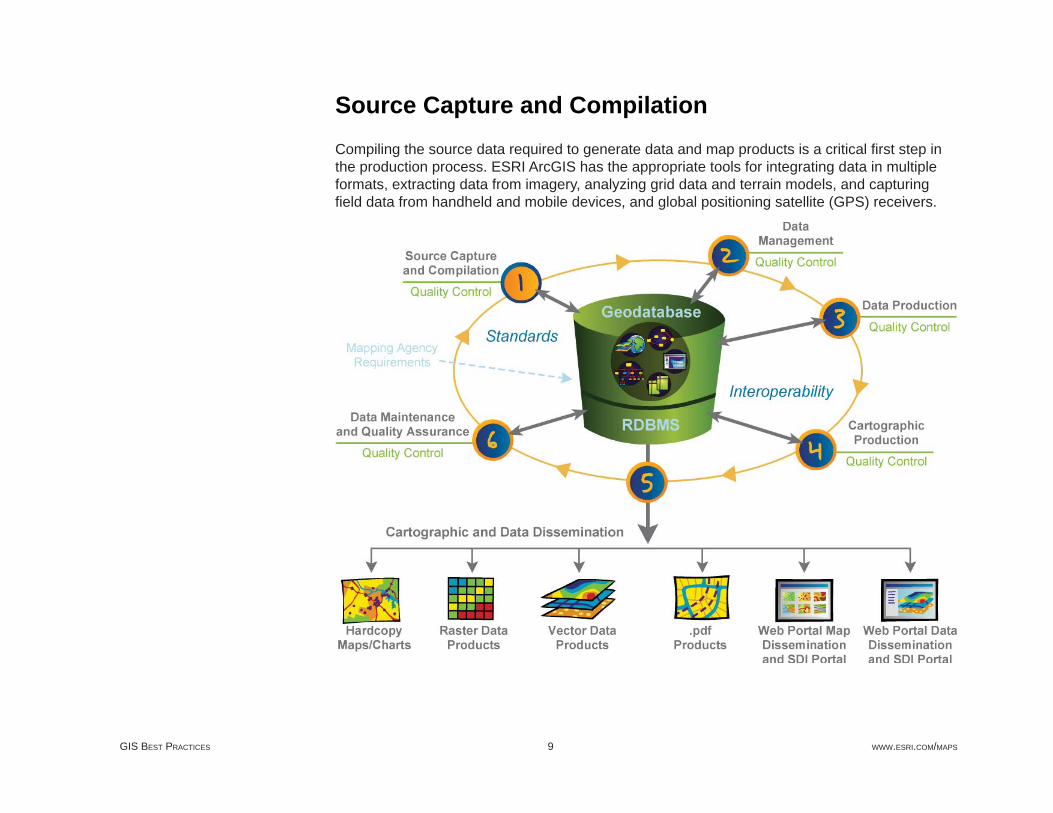
Source Capture and CompilationCompiling the source data required to generate data and map products is a critical fi rst step in the production process. ESRI ArcGIS has the appropriate tools for integrating data in multiple formats, extracting data from imagery, analyzing grid data and terrain models, and capturing fi eld data from handheld and mobile devices, and global positioning satellite (GPS) receivers.
GIS BEST PRACTICES 11 WWW.ESRI.COM/MAPS
USGS, NGA, and DHS Collaborate to Build "GIS for the Gulf" Extensive Spatial Infrastructure Uses Local Data and ETL Technology and Processes
The United States Geological Survey (USGS), the National Geospatial-Intelligence Agency (NGA), and the United States Department of Homeland Security (DHS) have implemented a GIS database for areas affected by hurricanes Rita and Katrina, extending large volumes of data to organizations responding to the disasters.
GIS for the Gulf (GFG) brought GIS data from many different systems together into one repository built upon the GIS for the Nation data model developed by USGS. Its purpose was to meet the immediate hurricane response needs, to provide a resource for long-term recovery and reconstruction efforts, and to assist in preparedness for future hurricane seasons. The National Geospatial Program Offi ce (NGPO) of the USGS intends for the GFG to serve as a technical and partnership blueprint for successfully carrying out the GIS for the Nation vision across the country. That vision is centered on collaborative partnerships with local, state, and other federal agency GIS organizations to facilitate data stewardship and sharing. Partnerships are designed to link local organizations into a national approach using tools such as the Geospatial One-Stop and the National Map.
"This was an opportunity to combine the talents of USGS leadership, in partnership with DHS, ESRI, NGA, and a number of local and state organizations, to think about a different approach for building GIS for the Gulf," says Hank Garie, chief, Geographic Information and Analysis, National Geospatial Program Offi ce, USGS. "This approach entails developing a data model and integrating data into that model. GIS for the Gulf is the fi rst geographic area where we built upon things such as Project Homeland and other pilots, to serve an emergency response need."
"We're working with several government agencies to carry out this vision of connecting individual GIS systems to support a variety of needs," says Jack Dangermond, president, ESRI. "This work takes advantage of the National Spatial Data Infrastructure (NSDI), the National Map, Geospatial One-Stop (GOS), and other enterprise models to foster a new level of collaboration, sharing, and integration. It will spur the development of larger, integrated applications and data access that cut across organizations."
MARCH 2007 12 MODERNIZING MAPPING ORGANIZATIONS' WORKFLOWS
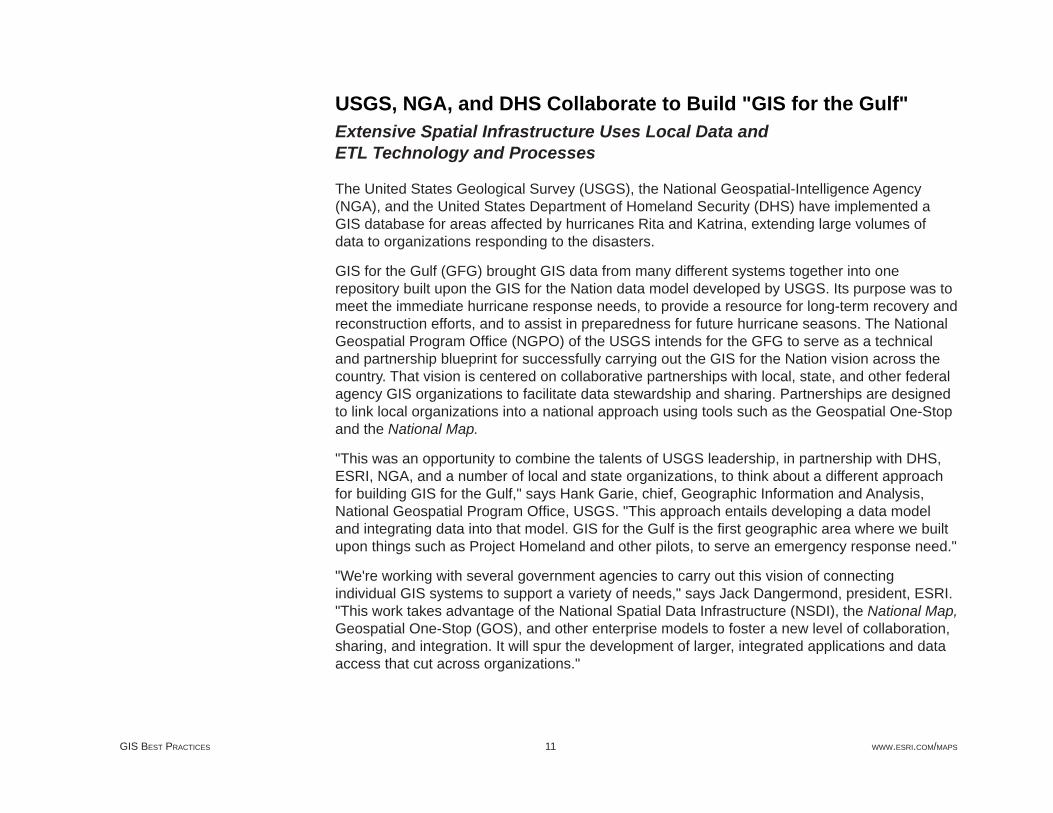
Hurricane Rita shown in ArcGIS (weather data provided by Meteorlogix).
As part of this effort, DHS, ESRI, NGA, and USGS are leveraging and enhancing the existing GOS portal to provide access to the GIS for the Gulf database via simple and easy-to-use applications within the current GOS portal application framework. In addition, these organizations are working together to integrate the GIS for the Nation database that was implemented for GIS for the Gulf within the NGA Palanterra system and the DHS Infrastructure
GIS BEST PRACTICES 13 WWW.ESRI.COM/MAPS
Critical Asset Viewer (iCAV) application. The NGA Palanterra system is being developed and supported under Project Homeland. Project Homeland is also providing technical support to the DHS iCAV Project, which is using the NGA Palanterra application.
Lessons learned from the 2004 tsunami and other recent natural and human-caused disasters have forced U.S. federal, state, and local agencies to examine how they can facilitate easier and more effective collaboration between organizations, particularly for leveraging independent local datasets that could be deployed immediately when needed.
Early in February 2005, USGS fi rst worked with local government agencies and other organizations to investigate building an all-purpose data-sharing information model that would work for local, state, regional, and national needs. This built upon previous GOS and Federal Geographic Data Committee data standards work and resulted in the fi rst draft GIS for the Nation design and specifi cations, which was presented in August 2005 at the ESRI International User Conference in San Diego, California.
"We had already worked with a number of partners and had many of the provisions in place for a GIS for the Nation model prior to the hurricane disasters," says Robert Pierce, USGS. "Then Hurricane Katrina came along. We used this event as an opportunity to use these specifi cations and models to pull information together for the affected area and provide it to emergency responders and commanders. We were able to integrate and build a lot of information for recovery and other purposes along the gulf."
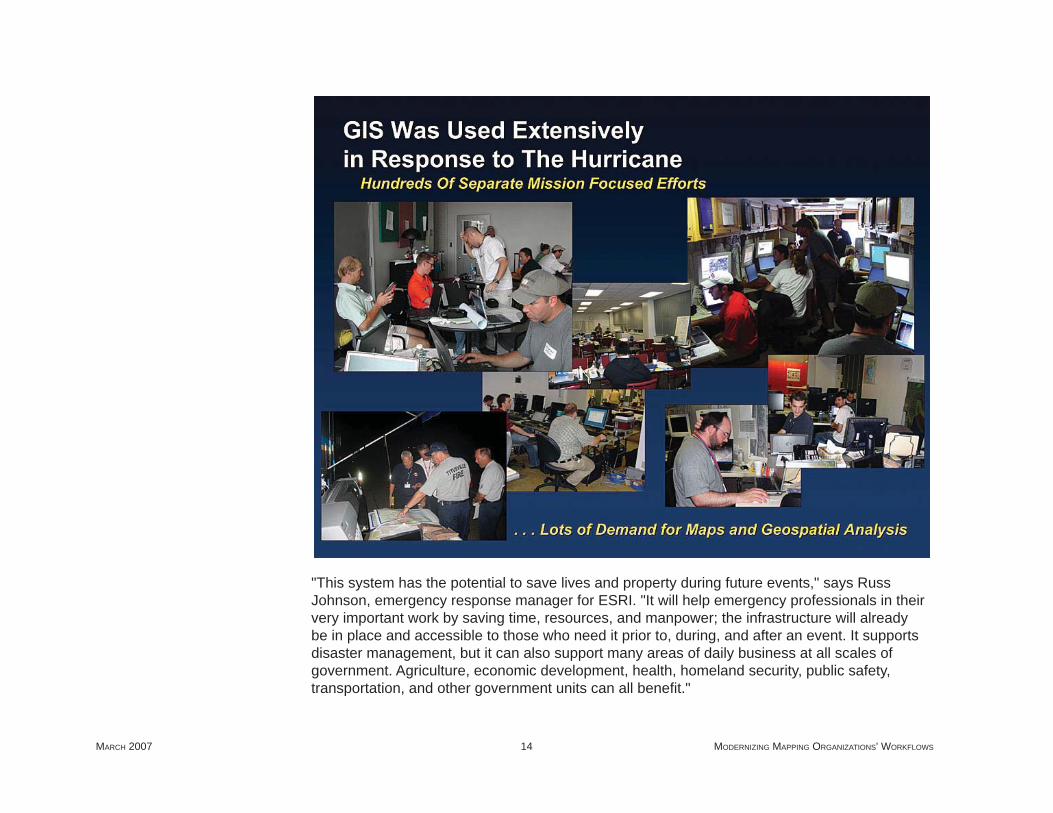
In the immediate aftermath of Hurricane Katrina, leaders from DHS, the Federal Emergency Management Agency (FEMA), NGA, and USGS began work on GIS for the Gulf, which includes the states of Alabama, Louisiana, Mississippi, and Texas. They worked to connect many different GIS systems and datasets into a greater whole. This required multiple-agency participation at all levels of government and private industry. These organizations began to share, import, integrate, and synchronize datasets into operational databases for the Emergency Operations Centers. The result was a comprehensive database based on a standardized, multiscale data model, providing a consistent view of data across jurisdictional boundaries. Integrated datasets were assembled and began to ship within just a few weeks.
Building an All-Purpose Data-Sharing Model
Building an All-Purpose Data-Sharing Model
MARCH 2007 14 MODERNIZING MAPPING ORGANIZATIONS' WORKFLOWS
"This system has the potential to save lives and property during future events," says Russ Johnson, emergency response manager for ESRI. "It will help emergency professionals in their very important work by saving time, resources, and manpower; the infrastructure will already be in place and accessible to those who need it prior to, during, and after an event. It supports disaster management, but it can also support many areas of daily business at all scales of government. Agriculture, economic development, health, homeland security, public safety, transportation, and other government units can all benefi t."
GIS BEST PRACTICES 15 WWW.ESRI.COM/MAPS
Today, GIS for the Gulf benefi ts from the many weeks of effort immediately following the hurricanes and the continued improvement and extension of the system.
Based on the USGS data model, GIS for the Gulf data themes include emergency operations, structures/critical infrastructure, government units, utilities, addresses, transportation, cadastral, hydrography, environmental, land use/land cover, basemap, elevation, geodetic control, and imagery. Data providers include dozens of local, county, state, and federal agencies in and around the gulf region.
There are several ways to access GIS for the Gulf via the Geospatial One-Stop portal. This includes a GIS for the Gulf viewer for responders, data download capabilities, and online data viewing, as well as custom Web services, such as "check my house," allowing the public to locate their homes and view current aerial photos of their neighborhoods. In addition, GIS for the Gulf data was delivered to FEMA joint fi eld offi ces as well as other government offi ces.
"What we ended up with was a database of the affected area consisting of roughly 60 data layers, including detailed parcel information and aerial imagery, combined with a suite of applications that allows data to be viewed, analyzed, and manipulated through GOS," says Garie. "In addition, for the fi rst time, USGS is able to deliver updated topographic maps on demand of the affected area. Users also have the ability to download this information all in a secure environment that is password protected."
Data collection was prioritized by geography and content, with focus on regional datasets, such as transportation and administrative boundaries from the four states, and large local datasets, such as parcels, structures, and aerial imagery, from the coastal counties.
Teams focused on fi nding data and performing extraction, transformation, and loading (ETL) processes and inputting data into the production server. This includes geographic features; related attribute information; and descriptive metadata, which incorporates data history.
In addition to individual systems, the extended regional GIS network is available for connecting systems at various levels of government. Standardized data content guidelines ensure consistent information for any user.
GIS for the Gulf Today
GIS for the Gulf Today
MARCH 2007 16 MODERNIZING MAPPING ORGANIZATIONS' WORKFLOWS
While GIS and existing shared data models proved essential, GIS leaders recognized several areas where improvements could be made.
The value of additional pre-event preparedness, particularly a fully integrated, deployable GIS infrastructure, would improve many different emergency response capabilities and processes for future events. It would also provide enormous value for long-term recovery. "We need to continue to reach out to local organizations and coordinate with statewide GIS leaders to ensure partnerships and data sharing agreements are in place. The time to develop collaborative relationships is not during an emergency, but well before," Garie stresses. The majority of data collection takes place at the local and state levels and moves up into federated systems. Information is captured by various participating agencies and is shared and exchanged as needed. The organizational framework promotes data sharing and data development. Based on needs requirements, a set of commonly used data, analyses, and other applications are already in place and are ready when an event occurs.
"GIS for the Gulf was a success because we were able to get it out of the door and into the hands of fi rst responders shortly after the hurricanes hit," says Pierce. "Now it is an ongoing project that will evolve and improve over time. It will provide a much better, easier, and more cost-effective solution for future events."
GIS for the Gulf provides knowledge exchange prior to an event regarding what data exists, where it is located, who owns it, how accessible it is, and more. It provides specifi c security levels for various datasets, ensuring only the right people view the right data. It also fosters organizations working together, sharing information, and effective operation using a common information palette.
There were several factors that contributed to the initial success of GIS for the Gulf and its future development. USGS staff was familiar with the data model and performed most of the ETL functions. In addition, much of the basemap (framework) data for the Gulf area was already available through the National Map. Strong existing relationships among DHS, FEMA, NGA, USGS, ESRI, and others enabled the team to collect more data. Many counties had GIS systems already in place and ready to be integrated. State and federal GIS clearinghouses were able to provide an enormous amount of data, such as National Hydrography Dataset and census. In addition, the USGS imagery services were available throughout the event.
Where GIS for the Gulf Goes From Here
Where GIS for the Gulf Goes From Here
GIS BEST PRACTICES 17 WWW.ESRI.COM/MAPS
"The future goal is to include the state of Florida as part of GIS for the Gulf and to extend the database to serve as a foundation for long-term recovery efforts, such as planning new communities, new schools, and more," says Garie. "The goal is to also include new digital datasets that are built and added to the integrated base. We want to share what we've done so that others can benefi t from it. Without the help of our partners down in that region, as well as other state and federal agencies, we would not have had the resources to pull together the integrated data model."
(Reprinted from the Winter 2005/2006 issue of ArcNews magazine)
GIS BEST PRACTICES 19 WWW.ESRI.COM/MAPS
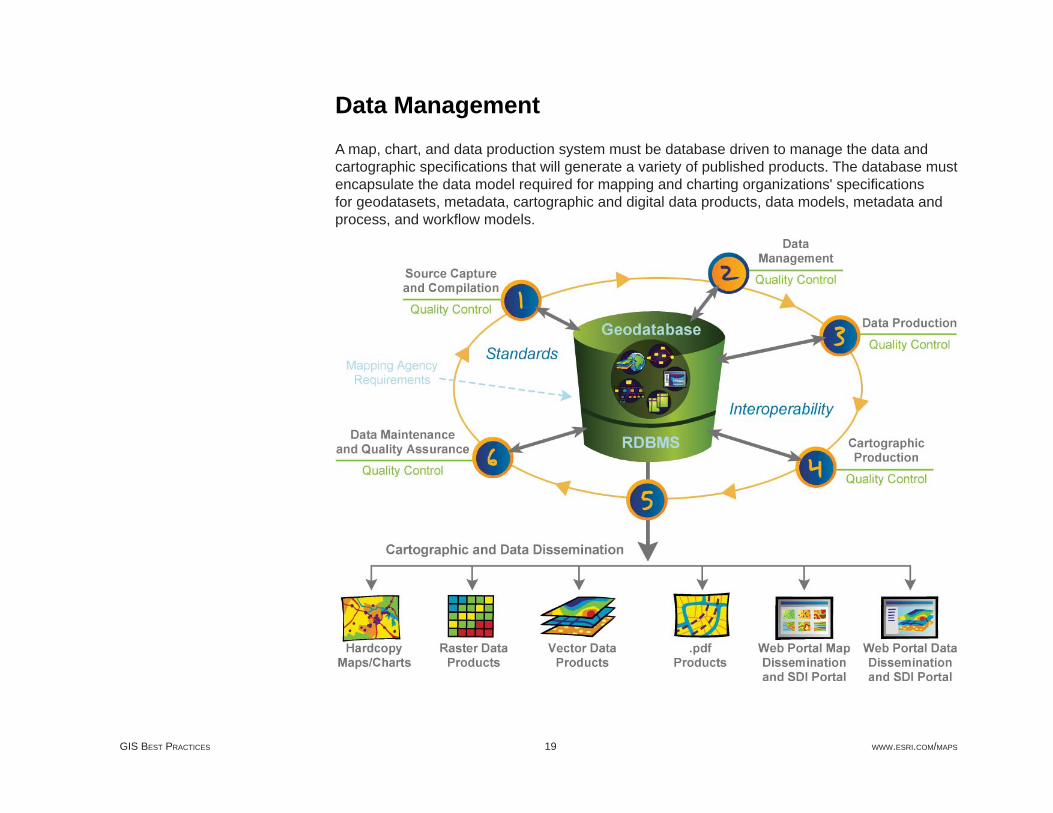
Data ManagementA map, chart, and data production system must be database driven to manage the data and cartographic specifi cations that will generate a variety of published products. The database must encapsulate the data model required for mapping and charting organizations' specifi cations for geodatasets, metadata, cartographic and digital data products, data models, metadata and process, and workfl ow models.
GIS BEST PRACTICES 21 WWW.ESRI.COM/MAPS
GIS for the Nation: the National GIS Data Model
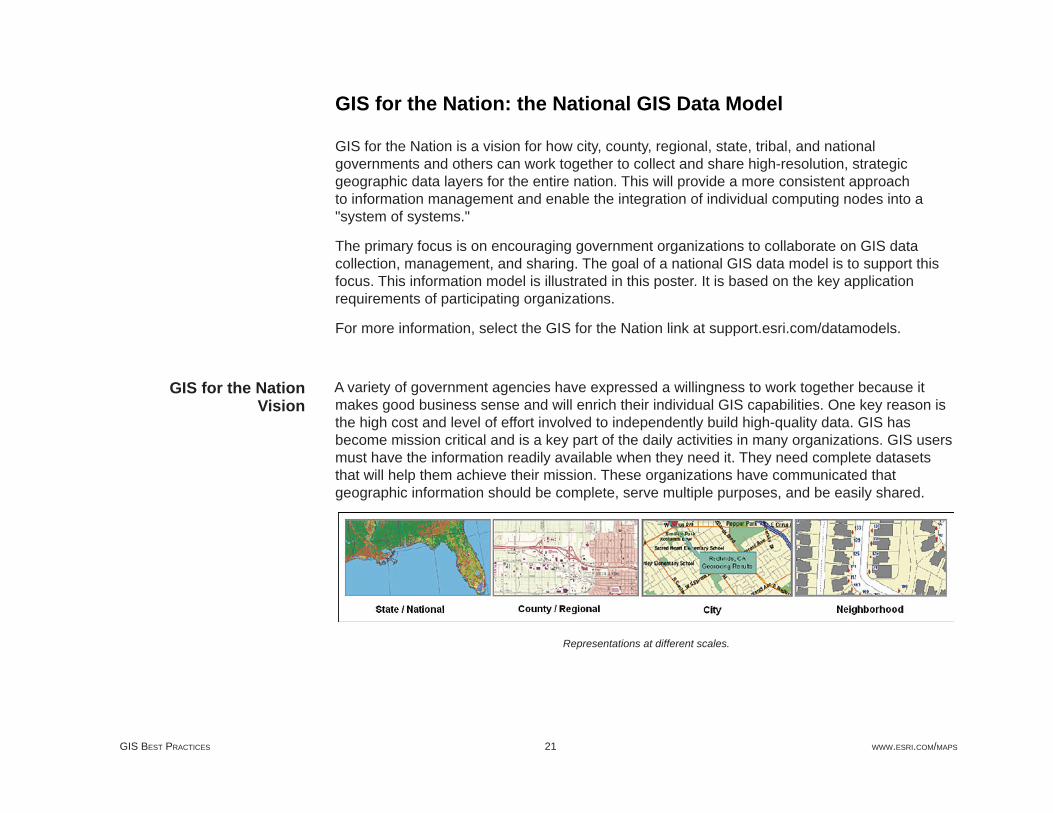
GIS for the Nation is a vision for how city, county, regional, state, tribal, and national governments and others can work together to collect and share high-resolution, strategic geographic data layers for the entire nation. This will provide a more consistent approach to information management and enable the integration of individual computing nodes into a "system of systems."
The primary focus is on encouraging government organizations to collaborate on GIS data collection, management, and sharing. The goal of a national GIS data model is to support this focus. This information model is illustrated in this poster. It is based on the key application requirements of participating organizations.
For more information, select the GIS for the Nation link at support.esri.com/datamodels.
A variety of government agencies have expressed a willingness to work together because it makes good business sense and will enrich their individual GIS capabilities. One key reason is the high cost and level of effort involved to independently build high-quality data. GIS has become mission critical and is a key part of the daily activities in many organizations. GIS users must have the information readily available when they need it. They need complete datasets that will help them achieve their mission. These organizations have communicated that geographic information should be complete, serve multiple purposes, and be easily shared.
Representations at different scales.
GIS for the Nation Vision
MARCH 2007 22 MODERNIZING MAPPING ORGANIZATIONS' WORKFLOWS
Twelve strategies provide the foundation of a GIS for the Nation:
The cornerstone is a comprehensive common data model. This shared data model, based on data provided by each participant, is designed to meet the needs of local, state, and tribal governments, as well as federal agencies.
The data model includes 14 data themes. There is a strategy for data development for each theme. Each strategy refl ects key information needs of the participants. For example, the strategy for orthoimagery calls for a minimum of six-inch to one-foot resolution in urban areas (fl own every two years) and one-meter resolution collected every three to fi ve years for the whole state or country.
Assign collection responsibility to the right organizations. In the United States, generally data should be collected locally, yet shared broadly and appropriately. Most of the strategic datasets are best collected by the local managing agencies, which can then be harvested, transformed, and shared. Local governments will collect many key datasets and organize them in regional data centers. States and national agencies will harvest these datasets into their systems for appropriate and agreed-upon reuse.
The data model is expressed as a set of minimum guidelines. User sites would agree to collect their data consistent with these minimum guidelines so that others can reuse their shared information with confi dence.
The data model is a framework for data sharing. The schemas in each individual organization must be tailored to address individual needs, yet also must support consistent sharing between organizations.
The data model must support a range of scales and geographic extents. Data models must be defi ned for use at a range of map scales in order to address a variety of problems and applications.
The data model must refl ect the needs of all participants. The design must be multipurpose. The design must be useful for many applications and must meet the varied needs of local, state, regional, tribal, and national organizations. Each user organization must be able to see their data requirements refl ected as elements in the comprehensive data model.
1.
2.
3.
4.
5.
6.
7.
GIS BEST PRACTICES 23 WWW.ESRI.COM/MAPS
The design must be application driven. The design must refl ect the information needs of each organization to meet their business needs.
The design must build upon best practices. The GIS for the Nation requires a simple system that works—one that builds on what many users are already doing or need to do.
The design must be open and interoperable and work in any GIS. The data models and designs need to be universal and work across a range of GIS systems.
Codevelopment requires data interchange and translation procedures for moving data between organizations and systems. Data translation procedures will be critical for facilitating information fl ows between various organizations and their independent, site-specifi c schemas.
Users can add to this framework as needed. It must be easy for users to extend this data model by adding additional data themes and by extending existing datasets.
At this point, a draft design and a series of data templates have been developed. Currently, these are being put into action and tested in a number of systems such as a GIS for the Gulf region affected by hurricanes Katrina and Rita. These efforts will be used to validate as well as to modify and improve this framework.
Organizations responsible for building spatial data infrastructures (SDIs) are emerging in many regions, countries, and continents. The GIS for the Nation is meant to assist in building application-driven SDIs. In the United States, many organizations are taking a leading role in these efforts, including the Department of Homeland Security and the Federal Emergency Management Agency, the National States Geographic Information Council, the USGS National Geospatial Programs Offi ce, and others, as well as numerous state and local government organizations.
(Reprinted from the Fall 2005 issue of ArcNews magazine)
8.
9.
10.
11.
12.
GIS BEST PRACTICES 25 WWW.ESRI.COM/MAPS
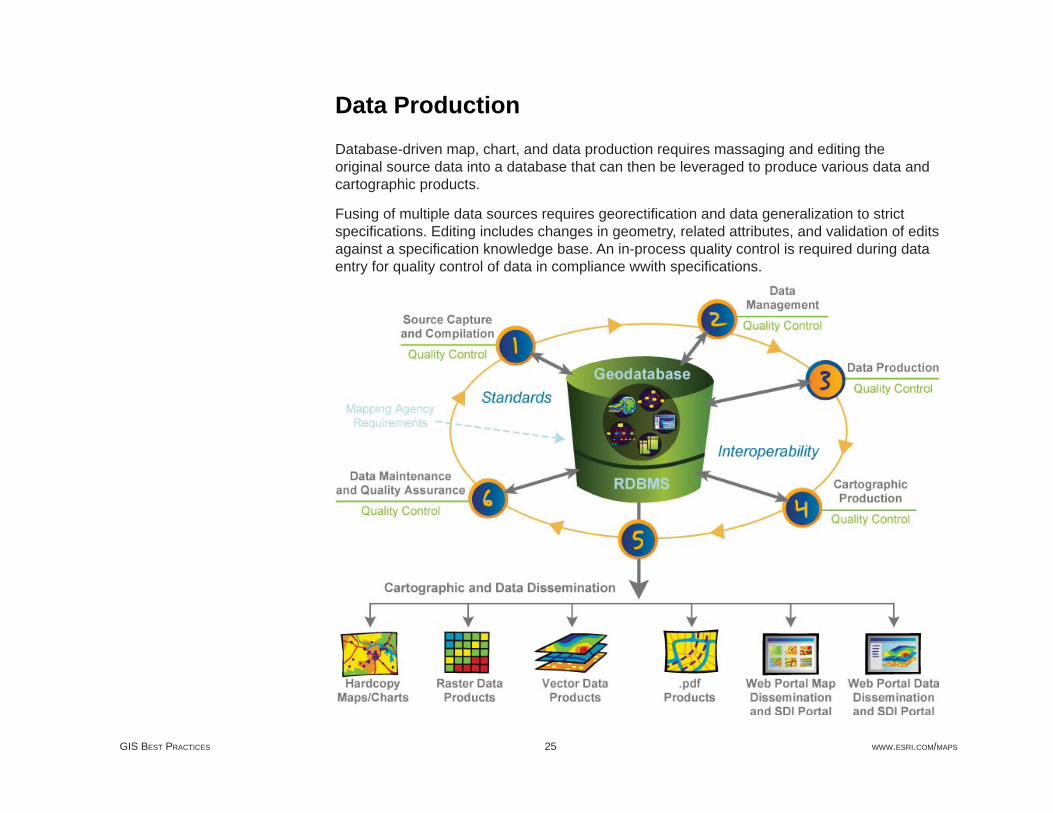
Data ProductionDatabase-driven map, chart, and data production requires massaging and editing the original source data into a database that can then be leveraged to produce various data and cartographic products.
Fusing of multiple data sources requires georectifi cation and data generalization to strict specifi cations. Editing includes changes in geometry, related attributes, and validation of edits against a specifi cation knowledge base. An in-process quality control is required during data entry for quality control of data in compliance wwith specifi cations.
GIS BEST PRACTICES 27 WWW.ESRI.COM/MAPS
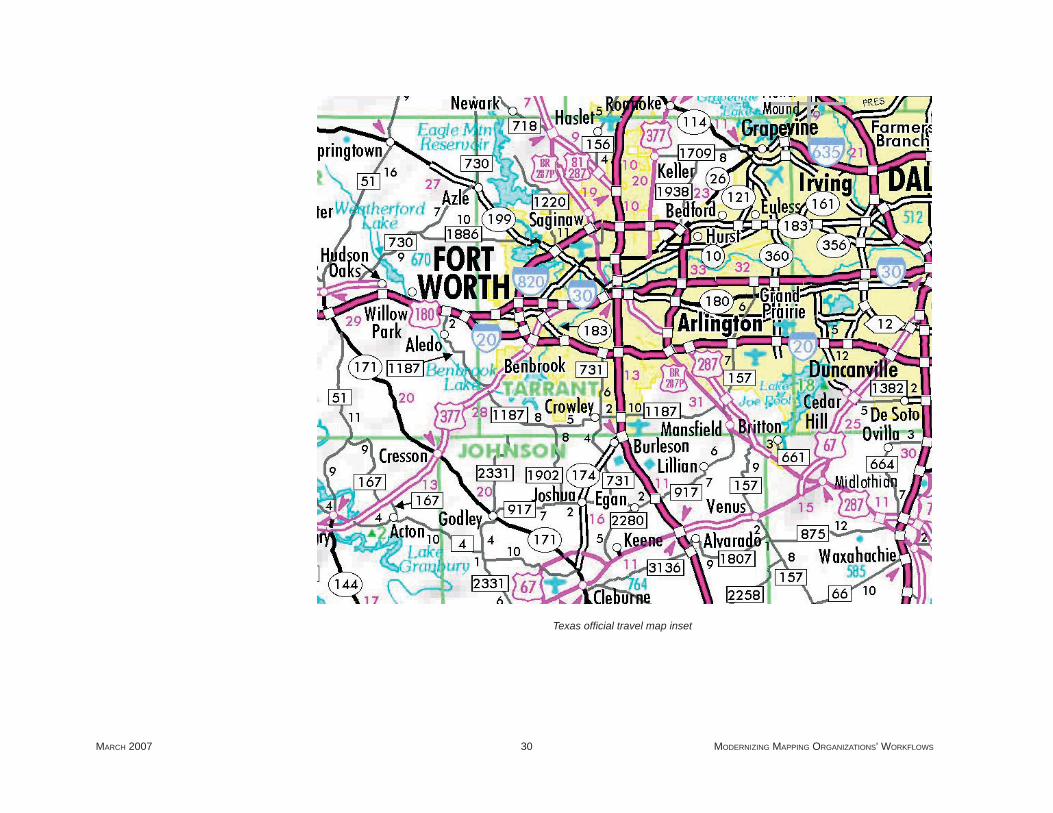
Texas Department of TransportationUsing GIS to Create Offi cial Travel Map
The mission of the Texas Department of Transportation (TxDOT) is to provide safe, effective, and effi cient movement of people and goods. The Travel Division of TxDOT supports the TxDOT mission by inspiring safe and pleasurable travel to and within Texas. The Texas Offi cial Travel Map is one of several publications produced by the Travel Division for this purpose.
The map is a standard, folded road map with the state of Texas on one side at a scale of approximately 1:1,500,000 and insets of major cities on the other side at various larger scales. When folded, the map has front and back covers that include illustrations and text. The map shows county lines, roads, rivers, lakes, and other feature data and indexes to features such as state parks, national wildlife refuges, forests, and grasslands. Other items on the map include a chart showing the mileage between cities in Texas, various travel information, and a legend.
When the time came to update the map, the Travel Division began by updating its mapmaking processes using geographic information system (GIS) technology from ESRI, which was being used in TxDOT. "All previous editions of the travel map were made using traditional cartographic methods, scribe coat, and stick-up text," explains Dan Mullis, Travel Division's travel map editor. "The processes involved in updating the map had become increasingly diffi cult and more expensive. Given the impending growth in TxDOT's GIS technology, it became clear that producing the map with GIS technology was our best option. Employing this new technology was essential to modernizing the map."
Problem Goals ResultsTraditional cartographic methods of updating maps are too diffi cult and expensive.
Make map editing easier.
Cut expenses associated with updating maps.
Automated map production process
Streamlined map editing process
Process transferrable to other map creation projects
The Challenge
MARCH 2007 28 MODERNIZING MAPPING ORGANIZATIONS' WORKFLOWS
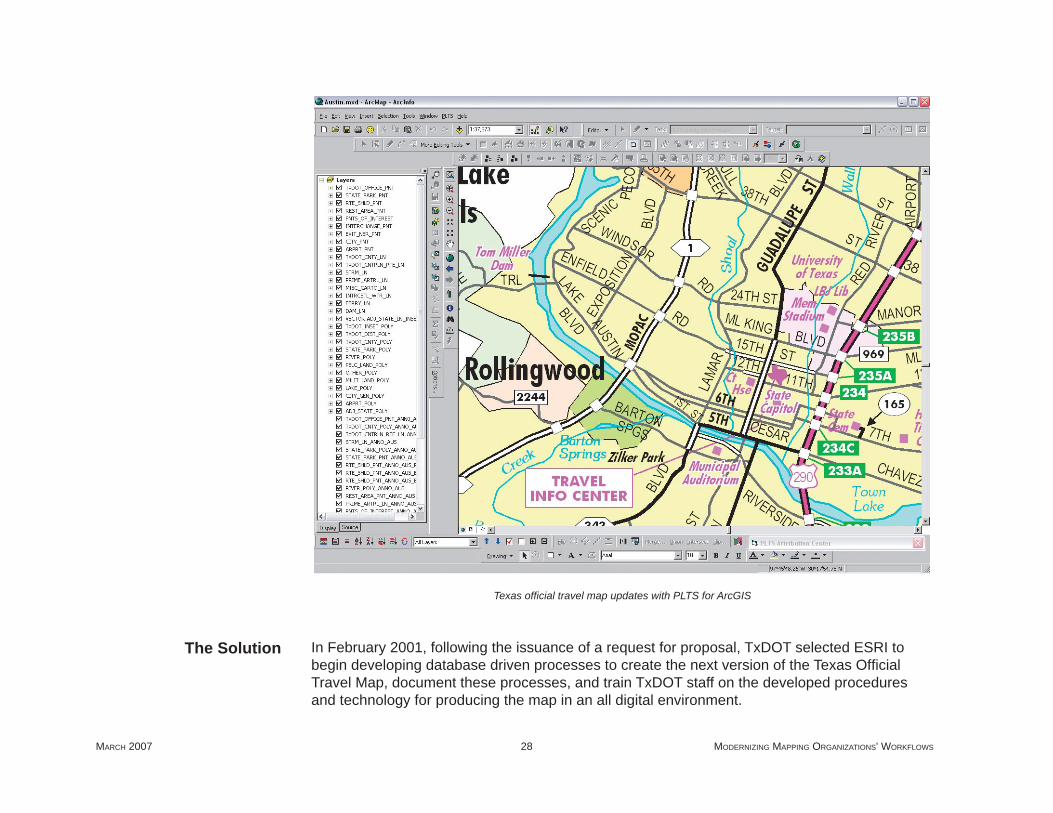
Texas offi cial travel map updates with PLTS for ArcGIS
In February 2001, following the issuance of a request for proposal, TxDOT selected ESRI to begin developing database driven processes to create the next version of the Texas Offi cial Travel Map, document these processes, and train TxDOT staff on the developed procedures and technology for producing the map in an all digital environment.
The Solution
GIS BEST PRACTICES 29 WWW.ESRI.COM/MAPS
"The key to the development of the automated mapping procedure was the implementation of a single centralized database," explains Mullis. "With ArcGIS and database driven technology, the geodatabase used by this project for the production of typical road maps contains all the geographic feature data that TxDOT once kept in a variety of digital formats."
After cartographic fi nishing and quality control, TxDOT worked with its vendors to create prepress proofs of the map.
Based on the success of a prototype area, TxDOT moved forward with its plans to develop the complete Texas Offi cial Travel Map including 26 city insets. To begin this phase, TxDOT completed implementation of an agencywide enterprise geodatabase that is maintained by its Information Systems Division and Geographic Information Systems and Database Administration offi ces. TxDOT staff migrated statewide data from numerous state and federal sources, many of which were used during prototyping.
ESRI took this migrated data and developed an update scenario with custom software tools that took data from the GIS enterprise geodatabase and pulled the changed features into GIS Data ReViewer; the Travel Division could then update the travel map geodatabase. Says Mullis, "Using the commercial off-the-shelf based GIS Data ReViewer for managing updated features eliminated the need for more expensive custom application development."
The process developed during this digitization project gives TxDOT more powerful tools to create other map-based products quickly and accurately for the traveling public. "The process we created for the Texas Offi cial Travel Map offers several key advantages to TxDOT," says Holly Ying, ESRI project manager. "It automates and improves the map production process by using a seamless enterprise geodatabase and ArcSDE solution."
Adds David Watkins, senior cartographic technical manager, ESRI, "The process allows the Travel Division to easily create map products for additional travel publications or to suit other business objectives. It also streamlines the update process of changes from the TxDOT enterprise geodatabase to the travel map geodatabase."
Results
MARCH 2007 30 MODERNIZING MAPPING ORGANIZATIONS' WORKFLOWS
Texas offi cial travel map inset
GIS BEST PRACTICES 31 WWW.ESRI.COM/MAPS
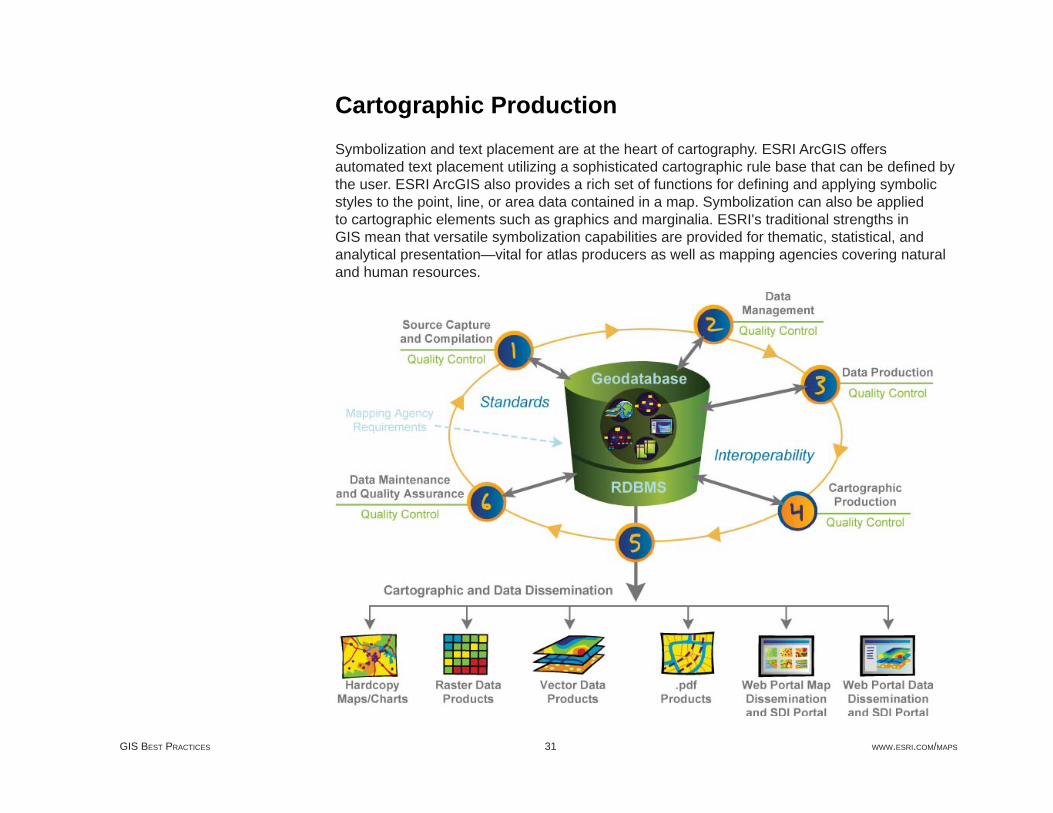
Cartographic ProductionSymbolization and text placement are at the heart of cartography. ESRI ArcGIS offers automated text placement utilizing a sophisticated cartographic rule base that can be defi ned by the user. ESRI ArcGIS also provides a rich set of functions for defi ning and applying symbolic styles to the point, line, or area data contained in a map. Symbolization can also be applied to cartographic elements such as graphics and marginalia. ESRI's traditional strengths in GIS mean that versatile symbolization capabilities are provided for thematic, statistical, and analytical presentation—vital for atlas producers as well as mapping agencies covering natural and human resources.
GIS BEST PRACTICES 33 WWW.ESRI.COM/MAPS
National Geographic Atlas of the World, Eighth Edition, Updated with GIS Moving from Coverages to Geodatabases for Physical and Political Maps
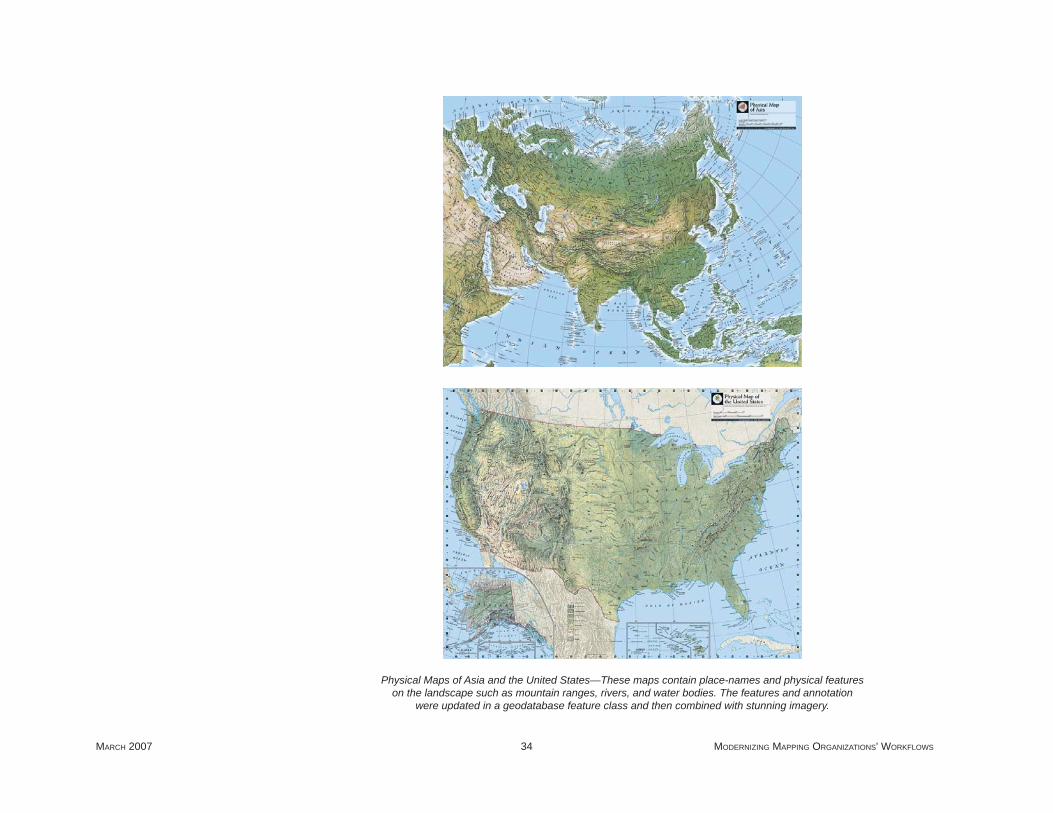
The eighth edition of the National Geographic Atlas of the World contains satellite views and maps of the earth's physical features—information encompassing cities, nations, and the physical and natural worlds—as well as political maps of all the countries on earth. It is also the only world atlas on the market with a fully integrated Internet component. The companion Web site to the atlas allows users to create custom views of maps, zoom into satellite globe imagery to detailed views of world landmarks, and download and print atlas updates.
The atlas is an update and expansion of the seventh edition. Updating a world atlas is a prodigious undertaking. Among other variables, countries change their boundaries, cities change their names, and highway construction changes the roads. To improve the update process, National Geographic has used digital techniques to produce the physical and political plates (i.e., two-page map spread) in the atlas since the seventh edition, when it fi rst created the ArcInfo coverages that produced these plates.
In addition to making the more than 17,000 updates in the eighth edition, National Geographic decided to move from coverages to ArcGIS personal geodatabases for the physical and political plates. The decision to move to geodatabase format will keep National Geographic at the forefront of technology and enable it to make future updates using the most advanced techniques available.
To move from coverage to geodatabase format, National Geographic selected ESRI's Professional Services Group and ESRI's team member, Aerial Information Systems, Inc. (AIS). Kevin Allen, the director of Map Services at National Geographic, indicates that the selection of the ESRI team was based on technical experience in creating both databases and geodatabases, past performance, and cost.
Updating the Physical and
Political Maps
MARCH 2007 34 MODERNIZING MAPPING ORGANIZATIONS' WORKFLOWS
Physical Maps of Asia and the United States—These maps contain place-names and physical features on the landscape such as mountain ranges, rivers, and water bodies. The features and annotation
were updated in a geodatabase feature class and then combined with stunning imagery.
GIS BEST PRACTICES 35 WWW.ESRI.COM/MAPS
To keep the content and the appearance of the physical and political plates consistent, ESRI, in cooperation with National Geographic, created a geodatabase model that accommodated the information in all the plates. David Watkins, the lead ESRI cartographer, reports that the geodatabase design was necessarily created in an iterative fashion, since additional information was rolled into the geodatabase design as it was discovered. Ultimately, however, all the personal geodatabases conformed to the same database model.
To convey the updates that were necessary, National Geographic created a digital edit overlay for each plate by using Adobe Illustrator; each overlay highlighted the updates and the location of changes to features and text. In addition to converting the coverage data to personal geodatabases, ESRI converted the Illustrator overlays to georeferenced TIFF fi les, then provided the geodatabases and the TIFF fi les to AIS, which edited the geodatabases with the latest version of the ArcMap application that is included in ArcGIS Desktop (ArcView, ArcEditor, ArcInfo). Primarily, ArcInfo was used for this project.
It was understood from the beginning that the ArcMap map documents would be converted into the Adobe Illustrator fi les with which National Geographic would publish the atlas. To streamline the ArcMap-to-Illustrator export procedure, layering in the map documents was predefi ned and symbology was customized to improve the work fl ow. For example, National Geographic provided its own Illustrator fi ll patterns, and the map document included these fi ll areas as solid fi ll symbols in a separate layer. This made it easy to replace the layer in the Illustrator fi le after the export. The same process was used for a custom color overlay and the dashed-line patterns.
After the conversion to Illustrator, National Geographic did some additional fi nishing, including some fi nal text placement adjustments, adding titles, scale bars, and some of the other information associated with page layouts. Finally, Illustrator was used to create the color separations used by the printer.
MARCH 2007 36 MODERNIZING MAPPING ORGANIZATIONS' WORKFLOWS
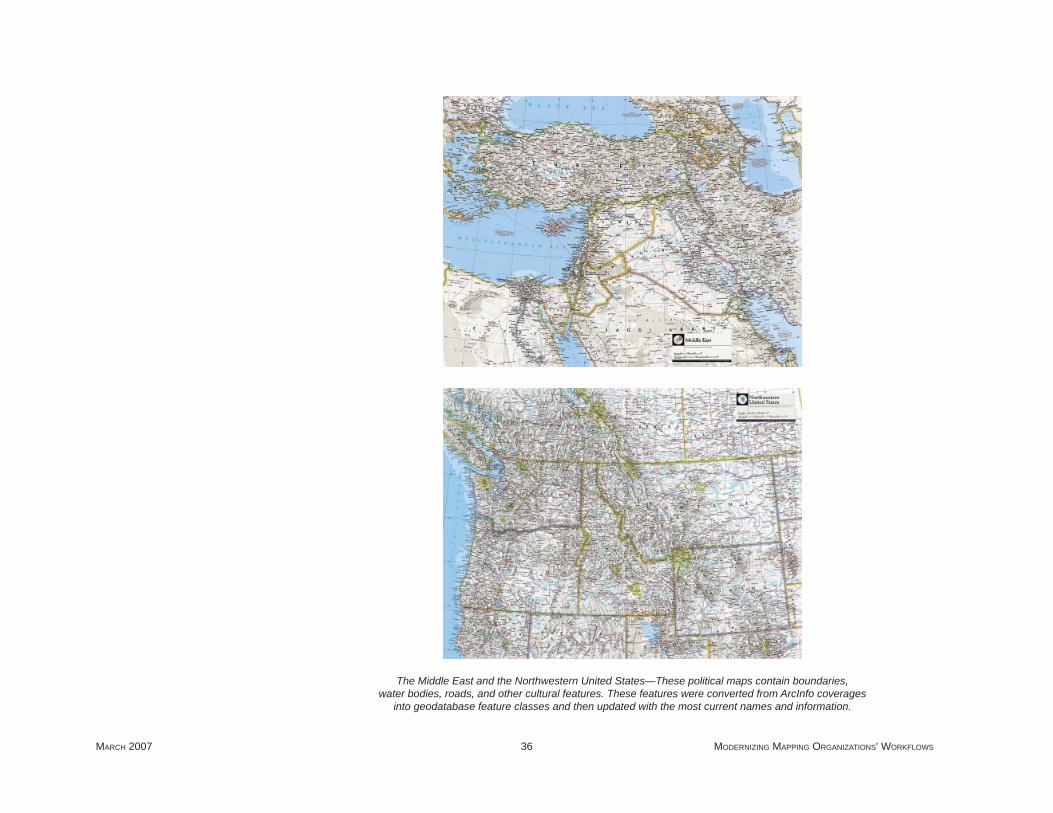
The Middle East and the Northwestern United States—These political maps contain boundaries, water bodies, roads, and other cultural features. These features were converted from ArcInfo coverages
into geodatabase feature classes and then updated with the most current names and information.
GIS BEST PRACTICES 37 WWW.ESRI.COM/MAPS
Watkins says that the index, which constitutes about one-third of the atlas, represents another signifi cant achievement. Each feature is identifi ed in the index by name, type (e.g., river, mountain), location, page number, and reference coordinate. Although this might sound simple, implementing the entries successfully means complying with a multitude of indexing rules.
A feature that appears on several pages in the atlas, for example, is indexed only to the best page for that feature. Some features have multiple names; these features are indexed on both the preferred and secondary names. Some rivers run through several countries and have a different name in each country. These names are linked in the index by "see also" references. Watkins reports that generating the index was ultimately handled with the help of ESRI's new PLTS software functionality that will be published in a future release of PLTS. The index, like the physical and political plates, was fi nished at National Geographic.
The ESRI team completed its part of the work in less than a year (June 2003 to May 2004), and National Geographic spent several months doing the atlas fi nishing, given that it was solely responsible for the satellite imagery and the other plates ESRI did not produce. "It's very important for people to realize that ESRI did not produce this atlas," says Mary Rosenbaum, the ESRI project manager. "ESRI supported the work that went into part of it, but National Geographic deserves the credit for the atlas as a whole." The atlas was printed in Brazil and shipped back to the United States in time for Christmas. It has been such a big success in the marketplace that it is about to go into a second printing.
National Geographic wants to publish the next version of the atlas entirely with ArcGIS Desktop. "Publishing with ArcMap will simplify the process and speed it up," says Allen. "We're looking forward to the streamlined process that will be associated with the next edition."
(Reprinted from the Summer 2005 issue of ArcNews magazine)
Preparing the Index
GIS BEST PRACTICES 39 WWW.ESRI.COM/MAPS
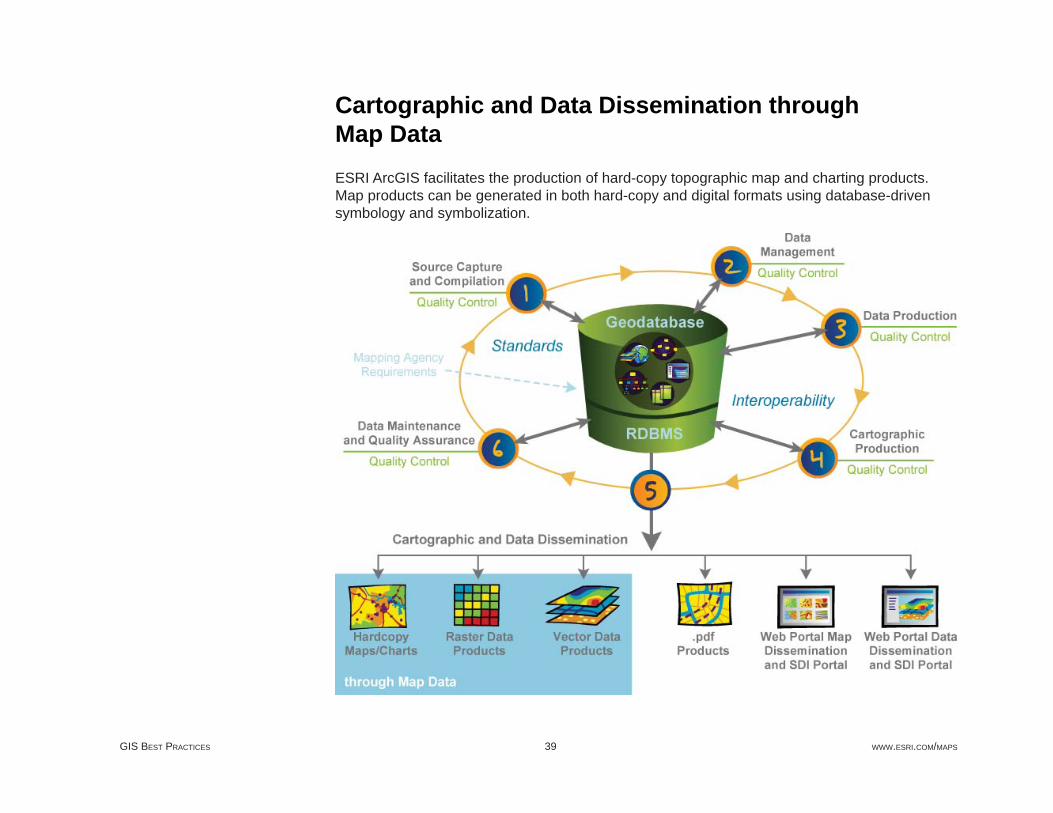
Cartographic and Data Dissemination through Map DataESRI ArcGIS facilitates the production of hard-copy topographic map and charting products. Map products can be generated in both hard-copy and digital formats using database-driven symbology and symbolization.
GIS BEST PRACTICES 41 WWW.ESRI.COM/MAPS
The Congressional Cartography Program Responds to United States Senate and House of Representatives with GIS Established by the U.S. Library of Congress, Geography and Map Division
In recent years, awareness and use of GIS within the United States Senate and House of Representatives has been limited to only a few congressional offi ces, with limited coordination between them. There hasn't been a one-stop GIS shop where congressional offi ces could obtain geographic information and services to make better informed policy decisions—until now. Housed in the Library of Congress, Geography and Map Division, the Congressional Cartography Program (CCP) was established in summer 2003 to provide congress with on-request cartographic products and services.
The Library of Congress has been collecting cartographic materials since its beginning in 1800. Today, the Geography and Map Division's holdings number more than fi ve million maps, charts, atlases, globes, models, and digital fi les, occupying a 2.5-acre space in the James Madison building in Washington, D.C. It is the largest and most comprehensive cartographic collection in the world. And now CCP provides a new realm of services for congress, using GIS software that provides dynamic, custom-made products.
The long-range mission of CCP is to perform the essential data acquisition and integration and cartographic design to develop customized applications for members and committees of congress and the Congressional Research Service—the public policy research arm of congress. Initially, CCP has been focusing on the development of a few basic cartographic products, but will ultimately develop into a multistaff geographic analysis program and one-stop decision support system. This system will be able to provide easy-to-use applications for basic reference mapping production and a backdrop for more sophisticated geographic analysis. Having a streamlined production application in place allows CCP staff members to focus their efforts on in-depth analysis, custom cartography (which may include an international scope), consulting, training, and geographic outreach.
Robert Dizard, Library of Congress deputy associate librarian of library services, states, "The Congressional Cartography Program allows us to meet the library's fi rst priority of service to congress by providing an insightful new way for members and staff to analyze public policy issues and develop legislative proposals. CCP also helps keep the Geography and Map
MARCH 2007 42 MODERNIZING MAPPING ORGANIZATIONS' WORKFLOWS
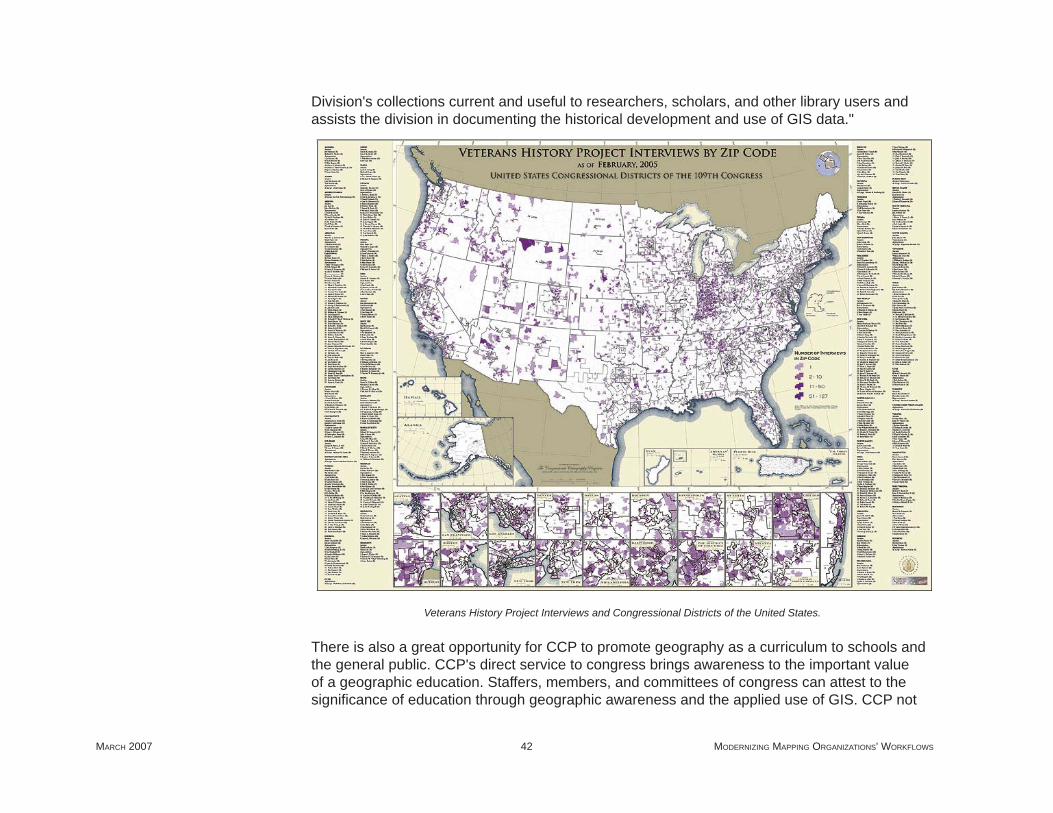
Division's collections current and useful to researchers, scholars, and other library users and assists the division in documenting the historical development and use of GIS data."
Veterans History Project Interviews and Congressional Districts of the United States.
There is also a great opportunity for CCP to promote geography as a curriculum to schools and the general public. CCP's direct service to congress brings awareness to the important value of a geographic education. Staffers, members, and committees of congress can attest to the signifi cance of education through geographic awareness and the applied use of GIS. CCP not
GIS BEST PRACTICES 43 WWW.ESRI.COM/MAPS
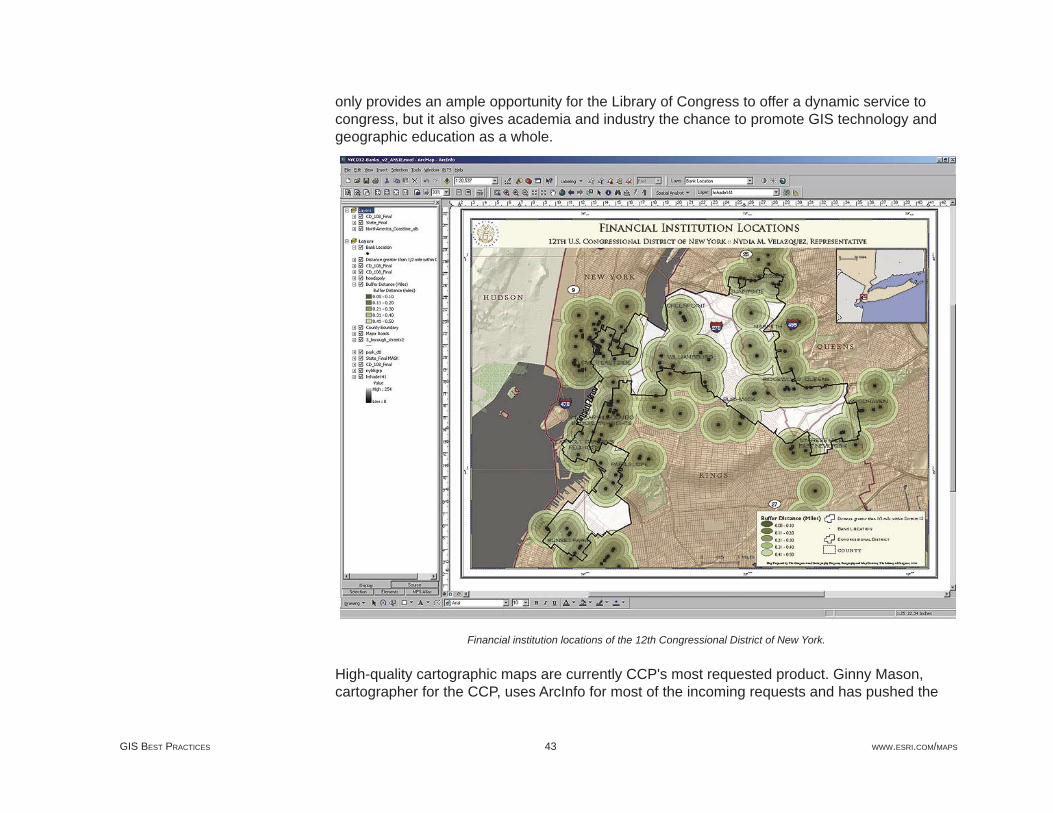
only provides an ample opportunity for the Library of Congress to offer a dynamic service to congress, but it also gives academia and industry the chance to promote GIS technology and geographic education as a whole.
Financial institution locations of the 12th Congressional District of New York.
High-quality cartographic maps are currently CCP's most requested product. Ginny Mason, cartographer for the CCP, uses ArcInfo for most of the incoming requests and has pushed the
MARCH 2007 44 MODERNIZING MAPPING ORGANIZATIONS' WORKFLOWS
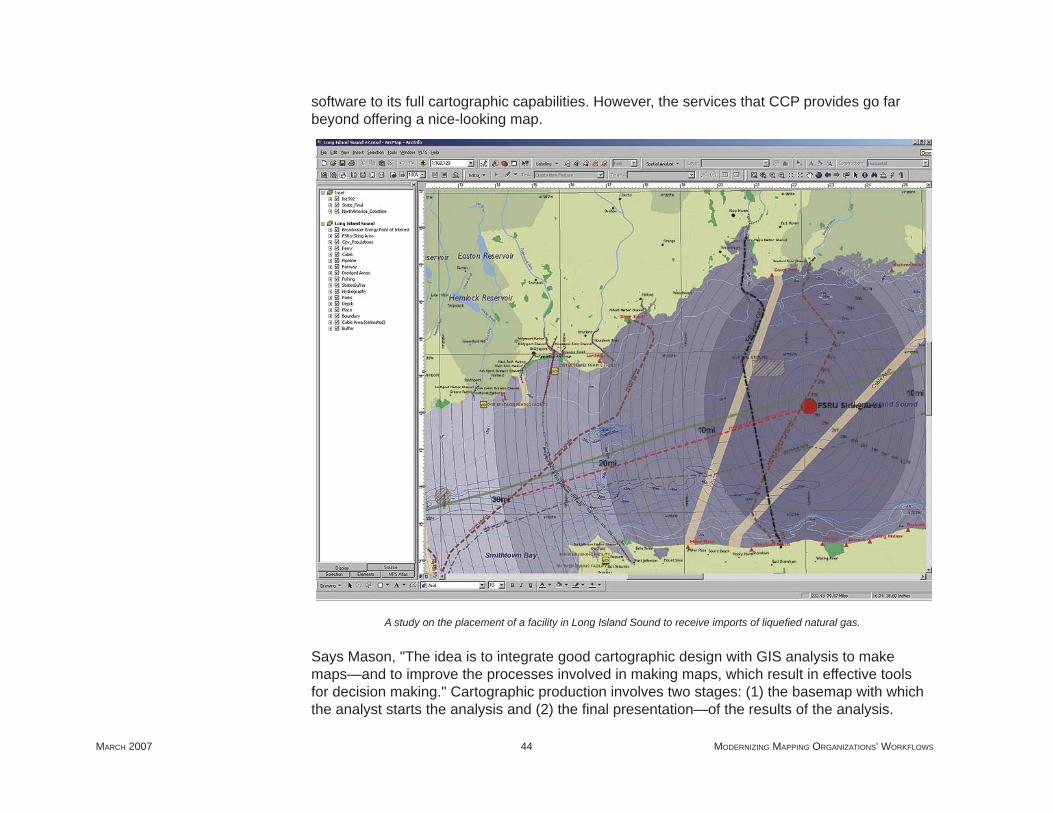
software to its full cartographic capabilities. However, the services that CCP provides go far beyond offering a nice-looking map.
A study on the placement of a facility in Long Island Sound to receive imports of liquefi ed natural gas.
Says Mason, "The idea is to integrate good cartographic design with GIS analysis to make maps—and to improve the processes involved in making maps, which result in effective tools for decision making." Cartographic production involves two stages: (1) the basemap with which the analyst starts the analysis and (2) the fi nal presentation—of the results of the analysis.
GIS BEST PRACTICES 45 WWW.ESRI.COM/MAPS
Geographic services provided by CCP aid in the performance of the intermediate stage—the actual analysis.
To serve congress in a timely and effi cient manner, CCP has created a map template approach to cartographic production that allows effi cient production of frequently requested core cartographic products. The templates provide customers with products that allow quick turnover for frequently requested geographical extents, such as maps of congressional districts and individual states, so they can devote more staff time to complex analysis and geographic services. CCP is developing a cartographic design standard to optimize end-use needs and provide a trademark product distinctive of the Library of Congress. Beginning with maps of congressional districts and individual states, CCP will then move on to other extents, such as maps of counties, individual countries of the world, U.S. ZIP Codes, and thematic distributions of various data at a national scale. In developing these basemap products, CCP is creating a cartographic geodatabase model within ArcInfo, thus streamlining cartographic production.
Currently, the more sophisticated GIS requests from congress are just beginning, mainly because many staff members are only now catching on to the capabilities that GIS has to offer for their projects. An offi ce may request a map of fi nancial institutions in its district, when what it really wants to know is where the underserved fi nancial areas in its district are located and why. CCP takes requests and inquiries to the next level by investigating the issue at hand and working side by side with staffers and analysts to educate and promote the value of GIS.
Using ArcSDE on an Oracle database, CCP has compiled data from Tele Atlas, the United States Geological Survey, and requested projects from its own central data repository. ESRI's Professional Services Division assisted in the implementation of this database and also the strategy and planning of an enterprise structure that would be capable of handling a large number of requests, as well as future intranet applications for congress. This data infrastructure is also the foundation for the program's map templates, which led CCP to retain ESRI Professional Services during the infrastructure implementation. Jacob Zonn, CCP analyst, states, "To create a strong enterprise structure from the bottom up, it was imperative that ESRI Professional Services play a large role in the initial implementation, especially since our program uses ESRI software to deploy our products."
(Reprinted from the Summer 2005 issue of ArcNews magazine)
GIS BEST PRACTICES 47 WWW.ESRI.COM/MAPS
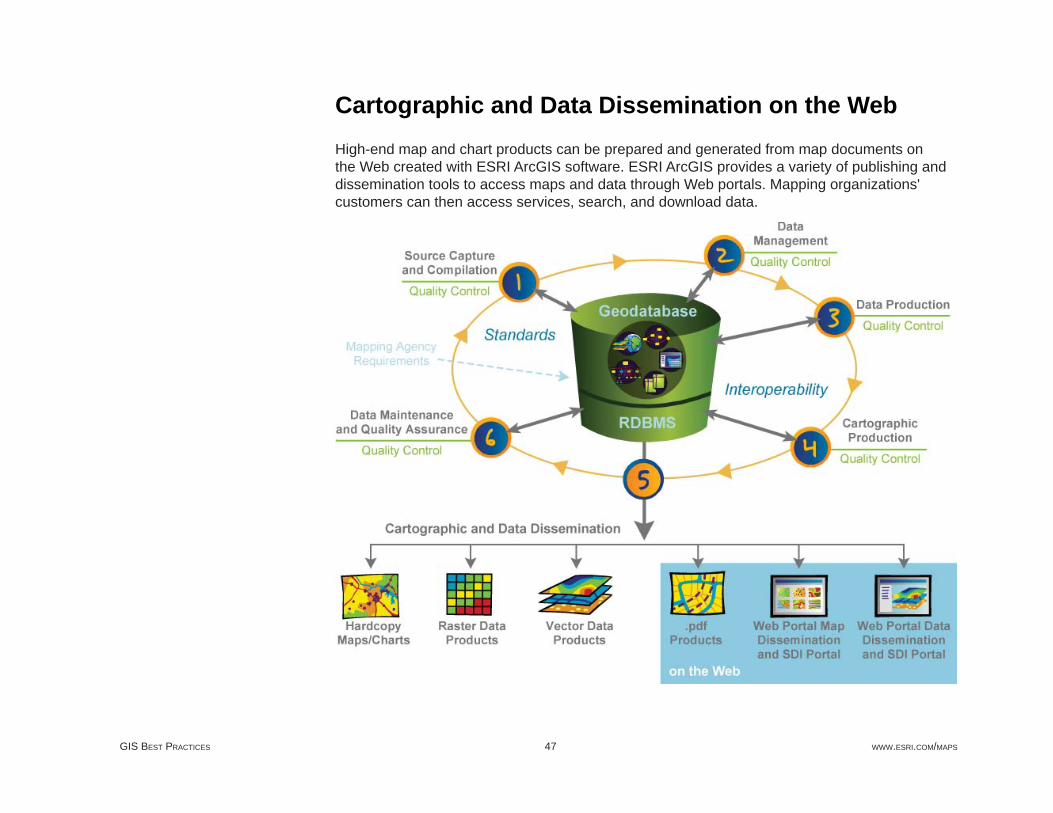
Cartographic and Data Dissemination on the WebHigh-end map and chart products can be prepared and generated from map documents on the Web created with ESRI ArcGIS software. ESRI ArcGIS provides a variety of publishing and dissemination tools to access maps and data through Web portals. Mapping organizations' customers can then access services, search, and download data.
GIS BEST PRACTICES 49 WWW.ESRI.COM/MAPS
Geospatial One-Stop Portal Receives Excellence.Gov Award
The United States Department of the Interior (DOI) and the United States Geological Survey (USGS) recently won the Excellence.Gov Award for the Geospatial One-Stop (GOS) Web portal. In its sixth year and sponsored by the American Council for Technology (ACT), the award was presented to fi ve winners selected for demonstrating best practices in information sharing for federally led information technology program implementations.
"We're honored to receive this prestigious award from the American Council for Technology," says Karen Siderelis, associate director for geospatial information, USGS and DOI. "We developed Geospatial One-Stop as a resource serving both government and private agencies, as well as the general public. Its purpose is to help individuals and organizations share and access information to make better, more-informed decisions. We're grateful for the acknowledgment and will continue to make Geospatial One-Stop the best possible Internet resource."
A panel of 23 judges from both the private and public sectors selected the top fi ve winners from more than 80 applicants. In addition to the fi ve winners, 20 programs were also honored as fi nalists. The announcement was made February 15, 2006, in Washington, D.C., at a ceremony luncheon with a keynote address by Congressman Tom Davis.
Geospatial One-Stop (www.geodata.gov) is a Web-based portal that provides a resource to discover and view maps, data, and other geospatial services from across the United States. The GOS portal is used by state, local, and tribal governments, as well as the private sector and academia, to access and share geospatial information, improve planning for future investments in geospatial data, expand partnerships, collaborate on the development and implementation of standards for data sharing, and support the decision-making needs of governments and organizations.
The portal was an invaluable resource during Hurricanes Katrina and Rita: it made available critical information that aided federal, state, and local agencies in emergency response activities. Virtual Internet communities were also established. Thousands of sources were made available using an interactive Hurricane Map Viewer and Louisiana State basemap. Maps and images were available for print, download, or e-mail.
MARCH 2007 50 MODERNIZING MAPPING ORGANIZATIONS' WORKFLOWS
Scott Cameron, deputy assistant secretary for Policy, Management, and Budget (DOI) and managing partner of Geospatial One-Stop, attended the ceremony and accepted the award on behalf of the Department of the Interior. Geospatial One-Stop partners honored at the awards ceremony included Hank Garie, executive director of Geospatial One-Stop; Karen Siderelis and Leslie Wollack of USGS; Bert Jarreau of the National Association of Counties; Bill Burgess of the National States Geographic Information Council; and Pat Cummens of ESRI.
Says Cummens: "ESRI is privileged to serve these two government agencies and help them carry out their mission of providing geographic knowledge using the Internet."
(Reprinted from the Spring 2006 issue of ArcNews magazine)
GIS BEST PRACTICES 51 WWW.ESRI.COM/MAPS
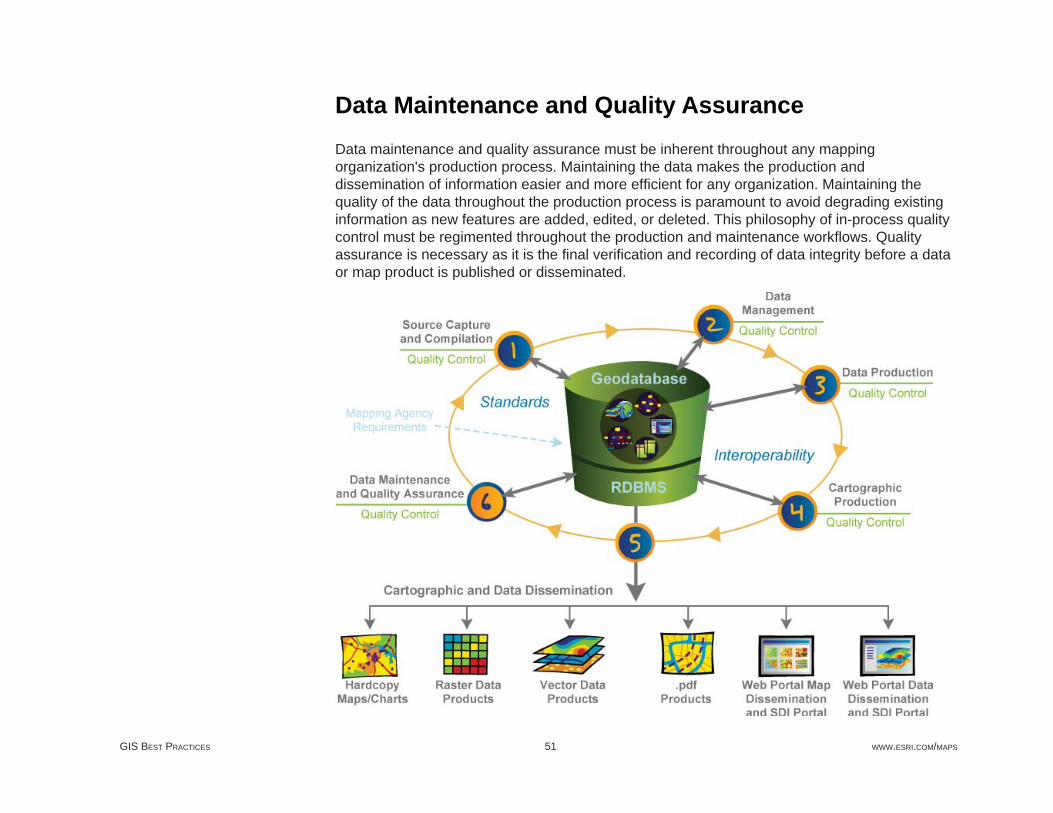
Data Maintenance and Quality AssuranceData maintenance and quality assurance must be inherent throughout any mapping organization's production process. Maintaining the data makes the production and dissemination of information easier and more effi cient for any organization. Maintaining the quality of the data throughout the production process is paramount to avoid degrading existing information as new features are added, edited, or deleted. This philosophy of in-process quality control must be regimented throughout the production and maintenance workfl ows. Quality assurance is necessary as it is the fi nal verifi cation and recording of data integrity before a data or map product is published or disseminated.
MARCH 2007 52 MODERNIZING MAPPING ORGANIZATIONS' WORKFLOWS
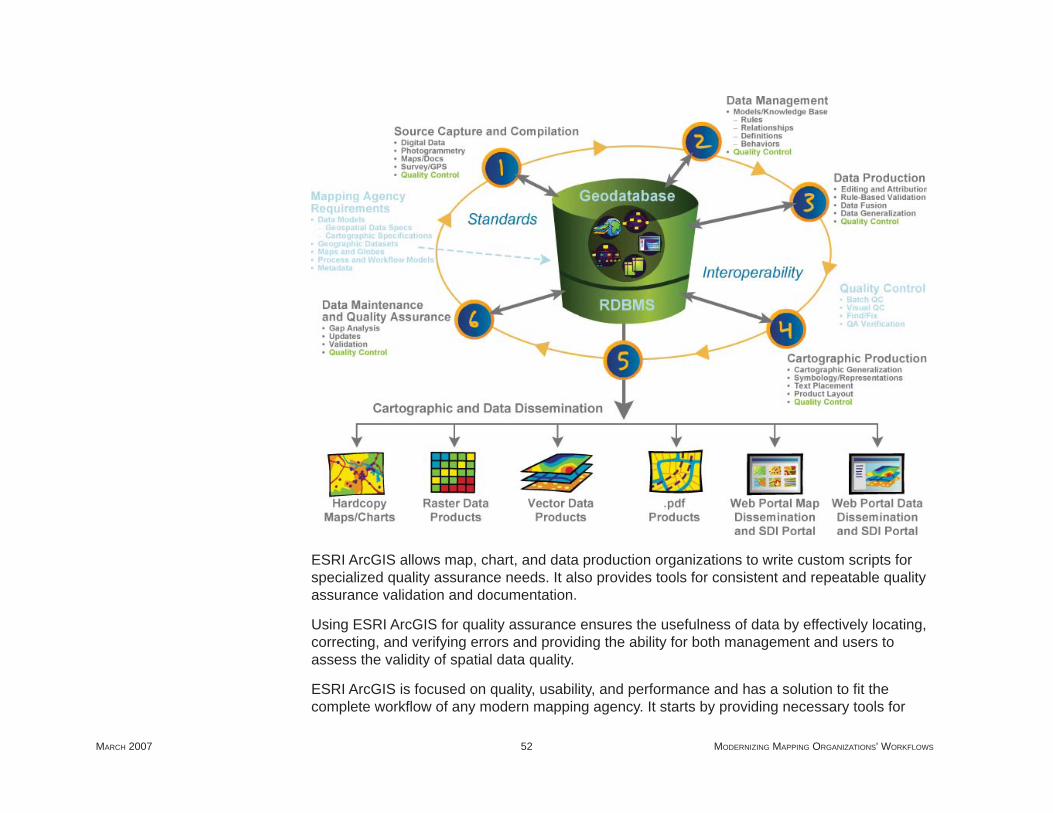
ESRI ArcGIS allows map, chart, and data production organizations to write custom scripts for specialized quality assurance needs. It also provides tools for consistent and repeatable quality assurance validation and documentation.
Using ESRI ArcGIS for quality assurance ensures the usefulness of data by effectively locating, correcting, and verifying errors and providing the ability for both management and users to assess the validity of spatial data quality.
ESRI ArcGIS is focused on quality, usability, and performance and has a solution to fi t the complete workfl ow of any modern mapping agency. It starts by providing necessary tools for
GIS BEST PRACTICES 53 WWW.ESRI.COM/MAPS
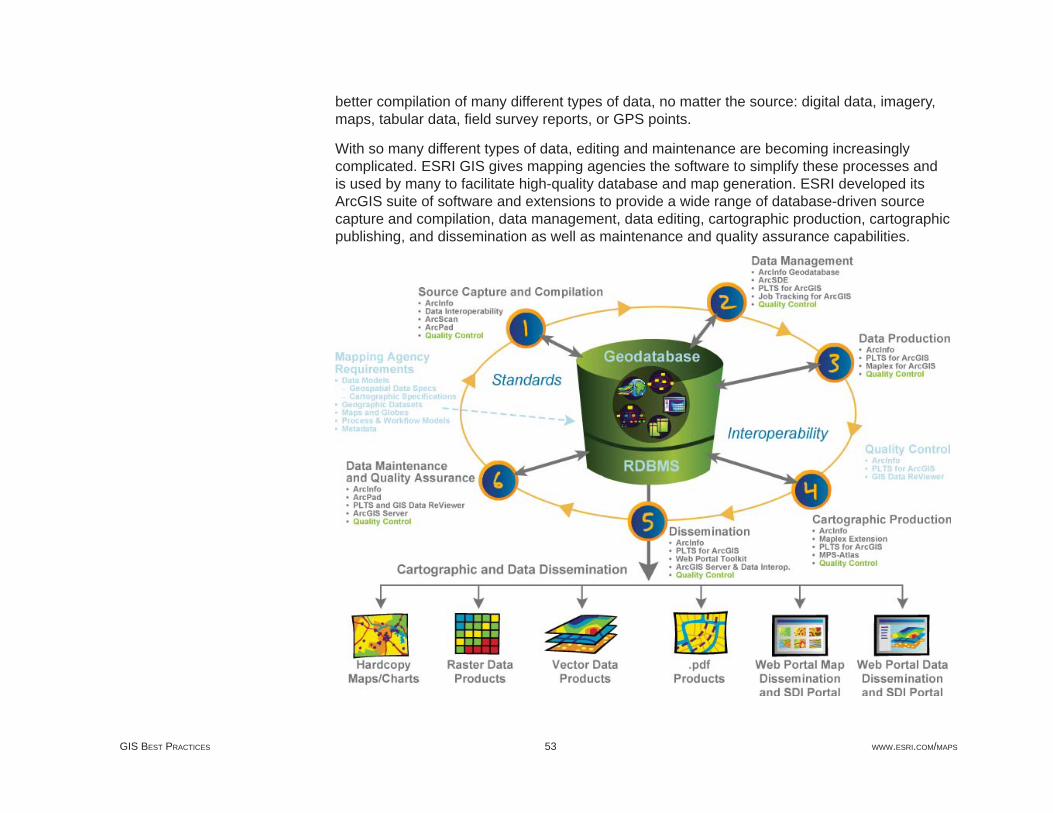
better compilation of many different types of data, no matter the source: digital data, imagery, maps, tabular data, fi eld survey reports, or GPS points.
With so many different types of data, editing and maintenance are becoming increasingly complicated. ESRI GIS gives mapping agencies the software to simplify these processes and is used by many to facilitate high-quality database and map generation. ESRI developed its ArcGIS suite of software and extensions to provide a wide range of database-driven source capture and compilation, data management, data editing, cartographic production, cartographic publishing, and dissemination as well as maintenance and quality assurance capabilities.
GIS BEST PRACTICES 55 WWW.ESRI.COM/MAPS
BAE SystemsAutomated QA/QC Tests Aid in Map Production
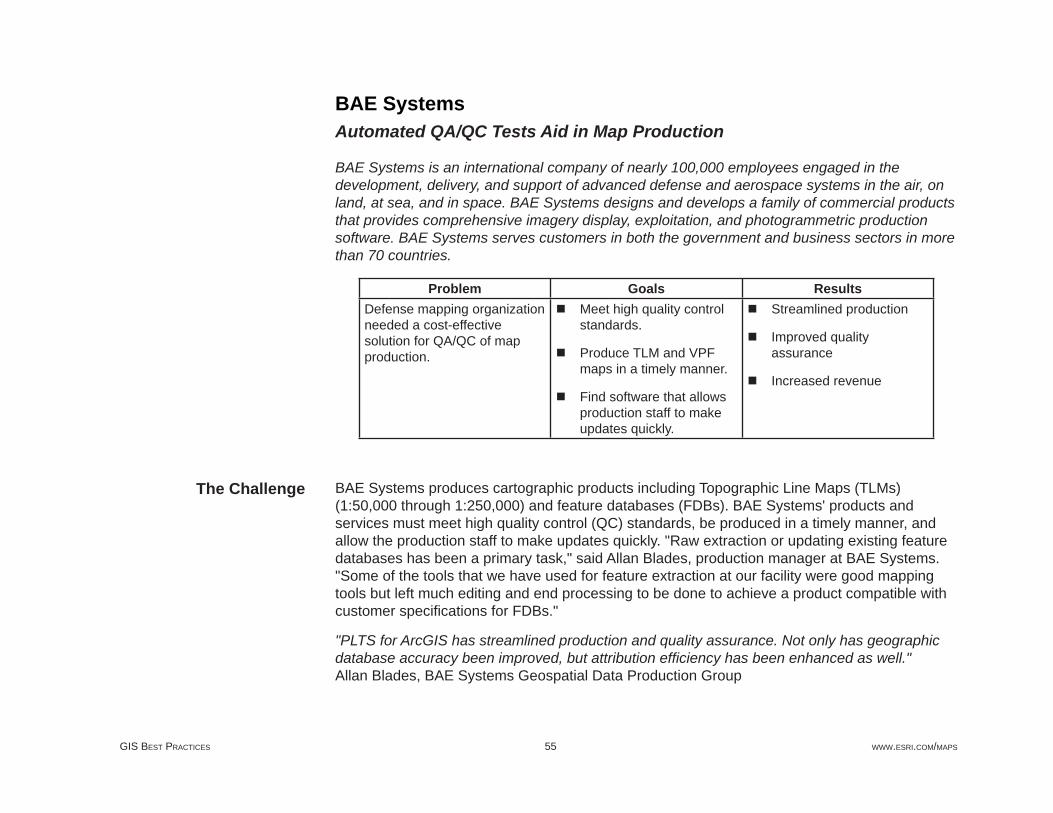
BAE Systems is an international company of nearly 100,000 employees engaged in the development, delivery, and support of advanced defense and aerospace systems in the air, on land, at sea, and in space. BAE Systems designs and develops a family of commercial products that provides comprehensive imagery display, exploitation, and photogrammetric production software. BAE Systems serves customers in both the government and business sectors in more than 70 countries.
Problem Goals ResultsDefense mapping organization needed a cost-effective solution for QA/QC of map production.
Meet high quality control standards.
Produce TLM and VPF maps in a timely manner.
Find software that allows production staff to make updates quickly.
Streamlined production
Improved quality assurance
Increased revenue
BAE Systems produces cartographic products including Topographic Line Maps (TLMs) (1:50,000 through 1:250,000) and feature databases (FDBs). BAE Systems' products and services must meet high quality control (QC) standards, be produced in a timely manner, and allow the production staff to make updates quickly. "Raw extraction or updating existing feature databases has been a primary task," said Allan Blades, production manager at BAE Systems. "Some of the tools that we have used for feature extraction at our facility were good mapping tools but left much editing and end processing to be done to achieve a product compatible with customer specifi cations for FDBs."
"PLTS for ArcGIS has streamlined production and quality assurance. Not only has geographic database accuracy been improved, but attribution effi ciency has been enhanced as well."Allan Blades, BAE Systems Geospatial Data Production Group
The Challenge
MARCH 2007 56 MODERNIZING MAPPING ORGANIZATIONS' WORKFLOWS
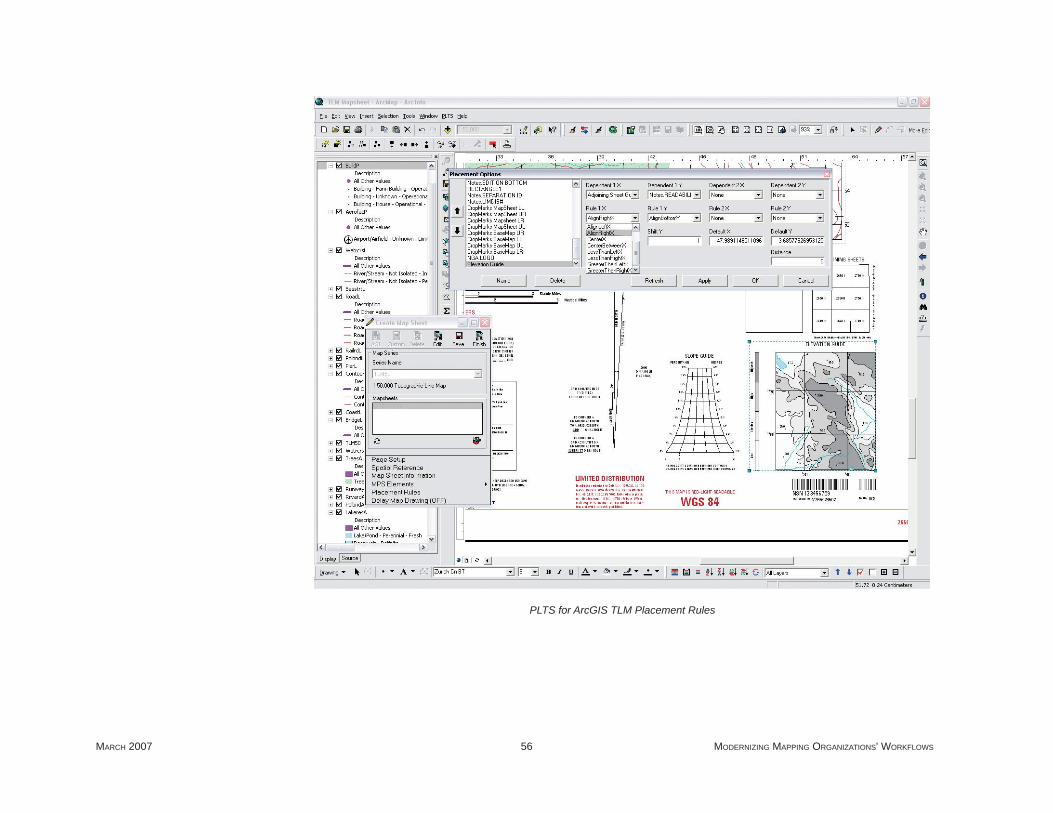
PLTS for ArcGIS TLM Placement Rules
GIS BEST PRACTICES 57 WWW.ESRI.COM/MAPS
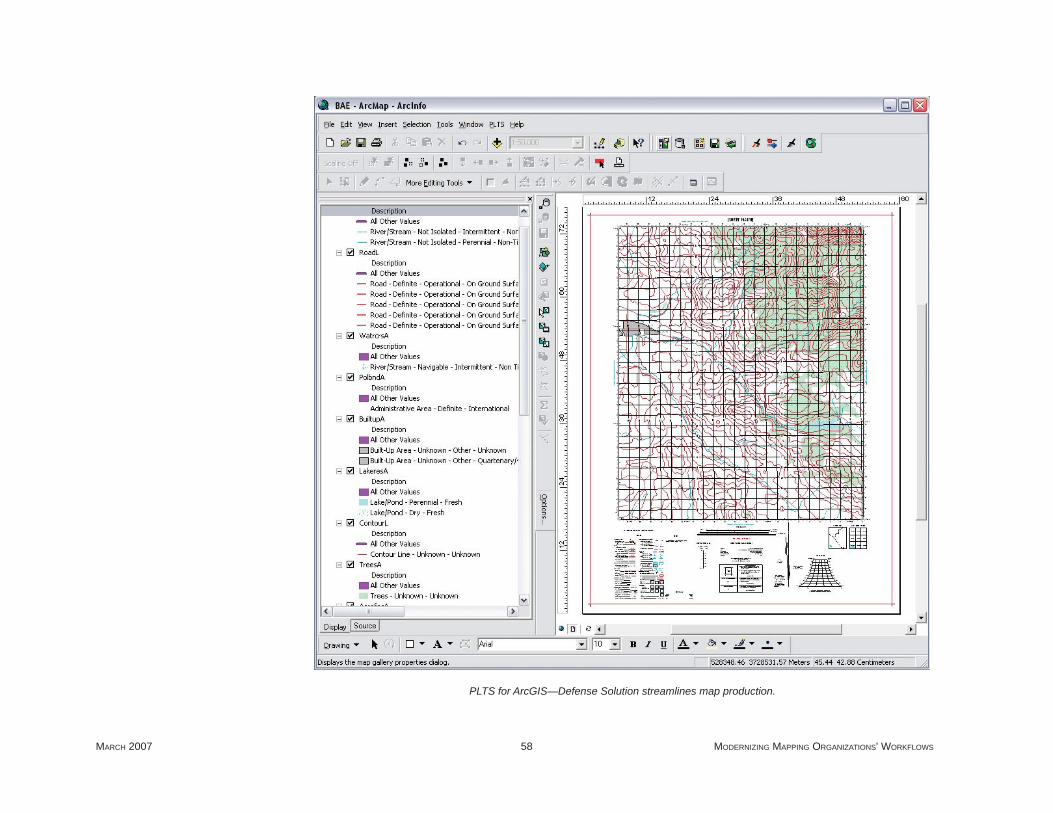
BAE Systems found that ESRI's Production Line Tool Set (PLTS) for ArcGIS—Defense Solution permits the company to streamline production and facilitate project-specifi c customization for a variety of its customers' needs. PLTS for ArcGIS is a collection of software applications for building and maintaining digital databases and for cartographic map production. These tools have been developed to produce standard defense industry-compliant cartographic products—including digital data in Vector Product Format and hard-copy products such as TLMs—that meet military specifi cations.
BAE Systems uses PLTS for ArcGIS to convert a variety of project-specifi c input fi les to ArcGIS through a fully automated, menu-driven process. Integrity checking is performed during the conversion, and reports are evaluated for errors and status checking. Next, the geospatial products and solutions project managers or senior technicians modify database fi les to build a template that meets the customer's needs. After areas of interest are assigned to extraction teams, extractors use the various PLTS for ArcGIS tools to ensure quality and consistency of the project. Visual QC of each cell is performed at interim milestones throughout the project's life cycle.
PLTS ArcGIS Data ReViewer is an important component for feedback to the extractor from the QC team. Automated QC is performed when the cell is complete. This incorporates geometry checks and topology rule checks. "With PLTS for ArcGIS, we can perform automated tests that were previously not available," said Blades.
"ESRI's user interface and support are reliable components of our production processes. The ESRI PLTS for ArcGIS team is very responsive to the time-sensitive needs of its users," said Ryan Ashker, BAE Systems task order manager and GIS specialist in San Diego. Now, BAE Systems has the QA/QC system it needs from the entering of data until the fi nal check is performed.
The Solution
Results
MARCH 2007 58 MODERNIZING MAPPING ORGANIZATIONS' WORKFLOWS
PLTS for ArcGIS—Defense Solution streamlines map production.

Copyright © 2007 ESRIAll rights reserved.Printed in the United States of America.
The information contained in this document is the exclusive property of ESRI. This work is protected under United States copyright law and other international copyright treaties and conventions. No part of this work may be reproduced or transmitted in any form or by any means, electronic or mechanical, including photocopying and recording, or by any information storage or retrieval system, except as expressly permitted in writing by ESRI. All requests should be sent to Attention: Contracts and Legal Services Manager, ESRI, 380 New York Street, Redlands, CA 92373-8100, USA.
The information contained in this document is subject to change without notice.
U.S. GOVERNMENT RESTRICTED/LIMITED RIGHTSAny software, documentation, and/or data delivered hereunder is subject to the terms of the License Agreement. In no event shall the U.S. Government acquire greater than RESTRICTED/LIMITED RIGHTS. At a minimum, use, duplication, or disclosure by the U.S. Government is subject to restric-tions as set forth in FAR §52.227-14 Alternates I, II, and III (JUN 1987); FAR §52.227-19 (JUN 1987) and/or FAR §12.211/12.212 (Commercial Technical Data/Computer Software); and DFARS §252.227-7015 (NOV 1995) (Technical Data) and/or DFARS §227.7202 (Computer Software), as applicable. Contractor/Manufacturer is ESRI, 380 New York Street, Redlands, CA 92373-8100, USA.
@esri.com, 3D Analyst, ACORN, ADF, AML, ArcAtlas, ArcCAD, ArcCatalog, ArcCOGO, ArcData, ArcDoc, ArcEdit, ArcEditor, ArcEurope, ArcExplorer, ArcExpress, ArcGIS, ArcGlobe, ArcGrid, ArcIMS, ARC/INFO, ArcInfo, ArcInfo Librarian, ArcInfo—Professional GIS, ArcInfo—The World’s GIS, ArcLocation, ArcLogistics, ArcMap, ArcNetwork, ArcNews, ArcObjects, ArcOpen, ArcPad, ArcPlot, ArcPress, ArcQuest, ArcReader, ArcScan, ArcScene, ArcSchool, ArcSDE, ArcSdl, ArcSketch, ArcStorm, ArcSurvey, ArcTIN, ArcToolbox, ArcTools, ArcUSA, ArcUser, ArcView, ArcVoyager, ArcWatch, ArcWeb, ArcWorld, ArcXML, Atlas GIS, AtlasWare, Avenue, Business Analyst Online, BusinessMAP, Community, CommunityInfo, Data Automation Kit, Database Integrator, DBI Kit, EDN, ESRI, ESRI—Team GIS, ESRI—The GIS Company, ESRI—The GIS People, ESRI—The GIS Software Leader, FormEdit, Geographic Design System, ESRI BIS, Geography Matters, Geography Network, GIS by ESRI, GIS Day, GIS for Everyone, GISData Server, JTX, MapBeans, MapCafé, MapData, MapObjects, Maplex, MapStudio, ModelBuilder, MOLE, NetEngine, PC ARC/INFO, PC ARCPLOT, PC ARCSHELL, PC DATA CONVERSION, PC STARTER KIT, PC TABLES, PC ARCEDIT, PC NETWORK, PC OVERLAY, PLTS, Rent-a-Tech, RouteMAP, SDE, Site·Reporter, SML, Sourcebook·America, Spatial Database Engine, StreetEditor, StreetMap, Tapestry, the ARC/INFO logo, the ArcAtlas logo, the ArcCAD logo, the ArcCAD WorkBench logo, the ArcCOGO logo, the ArcData logo, the ArcData Online logo, the ArcEdit logo, the ArcEurope logo, the ArcExplorer logo, the ArcExpress logo, the ArcGIS logo, the ArcGIS Explorer logo, the ArcGrid logo, the ArcIMS logo, the ArcInfo logo, the ArcLogistics Route logo, the ArcNetwork logo, the ArcPad logo, the ArcPlot logo, the ArcPress for ArcView logo, the ArcPress logo, the ArcScan logo, the ArcScene logo, the ArcSDE CAD Client logo, the ArcSDE logo, the ArcStorm logo, the ArcTIN logo, the ArcTools logo, the ArcUSA logo, the ArcView 3D Analyst logo, the ArcView Business Analyst logo, the ArcView Data Publisher logo, the ArcView GIS logo, the ArcView Image Analysis logo, the ArcView Internet Map Server logo, the ArcView logo, the ArcView Network Analyst logo, the ArcView Spatial Analyst logo, the ArcView StreetMap 2000 logo, the ArcView StreetMap logo, the ArcView Tracking Analyst logo, the ArcWorld logo, the Atlas GIS logo, the Avenue logo, the BusinessMAP logo, the Community logo, the Data Automation Kit logo, the Digital Chart of the World logo, the ESRI Data logo, the ESRI globe logo, the ESRI Press logo, the Geography Network logo, the MapCafé logo, the MapObjects Internet Map Server logo, the MapObjects logo, the MOLE logo, the NetEngine logo, the PC ARC/INFO logo, the Production Line Tool Set logo, the RouteMAP IMS logo, the RouteMAP logo, the SDE logo, The World’s Leading Desktop GIS, Water Writes, www.esri.com, www.esribis.com, www.geographynetwork.com, www.gis.com, www.gisday.com, and Your Personal Geographic Information System are trademarks, registered trademarks, or service marks of ESRI in the United States, the European Community, or certain other jurisdictions.
Other companies and products mentioned in the ESRI Web site may be trademarks or registered trademarks of their respective trademark owners.
ESRI • 380 New York Street • Redlands, CA 92373-8100 • 909-793-2853 • FAX 909-793-5953 • www.esri.com
Since 1969, ESRI has been giving customers around
the world the power to think and plan geographically.
The market leader in geographic information system
(GIS) solutions, ESRI software is used in more than
300,000 organizations worldwide including each
of the 200 largest cities in the United States, most
national governments, more than two-thirds of Fortune
500 companies, and more than 5,000 colleges and
universities. ESRI applications, running on more than one
million desktops and thousands of Web and enterprise
servers, provide the backbone for the world’s mapping
and spatial analysis. ESRI is the only vendor that provides
complete technical solutions for desktop, mobile, server,
and Internet platforms. Visit us at www.esri.com.