Modernising the reporting of ODA loans
15
Unclassified DCD/DAC/STAT(2014)1 Organisation de Coopération et de Développement Économiques Organisation for Economic Co-operation and Development ___________________________________________________________________________________________ _____________ English - Or. English Development Co-operation Directorate Development Assistance Committee DAC Working Party on Development Finance Statistics MODERNISING THE REPORTING ON ODA LOANS - RISK-ADJUSTED GRANT EQUIVALENTS AND OTHER APPROACHES Informal Meeting, 24 - 25 April 2014, Paris This document is submitted for DISCUSSION under Item 3 of the Draft WP-STAT Agenda [DCD/DAC/STAT/A(2014)1/PROV]. It responds to broad endorsement by the Senior Level Meeting on 3-4 March 2014 of recommendations to “work towards the establishment of a clear quantitative definition of concessionality in character for use in the ODA context” and “with the assistance of the WP-STAT further investigate the feasibility of risk-adjusted grant equivalents (while not excluding other options)”. Members are invited to give their views on the implementation issues and potential implications on development finance allocations as detailed in paragraphs 9 and 19 through 23. Contact: Julia Benn - Tel: +33 1 45 24 90 39 - Email: [email protected]; Valérie Gaveau - Tel: +33 1 45 24 90 53 - Email: [email protected] Complete document available on OLIS in its original format This document and any map included herein are without prejudice to the status of or sovereignty over any territory, to the delimitation of international frontiers and boundaries and to the name of any territory, city or area. DCD/DAC/STAT(2014)1 Unclassified English - Or. English
Transcript of Modernising the reporting of ODA loans
Unclassified DCD/DAC/STAT(2014)1 Organisation de Coopération et de Développement Économiques Organisation for Economic Co-operation and Development
___________________________________________________________________________________________
_____________ English - Or. English Development Co-operation Directorate
Development Assistance Committee
DAC Working Party on Development Finance Statistics
MODERNISING THE REPORTING ON ODA LOANS - RISK-ADJUSTED GRANT EQUIVALENTS
AND OTHER APPROACHES
Informal Meeting, 24 - 25 April 2014, Paris
This document is submitted for DISCUSSION under Item 3 of the Draft WP-STAT Agenda
[DCD/DAC/STAT/A(2014)1/PROV].
It responds to broad endorsement by the Senior Level Meeting on 3-4 March 2014 of recommendations to “work
towards the establishment of a clear quantitative definition of concessionality in character for use in the ODA
context” and “with the assistance of the WP-STAT further investigate the feasibility of risk-adjusted grant
equivalents (while not excluding other options)”.
Members are invited to give their views on the implementation issues and potential implications on development
finance allocations as detailed in paragraphs 9 and 19 through 23.
Contact: Julia Benn - Tel: +33 1 45 24 90 39 - Email: [email protected];
Valérie Gaveau - Tel: +33 1 45 24 90 53 - Email: [email protected]
Complete document available on OLIS in its original format
This document and any map included herein are without prejudice to the status of or sovereignty over any territory, to the delimitation of
international frontiers and boundaries and to the name of any territory, city or area.
DC
D/D
AC
/ST
AT
(20
14)1
Un
classified
En
glish
- Or. E
ng
lish

DCD/DAC/STAT(2014)1
2
TABLE OF CONTENTS
MODERNISING THE REPORTING ON ODA LOANS – RISK-ADJUSTED GRANT EQUIVALENTS
AND OTHER APPROACHES 3
Risk-adjusted grant equivalents [Option 1] 3 Calculation method 3 Implementation issues 4
Unified IMF/World Bank benchmark for External Debt Analysis in Low Income Countries [Option 2:
cash-flow method, Option 3: grant equivalent method] 7 Alternative approach: No new quantitative test for ODA loan concessionality 8 Scenarios 8
Second-order implications 9 Conformity of risk-adjusted grant equivalents with the 2012 HLM decisions 9
Conclusion 9
ANNEX 1: ESTIMATED EFFECT OF OPTIONS ON ODA DATA 11

DCD/DAC/STAT(2014)1
3
MODERNISING THE REPORTING ON ODA LOANS – RISK-ADJUSTED GRANT
EQUIVALENTS AND OTHER APPROACHES
1. This paper responds to broad endorsement by the Senior Level Meeting on 3-4 March 2014 of
recommendations to “work towards the establishment of a clear quantitative definition of concessionality
in character for use in the ODA context” and “with the assistance of the WP-STAT further investigate the
feasibility of risk-adjusted grant equivalents (while not excluding other options)”.1.
2. It thus presents, for WP-STAT members’ consideration and comment, an assessment of the
feasibility of risk-adjusted grant equivalents, and alternatives. The paper does not aim to secure decisions
or approvals at this stage. Rather, in line with the SLM mandate, it aims to support an open and informal
discussion of the feasibility of a risk-adjusted grant equivalent approach and its direct and second-order
implications on statistical reporting, with some consideration of alternative approaches. The group’s
technical advice will be a key input to upcoming DAC, SLM and HLM discussions.
3. As with previous discussions of loan concessionality in DAC statistics, this document assumes an
understanding of grant element methodology. Before tackling the discussion below, correspondents who
are new to DAC statistics may therefore first wish to consult DCD/DAC/STAT(2012)18/REV1, which
explains this methodology.
Risk-adjusted grant equivalents [Option 1]
4. The risk-adjusted grant equivalent approach – specifically mentioned in the SLM paper and
already discussed at the WP-STAT Concessionality Workshop on 19 November 2013 – involves a major
change of methodology. ODA would no longer record the disbursements and repayments on loans that
met the grant element test. Instead it would record the grant equivalent of the loan, assessed on the basis
of the terms of repayment of the loan when the loan was extended. Moreover, the discount rates applied
in the calculation of grant equivalents would take into account both the donor’s cost of funds and the risk
incurred in lending to a particular country.
5. It is important to stress that reporting based on risk-adjusted grant equivalents does not mean
flow data would no longer be collected. Loan-by-loan reporting in CRS++ – on amounts committed and
disbursed, principal and interest received, and debt outstanding – would remain as at present. These data
would be used for the measurement of total official support for development (TOSD) and the statistical
presentations of development finance from the perspective of the recipients.
Calculation method
6. The method would be as follows: First, a risk-adjusted discount rate would need to be
determined for the specific loan. This would be an estimate of the natural or neutral rate of interest that
would have been charged in a market transaction (recognising however that the lender and, in many cases,
the borrower may be governments). The risk-adjusted rate consists of the donor’s total funding costs and a
risk premium.
7. The risk-adjusted discount rate would then be used in a grant element calculation, and the
resulting grant equivalent would be the ODA component of the loan.
1. Cf. DCD/DAC(2014)9, paragraph 29, point 6.

DCD/DAC/STAT(2014)1
4
8. A simplified example may clarify this. Figure 1 shows a grant element calculation on a USD 1
million loan, extended at 2.5% interest, where the donor’s total cost of making funds available is 4% p.a.,
and the additional risk represented by the borrowing country in question is 3%. Thus the natural rate of
interest – i.e. the rate the borrower could expect to pay if there was no subsidy – is 7% p.a. When all the
service payments required on the loan3 are discounted at this rate, they amount to USD 785 500, and the
loan’s grant equivalent is the difference between this and USD 1 million – i.e. USD 214 500. So a risk-
adjusted grant equivalent approach would record USD 214 500 as ODA.
Figure 1. Grant element calculation
(Loan of USD 1 million; interest rate 2.5% p.a., grace period 2.5 years, maturity 10 years, discount rate 7%)
Implementation issues
9. Calculating loan ODA in this way raises a number of implementation issues, some of which are
technical while others have direct or second-order political implications. Members’ views are invited on
the following points:
Eligible population of loans: One of the perceived advantages of the grant equivalent approach,
noted at the Concessionality Workshop and subsequently, is that it provides a continuous “sliding
scale” of concessionality measurement. Highly concessional loans would yield more ODA than
loans with modest degrees of concessionality, but all concessional elements, however small,
could be captured. This is in contrast to present “cut-off” system which counts the whole loan as
ODA only if it reaches a 25% grant element, and excludes it from ODA if it does not.
3. The service payments here consist only of amortisation and interest, but could also include fees and charges.
Principal
outstanding
in USD
thousands01-01-2001
01-07-2001 0.5 1,000.0 12.5 12.5 1.034 12.1
01-01-2002 1 1,000.0 12.5 12.5 1.070 11.7
01-07-2002 1.5 1,000.0 12.5 12.5 1.107 11.3
01-01-2003 2 1,000.0 12.5 12.5 1.145 10.9
01-07-2003 2.5 1,000.0 62.5 12.5 75.0 1.184 63.3
01-01-2004 3 937.5 62.5 11.7 74.2 1.225 60.6
01-07-2004 3.5 875.0 62.5 10.9 73.4 1.267 58.0
01-01-2005 4 812.5 62.5 10.2 72.7 1.311 55.4
01-07-2005 4.5 750.0 62.5 9.4 71.9 1.356 53.0
01-01-2006 5 687.5 62.5 8.6 71.1 1.403 50.7
01-07-2006 5.5 625.0 62.5 7.8 70.3 1.451 48.5
01-01-2007 6 562.5 62.5 7.0 69.5 1.501 46.3
01-07-2007 6.5 500.0 62.5 6.3 68.8 1.552 44.3
01-01-2008 7 437.5 62.5 5.5 68.0 1.606 42.3
01-07-2008 7.5 375.0 62.5 4.7 67.2 1.661 40.4
01-01-2009 8 312.5 62.5 3.9 66.4 1.718 38.6
01-07-2009 8.5 250.0 62.5 3.1 65.6 1.777 36.9
01-01-2010 9 187.5 62.5 2.3 64.8 1.838 35.3
01-07-2010 9.5 125.0 62.5 1.6 64.1 1.902 33.7
01-01-2011 10 62.5 62.5 0.8 63.3 1.967 32.2
sum = 785.5
Grant element = (1000-785.5)/1000 = 21.45%
Matu
rity
Gra
ce
INT
B. Six-month
factor at
7% p.a.
(1.07)p
C. Present
value of
future
payments
Period (p)Date payment
due
Future payments
Principal Interest A. Total

DCD/DAC/STAT(2014)1
5
The sliding scale would apply to all official loans with a developmental purpose (i.e., excluding
export credits). However, the calculation may result in a negative grant equivalent for loans
extended at terms harder than market terms. It would thus be necessary to decide whether such
negative entries should be deducted from ODA. The loan volume would in any case be
reportable as TOSD.
Source of information for risk-adjusted rates: Four members proposed a method of
constructing risk-adjusted rates as the sum of i) donor country bond yields, ii) an allowance for
cost of credit, and iii) a risk premium.4 More recently, the independent researcher David
Roodman has proposed and used DDRs with the addition of the OECD’s Minimum Premium
Rates as used in the Export Credit Arrangement.5 The second method would perhaps be simpler
to operate as it relies on standard, readily available OECD data.
The methods differ with regard to the reference rate for the donor funding cost (one uses bond
yields plus one percent, while the other uses DDRs where the margin varies between 0.75% and
1.25% depending on the maturity of the loan) and the risk premium (one based on average default
spreads of recipient countries grouped by the OECD’s country risk categories, the other directly
applying the OECD’s Minimum Premium Rates). The Secretariat has tested both methods of
determining the donor funding costs, which produce very similar results. As regards the risk
premium, simulations have so far been computed only applying the first method and the best
source of information remains to be determined. The required default spreads could be derived
from financial information providers such as Bloomberg. The OECD Arrangement explicitly
advises against applying the Minimum Premium Rates for any other purpose than the
Arrangement.
Frequency of change of risk-adjusted rates: DDRs are subject to an annual change on the 15th
of January. The same revision cycle could be applied to the standardised risk premia, to be added
to the DDR, to derive the risk-adjusted discount rates for use in ODA reporting for that year.
Application of risk-adjusted rates to loans to multilateral organisations and funds: In recent
years members have reported very few loans to multilateral organisations, but it should be
considered whether, and if so how, to apply risk-adjusted rates to such lending. (Note that
limited debt funding in the form of concessional loans was introduced in the IDA 17 financing
framework.) A plausible solution might be to use the DDRs without any risk premium, on the
logic that a loan to a multilateral can be assumed to be of AAA quality.
Timing of reporting of grant equivalents: The simplest method of introducing grant equivalent
reporting on loans would be to report the total grant equivalent at the time of loan commitment.
However, this would make time series lumpy and care would need to be taken to adjust this
reporting if part or all of the loan was not actually disbursed. An alternative would be to apply
the grant element percentage to each disbursement as it was made. Thus, if the risk-adjusted
grant element was 21.45%, as in the above example, 21.45% of each disbursement tranche of the
loan would be reportable as ODA. Either method seems feasible. Yet another alternative,
suggested by Spain, would be to apply the grant element method only to the loan repayments6.
4. Cf. DCD/DAC/STAT(2012)22.
5. http://davidroodman.com/blog/2014/02/17/whats-the-best-way-to-count-loans-as-aid/
6. Spain’s suggestion is as follows. Report the full face value of the loan as ODA when it is extended. When
repayments of principal arrive, only make negative ODA entries for the non-grant-equivalent share of each

DCD/DAC/STAT(2014)1
6
Maintaining data on actual flows: Total ODA would no longer consist of grant and loan flows
of cash, but of grants combined with grant-equivalent efforts. The flow concept could however be
retained at the level of total official transactions (TOSD). Thus in the above example, ODA
would record USD 214 500 and “non-ODA TOSD” would record USD 785 500 when the loan
was extended, so that the total outflow of USD 1 million would show as TOSD. The principal
repayments would then be deducted in full from TOSD, so that the net flow over the life of the
loan would be zero in TOSD. However, no part of the principal repayments would be deducted
from ODA. Interest would continue to be recorded as a memo item.
This approach would seem feasible, though it raises a further question which has political as well
as technical aspects. The 1970 UN resolution on aid and flow targets expressed these as “net
amount[s]…in terms of actual disbursements”.7 Could the new type of ODA total, consisting of
grants and grant equivalents, be considered as equivalent to net disbursements? Reporting on
grant equivalents year by year as and when loans were disbursed would seem more appropriate
here than reporting on grant equivalents upfront when loans are committed. It would allow using
total ODA in assessments of performance against the UN target.
Treatment of the existing stock of ODA debt: Moving to a grant equivalent approach would
leave a large stock of outstanding ODA debt which under the present system would have given
rise to negative entries as it was repaid.8 Do members believe these repayments should still be
deducted from future ODA figures? As a general rule a change in reporting methodology should
not favour some members over others. Also, ignoring the existing debt stock would be prone to
criticism by the NGO community that has been closely monitoring the discussion on the
reporting on ODA loans. In any case, data on the repayments would still need to be collected,
and could therefore be published in separate series. Alternatively, a transition period for
reporting negative entries for the existing stock of ODA debt could be defined.
Adjustments to debt relief reporting: Since this option factors the risk of default into the ODA
amount reportable when loans are extended, actual default and subsequent debt forgiveness
should logically not give rise to a new ODA entry. (At present, interest forgiven on ODA loans,
and principal and interest forgiven on OOF loans, counts as new ODA.) This would apply to all
official development loans assessed for concessionality.
The bulk of debt relief reported as ODA in the past relates to loans originally provided by the
private sector. To date the full face value of forgiven debt has been reportable as an ODA grant,
but this far exceeds the real cost to donors. Moreover, much forgiven debt concerns export
credits, which are insured against default, at rates that take account of default risk. The
implementation of a risk-adjusted approach in ODA reporting triggers the question of whether
there is a need to curtail debt forgiveness reporting in respect of export credits and other private
debt. At the SLM, a few members suggested this issue should be further discussed with
representatives of the Paris Club.
repayment. When all repayments have been deducted, the net ODA over the life of the loan would thus be its
grant equivalent.
7. See http://www.un-documents.net/a25r2626.htm. The phrase “in terms of actual disbursements” appears only in
paragraph 42 of the Resolution which specifies the 1 per cent flow target. It could, however, be assumed to carry
over to paragraph 43 which specifies the 0.7 per cent ODA target.
8. For reference, member countries’ total outstanding ODA debt as at the end of 2011 is estimated at USD 207
billion. The corresponding figure for EU institutions was USD 19 billion.

DCD/DAC/STAT(2014)1
7
Adapting the Terms Recommendation: The DAC Recommendation on Terms and Conditions of
Aid, last revised in 1978, is a key discipline maintaining the overall concessionality of members’
aid programmes. It requires, among other things, maintenance of an 86% grant element of total
ODA, calculated annually on a commitment basis.
If ODA loans are now to be recorded as grant equivalents instead of cash flows, the
Recommendation will need either interpretation or amendment if it is not to become a dead letter.
This would be feasible in principle, given that members would continue to report the details of
loans in CRS++. However, it is not immediately clear what form the Recommendation would
need to take to cope with ODA loans being reported in their grant equivalents. One possibility
would be to maintain an “old ODA” series, calculated on the old basis, to which the
Recommendation would still apply. This would not, however, guarantee a minimum grant
element for the “new ODA” based on grant equivalents.
Unified IMF/World Bank benchmark for External Debt Analysis in Low Income Countries [Option
2: cash-flow method, Option 3: grant equivalent method]
10. On 11 October 2013, the IMF Board of Governors approved a new flat discount rate of 5% for
assessing the concessionality of loans to low income countries (LICs). Only loans reaching a minimum
grant element of 35%, using a 5% discount rate, are regarded as concessional. The unified 5% rate
replaced an earlier system based on Commercial Interest Reference Rates, but with different treatment of
long and short-term loans. Five per cent was “a level broadly aligned with the discount rate currently [i.e.
in October 2013] used for calculating the grant element of long-term U.S. dollar-denominated loans”.9
11. Harmonising the concessionality assessment with the IMF/World Bank system would retain the
cash-flow basis of DAC statistics. However, it has one major caveat – the system is only applicable to
lending to LICs and not to MICs, the latter representing a significant share of members’ ODA loans. The
counter-argument here could be that the system remains close to the criteria used by the OECD to assess
tied aid loans and that the Tied Aid Disciplines apply to lending to LICs and MICs.10 To be regarded as
concessional, a tied aid loan must bear a grant element of 35% (50% for least-developed countries), using
the OECD’s Differentiated Discount Rates (DDRs). Both the DDRs and the IMF’s earlier rates for
calculating grant elements derive from Commercial Interest Reference Rates, though with somewhat
different adjustments and averaging procedures. The 2014 US dollar DDRs range from 3.9% to 4.4%,
depending on the tenor (duration) of the loan.
12. Using either the IMF/World Bank system or the OECD system for tied aid therefore produces
similar results. Both systems are much stricter than the current grant element test in the ODA definition,
and leave many fewer loans qualifying as concessional. This is partly because they both discount the
future repayment stream on the loan at a much lower rate than the ODA grant element test (4-5% instead of
10%). This leaves a smaller gap between the repayment stream and the face value of the loan, resulting in
smaller grant equivalents. But both the IMF and Tied Aid methods also require a higher grant element (35-
50% instead 25%) before a loan is regarded as concessional.
13. An example may help bring this out. Say a 15-year loan was made at 1% interest, with equal
principal payments twice a year, and no grace period. Its grant element, using a 10% discount rate, is
9. The Executive Board of the World Bank approved a similar proposal shortly afterwards. See
http://www.imf.org/external/np/pp/eng/2013/100413.pdf and
http://www.imf.org/external/np/pp/eng/2013/122313.pdf.
10. See http://search.oecd.org/officialdocuments/displaydocumentpdf/?doclanguage=en&cote=tad/pg(2014)1, p. 19f.

DCD/DAC/STAT(2014)1
8
41.74%.11 Thus it easily qualifies as an ODA loan against a 25% grant element. But if it were assessed
instead on the IMF’s grant element calculator against a discount rate of 5%, its grant element would be
24.07% – short of the current 25% threshold, and well short of the 35% level applied under the IMF and
Tied Aid methods.
14. Calculating ODA using the IMF/World Bank test described above implies that:
the current ODA grant element test would effectively be superseded by a more stringent
formula, so that a smaller volume of official lending would qualify as ODA
as the new discount rate would not take default risk into account, it would not require changes to
debt relief reporting rules in respect of official development loans.
Given that members have generally expressed their support for the grant equivalent approach, an
alternative to look into would be aligning the discount rate with that used by the IMF but applying the
grant equivalent approach. Figures for this are shown as Option 3 in the Annex. It will be observed that
choice of the discount rate significantly affects the calculated grant equivalent.
Alternative approach: No new quantitative test for ODA loan concessionality
15. A couple of members have indicated a preference for not introducing any new quantitative test of
the concessionality of ODA loans. This would seem unacceptable as it would be in breach of the HLM
decision to “establish, as soon as possible, and at the latest by 2015, a clear, quantitative definition of
‘concessional in character’, in line with prevailing financial market conditions.” 12
16. One member has expressed the view that the 10% discount rate could be considered a proxy for
risk-adjusted rates over a long period and across the developing countries as a whole. This reasoning is
new and the Secretariat has not examined it in detail. If 10% is a proxy for risk-adjusted rates, however, it
might be more logical to apply it to calculate grant equivalents, and count those as ODA. In that case,
many of the questions raised under section “risk-adjusted grant equivalents” would then be relevant for this
option too.
Scenarios
17. In response to members’ request for quantitative analysis of the implications of the risk-adjusted
grant equivalent approach, Annex 1 attempts to estimate the effects on members’ ODA of the above
options, over the period 2004-12. The results should be treated with some reserve, since:
some loans reported as OOF have not had their terms reported or were extended at variable
interest rates: these have not been assessed for concessionality and have not been included13
there are difficulties in tracing disbursement and repayment streams as identification numbers
sometimes change over time: averages were used instead
11. Using the OECD grant element calculator at www.oecd.org/development/stats/15344611.xls; to replicate,
remember to “enable macros”.
12. See the HLM communique at
http://www.oecd.org/dac/HLM%20Communique%202012%20final%20ENGLISH.pdf.
13. At the time of writing only three members had responded to the Secretariat’s request for additional data on OOF
loans required for this analysis.
DCD/DAC/STAT(2014)1
9
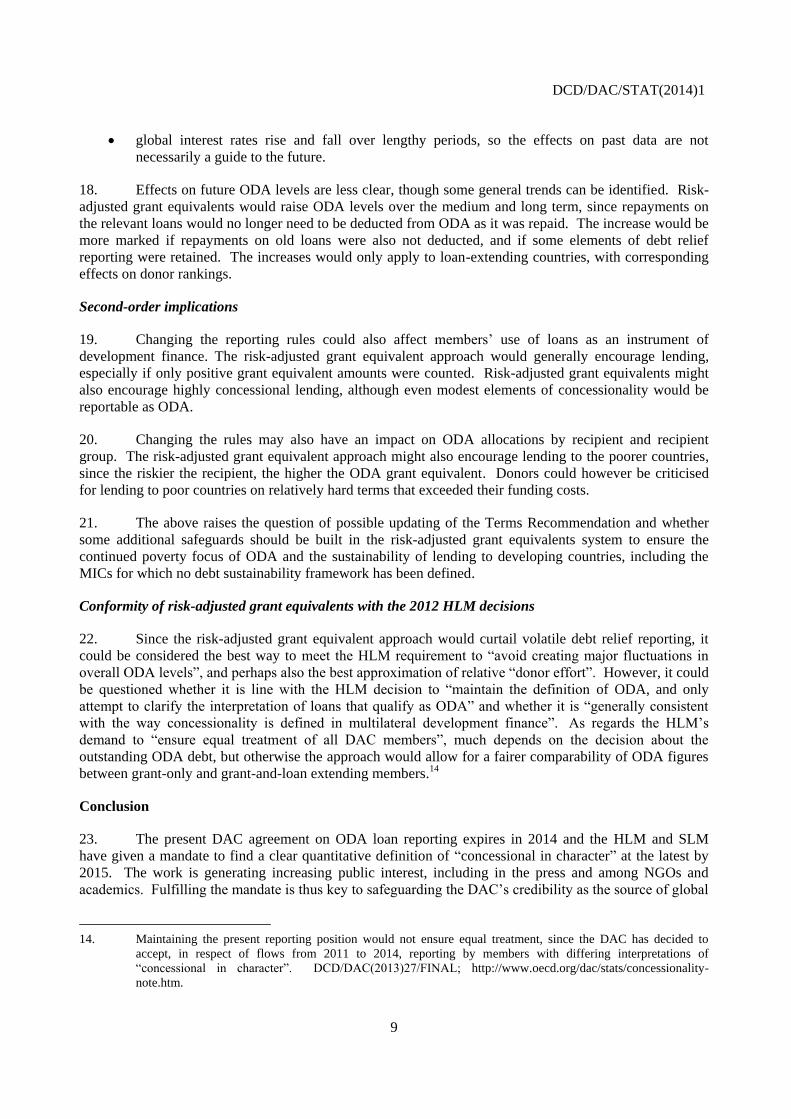
global interest rates rise and fall over lengthy periods, so the effects on past data are not
necessarily a guide to the future.
18. Effects on future ODA levels are less clear, though some general trends can be identified. Risk-
adjusted grant equivalents would raise ODA levels over the medium and long term, since repayments on
the relevant loans would no longer need to be deducted from ODA as it was repaid. The increase would be
more marked if repayments on old loans were also not deducted, and if some elements of debt relief
reporting were retained. The increases would only apply to loan-extending countries, with corresponding
effects on donor rankings.
Second-order implications
19. Changing the reporting rules could also affect members’ use of loans as an instrument of
development finance. The risk-adjusted grant equivalent approach would generally encourage lending,
especially if only positive grant equivalent amounts were counted. Risk-adjusted grant equivalents might
also encourage highly concessional lending, although even modest elements of concessionality would be
reportable as ODA.
20. Changing the rules may also have an impact on ODA allocations by recipient and recipient
group. The risk-adjusted grant equivalent approach might also encourage lending to the poorer countries,
since the riskier the recipient, the higher the ODA grant equivalent. Donors could however be criticised
for lending to poor countries on relatively hard terms that exceeded their funding costs.
21. The above raises the question of possible updating of the Terms Recommendation and whether
some additional safeguards should be built in the risk-adjusted grant equivalents system to ensure the
continued poverty focus of ODA and the sustainability of lending to developing countries, including the
MICs for which no debt sustainability framework has been defined.
Conformity of risk-adjusted grant equivalents with the 2012 HLM decisions
22. Since the risk-adjusted grant equivalent approach would curtail volatile debt relief reporting, it
could be considered the best way to meet the HLM requirement to “avoid creating major fluctuations in
overall ODA levels”, and perhaps also the best approximation of relative “donor effort”. However, it could
be questioned whether it is line with the HLM decision to “maintain the definition of ODA, and only
attempt to clarify the interpretation of loans that qualify as ODA” and whether it is “generally consistent
with the way concessionality is defined in multilateral development finance”. As regards the HLM’s
demand to “ensure equal treatment of all DAC members”, much depends on the decision about the
outstanding ODA debt, but otherwise the approach would allow for a fairer comparability of ODA figures
between grant-only and grant-and-loan extending members.14
Conclusion
23. The present DAC agreement on ODA loan reporting expires in 2014 and the HLM and SLM
have given a mandate to find a clear quantitative definition of “concessional in character” at the latest by
2015. The work is generating increasing public interest, including in the press and among NGOs and
academics. Fulfilling the mandate is thus key to safeguarding the DAC’s credibility as the source of global
14. Maintaining the present reporting position would not ensure equal treatment, since the DAC has decided to
accept, in respect of flows from 2011 to 2014, reporting by members with differing interpretations of
“concessional in character”. DCD/DAC(2013)27/FINAL; http://www.oecd.org/dac/stats/concessionality-
note.htm.

DCD/DAC/STAT(2014)1
10
ODA data, and securing its role in monitoring financial flows for development in the post-2015 period.
WP-STAT members’ input will be a vital contribution towards achieving this result.
24. Members are therefore requested to discuss whether:
ODA reporting based on risk-adjusted grant equivalents is feasible, and if so, how each of
the implementation issues outlined in paragraph 9 should be handled.
If the approach is not considered feasible, what other approaches should be examined.
DCD/DAC/STAT(2014)1
11
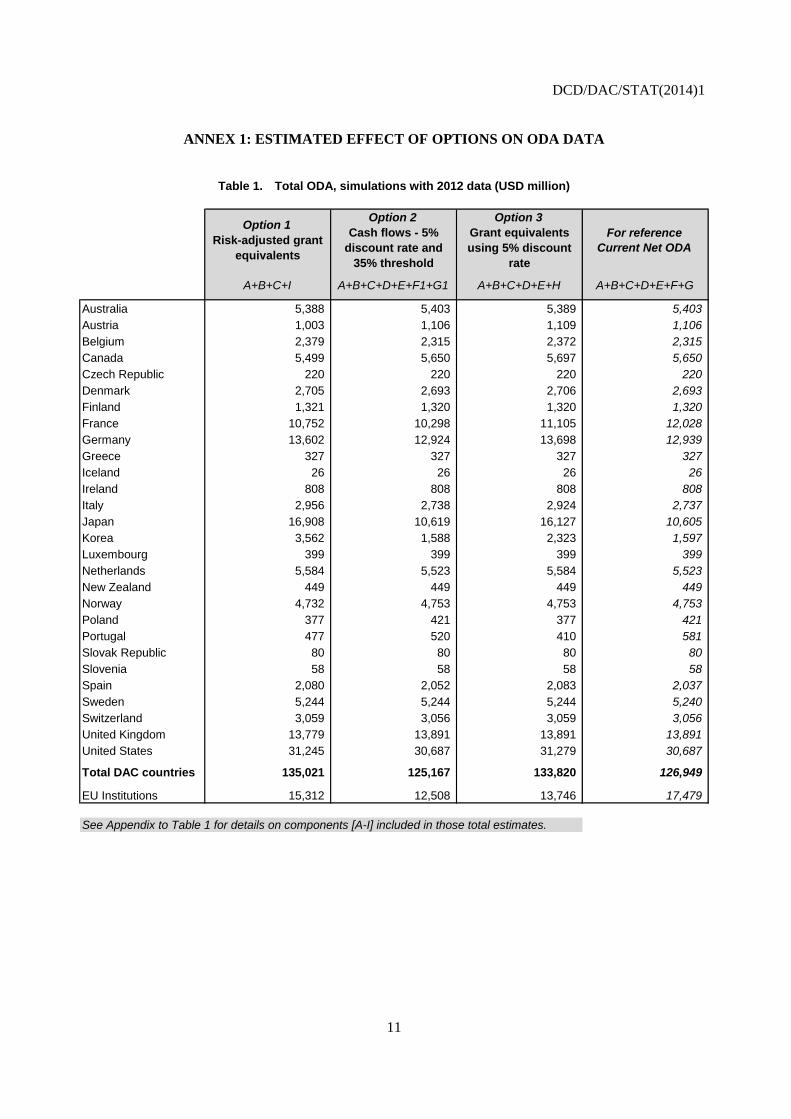
ANNEX 1: ESTIMATED EFFECT OF OPTIONS ON ODA DATA
Table 1. Total ODA, simulations with 2012 data (USD million)
Option 1
Risk-adjusted grant
equivalents
Option 2
Cash flows - 5%
discount rate and
35% threshold
Option 3
Grant equivalents
using 5% discount
rate
For reference
Current Net ODA
A+B+C+I A+B+C+D+E+F1+G1 A+B+C+D+E+H A+B+C+D+E+F+G
Australia 5,388 5,403 5,389 5,403
Austria 1,003 1,106 1,109 1,106
Belgium 2,379 2,315 2,372 2,315
Canada 5,499 5,650 5,697 5,650
Czech Republic 220 220 220 220
Denmark 2,705 2,693 2,706 2,693
Finland 1,321 1,320 1,320 1,320
France 10,752 10,298 11,105 12,028
Germany 13,602 12,924 13,698 12,939
Greece 327 327 327 327
Iceland 26 26 26 26
Ireland 808 808 808 808
Italy 2,956 2,738 2,924 2,737
Japan 16,908 10,619 16,127 10,605
Korea 3,562 1,588 2,323 1,597
Luxembourg 399 399 399 399
Netherlands 5,584 5,523 5,584 5,523
New Zealand 449 449 449 449
Norway 4,732 4,753 4,753 4,753
Poland 377 421 377 421
Portugal 477 520 410 581
Slovak Republic 80 80 80 80
Slovenia 58 58 58 58
Spain 2,080 2,052 2,083 2,037
Sweden 5,244 5,244 5,244 5,240
Switzerland 3,059 3,056 3,059 3,056
United Kingdom 13,779 13,891 13,891 13,891
United States 31,245 30,687 31,279 30,687
Total DAC countries 135,021 125,167 133,820 126,949
EU Institutions 15,312 12,508 13,746 17,479
See Appendix to Table 1 for details on components [A-I] included in those total estimates.

DCD/DAC/STAT(2014)1
12
APPENDIX TO TABLE 1
Components included in current ODA and options 1-3, 2012 data (USD million)
option 3 option 1
NET GRANTS
(excl. debt delief)
NET
EQUITIES
NET DEBT
RELIEF GRANTS
(private claims)
NET DEBT
RELIEF GRANTS
(other)
NET DEBT
RESCHEDULING
(ODA & OOF
claims)
GROSS LOAN
DISBURSEMENTS
(excl. debt
rescheduling)
LOAN REFLOWS
(excl. debt
rescheduling)
GROSS LOAN
DISBURSEMENTS
(excl. debt
rescheduling)
APPLYING A 5%
DISCOUNT RATE
LOAN REFLOWS
(excl. debt
rescheduling)
APPLYING A 5%
DISCOUNT RATE
GRANT EQUIVALENT
OF LOANS
5% DISCOUNT RATE
GRANT EQUIVALENT
OF LOANS
RISK-ADJUSTED DDR
A B C D E F G
F1= F x share of
loans still qualifying as
ODA using a 5%
discount rate and 35%
threshold
G1= G x share of
loans still qualifying
as ODA using a 5%
discount rate and
35% threshold
H I
Australia 5,355 0 0 8 0 43 -4 43 -4 26 33
Austria 1,002 1 0 106 0 1 -4 1 -4 0 0
Belgium 2,077 0 272 0 0 3 -37 3 -37 24 31
Canada 5,499 0 0 198 0 0 -47 0 -47 0 0
Czech Republic 220 0 0 0 0 0 0 0 0 0 0
Denmark 2,730 -25 0 1 0 0 -13 0 -13 0 0
Finland 1,282 38 0 0 0 0 0 0 0 1 1
France 8,395 0 0 1,337 137 3,688 -1,528 732 -303 1,236 2,357
Germany 12,102 270 0 545 0 1,362 -1,339 425 -417 781 1,230
Greece 327 0 0 0 0 0 0 0 0 0 0
Iceland 26 0 0 0 0 0 0 0 0 0 0
Ireland 808 0 0 0 0 0 0 0 0 0 0
Italy 2,757 0 0 2 0 78 -100 75 -95 165 199
Japan 10,961 -162 0 0 0 7,698 -7,893 7,137 -7,317 5,328 6,109
Korea 1,129 0 0 0 0 517 -49 507 -48 1,194 2,433
Luxembourg 399 0 0 0 0 0 0 0 0 0 0
Netherlands 5,464 0 120 0 0 0 -61 0 -61 0 0
New Zealand 449 0 0 0 0 0 0 0 0 0 0
Norway 4,490 242 0 21 0 0 0 0 0 0 0
Poland 377 0 0 0 0 61 -18 61 -18 0 0
Portugal 311 0 0 0 0 308 -38 238 -29 99 166
Slovak Republic 80 0 0 0 0 0 0 0 0 0 0
Slovenia 58 0 0 0 0 0 0 0 0 0 0
Spain 1,985 23 73 0 3 38 -84 25 -56 0 0
Sweden 5,185 59 0 0 0 0 -5 0 0 0 0
Switzerland 3,035 10 15 0 0 0 -4 0 -4 0 0
United Kingdom 13,639 140 0 112 0 0 0 0 0 0 0
United States 31,206 0 0 56 0 0 -576 0 -576 16 39
Total DAC countries 121,347 596 480 2,387 140 13,797 -11,798 9,246 -9,029 8,870 12,597
EU Institutions 12,003 2 0 8 0 6,064 -598 549 -54 1,733 3,307
current ODA option 2

DCD/DAC/STAT(2014)1
13
Table 2. Total ODA, simulations with average 2004-2012 data (constant 2012 prices) (USD million)
Option 1
Risk-adjusted grant
equivalents
Option 2
Cash flows - 5%
discount rate and
35% threshold
Option 3
Grant equivalents
using 5% discount
rate
For reference
Current Net ODA
A+B+C+I A+B+C+D+E+F1+G1 A+B+C+D+E+H A+B+C+D+E+F+G
Australia 3,877 3,986 4,006 3,986
Austria 1,204 1,369 1,387 1,369
Belgium 2,432 2,359 2,424 2,359
Canada 4,983 5,114 5,160 5,114
Czech Republic 196 203 203 203
Denmark 2,683 2,701 2,739 2,701
Finland 1,148 1,145 1,146 1,144
France 10,889 11,012 11,615 11,438
Germany 11,562 12,013 12,658 11,908
Greece 475 475 475 475
Iceland 30 30 30 30
Ireland 888 889 889 889
Italy 3,410 3,844 4,062 3,841
Japan 17,795 12,099 17,155 12,074
Korea 1,486 926 1,199 931
Luxembourg 391 391 391 391
Netherlands 6,036 5,911 6,064 5,911
New Zealand 397 397 397 397
Norway 4,481 4,512 4,509 4,512
Poland 301 331 301 331
Portugal 491 576 542 600
Slovak Republic 74 74 74 74
Slovenia 50 50 50 50
Spain 4,519 4,340 4,450 4,367
Sweden 4,707 4,765 4,765 4,768
Switzerland 2,555 2,546 2,556 2,546
United Kingdom 11,091 11,778 11,780 11,751
United States 28,520 28,505 29,455 28,505
Total DAC countries 126,668 122,341 130,480 122,664
EU Institutions 14,435 12,419 13,251 16,883
See Appendix to Table 2 for details on components [A-I] included in those total estimates.

DCD/DAC/STAT(2014)1
14
APPENDIX TO TABLE 2
Components included in current ODA and options 1-3, average 2004-2012 data (constant 2012 prices) (USD million)
Note: average 2011-2012 data for the EU Institutions
option 3 option 1
NET GRANTS
(excl. debt delief)
NET
EQUITIES
NET DEBT
RELIEF GRANTS
(private claims)
NET DEBT
RELIEF GRANTS
(other)
NET DEBT
RESCHEDULING
(ODA & OOF
claims)
GROSS LOAN
DISBURSEMENTS
(excl. debt
rescheduling)
LOAN REFLOWS
(excl. debt
rescheduling)
GROSS LOAN
DISBURSEMENTS
(excl. debt
rescheduling)
APPLYING A 5%
DISCOUNT RATE
LOAN REFLOWS
(excl. debt
rescheduling)
APPLYING A 5%
DISCOUNT RATE
GRANT EQUIVALENT
OF LOANS
5% DISCOUNT RATE
GRANT EQUIVALENT
OF LOANS
RISK-ADJUSTED DDR
A B C D E F G
F1= F x share of loans
still qualifying as ODA
using a 5% discount
rate and 35%
threshold
G1= G x share of
loans still qualifying
as ODA using a 5%
discount rate and
35% threshold
H I
Australia 3,797 0 0 147 0 43 0 43 0 62 80
Austria 935 2 264 185 0 0 -16 0 -16 2 3
Belgium 2,111 0 290 0 0 28 -70 28 -70 23 32
Canada 4,983 0 0 177 0 0 -45 0 -45 0 0
Czech Republic 196 0 0 7 0 0 0 0 0 0 0
Denmark 2,679 4 0 53 3 20 -57 20 -57 0 0
Finland 1,101 21 23 0 0 1 -3 0 -1 0 3
France 8,927 0 612 1,221 147 2,106 -1,576 418 -313 708 1,349
Germany 10,365 185 0 1,523 -12 1,199 -1,353 374 -422 596 1,011
Greece 475 0 0 0 0 0 0 0 0 0 0
Iceland 30 0 0 0 0 0 0 0 0 0 0
Ireland 888 0 0 0 0 0 0 0 0 0 0
Italy 3,204 0 0 702 4 180 -249 172 -238 152 206
Japan 10,911 -28 1,285 177 73 7,807 -8,152 7,237 -7,557 4,736 5,627
Korea 691 0 0 1 1 278 -40 272 -39 506 794
Luxembourg 391 0 0 0 0 0 0 0 0 0 0
Netherlands 5,813 0 223 25 3 2 -154 2 -154 0 0
New Zealand 397 0 0 0 0 0 0 0 0 0 0
Norway 4,322 159 0 29 0 3 -1 3 -1 0 0
Poland 301 0 0 0 0 36 -6 36 -6 0 0
Portugal 403 0 0 1 87 125 -16 97 -13 51 88
Slovak Republic 74 0 0 0 0 0 0 0 0 0 0
Slovenia 50 0 0 0 0 0 0 0 0 0 0
Spain 3,934 61 265 18 5 435 -350 292 -235 167 259
Sweden 4,647 36 24 58 0 3 -1 0 0 0 1
Switzerland 2,416 30 108 1 0 1 -11 1 -11 0 0
United Kingdom 10,715 50 320 693 0 128 -154 0 0 2 6
United States 28,507 0 0 909 31 15 -957 15 -957 8 13
Total DAC countries 113,263 521 3,414 5,928 340 12,411 -13,212 9,011 -10,137 7,014 9,471
EU Institutions 11,946 17 0 11 0 5,497 -587 498 -53 1,277 2,472
current ODA option 2

DCD/DAC/STAT(2014)1
15
Methodological note: For reasons given in the text, it is not possible to precisely quantify the effect
that Options 1-3 would have had on past ODA figures. However, these tables are an attempt at estimation.
For Option 1, the estimates comprise ODA grants plus the grant equivalent of official developmental
loans. Grants include grants for forgiveness of private debt (no data being presently available on the share
of this that may have been insured or purchased at a discount), but not for forgiveness of official debt.
Grant equivalents are included both for ODA loans and for OOF developmental loans the terms of which
were available. The discount rate used to calculate the grant equivalent of each loan was the Differentiated
Discount Rate for the year and currency concerned, plus an allowance for risk for the recipient country
concerned.
For Option 2, the figures comprise ODA grants plus net ODA loans (positive or negative) multiplied
by the share, calculated for each loan-extending donor separately, of ODA loans that would meet a 35%
grant element test using a 5% discount rate. (Ideally the method for Option 2 would exclude all
disbursements and repayments of loans that would not meet this tighter concessionality test; however, for
several donors it was not possible to track disbursements and repayments loan-by-loan.)
For Option 3, the estimates comprise ODA grants plus the grant equivalent of official developmental
loans calculated using a fixed 5% discount rate. There is no deduction for forgiveness of official debt in
this option.
The appendices to Tables 1 and 2 provide the detail of components entering the calculations to
facilitate understanding and enable calculation of the effects of some other approaches.