Modern Wine Analysis Trace analysis of precious drops · Modern Wine Analysis Trace analysis of...
32
Modern Wine Analysis Trace analysis of precious drops News from GERSTEL GmbH & Co. KG · Eberhard-Gerstel-Platz 1 · 45473 Mülheim an der Ruhr · Germany · Phone + 49 (0) 2 08 - 7 65 03-0 · [email protected] www.gerstel.com ISSN 1619 - 0076 G L O B A L A N A L Y T I C A L S O L U T I O N S Research The Twister sniffs out the aftertaste Off flavors in wine Watch your sulfurs! Wine flavor analysis Holding on to fleeting encounters SPECIAL EDITION
Transcript of Modern Wine Analysis Trace analysis of precious drops · Modern Wine Analysis Trace analysis of...
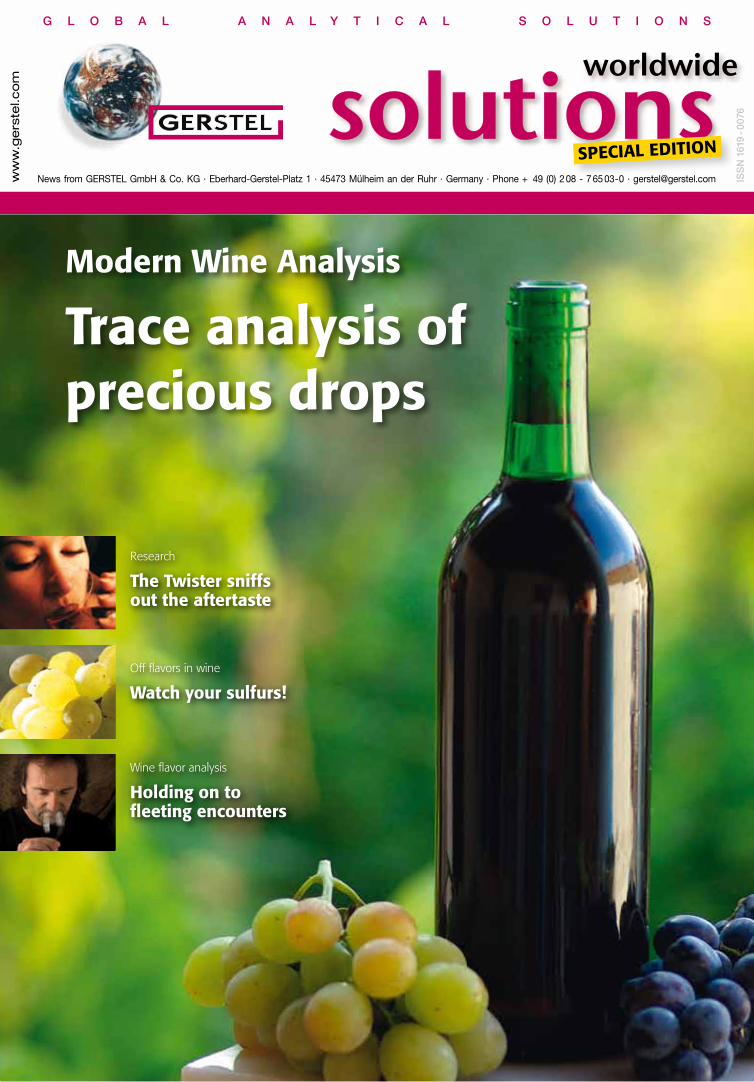
Modern Wine Analysis
Trace analysis of precious drops
News from GERSTEL GmbH & Co. KG · Eberhard-Gerstel-Platz 1 · 45473 Mülheim an der Ruhr · Germany · Phone + 49 (0) 2 08 - 7 65 03-0 · [email protected] ww
w.g
ers
tel.c
om
ISS
N 1
619
- 007
6
G L O B A L A N A L Y T I C A L S O L U T I O N S
Research
The Twister sniffs out the aftertaste
Off flavors in wine
Watch your sulfurs!
Wine flavor analysis
Holding on to fleeting encounters
SPECIAL EDITION

Wine has been a permanent fixture in the history of mankind for more than 7,000
years. The grape juice fermentation product is today justly described as a cultural heritage.
Surely wine producers have always worked hard to improve the already high quality of their product, making sure that it stays fresh longer or improving the flavor and taste to make it more appealing. Equally, through the ages, wine producers have regularly been spiking wine with low cost ingredients to lower the cost while making the wine appear of better quality than it is. A Phoenician tombstone dating back to 1,000 A.C. states: You shall not perform magic on your neighbor’s wine. Fatal side effects experienced from using lead sugar as a sweetener gave rise to serious wine analysis as of the 17th century. However, those who claim that wine analysis is just a means of detecting illegal techniques or additives are not delving deep enough into the matter. Modern wine science makes use of a wide range of instrumental analysis techniques and methods.
These enable the scientist to determine the or ig in of the key taste and f lavor compounds in the grapes and to follow the underlying metabolism processes every step of the way during the various technical and microbiological stages in the wine making process. Nevertheless, wine chemists are often faced with challenges that require new approaches and new solutions. In recent years it was increasingly found, that compounds which are odor active in the final wine are initially not detected in sensory tests.
This is due to the fact that they are bound to short chain saccharides or peptides during their formation in the grape vines. The side chains are subsequently split off by the yeasts during alcoholic fermentation, but hydrolysis is not the only thing that is happening. Through additional biochemical modifications performed by the yeast during the fermentation process, new and modified flavor compounds are created that give rise to different taste and flavor impressions. This means that the micro-organisms have significant influence on the wine flavor. A full and clear picture of the sensory aspects of a wine is only bestowed upon those that succeed in playing the entire range of instruments available for both wine
microbiology and wine analysis. Consequently, modern wine analysis is not just about enlisting the help of traditional tools such as spectroscopy, chromatography, photometry and electrochemistry; we must also rely on biochemical and molecular biology methods.
It would be a mistake to believe, however, that simply detecting genes and determining and regulating expression rates is the road to fruitful knowledge. In the age of “-omics”, Genomics, Transcriptomics and Metabolomics, detecting genes and determining and regulating their expression rates is no longer sufficient. A comprehensive determination of the metabolites formed during cellular activities on the vine and during fermentation is required; for the wine, these are the primary quality determining flavor compounds. Meanwhile oenologists world-wide are also learning to weave a systematic web using various highly different individual analyses and leading the way to a Systems Biology approach. This is a comprehensive research approach that the Geisenheim Research Center among others has put into practice in order to safeguard a millennia old cultural heritage and to benefit the consumer.
Prof. Dr. Manfred Grossmann is Vice-Chairman of the Institute of Oenol-ogy and Beverage Research and Chair-man of the Depart-ment of Biology and Microbiology, one of the oldest research centres in the German speak-ing countries. Professor Grossman is a member of the Board of Wine Research, consulting the German Federal Ministry of Nutrition, Agriculture and Consumer Protection; Consultant for the Federal Ministry of Education and Research as well as external reviewer for the Univer-sity of Stellenbosch. (South Africa). Since 1996 Professor Grossmann has been German delegate to the expert commit-tee „Microbiology of Wine“ of the Inter-national Organization of Vine and Wine (OIV) and has been vice-chairman of this committee since 2004.
Modern wine analysis
It’s not all about adulteration Prof. Dr. Manfred Grossmann
Imprint
ISS
N 1
619-
0076
· 07
/ 201
2
Published by GERSTEL GmbH & Co. KG Eberhard-Gerstel-Platz 1 45473 Mülheim an der Ruhr, Germany
Editorial Director Guido Deußing ScienceCommunication Neuss, Germany [email protected]
Translation and editing Kaj Petersen [email protected]
Scientific advisory board Eike Kleine-Benne, Ph.D. [email protected] Oliver Lerch, Ph.D. [email protected] Malte Reimold, Ph.D. [email protected]
Contact [email protected]
Design Paura Design, Hagen, Germany www.paura.de
Content
Modern Wine Analysis
Trace analysis of precious drops
News from GERSTEL GmbH & Co. KG · Eberhard-Gerstel-Platz 1 · 45473 Mülheim an der Ruhr · Germany · Phone + 49 (0) 2 08 - 7 65 03-0 · [email protected] ww
w.g
ers
tel.c
om
ISS
N 1
619
- 007
6
G L O B A L A N A L Y T I C A L S O L U T I O N S
Research
The Twister sniffs out the aftertaste
Off flavors in wine
Watch your sulfurs!
Wine flavor analysis
Holding on to fleeting encounters
SPECIAL EDITION
Modern wine analysis It’s not all about adulteration 2Archaeology meets chemistry Peeking into Pharaoh’s wine glass 3Research The Twister sniffs out the aftertaste 6Pesticide analysis EZ When the sample matrix no longer matters 9Lab on the slopes Flavor from trash cans 12Advanced Flavor and Fragrance Analysis An extra GC dimension at your finger tips 14Degustation Tasting a wine beats reading about it… 16Off Flavors in Wine part I: Corky Efficient and sensitive determination of TCA and other off-flavors 17
Off flavors in wine part II: Sulfur related flavors – reductive notes Watch your sulfurs! 20Twister extraction Two is company 24Wine flavor analysis Holding on to fleeting encounters 29Literature Suggested reading… 32
2 GERSTEL Solutions Worldwide Wine Special
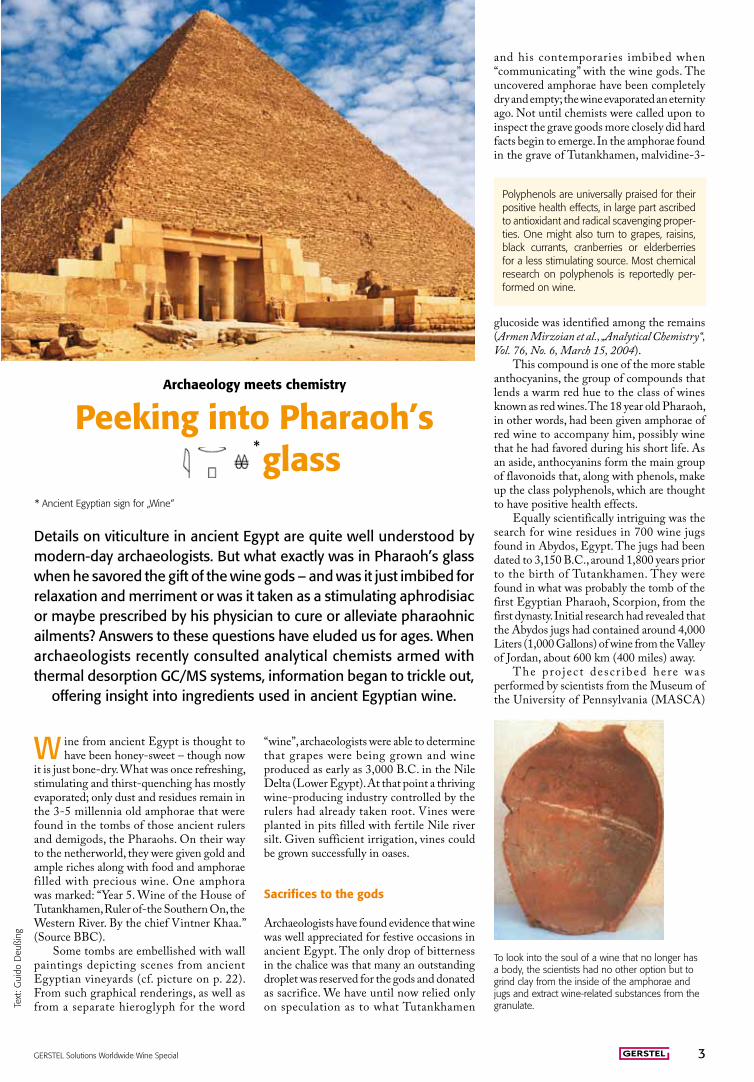
W ine from ancient Egypt is thought to have been honey-sweet – though now
it is just bone-dry. What was once refreshing, stimulating and thirst-quenching has mostly evaporated; only dust and residues remain in the 3-5 millennia old amphorae that were found in the tombs of those ancient rulers and demigods, the Pharaohs. On their way to the netherworld, they were given gold and ample riches along with food and amphorae filled with precious wine. One amphora was marked: “Year 5. Wine of the House of Tutankhamen, Ruler of-the Southern On, the Western River. By the chief Vintner Khaa.’’ (Source BBC).
Some tombs are embellished with wall paintings depicting scenes from ancient Egyptian vineyards (cf. picture on p. 22). From such graphical renderings, as well as from a separate hieroglyph for the word
Archaeology meets chemistry
Details on viticulture in ancient Egypt are quite well understood by modern-day archaeologists. But what exactly was in Pharaoh’s glass when he savored the gift of the wine gods – and was it just imbibed for relaxation and merriment or was it taken as a stimulating aphrodisiac or maybe prescribed by his physician to cure or alleviate pharaohnic ailments? Answers to these questions have eluded us for ages. When archaeologists recently consulted analytical chemists armed with thermal desorption GC/MS systems, information began to trickle out,
offering insight into ingredients used in ancient Egyptian wine.
Peeking into Pharaoh’s glass*
* Ancient Egyptian sign for „Wine“
“wine”, archaeologists were able to determine that grapes were being grown and wine produced as early as 3,000 B.C. in the Nile Delta (Lower Egypt). At that point a thriving wine-producing industry controlled by the rulers had already taken root. Vines were planted in pits filled with fertile Nile river silt. Given sufficient irrigation, vines could be grown successfully in oases.
Sacrifices to the gods
Archaeologists have found evidence that wine was well appreciated for festive occasions in ancient Egypt. The only drop of bitterness in the chalice was that many an outstanding droplet was reserved for the gods and donated as sacrifice. We have until now relied only on speculation as to what Tutankhamen
and his contemporaries imbibed when “communicating” with the wine gods. The uncovered amphorae have been completely dry and empty; the wine evaporated an eternity ago. Not until chemists were called upon to inspect the grave goods more closely did hard facts begin to emerge. In the amphorae found in the grave of Tutankhamen, malvidine-3-
To look into the soul of a wine that no longer has a body, the scientists had no other option but to grind clay from the inside of the amphorae and jugs and extract wine-related substances from the granulate.
Polyphenols are universally praised for their positive health effects, in large part ascribed to antioxidant and radical scavenging proper-ties. One might also turn to grapes, raisins, black currants, cranberries or elderberries for a less stimulating source. Most chemical research on polyphenols is reportedly per-formed on wine.
glucoside was identified among the remains (Armen Mirzoian et al., „Analytical Chemistry“, Vol. 76, No. 6, March 15, 2004).
This compound is one of the more stable anthocyanins, the group of compounds that lends a warm red hue to the class of wines known as red wines. The 18 year old Pharaoh, in other words, had been given amphorae of red wine to accompany him, possibly wine that he had favored during his short life. As an aside, anthocyanins form the main group of flavonoids that, along with phenols, make up the class polyphenols, which are thought to have positive health effects.
Equally scientifically intriguing was the search for wine residues in 700 wine jugs found in Abydos, Egypt. The jugs had been dated to 3,150 B.C., around 1,800 years prior to the birth of Tutankhamen. They were found in what was probably the tomb of the first Egyptian Pharaoh, Scorpion, from the first dynasty. Initial research had revealed that the Abydos jugs had contained around 4,000 Liters (1,000 Gallons) of wine from the Valley of Jordan, about 600 km (400 miles) away.
The pro j ec t desc r ibed here was performed by scientists from the Museum of the University of Pennsylvania (MASCA)
Text
: Gui
do D
eußi
ng
GERSTEL Solutions Worldwide Wine Special 3
Mural in the tomb of Nebamun, soldier in the army of Pharaoh Thutmose IV (Photo: archive).
Section of „Papyrus Ebers“ (1,500 B.C.) a 20 meter long list of medicinal recipes, and thereby the most comprehensive documentation of medi-cal knowledge in ancient Egypt known to man. The content mainly deals with internal diseases and their treatment. The papyrus was acquired for the University of Leipzig, Germany in 1872 by Georg Ebers (1837-1898), Professor of Egyptology.
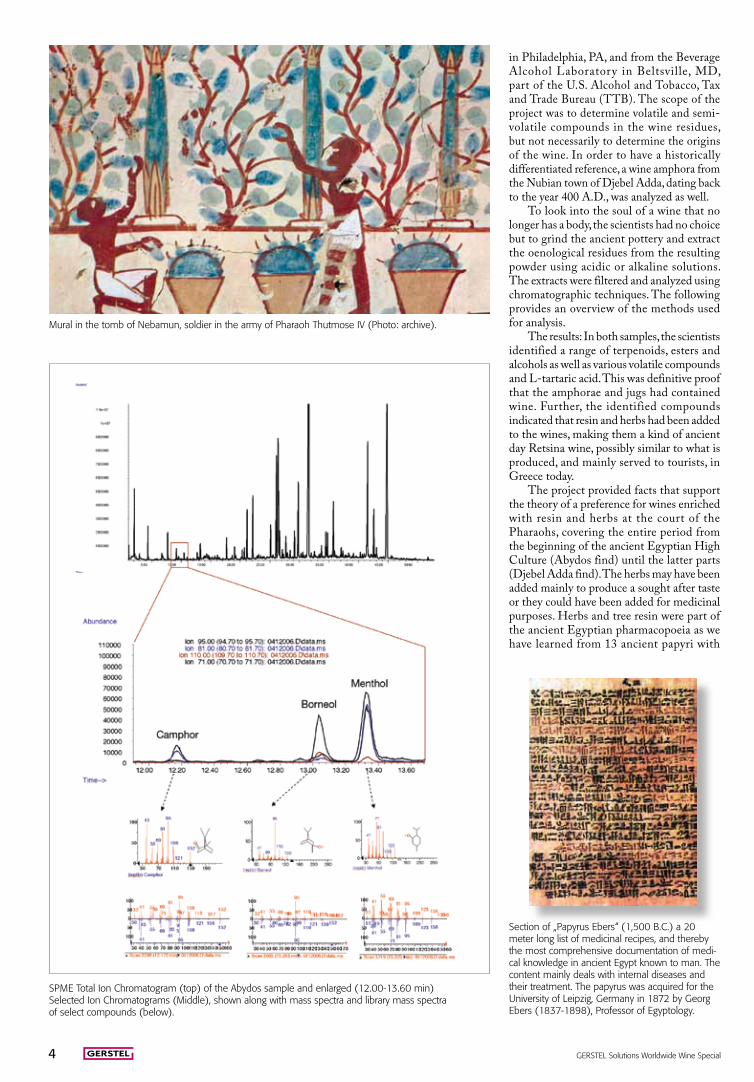
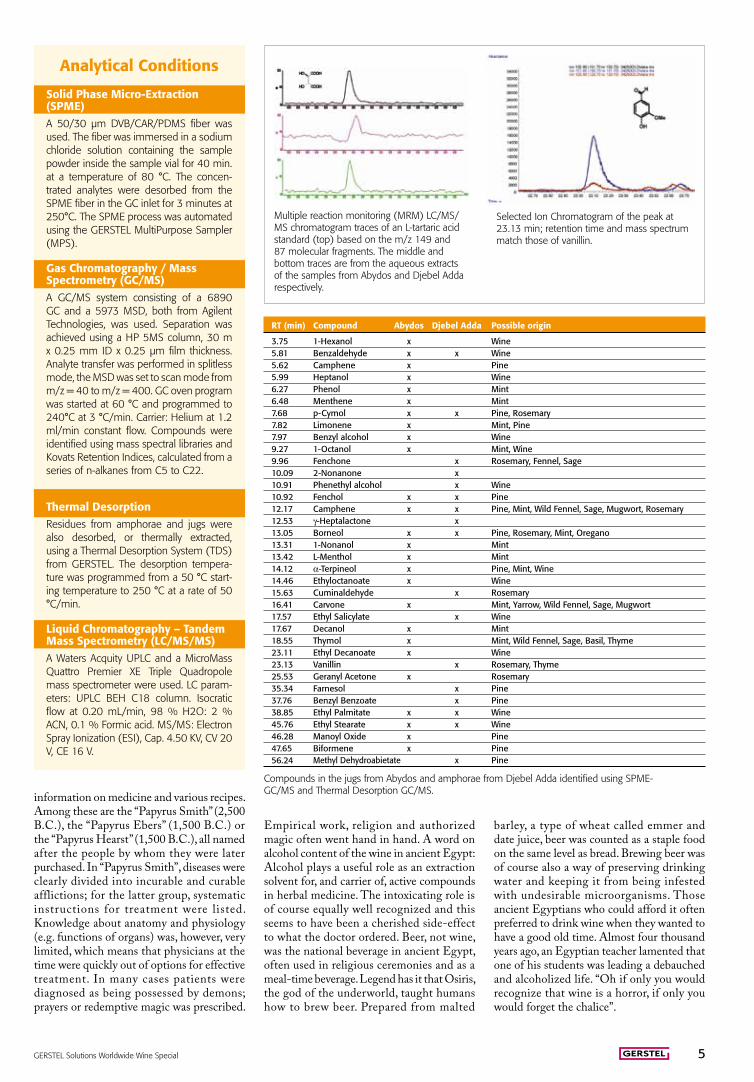
SPME Total Ion Chromatogram (top) of the Abydos sample and enlarged (12.00-13.60 min) Selected Ion Chromatograms (Middle), shown along with mass spectra and library mass spectra of select compounds (below).
in Philadelphia, PA, and from the Beverage Alcohol Laboratory in Beltsville, MD, part of the U.S. Alcohol and Tobacco, Tax and Trade Bureau (TTB). The scope of the project was to determine volatile and semi-volatile compounds in the wine residues, but not necessarily to determine the origins of the wine. In order to have a historically differentiated reference, a wine amphora from the Nubian town of Djebel Adda, dating back to the year 400 A.D., was analyzed as well.
To look into the soul of a wine that no longer has a body, the scientists had no choice but to grind the ancient pottery and extract the oenological residues from the resulting powder using acidic or alkaline solutions. The extracts were filtered and analyzed using chromatographic techniques. The following provides an overview of the methods used for analysis.
The results: In both samples, the scientists identified a range of terpenoids, esters and alcohols as well as various volatile compounds and L-tartaric acid. This was definitive proof that the amphorae and jugs had contained wine. Further, the identified compounds indicated that resin and herbs had been added to the wines, making them a kind of ancient day Retsina wine, possibly similar to what is produced, and mainly served to tourists, in Greece today.
The project provided facts that support the theory of a preference for wines enriched with resin and herbs at the court of the Pharaohs, covering the entire period from the beginning of the ancient Egyptian High Culture (Abydos find) until the latter parts (Djebel Adda find). The herbs may have been added mainly to produce a sought after taste or they could have been added for medicinal purposes. Herbs and tree resin were part of the ancient Egyptian pharmacopoeia as we have learned from 13 ancient papyri with
4 GERSTEL Solutions Worldwide Wine Special
RT (min) Compound Abydos Djebel Adda Possible origin
3.75 1-Hexanol x Wine5.81 Benzaldehyde x x Wine5.62 Camphene x Pine5.99 Heptanol x Wine6.27 Phenol x Mint6.48 Menthene x Mint7.68 p-Cymol x x Pine, Rosemary7.82 Limonene x Mint, Pine7.97 Benzyl alcohol x Wine9.27 1-Octanol x Mint, Wine9.96 Fenchone x Rosemary, Fennel, Sage10.09 2-Nonanone x 10.91 Phenethyl alcohol x Wine10.92 Fenchol x x Pine12.17 Camphene x x Pine, Mint, Wild Fennel, Sage, Mugwort, Rosemary12.53 g-Heptalactone x 13.05 Borneol x x Pine, Rosemary, Mint, Oregano13.31 1-Nonanol x Mint13.42 L-Menthol x Mint14.12 a-Terpineol x Pine, Mint, Wine14.46 Ethyloctanoate x Wine15.63 Cuminaldehyde x Rosemary16.41 Carvone x Mint, Yarrow, Wild Fennel, Sage, Mugwort17.57 Ethyl Salicylate x Wine17.67 Decanol x Mint18.55 Thymol x Mint, Wild Fennel, Sage, Basil, Thyme23.11 Ethyl Decanoate x Wine23.13 Vanillin x Rosemary, Thyme25.53 Geranyl Acetone x Rosemary35.34 Farnesol x Pine37.76 Benzyl Benzoate x Pine38.85 Ethyl Palmitate x x Wine45.76 Ethyl Stearate x x Wine46.28 Manoyl Oxide x Pine47.65 Biformene x Pine56.24 Methyl Dehydroabietate x Pine
Compounds in the jugs from Abydos and amphorae from Djebel Adda identified using SPME-GC/MS and Thermal Desorption GC/MS.
Multiple reaction monitoring (MRM) LC/MS/MS chromatogram traces of an L-tartaric acid standard (top) based on the m/z 149 and 87 molecular fragments. The middle and bottom traces are from the aqueous extracts of the samples from Abydos and Djebel Adda respectively.
Selected Ion Chromatogram of the peak at 23.13 min; retention time and mass spectrum match those of vanillin.
information on medicine and various recipes. Among these are the “Papyrus Smith” (2,500 B.C.), the “Papyrus Ebers” (1,500 B.C.) or the “Papyrus Hearst” (1,500 B.C.), all named after the people by whom they were later purchased. In “Papyrus Smith”, diseases were clearly divided into incurable and curable afflictions; for the latter group, systematic instructions for treatment were listed. Knowledge about anatomy and physiology (e.g. functions of organs) was, however, very limited, which means that physicians at the time were quickly out of options for effective treatment. In many cases patients were diagnosed as being possessed by demons; prayers or redemptive magic was prescribed.
Empirical work, religion and authorized magic often went hand in hand. A word on alcohol content of the wine in ancient Egypt: Alcohol plays a useful role as an extraction solvent for, and carrier of, active compounds in herbal medicine. The intoxicating role is of course equally well recognized and this seems to have been a cherished side-effect to what the doctor ordered. Beer, not wine, was the national beverage in ancient Egypt, often used in religious ceremonies and as a meal-time beverage. Legend has it that Osiris, the god of the underworld, taught humans how to brew beer. Prepared from malted
barley, a type of wheat called emmer and date juice, beer was counted as a staple food on the same level as bread. Brewing beer was of course also a way of preserving drinking water and keeping it from being infested with undesirable microorganisms. Those ancient Egyptians who could afford it often preferred to drink wine when they wanted to have a good old time. Almost four thousand years ago, an Egyptian teacher lamented that one of his students was leading a debauched and alcoholized life. “Oh if only you would recognize that wine is a horror, if only you would forget the chalice”.
Analytical Conditions
Solid Phase Micro-Extraction (SPME)A 50/30 µm DVB/CAR/PDMS fiber was used. The fiber was immersed in a sodium chloride solution containing the sample powder inside the sample vial for 40 min. at a temperature of 80 °C. The concen-trated analytes were desorbed from the SPME fiber in the GC inlet for 3 minutes at 250°C. The SPME process was automated using the GERSTEL MultiPurpose Sampler (MPS).
Gas Chromatography / Mass Spectrometry (GC/MS)A GC/MS system consisting of a 6890 GC and a 5973 MSD, both from Agilent Technologies, was used. Separation was achieved using a HP 5MS column, 30 m x 0.25 mm ID x 0.25 µm film thickness. Analyte transfer was performed in splitless mode, the MSD was set to scan mode from m/z = 40 to m/z = 400. GC oven program was started at 60 °C and programmed to 240°C at 3 °C/min. Carrier: Helium at 1.2 ml/min constant flow. Compounds were identified using mass spectral libraries and Kovats Retention Indices, calculated from a series of n-alkanes from C5 to C22.
Thermal DesorptionResidues from amphorae and jugs were also desorbed, or thermally extracted, using a Thermal Desorption System (TDS) from GERSTEL. The desorption tempera-ture was programmed from a 50 °C start-ing temperature to 250 °C at a rate of 50 °C/min.
Liquid Chromatography – Tandem Mass Spectrometry (LC/MS/MS)A Waters Acquity UPLC and a MicroMass Quattro Premier XE Triple Quadropole mass spectrometer were used. LC param-eters: UPLC BEH C18 column. Isocratic flow at 0.20 mL/min, 98 % H2O: 2 % ACN, 0.1 % Formic acid. MS/MS: Electron Spray Ionization (ESI), Cap. 4.50 KV, CV 20 V, CE 16 V.
GERSTEL Solutions Worldwide Wine Special 5
Research
The Twister sniffs out the aftertasteWhat do wine and mouthwash have in common? Both leave an aftertaste. How aftertaste develops has not yet been clearly determined, but it is well known that flavors and odors play an essential part; in fact, a more correct term would be “afterflavor”. A scientist from the German Research Laboratoy for Food Chemistry sheds some light on the secrets of how we taste.
6 GERSTEL Solutions Worldwide Wine Special

Using a method based on Stir Bar Sorptive Extract ion (SBSE), the German
Research Laboratory for Food Chemistry has succeeded for the first time in determining minute amounts of odor-causing substances in the mouth at defined time intervals after the consumption of food. The method can be used to determine aftertaste and it has helped explain how aftertaste develops. There are different ways to approach a good wine. Connoisseurs always swear by their own personal method. Certain principles and details, however, simply follow from instinct and from human anatomy. Minor tricks of the trade and some experience can then help even amateurs to a more qualified assessment and maybe to more enjoyment. To sum it up: wine tasting is not just for specialists. Even the ancient Romans knew that a wine should be judged not only by its taste, but by its color and flavor as well. Sounds simple, and it actually is – at least the part about the taste. The flavor evaluation, the palate test, still holds many secrets. Simple descriptors such as sweet sour, salty bitter, creamy, spicy or toasty cannot fully describe the complex interactions that provide the full experience of tasting food and drink. Whether food or drink has a short or long lasting taste, and whether it turns out to be enjoyable, depends mainly on to what extent and for how long characteristic flavors find their way from the oral cavity via the throat to the olfactory sensors in the nose. This process is referred to as retronasal odor perception. In contrast, when flavors are sensed in combination with inhalation through the nose, it is called orthonasal odor perception.
Learning from Mother Nature: Following the ways of human tasting But how do the flavor compounds that are released from foods or beverages in our mouth reach their destination, the olfactory sensors? To adequately answer this question it is not enough to watch a connoisseur during wine tasting. You can reach some conclusions about the person from the smacking, slurping and guttural sounds emanating during the process
of expert tasting. Still it remains unclear exactly how the odorous substances reach the olfactory sensing apparatus. If modern imaging tools are used, however, it becomes obvious that this is a precisely controlled process, which permits a flavor transfer only at certain times.
If there is food in the oral cavity and lips and jaws are closed, the palate and tongue base form a barrier that actually seals the oral cavity and prevents us from unintentionally swallowing food or literally getting it down the wrong pipe. A small experiment demonstrates the incredible efficiency of this natural lock inside the mouth. Take a small sip of coffee or wine and leave it in your mouth. Now close your lips. In doing so, keep your lower jaw completely still. What is your perception? Now start to chew. Does anything change in your perception? And then swallow. What is your perception now?
„As a general rule, taste impressions like sour, bitter, sweet or salty can be detected during the fi rst par t of this experiment, but no typical flavor notes like toasty, fruity or flowery“, explains Dr. Andrea Büttner, a scientist at the German Research Laboratory for Food Chemistry. During chewing, namely the second part of the experiment, the natural barrier in the oral cavity opens for a short time and small amounts of aroma components reach the olfactory bulb via the throat.
“However the real perception of the wine or coffee aroma does not occur until immediately after swallowing, with the first breath.”
An aroma impulse, by the way, can also be registered when we place food into our mouth. Andrea Büttner: „This is an important protective mechanism provided by Mother Nature. Through it we receive a first impression on whether the substance in our mouth is fit to eat or not.” The phenomenon has physiological reasons: as soon as we open the jaw, the tongue-palate barrier opens up for a short time. After closing mouth and jaw again, excess air is released from the mouth cavity into the nose via the throat cavity; flavor substances from the food are thus transferred to the olfactory sensors in the nose, where
a discernable sensory impulse is released through the sensory bulb to our brains. Proof that this is how the process works was provided by real-time breath analysis using Proton Transfer Reaction Mass Spectrometry (PTR-MS).
After taking a sip of wine, a test person exhales through the nose and then closes the lips and tongue-palate barrier. In the online PTR-MS measurement, a distinct initial peak is seen. The signal is due to the presence of ethyl acetate formed by reaction between ethanol and acetic acid. This highly volatile compound is easily sensed at relatively low
concentrations and often identified as a nail polish smell. In wine, ethyl acetate occurs naturally. In this experiment, ethyl acetate is used as a marker to detect the transfer of volatile wine flavor compounds from the oral cavity to the nose cavity. The initial ethyl acetate peak during wine intake lasts only 2.5 seconds. Even though the test person keeps the wine in the mouth for some time, only isoprene, a metabolite which is released into the atmosphere via our breath, is detected, but no ethyl acetate.
You can’t smell with your mouth full
Though the experienced connoisseur seldom swallows during wine tasting, he or she is able to give a comprehensive retronasal evaluation of a wine. Using a few tricks of the trade, mother nature and her physiological miracle of sensory perception is outwitted:
Open palate while food is inserted into the mouth with a spoon (video-fluoroscopic snap-shot).
GC System with MPS and TDU for fully automated analysis of up to 196 GERSTEL Twisters.
Text
: Gui
do D
eußi
ng
GERSTEL Solutions Worldwide Wine Special 7
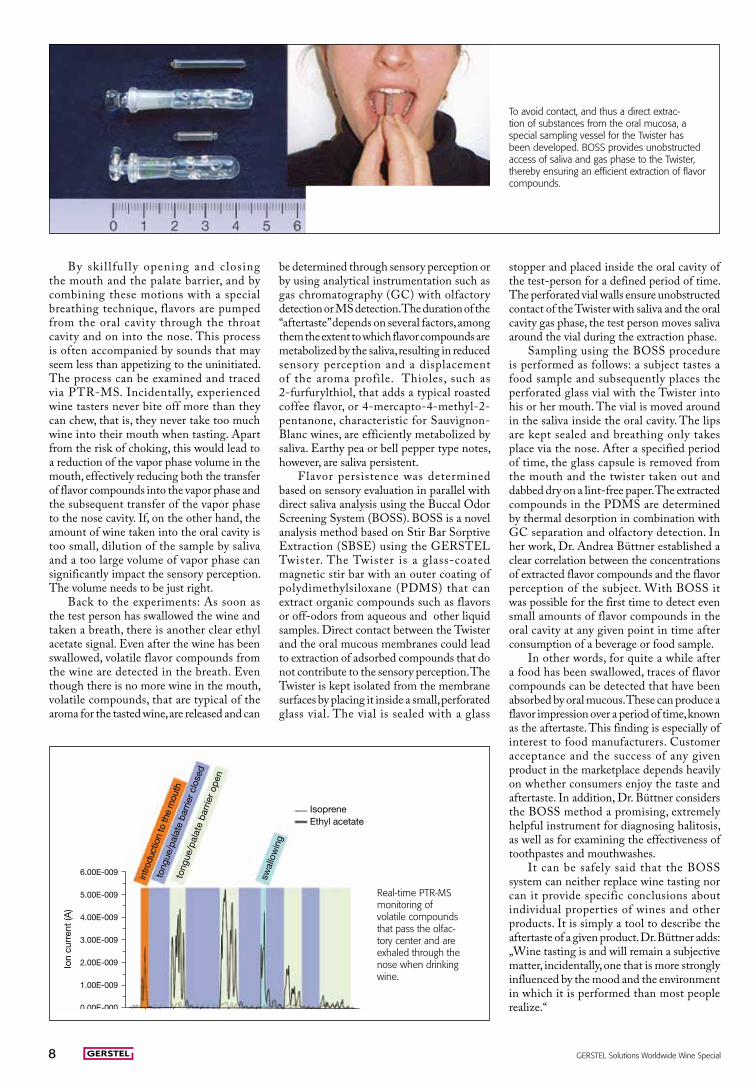
To avoid contact, and thus a direct extrac-tion of substances from the oral mucosa, a special sampling vessel for the Twister has been developed. BOSS provides unobstructed access of saliva and gas phase to the Twister, thereby ensuring an efficient extraction of flavor compounds.
���������
���������
���������
���������
���������
���������
���������
��������� ����� � �
��������
���
������
���
�� ��
��� ��� �
�����
�
���
����
�� ���
������
���
�
���
����
��
���
������
���
��������
�� �� �� �� �� ��� ��� ���
Real-time PTR-MS monitoring of volatile compounds that pass the olfac-tory center and are exhaled through the nose when drinking wine.
By skil lful ly opening and c losing the mouth and the palate barrier, and by combining these motions with a special breathing technique, flavors are pumped from the oral cavity through the throat cavity and on into the nose. This process is often accompanied by sounds that may seem less than appetizing to the uninitiated. The process can be examined and traced via PTR-MS. Incidentally, experienced wine tasters never bite off more than they can chew, that is, they never take too much wine into their mouth when tasting. Apart from the risk of choking, this would lead to a reduction of the vapor phase volume in the mouth, effectively reducing both the transfer of flavor compounds into the vapor phase and the subsequent transfer of the vapor phase to the nose cavity. If, on the other hand, the amount of wine taken into the oral cavity is too small, dilution of the sample by saliva and a too large volume of vapor phase can significantly impact the sensory perception. The volume needs to be just right.
Back to the experiments: As soon as the test person has swallowed the wine and taken a breath, there is another clear ethyl acetate signal. Even after the wine has been swallowed, volatile flavor compounds from the wine are detected in the breath. Even though there is no more wine in the mouth, volatile compounds, that are typical of the aroma for the tasted wine, are released and can
be determined through sensory perception or by using analytical instrumentation such as gas chromatography (GC) with olfactory detection or MS detection. The duration of the “aftertaste” depends on several factors, among them the extent to which flavor compounds are metabolized by the saliva, resulting in reduced sensory perception and a displacement of the aroma profile. Thioles, such as 2-furfurylthiol, that adds a typical roasted coffee flavor, or 4-mercapto-4-methyl-2-pentanone, characteristic for Sauvignon-Blanc wines, are efficiently metabolized by saliva. Earthy pea or bell pepper type notes, however, are saliva persistent.
Flavor persistence was determined based on sensory evaluation in parallel with direct saliva analysis using the Buccal Odor Screening System (BOSS). BOSS is a novel analysis method based on Stir Bar Sorptive Extraction (SBSE) using the GERSTEL Twister. The Twister is a glass-coated magnetic stir bar with an outer coating of polydimethylsiloxane (PDMS) that can extract organic compounds such as flavors or off-odors from aqueous and other liquid samples. Direct contact between the Twister and the oral mucous membranes could lead to extraction of adsorbed compounds that do not contribute to the sensory perception. The Twister is kept isolated from the membrane surfaces by placing it inside a small, perforated glass vial. The vial is sealed with a glass
stopper and placed inside the oral cavity of the test-person for a defined period of time. The perforated vial walls ensure unobstructed contact of the Twister with saliva and the oral cavity gas phase, the test person moves saliva around the vial during the extraction phase.
Sampling using the BOSS procedure is performed as follows: a subject tastes a food sample and subsequently places the perforated glass vial with the Twister into his or her mouth. The vial is moved around in the saliva inside the oral cavity. The lips are kept sealed and breathing only takes place via the nose. After a specified period of time, the glass capsule is removed from the mouth and the twister taken out and dabbed dry on a lint-free paper. The extracted compounds in the PDMS are determined by thermal desorption in combination with GC separation and olfactory detection. In her work, Dr. Andrea Büttner established a clear correlation between the concentrations of extracted flavor compounds and the flavor perception of the subject. With BOSS it was possible for the first time to detect even small amounts of flavor compounds in the oral cavity at any given point in time after consumption of a beverage or food sample.
In other words, for quite a while after a food has been swallowed, traces of flavor compounds can be detected that have been absorbed by oral mucous. These can produce a flavor impression over a period of time, known as the aftertaste. This finding is especially of interest to food manufacturers. Customer acceptance and the success of any given product in the marketplace depends heavily on whether consumers enjoy the taste and aftertaste. In addition, Dr. Büttner considers the BOSS method a promising, extremely helpful instrument for diagnosing halitosis, as well as for examining the effectiveness of toothpastes and mouthwashes.
It can be safely said that the BOSS system can neither replace wine tasting nor can it provide specific conclusions about individual properties of wines and other products. It is simply a tool to describe the aftertaste of a given product. Dr. Büttner adds: „Wine tasting is and will remain a subjective matter, incidentally, one that is more strongly influenced by the mood and the environment in which it is performed than most people realize.“
8 GERSTEL Solutions Worldwide Wine Special
Pesticide analysis EZ
When the sample matrix
no longer matters
Application specialists from TeLA GmbH have developed a new method that dramatically simplifies LC/MS determination of pesticide levels, providing high-quality results independent of the sample matrix type
and complexity.
P esticides, fungicides and herbicides are needed in order to provide an adequate
supply of food to the ever-growing human population across the world. The other side of the coin is that residues of these types of compounds in foods cannot be allowed to endanger or affect the health of the consumer. To ensure that foods do not endanger us, maximum acceptable levels, sometimes referred to as tolerated levels, have been established for individual compounds according to the current state of scientific knowledge. If these levels are exceeded, it would be illegal to market the contaminated product in Europe. Corresponding laws were established by the EU. This legal basis must be, or, in some cases, already has been, adapted into National law by EU member states.
In Germany, the details on maximum acceptable levels of residues can be found in the German LFGB, acronym for the compendium of laws governing Food, Feed
and various consumer products. As an aside, the term “consumer products” in this context spans a great variety of products ranging from packaging that comes into contact with food, feed or personal care products to personal care products themselves, such as cosmetics, tooth paste or shampoo or other personal care items that make more than brief contact with skin or mucous membranes.
Rules, unless properly enforced, are of course worth less than the proverbial paper they were printed on. In other words trust is fine, but we should verify and if needed take corrective action to ensure compliance and best possible consumer safety. This requires a network of reliable laboratories, which is not a trivial matter, as can be seen a bit later in this text.
World-wide, around 700 pesticides are in use, very few of which can be legally used throughout Europe. Various compounds classes have been established, but even these
can cover a wide range of polarities, making it difficult to develop a fast all-encompassing ana lysis method.
Still, effective multi-residue methods are in use for the determination of pesticides, helping to ensure food safety. When fruits and vegetables are analyzed for pesticide residues, often several pesticides are found. The effects on human health have only been documented for very few of these compounds or compound groups.
Tracking down pesticides using GC/MS and LC/MS
Classical pesticide analysis relied on gas chromatography (GC) using an electron capture detector (ECD) or a nitrogen phosphorous detector (NPD). The most widely used detector today is the mass selective detector (MSD).
GERSTEL Solutions Worldwide Wine Special 9

In Germany, the analytes that are mainly in focus are those listed in the DFG S19 method, a multi-residue method for the determination of pesticides in food, which enjoys Europe-wide recognition. The analysis of the 270 compounds listed in the S19 method does, however, require significant sample preparation including a gel chromatography clean-up step to separate analytes from the matrix.
Different analysis techniques are used for different types of pesticides. Liquid chromatography (LC) combined with a mass selective detector (MS) is used to determine polar to moderately apolar compounds. Gas chromatography (GC), most often in combination with a mass selective detector (MSD) covers apolar to moderately polar compounds. As can be seen from this description, there is some overlap between the techniques. Recently a new multi-residue method for the determination of pesticide levels in fruits and vegetables was presented (QuEChERS: Quick, Easy, Cheap, Effective, Rugged & Safe) [1]. Compared to previous methods, the QuEChERS sample preparation steps are much less time-consuming, enabling the preparation of 8 samples in less than 30 minutes. QuEChERS is a sample preparation method well suited for both GC, GC/MS and LC/MS analysis. The QuEChERS sample preparation steps are listed below.
The main benefit of this sample preparation method is that the overall analysis is less time-consuming and less error-prone than more traditional approaches. Unfortunately, extracts obtained following this procedure often have a high matrix content, which causes chromatographic problems for GC analysis due to residue build-up in the liner unless an automated liner exchange system such as the GERSTEL ALEX is used. [2]
QuEChERS method:
Weigh 10 g of sample –> Add 10 ml of Acetonitrile (AcN)
Shake vigorously 1 min –> Add 4 g MgSO4 and 1 gNaCl
Shake vigorously 1 min –> Add internal standard solution
Shake 30 sec and centrifuge –> Take Aliquot of supernatant
–> Add MgSO4 and sorbent
Shake 30 sec and centrifuge –> Take Aliquot of supernatant
–> inject to GC-MS and LC-MS
The results obtained using QuEChERS sample preparation are comparable to those reached using the S19 method. The QuEChERS method is much faster, requires much less sample preparation, covers a wider range of analytes and is more
readily automated. In addition, much smaller volumes of partly toxic organic solvents are required, compared with other currently used methods for determining pesticides in fruits and vegetables. In addition to the financial benefits of a much higher laboratory throughput, the cost of materials at around one Euro per sample is relatively low.
The limits of QuEChERS are en-countered whenever samples with more complex matrices need to be analyzed, such as garlic, onion, artichoke or avocado with much higher fat content. This can lead to problems with interferences, than can especially influence quantification unless further clean-up steps are performed.
To enable reliable and rugged analysis independent of the sample matrix, we looked for a similarly effective alternative sample preparation procedure. We found that automated solid phase extraction (SPE) based on the GERSTEL MultiPurpose Sampler (MPS) provided an excellent solution. The GERSTEL SPE, we have previously used successfully for a number of applications, including aflatoxins, chloramphenicol and malachite green in foods. In summary, we can report that our automated SPE-LC-MS/MS-ESI multi-residue method reduces the number of manual steps required to a minimum while increasing laboratory throughput. The results are solid and reproducible combined with high sensitivity and good limits of determination.
Instrumental requirements
The GERSTEL SPE was fitted with an injection valve; sample introduction to the Agilent LC 1200 was performed directly by the SPE system; detection was performed using an Agilent 6410 MS/MS Triple Quad instrument.
Sample Preparation: 15 mL of an acetonitrile/water mixture (80:20) was added to a five gram sample of fruit or vegetable for extraction. The SPE cartridge (M&N C-18ec, 6 mL, 1 g) was conditioned using 10 mL methanol (MeOH) and 10 mL water. All steps in the sample preparation procedure, including sample introduction were fully automated.
5 mL sample was added to the cartridge, which was subsequently rinsed with 5 mL water. Analytes were then eluted using an acetonitrile/water mixture added at a flow rate of 600µL/min. In contrast to most manual SPE methods, the liquid is not aspirated through the cartridge under vacuum, rather it is added under positive pressure using a syringe. This means that flows, and therefore also the elution speed, are accurately controlled and results more reproducible. This holds true even when sample matrix changes the restriction across the cartridge. The eluate was concentrated for six minutes at 50 °C and the residual analytes taken up in 5 mL of a acetonitrile/formic acid mixture (30:70).
Calibration curves for nine pesticides, determined using the TeLA GmbH SPE-LC-MS/MS pesticide multi-residue method.
Sample introduction and analyte separation: 20 µL of the cleaned-up extract was introduced directly to the LC/MS-MS System. The temperature of the column (ZorbaxXDB C-18 100x2.1 mm, 1.8 µm rapid resolution) was set to 50 °C; flow rate: 0.5 mL/min resulting in a column head pressure of approximately 420 bar. A solvent mixture of 5mM formic acid (A) and acetonitrile (B) was used as mobile phase based on the following gradient programming: 0 min (20 % B); 5 min (20 % B), 30 min (90 % B).
Detection: Analytes were detected with positive Electron Spray Ionization (ESI) using the electron spray ion source or, alternatively, the Agilent Multimode ion source. Our experiments clearly showed that the Multimode source provided significantly lower detection limits for some pesticides than the ESI source. For other compounds, however, a lower response was obtained than with the ESI ion source. The settings for the ion source were optimized for the flow and eluent used. The following parameters were used: N2 temperature: 340 °C; carrier gas flow (N2): 9 L/min; nebulizer pressure: 30 psi. The triple quadrupole instrument was operated in MRM mode, with 5 different time segments, monitoring two transitions for each pesticide. In eachsegment 40 to 50 analytes were monitored.
The proof of the pudding
When using the QuEChERS method, it is necessary to adapt the clean-up steps to the sample at hand. It has been clearly shown that for “uncomplicated” matrices, such as lettuce or cucumber, additional clean-up steps are not required following the acetonitrile/water extraction.
For complex matrices that contain fat and other challenging matrix components, fur ther c lean-up steps are of course needed. For this purpose we used the GERSTEL SPE system.
10 GERSTEL Solutions Worldwide Wine Special
Authors
Norbert Helle, Ph.D. and Meike Holtmann, TeLa GmbH, Fischkai 1, 27572 Bremer-haven, Germany; Phone: +49 471 / 4832 430; Fax: +49 471 / 4832 438; E-mail: [email protected]
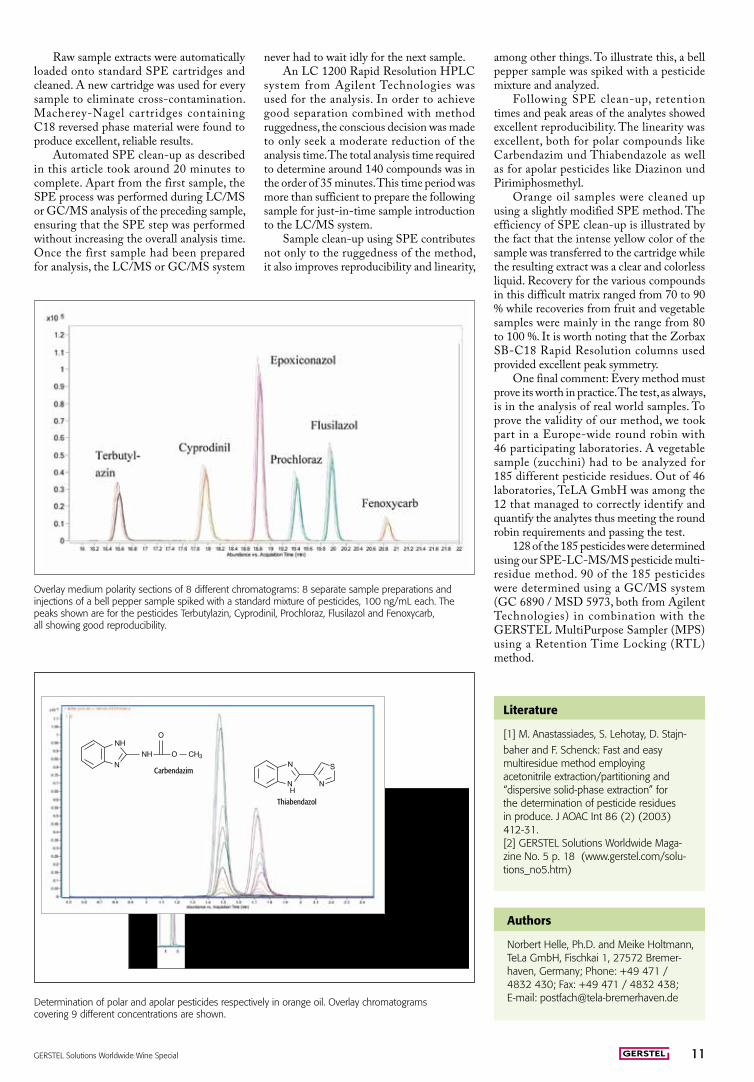
Overlay medium polarity sections of 8 different chromatograms: 8 separate sample preparations and injections of a bell pepper sample spiked with a standard mixture of pesticides, 100 ng/mL each. The peaks shown are for the pesticides Terbutylazin, Cyprodinil, Prochloraz, Flusilazol and Fenoxycarb, all showing good reproducibility.
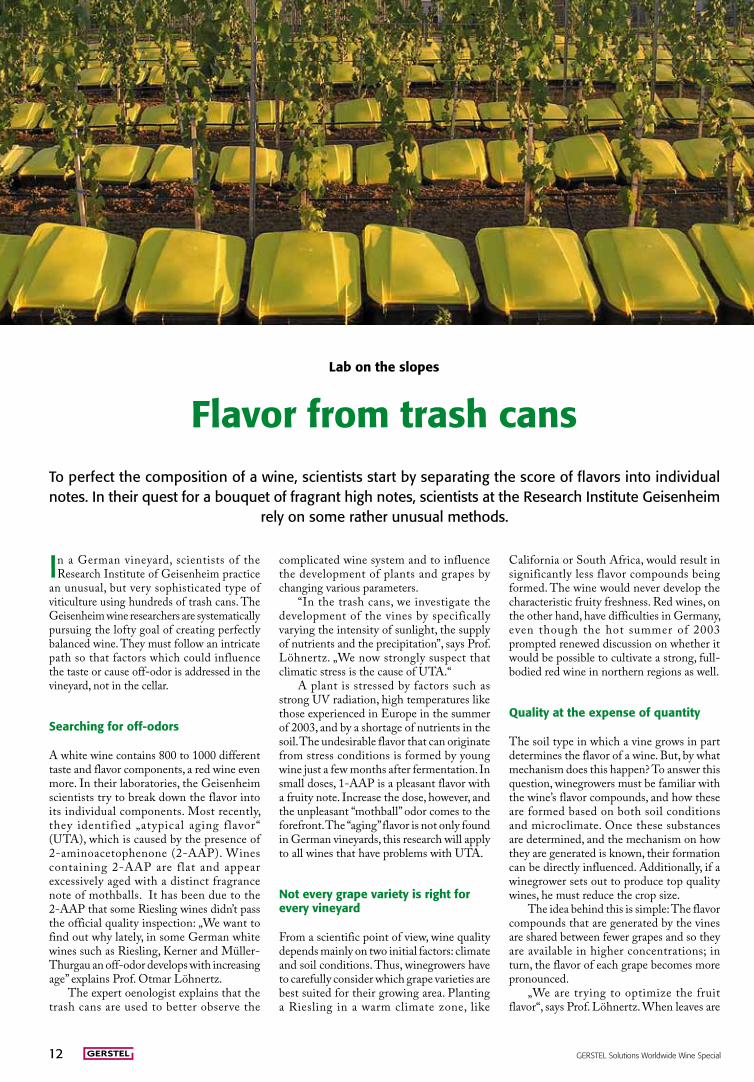
Carbendazim
Thiabendazol
Determination of polar and apolar pesticides respectively in orange oil. Overlay chromatograms covering 9 different concentrations are shown.
Raw sample extracts were automatically loaded onto standard SPE cartridges and cleaned. A new cartridge was used for every sample to eliminate cross-contamination. Macherey-Nagel cartridges containing C18 reversed phase material were found to produce excellent, reliable results.
Automated SPE clean-up as described in this article took around 20 minutes to complete. Apart from the first sample, the SPE process was performed during LC/MS or GC/MS analysis of the preceding sample, ensuring that the SPE step was performed without increasing the overall analysis time. Once the first sample had been prepared for analysis, the LC/MS or GC/MS system
never had to wait idly for the next sample. An LC 1200 Rapid Resolution HPLC
system from Agilent Technologies was used for the analysis. In order to achieve good separation combined with method ruggedness, the conscious decision was made to only seek a moderate reduction of the analysis time. The total analysis time required to determine around 140 compounds was in the order of 35 minutes. This time period was more than sufficient to prepare the following sample for just-in-time sample introduction to the LC/MS system.
Sample clean-up using SPE contributes not only to the ruggedness of the method, it also improves reproducibility and linearity,
Literature
[1] M. Anastassiades, S. Lehotay, D. Stajn-
baher and F. Schenck: Fast and easy multiresidue method employing acetonitrile extraction/partitioning and “dispersive solid-phase extraction” for the determination of pesticide residues in produce. J AOAC Int 86 (2) (2003) 412-31.[2] GERSTEL Solutions Worldwide Maga-zine No. 5 p. 18 (www.gerstel.com/solu-tions_no5.htm)
among other things. To illustrate this, a bell pepper sample was spiked with a pesticide mixture and analyzed.
Following SPE clean-up, retention times and peak areas of the analytes showed excellent reproducibility. The linearity was excellent, both for polar compounds like Carbendazim und Thiabendazole as well as for apolar pesticides like Diazinon und Pirimiphosmethyl.
Orange oil samples were cleaned up using a slightly modified SPE method. The efficiency of SPE clean-up is illustrated by the fact that the intense yellow color of the sample was transferred to the cartridge while the resulting extract was a clear and colorless liquid. Recovery for the various compounds in this difficult matrix ranged from 70 to 90 % while recoveries from fruit and vegetable samples were mainly in the range from 80 to 100 %. It is worth noting that the Zorbax SB-C18 Rapid Resolution columns used provided excellent peak symmetry.
One final comment: Every method must prove its worth in practice. The test, as always, is in the analysis of real world samples. To prove the validity of our method, we took part in a Europe-wide round robin with 46 participating laboratories. A vegetable sample (zucchini) had to be analyzed for 185 different pesticide residues. Out of 46 laboratories, TeLA GmbH was among the 12 that managed to correctly identify and quantify the analytes thus meeting the round robin requirements and passing the test.
128 of the 185 pesticides were determined using our SPE-LC-MS/MS pesticide multi-residue method. 90 of the 185 pesticides were determined using a GC/MS system (GC 6890 / MSD 5973, both from Agilent Technologies) in combination with the GERSTEL MultiPurpose Sampler (MPS) using a Retention Time Locking (RTL) method.
GERSTEL Solutions Worldwide Wine Special 11
Lab on the slopes
Flavor from trash cans
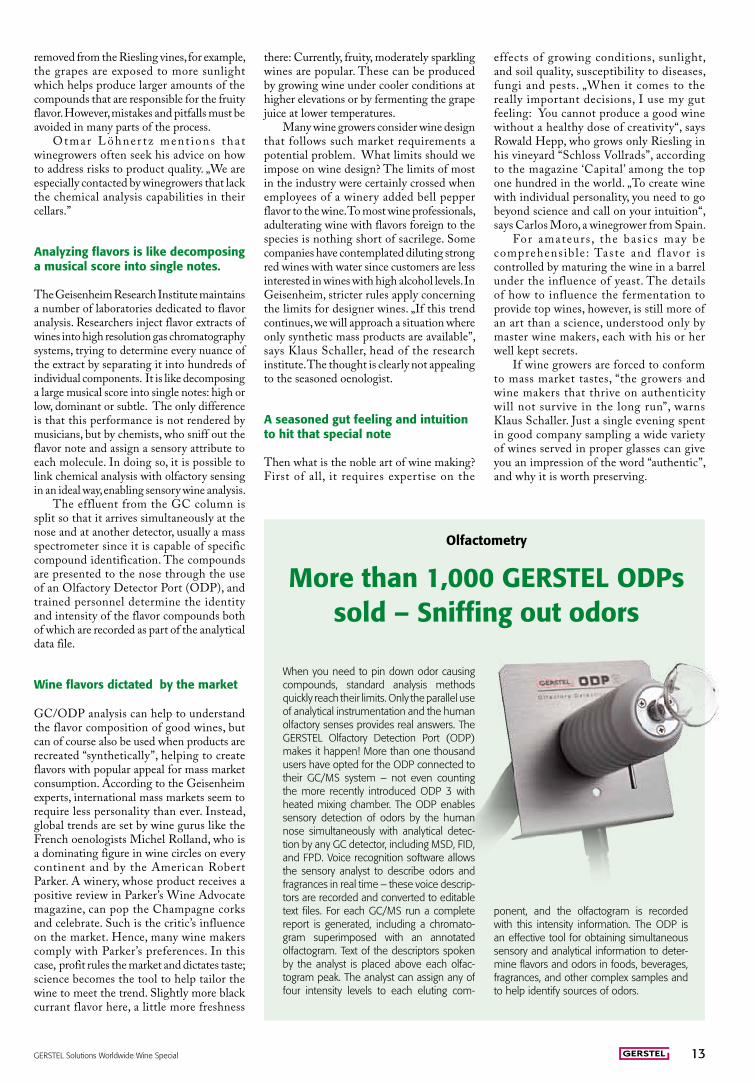
I n a German vineyard, scientists of the Research Institute of Geisenheim practice
an unusual, but very sophisticated type of viticulture using hundreds of trash cans. The Geisenheim wine researchers are systematically pursuing the lofty goal of creating perfectly balanced wine. They must follow an intricate path so that factors which could influence the taste or cause off-odor is addressed in the vineyard, not in the cellar.
Searching for off-odors
A white wine contains 800 to 1000 different taste and flavor components, a red wine even more. In their laboratories, the Geisenheim scientists try to break down the flavor into its individual components. Most recently, they identified „atypical aging flavor“ (UTA), which is caused by the presence of 2-aminoacetophenone (2-AAP). Wines containing 2-AAP are flat and appear excessively aged with a distinct fragrance note of mothballs. It has been due to the 2-AAP that some Riesling wines didn’t pass the official quality inspection: „We want to find out why lately, in some German white wines such as Riesling, Kerner and Müller-Thurgau an off-odor develops with increasing age” explains Prof. Otmar Löhnertz.
The expert oenologist explains that the trash cans are used to better observe the
California or South Africa, would result in significantly less flavor compounds being formed. The wine would never develop the characteristic fruity freshness. Red wines, on the other hand, have difficulties in Germany, even though the hot summer of 2003 prompted renewed discussion on whether it would be possible to cultivate a strong, full-bodied red wine in northern regions as well.
Quality at the expense of quantity
The soil type in which a vine grows in part determines the flavor of a wine. But, by what mechanism does this happen? To answer this question, winegrowers must be familiar with the wine’s flavor compounds, and how these are formed based on both soil conditions and microclimate. Once these substances are determined, and the mechanism on how they are generated is known, their formation can be directly influenced. Additionally, if a winegrower sets out to produce top quality wines, he must reduce the crop size.
The idea behind this is simple: The flavor compounds that are generated by the vines are shared between fewer grapes and so they are available in higher concentrations; in turn, the flavor of each grape becomes more pronounced.
„We are trying to optimize the fruit flavor“, says Prof. Löhnertz. When leaves are
complicated wine system and to influence the development of plants and grapes by changing various parameters.
“In the trash cans, we investigate the development of the vines by specifically varying the intensity of sunlight, the supply of nutrients and the precipitation”, says Prof. Löhnertz. „We now strongly suspect that climatic stress is the cause of UTA.“
A plant is stressed by factors such as strong UV radiation, high temperatures like those experienced in Europe in the summer of 2003, and by a shortage of nutrients in the soil. The undesirable flavor that can originate from stress conditions is formed by young wine just a few months after fermentation. In small doses, 1-AAP is a pleasant flavor with a fruity note. Increase the dose, however, and the unpleasant “mothball” odor comes to the forefront. The “aging” flavor is not only found in German vineyards, this research will apply to all wines that have problems with UTA.
Not every grape variety is right for every vineyard
From a scientific point of view, wine quality depends mainly on two initial factors: climate and soil conditions. Thus, winegrowers have to carefully consider which grape varieties are best suited for their growing area. Planting a Riesling in a warm climate zone, like
To perfect the composition of a wine, scientists start by separating the score of flavors into individual notes. In their quest for a bouquet of fragrant high notes, scientists at the Research Institute Geisenheim
rely on some rather unusual methods.
12 GERSTEL Solutions Worldwide Wine Special
removed from the Riesling vines, for example, the grapes are exposed to more sunlight which helps produce larger amounts of the compounds that are responsible for the fruity flavor. However, mistakes and pitfalls must be avoided in many parts of the process.
O tmar L öhner t z ment ions tha t winegrowers often seek his advice on how to address risks to product quality. „We are especially contacted by winegrowers that lack the chemical analysis capabilities in their cellars.”
Analyzing flavors is like decomposing a musical score into single notes.
The Geisenheim Research Institute maintains a number of laboratories dedicated to flavor analysis. Researchers inject flavor extracts of wines into high resolution gas chromatography systems, trying to determine every nuance of the extract by separating it into hundreds of individual components. It is like decomposing a large musical score into single notes: high or low, dominant or subtle. The only difference is that this performance is not rendered by musicians, but by chemists, who sniff out the flavor note and assign a sensory attribute to each molecule. In doing so, it is possible to link chemical analysis with olfactory sensing in an ideal way, enabling sensory wine analysis.
The effluent from the GC column is split so that it arrives simultaneously at the nose and at another detector, usually a mass spectrometer since it is capable of specific compound identification. The compounds are presented to the nose through the use of an Olfactory Detector Port (ODP), and trained personnel determine the identity and intensity of the flavor compounds both of which are recorded as part of the analytical data file.
Wine flavors dictated by the market
GC/ODP analysis can help to understand the flavor composition of good wines, but can of course also be used when products are recreated “synthetically”, helping to create flavors with popular appeal for mass market consumption. According to the Geisenheim experts, international mass markets seem to require less personality than ever. Instead, global trends are set by wine gurus like the French oenologists Michel Rolland, who is a dominating figure in wine circles on every continent and by the American Robert Parker. A winery, whose product receives a positive review in Parker’s Wine Advocate magazine, can pop the Champagne corks and celebrate. Such is the critic’s influence on the market. Hence, many wine makers comply with Parker’s preferences. In this case, profit rules the market and dictates taste; science becomes the tool to help tailor the wine to meet the trend. Slightly more black currant flavor here, a little more freshness
there: Currently, fruity, moderately sparkling wines are popular. These can be produced by growing wine under cooler conditions at higher elevations or by fermenting the grape juice at lower temperatures.
Many wine growers consider wine design that follows such market requirements a potential problem. What limits should we impose on wine design? The limits of most in the industry were certainly crossed when employees of a winery added bell pepper flavor to the wine. To most wine professionals, adulterating wine with flavors foreign to the species is nothing short of sacrilege. Some companies have contemplated diluting strong red wines with water since customers are less interested in wines with high alcohol levels. In Geisenheim, stricter rules apply concerning the limits for designer wines. „If this trend continues, we will approach a situation where only synthetic mass products are available”, says Klaus Schaller, head of the research institute. The thought is clearly not appealing to the seasoned oenologist.
A seasoned gut feeling and intuition to hit that special note
Then what is the noble art of wine making? First of all, it requires expertise on the
effects of growing conditions, sunlight, and soil quality, susceptibility to diseases, fungi and pests. „When it comes to the really important decisions, I use my gut feeling: You cannot produce a good wine without a healthy dose of creativity“, says Rowald Hepp, who grows only Riesling in his vineyard “Schloss Vollrads”, according to the magazine ‘Capital’ among the top one hundred in the world. „To create wine with individual personality, you need to go beyond science and call on your intuition“, says Carlos Moro, a winegrower from Spain.
For amateurs , the bas ics may be comprehensible : Taste and f lavor i s controlled by maturing the wine in a barrel under the influence of yeast. The details of how to influence the fermentation to provide top wines, however, is still more of an art than a science, understood only by master wine makers, each with his or her well kept secrets.
If wine growers are forced to conform to mass market tastes, “the growers and wine makers that thrive on authenticity will not survive in the long run”, warns Klaus Schaller. Just a single evening spent in good company sampling a wide variety of wines served in proper glasses can give you an impression of the word “authentic”, and why it is worth preserving.
Olfactometry
More than 1,000 GERSTEL ODPs sold – Sniffing out odors
When you need to pin down odor causing compounds, standard analysis methods quickly reach their limits. Only the parallel use of analytical instrumentation and the human olfactory senses provides real answers. The GERSTEL Olfactory Detection Port (ODP) makes it happen! More than one thousand users have opted for the ODP connected to their GC/MS system – not even counting the more recently introduced ODP 3 with heated mixing chamber. The ODP enables sensory detection of odors by the human nose simultaneously with analytical detec-tion by any GC detector, including MSD, FID, and FPD. Voice recognition software allows the sensory analyst to describe odors and fragrances in real time – these voice descrip-tors are recorded and converted to editable text files. For each GC/MS run a complete report is generated, including a chromato-gram superimposed with an annotated olfactogram. Text of the descriptors spoken by the analyst is placed above each olfac-togram peak. The analyst can assign any of four intensity levels to each eluting com-
ponent, and the olfactogram is recorded with this intensity information. The ODP is an effective tool for obtaining simultaneous sensory and analytical information to deter-mine flavors and odors in foods, beverages, fragrances, and other complex samples and to help identify sources of odors.
GERSTEL Solutions Worldwide Wine Special 13
Food analysis is certainly not a trivial matter. The typical matrix is complex, often
requiring several sample preparation steps and extensive sample clean-up. However, even well prepared samples can produce forests of overlapping peaks making it a case of not being able to see the trees for the forest. If a case of unresolved peaks is clearly at hand, or if an odor detected by using an Olfactory Detection Port (ODP) doesn’t match the
Advanced Flavor and Fragrance Analysis
An extra GC dimension at your finger tips
Gas chromatography (GC) experts rely on sharp peaks and baseline resolution to provide accurate answers. To perform chromatographic analysis of real-world samples, analysts often must deal with either
complex sample types such as essential oils and petroleum fractions, or complex matrices like biological fluids, foods, sludge, or polymers. Once the sample has been prepared for analysis, separation of all the individual compounds present by means of a single chromatographic separation can be challenging due
to the compounds having different ranges of polarity, boiling point, solubility, MW, and concentration. It is therefore necessary to use innovative yet robust
techniques that go beyond using a single chromatographic dimension to achieve compound separation. This sounds simple enough, but until now it hasn’t been, since techniques that require a second dimension (column) require a lot of additional hardware, including an extra GC. Not anymore: The patented GERSTEL Selectable 1D/2D-GC/MS System enables the best of both worlds. The system can be used for routine single dimensional GC/MS analysis, and with the click of a mouse, can be switched to perform two-dimensional separation when needed for more complex matrices. This allows interesting sections of the chromatogram to be collected and concentrated from multiple runs to better separate and isolate trace compounds. This can, for example, be used for trouble shooting when off-odors are detected in a product.
All this is performed using just one GC/MS system.
peaks in the chromatogram, the analyst needs to have a good tool kit at her or his disposal. In this case, selectable multidimensional GC can be the technique that cuts through the thicket and provides clear, reliable answers whenever one-dimensional GC does not.
Until now, multi-dimensional GC required the use of a dedicated system with two GCs coupled to each other. Due to the extra cost, and to the often limited utilization
in the laboratory, such solutions didn’t always provide the best return on investment (ROI).
GERSTEL now offers a solution that can be used for routine analysis as well as for special challenges. The patented GERSTEL Selectable 1D/2D-GC/MS is a flexible system, based on a single standard GC/MS instrument. It is both a routine analysis system and a complex problem solving system that offers heart-cutting and two-dimensional
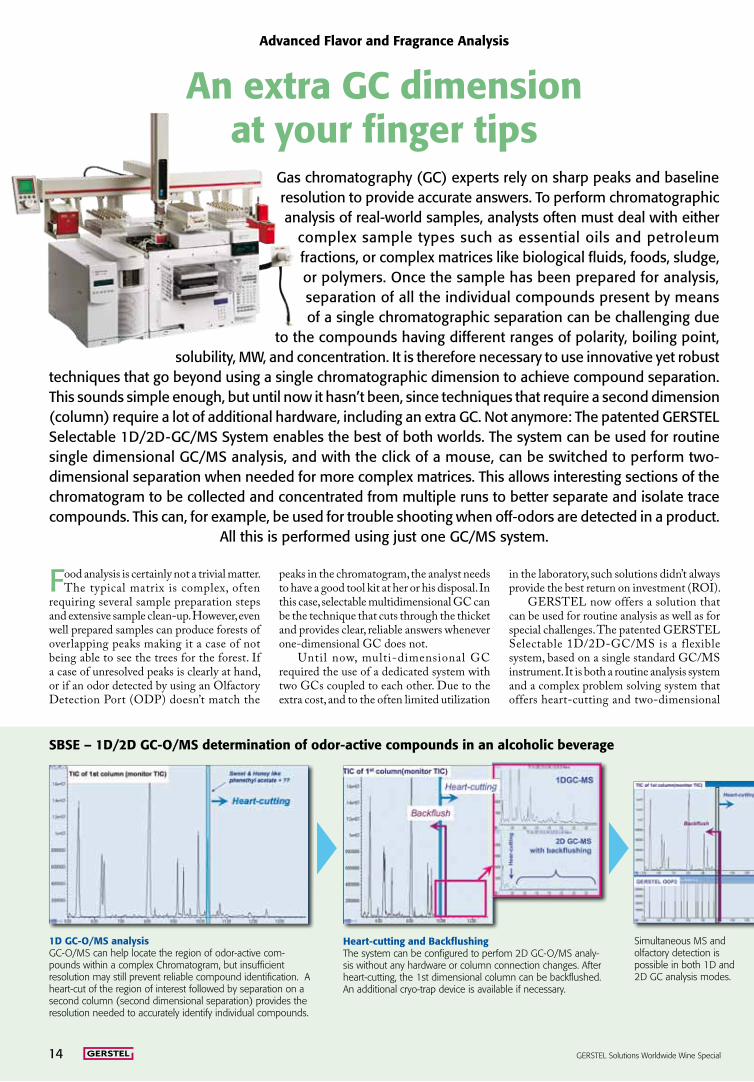
SBSE – 1D/2D GC-O/MS determination of odor-active compounds in an alcoholic beverage
1D GC-O/MS analysisGC-O/MS can help locate the region of odor-active com-pounds within a complex Chromatogram, but insufficient resolution may still prevent reliable compound identification. A heart-cut of the region of interest followed by separation on a second column (second dimensional separation) provides the resolution needed to accurately identify individual compounds.
Heart-cutting and BackflushingThe system can be configured to perfom 2D GC-O/MS analy-sis without any hardware or column connection changes. After heart-cutting, the 1st dimensional column can be backflushed. An additional cryo-trap device is available if necessary.
Simultaneous MS and olfactory detection is possible in both 1D and 2D GC analysis modes.
14 GERSTEL Solutions Worldwide Wine Special
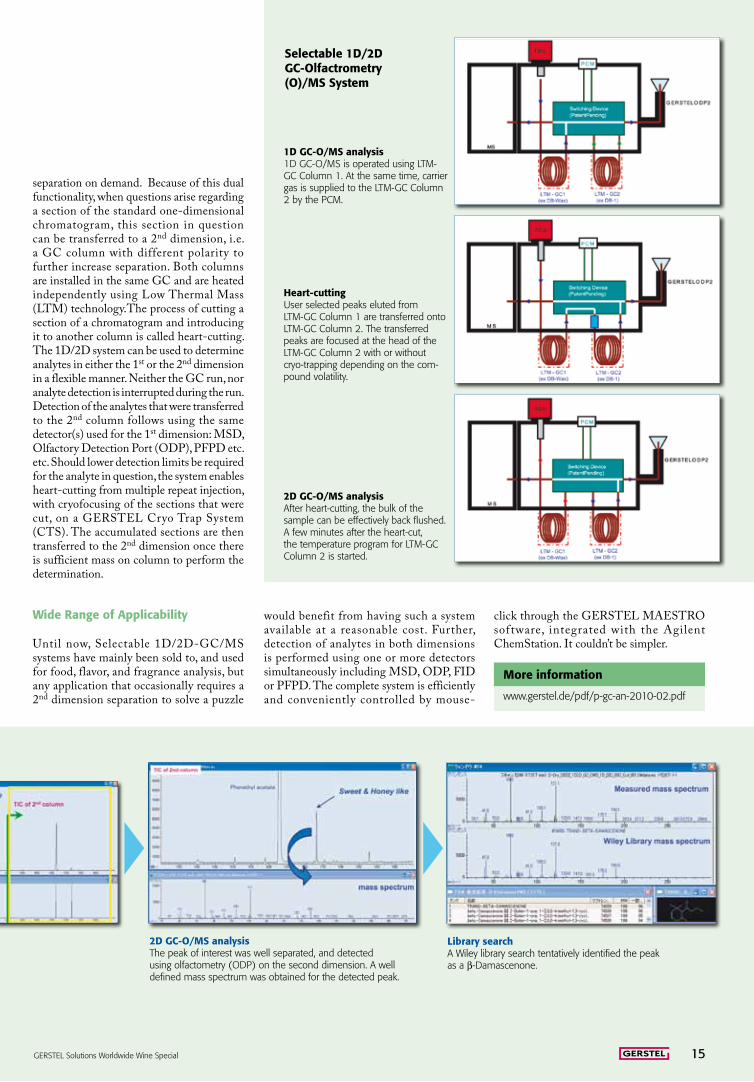
separation on demand. Because of this dual functionality, when questions arise regarding a section of the standard one-dimensional chromatogram, this section in question can be transferred to a 2nd dimension, i.e. a GC column with different polarity to further increase separation. Both columns are installed in the same GC and are heated independently using Low Thermal Mass (LTM) techno logy.The process of cutting a section of a chromatogram and introducing it to another column is called heart-cutting. The 1D/2D system can be used to determine analytes in either the 1st or the 2nd dimension in a flexible manner. Neither the GC run, nor analyte detection is interrupted during the run. Detection of the analytes that were transferred to the 2nd column follows using the same detector(s) used for the 1st dimension: MSD, Olfactory Detection Port (ODP), PFPD etc. etc. Should lower detection limits be required for the analyte in question, the system enables heart-cutting from multiple repeat injection, with cryofocusing of the sections that were cut, on a GERSTEL Cryo Trap System (CTS). The accumulated sections are then transferred to the 2nd dimension once there is sufficient mass on column to perform the determination.
Wide Range of Applicability
Until now, Selectable 1D/2D-GC/MS systems have mainly been sold to, and used for food, flavor, and fragrance analysis, but any application that occasionally requires a 2nd dimension separation to solve a puzzle
would benefit from having such a system available at a reasonable cost. Further, detection of analytes in both dimensions is performed using one or more detectors simultaneously including MSD, ODP, FID or PFPD. The complete system is efficiently and conveniently controlled by mouse-
2D GC-O/MS analysisThe peak of interest was well separated, and detected using olfactometry (ODP) on the second dimension. A well defined mass spectrum was obtained for the detected peak.
Library searchA Wiley library search tentatively identified the peak as a b-Damascenone.
1D GC-O/MS analysis1D GC-O/MS is operated using LTM-GC Column 1. At the same time, carrier gas is supplied to the LTM-GC Column 2 by the PCM.
Heart-cuttingUser selected peaks eluted from LTM-GC Column 1 are transferred onto LTM-GC Column 2. The transferred peaks are focused at the head of the LTM-GC Column 2 with or without cryo-trapping depending on the com-pound volatility.
2D GC-O/MS analysisAfter heart-cutting, the bulk of the sample can be effectively back flushed. A few minutes after the heart-cut, the temperature program for LTM-GC Column 2 is started.
click through the GERSTEL MAESTRO software, integrated with the Agilent ChemStation. It couldn’t be simpler.
More information
www.gerstel.de/pdf/p-gc-an-2010-02.pdf
Selectable 1D/2D GC-Olfactrometry (O)/MS System
GERSTEL Solutions Worldwide Wine Special 15

Degustation
Tasting a wine beats reading about it…
When it comes to nobler or even divine drops, tasting a wine beats reading rave reviews. But a little reading could offer a good starting point when you set out to differentiate noble drops from pleasurable daily or even inferior ones. When mingling with real or would-be connoisseurs, the following vocabulary samples could help you fit in: A wine scientist is called an oenologist; wine expert in a classy restaurant: Sommelier; and while merry wine drinkers enjoy wine tasting, high-brow tasting is referred to as a degustation. In the following, a few points are listed as to how professionals explore the soul of a wine.
1 White and Rosé wines should be served cool, depending on the grape variety between 7 and 13 °C (Follow
the recommendations on the label). The wine shouldn‘t be colder or fruity notes in the aroma could be lost or diminished. Red wine is best enjoyed at room temperature, typically in the range 16-18 °C, or the alcohol will overshadow the aroma and bouquet of the wine.
2 Uncork the bottle in a timely manner and let the wine breathe before tasting it. Aeration will generally round or
soften the wine, activating or releasing aromas and bouquet allowing a full appreciation of what the wine brings to the table. This holds true for both red and white wines, but every wine has its own personality, requiring individual timing. A German Pinot Noir readily surrenders its black currant notes after only 15 minutes. A Barolo from Piedmont with its characteristic tannins, however, profits from breathing for 60 minutes. For a more efficient, or even hasty, aeration, the wine can be decanted, i.e. transferred to a decanter and even swirled. In case of a well aged wine, however, none of this is advisable; the oxygen could make the wine go bad. Too much agitation could do the same; the bottle should be transported and the wine poured into the glass slowly and cautiously.
3 An authentic optical impression of the wine is best achieved in a clear glass. It should be bulgy with a narrower
opening. This shape is best suited to retain the aroma of the wine. According to ISO 3591: „The tasting glass consists of a cup (an „elongated egg“) supported by a stem resting on a base. The opening of the cup is narrower than the convex part so as to concentrate the bouquet.“ In order to allow the aroma to present itself to the nose, the glass must have sufficient free volume (headspace) above the wine; better to revisit the bottle than to
overfill the glass. The glass should be held at the bottom part of the stem, ensuring that the wine is not heated by the hand and to keep perfume or soap flavors from interfering with the olfactory wine impression.
4 Once in the glass, the wine should not be tasted immediately, a visual appreciation should be gained first. The color allows
first conclusions to be drawn as to grape variety, maturity, quality and condition. A sweet or suave white wine generally has a deeper yellow hue than most dry varieties. A higher viscosity indicates higher levels of sugar as indicated by patterns similar to gothic cathedral windows when a layer of
wine slowly flows down the inside of the glass after swirling. Good quality is also indicated by an intense clarity and shine of the wine, which shouldn‘t be clouded by suspended precipitate. Brown coloration of white and red wines alike is a sign of excessive ageing and the wine should no longer be consumed.
5 The olfactory evaluation is the initial close encounter with a wine. The well honed nose is the first and foremost
tool of the trade for a wine taster, a well trained olfactory sense can help distinguish and determine a large number of aromas and flavors. Aspirating the headspace from the glass and evaluating the olfactory profile is often done with eyes closed to enable full concentration during the fleeting encounter with the most volatile fraction. At first, this is done without agitating the wine to avoid
driving away the volatile aroma compounds. After the initial olfactory assessment, the wine is swirled in the glass and further scents emerge from the wine at the bottom of the glass. The full picture is always composed of both objective and subjective facets, but experts generally agree: White wines have gooseberry, strawberry or vanilla aromas; red Bordeaux wines can exhibit chocolate aromas.
6 Getting the taste of a wine is a matter for the tongue. Wine tasting therefore involves not just drinking, but rather
letting the wine cascade enjoyably over your tongue. The tongue registers sweet, salty and bitter impressions. The less than appetizing slurping sound generated by professional tasters occurs when air is pulled through the oral cavity to aerate the wine and release the full impression to the olfactory bulbs in the nose cavity. Finally, the litmus test: Swallow or expectorate (discard into the spittoon). The answer is unequivocal: to track the sensation in the oral cavity, the wine must go down the throat. You expectorate the good drops mainly if several wines are to be tasted and the alcohol shouldn‘t go to your head. If after tasting a wine the taste subsides quickly, it is described as a short aftertaste - if it persists, it‘s a long finish as is to be expected, for example, from high quality wines. And if the taste disappears only to reappear, it is called a peacock finish. According to Wikipedia: „The aftertaste of a wine can be described as bitter, persistent, short, sweet, smooth, or even non-existent. Included in assessing the aftertaste of a wine is consideration of the aromas still present after swallowing. High quality wines typically have long finishes accompanied by pleasant aromas“. As for the sample to sample carry over: Still water with little mineral content is the right interlude between wines to ensure a neutral transition. Chewing white bread, on the other hand could influence the tasting since enzymes in the saliva convert starch to sugar.
Step by step: Tasting wine like a pro...
16 GERSTEL Solutions Worldwide Wine Special
Y ou don’t have to be a sommelier or wine expert to tell the difference between a perfect
wine and a corky wine. 2,4,6-trichloroanisol (TCA) has an extremely low odor threshold. As little as a few nanograms per liter of air is enough to detect an unpleasant musty off-flavor. In water and wine it is a similar story with odor thresholds at 0.3 ng/L and 1.4 ng/L respectively, “but that is only a theoretical value”, says Horst Rudy from the Agricultural Service Center (DLR) of the Mosel wine region in Germany. “After all”, the laboratory manager explains, “sensory perception is highly individual and very subjective: While one consumer may sense no problem even at much higher concentrations, another person’s
Off Flavors in Wine part I: Corky
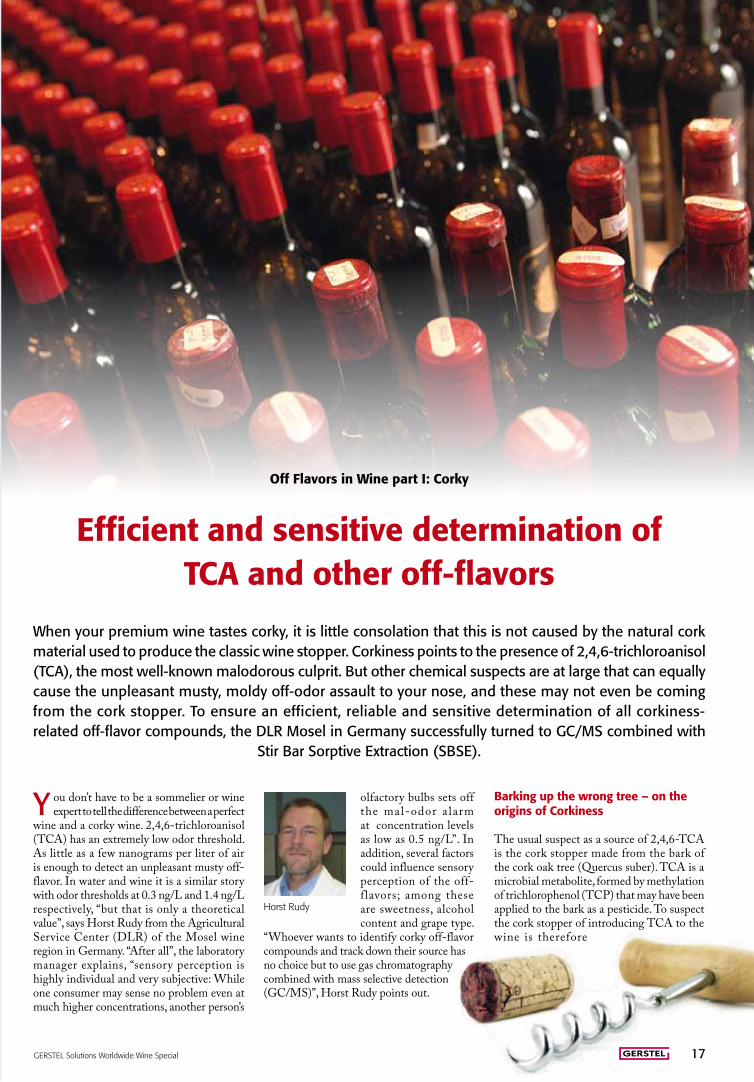
When your premium wine tastes corky, it is little consolation that this is not caused by the natural cork material used to produce the classic wine stopper. Corkiness points to the presence of 2,4,6-trichloroanisol (TCA), the most well-known malodorous culprit. But other chemical suspects are at large that can equally cause the unpleasant musty, moldy off-odor assault to your nose, and these may not even be coming from the cork stopper. To ensure an efficient, reliable and sensitive determination of all corkiness-related off-flavor compounds, the DLR Mosel in Germany successfully turned to GC/MS combined with
Stir Bar Sorptive Extraction (SBSE).
Efficient and sensitive determination of TCA and other off-flavors
olfactory bulbs sets off the mal-odor a larm at concentration levels as low as 0.5 ng/L”. In addition, several factors could influence sensory perception of the off-flavors; among these are sweetness, alcohol content and grape type.
“Whoever wants to identify corky off-flavor compounds and track down their source has no choice but to use gas chromatography combined with mass selective detection (GC/MS)”, Horst Rudy points out.
Horst Rudy
Barking up the wrong tree – on the origins of Corkiness
The usual suspect as a source of 2,4,6-TCA is the cork stopper made from the bark of the cork oak tree (Quercus suber). TCA is a microbial metabolite, formed by methylation of trichlorophenol (TCP) that may have been applied to the bark as a pesticide. To suspect the cork stopper of introducing TCA to the wine is therefore
GERSTEL Solutions Worldwide Wine Special 17
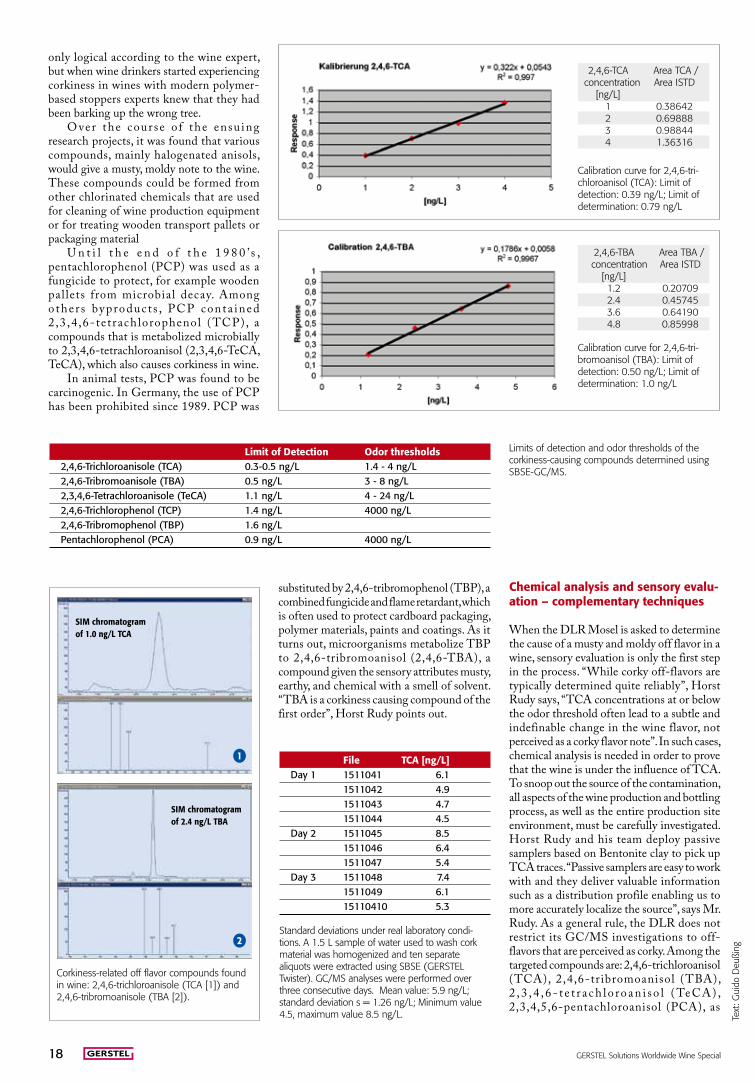
Calibration curve for 2,4,6-tri-chloroanisol (TCA): Limit of detection: 0.39 ng/L; Limit of determination: 0.79 ng/L
2,4,6-TCA Area TCA / concentration Area ISTD [ng/L] 1 0.38642 2 0.69888 3 0.98844 4 1.36316
Calibration curve for 2,4,6-tri-bromoanisol (TBA): Limit of detection: 0.50 ng/L; Limit of determination: 1.0 ng/L
2,4,6-TBA Area TBA / concentration Area ISTD [ng/L] 1.2 0.20709 2.4 0.45745 3.6 0.64190 4.8 0.85998
Limit of Detection Odor thresholds 2,4,6-Trichloroanisole (TCA) 0.3-0.5 ng/L 1.4 - 4 ng/L2,4,6-Tribromoanisole (TBA) 0.5 ng/L 3 - 8 ng/L 2,3,4,6-Tetrachloroanisole (TeCA) 1.1 ng/L 4 - 24 ng/L 2,4,6-Trichlorophenol (TCP) 1.4 ng/L 4000 ng/L 2,4,6-Tribromophenol (TBP) 1.6 ng/L Pentachlorophenol (PCA) 0.9 ng/L 4000 ng/L
File TCA [ng/L]Day 1 1511041 6.1 1511042 4.9 1511043 4.7 1511044 4.5Day 2 1511045 8.5 1511046 6.4 1511047 5.4Day 3 1511048 7.4 1511049 6.1 15110410 5.3
Standard deviations under real laboratory condi-tions. A 1.5 L sample of water used to wash cork material was homogenized and ten separate aliquots were extracted using SBSE (GERSTEL Twister). GC/MS analyses were performed over three consecutive days. Mean value: 5.9 ng/L; standard deviation s = 1.26 ng/L; Minimum value 4.5, maximum value 8.5 ng/L.
only logical according to the wine expert, but when wine drinkers started experiencing corkiness in wines with modern polymer-based stoppers experts knew that they had been barking up the wrong tree.
O ver the cour se o f the ensu ing research projects, it was found that various compounds, mainly halogenated anisols, would give a musty, moldy note to the wine. These compounds could be formed from other chlorinated chemicals that are used for cleaning of wine production equipment or for treating wooden transport pallets or packaging material
U n t i l t h e e n d o f t h e 1 9 8 0 ’ s , pentachlorophenol (PCP) was used as a fungicide to protect, for example wooden pallets from microbial decay. Among o the r s by produc t s , PCP conta ined 2,3 ,4 ,6-tetrachlorophenol (TCP), a compounds that is metabolized microbially to 2,3,4,6-tetrachloroanisol (2,3,4,6-TeCA, TeCA), which also causes corkiness in wine.
In animal tests, PCP was found to be carcinogenic. In Germany, the use of PCP has been prohibited since 1989. PCP was
Corkiness-related off flavor compounds found in wine: 2,4,6-trichloroanisole (TCA [1]) and 2,4,6-tribromoanisole (TBA [2]).
1
2
SIM chromatogramof 2.4 ng/L TBA
SIM chromatogramof 1.0 ng/L TCA
Chemical analysis and sensory evalu-ation – complementary techniques
When the DLR Mosel is asked to determine the cause of a musty and moldy off flavor in a wine, sensory evaluation is only the first step in the process. “While corky off-flavors are typically determined quite reliably”, Horst Rudy says, “TCA concentrations at or below the odor threshold often lead to a subtle and indefinable change in the wine flavor, not perceived as a corky flavor note”. In such cases, chemical analysis is needed in order to prove that the wine is under the influence of TCA. To snoop out the source of the contamination, all aspects of the wine production and bottling process, as well as the entire production site environment, must be carefully investigated. Horst Rudy and his team deploy passive samplers based on Bentonite clay to pick up TCA traces. “Passive samplers are easy to work with and they deliver valuable information such as a distribution profile enabling us to more accurately localize the source”, says Mr. Rudy. As a general rule, the DLR does not restrict its GC/MS investigations to off-flavors that are perceived as corky. Among the targeted compounds are: 2,4,6-trichloroanisol (TCA), 2,4,6-tr ibromoanisol (TBA), 2 , 3 , 4 , 6 - t e t r a c h lo roan i so l ( Te CA) , 2,3,4,5,6-pentachloroanisol (PCA), as
substituted by 2,4,6-tribromophenol (TBP), a combined fungicide and flame retardant, which is often used to protect cardboard packaging, polymer materials, paints and coatings. As it turns out, microorganisms metabolize TBP to 2,4,6-tribromoanisol (2,4,6-TBA), a compound given the sensory attributes musty, earthy, and chemical with a smell of solvent. “TBA is a corkiness causing compound of the first order”, Horst Rudy points out.
Limits of detection and odor thresholds of the corkiness-causing compounds determined using SBSE-GC/MS.
Text
: Gui
do D
eußi
ng
18 GERSTEL Solutions Worldwide Wine Special
Step by step: How to extract odor active
compounds from wine or water using the GERSTEL Twister
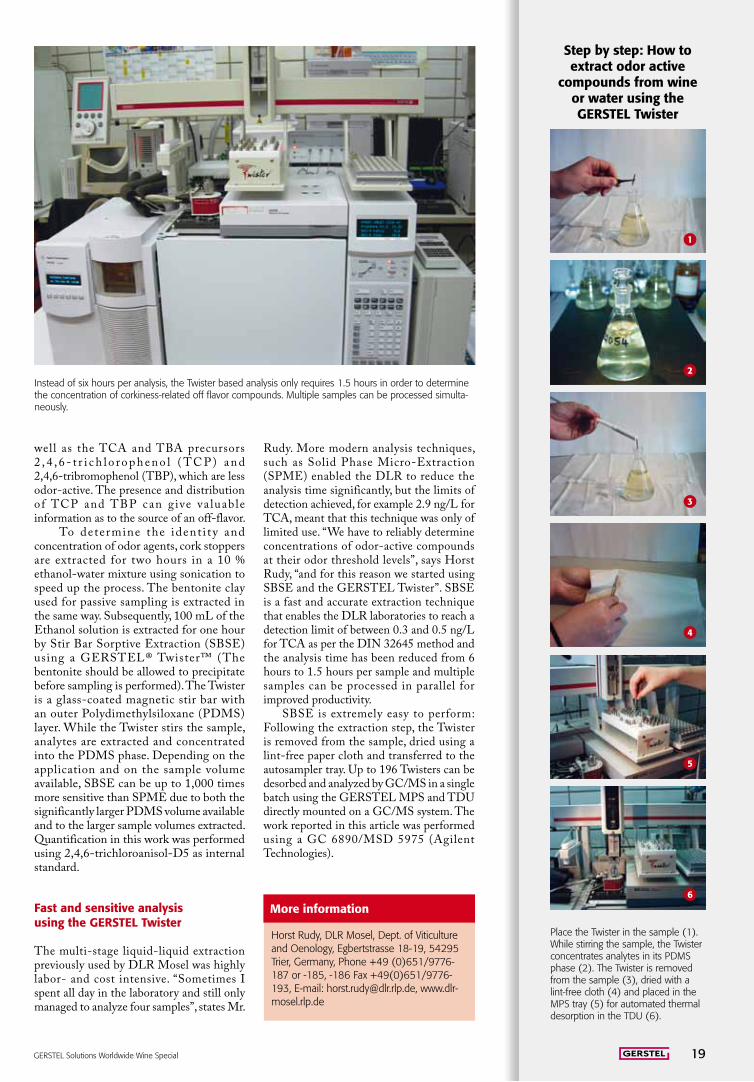
Instead of six hours per analysis, the Twister based analysis only requires 1.5 hours in order to determine the concentration of corkiness-related off flavor compounds. Multiple samples can be processed simulta-neously.
well as the TCA and TBA precursors 2 , 4 , 6 - t r i c h l o ro p h e n o l ( TC P ) a n d 2,4,6-tribromophenol (TBP), which are less odor-active. The presence and distribution of TCP and TBP can g ive va luable information as to the source of an off-flavor. To determine the identi ty and concentration of odor agents, cork stoppers are extracted for two hours in a 10 % ethanol-water mixture using sonication to speed up the process. The bentonite clay used for passive sampling is extracted in the same way. Subsequently, 100 mL of the Ethanol solution is extracted for one hour by Stir Bar Sorptive Extraction (SBSE) using a GERSTEL® Twister™ (The bentonite should be allowed to precipitate before sampling is performed). The Twister is a glass-coated magnetic stir bar with an outer Polydimethylsiloxane (PDMS) layer. While the Twister stirs the sample, analytes are extracted and concentrated into the PDMS phase. Depending on the application and on the sample volume available, SBSE can be up to 1,000 times more sensitive than SPME due to both the significantly larger PDMS volume available and to the larger sample volumes extracted. Quantification in this work was performed using 2,4,6-trichloroanisol-D5 as internal standard.
Fast and sensitive analysis using the GERSTEL Twister
The multi-stage liquid-liquid extraction previously used by DLR Mosel was highly labor- and cost intensive. “Sometimes I spent all day in the laboratory and still only managed to analyze four samples”, states Mr.
Rudy. More modern analysis techniques, such as Solid Phase Micro-Extraction (SPME) enabled the DLR to reduce the analysis time significantly, but the limits of detection achieved, for example 2.9 ng/L for TCA, meant that this technique was only of limited use. “We have to reliably determine concentrations of odor-active compounds at their odor threshold levels”, says Horst Rudy, “and for this reason we started using SBSE and the GERSTEL Twister”. SBSE is a fast and accurate extraction technique that enables the DLR laboratories to reach a detection limit of between 0.3 and 0.5 ng/L for TCA as per the DIN 32645 method and the analysis time has been reduced from 6 hours to 1.5 hours per sample and multiple samples can be processed in parallel for improved productivity.
SBSE is extremely easy to perform: Following the extraction step, the Twister is removed from the sample, dried using a lint-free paper cloth and transferred to the autosampler tray. Up to 196 Twisters can be desorbed and analyzed by GC/MS in a single batch using the GERSTEL MPS and TDU directly mounted on a GC/MS system. The work reported in this article was performed using a GC 6890/MSD 5975 (Agilent Technologies).
Place the Twister in the sample (1). While stirring the sample, the Twister concentrates analytes in its PDMS phase (2). The Twister is removed from the sample (3), dried with a lint-free cloth (4) and placed in the MPS tray (5) for automated thermal desorption in the TDU (6).
1
2
3
4
5
6
More information
Horst Rudy, DLR Mosel, Dept. of Viticulture and Oenology, Egbertstrasse 18-19, 54295 Trier, Germany, Phone +49 (0)651/9776-187 or -185, -186 Fax +49(0)651/9776-193, E-mail: [email protected], www.dlr-mosel.rlp.de
GERSTEL Solutions Worldwide Wine Special 19
The flavor of a wine is heavily influenced by sulfur-containing compounds, which, among other things, give wine the flavor typical of the grape variety used. At the same time, sulfur containing compounds are responsible for some wine flaws or wine defects that are commonly referred to as reductive notes. To determine the presence and quantity of sulfur-containing compounds for the purpose of quality control, wine experts at the Geisenheim Research Center rely on Headspace Gas Chromatography
(HS-GC) combined with pulsed flame photometric detection (PFPD).
Off flavors in wine part II: Sulfur related flavors – reductive notes
Watch your sulfurs!
Sulfur is widely used in the wine industry. More precisely, sulfur dioxide (SO2) is
used as a preservative and disinfectant since it reacts with oxygen to prevent oxidation reactions that could have undesirable effects on the flavor and color of the wine. In addition, SO2 inhibits growth of bacteria and wild yeasts, resulting in faster and cleaner fermentation during which important sulfur-containing compounds are formed, albeit in significantly reduced amounts. Volatile sulfur-containing compounds, especially thiols (R-SH), are highly odor-active compounds that lend characteristic notes to many foods. Among these are onion, garlic, leek, cabbage, asparagus, tropical fruits (such as maracuja and pineapple), grape fruit, black currant, gooseberries as well as cooked or fried meat, cheese, and coffee.
Thanks to new extraction and enrichment techniques and more selective and sensitive analysis techniques, a wide range of sulfur containing compounds have also been determined in wine in recent years. Some of these contribute significantly to the typical flavor of grape varieties. 4-Mercapto-4-methylpentan-2-on (4-MMP), for example, is a key compound in Sauvignon Blanc flavor [2]. Thiols, formerly known as mercaptans, are often blessed with an extremely low odor threshold. Concentrations in the microgram or even nanogram per liter range can be sufficient to cause a noticeable and decisive
off-flavor. Sulfides in particular cause off-flavors that often lead to rejection of the wine in the quality control phase [5, 6].
Sulfur-containing compounds cause wine faults
Until only a few decades ago, the off-flavor often described as “rotten eggs” was thought to be caused by a too high concentration of hydrogen sulfide (H2S). In the meantime a plethora of compounds have been found that can cause or contribute to this off-flavor. The flavor notes of individual sulfur compounds, as well as their respective concentrations, are decisive factors in the final sensory impression and in the olfactory intensity of the flavor profile. To describe a reductive note, descriptors such as reductive, stuffy, unclean, bacony, or cheesy are used. Consumers tend to associate faulty wines with overly ripe tropical fruit, black currant, burnt rubber, bread crust, yeast extract, or a dull moldy smell. The descriptor reductive has gained acceptance internationally even for less intensive sulfur caused off-flavors. Growing the vines under conditions that reduce the amount of oxygen taken up by the plants can help reduce oxidation of those thiols typical of the grape variety helping to stabilize the levels of off odor causing compounds such as H2S,
methanethiol and ethanethiol, which give the wine a cheesy or burnt rubber note. Often the presence of just minute amounts of volatile sulfur compounds will mask characteristic notes or fruity notes of a wine making it appear dull and less expressive of its type.
How a wine arrives at its (off-)flavor…
Apart from chemical, photochemical and thermally induced reactions during preparation and storage of wine, a multitude of enzymatic reactions take place, which could cause a reductive note. Research has shown that especially the nitrogen and sulfur metabolism of yeast has great impact on the formation of sulfur containing flavor compounds. Sulfate, naturally present in grape juice, is taken up by the yeast and reduced to sulfide. Reduced Sulfur (S2-) is used by the yeast to synthesize sulfur-containing amino acids e.g. methionine and cysteine as well as peptides and proteins used to form enzymes. To synthesize sulfur containing amino acids, the yeast must not only reduce the sulfate, it must also take up nitrogen in the form of ammonia or amino acids as well as sugar used as an energy source. If there is a nitrogen deficiency, the sulfide formed in the yeast cannot be converted to sulfur-containing amino acids since the required building blocks
20 GERSTEL Solutions Worldwide Wine Special
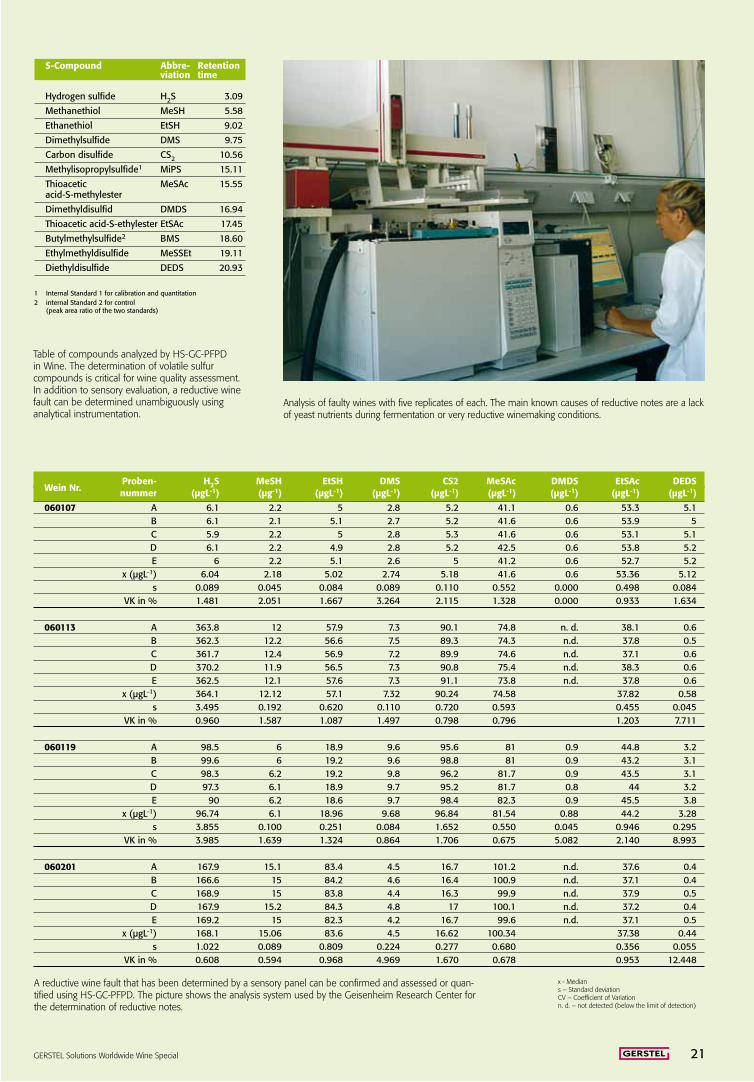
Proben- H2S MeSH EtSH DMS CS2 MeSAc DMDS EtSAc DEDSWein Nr. nummer (μgL-1) (μg-1) (μgL-1) (μgL-1) (μgL-1) (μgL-1) (μgL-1) (μgL-1) (μgL-1)
060107 A 6.1 2.2 5 2.8 5.2 41.1 0.6 53.3 5.1 B 6.1 2.1 5.1 2.7 5.2 41.6 0.6 53.9 5 C 5.9 2.2 5 2.8 5.3 41.6 0.6 53.1 5.1 D 6.1 2.2 4.9 2.8 5.2 42.5 0.6 53.8 5.2 E 6 2.2 5.1 2.6 5 41.2 0.6 52.7 5.2 x (μgL-1) 6.04 2.18 5.02 2.74 5.18 41.6 0.6 53.36 5.12 s 0.089 0.045 0.084 0.089 0.110 0.552 0.000 0.498 0.084 VK in % 1.481 2.051 1.667 3.264 2.115 1.328 0.000 0.933 1.634
060113 A 363.8 12 57.9 7.3 90.1 74.8 n. d. 38.1 0.6 B 362.3 12.2 56.6 7.5 89.3 74.3 n.d. 37.8 0.5 C 361.7 12.4 56.9 7.2 89.9 74.6 n.d. 37.1 0.6 D 370.2 11.9 56.5 7.3 90.8 75.4 n.d. 38.3 0.6 E 362.5 12.1 57.6 7.3 91.1 73.8 n.d. 37.8 0.6 x (μgL-1) 364.1 12.12 57.1 7.32 90.24 74.58 37.82 0.58 s 3.495 0.192 0.620 0.110 0.720 0.593 0.455 0.045 VK in % 0.960 1.587 1.087 1.497 0.798 0.796 1.203 7.711
060119 A 98.5 6 18.9 9.6 95.6 81 0.9 44.8 3.2 B 99.6 6 19.2 9.6 98.8 81 0.9 43.2 3.1 C 98.3 6.2 19.2 9.8 96.2 81.7 0.9 43.5 3.1 D 97.3 6.1 18.9 9.7 95.2 81.7 0.8 44 3.2 E 90 6.2 18.6 9.7 98.4 82.3 0.9 45.5 3.8 x (μgL-1) 96.74 6.1 18.96 9.68 96.84 81.54 0.88 44.2 3.28 s 3.855 0.100 0.251 0.084 1.652 0.550 0.045 0.946 0.295 VK in % 3.985 1.639 1.324 0.864 1.706 0.675 5.082 2.140 8.993
060201 A 167.9 15.1 83.4 4.5 16.7 101.2 n.d. 37.6 0.4 B 166.6 15 84.2 4.6 16.4 100.9 n.d. 37.1 0.4 C 168.9 15 83.8 4.4 16.3 99.9 n.d. 37.9 0.5 D 167.9 15.2 84.3 4.8 17 100.1 n.d. 37.2 0.4 E 169.2 15 82.3 4.2 16.7 99.6 n.d. 37.1 0.5 x (μgL-1) 168.1 15.06 83.6 4.5 16.62 100.34 37.38 0.44 s 1.022 0.089 0.809 0.224 0.277 0.680 0.356 0.055 VK in % 0.608 0.594 0.968 4.969 1.670 0.678 0.953 12.448
A reductive wine fault that has been determined by a sensory panel can be confirmed and assessed or quan-tified using HS-GC-PFPD. The picture shows the analysis system used by the Geisenheim Research Center for the determination of reductive notes.
Table of compounds analyzed by HS-GC-PFPD in Wine. The determination of volatile sulfur compounds is critical for wine quality assessment. In addition to sensory evaluation, a reductive wine fault can be determined unambiguously using analytical instrumentation.
S-Compound Abbre- Retention viation time
Hydrogen sulfide H2S 3.09
Methanethiol MeSH 5.58
Ethanethiol EtSH 9.02
Dimethylsulfide DMS 9.75
Carbon disulfide CS2 10.56
Methylisopropylsulfide1 MiPS 15.11
Thioacetic MeSAc 15.55acid-S-methylester
Dimethyldisulfid DMDS 16.94
Thioacetic acid-S-ethylester EtSAc 17.45
Butylmethylsulfide2 BMS 18.60
Ethylmethyldisulfide MeSSEt 19.11
Diethyldisulfide DEDS 20.93
1 Internal Standard 1 for calibration and quantitation 2 internal Standard 2 for control (peak area ratio of the two standards)
Analysis of faulty wines with five replicates of each. The main known causes of reductive notes are a lack of yeast nutrients during fermentation or very reductive winemaking conditions.
x - Medians – Standard deviationCV – Coefficient of Variation n. d. – not detected (below the limit of detection)
GERSTEL Solutions Worldwide Wine Special 21

are not available in sufficient quantities [1]. Under normal conditions, the yeast forms only as much sulfide as is needed. If there is a nutrient deficiency, however, the sulfide synthesis cannot be fully controlled and excess sulfides are formed, which are partly released into the wine as hydrogen sulfide, and partly reacted to form highly odor active compounds such as methanethiol, ethanethiol and their oxidation products dimethyldisulfide and diethyldisulfide. An elevated level of hydrogen sulfide also leads to enhanced synthesis of thioacetic acid esters, most notably thioacetic acid-S-methylester and thioacetic acid-S-ethylester. Both these compounds have odor thresholds in wine above 40 µg/ L, which means that they only contribute to wine faults at significantly enhanced levels. During storage and maturation of the wine, hydrolysis of thioacetic acid esters and other fermentation esters takes place until a chemical equilibrium has been established. The rate and the degree to which hydrolysis takes place depends on the pH of the wine and the storage temperature. During hydrolysis, the very volatile and highly odor active compounds methanethiol and ethanethiol are released, both of which have an odor threshold around 1 to 2 µg/L. This means that the release of even the smallest amounts of thiols during bottling and storage can result in a reductive note or a wine fault [5, 6].
Quality Control based on HS-GC with PFPD Detection
In recent years, yeast problems and reductive notes have increasingly been experienced internationally. Stress-causing physiological impact on vines during the growth season was thought to be responsible for these effects, for example, caused by a lack of water and nitrogen. If nitrogen is not
Stacked view of chromatograms resulting from a wine with reductive note wine fault (top) and without (bottom trace).
Calibration curve for diethyldisulfide (DEDS).
Calibration curve for methanethiol (MeSH).
Five replicate chromatograms of a wine with reductive note wine fault.
Instrumental analysis doesn’t replace sensory evaluation, but it delivers facts that can be used for unambiguous assessment of wine quality.
Wine with faultNo.
Analysis A
Analysis B
Analysis C
Analysis D
Analysis E
MiPSinternal
standard
BMSinternal
standard
Wine with fault
Wine without fault
No.
No.
MiPSinternal
standard
MiPSinternal
standard
BMSinternal
standard
BMSinternal
standard
22 GERSTEL Solutions Worldwide Wine Special
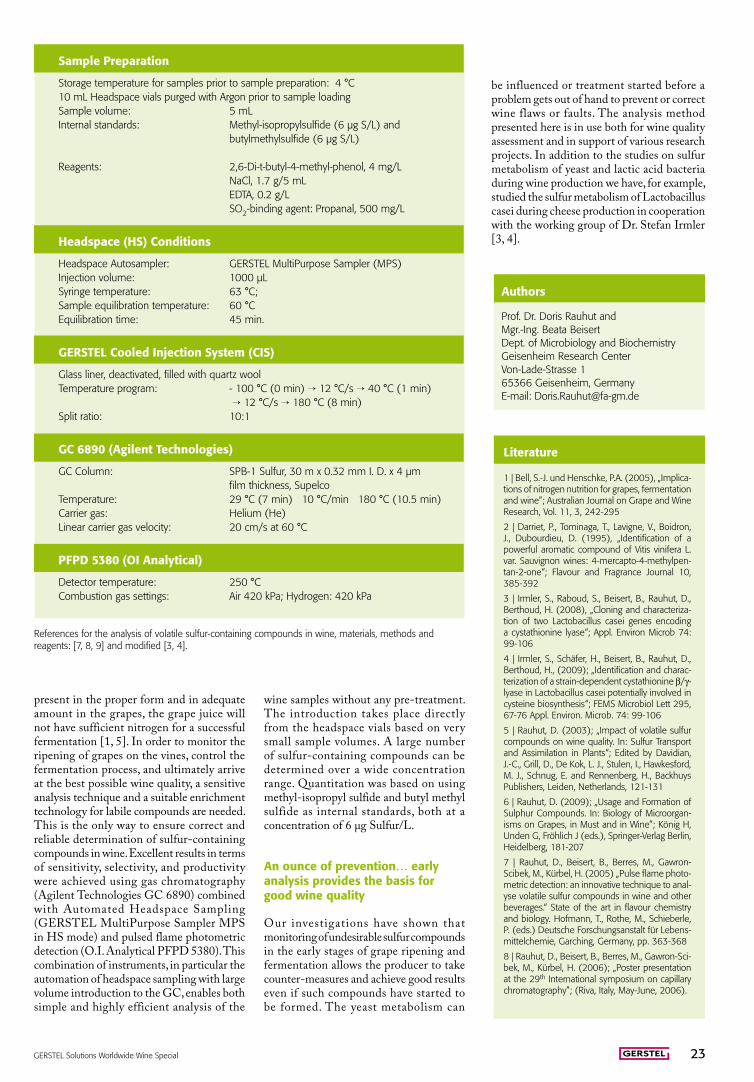
References for the analysis of volatile sulfur-containing compounds in wine, materials, methods and reagents: [7, 8, 9] and modified [3, 4].
present in the proper form and in adequate amount in the grapes, the grape juice will not have sufficient nitrogen for a successful fermentation [1, 5]. In order to monitor the ripening of grapes on the vines, control the fermentation process, and ultimately arrive at the best possible wine quality, a sensitive analysis technique and a suitable enrichment technology for labile compounds are needed. This is the only way to ensure correct and reliable determination of sulfur-containing compounds in wine. Excellent results in terms of sensitivity, selectivity, and productivity were achieved using gas chromatography (Agilent Technologies GC 6890) combined with Automated Headspace Sampling (GERSTEL MultiPurpose Sampler MPS in HS mode) and pulsed flame photometric detection (O.I. Analytical PFPD 5380). This combination of instruments, in particular the automation of headspace sampling with large volume introduction to the GC, enables both simple and highly efficient analysis of the
wine samples without any pre-treatment. The introduction takes place directly from the headspace vials based on very small sample volumes. A large number of sulfur-containing compounds can be determined over a wide concentration range. Quantitation was based on using methyl-isopropyl sulfide and butyl methyl sulfide as internal standards, both at a concentration of 6 µg Sulfur/L.
An ounce of prevention… early analysis provides the basis for good wine quality
Our investigations have shown that monitoring of undesirable sulfur compounds in the early stages of grape ripening and fermentation allows the producer to take counter-measures and achieve good results even if such compounds have started to be formed. The yeast metabolism can
be influenced or treatment started before a problem gets out of hand to prevent or correct wine flaws or faults. The analysis method presented here is in use both for wine quality assessment and in support of various research projects. In addition to the studies on sulfur metabolism of yeast and lactic acid bacteria during wine production we have, for example, studied the sulfur metabolism of Lactobacillus casei during cheese production in cooperation with the working group of Dr. Stefan Irmler [3, 4].
Sample Preparation
Storage temperature for samples prior to sample preparation: 4 °C 10 mL Headspace vials purged with Argon prior to sample loadingSample volume: 5 mLInternal standards: Methyl-isopropylsulfide (6 µg S/L) and
butylmethylsulfide (6 µg S/L)
Reagents: 2,6-Di-t-butyl-4-methyl-phenol, 4 mg/L NaCl, 1.7 g/5 mL EDTA, 0.2 g/L SO2-binding agent: Propanal, 500 mg/L
Headspace (HS) Conditions
Headspace Autosampler: GERSTEL MultiPurpose Sampler (MPS)Injection volume: 1000 µLSyringe temperature: 63 °C; Sample equilibration temperature: 60 °CEquilibration time: 45 min.
GERSTEL Cooled Injection System (CIS)
Glass liner, deactivated, filled with quartz wool Temperature program: - 100 °C (0 min) → 12 °C/s → 40 °C (1 min)
→ 12 °C/s → 180 °C (8 min)Split ratio: 10:1
GC 6890 (Agilent Technologies)
GC Column: SPB-1 Sulfur, 30 m x 0.32 mm I. D. x 4 µm film thickness, SupelcoTemperature: 29 °C (7 min) → 10 °C/min → 180 °C (10.5 min)Carrier gas: Helium (He)Linear carrier gas velocity: 20 cm/s at 60 °C
PFPD 5380 (OI Analytical)
Detector temperature: 250 °CCombustion gas settings: Air 420 kPa; Hydrogen: 420 kPa
Authors
Prof. Dr. Doris Rauhut andMgr.-Ing. Beata BeisertDept. of Microbiology and BiochemistryGeisenheim Research CenterVon-Lade-Strasse 165366 Geisenheim, GermanyE-mail: [email protected]
Literature
1 | Bell, S.-J. und Henschke, P.A. (2005), „Implica-tions of nitrogen nutrition for grapes, fermentation and wine”; Australian Journal on Grape and Wine Research, Vol. 11, 3, 242-295
2 | Darriet, P., Tominaga, T., Lavigne, V., Boidron, J., Dubourdieu, D. (1995), „Identification of a powerful aromatic compound of Vitis vinifera L. var. Sauvignon wines: 4-mercapto-4-methylpen-tan-2-one“; Flavour and Fragrance Journal 10, 385-392
3 | Irmler, S., Raboud, S., Beisert, B., Rauhut, D., Berthoud, H. (2008), „Cloning and characteriza-tion of two Lactobacillus casei genes encoding a cystathionine lyase“; Appl. Environ Microb 74: 99-106
4 | Irmler, S., Schäfer, H., Beisert, B., Rauhut, D., Berthoud, H., (2009); „Identification and charac-terization of a strain-dependent cystathionine b/g-lyase in Lactobacillus casei potentially involved in cysteine biosynthesis“; FEMS Microbiol Lett 295, 67-76 Appl. Environ. Microb. 74: 99-106
5 | Rauhut, D. (2003); „Impact of volatile sulfur compounds on wine quality. In: Sulfur Transport and Assimilation in Plants“; Edited by Davidian, J.-C., Grill, D., De Kok, L. J., Stulen, I., Hawkesford, M. J., Schnug, E. and Rennenberg, H., Backhuys Publishers, Leiden, Netherlands, 121-131
6 | Rauhut, D. (2009); „Usage and Formation of Sulphur Compounds. In: Biology of Microorgan-isms on Grapes, in Must and in Wine”; König H, Unden G, Fröhlich J (eds.), Springer-Verlag Berlin, Heidelberg, 181-207
7 | Rauhut, D., Beisert, B., Berres, M., Gawron-Scibek, M., Kürbel, H. (2005) „Pulse flame photo-metric detection: an innovative technique to anal-yse volatile sulfur compounds in wine and other beverages.“ State of the art in flavour chemistry and biology. Hofmann, T., Rothe, M., Schieberle, P. (eds.) Deutsche Forschungsanstalt für Lebens-mittelchemie, Garching, Germany, pp. 363-368
8 | Rauhut, D., Beisert, B., Berres, M., Gawron-Sci-bek, M., Kürbel, H. (2006); „Poster presentation at the 29th International symposium on capillary chromatography”; (Riva, Italy, May-June, 2006).
GERSTEL Solutions Worldwide Wine Special 23
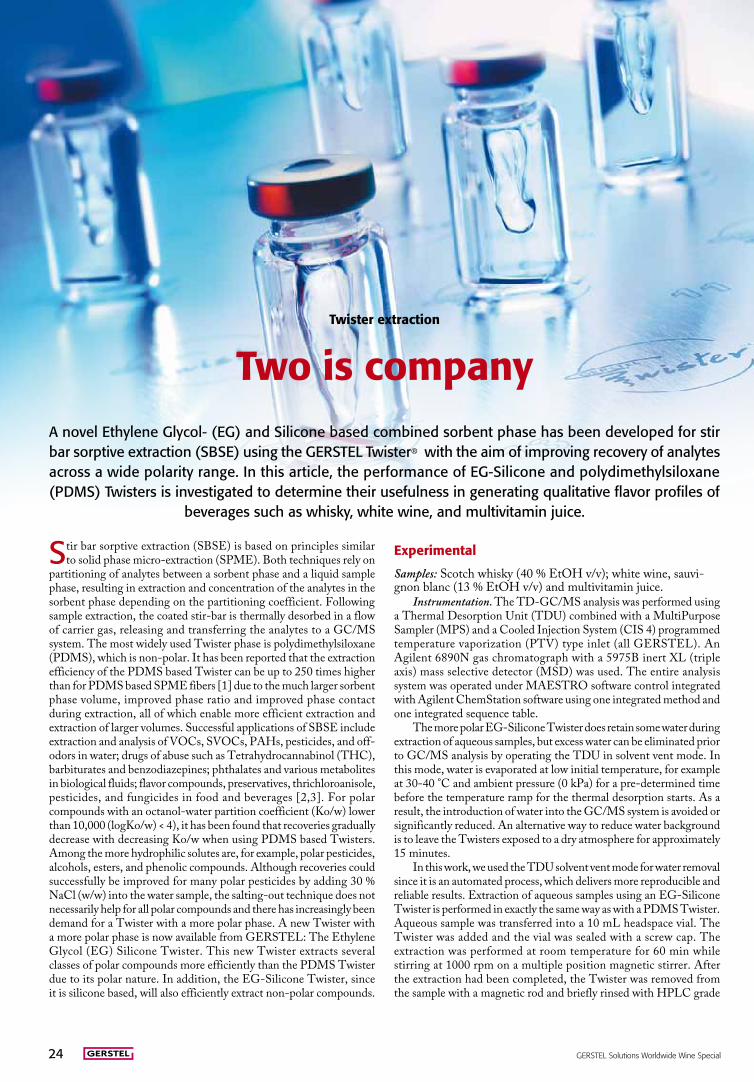
Twister extraction
Two is companyA novel Ethylene Glycol- (EG) and Silicone based combined sorbent phase has been developed for stir bar sorptive extraction (SBSE) using the GERSTEL Twister® with the aim of improving recovery of analytes across a wide polarity range. In this article, the performance of EG-Silicone and polydimethylsiloxane (PDMS) Twisters is investigated to determine their usefulness in generating qualitative flavor profiles of
beverages such as whisky, white wine, and multivitamin juice.
Stir bar sorptive extraction (SBSE) is based on principles similar to solid phase micro-extraction (SPME). Both techniques rely on
partitioning of analytes between a sorbent phase and a liquid sample phase, resulting in extraction and concentration of the analytes in the sorbent phase depending on the partitioning coefficient. Following sample extraction, the coated stir-bar is thermally desorbed in a flow of carrier gas, releasing and transferring the analytes to a GC/MS system. The most widely used Twister phase is polydimethylsiloxane (PDMS), which is non-polar. It has been reported that the extraction efficiency of the PDMS based Twister can be up to 250 times higher than for PDMS based SPME fibers [1] due to the much larger sorbent phase volume, improved phase ratio and improved phase contact during extraction, all of which enable more efficient extraction and extraction of larger volumes. Successful applications of SBSE include extraction and analysis of VOCs, SVOCs, PAHs, pesticides, and off-odors in water; drugs of abuse such as Tetrahydrocannabinol (THC), barbiturates and benzodiazepines; phthalates and various metabolites in biological fluids; flavor compounds, preservatives, thrichloroanisole, pesticides, and fungicides in food and beverages [2,3]. For polar compounds with an octanol-water partition coefficient (Ko/w) lower than 10,000 (logKo/w) < 4), it has been found that recoveries gradually decrease with decreasing Ko/w when using PDMS based Twisters. Among the more hydrophilic solutes are, for example, polar pesticides, alcohols, esters, and phenolic compounds. Although recoveries could successfully be improved for many polar pesticides by adding 30 % NaCl (w/w) into the water sample, the salting-out technique does not necessarily help for all polar compounds and there has increasingly been demand for a Twister with a more polar phase. A new Twister with a more polar phase is now available from GERSTEL: The Ethylene Glycol (EG) Silicone Twister. This new Twister extracts several classes of polar compounds more efficiently than the PDMS Twister due to its polar nature. In addition, the EG-Silicone Twister, since it is silicone based, will also efficiently extract non-polar compounds.
Experimental
Samples: Scotch whisky (40 % EtOH v/v); white wine, sauvi-gnon blanc (13 % EtOH v/v) and multivitamin juice.
Instrumentation. The TD-GC/MS analysis was performed using a Thermal Desorption Unit (TDU) combined with a MultiPurpose Sampler (MPS) and a Cooled Injection System (CIS 4) programmed temperature vaporization (PTV) type inlet (all GERSTEL). An Agilent 6890N gas chromatograph with a 5975B inert XL (triple axis) mass selective detector (MSD) was used. The entire analysis system was operated under MAESTRO software control integrated with Agilent ChemStation software using one integrated method and one integrated sequence table.
The more polar EG-Silicone Twister does retain some water during extraction of aqueous samples, but excess water can be eliminated prior to GC/MS analysis by operating the TDU in solvent vent mode. In this mode, water is evaporated at low initial temperature, for example at 30-40 °C and ambient pressure (0 kPa) for a pre-determined time before the temperature ramp for the thermal desorption starts. As a result, the introduction of water into the GC/MS system is avoided or significantly reduced. An alternative way to reduce water background is to leave the Twisters exposed to a dry atmosphere for approximately 15 minutes.
In this work, we used the TDU solvent vent mode for water removal since it is an automated process, which delivers more reproducible and reliable results. Extraction of aqueous samples using an EG-Silicone Twister is performed in exactly the same way as with a PDMS Twister. Aqueous sample was transferred into a 10 mL headspace vial. The Twister was added and the vial was sealed with a screw cap. The extraction was performed at room temperature for 60 min while stirring at 1000 rpm on a multiple position magnetic stirrer. After the extraction had been completed, the Twister was removed from the sample with a magnetic rod and briefly rinsed with HPLC grade
24 GERSTEL Solutions Worldwide Wine Special
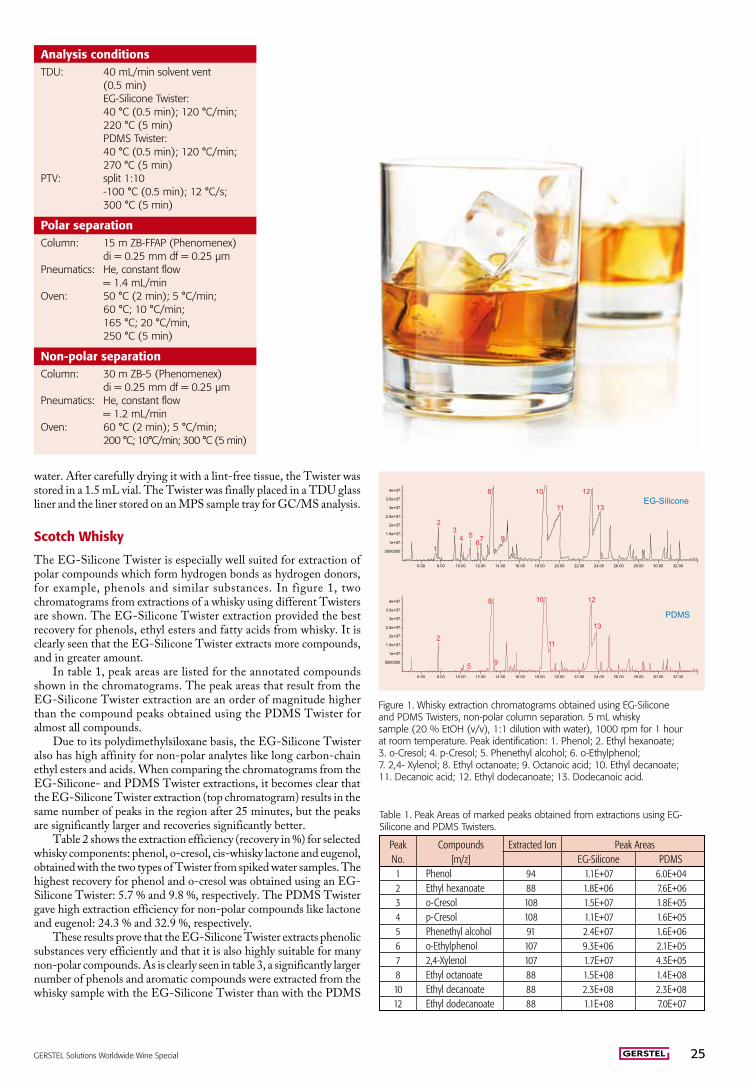
water. After carefully drying it with a lint-free tissue, the Twister was stored in a 1.5 mL vial. The Twister was finally placed in a TDU glass liner and the liner stored on an MPS sample tray for GC/MS analysis.
Scotch Whisky
The EG-Silicone Twister is especially well suited for extraction of polar compounds which form hydrogen bonds as hydrogen donors, for example, phenols and similar substances. In figure 1, two chromatograms from extractions of a whisky using different Twisters are shown. The EG-Silicone Twister extraction provided the best recovery for phenols, ethyl esters and fatty acids from whisky. It is clearly seen that the EG-Silicone Twister extracts more compounds, and in greater amount.
In table 1, peak areas are listed for the annotated compounds shown in the chromatograms. The peak areas that result from the EG-Silicone Twister extraction are an order of magnitude higher than the compound peaks obtained using the PDMS Twister for almost all compounds.
Due to its polydimethylsiloxane basis, the EG-Silicone Twister also has high affinity for non-polar analytes like long carbon-chain ethyl esters and acids. When comparing the chromatograms from the EG-Silicone- and PDMS Twister extractions, it becomes clear that the EG-Silicone Twister extraction (top chromatogram) results in the same number of peaks in the region after 25 minutes, but the peaks are significantly larger and recoveries significantly better.
Table 2 shows the extraction efficiency (recovery in %) for selected whisky components: phenol, o-cresol, cis-whisky lactone and eugenol, obtained with the two types of Twister from spiked water samples. The highest recovery for phenol and o-cresol was obtained using an EG-Silicone Twister: 5.7 % and 9.8 %, respectively. The PDMS Twister gave high extraction efficiency for non-polar compounds like lactone and eugenol: 24.3 % and 32.9 %, respectively.
These results prove that the EG-Silicone Twister extracts phenolic substances very efficiently and that it is also highly suitable for many non-polar compounds. As is clearly seen in table 3, a significantly larger number of phenols and aromatic compounds were extracted from the whisky sample with the EG-Silicone Twister than with the PDMS
Figure 1. Whisky extraction chromatograms obtained using EG-Silicone and PDMS Twisters, non-polar column separation. 5 mL whisky sample (20 % EtOH (v/v), 1:1 dilution with water), 1000 rpm for 1 hour at room temperature. Peak identification: 1. Phenol; 2. Ethyl hexanoate; 3. o-Cresol; 4. p-Cresol; 5. Phenethyl alcohol; 6. o-Ethylphenol; 7. 2,4- Xylenol; 8. Ethyl octanoate; 9. Octanoic acid; 10. Ethyl decanoate; 11. Decanoic acid; 12. Ethyl dodecanoate; 13. Dodecanoic acid.
Table 1. Peak Areas of marked peaks obtained from extractions using EG-Silicone and PDMS Twisters.
Peak Compounds Extracted Ion Peak Areas No. [m/z] EG-Silicone PDMS 1 Phenol 94 1.1E+07 6.0E+04 2 Ethyl hexanoate 88 1.8E+06 7.6E+06 3 o-Cresol 108 1.5E+07 1.8E+05 4 p-Cresol 108 1.1E+07 1.6E+05 5 Phenethyl alcohol 91 2.4E+07 1.6E+06 6 o-Ethylphenol 107 9.3E+06 2.1E+05 7 2,4-Xylenol 107 1.7E+07 4.3E+05 8 Ethyl octanoate 88 1.5E+08 1.4E+08 10 Ethyl decanoate 88 2.3E+08 2.3E+08 12 Ethyl dodecanoate 88 1.1E+08 7.0E+07
Analysis conditionsTDU: 40 mL/min solvent vent (0.5 min) EG-Silicone Twister: 40 °C (0.5 min); 120 °C/min; 220 °C (5 min) PDMS Twister: 40 °C (0.5 min); 120 °C/min; 270 °C (5 min)PTV: split 1:10 -100 °C (0.5 min); 12 °C/s; 300 °C (5 min)
Polar separationColumn: 15 m ZB-FFAP (Phenomenex) di = 0.25 mm df = 0.25 µmPneumatics: He, constant flow = 1.4 mL/minOven: 50 °C (2 min); 5 °C/min; 60 °C; 10 °C/min; 165 °C; 20 °C/min, 250 °C (5 min)
Non-polar separationColumn: 30 m ZB-5 (Phenomenex) di = 0.25 mm df = 0.25 µmPneumatics: He, constant flow = 1.2 mL/minOven: 60 °C (2 min); 5 °C/min; 200 °C; 10°C/min; 300 °C (5 min)
GERSTEL Solutions Worldwide Wine Special 25
Twister. The total number of extracted compounds is 126 for the EG-Silicone Twister and 92 for the PDMS Twister. For the other compounds classes, both Twisters extract a similar number of compounds, but the EG-Silicone Twister generally gives better recovery.
In order to achieve better separation of polar compounds f rom the wh i sky s amp le , a Z B - F F A P c o l u m n w a s subsequently used. The resulting chromatogram is shown in figure 2, the whisky profile was obtained based on extraction with an EG-Silicone Twister. Table 4 l ists the proposed compound names identified with the mass spectral database (Wiley 6N). All identified peaks have a hit quality higher than 80.
The plausibi l i ty of the identification was checked against literature to ensure that the reported compounds were known to be present in whisky. Using the polar column, the
peaks for acids, phenols and other polar compounds show a better peak shape. Many important whisky compounds (vanillin, ethyl vanillate, etc.), which were covered by broad co-eluting acid peaks when using the ZB-5 non-polar column, were now well separated and could easily be identified.
Multivitamin Juice
Extraction of multivitamin juice or of other fruit juices is often negatively influenced by fruit pulp, which blocks analyte access to the extraction phase and/or hinders phase separation following the extraction. In contrast, the presence of fruit pulp has no effect on the SBSE extraction process for multivitamin juice. A 10 mL sample was directly dispensed into a 10 mL vial, the Twister was added and the sample stirred for 1 hour at 1000 rpm. Both EG-Silicone- and PDMS Twisters were used for the extraction.
As can be seen in the chromatograms in figure 3, the EG-Silicone Twister extracts more compounds than the PDMS Twister and with better recovery. The peaks obtained using the EG-Silicone Twister are significantly larger. In the chromatogram obtained with EG-Silicone Twister, 39 peaks were clearly identified. Nine compounds were not at all found or identified using the PDMS Twister: formic acid, acetic acid, furfural, furfural alcohol, 2-hydroxycyclopent-2-enone, 3-methyl-2,5-furandione, 5-methyl-2-furfural, 2,3-dihydro-3,5-dihydroxy-6-methyl-4H-pyran-4-one and Hydroxymethylfurfurole (HMF). Most of these compounds are furfurals and derivatives of furan. Moreover, the peaks for these nine compounds were very large using EG-Silicone Twister extraction, for example furfural (No. 3) and HMF (No. 21). Some important terpenes in the multivitamin juice were extracted by both Twisters, these are listed in table 6. Eight terpenes were selected and their peaks integrated based on extracted ion chromatograms (EICs). The EIC masses used and the resulting peak areas are also listed in table 6. It can be seen that EG-Silicone- and PDMS Twisters have similar extraction efficies for the terpenes judging by the very similar peak areas obtained using the
Peak Proposed Peak Proposed Peak Proposed No. Identity No. Identity No. Identity 1 Ethyl octanoate 9 trans Whisky lactone 17 Capric acid 2 Ethyl nonanoate 10 o-Cresol 18 Farnesol 3 Ethyl decanoate 11 p-Ethylguaiacol 19 Lauric acid 4 1-Decanol 12 d-Nerolidol 20 Vanillin 5 Phenethyl acetate 13 Octanoic acid 21 Ethyl vanillate 6 Ethyl dodecanoate 14 o-Ethylphenol 22 Myristic acid 7 Guaiacol 15 2,4-Xylenol 8 Phenethyl alcohol 16 p-Ethylphenol
Table 4. Tentatively identified compounds found in Scotch whisky by Twister extraction and GC/MS analysis using a ZB-FFAP Column.
Table2. Recovery in % for selected whisky standard substances obtained with the EG-Silicone and PDMS Twisters.
Whisky Log EG- PDMS standards Ko/w Silicone Phenol 1.46 5.7 3.0 o-Cresol 1.95 9.8 1.5 cis-Whisky 2.00 6.1 24.3 lactone Eugenol 2.27 29.5 32.9
Table 3. Whisky compounds extracted by SBSE using the PDMS and EG-Silicone Twister respectively.
Compound class PDMS EG- Silicone Phenols and aromatic compounds 14 40 Fusel alcohols 10 10 Fatty acids 11 11 Aliphatic acid ethyl esters 15 15 Other esters 22 22 Lactones 1 2 Acrolein derivates 7 7 Terpenes and norisoprenoids 6 7 Miscellaneous 6 12
Total 92 126
Figure 2. SBSE-TD-GC/MS chromatogram, polar column separation, resulting from an EG-Silicone Twister extraction of a 5 mL whisky sample diluted 1:1 with water (20 % EtOH v/v). Sample extracted for one hour at room tempera-ture and 1000 rpm.
two Twisters. For more polar alcohol-terpenes linalool, 4-terpineol, alpha-terpineol, and nerolidol, the EG-Silicone Twister does provide better recovery than the PDMS Twister; conversely, for monoterpenes like alpha-pinene, beta-myrcene, delta-3-carene and d-limonene the PDMS Twister gives better recovery.
White Wine (Sauvignon Blanc)
EG-Silicone- and PDMS Twisters were used to extract a broad range of volatile compounds and generate a flavor profile of a white wine. Subsequently, the extraction results for the two Twister types were compared. PDMS Twisters can be added directly to the wine sample without modifying the sample. Prior to extraction with EG-Silicone Twister, the wine sample needed to be neutralized to pH 3.6 in order to avoid break-down of the Twister phase. Chromatograms were obtained using both ZB-5 (non-polar) and ZB-FFAP (polar) columns, the tentatively identified wine compounds are listed in Table 7. Except for the oven programs and column flow rates used, all conditions for TDU, CIS, and MSD were the same for all analyses performed.
A stacked view comparison of chromatograms from extractions using different Twisters is shown in figure 4. It can be seen that the EG-
26 GERSTEL Solutions Worldwide Wine Special
Table 6. Peak area responses of Terpenes resulting from Twister extractions.
Peak No. Compounds Extracted Ion Peak Areas [m/z] EG-Silicone PDMS 7 alpha-Pinene 93 1.7E+05 3.9E+05 10 beta-Myrcene 93 1.4E+06 2.6E+06 11 delta-3-Carene 93 2.8E+06 4.7E+06 12 D-Limonene 68 1.3E+07 1.8E+07 16 Linalool 71 1.5E+06 4.3E+05 19 4-Terpineol 71 4.3E+05 2.7E+05 20 alpha-Terpineol 59 1.5E+06 4.3E+05 27 Nerolidol 69 5.2E+05 4.8E+05
Figure 3. Multivitamin juice chromatogram obtained from EG-Silicone- and PDMS Twisters, non-polar column separation. 10 mL sample, 1000 rpm, 1 hour, room temperature.
Table 5. Identified compounds found in multivitamin juice by Twister extraction and GC/MS analysis using a ZB-5 Column.
Silicone Twister extracts a larger number of individual substances (30 tentatively identified peaks) from wine than the PDMS Twister. Substances like furfural, cis- and trans-4-hydroxymethyl-2-methyl-1,3-dioxolane, glycerin, malic acid, methyl 2,3-dihydroxybenzoate are only found in the EG-Silicone Twister based chromatograms. The EG-Silicone Twister extracts acids much more efficiently from wine than the PDMS Twister, see peaks No. 11, 17, 21, 22, and 24 as well as alcohols like 2,3-butanediol (No. 3), 1-hexanol (No. 6), and Phenethyl alcohol (No.15).
PDMS Twisters, conversely, extract larger amounts of esters compared to EG-Silicone Twister (see No. 4, 7, 12, 13, 18, 25). To achieve better resolution and separation of polar compounds extracted from the wine, a polar column was also used. As can be seen in figure 5, the polar column produced sharp acid peaks and enabled the separation of several key polar compounds that were covered by big co-eluting ester peaks in the chromatogram produced on the non-polar column. Although a different column was used, the quantitative results and determined compound identities obtained from EG-Silicone- and PDMS Twister extractions were in good agreement. Some polar acids,
alcohols, as well as other polar compounds could be extracted only using the EG-Silicone Twister. Additionally, 5-methyl-2-furfural (No. 11) and Hydroxymethylfurfurole (HMF) (No. 24 ), p-Hydroxyphenethyl alcohol (No. 27) and ethyl 3-(4-hydroxyphenyl)-propenoate (Z or E) (No. 29) were found only when combining EG-Silicone Twister extraction with separation on a polar column (Table 8).
Figure 4. Sauvignon Blanc chromatogram profiles obtained from EG-Silicone- and PDMS Twister extractions of 5 mL samples for one hour at 1000 rpm, non-polar column separation.
Peak Proposed Identity Peak Proposed Identity Peak Proposed Identity No. No. No. 1 Formic acid 14 gamma-Terpinene 27 Nerolidol 2 Acetic acid 15 alpha-Terpinolene 28 Methoxyeugenol 3 Furfural 16 Linalool 29 alpha-Cubebene 4 Furfural alcohol 17 Apple oil 30 Myristic acid 5 Isoamyl acetate 18 2,3-Dihydro-3,5- 31 Nootkatone dihydroxy-6-methyl- 4H-pyran-4-one 6 2-Hydroxycyclopent- 19 4-Terpineol 32 8-Hydroxy-6- 2-en-one methoxy 7 alpha-Pinene 20 alpha-Terpineol 33 9-Hexadecenoic acid 8 3-Methyl-2,5- 21 Hydroxymethyl- 34 Palmitic acid Furandione furfurole (HMF) 9 5-Methyl-2-furfural 22 Eugenol 35 Limetin 10 beta-Myrcene 23 trans-Caryophyllene 36 Xanthotoxin 11 delta-3-Carene 24 alpha-Humulene 37 Linoleic acid 12 D-Limonene 25 Valencene 38 Isopimpinellin 13 Isoamylbutyrate 26 Elemicin 39 Squalene
GERSTEL Solutions Worldwide Wine Special 27

Authors
Yunyun Nie, Eike Kleine-Benne GERSTEL GmbH & Co. KG, Eberhard-Gerstel-Platz 1, D-45473 Mülheim an der Ruhr, Germany
Figure 5. Sauvignon blanc chromatogram profiles obtained from EG-Silicone- and PDMS Twister extractions of 5 mL samples for one hour at 1000 rpm, polar column separation.
References
1. Frank David, Bart Tienpont,Pat Sandra, Stir-bar sorptive extraction of trace organic compounds from aqueous matrices, LCGC North America, 21: 21-27 (2003)2. Kevin Mac Namara, Michelle Lee, Albert Robbat Jr., J.Chromatogr. A 1217 (2010) 1363. Kevin Mac Namara, Dagamara Dabrowska, Meike Baden, Norbert Helle, LC/GC Chromatography, Sep. 2011
Table 8. Tentatively identified compounds extracted from white wine using different Twisters and separated on a ZB-FFAP Column.
Table 7. Tentatively identified compounds extracted from white wine using different Twisters and separated on a ZB-5 GC Column.
Peak Proposed Identity Peak Proposed Identity Peak Proposed Identity No. No. No. 1 2-Methyl-butanol 11 Hexanoic acid 21 Nonanoic acid 2 3-Methyl-butanol 12 Ethyl hexanoate 22 Malic acid 3 2,3-Butanediol 13 1-Hexyl acetate 23 Methyl 2,3-dihydroxy- 4 Ethyl butanoate 14 Glycerine 24 Capric acid 5 Furfural 15 Phenethyl alcohol 25 Ethyl decanoate 6 1-Hexanol 16 2,3-Dihydro-3,5- 26 p-Hydroxyphenethyl dihydroxy-6-methyl- alcohol 4H-pyran-4-one 7 Isoamyl acetate 17 Octanoic acid 27 2,4-Di-tert-butylphenol 8 trans-4-Hydroxymethyl- 18 Ethyl octanoate 28 Methyl 2,5-dihydroxy 2-methyl-1,3-dioxolane benzoate 9 cis-4-Hydroxymethyl- 19 Phenethyl acetate 29 Lauric acid 2-methyl-1,3-dioxolane 10 Citraconic anhydride 20 Ethyl dl-malate 30 Ethyl laurate
Acknowledgment
The authors would like to thank Dr. Kevin MacNamara, Irish Distillers, Pernod-Ricard for his kind support.
Further information
www.gerstel.com - Applications: AppNote 3/2011 (www.gerstel.com/pdf/p-gc-an-2011-03.pdf)
CONCLUSION
The novel EG-Silicone Twister presented in this work enables higher ex-traction efficiency than the traditional PDMS Twister for polar com-pounds in samples like whisky, multivitamin juice and white wine. For compounds like
phenols, furans, alco-hols, and acids, use of
EG-Silicone Twister re-sults in the best extraction efficiency. For non-polar compounds such as ter-penes and ethyl esters etc., EG-Silicone Twisters, due to their dimethylsiloxane
base, provide extraction efficiencies similar to those achieved using PDMS Twisters. By using both the EG-Silicone- and the PDMS Twister in a sequential SBSE process, an overall analyte profile of non-polar and polar organic compounds in a sample can be obtained. The pH value of the sample is a critical point for the EG-Silicone Twister. In water-based standards, the optimum pH range was found to be from 3.5 to 10.0, for wine samples from 3.6 to 7.0. Like the PDMS Twister, the extraction using the EG-Silicone Twister is easy to perform. Only a few instrumental parameters have to be adjusted. Additionally, operating the TDU in solvent vent mode is important when desorbing EG-Silicone Twisters in order to remove excess water that is retained due to its polar nature. This is needed in order to eliminate water from the GC/MS system.
Peak Proposed Identity Peak Proposed Identity Peak Proposed Identity No. No. No. 1 1-Hexyl acetate 11 5-Methyl-2-furfural 21 Glycerine 2 1-Hexanol 12 Phenethyl acetate 22 2,3-Dihydrobenzofuran 3 Ethyl octanoate 13 Hexanoic acid 23 Lauric acid 4 Acetic acid 14 Phenethyl alcohol 24 Hydroxymethyl- furfurole (HMF) 5 Furfural 15 Ethyl dl-malate 25 Malic acid 6 trans-4-Hydroxy- 16 Octanoic acid 26 Myristic acid methyl-2-methyl- 1,3-dioxolane 7 2,3-Butanediol 17 Nonanoic acid 27 p-Hydroxyphenethyl alcohol 8 Ethyl decanoate 18 2,3-Dihydro-3,5- 28 Palmitic acid dihydroxy-6-methyl- 4H-pyran-4-one 9 cis-4-Hydroxymethyl- 19 Decanoic acid 29 Ethyl 3-(4-hydroxy 2-methyl-1,3-dioxolane phenyl)-propenoate (Z or E) 10 Clorius 20 2,4-Di-tert-butylphenol
28 GERSTEL Solutions Worldwide Wine Special
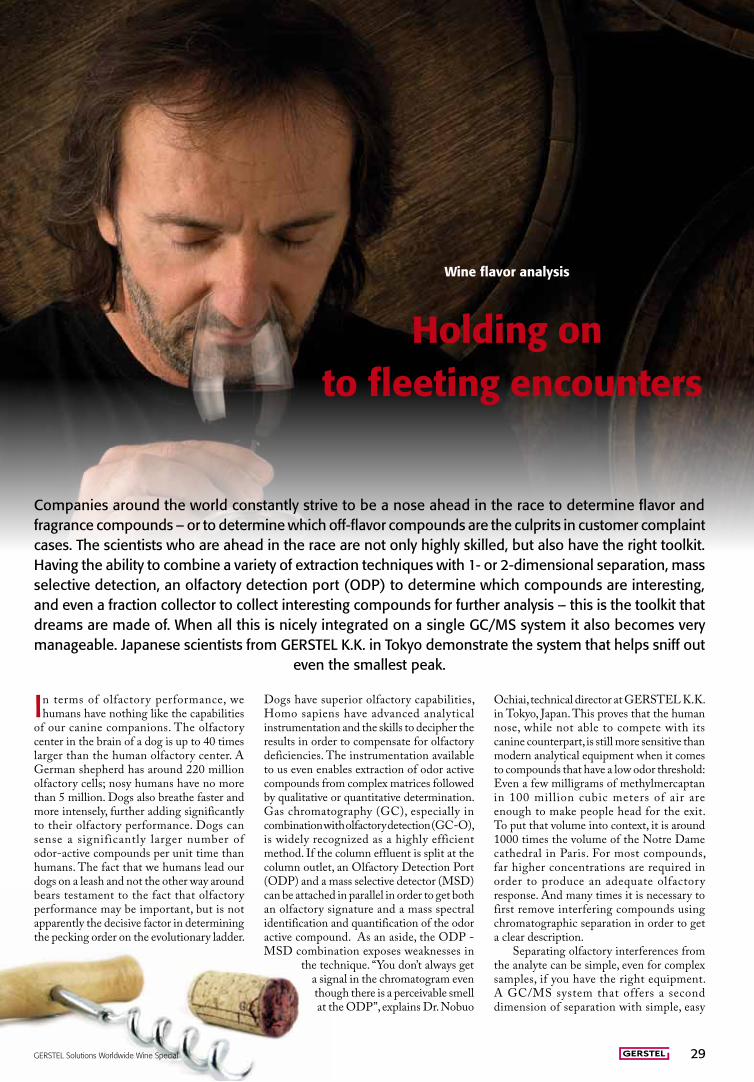
In terms of olfactory performance, we humans have nothing like the capabilities
of our canine companions. The olfactory center in the brain of a dog is up to 40 times larger than the human olfactory center. A German shepherd has around 220 million olfactory cells; nosy humans have no more than 5 million. Dogs also breathe faster and more intensely, further adding significantly to their olfactory performance. Dogs can sense a significantly larger number of odor-active compounds per unit time than humans. The fact that we humans lead our dogs on a leash and not the other way around bears testament to the fact that olfactory performance may be important, but is not apparently the decisive factor in determining the pecking order on the evolutionary ladder.
Wine flavor analysis
Holding on to fleeting encounters
Companies around the world constantly strive to be a nose ahead in the race to determine flavor and fragrance compounds – or to determine which off-flavor compounds are the culprits in customer complaint cases. The scientists who are ahead in the race are not only highly skilled, but also have the right toolkit. Having the ability to combine a variety of extraction techniques with 1- or 2-dimensional separation, mass selective detection, an olfactory detection port (ODP) to determine which compounds are interesting, and even a fraction collector to collect interesting compounds for further analysis – this is the toolkit that dreams are made of. When all this is nicely integrated on a single GC/MS system it also becomes very manageable. Japanese scientists from GERSTEL K.K. in Tokyo demonstrate the system that helps sniff out
even the smallest peak.
Dogs have superior olfactory capabilities, Homo sapiens have advanced analytical instrumentation and the skills to decipher the results in order to compensate for olfactory deficiencies. The instrumentation available to us even enables extraction of odor active compounds from complex matrices followed by qualitative or quantitative determination. Gas chromatography (GC), especially in combination with olfactory detection (GC-O), is widely recognized as a highly efficient method. If the column effluent is split at the column outlet, an Olfactory Detection Port (ODP) and a mass selective detector (MSD) can be attached in parallel in order to get both an olfactory signature and a mass spectral identification and quantification of the odor active compound. As an aside, the ODP - MSD combination exposes weaknesses in
the technique. “You don’t always get a signal in the chromatogram even though there is a perceivable smell at the ODP”, explains Dr. Nobuo
Ochiai, technical director at GERSTEL K.K. in Tokyo, Japan. This proves that the human nose, while not able to compete with its canine counterpart, is still more sensitive than modern analytical equipment when it comes to compounds that have a low odor threshold: Even a few milligrams of methylmercaptan in 100 million cubic meters of air are enough to make people head for the exit. To put that volume into context, it is around 1000 times the volume of the Notre Dame cathedral in Paris. For most compounds, far higher concentrations are required in order to produce an adequate olfactory response. And many times it is necessary to first remove interfering compounds using chromatographic separation in order to get a clear description.
Separating olfactory interferences from the analyte can be simple, even for complex samples, if you have the right equipment. A GC/MS system that offers a second dimension of separation with simple, easy
GERSTEL Solutions Worldwide Wine Special 29
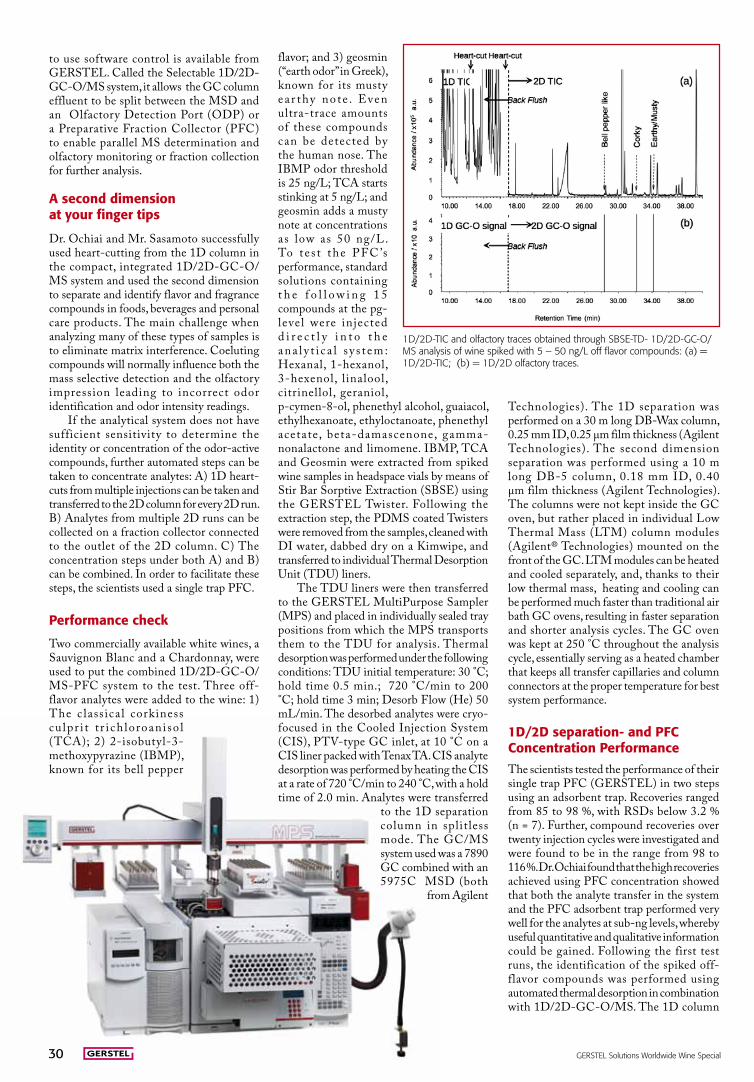
to use software control is available from GERSTEL. Called the Selectable 1D/2D-GC-O/MS system, it allows the GC column effluent to be split between the MSD and an Olfactory Detection Port (ODP) or a Preparative Fraction Collector (PFC) to enable parallel MS determination and olfactory monitoring or fraction collection for further analysis.
A second dimension at your finger tips
Dr. Ochiai and Mr. Sasamoto successfully used heart-cutting from the 1D column in the compact, integrated 1D/2D-GC-O/MS system and used the second dimension to separate and identify flavor and fragrance compounds in foods, beverages and personal care products. The main challenge when analyzing many of these types of samples is to eliminate matrix interference. Coeluting compounds will normally influence both the mass selective detection and the olfactory impression leading to incorrect odor identification and odor intensity readings.
If the analytical system does not have sufficient sensitivity to determine the identity or concentration of the odor-active compounds, further automated steps can be taken to concentrate analytes: A) 1D heart-cuts from multiple injections can be taken and transferred to the 2D column for every 2D run. B) Analytes from multiple 2D runs can be collected on a fraction collector connected to the outlet of the 2D column. C) The concentration steps under both A) and B) can be combined. In order to facilitate these steps, the scientists used a single trap PFC.
Performance check
Two commercially available white wines, a Sauvignon Blanc and a Chardonnay, were used to put the combined 1D/2D-GC-O/MS-PFC system to the test. Three off-flavor analytes were added to the wine: 1) The c lassical corkiness cu lpr i t t r i ch loroani so l (TCA); 2) 2-isobutyl-3-methoxypyrazine (IBMP), known for its bell pepper
flavor; and 3) geosmin (“earth odor” in Greek), known for its musty e a r thy no te . Even ultra-trace amounts of these compounds can be detected by the human nose. The IBMP odor threshold is 25 ng/L; TCA starts stinking at 5 ng/L; and geosmin adds a musty note at concentrations as low as 50 ng/L. To t e s t the PFC ’s performance, standard solutions containing t h e f o l l o w i n g 1 5 compounds at the pg-level were injected d i r e c t l y i n t o t h e ana l y t i c a l s y s t em: Hexanal, 1-hexanol, 3-hexenol, linalool, citrinellol, geraniol, p-cymen-8-ol, phenethyl alcohol, guaiacol, ethylhexanoate, ethyloctanoate, phenethyl acetate, beta-damascenone, gamma-nonalactone and limomene. IBMP, TCA and Geosmin were extracted from spiked wine samples in headspace vials by means of Stir Bar Sorptive Extraction (SBSE) using the GERSTEL Twister. Following the extraction step, the PDMS coated Twisters were removed from the samples, cleaned with DI water, dabbed dry on a Kimwipe, and transferred to individual Thermal Desorption Unit (TDU) liners.
The TDU liners were then transferred to the GERSTEL MultiPurpose Sampler (MPS) and placed in individually sealed tray positions from which the MPS transports them to the TDU for analysis. Thermal desorption was performed under the following conditions: TDU initial temperature: 30 °C; hold time 0.5 min.; 720 °C/min to 200 °C; hold time 3 min; Desorb Flow (He) 50 mL/min. The desorbed analytes were cryo-focused in the Cooled Injection System (CIS), PTV-type GC inlet, at 10 °C on a CIS liner packed with Tenax TA. CIS analyte desorption was performed by heating the CIS at a rate of 720 °C/min to 240 °C, with a hold time of 2.0 min. Analytes were transferred
to the 1D separation column in splitless mode. The GC/MS system used was a 7890 GC combined with an 5975C MSD (both
from Agilent
Technologies). The 1D separation was performed on a 30 m long DB-Wax column, 0.25 mm ID, 0.25 µm film thickness (Agilent Technologies). The second dimension separation was performed using a 10 m long DB-5 column, 0.18 mm ID, 0.40 µm film thickness (Agilent Technologies). The columns were not kept inside the GC oven, but rather placed in individual Low Thermal Mass (LTM) column modules (Agilent® Technologies) mounted on the front of the GC. LTM modules can be heated and cooled separately, and, thanks to their low thermal mass, heating and cooling can be performed much faster than traditional air bath GC ovens, resulting in faster separation and shorter analysis cycles. The GC oven was kept at 250 °C throughout the analysis cycle, essentially serving as a heated chamber that keeps all transfer capillaries and column connectors at the proper temperature for best system performance.
1D/2D separation- and PFC Concentration Performance
The scientists tested the performance of their single trap PFC (GERSTEL) in two steps using an adsorbent trap. Recoveries ranged from 85 to 98 %, with RSDs below 3.2 % (n = 7). Further, compound recoveries over twenty injection cycles were investigated and were found to be in the range from 98 to 116 %. Dr. Ochiai found that the high recoveries achieved using PFC concentration showed that both the analyte transfer in the system and the PFC adsorbent trap performed very well for the analytes at sub-ng levels, whereby useful quantitative and qualitative information could be gained. Following the first test runs, the identification of the spiked off- flavor compounds was performed using automated thermal desorption in combination with 1D/2D-GC-O/MS. The 1D column
1D/2D-TIC and olfactory traces obtained through SBSE-TD- 1D/2D-GC-O/MS analysis of wine spiked with 5 – 50 ng/L off flavor compounds: (a) = 1D/2D-TIC; (b) = 1D/2D olfactory traces.
30 GERSTEL Solutions Worldwide Wine Special
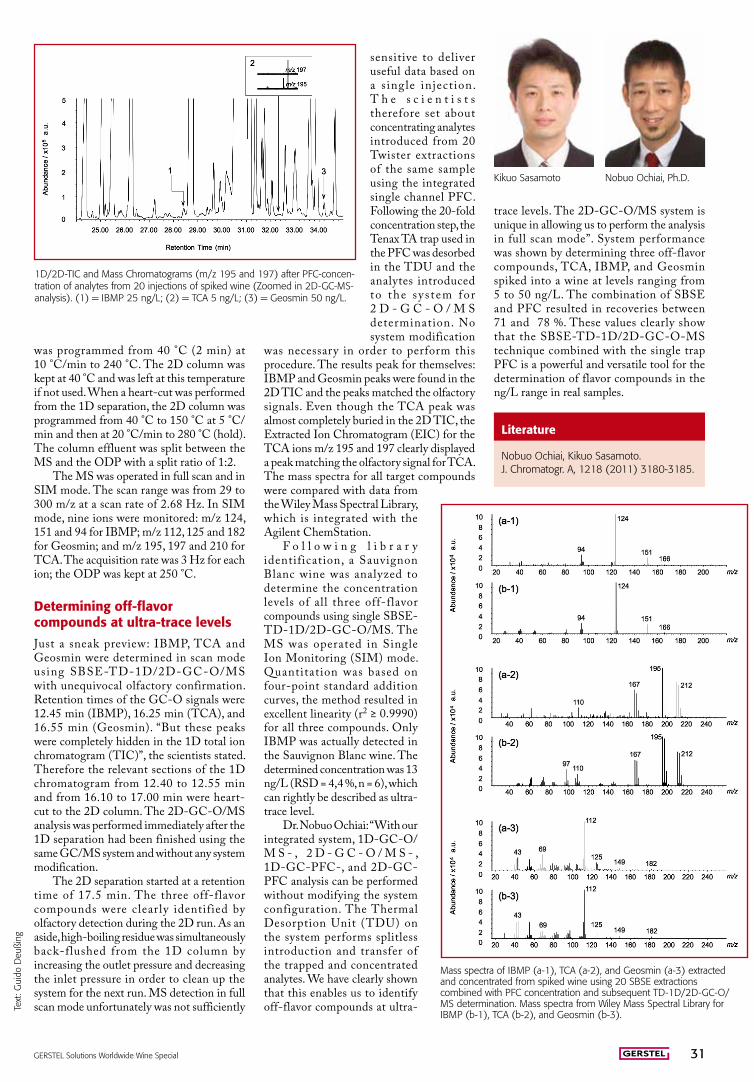
was programmed from 40 °C (2 min) at 10 °C/min to 240 °C. The 2D column was kept at 40 °C and was left at this temperature if not used. When a heart-cut was performed from the 1D separation, the 2D column was programmed from 40 °C to 150 °C at 5 °C/min and then at 20 °C/min to 280 °C (hold). The column effluent was split between the MS and the ODP with a split ratio of 1:2.
The MS was operated in full scan and in SIM mode. The scan range was from 29 to 300 m/z at a scan rate of 2.68 Hz. In SIM mode, nine ions were monitored: m/z 124, 151 and 94 for IBMP; m/z 112, 125 and 182 for Geosmin; and m/z 195, 197 and 210 for TCA. The acquisition rate was 3 Hz for each ion; the ODP was kept at 250 °C.
Determining off-flavor compounds at ultra-trace levels
Just a sneak preview: IBMP, TCA and Geosmin were determined in scan mode using SBSE-TD-1D/2D-GC-O/MS with unequivocal olfactory confirmation. Retention times of the GC-O signals were 12.45 min (IBMP), 16.25 min (TCA), and 16.55 min (Geosmin). “But these peaks were completely hidden in the 1D total ion chromatogram (TIC)”, the scientists stated. Therefore the relevant sections of the 1D chromatogram from 12.40 to 12.55 min and from 16.10 to 17.00 min were heart-cut to the 2D column. The 2D-GC-O/MS analysis was performed immediately after the 1D separation had been finished using the same GC/MS system and without any system modification.
The 2D separation started at a retention time of 17.5 min. The three off-flavor compounds were clearly identified by olfactory detection during the 2D run. As an aside, high-boiling residue was simultaneously back-flushed from the 1D column by increasing the outlet pressure and decreasing the inlet pressure in order to clean up the system for the next run. MS detection in full scan mode unfortunately was not sufficiently
sensitive to deliver useful data based on a s ingle inject ion. T h e s c i e n t i s t s therefore set about concentrating analytes introduced from 20 Twister extractions of the same sample using the integrated single channel PFC. Following the 20-fold concentration step, the Tenax TA trap used in the PFC was desorbed in the TDU and the analytes introduced to the sy s tem for 2 D - G C - O / M S determination. No system modification
was necessary in order to perform this procedure. The results peak for themselves: IBMP and Geosmin peaks were found in the 2D TIC and the peaks matched the olfactory signals. Even though the TCA peak was almost completely buried in the 2D TIC, the Extracted Ion Chromatogram (EIC) for the TCA ions m/z 195 and 197 clearly displayed a peak matching the olfactory signal for TCA. The mass spectra for all target compounds were compared with data from the Wiley Mass Spectral Library, which is integrated with the Agilent ChemStation.
F o l l o w i n g l i b r a r y identification, a Sauvignon Blanc wine was analyzed to determine the concentration levels of all three off-flavor compounds using single SBSE-TD-1D/2D-GC-O/MS. The MS was operated in Single Ion Monitoring (SIM) mode. Quantitation was based on four-point standard addition curves, the method resulted in excellent linearity (r2 ≥ 0.9990) for all three compounds. Only IBMP was actually detected in the Sauvignon Blanc wine. The determined concentration was 13 ng/L (RSD = 4,4 %, n = 6), which can rightly be described as ultra-trace level.
Dr. Nobuo Ochiai: “With our integrated system, 1D-GC-O/M S - , 2 D - G C - O / M S - , 1D-GC-PFC-, and 2D-GC-PFC analysis can be performed without modifying the system configuration. The Thermal Desorption Unit (TDU) on the system performs splitless introduction and transfer of the trapped and concentrated analytes. We have clearly shown that this enables us to identify off-flavor compounds at ultra-
1D/2D-TIC and Mass Chromatograms (m/z 195 and 197) after PFC-concen-tration of analytes from 20 injections of spiked wine (Zoomed in 2D-GC-MS-analysis). (1) = IBMP 25 ng/L; (2) = TCA 5 ng/L; (3) = Geosmin 50 ng/L.
Mass spectra of IBMP (a-1), TCA (a-2), and Geosmin (a-3) extracted and concentrated from spiked wine using 20 SBSE extractions combined with PFC concentration and subsequent TD-1D/2D-GC-O/MS determination. Mass spectra from Wiley Mass Spectral Library for IBMP (b-1), TCA (b-2), and Geosmin (b-3).
Kikuo Sasamoto Nobuo Ochiai, Ph.D.
Literature
Nobuo Ochiai, Kikuo Sasamoto. J. Chromatogr. A, 1218 (2011) 3180-3185.
Text
: Gui
do D
eußi
ng
trace levels. The 2D-GC-O/MS system is unique in allowing us to perform the analysis in full scan mode”. System performance was shown by determining three off-flavor compounds, TCA, IBMP, and Geosmin spiked into a wine at levels ranging from 5 to 50 ng/L. The combination of SBSE and PFC resulted in recoveries between 71 and 78 %. These values clearly show that the SBSE-TD-1D/2D-GC-O-MS technique combined with the single trap PFC is a powerful and versatile tool for the determination of flavor compounds in the ng/L range in real samples.
GERSTEL Solutions Worldwide Wine Special 31

Eliminating wine matrix interference
The wine matrix is a critical part of the body of the wine. When it comes to chemical analysis and determining various wine
constituents, the matrix can be in the way, however. How to eliminate the matrix without throwing the baby, i.e. the analytes, out with the bath water? Scientists from the renowned Château Léoville Las Cases near Bordeaux teamed up with scientists from the Research Institute for Chromatography (RIC) in Belgium and developed an automated SPE-LC-MS/MS method based on the GERSTEL MultiPurpose Sampler (MPS).
More information
There are many advantages to stir bar sorptive extraction (SBSE) for isolating and concentrating flavor active chemicals from foods.
These include simplicity, wide application range, efficient analyte concentration, and generally the absence of masking solvent peaks. Written from a practical, problem-solving perspective, the second edition of Flavor, Fragrance, and Odor Analysis highlights this powerful technique and emphasizes the range of applications available. Topics discussed include:
Sequential SBSE, a novel extraction procedure · A simplified method for switching from one-dimensional to two-dimensional GC/MS · How to improve analytical sensitivity and recovery of phenolic compounds with aqueous acylation prior to SBSE GC-MS · Analyzing and combating off-flavors caused by metabolites from microorganisms · A technique for measuring synergy effects between odorants · The identification of the characterizing aroma-active compounds of tropical fruits with high economic potential · The parameters utilized during the production of aqueous formulations rich in pyrazines · How spectral deconvolution can be used to speciate the subtle differences in essential oil content and track key ingredients through the manufacturing process
The final chapter summarizes chemical identities of characterizing aroma chemicals in fruits, vegetables, nuts, herbs and spices, and savory and dairy flavors. It also provides a brief compendium of the characterization of off-flavors and taints that are reported in foods. With contributions from a distinguished panel of international experts, this volume provides chemists and researchers with the latest techniques for analyzing and enhancing food flavor and fragrance.
Flavor, Fragrance, and Odor Analysis, Second Edition
Literature
Suggested reading…
More information
E. Dumont, M. Georges, R. Fulchic, G. Vanhoenacker, F. David, P. Sandra. Determination of various wine constituents using direct injection, automated off-line solid phase extraction, and liquid-liquid extraction in combination with liquid chromatography-tandem mass spectrometry. Focus on Food analysis. Supplement to AgroFood industry hitech. May/June 2010. Vol. 21 n. 3.
More information
C. Franc, F. David, G.de Revel. Multi-residue off-flavour profiling in wine using stir bar sorptive extraction-thermal desorption-gas chromatography-mass spectrometry. Journal of Chromatography A, 1216 (2009) 3318-3327.
Causing another stir
Stir Bar Sorptive Extraction (SBSE) using the GERSTEL Twister® in combination with thermal desorption GC/MS is already a proven
approach for the analysis of wine and other beverages. Wine scientists from the University of Bordeaux and scientists from the Research Institute for Chromatography (RIC) in Belgium analyzed various wines for off-flavor compounds using the Twister and compared the results with those obtained using other techniques such as Headspace SPME (HS-SPME) and liquid-liquid extraction (LLE).
Ray Marsili (Edi.), Flavor, Fragrance, and Odor Analysis,Second Edition, 280 Pages, ISBN-10: 1439846731 and ISBN-13: 978-1439846735.
www.gerstel.com
GERSTEL, Inc., USA +1 410 - 247 5885 [email protected]
GERSTEL K.K., Japan +81 3 57 31 53 21 [email protected]
GERSTEL LLP, Singapore +65 6622 5486 [email protected]
GERSTEL GmbH & Co. KG,Germany +49 208 - 7 65 03-0 [email protected]
GERSTEL AG, Switzerland +41 41 - 9 21 97 23 [email protected]
G L O B A L A N A L Y T I C A L S O L U T I O N S
Subject to change. GERSTEL®, GRAPHPACK® and TWISTER® are registered trademarks of GERSTEL GmbH & Co. KG.Printed in Germany · 0312 · © Copyright by GERSTEL GmbH & Co. KG
GERSTEL BRASIL +55 11 5665 8931 [email protected]