
Modern Modeling Methods Conference · I ndhope to see you all again at our eighth annual Modern...
68
Modern Modeling Methods Conference May 22 nd – 25 th , 2017 University of Connecticut
Transcript of Modern Modeling Methods Conference · I ndhope to see you all again at our eighth annual Modern...

Modern Modeling Methods Conference
May 22nd – 25th, 2017
University of Connecticut

1
2017 Modern Modeling Methods Conference
Welcome and thank you for joining us for the 7th annual Modern Modeling Methods Conference at
the University of Connecticut. Special thanks to all of the keynote speakers and concurrent
presenters for making this wonderful program possible! I look forward to this week all year long. I
love seeing all the wonderful modeling work that researchers are doing, and I love getting the
chance to interact with people whose work I am reading and citing throughout the year. It’s a
pleasure and an honor to have Dr. Ken Bollen back at the modeling conference. Dr. Bollen was one
of our 5 keynote speakers at the first modeling conference in 2011. I am also extremely excited to
welcome Dr. Steven Boker to the Modeling conference for the first time. I have been a great fan of
his work ever since I saw him speak at UVA over a decade ago. Thank you to the following people
for their contributions to the conference: Lisa Rasicot, Casey Davis, Kasey Neves, Cheryl Lowe,
Robbin Haboian-Demircan, and conference services for providing administrative and logistical
support for the conference. I couldn’t keep this conference going without them!
I hope to see you all again at our eighth annual Modern Modeling Methods Conference May 22nd-
23rd, 2018. Confirmed keynote speakers for 2018 include Dr. Peter Molenaar (Penn State) and
Tenko Raykov (MSU). Tenko Raykov will be offering a full day Pre-Conference workshop on IRT
from a Latent Variable Modeling Perspective on May 21st. We are in the process of lining up a
third keynote speaker and a post-conference presenter, and we hope to announce those presenters
soon. Proposals for concurrent sessions will be due February 1st, 2018, and can be submitted online
at our website: www.modeling.uconn.edu
If you have suggestions, please be sure to fill out the conference evaluation, located on our website,
www.modeling.uconn.edu . We hope you have a great conference – Happy modeling!
D. Betsy McCoach
Professor, Neag School of Education
2
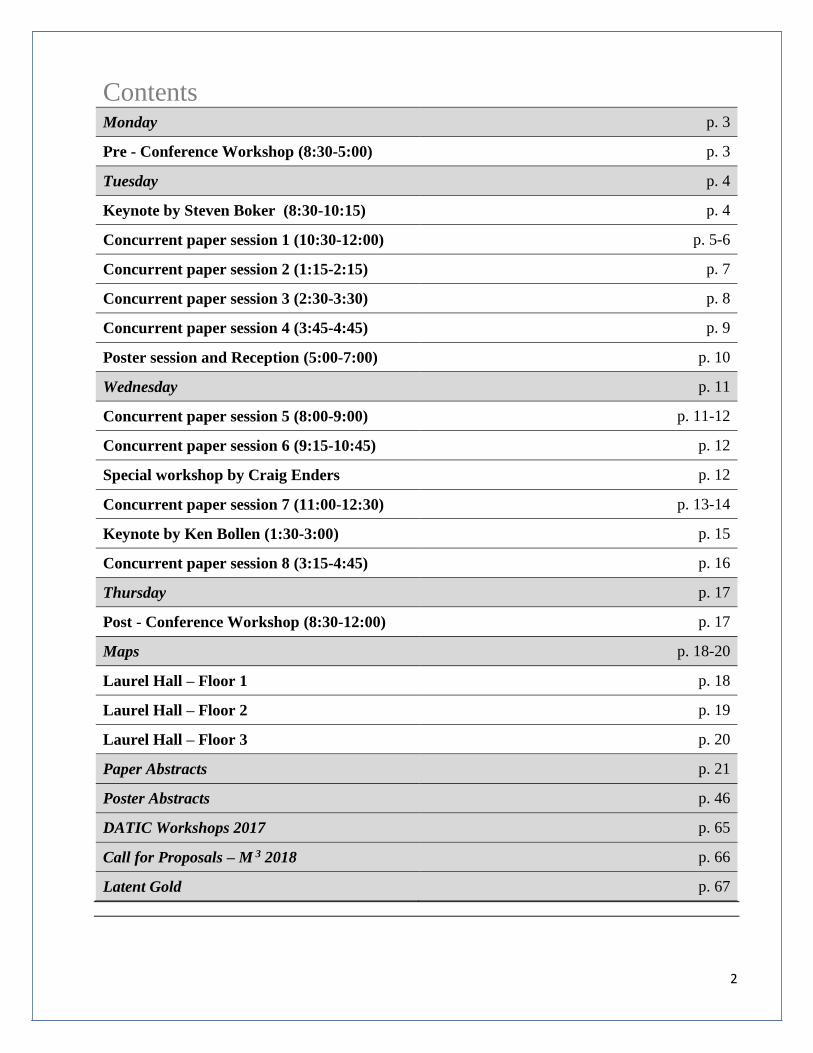
Contents
Monday p. 3
Pre - Conference Workshop (8:30-5:00) p. 3
Tuesday p. 4
Keynote by Steven Boker (8:30-10:15) p. 4
Concurrent paper session 1 (10:30-12:00) p. 5-6
Concurrent paper session 2 (1:15-2:15) p. 7
Concurrent paper session 3 (2:30-3:30) p. 8
Concurrent paper session 4 (3:45-4:45) p. 9
Poster session and Reception (5:00-7:00) p. 10
Wednesday p. 11
Concurrent paper session 5 (8:00-9:00) p. 11-12
Concurrent paper session 6 (9:15-10:45) p. 12
Special workshop by Craig Enders p. 12
Concurrent paper session 7 (11:00-12:30) p. 13-14
Keynote by Ken Bollen (1:30-3:00) p. 15
Concurrent paper session 8 (3:15-4:45) p. 16
Thursday p. 17
Post - Conference Workshop (8:30-12:00) p. 17
Maps p. 18-20
Laurel Hall – Floor 1 p. 18
Laurel Hall – Floor 2 p. 19
Laurel Hall – Floor 3 p. 20
Paper Abstracts p. 21
Poster Abstracts p. 46
DATIC Workshops 2017 p. 65
Call for Proposals – M 3 2018 p. 66
Latent Gold p. 67

3
Modern Modeling Models – 2017 Schedule
Monday, May 22:
Preconference workshop
OpenMx XSEM with Applications to Dynamical Systems Analysis
Steven Boker
Continental Breakfast and Registration 7:30 am – 8:30 am
Laurel Hall Atrium
Pre – Conference Workshop
OpenMx XSEM with Applications to Dynamical Systems Analysis
Steven Boker
Laurel Hall 102
8:30 am – 5:00pm
The first half of the workshop will introduce OpenMx and the specification of simple
latent variable models within R as well as provide an overview of some of its more
advanced features such as full information, definition variables, parallelizing, ordinal
thresholds, multiple groups, and mixture distributions. The second half of the workshop
will present dynamical systems analysis as a continuous-time generalization of time
series models using systems of differential equations.
Lunch is on your own. Several options are available in the Student Union.
Afternoon break: Refreshments in Laurel Hall Atrium from 3:00-4:00

4
Tuesday – May 23
Continental Breakfast and Registration 7:30 am – 8:30 am
Laurel Hall Atrium
Welcome 8:30 am
Laurel Hall 102
Opening Keynote- Steven Boker 8:30 am – 10:15 am
Laurel Hall 102
Dynamical Systems Analysis in the Context of Statistical Methods and
Research Design Steven Boker
University of Virginia
Over the past three decades, there has been a great deal of work on integrating the ideas and
generative models produced in particular by mathematicians, physicists, and chemists into methods
and algorithms that can be useful to test models on data from the social, behavioral, and medical
sciences. Historically, Hotelling suggested in 1927 that differential equations should be used for
models of change, but despaired that the problem was intractable using available tools. Stochastic
differential equations and Kalman Filters were introduced in the 1950's and 60's. The field of
dynamical systems enjoyed a burst of popularity in the 1970's and 80's with the co-occurring
introduction of the notions of chaotic systems, fractal dimensions, and the availability of desktop
computers that let one explore these generative models. There followed a period of about two
decades where methods for estimating parameters of differential equations began to become better
developed, but the intensive multivariate, multi-person time series required to identify such models
were not yet available. Finally, in the past 10 years we have seen the emergence of widely available
technology such as smart phones that can track intensively measured multivariate time series from
many individuals. This talk will provide a brief history of the field dynamical systems and a way of
organizing the questions we might ask of intensively time-sampled multivariate multi-person
data. Some of the main dynamical systems data analytic methods available will be overviewed and
placed into context of the questions for which they are best suited. A short discussion and rationale
for models for self-regulating phenomena will be presented. The talk will discuss some of the
problems associated with modeling nonstationary systems, why we should care, and a review of
some of the methods that are in use for estimating and dealing with non-stationarity. The talk will
conclude with a brief introduction to the problem of privacy preserving analytics for data on
personal devices and one potential solution to this problem: distributed likelihood estimation.

5
Concurrent paper session 1 Tuesday 10:30 am - 12:00 pm
Session 1A: Symposium - Mixture models are measurement models, too!
Measurement invariance and differential item functioning in latent class
analysis
Laurel Hall 202 Paper Authors
Unmodeled Differential Item Functioning (DIF) in Latent Class
Analysis: A Monte Carlo Simulation
Veronica Cole
Katherine Masyn
Dan Bauer
Measurement Invariance in Multiple-Group Latent Class Analysis Katherine Masyn
Veronica Cole
Dan Bauer
Regression-based Approaches to DIF Detection in Latent Class
Models
Veronica Cole
Katherine Masyn
Dan Bauer
Session 1B: Modeling Educational Effects
Laurel Hall 205 Paper Authors
Efficacy of a Scaled-Up First Grade Reading Intervention for
English Language Learners
Paulina A. Kulesz
Application of Cross-Classified Multiple Membership Growth Curve
Modeling in a Study of the Effect of School Mobility on Students’
Academic Performance
Bess. A Rose
A Piecewise Latent Growth Model to Study the Effects of a College
Admissions Test Overhaul
Paulina Pérez Mejias
Alberto F. Caberera
Session 1C: Survey Research Models
Laurel Hall 206 Paper Authors
Footballs, Eigenvectors, and Psychometrics: An Outlier Detection
Proposal for Likert-Type Survey Data
Allen G. Harbaugh
Item Response Theory and Ranking of Congressional Voting
Behavior
Holmes Finch
Gregory Marchant
Alicia Hazelwood
The Use of Topic Modeling to Analyze Open-Ended Survey Items Holmes Finch
Maria Hernandez Finch
Constance McIntosh
Claire Braun

6
Concurrent paper session 1 Tuesday 10:30 am - 12:00 pm
Session 1D: Measurement and Psychometrics
Laurel Hall 305 Paper Authors
The α and the ω of Congeneric Test Theory: An Extension of
Reliability and Internal Consistency to Heterogeneous Tests
Joseph F. Lucke
Using the Nominal IRT Model for Recency of Drug Use Items A.R. Georgeson
Exploring Measurement Invariance Using CTT and IRT Techniques Noela Haughton
Priti Signh
Lunch Tuesday 12:00 pm – 1:15 pm
Student Union Ballroom
3rd floor, Student Union

7
Concurrent paper session 2 Tuesday 1:15 pm – 2:15 pm
Session 2A: IRT Methods and Applications
Laurel Hall 202 Paper Authors
A Conditional Joint Modeling Approach for Compensatory
Multidimensional Item Response Model and Response Times
Kaiwen Man
Hong Jiao
Peida Zhan
Chi-Yu Huang
Detection of Differential Item Functioning in the Context of
Clustered Data: A Comparison Study
Graham G. Rifenbark
H. Jane Rogers
Session 2B: Mediation Models
Laurel Hall 205 Paper Authors
Multimethod Moderated Mediation Analysis using a Categorical
Multigroup Design
Kaylee Litson
Christian Geiser
G. Leonard Burns
Tools for Computationally Efficient Power and Sample Size
Determination for Mediation Models
Alexander M. Shoemann
Aaron J. Boulton
Stephen D. Short
Session 2C: Intra and Inter-individual Variation Modeling
Laurel Hall 206 Paper Authors
Bayesian/Mixed-Effects Nonstationary Latent Differential
Equation Models
Mauricio Garnier-Villarreal
Pascal R. Deboeck
Davis K. Johnson
Amber Watts
Session 2D: Modeling Composite – Based Populations Laurel Hall 305 Paper Authors
Modeling Composite-Based Populations Using Composite-Based
Methods
Jan-Michael Becker
Edward E. Rigdon
Arun Rai
2:15-2:30 Break- Refreshments in the Laurel Hall Atrium

8
Concurrent paper session 3 Tuesday 2:30 pm – 3:30 pm
Session 3A: Casual Inference
Laurel Hall 202 Paper Authors
The Mechanics of Omitted Variable Bias: Bias Amplification and
Cancellation of Offsetting Biases
Yongnam Kim
Peter M. Steiner
Marginal Structural Models for Estimating the Effects of Chronic
Community Violence Exposure on Youth Aggression and Depression
Traci M. Kennedy
Edward H. Kennedy
Session 3B: Probability Index Models
Laurel Hall 205 Paper Authors
Probability Index Models Jan De Neve
Session 3C: Bayesian Single Case Models
Laurel Hall 206 Paper Authors
Bayesian Testing in Single-Case Research: A Forward Paradigm
Shift
Tyler Hicks
Jason Travers
Leslie Bross
Design-comparable Effect Sizes for Single-Case Research: A
Bayesian Approach
Tyler Hicks
Eun Sook Kim
Seang Hwane Joo
Jeong Hoon Choi
John Ferron
Jeff Kromrey
Session 3D: Modeling Change and Context
Laurel Hal 305 Paper Authors
Variance Estimation of Health Disparity Measures in Complex
Survey Settings
Meng Qui
Affective Red Zones: An Examination of Bivariate Change in
Context
Joel Steele
David Sbarra
Emilio Ferrer
3:30-3:45 Break- Refreshments in the Laurel Hall Atrium

9
Concurrent paper session 4 Tuesday 3:45 pm – 4:45 pm
Session 4A: Symposium – Applications of Multilevel Models with Latent
Variables to K-12 Education
Laurel Hall 202
Symposium Authors
Different Levels of Leadership for Learning: Investigating
Differences Between Teachers Individually and Collectively Using
Multilevel Factor Analysis of the 2011-12 Schools and Staffing
Survey
Jared Boyce
Alex J. Bowers
Site Section in School District Research: A Measure of Effectiveness
Using Hierarchical Longitudinal Growth Models of Performance
Alex J. Bowers
Feasibility of Increasing Access: How Does Instructional
Leadership Influence Opportunity to Learn in U.S. and Belgium?
Angela Urick
Allison Wilson
Timothy G. Ford
Session 4B: Longitudinal and Multilevel SEM
Laurel Hall 205 Paper Authors
Estimating Latent trends in Multivariate Longitudinal Data via
Parafac2 with Functional and Structural Constraints
Nathaniel E. Helwig
Toward Multilevel SEM with Latent Quadratic Effects Joshua Pritikin
Session 4C: Power and Program Evaluation
Laurel Hall 206 Paper Authors
The Illusion of Intended Statistical Power: Avoiding Underpowered
Replication Studies via Effective Sample Size Planning
Samantha Anderson
Scott Maxwell
Ken Kelley
Using Aggregate Unit Pre/Post Assessment Results Across
Classrooms: A Monte Carlo Study Proof of Concept in Program
Evaluation
Matthew Lavery
Session 4D: Suppression / Non-Monotonic Effects
Laurel Hall 305 Paper Authors
Suppression Effects in Regression: The Case of Learning Strategies
and Academic Achievement
Eric Loken
Xiaowen Liu
A New Model for Non-Monotonic Effects David Weakliem

10
Tuesday, May 23
Poster session and Reception Student Union Ballroom
5:00 pm – 6:30 pm
Tuesday, May 23
Third Floor, Student Union
Please join us for appetizers, an open bar, and 51 fascinating posters on a wide variety of modeling
topics. Poster abstracts and presenters are listed in the back of the program, starting on page 46.

11
Wednesday – May 24
Continental breakfast
7:30 am – 8:30 am
Laurel Hall Atrium
Concurrent paper session 5 Wednesday 8:00 am – 9:00 am
Session 5A: Symposium – Considerations When Utilizing Indicators to Evaluate
Latent-level Differences across Time and Groups
Laurel Hall 301
Symposium Authors
Longitudinal Factorial Invariance: Measuring and Modeling the
Same Construct Over Time
Marilu Isiodia
Implications of Establishing Internal Consistency but Not Factorial
Invariance on Growth Model Parameter
Marilu Isiodia
Session 5B: Papers – Dealing with Non-normality
Laurel Hall 305 Paper Authors
Effects of Non-normality of Residuals in Hierarchical Linear
Modeling
Kaiwen Man
Yating Zheng
Laura Stapleton
Evaluation of Supplemental Samples in Longitudinal Research with
Non-normal Missing Date
Jessica Mazen
Session 5C: Evaluating Balance for Causal Inference
Laurel Hall 306 Paper Authors
Evaluating Balance for Causal Inference: An Illustration of the
Cobalt Package in R
Noah Greifer

12
Concurrent paper session 6 Wednesday 9:15 am – 10:45 am
Session 6A: Workshop by Craig Enders: Multiple Imputation for Multilevel Data
Laurel Hall 301 (Please note: this is a double session which runs 9:15-12:30.) Special Workshop Presenter
Multiple Imputation for Multilevel Data (Part I) Craig Enders
Session 6B: Graphical Methods for Understanding SEM Models
Laurel Hall 305 Paper Authors
Graphical Methods for Understanding SEM Models Keke Lai
Samuel Green
Roy Levy
Session 6C: What the Dutch can do with prior information (and you can too)
Laurel Hall 306
Symposium Authors
Bayesian Structural Equation Models with Small Samples Sanne Smid
Dan McNeish
Rens van de Schoot
Using the Data Agreement Criterion to Rank Experts’ Beliefs Duco Veen
Diedrick Stoel
Rens van de Schoot
Testing ANOVA Replications by Means of the Prior Predictive p-
value
Mariëlle Zondervan-
Zwijnenburg
Rens van de Schoot
Herbert Hoijtink
Session 6D: Dyadic, Social Network, and Social Relations Models
Laurel Hall 106 Paper Authors
Applying Modern Methods for Missing Data Analysis to the Social
Relations Model
Terrence Jorgensen
Modeling Parent’s Reports of Children’s Gender-Type Behavior
Over Time with an Indistinguishable Dyads Common Fate Growth
Model
Randi Garcia
Abbie Goldberg
Teacher Social Network Change over Time: How do Longitudinal
Modeling Approaches Compare?
Elizabeth Dietrich
Nathan Abe
Elizabeth Sanders
Jessica Thompson
13
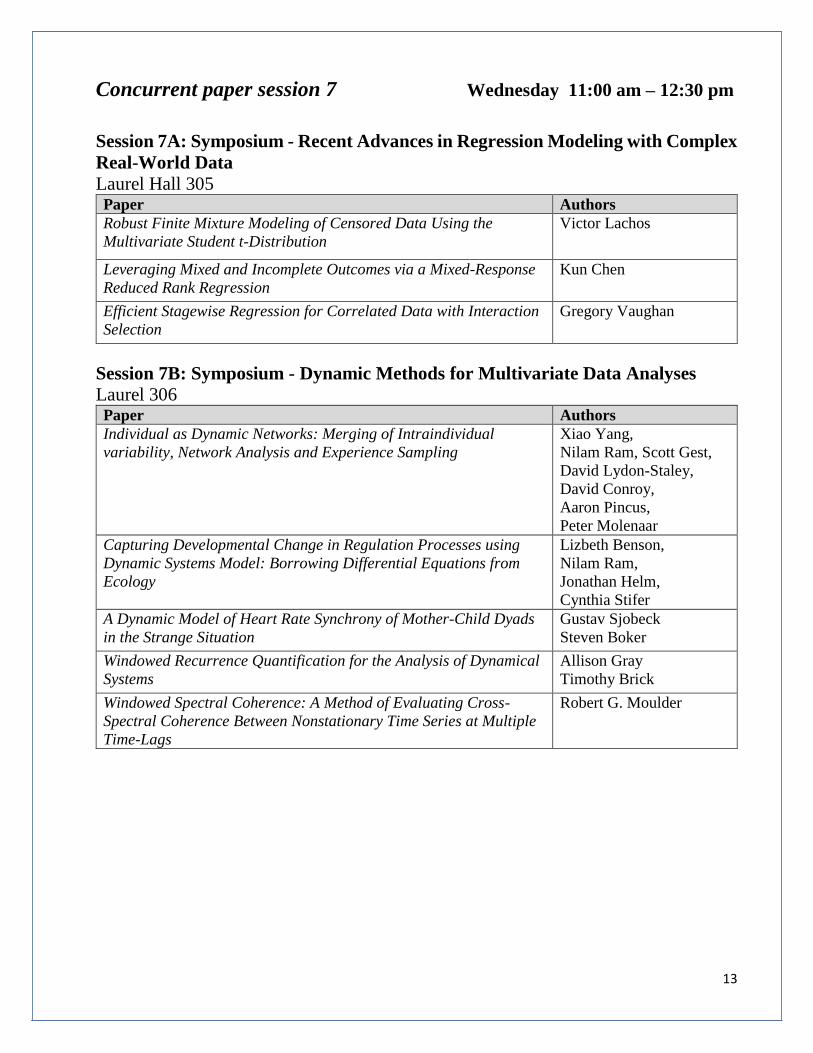
Concurrent paper session 7 Wednesday 11:00 am – 12:30 pm
Session 7A: Symposium - Recent Advances in Regression Modeling with Complex
Real-World Data
Laurel Hall 305 Paper Authors
Robust Finite Mixture Modeling of Censored Data Using the
Multivariate Student t-Distribution
Victor Lachos
Leveraging Mixed and Incomplete Outcomes via a Mixed-Response
Reduced Rank Regression
Kun Chen
Efficient Stagewise Regression for Correlated Data with Interaction
Selection
Gregory Vaughan
Session 7B: Symposium - Dynamic Methods for Multivariate Data Analyses
Laurel 306 Paper Authors
Individual as Dynamic Networks: Merging of Intraindividual
variability, Network Analysis and Experience Sampling
Xiao Yang,
Nilam Ram, Scott Gest,
David Lydon-Staley,
David Conroy,
Aaron Pincus,
Peter Molenaar
Capturing Developmental Change in Regulation Processes using
Dynamic Systems Model: Borrowing Differential Equations from
Ecology
Lizbeth Benson,
Nilam Ram,
Jonathan Helm,
Cynthia Stifer
A Dynamic Model of Heart Rate Synchrony of Mother-Child Dyads
in the Strange Situation
Gustav Sjobeck
Steven Boker
Windowed Recurrence Quantification for the Analysis of Dynamical
Systems
Allison Gray
Timothy Brick
Windowed Spectral Coherence: A Method of Evaluating Cross-
Spectral Coherence Between Nonstationary Time Series at Multiple
Time-Lags
Robert G. Moulder

14
Concurrent paper session 7 Wednesday 11:00 am – 12:30 pm
Session 7C: Educational & Developmental Applications
Laurel Hall 106 Paper Authors
Self-Regulatory Climate Measures Mwarumba Mwavita
Kathy Curry
Confirming the Factor Structure of the Critical
Thinking Assessment Test: A Bayesian CFA Approach
Chi Hang Bryan Au
Allison Ames
Longitudinal Studies on Night Sleep Trajectories
throughout Infancy
Shaun Goh, Daniel Goh, Teoh Oon Hoe,
Seang Mei Saw, Fabian Yap, Yap Seng
Chong, Anqi Qiu, Birit Brokeman
Session 7D: Workshop- Craig Enders- Multiple Imputation for Multilevel Data
Laurel Hall 301 Special Workshop Presenter
Multiple Imputation for Multilevel Data (Part II) Craig Enders
Lunch Wednesday 12:30 pm – 1:30 pm
Student Union Food Court The card in your packet has $13.00 that can be used at any of the Student Union eateries EXCEPT
Subway.

15
Keynote- Kenneth Bollen Wednesday 1:30-3:00pm
Model Implied Instrumental Variables: A New Orientation to Structural
Equation Models Kenneth Bollen
Laurel Hall 102
1:30 pm – 3:00 pm
It is hardly controversial to say that our models are approximations to reality. Yet when it comes to
estimating structural equation models (SEMs), we use estimators that assume true models (e.g.,
ML) and that can spread bias through estimated parameters when the model is approximate. This
talk presents the Model Implied Instrumental Variable (MIIV) approach to SEMs originally
proposed in Bollen (1996). It has greater robustness to structural misspecifications and the
conditions for robustness are well understood. In addition, the MIIV-2SLS estimator is
asymptotically distribution free. Furthermore, MIIV-2SLS has equation based overidentification
tests that can help pinpoint errors in specification. Beyond these features, the MIIV approach has
other desirable qualities (e.g., a new test of dimensionality). MIIV methods apply to higher order
factor analyses, categorical measures, growth curve models, and nonlinear latent variables. Finally,
it permits researchers to estimate and test only the latent variable model or any other subset of
equations. Despite these promising features, research is needed to better understand its
performance under a variety of conditions that represent real world empirical examples. This
presentation will provide an overview of this new orientation to SEMs and illustrate MIIVsem, an R
package that implements it.
Refreshment Break- 3:00-3:15
Laurel Hall Atrium

16
Concurrent paper sessions 8 Wednesday 3:15 pm – 4:45 pm
Session 8A: Advances in Mixture Modeling
Laurel Hall 301 Paper Authors
A Framework of R-squared Measures for Single-level and Multilevel
Regression Mixture Models
Jason Rights
Sonya Sterba
Methods of Covariate Inclusion in Latent Transition Analysis: A
Monte Carlo Simulation Study
Ai Ye
Jeffery Harring
Luke Rinne
Statistical Modeling of EEG Brain Mapping Data: Challenges and
Opportunities
Jay Magidson
Session 8B: Modeling Health Disparities
Laurel Hall 305 Paper Authors
Assessing Health Disparities in Intensive Longitudinal Data: Gender
Differences in Granger Causality Between Primary Care Provider
and Emergency Room Usage, Assessed with Medicaid Insurance
Claims
Emil Coman
Yinghui Duan
Daren Anderson
How to Peel Oranges into Apples: Finding Causes and Effects of
Health Disparities with Difference Scores Built by 1-on-1 Matching
Emil Coman
Helen Wu
A Review of Modern Methods of Estimating the Size of Health
Disparities
Emil Coman
Helen Wu
Session 8C: Symposium – Advances in multivariate multilevel models for cross-
sectional, longitudinal, and repeated cross-sectional data Laurel Hall 306
Symposium Authors
Estimating a Piecewise Growth Model with Longitudinal Data that
Contains Individual Mobility across Clusters
Audrey Leroux
A Cluster-level Latent Transition Model for Multivariate Multilevel
Repeated Cross Sectional Data
Katherine Masyn
Rashelle Musci
Amie Bettencourt
Albert Farrell
17
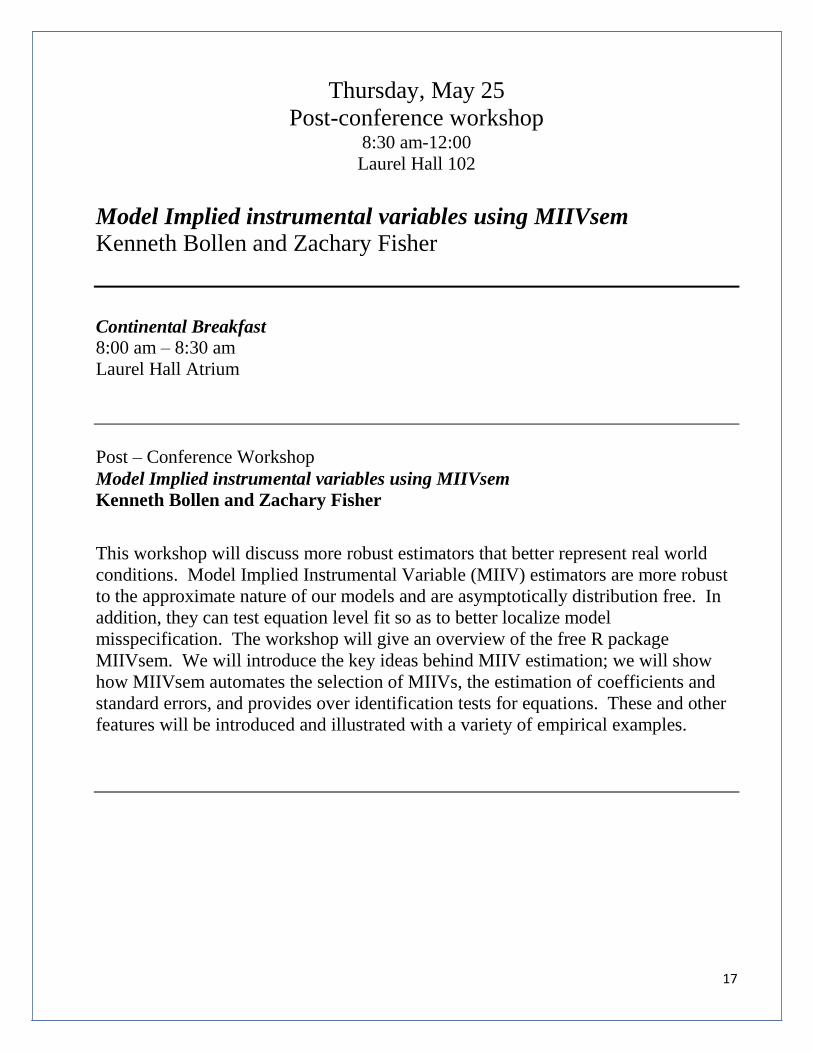
Thursday, May 25
Post-conference workshop 8:30 am-12:00
Laurel Hall 102
Model Implied instrumental variables using MIIVsem
Kenneth Bollen and Zachary Fisher
Continental Breakfast
8:00 am – 8:30 am
Laurel Hall Atrium
Post – Conference Workshop
Model Implied instrumental variables using MIIVsem
Kenneth Bollen and Zachary Fisher
This workshop will discuss more robust estimators that better represent real world
conditions. Model Implied Instrumental Variable (MIIV) estimators are more robust
to the approximate nature of our models and are asymptotically distribution free. In
addition, they can test equation level fit so as to better localize model
misspecification. The workshop will give an overview of the free R package
MIIVsem. We will introduce the key ideas behind MIIV estimation; we will show
how MIIVsem automates the selection of MIIVs, the estimation of coefficients and
standard errors, and provides over identification tests for equations. These and other
features will be introduced and illustrated with a variety of empirical examples.

18
Maps
Laurel Hall (Classroom Building) Floor Plans:
First Floor:
Laurel Hall (Classroom Building) Floor Plans:

19
Second Floor:

20
Laurel Hall (Classroom Building) Floor Plans:
Third Floor:

21
Paper Abstracts
Concurrent paper session 1 Tuesday 10:30 am – 12:00 pm
Session 1A: Mixture models are measurement models, too! Measurement invariance and
differential item functioning in latent class analysis
Chair: Katherine Masyn
Compared to the vast and ever-growing psychometric research corpus regarding measurement
invariance (MI) and differential item functioning (DIF) in the SEM and IRT spheres, there is a
relative scarcity of work addressing these issues in finite mixture modeling. To be fair, a great deal
of attention has been paid to the inclusion of covariates in latent class analysis (LCA), but without a
focus on measurement bias. To address this insufficiency in the mixture modeling literature, our
symposium brings together three papers that collectively provide a methodological framework for
conceptualizing, parameterizing, and testing for measurement invariance in latent class models.
The first paper lays the critical simulation groundwork, exploring the consequences of not
accounting for DIF in latent class models, which to-date are undocumented, un-explicated, and
unquantified. The second paper presents a multiple-group approach to parameterizing and testing
for MI in latent class models. The third and final paper presents and compares a set of sequential,
regression-based procedures for DIF detection in latent class analysis for multiple covariates on
different scales.
Paper 1. Unmodeled differential item functioning (DIF) in latent class analysis: A
Monte Carlo simulation.
Veronica Cole, Katherine Masyn, and Dan Bauer
Paper 2. Measurement invariance in multiple-group latent class analysis Katherine Masyn, Veronica Cole, and Dan Bauer
Paper 3. Regression-based approaches to DIF detection in latent class models Veronica Cole, Katherine Masyn, and Dan Bauer
Session 1B: Modeling Educational Effects
Efficacy of a Scaled-Up First Grade Reading Intervention for English Language Learners
Paulina A. Kulesz
The project examined the effectiveness (IES Goal 4 Study) of a fully developed first grade literacy
intervention in Spanish and English, with proven efficacy, when implemented directly by school
personnel across various settings and populations, and assessed the factors at the student and school
levels that moderate intervention effectiveness. Schools across four general settings (border-Texas;
suburban-Texas, suburban-Colorado; urban-California) were randomized to treatment or a business-
as-usual control. Treatment schools were given access to the researcher-developed intervention in
both English and in Spanish, but delivered the treatment themselves to the students they identified
as ‘at-risk’ and in the language chosen by the school. In many educational studies, interventions are
22
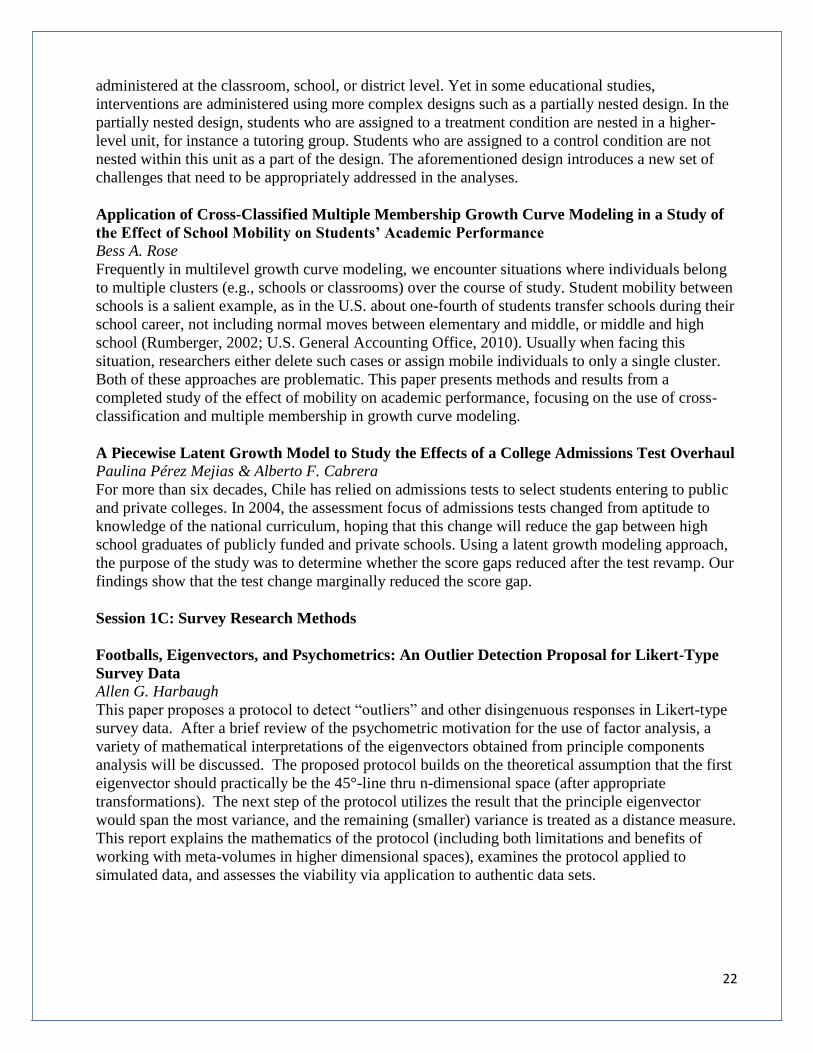
administered at the classroom, school, or district level. Yet in some educational studies,
interventions are administered using more complex designs such as a partially nested design. In the
partially nested design, students who are assigned to a treatment condition are nested in a higher-
level unit, for instance a tutoring group. Students who are assigned to a control condition are not
nested within this unit as a part of the design. The aforementioned design introduces a new set of
challenges that need to be appropriately addressed in the analyses.
Application of Cross-Classified Multiple Membership Growth Curve Modeling in a Study of
the Effect of School Mobility on Students’ Academic Performance
Bess A. Rose
Frequently in multilevel growth curve modeling, we encounter situations where individuals belong
to multiple clusters (e.g., schools or classrooms) over the course of study. Student mobility between
schools is a salient example, as in the U.S. about one-fourth of students transfer schools during their
school career, not including normal moves between elementary and middle, or middle and high
school (Rumberger, 2002; U.S. General Accounting Office, 2010). Usually when facing this
situation, researchers either delete such cases or assign mobile individuals to only a single cluster.
Both of these approaches are problematic. This paper presents methods and results from a
completed study of the effect of mobility on academic performance, focusing on the use of cross-
classification and multiple membership in growth curve modeling.
A Piecewise Latent Growth Model to Study the Effects of a College Admissions Test Overhaul
Paulina Pérez Mejias & Alberto F. Cabrera
For more than six decades, Chile has relied on admissions tests to select students entering to public
and private colleges. In 2004, the assessment focus of admissions tests changed from aptitude to
knowledge of the national curriculum, hoping that this change will reduce the gap between high
school graduates of publicly funded and private schools. Using a latent growth modeling approach,
the purpose of the study was to determine whether the score gaps reduced after the test revamp. Our
findings show that the test change marginally reduced the score gap.
Session 1C: Survey Research Methods
Footballs, Eigenvectors, and Psychometrics: An Outlier Detection Proposal for Likert-Type
Survey Data
Allen G. Harbaugh
This paper proposes a protocol to detect “outliers” and other disingenuous responses in Likert-type
survey data. After a brief review of the psychometric motivation for the use of factor analysis, a
variety of mathematical interpretations of the eigenvectors obtained from principle components
analysis will be discussed. The proposed protocol builds on the theoretical assumption that the first
eigenvector should practically be the 45°-line thru n-dimensional space (after appropriate
transformations). The next step of the protocol utilizes the result that the principle eigenvector
would span the most variance, and the remaining (smaller) variance is treated as a distance measure.
This report explains the mathematics of the protocol (including both limitations and benefits of
working with meta-volumes in higher dimensional spaces), examines the protocol applied to
simulated data, and assesses the viability via application to authentic data sets.
23
Item Response Theory and Ranking of Congressional Voting Behavior
Holmes Finch, Gregory Marchant, & Alicia Hazelwood
This study explored the use of Item Response Theory for investigating U.S. congressional voting
patterns, and compared IRT estimates of political conservatism to conservatism scores and rankings
of Congress persons provided by a political action committee, Freedom Works. It was hypothesized
that IRT would yield more informative results about voting patterns, beyond the scores established
by the group. In particular, the statistically driven methodology provides less subjective relative
congressional rankings, and yields additional information for understanding voting behavior. There
were four goals of this study: 1) To characterize congressional voting patterns using IRT, 2) To
investigate differential item functioning (DIF) by political party to identify votes that were
relatively more party based, 3) To use IRT person fit statistics to identify legislators who voted
anomalously, and 4) To compare IRT legislator rankings with those of FW. This study
demonstrated how IRT based tools, such as DIF detection, estimation of latent traits, and person fit
indices, can be used to identify ranking variables that do not behave consistently and unusual
ranked elements. With respect to this study, 3 of the 15 votes were found to exhibit high levels of
DIF between the two parties, with an additional 4 exhibiting moderate DIF. In each case where DIF
was present, the bills were easier for Republicans to endorse than for Democrats.
The use of Topic Modeling to Analyze Open-Ended Survey Items
Holmes Finch, Maria Hernandez Finch, Constance McIntosh, & Claire Braun
Social scientists frequently use questionnaires and surveys in their research, most often consisting
of Likert items consisting of a series of statements each followed by a discrete set of ordered
response options. Other item formats are available, including those for which respondents generate
their own text in response to a question or statement. Such open-ended items can be difficult to
code, but also allow for a deeper exploration of respondent attitudes than is possible with Likert
items. Two issues with using open-ended items involve challenges in quantifying responses, and
difficulties connecting open-ended responses with responses to other items on the instrument. The
goal of this study is to demonstrate the use of topic modeling (TM; Blei & Lafferty, 2009) in the
analysis of open-ended questionnaire items. Results demonstrated the utility of TM to identify
substantively meaningful topics, which could then be included in analyses involving other items,
allowing for deeper insights into respondents' attitudes and opinions.
Session 1D: Measurement and Psychometrics
The α and the ω of Congeneric Test Theory: An Extension of Reliability and Internal
Consistency to Heterogeneous Tests
Joseph F. Lucke
A decade or so ago, several authors independently proposed model-based definitions of Cronbach’s
alpha and McDonald's omega as derived from the congeneric psychometric model and its
extensions. Unfortunately, these versions of alpha and omega have not gained much traction in the
psychometric literature. The goal of this presentation is to present the model-base versions and
show how the work in applications. Using a single data set, the presentation covers these parameters
in a single factor model, a two factor model, a four factor model, a hierarchical factor model, and a
bifactor model. In each case, the presentation shows how alpha and omega can be decomposed into
single factor components, cross-factor components, and factor path components. The presentation
also reveals where alpha differs from omega.
24
Using the Nominal IRT Model for Recency of Drug Use Items
A.R.Georgeson
The present study uses the nominal item response theory model to examine items asking about
recent drug use. Such items often include separate response options for never having used a
substance and not using the substance in the time period specified in the item. As these options are
qualitatively different, the nominal model was used to determine whether these response options
were different. In modeling these data, we are also examining polysubstance use and determining
whether there is unidimensionality in use across substances. Many substance abuse measures have a
two-part structure sometimes referred to as presence-severity (Liu & Verkuilen 2013; Olsen &
Schafer, 2001). Because a number of aspects of drug use are integrated into the determination of
severity, the idea is that a question evaluating the presence of substance use will act as a filter for
other items. A presence item would ask whether or not an individual had used a particular
substance within a certain time period. Thus, if the individual endorses recent use of a particular
substance, they will receive questions pertaining to the severity of the substance use. If the
individual did not endorse recent use of the substance, they are effectively opting out of receiving
additional questions related to that item. A unique problem that applies to these presence/absence of
use items is that an individual who has not recently used a substance is essentially treated as being
the same as an individual who has never used that substance. This problem created the initial
motivation for the investigation described in this paper. What does it mean to treat individuals who
have not recently used a substance in the same way as individuals who have never used a
substance? When the construct of interest is severity of use of a particular substance, this
equivocation is probably permissible. However, we were interested in taking a more holistic look at
substance use and considering whether there is a unidimensional latent variable underlying lifetime
use of any substance compared to lifetime abstinence from every substance. Stated differently, do
individuals only use a single substance and are fully abstinent from any other substance? This
notion seems possible, but unlikely. In this project, we modeled items asking about recent substance
use using the nominal IRT model. This model allows the researcher to have uncertainty about the
order of response categories beforehand. It may also be used in cases where the response categories
might have some quantitative as well as qualitative attributes (Thissen, Cai, and Bock, 2010).
Exploring measurement invariance using CTT and IRT techniques Noela Haughton & Priti Singh Surveys offer a relatively easy and flexible approach to data collection. A key concept that is too often
overlooked is measurement invariance, i.e., the consistency of the constructs being measures across
sub groups and longitudinal situations. The purpose of this study is to explore and propose framework
for using IRT and CTT modeling techniques for validation purposes in survey research. Survey
responses were collected from college freshman (n=441) who attended a six-week university summer
bridge program. The survey’s initial design was based on a priori hypothesis of a ten factor, second-
order model of academic and social engagement. SEM and Rasch modeling techniques were carried
out using AMOS and WINSTEPS software respectively.

25
Concurrent paper session 2 1:15 pm – 2:15 pm
Session 2A: IRT Methods and Applications
A Conditional Joint Modeling Approach for Compensatory Multidimensional Item Response
Model and Response Times
Kaiwen Man, Hong Jiao, Peida Zhan, & Chi-Yu Huang
Many previous studies focused on the investigating the speed and accuracy within a uni-
dimensional IRT framework (Meyer, 2010; Thissen, 1983; van der Linden, 2008; Wang & Hanson,
2005). In this study, a conditional joint modeling approach for exploring the compensatory
multidimensional IRT and RTs was proposed. Such an approach describes the relationship between
the speediness and accuracy of a person in a multidimensional structure. In this way, the
relationship between speediness and latent construct relationship would be further investigated. The
new hierarchical model was estimated by Bayesian approach using Markov chain Monte Carlo
(MCMC). The model parameter recovery is assessed via simulation studies to investigate the
improvements of the parameter recovery for both item and latent traits parameters by joint
modelling the MIRT with RTs.
Detection of Differential Item Functioning in the Context of Clustered Data: A Comparison
Study
Graham G. Rifenbark & H. Jane Rogers
Investigations of differential item functioning (DIF) continue to be of interest and importance to
measurement practitioners. Item response theory (IRT) provides a strong theoretical framework for
DIF detection procedures; however, the multilevel linear modeling (MLM) framework provides an
alternative that has several advantages. Kamata’s (2001) multi-level formulation of IRT models
(i.e., HGLM) provides an optimal solution for not only detecting DIF items, but also for explaining
DIF via contextual effects (Williams & Beretvas, 2006). Vaughn (2006) extended the HGLM
approach for DIF detection to polytomous items and clustered response data. One of the most
widely used methods for DIF detection in practice is the Mantel-Haenszel statistic (MH; Holland &
Thayer, 1988). French and Finch (2013) investigated a multilevel extension of the MH statistic for
clustered response data. They investigated adjustments include matching with respect to a MLM
predicted matching score (Pommerich, 1995) and an augmented MH statistic that takes into account
clustering (Begg, 1999). Both of these procedures can be extended to the polytomous case (French
& Finch, 2013). The purpose of this study is to compare Type I error rates and power for the
adjusted MH statistics and the HGLM approach, estimated using a Hamiltonian Monte Carlo
routine available in the program STAN (STAN Development, 2016), in the context of polytomous
response data.
Session 2B: Mediation Models
Multimethod Moderated Mediation Analysis using a Categorical Multigroup Design
Kaylee Litson, Christian Geiser, & G. Leonard Burns
Moderated mediation analysis is a statistical tool used to examine whether the mediated effect
varies as a function of some moderating factor. Commonly, moderated mediation analyses are used
to answer questions researchers have about how and when a variable influences another variable.
Recently, researchers have begun creating statistical models to account for the measurement
structure of factors in moderated mediation analyses; specifically, researchers have created models
to control for measurement error (Cheung & Lau, 2015; Fritz et al., 2016). However, measurement

26
error is only a single aspect of a variable’s measurement structure. Another common aspect of
measurement that is common in psychological research is the method of measurement (e.g., self-
report versus other-report). The method of measurement is well-known to influence results of
statistical analyses (Podsakoff, MacKenzie, & Podsakoff, 2012), and researchers attempt to control
for such influences by measuring data using multiple methods (e.g., self-report and other-report).
However, with regards to moderated mediation analyses, no method has previously been created
which combines multimethod measurement designs with moderated mediation analyses. As such,
researchers cannot integrate all data from a multimethod design into current moderated mediation
approaches. We propose a new multimethod moderated mediation model by combining 1) a
confirmatory factor analysis multitrait-multimethod (CFA-MTMM) approach (Eid et al., 2003) with
2) a multigroup approach to moderated mediation using latent variables (Lau & Cheung, 2010). We
present an application of the new method in which child inattention was predicted to mediate the
relationship between child hyperactivity and academic impairment. Further, the mediated path was
expected to differ across the child’s biological sex, the grouping (moderating) variable. In this
application, N = 798 children were evaluated by mother and father reports across three waves. We
discuss the results and implications of the new model in more detail.
Tools for computationally efficient power and sample size determination for mediation models
Alexander M. Schoemann, Aaron J. Boulton, & Stephen D. Short
Mediation analysis has been one of the most popular statistical methods utilized by social and
behavioral researchers for decades. Current best practice recommendations for assessing power and
sample size in mediation models are to use a Monte Carlo power analysis and, preferably, to test the
indirect effect with a bootstrapped confidence interval (e.g., Zhang, 2014). Unfortunately, these
methods have rarely been adopted by researchers due to limited software options and long
computational times. We propose a new method and convenient tools for determining sample size
and power in mediation models. The method uses a randomly varying N approach to sample size
determination (Schoemann, Miller, Pornprasermanit, & Wu, 2014). In addition, our method uses
Monte Carlo confidence intervals to test the indirect effect. Monte Carlo confidence intervals
(Preacher & Selig, 2012). Combing the varying parameters approach to Monte Carlo power
simulations with Monte Carlo confidence intervals for indirect effects allows researchers to quickly
produce estimates of power and sample size that are as accurate as traditional approaches using
fixed sample sizes and bootstrap confidence intervals. We will demonstrate the accuracy of our new
method through Monte Carlo simulations and an easy-to-use Shiny application (located at
http://marlab.org/power_mediation ) that implements our method for several different mediation
models. These developments will allow researchers to quickly and easily determine power and
sample size for simple and complex mediation models.
Session 2C: Intra and Interindividual Variation Modeling
Intra and Interindividual Variation Modeling: Bayesian/Mixed-Effects Nonstationary Latent
Differential Equation Model
Mauricio Garnier-Villarreal, Pascal R. Deboeck, Davis K. Johnson, & Amber Watts
Longitudinal analysis are powerful methods to estimate change over time. The combination of
nomothetic and idiographic approaches within longitudinal analysis would allow to answer
questions related to intra and interindividual variability in one integrated method. Differential
equations modeling is a method that studies intraindividual variability as a form of continuous-time
modeling, which can be implemented as fixed-effects or mixed-effects. This research tend to extend
the Latent Differential Equation (LDE) by adding the mixed-effects, estimating subject and sample
27
parameters, including interindividual variability on parameters of interest. This model estimates
non-stationary LDE, by allowing an the model to have a linear slope; the present research estimates
the non-stationary LDE model in a mixed-effects framework, including both individual and sample
parameters, combining nomothetic and idiographic information. The inclusion of the non-stationary
slope means that the model includes short term dynamics (DE) and long term dynamics (slope). The
proposed model was tested with a simulation.
Session 2D: Modelling Composite-Based Populations Using Composite-Based Methods
Jan-Michael Becker, Edward E. Rigdon, & Arun Rai
In structural equation modeling (SEM), the method most commonly used is common factor-based:
unobserved variables like psychological attributes are represented by common factors extracted
from multiple indicators. However, soon after the birth of factor-based SEM, the first composite-
based approach, known as partial least squares (PLS) path modeling, arose. Today, the assortment
of composite-based methods includes generalized structured component analysis (GSCA) and
regularized generalized canonical correlation analysis (RGCCA). Collectively, though, composite-
based methods have a reputation for producing biased estimates of model parameters. Yet the
research behind this general conclusion has almost universally involved simulations with data
drawn from factor-based populations, where these composite-based populations are misspecified.
This research demonstrates a procedure for specifying composite-based populations and then
examines the performance of composite-based approaches to SEM in simulations based on
composite-based populations. Jöreskog (e.g., 1969) launched modern structural equation modeling
with the development of an inferential approach to structured factor modeling using maximum
likelihood (ML) estimation. In response, Jöreskog’s mentor, Wold (e.g., Jöreskog & Wold 1982)
developed a composite-based partial least squares (PLS) method for approximating factor model
results while reducing the computing and distributional assumption demands. Yet parameter
estimates tended to be biased in certain ways, as demonstrated by extensive simulation research.
Unfortunately, all of this research involved sampling for populations defined by factor models. PLS
path modeling is a composite-based method, so for simulation models to be correctly specified, they
must draw data from composite-based populations (Rigdon 2012). Moreover, in forming
expectations about the behavior of composite-based methods, researchers need to look to work on
the behavior of regression methods. Dana and Dawes (2004), for example, showed that in terms of
out-of-sample R2 (using sample based parameter estimates to predict population cases not used to
compute the estimates), ordinary least squares (OLS) regression weights only provide best
performance when sample size and true population R2 are both high. Rigdon (2012) asserted that
PLS path modeling includes one estimation approach which amounts to using OLS regression
weights while another amounts to using correlation weights, so it seems likely that the performance
of composite-based methods may vary on the same basis. Other composite-based approaches to
SEM have emerged, including Hwang and Takane’s (2004) generalized structured component
analysis (GSCA) and Tenenhaus and Tenenhaus’ (2011) regularized generalized canonical
correlation analysis (RGCCA). Critics of PLS path modeling have periodically suggested other
alternatives, including simple path analysis using unweighted composites and path analysis using
principal components. Any reassessment of composite-based methods, using correctly specified
composite-based populations, ought to include these alternatives, as well. Becker et al. (2013)
demonstrated a technique for deriving an observed variable covariance matrix consistent with a
composite-based population, though their model was a very simple one. We expand the Becker et
al. (2013) approach to specify a somewhat more complex model as a basis for our simulations.

28
Concurrent paper session 3 Tuesday 2:30 pm – 3:30 pm
Session 3A: Casual Inference
The mechanics of omitted variable bias: Bias amplification and cancellation of offsetting
biases
Yongnam Kim. & Peter M. Steiner
Causal inference using observational studies frequently requires researchers to estimate treatment
effects conditional on a set of observed covariates. The hope is that such conditioning eliminates or
at least reduces the confounding bias. The resulting bias has been referred to as the omitted variable
bias (OVB), that is, a bias left after conditioning on other covariates. Though OVB is well known
and has been extensively discussed in the methodological literature, its exact mechanics have not
yet been fully formalized, especially with respect to causal inference. Applied researchers
frequently believe that including more covariates in a regression model (or matching on more
covariates) will always reduce the confounding bias. However, recently researchers have found that
this rationale does not hold in general, that is, it is possible that conditioning on a covariate can
increase the overall bias instead of reduces it. In this paper, we formally characterize the mechanics
of omitted variable bias and investigate the conditions under which conditioning on confounders
actually increases the overall bias. We also explore how measurement error and correlation affect
OVB.
Marginal Structural Models for Estimating the Effects of Chronic Community Violence
Exposure on Youth Aggression and Depression
Traci M. Kennedy, & Edward H. Kennedy
A major limitation to modeling observational data is that causal inferences can rarely be made
confidently. Because treatments (or “exposures”) occur naturalistically and are not randomly
assigned in observational studies, it is difficult to determine the extent to which an observed or
predicted association between exposure and outcome is causal, the direction of causality, and
whether confounders play a role. Although longitudinal data are helpful to establish a sequential
ordering of phenomena, they introduce their own threats to valid causal inferences – notably, the
issue of time-dependent confounding. Such is the case when a time-varying covariate confounds the
association between a predictor and outcome, but is also a critical element of the causal pathway. In
longitudinal data, this may occur when an outcome of interest (e.g., aggression) is both a potential
consequence and cause of an exposure (e.g., community violence exposure). For instance, numerous
studies have suggested that community violence exposure (CVE) among youth is associated with
increased aggression over time (Fowler et al., 2009). However, it is well-documented that youth
aggression, in turn, can place them at risk for involvement in community violence – via gang
involvement, for example (Lynch & Cicchetti, 1998). “Desensitization” theories postulate that as
aggression increases linearly with increasing CVE, emotional symptoms, such as depression, may
follow a quadratric trend, which levels off and may decrease at the highest exposure levels,
suggesting an emotional desensitization effect (Mrug et al., 2008; Ng-Mak et al., 2004). Standard
regression techniques that adjust for the autoregressive effects of the outcomes may over-control the
effects of the exposure itself, thereby leading to biased estimates of its effect on the outcomes. Thus,
advanced modeling techniques are critically needed that permit valid causal inferences for
longitudinal, observational data. Marginal structural models (MSM; Robins et al., 2000; Robins &
Hernan, 2009) are a useful set of tools within the potential outcomes framework that help isolate
causal effects in longitudinal, observational data (Coffman & Zhong, 2012). Although this method
has been increasingly applied in medical treatment settings, it has scarcely been used to model
29
observational data in the social sciences (Bacak & Kennedy, 2015; VanderWeele et al., 2016).
MSMs model the potential outcome of an exposure that varies over time, which provides an
estimate of the exposure’s causal effect on the outcome as if individuals were randomized to receive
different levels of the exposure over time instead of selecting into exposure groups naturalistically.
The first step of an MSM application is to model the likelihood of exposure across time points,
conditioning on past data at each time point (analogous to a time-varying propensity score).
Individuals are then weighted based on their likelihood of exposure, and a simple weighted
regression model then predicts the outcome from the exposure. Essentially, a “pseudopopulation” is
created that eliminates any association between exposure and confounding covariates. Thus, a pure
causal effect can be estimated equal to what would be observed had individuals been randomly
assigned to exposure levels.
Session 3B: Probability Index Models
Probability Index Models
Jan De Neve
Latent variables are not necessarily linearly related to the observed outcome. Diffusion models, for
example, typically assume a complex non-linear but monotone relationship between the observed
reaction time and the latent drift rate (Wagenmakers et al, 2012). Questionnaire data form another
example: if participants are reluctant to express extreme feelings for social desirability reasons and
report more moderate feelings than they actually have, the relationship between the observed and
latent variable can be curvilinear instead of linear (Garcia-Marques et al., 2014). Since the exact
relationship is typically unknown but assumed to be monotone, it is desirable to have effect sizes
that are invariant under monotone transformations. One example of a monotone-invariant effect size
is the Probabilisitic Index (PI): it is the probability that one outcome exceeds another, i.e.P(Y < Y')
for two outcomes Y and Y'. The PI as an effect size has several desirable properties: 1) it is robust
to outliers and relevant for skewed distributions, 2) it is a meaningful effect size for ordinal
outcomes, 3) tests based on the PI typically have good power properties and 4) the monotone-
invariance property implies that interactions do no disappear under monotone transformations - a
problem conventional models (e.g. ANOVA) suffer from (Wagenmakers et al, 2012). The PI is
sometimes referred to as the Mann--Whitney functional since it is the parameter associated with the
nonparametric Wilcoxon--Mann--Whitney test. Recently, a new flexible class of semiparametric
regression models, called Probabilistic Index Models (PIMs, Thas et al., 2012, De Neve and Thas,
2015), has been developed to model the PI as a function of covariates in a regression context. In this
presentation we introduce the PIM by examples and summarize the most important aspects of the
estimation theory. We illustrate the similarities and differences with the conventional linear
regression model and the Cox proportional hazards model. We further demonstrate how well known
rank tests, such as the Wilcoxon-Mann-Whitney and Kruskal-Wallis test can be embedded in a
PIM. In addition to hypotheses testing, the method allows for the estimation of meaningful effect
sizes, resulting in a better understanding of the data. We illustrate the methodology using the R
package pim. This talk is largely based on Thas et al. (2012) and De Neve & Thas (2015).
Session 3C: Bayesian Single Case Models
Bayesian Testing in Single-Case Research: A Forward Paradigm Shift
Tyler Hicks, Jason Travers, & Leslie Bross
This paper offers a rationale for a Bayesian approach to model selection in single-case research. We
argue that Bayesian testing has a special relevance for single-case research because the logic of a

30
Bayesian model selection pivots on Bayes’ rule rather than asymptotic considerations (e.g., error
control in the limits). As the main tool of Bayesian analysis, the rule shows how rational agents
modify beliefs given evidence. One major obstacle to the adoption of Bayesian testing in single-
case research is a lack of direction and software. We provide a SAS program and practical guidance
through examples that illustrate the proposed methods.
Design-comparable effect sizes for Single-Case Research: A Bayesian Approach
Tyler Hicks, Eun Sook Kim, Seang-Hwane Joo, Jeong Hoon Choi, John Ferron, & Jeff Kromrey
Ambiguity remains about how to proceed when a search of literature returns both single-case and
group research. Pustejovsky, Hedges, and Shadish (2014) have articulated a general modeling
framework to compute an effect size comparable across designs. Yet, recovering the parameters
needed to construct this effect size can be challenging with traditional estimation procedures. We
offer a tutorial on estimating these parameters using a Bayesian approach. We then perform a
simulation study to compare traditional frequentist and Bayesian estimation approaches.
Session 3D: Modeling Change
Variance Estimation of Health Disparity Measures in Complex Survey Settings
Meng Qui
Health disparities (HD) refer to differences in the health status across different racial, ethnic, and
socioeconomic groups (Keppel K, Pamuk E, Lynch J, et al., 2005). Great effort has been made to
identify and address the factors that lead to health disparities and many summary indices (e.g.,
Concentration Index) have been developed to measure the extent of health disparities. Early
methodological work assumed that data were obtained through simple random sampling (SRS),
with each individual having an equal probability of being included in the sample (Chen & Roy,
2009). For large, nationally representative health surveys, however, complex sampling designs are
often employed to select the sample, involving stratification, multistage clustering, or both.
Research on methods of incorporating design features is burgeoning, but the scale is still sporadic
and ad-hoc. This study proposed a variance estimation method, focusing on the widely used
Relative Concentration Index (RCI) (Kakwani, Wagstaff, and Doorslaer, 1997), by calculating the
Taylor deviates which incorporate the complex sample design features. This approach can be easily
applied on other similar HD summary measures. Simulation studies demonstrate the impact of
design features on estimating the point and variance of RCI.
Affective Red Zones: An Examination of Bivariate Change in Content
Joel Steele, David Sbarra, Emilio Ferrer
This work focuses on individual behaviors that are dependent on a context that is ephemeral yet
recurrent. The focus is on ratings of affect from individuals in romantic relationships over time. By
temporally identifying ostensible markers of poor relationship functioning, this work aims to
understand the correlates and eventual impacts of interindividual differences in affective change
that are related to these episodes. The term Red Zone is used to indicate these episodes and three
geometrically based measures are introduced to quantify bivariate changes in affect related to a Red
Zone traversal. Variance in these measures are used to model two distal indicators of relationship
functioning, relationship satisfaction and potential dissolution.

31
Concurrent paper session 4 Tuesday 3:45 pm – 4:45 pm
Session 4A: Applications of Multilevel models with Latent Variables to K-12 Educational
Leadership and Policy Research
In this symposium the authors will present three research studies that apply multilevel analysis with
latent variables to current issues within K-12 educational leadership and policy. The session will
first open with a brief overview of research concerns within leadership and policy of K-12 schools
that are addressed through the application of multilevel models: factor analysis, growth, and
structural equation models. The session includes three studies as an application for each: 1) to
investigate different levels of leadership for learning between teachers individually and collectively
using multilevel factor analysis; 2) to identify school districts as research sites based on
effectiveness using hierarchical longitudinal growth models; 3) and to test the relationships between
school leadership, school supports and instruction on a student’s opportunity to learn math using a
multilevel structural equation model. The session will then end with a participatory discussion
between the authors and the audience on novel applications of multilevel models with latent
variables to current issues in K-12 education practice and policy.
Paper 1. Different levels of leadership for learning: Investigating differences between teachers
individually and collectively using multilevel factor analysis of the 2011-12 Schools and
Staffing Survey
Jared Boyce & Alex J. Bowers
Paper 2. Site section in school district research: A measure of effectiveness using hierarchical
longitudinal growth models of performance
Alex J. Bowers
Paper 3. Feasibility of increasing access: How does instructional leadership influence
opportunity to learn in U.S. and Belgium?
Angela Urick, Alison Wilson, & Timothy G. Ford
Session 4B: Longitudinal and Multilevel SEM
Estimating latent trends in multivariate longitudinal data via Parafac2 with functional and
structural constraints
Nathaniel E. Helwig
Longitudinal data are inherently multimode in the sense that such data are often collected across
multiple modes of variation, e.g., time x variables x subjects. In many longitudinal studies, multiple
variables are collected to measure some latent construct(s) of interest. In such cases, the goal is to
understand temporal trends in the latent variables, as well as individual differences in the trends.
Multimode component analysis models provide a powerful framework for discovering latent trends
in longitudinal data. However, classic implementations of multimode models do not take into
consideration functional information (i.e., the temporal sequence of the collected data) or structural
information (i.e., which variables load onto which latent factors) about the study design. In this
paper, we reveal how functional and structural constraints can be imposed in multimode models
(Parafac and Parafac2) in order to elucidate trends in longitudinal data. As a motivating example,
we consider a longitudinal study on per capita alcohol consumption trends conducted from 1970-
2013 by the U.S. National Institute on Alcohol Abuse and Alcoholism. We demonstrate how
functional and structural information about the study design can be incorporated into the Parafac
and Parafac2 alternating least squares algorithms to understand temporal and regional trends in
32
three latent constructs: beer consumption, spirits consumption, and wine consumption. Our results
reveal that Americans consume more than the recommended amount of alcohol, and total alcohol
consumption trends show no signs of decreasing in the last decade.
Toward multilevel structural equation modeling with latent quadratic effects
Joshua Pritikin
Rampart can efficiently model data gathered at many different levels. For example, a single data set
may contain measurements by time (lowest level), by student, by teacher, by school, and by district
(highest level). An extension that permits latent quadratic terms (i.e. interactions or random slopes)
is described.
Session 4C: Power, GI, & Effect Sizes
The illusion of intended statistical power: Avoiding underpowered replication studies via
effective sample size planning
Samantha Anderson, Scott Maxwell, Ken Kelley
Planning an appropriate sample size for an adequately powered study often requires specifying a
population value of the effect size, which is, by definition, unknown. A common sample size
planning approach circumvents this unknown parameter by using the observed effect size estimate
from a previously published study as an approximation of the likely effect size for the planned
study. Although this strategy is intuitively appealing, observed effect size estimates at face value are
typically not accurate estimates of the population effect size, due to publication bias and
uncertainty. We first show sample size planning that takes a sample effect size at face value often
results in underpowered studies, sometimes to a startling degree. We then present an alternative
approach that corrects sample effect size estimates for bias and uncertainty, and we demonstrate its
effectiveness for several experimental designs. Finally, we provide an R package and show how this
approach can be applied in practice.
Using Aggregate Unit Pre/Post Assessment Results Across Classrooms: A Monte Carlo Study
Proof of Concept in Program Evaluation
Matthew Lavery
Teachers often use assessment instruments in their classrooms from various sources, including
teacher-made tests, with unknown psychometric properties. While an individual teacher may use
such assessments in a pre/post design to measure student learning gains, reflect on teaching, and
evaluate the quality of an instructional unit, it is uncertain whether or how these data could be used
to inform program improvement or evaluation across classrooms or across schools. The present
study uses a multilevel Monte Carlo simulation study to evaluate the use of unit pre/post assessment
data aggregated across classrooms to investigate the impact of programs designed to improve
teachers’ instructional effectiveness with specific subgroups of students. Based on simulation
findings, guidelines are presented for a priori power analyses for level-1 and level-2 effects as well
as for cross level interaction effects. This analytical approach is then demonstrated by analyzing a
non-simulated data set of N = 6812 K-12 students taught by N = 244 teacher candidates during
student teaching in order to evaluate a differentiated ESOL teacher preparation program.

33
Session 4D: Suppression / Non-Monotonic Effects
Suppression Effects in Regression: The Case of Learning Strategies and Academic
Achievement
Eric Loken, & Xiaowen Liu
Suppressor effects in regression occur when coefficients behave inconsistently as more predictors
are added to the model. In a typical regression model, as new predictors are added to the model the
unique contribution of the predictors tends to diminish and the slopes attenuate towards zero.
However, in some cases the slopes increase or switch sign in the presence of new predictors, and it
is even possible for the multiple R-square for a model to be greater than the sum of the bivariate
squared correlations. A common reaction when this occurs is to cast doubt on the model,
sometimes dismissing the result as “just a suppressor effect”. There is a history in statistics and
social science of trying to understand more about the conditions that give rise to suppressor effects.
The first part of our paper will further explore suppression using the eigenvector decomposition of
the predictor matrix. For example, the eigenvector structure that leads to suppression is common in
longitudinal research. Often measures at two time points correlated highly, as might be the case for
two repeated measures of academic achievement or weight status or other measures with high
stability. But if an outcome is predicted to be associated with change from time 1 to time 2, then it
will be correlated with a contrast that reflects the second eigenvector of the predictor correlations.
We will explore the consequences of this for unbiased estimates of correlates with change. We will
also use this framework to explore whether suppression effects might contribute to false-positives
and biased effect size estimates in models with two and more predictors. The second part of our
paper focuses on one specific example that is emerging in educational psychology.
A New Model for Non-Monotonic Effects
David Weakliem
Non-monotonic effects are often of interest in the social sciences. The standard way to model such
effects is with a model including x and its square as independent variables, but this model imposes
some important restrictions: the implied relationship between x and y is symmetrical, and changes
in predicted values are proportional to the square of the distance from the maximum/minimum
value of x. The usual way to extend the quadratic model is with polynomials of a higher degree, but
the parameters are difficult to interpret. This research proposes an alternative model which extends
the quadratic regression model by including two additional parameters that can be interpreted as
representing skewness and “peakedness.” The model also suggests a simple specification test for
the adequacy of quadratic model. The extended model can be fitted by non-linear regression--
macros in several popular statistics programs will be shown. The paper will give several examples
of fitting and interpreting this model, and conclude by suggesting several possible extensions.
Concurrent paper session 5 Wednesday 8:00 am – 9:00 am
Session 5A: Symposium: Consideration When Utilizing Indicators to Evaluate Latent – Level
Differences across Time and Groups
The issue of measurement invariance is important to any research where the same measurement
model is used across time or groups. When the goal is to make latent level comparisons, the
assumption of measurement invariance must hold. The main objective of this symposium is to
demonstrate the consequences of violating the assumptions of measurement invariance when

34
making cross-group and occasion comparisons. First, we present a review and application of how to
evaluate different levels of factorial invariance (i.e., configural, weak, strong, and strict) using
empirical longitudinal data and illustrate how a construct’s latent trajectory can be assessed from
multiple indicators at each time point using a second-order latent growth model—i.e., the Curve of
Factors model. Second, we examine the convention of using a “sufficiently high” internal
consistency estimate to justify creating composite variables to model change over time, but not
establishing factorial invariance. Specifically, using simulated longitudinal, multivariate data, we
demonstrate how failure to achieve factorial invariance can result in parameter estimate
discrepancies of mean change over time when using latent growth models. Finally, via simulation
study, we demonstrate how misspecification of the referent indicator affects the estimation of model
parameters, as well as the detection of measurement invariance.
Paper 1. Longitudinal Factorial Invariance: Measuring and Modeling the Same
Construct Over Time Marilu Isiordia
Paper 2. Implications of Establishing Internal Consistency but Not Factorial
Invariance on Growth Model Parameters Marilu Isiordia
Session 5B: Dealing with Non- Normality
Effects of Non-normality of Residuals in Hierarchical Linear Modeling
Kaiwen Man, Yating Zheng, Laura Stapleton
Multilevel modeling (MLM) has become more and more popular in social science research.
However, most of the data in reality do not perfectly satisfy all the assumptions that are required
when implementing multilevel models. One major assumption of the multi-level model is that of
normality of the error distributions, at both the individual level and group level. Previous research
has explored the effects of the violation of the normality assumption at the higher level(s) and has
found that the estimates of the standard errors of the parameters are downward biased (van der
Leeden & Busing, 1994; Verbeke & Lesaffre, 1997; Mass & Hox, 2003). Few studies, however,
have explored the effects of the violation of this assumption at the lowest level of the model. In this
study, the effects of the breach of the normality assumption at both individual and group levels were
explored with both normal (e.g. number of clusters is 50) and small number of clusters (e.g. number
of clusters is 30). Specifically, the following research questions are addressed:1.What effects does
the violation of the normality assumption, at both individual and group levels, have on the estimates
of the fixed effects and random effects?) 2. Is any effect of a violation of the normality assumption
moderated by the number of clusters, especially with a small number of clusters?
Evaluation of Supplemental Samples in Longitudinal Research with Non-normal Missing
Date
Jessica Mazen
Although methodological articles provide advice on ways to handle missing data at the analysis
stage, there is less guidance for researchers who wish to use supplemental samples (i.e., the addition
of participants after the first measurement occasion) to handle attrition. Despite the lack of research
investigating the effects of using this approach on parameter estimates, supplemental samples have
been used in numerous studies in the field of psychology and beyond including multiple large-scale
studies. The purpose of this study is to explore the benefits and limitations of supplemental samples
in evaluating longitudinal data that is non-normally distributed. We distinguish between two
supplemental approaches: a refreshment approach where researchers select additional participants
35
using the same criteria as the initial participants (i.e., random selection from the population of
interest) and a replacement approach where researchers first identify auxiliary variables that explain
missingness and then select new participants based on those attributes. We compare the two types
of supplemental approaches in analyzing missing completely at random and missing at random data
in longitudinal research. By focusing on a linear growth curve model with a covariate, nine possible
influential factors are studied: distribution of the population, missing data mechanism, supplemental
sample type, missing data rate, sample size, number of measurement occasions, correlation between
the latent slope and auxiliary variable, variance of measurement errors, and the size and timing of
the supplemental samples. Overall, 7152 conditions of simulations are considered. For each
condition, a total of 500 data sets are generated and analyzed using a two-stage procedure for robust
structural equation modeling with missing data (Yuan & Zhang, 2012). The estimate of interest is
the population mean slope parameter and the impact of adding refreshment and replacement
samples is assessed using the degree of bias, mean square error, confidence interval width, and
power. Results show that, in general, patterns of bias were similar for different distributions. As
expected, the listwise deletion method yielded high rates of bias in the MAR conditions, but in
MCAR conditions this method resulted in bias comparable to complete data. Indeed, bias was low
for all MCAR conditions including all supplemental sample conditions. However, when the missing
data mechanism was MAR, the pattern of bias was strongly influenced by the supplemental sample
approach. When a refreshment approach was used, bias was low across conditions, whereas when a
replacement approach was used, bias was high across all conditions. As with bias, the results for
power were comparable across the various distributions. In general, power was high (at or above .8)
across most conditions. However, some patterns did emerge. For instance, when the missing rate
was low, power was similar across conditions, whereas when the missing rate was high (e.g., .15)
power differed depending on how the missing data was handled. Overall, results suggest that the
addition of refreshment samples, but not replacement samples, is an effective way to respond to
attrition in longitudinal research.
Session 5C: Evaluating Balance for Casual Inference
Evaluating Balance for Causal Inference: An Illustration of the cobalt Package in R
Noah Griefer
Covariate balance is the sine qua non of counterfactual causal inference research using preprocessing
methods such as propensity scores. Although many simulations and theoretical proofs exist to
demonstrate the unbiasedness of various preprocessing methods, in practice a researcher must
evaluate the results of their applied preprocessing implementation to determine whether to proceed
with a given method or to try again. For example, generalized boosted modeling has empirically been
shown to be very effective at generating propensity score weights in the face of outcome model
uncertainty, but for any given data set, a variety of other methods, including weighting with
propensity scores estimated from simple logistic regression, may be more effective at reducing
dependence between treatment and potential confounders. Because, ideally, the outcome data has not
been included in preprocessing analysis, the researcher can re-specify their conditioning model and
assess balance to guarantee the assumption of conditional independence on observed confounders has
been met. In addition, demonstrating covariate balance to consumers of causal research is key to
developing confidence that the obtained results are not a result of the researcher’s manipulation of
the model to attain a desired result, but rather valid results meeting the required assumption of
conditional independence. To satisfy the dual requirements of balance assessment—to assess a
preprocessing method and to demonstrate to readers that assumptions have been met—a variety of
tools should be used to assure balance is attained. Historically, these have included quantitative

36
measures of dependence such as mean differences, hypothesis tests, and correlations, as well as
qualitative measures such as Q-Q plots, probability density graphs, and histograms. Though assessing
balance is essentially assessing the adequacy of a preprocessing model, balance itself must be
modeled. Approaches to modeling balance have been the subject of a fair amount of research in recent
years, but have received far less attention than estimation and conditioning methods in the
methodological literature, despite the importance of balance assessment to making and defending
causal claims. For causal research with preprocessing analysis, R is the preferred tool because of its
flexibility, transparency, and support for rapid innovation and dissemination of new methods. Some
of the most popular R packages for preprocessing include the Matching, MatchIt, and twang packages,
which collectively implement various methods of matching, sub-classification, and weighting for
causal inference. Recently, the CBPS and ebal packages, which implement covariate balancing
propensity scores and entropy balancing, respectively, are growing in popularity. All of these
packages contain either estimation or conditioning methods and (with the exception of ebal) methods
for balance assessment. Across packages, there is much variation in how balance is modeled and
reported; no two packages present exactly the same statistics or graphics, and there is no consensus
on how balance statistics are calculated. Because of this, it is difficult to compare conditioning
methods across packages or even to be confident that the results from one package are valid with
respect to others. In addition, packages are rarely if ever updated with balance diagnostic measures
that align with current research on balance assessment. To solve these issues (and others), we present
the cobalt package, a tool that integrates with all the above packages to provide a unified balance
assessment that responds to contemporary research on methodological innovations and best practices.
Cobalt is both flexible and intuitive, with many user options for customizable output and intelligent
defaults for quick assessment. Users can control which balance statistics and data summaries are
displayed and how specific calculations are performed. Included are both quantitative and qualitative
methods for balance assessment and tools for visualization, such as the popular Love plot displaying
covariate balance, which is not included in any of the conditioning packages named above. In addition
to assessing the balance of output from the packages mentioned above, cobalt can assess balance on
data processed outside any of these packages, allowing researchers who manually match, stratify, or
generate weights to assess balance on their data. As preprocessing methods mature and expand to
solve different problems in data analysis, they demand more sophisticated tools to remain accessible
to researchers. cobalt has capabilities to assess balance in clustered data (e.g., students within
schools), moderated data (e.g., moderated by race), and multiply imputed data, making it the first
package to do so despite the burgeoning ubiquity of these data scenarios. Here, we introduce cobalt’s
capabilities in a variety of data scenarios, comparing and contrasting them with those of the balance
assessment tools of popular preprocessing packages. We provide a demonstration of the current best
practices in balance assessment and how cobalt accomplishes them with minimal effort on the part of
the analyst. Finally, we demonstrate an applied use of cobalt to evaluate balance.
Concurrent paper session 6 Wednesday 9:15 am – 10:45 am
Session 6A: Workshop: Multiple Imputation for Multilevel Data (Part I)
Craig Enders
(Please note: this is a double session which runs 9:15-12:30.)
Multiple imputation has been widely available for many years, but classic imputation routines are
inappropriate for multilevel data because they ignore clustering and generate imputations from a
model that assumes zero intraclass correlations. Joint modeling (JM) and fully conditional

37
specification (FCS) are the principal imputation frameworks for single-level data, and both have
multilevel counterparts. The multilevel versions of JM and FCS apply different underlying models,
and software packages offer different functionality. The JM and FCS tools that researchers currently
have at their disposal work well for very specific tasks, but these methods are generally not
equipped to handle a wide range of complexities that are typical of behavioral science data. The
Blimp application for Mac OS and Windows was developed to address a range of scenarios that are
difficult or impossible to handle with existing software. In particular, the FCS machinery
implemented in Blimp can accommodate random slopes, nominal and ordinal variables, unique
within- and between-cluster covariance structures, heterogeneous within-cluster variance structures,
and models with up to three levels, with missing data at any level of the data hierarchy. An
imputation model that implements any combination of these features can be specified with a simple
command language or through the graphical user interface. The session will provide attendees with
a broad overview of multilevel imputation, followed by a specific discussion of the FCS
methodologies implemented in Blimp. The presentation will include a mixture of theoretical and
applied topics and will include a software demonstration that illustrates the use of Blimp with
popular analysis programs such as Mplus, R, SAS, and SPSS. The Blimp software, documentation,
and various analysis scripts are available for download at www.appliedmissingdata.com/multilevel-
imputation.html .
Session 6B: Graphical Methods for Understanding SEM Model
Graphical Methods for Understanding SEM Model
Keke Lai, Samuel Green, Roy Levy
When structural equation models are not equivalent or nested, they may still have similar fit across a
wide range of data. In this paper we propose a framework to study the similarity between SEM
models. This framework can help researchers (a) identify the characteristics in data or model
parameters that lead to similarity in fit; (b) explain specifically how those key elements affect model
similarity. The first part of the framework is a new method to span the data space (i.e., generate
covariance matrices) where two given models tend to exhibit a certain pattern of fit difference (e.g.,
similar fit, similarly well fit, etc.). The two models and the pattern of fit difference are specified by
the researcher. The second part of the framework involves using graphical methods to study the
similarity between the two models with respect to the data space of interest. The graphical approaches
allow researchers not only to describe the relationship between models, but also why and how they
are similar or dissimilar.
Session 6C: What the Dutch can do with prior information (and you too)
Bayes is growing in all disciplines! This is one of the results found by van de Schoot, Winter, Ryan,
Zondervan-Zwijnenburg and Depaoli (in press) in an extensive systematic review. There are many
different reasons why one might choose to use Bayes (e.g., the use of priors, estimating otherwise
intractable models, modeling uncertainty, etc.). They found in this review that the use of Bayes has
increased and broadened in the sense that this methodology can be used in a flexible manner to tackle
many different forms of questions. In this symposium we will show a broad range topics that can be
tackled by using prior information. We start off with an evaluation of Bayesian estimation for small
sample problems, when is it a solution and what are some pitfalls? Thereafter we discuss a new
method to judge experts based on their elicited prior beliefs. To provide proof of concept an
application is presented ranking regional directors in a large financial institution. To conclude, an

38
innovative way of testing replication of hypothesis using prior predictive p-values is presented and
illustrated. Online tools are made available so that you too can start using this method.
Paper 1. Bayesian Structural Equation Models with Small Samples
Sanne Smid, Dan McNeish, Rens van de Schoot
Paper 2. Using the Data Agreement Criterion to Rank Experts’ Beliefs
Duco Veen, Diedrick Stoel, Rens van de Schoot
Paper 3. Testing ANOVA replications by means of the prior predictive p-value
Mariëlle Zondervan-Zwijnenburg, Rens van de Schoot, Herbert Hoijtink
Session 6D: Dyadic, Social Network, and Social Relations Models
Applying Modern Methods for Missing Data Analysis to the Social Relations Model
Terrence Jorgensen
To account for missing person-level or dyad-level data in the Social Relations Model (SRM), I
illustrate how to incorporate partially observed covariates as either auxiliary variables or substantive
predictors. I apply the method to network data about peer perceptions of body preoccupation among
162 sorority members, only 90 of whom provided self-reports of body preoccupation to use as
covariates. I use Bayesian estimation to fit the SRM as a cross-classified multilevel model (dyads
nested within perceivers and targets), in which the cross-classified effects are correlated (i.e.,
perceivers and targets were the same group of women), treating random effects and missing data as
parameters (i.e., data augmentation). I conclude with simulation results to verify the validity of the
method.
Modeling Parent’s Reports of Children’s Gender-Types Behavior over Time with an
Indistinguishable Dyads Common Fate Growth Model
Randi Garcia, Abbie Goldberg
The current longitudinal study examined patterns and predictors of parent-reported gender-typed play
behavior in adopted boys and girls in lesbian, gay, and heterosexual two-parent families, across early
childhood (Mage = 2.82 to 6.06 years). Specifically, using a sample of 181 couples (56 lesbian
couples, 48 gay male couples, and 77 heterosexual couples), we examined parent reports of children’s
gender-typed play behavior on the Pre-School Activities Inventory (PSAI; Golombok & Rust, 1993)
at three time points (mean age = 2.82 years at T1, 3.93 years at T2, and 6.06 years at T3). Family
structure variables (i.e., parents’ gender and sexual orientation; children’s gender and sibling status)
were included as predictors. At T1, according to parent reports, children in lesbian-parent families
had less gender-differentiated behavior (boys were less masculine, girls were less feminine) than
children in heterosexual- and gay-parent families, whereas the degree of gender differentiation did
not differ between heterosexual- versus gay-parent families. Findings from a Common Fate Growth
Model (Ledermann & Macho, 2014) revealed that, regardless of family type, the parent-reported
gender-typed behavior of boys, but not girls, significantly changed over time (i.e., boys’ behavior
became more masculine). Our findings have implications for researchers who study gender
development in children and adolescents, particularly those who are being raised by two mothers or
two fathers.

39
Teacher Social Network Change over Time: How do Longitudinal Modeling Approaches
Compare?
Elizabeth Dietrich, Nathan Abe, Elizabeth Sanders, Jessica Thompson
Social network analyses appearing in educational research is often limited to descriptive, rather than
model-based methods. Further, when model-based methods are employed for educational data, they
are usually limited to single timepoint models. The present study fills this gap by applying and
comparing major modeling techniques for estimating social network change over time within the
context of educational research. We use real data from a three-year study of a science teacher network
of N = 55 teachers located in a diverse public school district in which 68% of its students receive free
or reduced lunch. Our applied research interest is whether network characteristics change (for the
better) over time, and whether there were teacher characteristics that predicted change. Our
methodological research question is focused on comparing approaches to estimating network change
over time. Modeling approaches include the temporal random exponential graph model (TERGM),
the stochastic actor-oriented model (SAOM), as well as a 2-step approach using ERGM estimates +
multilevel modeling. Estimates of parameters, goodness-of-fit, and out-of-sample fit, as well as
practical considerations will be compared across approaches.
Concurrent paper session 7 Wednesday 11:00 am – 12:30 pm
Session 7A: Recent Advances in Regression Modeling with Complex Real-World Data
In many fields of science and technology, the amount of data being collected is growing at an
exponential rate, and so too is the complexity of the data. As data driven techniques are becoming
more popular, new and interesting data structures are being discovered that present new and unique
problems. In this ever expanding world of Big Data, we are faced with the challenge of trading off
the efficiency/scalability in computation and the accuracy/stability in modeling, which has been
reshaping statistical thinking and pushing a genuine refinement and expansion of the classical
statistical toolbox. Especially with the different forms data can take and the intrinsic multivariate
nature of these problems, how to achieve stable and scalable computation has been extremely
challenging. This symposia thus focuses on the state-of-art developments in multivariable regression
modeling with complex data structures. Some specific topics include finite mixture modeling with
censored and heavy tailed data, reduced rank estimation for mixed-responses with incomplete data,
and stagewise regression with interaction terms for correlated data. Without a doubt, these cutting-
edge works will be of great interest to our community and help make complex data a little simpler.
Paper 1. Robust Finite Mixture Modeling of Censored Data Using the Multivariate
Student-t Distribution
Victor Lachos
Paper 2. Leveraging Mixed and Incomplete Outcomes via a Mixed-Response Reduced
Rank Regression
Kun Chen
Paper 3. Efficient Stagewise Regression for Correlated Data with Interaction Selection
Gregory Vaughan
40
Session 7B: Dynamic Methods for Multivariate Data Analyses
Guided by advances in dynamical systems theories and longitudinal modeling, this symposium
features five papers that illustrate how dynamic, multivariate approaches are being used to advance
theoretical conceptions of and analytic possibilities for the study of social, emotional, and
developmental processes. The first paper utilizes unified structural equation modeling to construct a
multivariate EMA time-series as person-specific network, and then use network statistics to link to
person-level characteristics. Highlighting a hybrid method that aims to inform meta-theory that
human development as a product of dynamic processes across multiple domain and on multiple time-
scales. The second paper demonstrates the utility of a differential equation modeling approach for
studying how the dynamics of co-regulation change with age. Fishery management is used as an
analogy for examining mothers’ management of infants’ crying (i.e. fish harvesting). The analysis
illustrates how changes in infants' self-regulation and mothers' efficiency of soothing (co-regulation)
can be captured using a "harvesting" model. The third paper models longitudinal heart rate variability
measures from mother-infant dyads in the Strange Situation paradigm using windowed-cross
correlations and peak-picking algorithms to produce a graphical representation of synchrony between
mother and infant. The dynamic relations between mother and infant are dissected for each episode
of the Strange Situation. The fourth paper compares and contrasts two measures of synchrony via
Recurrence Quantification Analysis (RQA) and Windowed Cross Correlation (WCC). Applying the
windowing method from WCC to the metrics calculated by RQA, Windowed Recurrence
Quantification Analysis highlights changes in within-person/dyad processes and provides a more
refined examination of change over time. Fifth, spectral coherence is a method of assessing similarity
between frequencies of two time-series but it is inadequate when time series are nonstationary. We
propose a windowed spectral coherence method for assessing nonstationary time series. We describe
this method using behavioral data, and physiological models. Overall, this symposium highlights how
study designs and analytic methods facilitate the articulation, testing, and refinement of theory, the
limitations embedded in the designs and procedures, and promising future extensions.
Paper 1. Individual as Dynamic Networks: Merging of Intraindividual variability,
Network Analysis and Experience Sampling
Xiao Yang, Nilam Ram, Scott Gest, David Lydon-Staley, David Conroy, Aaron Pincus, Peter
Molenaar
Paper 2. Capturing Developmental Change in Regulation Processes using Dynamic
Systems Models: Borrowing Differential Equations from Ecology
Lizbeth Benson, Nilam Ram, Jonathan Helm, Cynthia Stifter
Paper 3. A Dynamic Model of Heart Rate Synchrony of Mother-Child Dyads in the
Strange Situation
Gustav Sjobeck, Steven Boker
Paper 4. Windowed Recurrence Quantification for the Analysis of Dynamical Systems
Allison Gray, Timothy Brick
Paper 5. Windowed Spectral Coherence: A Method of Cross-Spectral Coherence
Between Nonstationary Time Series at Multiple Time-Lags
Robert G. Moulder
41
Session 7C: Educational & Developmental Applications
Self-Regulatory Climate Measures
Mwarumba Mwavita, Kathy Curry
Schools face a multitude of challenges that affect student performance. Social conditions such as
poverty, violence, limited teaching capacity, and limited parent-school interactions (Boykin &
Noguera, 2011; Darling-Hammond, 2010; Diamond & Spillaine, 2004; Guin, 2004), conditions often
prevalent in high poverty environments, inhibit student ability to fulfill their educational potential
(Adams, Forsyth, Dollarhide, Miskell, & Ware, 2009; Bevel & Mitchell, 2012; Diamond & Spillane,
2004). The effects of these conditions are often highlighted in research centered on the urban school
setting (Diamond & Spillane, 2004; Guin, 2004) painting a bleak picture for the future of urban
students. Therefore, attention is needed to understand school conditions that can mitigate negative
effects of urban conditions and enhance student performance. In order to gain an understanding of the
relationship between student perceptions of school conditions (i.e., self-regulatory climate) that can
mitigate barriers to learning, we examined the relationship between self-regulatory climate and
student grit. We used multilevel modeling to explore the relationship.
Confirming the Factor Structure of the Critical Thinking Assessment Test: A Bayesian
Confirmatory Factor Analytic Approach
Chi Hang Bryan Au, Allison Ames
This study seeks to empirically confirm a critical thinking instrument's purported factor structure in
a confirmatory factor analysis (CFA) framework. Conventional Maximum Likelihood (ML)
estimation encountered difficulties in estimation due to several features of the instrument (e.g.,
multidimensionality of the items and an inconsistent scoring scheme leading to adoption of the
Bayesian Structural Equation Modeling (BSEM) approach.
Longitudinal Studies on Night Sleep Trajectories throughout Infancy
Shaun Goh, Daniel Goh, Teoh Oon Hoe, Seang Mei Saw, Fabian Yap, Yap Seng Chong, Anqi Qiu,
Birit Brokeman
Longitudinal studies on night sleep trajectories throughout infancy are sparse. Moreover, most studies
examined Caucasian samples, while cultural differences in sleep habits have been described. To
expand on the current literature, here we aim to determine night sleep trajectories in an Asian
population from age 3-24 months. Latent growth curve analyses were run in Mplus version 7.3, using
night sleep data from each infant (n = 893) at each time point to estimate the trajectory which
represents the change in level of night sleep across 3 to 24 months. We established a trajectory of
night sleep that was valid by modelling different latent growth curves and assessing them on a series
of fit indices from simpler, more parsimonious models to more complex, less parsimonious ones. A
piecewise latent growth curve model with two freely estimated/basis curves was retained as the best
fitting model. This model was not a precise fit of the data (Chi-square test of model fit = 18.01, df =
9, p<.05) but nonetheless was of close fit as shown by low RMSEA, CFI, TLI and SMRM values
(0.03, 90% CI 0.01 to 0.06; 0.97, 0.95, 0.04). The first curvilinear curve was estimated across 3 to 12
months, with an average increase of 0.12 hours of sleep per month. The second curvilinear curve was
estimated across 12 to 24 months, with an average increase of 0.02 hours of sleep per month. There
is an overall increase in the night sleep trajectory in this South-East Asian sample, which is indeed
different from existing Western samples (Zurich, Quebec). This difference in sleep trajectory after
the first year may be due to societal differences in bedtime routines, parental sleep-settling behaviors
and parental perception of sleep problems that have been attributed to influencing night sleep

42
duration, while sleep duration during the first year is more driven by biological factors such as brain
maturation of circadian networks or genetic factors. Data from this study may be helpful in informing
sleep medicine guidelines in Singapore and possibly other predominantly Asian countries on the
average sleep trajectory within infants from 3 to 24 months. It is especially useful for clinicians and
health professionals to understand that “one-size-does-not-fit-all”, hence Western-based sleep-related
guidelines and interventions may not always be applicable to infants of predominantly-Asian
countries, especially after the first year of age, where cross-cultural differences in sleep trajectories
are more likely to be present.
Session 7D: Workshop: Multiple Imputation for Multilevel Data (Part II)
Craig Enders
(This is a double session which runs 9:15-12:30. Session 7D is a continuation of session 6A.)
Concurrent paper session 8 Wednesday 3:15 pm – 4:45 pm
Session 8A: Advances in Mixture Modeling
A framework of R-squared measures for single-level and multilevel regression mixture models
Jason Rights, Sonya Sterba
Psychologists commonly apply regression mixture models in single-level (i.e., unclustered) and
multilevel (i.e., clustered) data analysis contexts. Though researchers applying non-mixture
regression models typically report R-squared measures of explained variance, there has been no
general treatment of R-squared measures for single-level and multilevel regression mixtures.
Consequently, it is common for researchers to summarize results of a fitted regression mixture by
simply reporting class-specific regression coefficients and their associated p-values, rather than
considering measures of effect size. In this talk, we discuss recent developments that fill this gap by
providing an integrative framework of R-squared measures for single-level regression mixture models
and multilevel regression mixture models (with classes at level-2 or both levels). Specifically, we
describe 11 R-squared measures that are distinguished based on what the researcher chooses to
consider as outcome variance and what sources the researcher chooses to contribute to predicted
variance. We relate these measures analytically and through simulated graphical illustrations. Further,
we demonstrate how these R-squared measures can be decomposed in novel ways into substantively
meaningful sources of explained variance. We describe and demonstrate new software tools to allow
researchers to compute these R-squared measures and decompositions in practice. Using two
empirical examples, we show how researchers can answer distinct substantive questions with each
measure and can gain insights by interpreting the set of measures in juxtaposition to each other.
Methods of Covariate Inclusion in Latent Transition Analysis: A Monte Carlo Simulation Study
Ai Ye, Jeffery Harring, Luke Rinne
Latent transition analysis (LTA) is a longitudinal variant of latent class analysis that allows
researchers to analyze how individuals change between latent classes over time. In LTA models, one
is often interested in relating latent class membership to auxiliary variables. However, in contrast with
recent investigations focused on evaluating the accuracy of covariate inclusion procedures within the
contexts of latent class analysis (LCA) or growth mixture modeling (GMM), where one latent variable
is estimated, investigations with multiple latent categorical variables, like latent transition analysis
(LTA), are scant. In the present study, we conducted a Monto Carlo simulation to evaluate several
recent bias-corrected three-step approaches with the traditional three-step and one-step methods for
incorporating covariates into LTA under various conditions, including class separation, covariate
43
effect size, type of parameters estimated, and sample size. Preliminary results suggest that the newer
three-step approaches yield consistently less biased parameter estimates and more accurate standard
errors than the uncorrected three-step method. Part of the inspiration for the study comes from a
presentation at the 2016 MMM conference regarding the work of investigating the method under the
context of LCA. Our purpose in this proposal is to extend the method to its longitudinal form.
Statistical Modeling of EEG Brain Mapping Data: Challenges and Opportunities
Jay Magidson
Mixture latent Markov (MLM) modeling often provides new insights from longitudinal data where
the goal is to track changes in latent states over time. Recently, there has been increased interest in
the use of EEG data to identify latent brain state patterns in need of improvement and to design a
therapy protocol to provide such improvement. For example, an individual with low alpha and high
beta waves, relative to a normal reference group, may suffer from anxiety. We propose a methodology
where MLM can be used to analyze EEG data to benefit an individual suffering from some
psychological condition. Despite the fact that data is obtained from only a single case, a massive
amount of data can be attained over a 2-3 minute period. In this paper we propose a new methodology
where MLM can be used to analyze EEG data and illustrate its application using pre and post neuro-
feedback brain map data. The resulting latent states are intriguing and suggest that MLM may provide
new insights in the area of neuro-feedback and other areas involving the analysis of EEG data.
Session 8B. Modeling Health Disparities
Assessing health disparities in intensive longitudinal data: gender differences in Granger
causality between primary care provider and emergency room usage, assessed with Medicaid
insurance claims
Emil Coman, Yinghui Duan, Daren Anderson
This presentation introduces the concept of Granger causality for intensive longitudinal (panel) data,
and demonstrates simple Stata and R code for implementing it. We illustrate how one can contrast
direction of causality in two populations of interest (like race/ethnicity e.g.), when health disparities
(HD) questions arise. We test which is the predominant direction of causality between primary care
provider (PCP) use and emergency room (ER) use, using the Granger causality/noncausality
approach, and compare male vs. female results, using a subset of a large Medicaid CT dataset (N =
14,358) for adults (n = 12,381, 18 and older, 33.2% males, 66.8 % females), of claims spanning three
years (April 2013-Sept. 2016). We describe common challenges of modeling intensive panel data
(some cases having as much as 5,300 repeated observations), and then delve into the details of
processing and analyzing such claims data, focusing on either actual utilization (number of times
patients see PCPs or go to ER) within specific time intervals, or on the actual cost of paid claims. The
mutual causation of two key outcomes questions are explained in the context of known panel
analytical econometric approaches. We use Stata’s recent pvargranger and R’s grangertest. These
‘chicken and egg’ questions have been asked before, even literally with chicken and eggs data, but
not with claims data to our knowledge. We interpret the results in terms of their implications for
practice, regarding how the use of PCP services drive (or not) lower/higher ER use. We expect that
PCP use to reduce ER use; similarly, more ER use should drive up PCP use, as patients are referred
back to their PCP by ER physicians, yet patients follow up more/less with such recommendations.
We examine HD questions as gender differences in the strength of Granger causality findings
regarding PCP-ER usage and costs over time, and conclude with HD implications of these modeling
options.

44
How to peel oranges into apples: Finding causes and effects of health disparities with difference
scores built by 1-on-1 matching
Emil Coman, Helen Wu
Understanding the causes of health disparities (HD) is a major public health objective in the US,
because it promises to uncover efficient solutions to achieve health equity, and ultimately better health
for all individuals. HD models however commonly focus on detecting population differences,
between a racial/ethnic (R/E) or gender group (e.g. Black patients), and a reference group (e.g. white
patients). Such differences are tested for significance using a variety of statistical models, primarily
tests of differences between some averages in the comparison groups, controlled for some proper
covariates. Judging the size of HDs in health outcomes is but the first step in understanding the causal
mechanisms that led to such HDs, and hence recommending changes that could reverse and hopefully
erase disparities. Causal analyses of the emergence of HDs however are not straightforward.
Revealing causes of HD requires modeling directly the difference in health outcomes, in other words
the actual differences in health outcomes between comparable cases need to become the (variable)
outcome, and potential predictors of it tested for impact, in size and significance. We propose an
approach that borrows strengths from the Latent Change Score (LCS) tool, here more properly labeled
Latent Difference Score (LDS). A LDS score is simply an (latent) difference score between two
commensurable variables, like post-pre scores of a same variable, or in our case the scores of half of
the sample (e.g. white patients) and the other matched half (Black patients). We will detail an
approach to match one-on-one patients, so that the data literally then becomes dyadic in structure.
A review of modern methods of estimating the size of health disparities
Emil Coman, Helen Wu
We review the current advanced/modern statistical methods of comparing racial/ethnic groups in
search of true health disparities (HD) estimates, and provides an applied ‘how to’ using Stata
commands. Currently, modern HD methods fall short of making sound causal claims, because
‘assignment’ to a racial/ethnic (R/E) group is not random at birth (like gender is), or R/E is not itself
an exogenous predictor, when it comes to health outcomes. It is well known for instance that
education and income act as ‘precursors’ or one’s R/E, or that R/E differences in outcomes of interest
are partially ‘due to’ education and income, and only partially ‘due to’ R/E membership. If a
researchers is interested in comparing health outcomes Y, like stress, a key mechanisms involved in
health processes, s/he would either: 1. Compare the two means using an independent samples
student’s t test; 2. Test for the significance of the Black/white dummy predictor in a regression of
HIL on the grouping variable (with adequate controls, like SES); 3. Compare the Y intercepts in two-
group regression/path models, with SES indicators as predictors; other more advanced methods. We
provide a comprehensive review of modern methods, accompanied by simple software code (Stata,
then Mplus) for obtaining HD estimates with education and income as controls/covariates, using: 1.
Multiple regression with covariates/controls (regress commands) 2. Clustered regression for clusters
defined by controls/covariates; (vce(cluster) options) 3. Propensity score matching approaches, based
on block matching algorithms, like 1. using Stata’s psmatch2; 2. atnd; 3. teffects. 4. Structural
Equation Modeling methods, including 2-group models allowing for differential effects within R/E
groups (sem command) 5. Instrumental variable estimation, in the econometric tradition, using Stata’s
ivregress. 6. A new approach, based on 1-on-1 matching of cases, and latent difference scores (sem
command, implementing latent difference scores; Mplus will be used for contrasts). While results
differ little, some methods provide wider estimates with smaller standard errors (IV in particular),
which require further investigations, we will illustrate and contrast them visually and analytically.
45
Session 8C: Advances in multivariate multilevel models for cross-sectional, longitudinal, and
repeated cross-sectional data
Chair: Katherine Masyn
This symposium brings together three papers that broaden the horizons of multivariate multilevel
modeling. Collectively, the papers represent innovation in the specification, estimation,
performance, and application of multivariate multilevel models for a variety of particularly
challenging data structure scenarios. The first paper considers the situation of multiple-membership
multilevel longitudinal data wherein some individuals followed over time change cluster
membership during the period of data collection. In her novel approach, the author presents the
model specification and estimation for a multilevel piecewise growth model that allows for the
possibility that some individuals may change cluster membership within and/or across different
segments of the growth process, comparing her model performance to a model that only used
cluster membership at the first measurement occasion and another that ignored individual mobility
across clusters. The second paper considers the situation of multivariate multilevel longitudinal
models based on multilevel repeated cross-sectional data wherein clusters are followed over time
but independent samples of individuals within clusters are measured at each time point and the
time-specific, individual-level measures are a set of indicators for a latent class variable. The
authors propose a multilevel latent transition analysis (LTA) with between-cluster random
intercepts of the individual-level indicators at each time point functioning as indicators for a time-
specific, cluster-level latent class variable and cluster changes in latent class membership over time
captured by a cluster-level LTA.
Paper 1. Estimating a piecewise growth model with longitudinal data that contains
individual mobility across clusters Audrey Leroux
Paper 2. A cluster-level latent transition model for multivariate multilevel repeated
cross-sectional data
Katherine Masyn, Rashelle Musci, Amie Bettencourt, Albert Farrell

46
Poster Abstracts
1. A method for identifying low variance
Cara Arizmendi & Kathleen Gates
Whether to include variables with low variance in analyses is a common predicament for
researchers. Despite the frequency of obtaining data with one or more variables with low variance, a
method for successfully identifying these variables for removal has yet to be developed. Simply
identifying problematic variables based on the value of their variance alone does not account for the
interdependencies among the variables as a whole. By failing to account for these
interdependencies, researchers may be removing innocuous variables from their data or may be
including variables that will over-inflate standard errors, resulting in unstable estimates in the
partial correlation matrix. Here, we present a method for identifying low variance using an
adaptation of the Haitovsky test, a test for detecting very high multicollinearity in correlation
matrices. Simulations demonstrate the test statistic's ability to identify when the variance of one or
more variables in a covariance matrix is too low for stable partial correlation estimates and
determine how to differentiate between detecting multicollinearity versus detecting low variance.
An empirical example is provided using data on community attitudes toward law enforcement from
the Police Foundation’s Public Safety Open Data Portal.
2. Predicting Positive Youth Development: The role of intentional self-regulation and
relationships
Caitlin Aymong, Jacqueline Lerner, Sara Johnson, & Michelle Weiner
Past research has demonstrated that having a role model and having intentional self-regulation (ISR)
have been linked with positive developmental outcomes. We used data from 413 6th-11th graders
from eleven New England schools who participated in the Connecting Adolescents Beliefs and
Behaviors study to examine the relations between ISR, role model relationship quality, and positive
youth development (PYD). A structural regression model was used to examine these relationships.
Standardized fit statistics for the full model were mixed (chi-square=1893.79, p<.001;
RMSEA=0.04; CFI=0.82; SRMR=0.08), with the chi-square statistic and CFI indicating poor fit,
but the RMSEA and SRMR indicating adequate fit. Similar to previous work, this model provides
evidence that ISR and relationships predict PYD. Interestingly, this model demonstrates that the
five factors (i.e., caring, connection, confidence, competence, and character) of PYD are
differentially predicted by relationship quality in this sample. Specifically, relationship quality
significantly predicted three aspects of PYD whereas ISR significantly predicted all five. ISR and
relationship quality together predicted 13-34% of the variance for each of the five factors of PYD.
3. Measurement Implications: Assessment of Invariance in the Everyday Discrimination
Scale across Transgender and Sexual Minority Identities
Loren Bauerband, Leslie A. Brick, & Wayne F. Velicer
The Everyday Discrimination Scale (EDS) is a brief measure of perceived experiences of
discrimination first designed for African Americans in a medical setting as a 9-item, single factor
measure. The EDS has been used in research with various racial and ethnic identities, LGBT
identities, and health conditions. Several studies have found the structure of the EDS to be invariant
across race, but no research has assessed structure across transgender and sexual orientation
identities. The current research used a nonprobability sample of 553 cisgender sexual minorities and

47
484 transgender individuals to assess invariance across LGBT identities. Structural invariance was
evaluated across configural, metric and scalar levels between cisgender and transgender groups, and
across gender identities among cisgender and transgender separately. Results supported the same
factor structure as previous research, but only partial metric invariance between cisgender and
transgender individuals. One item was noninvariant between transgender and cisgender groups, but
when invariance was assessed across genders within the transgender group, the same item was
noninvariant. This suggests one item was differentially related to experiences of discrimination for
only transgender women. Additional analyses may support the removal of this item from the scale,
but distinguishes a discrimination experience specific to transgender women.
4. Intervention effects on stage transitions for adolescent smoking and alcohol use
acquisition
Leslie A. Brick, Wayne F. Velicer, Colleen Redding, & Andrea Paiva
The health impacts of smoking and alcohol abuse have been long established with smoking
representing one of the most preventable causes of disease and alcohol use the most popular
psychoactive substance among adolescents. The current study evaluated stage of change
progression in a large (N=4,158), longitudinal school-based, computer delivered, Transtheoretical
model-tailored multiple behavior intervention focused on preventing acquisition of smoking and
alcohol use in adolescents. Assessments began in sixth grade and continued yearly until eighth
grade, with a follow-up in ninth grade. Longitudinal Markov modeling with an absorbing class (e.g.,
a class that represented students who became smokers/drinkers and could not transition into any
other class) was used to explore behavior acquisition stage transitions over the course of the
intervention. Nested models were employed to determine the best pattern of stage movement,
whether the pattern was consistent over time, and whether intervention condition affected stage
transitions. Major findings supported positive intervention effects for both the intervention and
comparison condition, which focused on energy balance behaviors and provided no direct
intervention on substance use behaviors. Substantial differences in stage membership and
transitions across intervention conditions highlighted the process of smoking and alcohol use
acquisition in middle school students across each intervention condition.
5. Fit for a Bayesian: An Evaluation of PPP and DIC
Meghan Cain & Zhiyong Zhang
This poster introduces Bayesian SEM and its fit indices: posterior predictive p-value (PPP) and
deviance information criteria (DIC). Both fit indices rely on frequentist ideas of model fit, but can
be calculated directly from the MCMC methods used in Bayesian analysis. As of yet, no criteria
have been established for their use in practical analysis, severely limiting the utility of Bayesian
SEM. This project aims to establish such criteria. Three simulations studies were conducted on
popular models in psychology and other social sciences. A wide variety of type and severity of
misspecifcation were covered, and the effects of sample size, model size, prior specification, and
data nonnormality were evaluated. Some recommendations for evaluating model fit in Bayesian
SEM using PPP and DIC are proposed.
6. AIC and BIC for Simple Models of Severely Complex Data
Ian Campbell
Different information criteria are often used to compare non-nested models in Structural Equation
Modeling (SEM), with the Bayesian Information Criterion (BIC) and the Akaike Information
Criterion (AIC) being the most common. Many previous simulations have recommended BIC as the
better method for model selection. However, these simulations have often focused on scenarios
48
where the true Data Generating Process (DGP) is relatively simple, often less complex than some of
the models under consideration in the candidate set. This does not reflect reality in psychology,
where complex human behaviors are thought to result from many interacting factors. To understand
how information criterion perform when the true DGP is substantially more complex than any of the
potential models, the current simulations used a severely complex DGP and examined the ability of
AIC and BIC to select the optimal model from among different sets of non-nested, relatively simple
candidate models—none of which contained the true model—across a wide range of misspecified
parameter values and sample sizes. The results indicate that BIC requires surprisingly large sample
sizes to select the best model with high consistency and that AIC may be a better option at certain
commonly seen sample sizes.
7. Accounting for Test Score Measurement Errors in Student Growth Models
Pei-Hsuan Chiu, H. Jane Rogers, & Hariharan Swaminathan
Student growth models based on test scores can provide important information about student’s
progress over time and allow prediction of future performance. These models can be constructed
under regression-based or latent variable frameworks. In either case, it is critical to take into
account test score measurement errors that come from either classical test theory (CTT) or item
response theory (IRT) models. As Fuller (1987) and other studies have indicated, ignoring or
misspecifying measurement errors can result in attenuation bias in parameter estimates and reduced
power for testing hypotheses . In the present study, three methods for accounting for test score
measurement errors are compared: 1) correction of parameter estimates using test score reliabilities
in a linear regression model; 2) specification of individual test score measurement error in the level
1 error variance structure of a linear growth model; and 3) incorporation of an IRT model as the
measurement model in a structural equation model (SEM) where the IRT model describes the
relationship among items and latent variables and a linear regression model (the structural model)
describe the relationship among latent variables. A simulation study compared the prediction
accuracy of the models.
8. Effects of Measurement Error on Autoregressive Parameters in Time Series Analysis
Kristine Christianson, Siwei Liu, & Emilio Ferrer
In the field of psychology, interest in investigating intraindividual processes through individual time
series analysis has grown in the last two decades. However, despite the fact that research has shown
that failure to take measurement error into account leads to biased estimates of autoregressive (AR)
coefficients (e.g., Schenker & Gentleman, 2001; Schuurman, Houtveen, & Hamaker, 2015), the
majority of these analyses do not explicitly incorporate measurement error. The purpose of this
project is to further investigate the effects of measurement error in individual time series data by
comparing the dynamic factor analysis (DFA) model to an AR model using composites of observed
indicators. We conducted a Monte Carlo study in which we generated data under a DFA(1,1) model
varying the factor loading/error variance ratios while holding all other parameters constant. We
generated 500 replications for each condition and then fit DFA(1,1) and AR(1) models to the
simulated data. Our findings suggest that, as expected, the DFA model successfully recovered the
AR parameter, but the AR(1) model using composites yielded attenuated estimates that worsened
with increasing error variance. These findings add support to previous work suggesting
measurement error in time series analysis leads to biased estimates of the AR parameter.

49
9. Evidence of Age-Varying Associations in Risk and Protective Factors for Obesity and
Overweight from the National Survey of Children’s Health
Darce Costello
Background: According to the Centers for Disease Control and Prevention, the proportion of U.S.
children classified as obese more than tripled since the early 1970s. Recent estimates indicate that
around 17% of U.S. children are obese and 16% are overweight. Obesity is associated with a variety
of chronic health problems in childhood and adulthood. In addition, overweight and obese children
experience negative social and mental health consequences, such as being bullied or socially
isolated and suffering from depression, anxiety, and low self-esteem. Obesity also
disproportionately affects children from low income households and racial and ethnic minorities.
Despite the wealth of research on childhood obesity and overweight in the U.S., there have been
few studies examining how the associations between risk and protective factors for being obese or
overweight may change during childhood. This secondary analysis uses data from the 2011-2012
National Survey of Children’s Health (NSCH) to examine how the associations between physical
activity, sedentary activity, and the risk for being overweight or obese vary between ages 10 to 17
years in order to shed light on developmental periods when the associations are strongest and when
intervention may be most effective. A secondary aim was to examine whether household income
moderated these age-varying associations. Method: The 2011-2012 NSCH was designed to be
representative of the U.S. population of non-institutionalized children in the U.S. ages 0-17. The
study outcome was a dichotomous indicator of overweight or obesity derived from age- and gender-
specific BMI based on parental report of the child’s height and weight.
10. Applying Equivalence Testing to Measurement Invariance
Alyssa Counsell & Robert A. Cribbie
Measurement invariance (MI) is an important concept for scale developers and researchers who
would like to compare data from multiple populations on some trait or construct. It is the idea that
differences between populations are a function of group membership rather than bias in how a scale
measures the target trait. A common practice to test levels of MI is through comparison of nested
confirmatory factor analysis models after adding equality constraints on parameters across the
groups. Statistically nonsignificant results from a chi square difference test are typically used as an
indication of MI since the additional constraints do not statistically worsen the model fit. Yuan and
Chan (2016) proposed to use equivalence testing approaches instead of this method to avoid the
logical and statistical issues with “accepting” the null hypothesis. This work introduces and
evaluates Yuan and Chan’s equivalence testing approach to MI, and demonstrates the use of the
method with data from males and females on the Generic Conspiracist Beliefs Scale, and discusses
statistical and theoretical differences between equivalence testing and traditional approaches.
11. A More Powerful Familywise Error Controlling Procedure for Evaluating Mean
Equivalence
Heather Davidson & Robert A. Cribbie
When one wishes to show that there are no meaningful differences between two or more groups,
equivalence tests should be used; a nonsignificant test of mean difference does not tell us that the
groups are all equivalent. The current research proposed a modified-Holm based procedure for
controlling the familywise Type I error rate when we fail to reject the null hypothesis in a one-way
equivalence test (i.e., when not all groups are equivalent, but some might be equivalent). Caffo,
Lauzon and Rohmel (2013) suggested dividing the alpha level by a correction of K squared divided
by 4, where K is the number of levels, however more statistical power is possible if a stepwise
50
approach is adopted. In this presentation we outline the new method and use a simulation study to
demonstrate the power advantage of the proposed method.
12. Beyond Two Dimensions of Effectiveness: A Three-Step Latent Profile Analysis of New
York City Schools Megan Duff & Alex J. Bowers
The purpose of this study is to identify a typology of school effectiveness in New York City. The
city’s new Framework for Great Schools suggests there are six key factors that lead to school
effectiveness, including: rigorous instruction, supportive environment, collaborative teachers,
effective school leadership, strong family-community ties, and trust. Although previous research
has supported these factors’ inclusion in models of school effectiveness; no one has attempted to
identify different subgroups of effective schools using these indicators. Employing a sample of all
New York City public schools serving students in grades 3-12 that participated in the New York
City School Survey in 2016 (N=1,853), we perform a 3-step latent profile analysis (LPA). First, we
estimate the subgroups of effective schools. Then we introduce a number of covariates to
characterize schools belonging to each group, using school-level descriptive data. Finally, we
examine the extent to which schools’ subgroup classifications explain academic outcomes. This
study contributes to the literature by applying recent developments in LPA to all but the 10 New
York City schools that did not participate in the 2016 survey.
13. An Evaluation of MIIV Estimation for Multilevel Structural Equation Modeling
Michael Giordano & Ken Bollen
This monte carlo simulation study evaluates properties of Model Implied Instrumental Variable
(MIIV) estimation for multilevel latent variable structural equation models (SEMs). Multilevel
SEMs are commonly estimated through full Maximum Likelihood as implemented in GLLAMM
(Stata) or MPLUS. Maximum likelihood estimators have ideal properties when their structural and
distributional assumptions are met; however we know in practice these assumptions are often
violated (e.g. incorrect model specification and nonnormality). Prior work has shown MIIV
estimators are more robust to structural and distributional assumptions for single level latent
variable SEMs. The current study builds upon previous findings extending the application of MIIVs
for multilevel SEMs. We estimate two-level confirmatory factor analysis models with MIIVs and
full ML. We look at the bias and variance of each estimator under correct and incorrect
specifications. We vary the number of indicators per latent variable, the sample size, and generate
data from normal and nonnormal distributions.
14. Analysis of item-level bias in the Bayley-III language subscales : The validity and
utility of standardized language assessment in a multilingual setting
Shaun Goh, Elaine KH Tham, Iliana Magiati, Sim Lit Wee, Shamini Sanmugam, Anqui Qui, L.
Mary Daniel, Birit Brokeman, & Anne Rifkin-Graboi
Purpose: To improve standardized language assessments among bilingual toddlers by identifying
and removing items that show differential functioning (DIF). Background: It remains unclear if
standardized language assessments can fairly assess the construct of language among bilinguals due
to possible unfamiliarity with cultural norms or a distributed language system. This paper
operationalizes and empirically estimates possible item level biases among a standardized language
assessment adapted for bilinguals. Methods: DIF was applied to Bayley’s-III expressive language
scales administered to two-year-olds (n = 459) with typical language development from the
Growing Up in Singapore Towards healthy Outcomes (GUSTO) cohort study. Confirmatory factor
analyses for binary items were run in Mplus version 7 with Weighted Least Squares Means and

51
Variances adjusted (WLSMV) estimator with probit link, a limited information estimator designed
to handle categorical type data. Then, each item was sequentially tested for the presence of DIF.
This was done by regressing a factor item onto the covariate of interest while simultaneously
adjusting for any true group difference by regression of the latent factor onto the covariate.
15. Evaluating UNC's Chancellor's Science Scholars Program: A Propensity Score
Analysis
Noah Greifer, Abigail Panter, & Viji Sathy
We evaluated the Chancellor's Science Scholars (CSS) program, an academic enrichment program
aimed at increasing underrepresented minority achievement and participation in science,
technology, engineering, and mathematics (STEM) PhD programs. To adjust for confounding, we
employed propensity score weighting to create a control group of non-participating student similar
on background covariates to CSS participants. Multiple imputation with chained equations was used
to handle missingness, and propensity scores were generating using the Covariate Balancing
Propensity Scores method. We estimated the effect of CSS participation on cumulative hours
completed, cumulative science hours completed, D/F/W rate, and science D/F/W rate after the first
year for the first three CSS cohorts. Results indicate that, assuming no unobserved confounding,
CSS participation causes improvements in these outcomes, especially science outcomes, for CSS
participants, consistent with the program's mission.
16. Temperamental Exuberance Moderates the Relation Between Effortful Control and 1st
Grade Reading Achievement: a Latent Growth Curve Modeling Approach
Rachel A. Gross & Anne Dopkins Stright
Theory suggests that reactive and regulatory temperament dimensions may interact to predict
children’s academic achievement, but no studies have examined the interaction of exuberance and
effortful control in relation to children’s achievement. Low effortful control is usually associated
with poorer achievement, but can be moderated by external factors (e.g., teacher support). Data
were drawn from the NICHD Study of Early Child Care and Youth Development to explore
whether the relation between effortful control at 54-months and reading achievement across 1st, 3rd,
and 5th grades can be moderated by a resource internal to the child: exuberance. Free-loading latent
growth curve models were estimated to account for the nonlinearity of individual growth
trajectories in children’s achievement scores. The interaction of exuberance and effortful control
predicted the intercept, such that when 54-month effortful control was high, children demonstrated
high levels of achievement in 1st grade regardless of 54-month exuberance, but when 54-month
effortful control was low, higher 54-month exuberance predicted higher 1st grade achievement.
Results suggest that higher exuberance may help children with poor effortful control obtain greater
reading achievement in 1st grade but that their exuberance may no longer compensate for their poor
effortful control in 3rd and 5th grades.
17. Examining multiple approaches to evaluating measurement invariance with multilevel
data and a level-1 grouping variable
Heather Gunn & Kevin Grimm
To make valid group comparisons on a latent construct, the indicators that define the construct need
to have an equivalent factor structure across the groups being compared. Occasionally, participants
are clustered in higher-level units, which can create dependency in the data. When testing for
measurement invariance with multilevel data, the dependency needs to be taken into consideration.
In this study, we compared the statistical conclusions of five approaches that evaluate measurement
invariance in regards to gender in multilevel data with a level-1 grouping variable. The five

52
methods we used were a multilevel factor mixture model for known classes approach, a MIMIC
approach, a definition variable approach, a design-based approach, and a Muthén’s maximum
likelihood approach. To evaluate measurement invariance, we used a subset of children (N = 2,617,
49.45% female) from the publicly available Early Childhood Longitudinal Study-Kindergarten
Cohort dataset. The boys and girls from this sample were nested within 150 schools. For this
illustrative example, the conclusions of the five approaches were the same (e.g., the same
parameters exhibited bias across approaches). Further work should explore the differences in power
and type I error rates between the approaches and how the assumptions of each approach affect the
results.
18. Nonlinear relationships between Traits and methods in MTMM models
Fred Hintz, Christian Geiser, & G. Leonard Burns
The examination of construct validity is of vital importance to psychological research, and the
multitrait-multimethod (MTMM) design is one of the most frequently employed methods to
examine construct validity. While most contemporary confirmatory factor analysis (CFA-MTMM)
methods do not allow correlations between trait and method latent variables, the latent difference
and latent means models of CFA-MTMM allow for the examination of linear relationships between
traits and methods (Browne, 1985; Eid, 2000; Geiser, Eid, West, Lischetzke, & Nussbeck, 2012;
Kenny, 1976; Marsh & Hocevar, 1983; Pohl, Steyer, & Kraus, 2008; Widaman, 1985). Theoretical
conceptualizations of method effects have suggested that in addition to linear relationships,
nonlinear relationships between traits and methods may exist in practical applications and be
relevant to the interpretation of the trait-method relationship (Schmitt, 2006). In the present paper,
two methods for examining nonlinear relations between traits and methods are proposed and
described in detail. An application to a multi-rater study of children with attention deficit and
hyperactivity disorder is described (N=725). A Monte Carlo study is presented that tested the
performance of the methods under different levels of convergent validity (variance of method
factor), reliability of indicators, and sample size.
19. Comparing Different Planned Missingness Designs in Longitudinal Studies
Nicholas Illenberger & Ofer Harel
Planned Missingness (PM) designs, in which researchers deliberately collect only partial data, have
enjoyed a recent growth in popularity. Among other benefits these designs have been proven
capable of reducing the study costs and alleviating participant burden. Past research has shown that
Split Form PM designs can be effective in simplifying complex surveys while Wave Missingness
PM designs act similarly for Longitudinal studies. However, less work has been done to inform how
to implement PM structures into studies which incorporate elements of both survey and longitudinal
designs. Specifically, in studies where a questionnaire is given to participants at multiple
measurement occasions the best way to design missingness is still unclear. To address this
deficiency, data in this hybrid format was simulated under both Split Form and Wave Missingness
PM structures. Multiple Imputation techniques were applied to estimate a multilevel logistic model
in each of the simulations. Estimated parameters were compared to the true values to see which PM
design allowed us to best capture the true model. The results of this study indicate that, compared to
the Split Form Design, the Wave Missingness design consistently performed less effectively in
capturing the multilevel model. Thus, in the context of longitudinal surveys this study recommends
the use of Split Form missingness designs, which performs well under a number of different
conditions.
53
20. Evaluating the Factor of Curves Model’s Capability to Capture Change Across
Psychometric Conditions
Marilu Isiordia
It is well-established that factorial invariance is a necessary condition for comparing latent means
over time. However, the literature has yet to support any analytical techniques to researchers who
wish to conduct latent mean analysis across repeated measurements when factorial invariance is not
tenable in the data. The Factor of Curves (FOCUS) model might be a practical solution to this
challenge. The FOCUS model evaluates whether a higher-order factor structure is responsible for
the covariation among univariate latent growth models. An advantage of the FOCUS model is that it
does not require factorial invariance constraints to assess common growth among lower-order
developmental functions. This study examined the FOCUS model’s capability to capture the
underlying growth process among a set of indicators across different levels of invariance. To
accomplish this, multivariate, longitudinal data was simulated under the following indicator-
construct relations: level of invariance, factor loading size, and number of indicators. Results
showed that across conditions, the FOCUS model recovered the population latent trajectory only
when factorial invariance was tenable. Overall, findings indicate that although the FOCUS model
does not require longitudinal factorial invariance constraints, factorial invariance still needs to hold
to make valid inferences about a construct’s latent trajectory over time.
21. Modeling the Longitudinal Effects of Executive Functioning on Theory of Mind in
Preschool Children using Structural Equation Modeling
Minji Kang & Randi L. Garcia
Although studies have found that there is an effect of executive functioning on acquisition of theory
of mind in children (Carlson, Claxton, & Moses, 2015), the most modern longitudinal modeling
techniques, using Structural Equation Modeling (SEM), have yet to be fully utilized in this field.
Theory of mind is measured with the false belief task which tests whether children can understand
that others may have diverging beliefs from their own. Emergence theory (Moses & Carlson, 2004)
states that executive functioning enables the weighing of different perspectives, a consequence of
which is the ability to consider the contents of others’ mental states. Using two waves (N = 326)
from a multi-year NIH language study, we estimated a model where executive functioning at T1
predicts change in theory of mind from T1 to T2. The model results indicate that there is a positive
relationship between executive functioning and change in theory of mind. Various indirect effects
of language acquisition on theory of mind through executive functioning were also estimated.
Future directions include using data from the full 4-wave longitudinal study to fit a Latent Growth
Curve Model predicting change in theory of mind from change in executive functioning.
22. Gain Scores Revisited: A Graphical Models Perspective
Yongnam Kim & Peter M. Steiner
The use of gain scores (i.e., the difference between posttest and pretest) for estimating the effect of
an intervention from observational data has been frequently avoided in education and psychology.
Recent advances in causal inference, in particular the graphical models approach (Pearl, 2009), shed
new light on the misunderstandings about gain scores. Using simple graphical models, we visualize
the conditions under which gain scores allow us to identify causal effects. Our graphs show that
gain scores remove bias in effect estimates by offsetting non-causal associations instead of directly
blocking them by conditioning on the pretest. The offsetting mechanics rely on the common trend
assumption and do not require a reliably measured pretest. Also, because gain score analyses do not
need to condition on other variables, they are neither prone to bias amplification—bias increases
after conditioning on covariates—nor to collider bias—bias induced by conditioning on a common

54
outcome. In addition to giving insight into the famous Lord’s paradox, our gain score graphs give
an idea how more complex identification strategies, such as difference-in-differences, fixed effects
models and comparative interrupted time series designs can be graphically represented.
23. Multiple imputation for incomplete categorical variables in multilevel data structure
Helani D. Kottage, Carole L. Birrell, & Marijka J. Batterham
Multiple imputation is considered a prominent method of handling missing data and has been
researched widely in recent years. Studies addressing its behavior in multilevel data structure are
lacking, especially when there are incomplete categorical variables. We attempt to fill such a gap in
literature by comparing three popular imputation methods available for handling incomplete data in
a multilevel data structure. A simulation study will compare the approaches of: (a) joint modelling,
(b) fully conditional specification, (c) fixed effects imputation specifically focusing on where
missingness is found in categorical predictor variables. Methods (a) and (b) assume underlying
continuous latent variables for categorical variables in a multilevel structure whereas the common
approach of (c) involves a single level imputation model. Further, the performance of these methods
will be investigated with varying cluster sizes and intra class correlations while missing rates (level-
1 variables), number of clusters and number of imputations are kept fixed. The substantive analysis
is to fit a two-level random intercept model to a continuous outcome variable (such as reading
score) with categorical predictors in both level-1 (e.g. students) and level-2 (e.g. schools).
24. An effect size measure for moderated mediation models
Mark Lachowicz
Mediation analysis has become an increasingly popular statistical method in education research.
However, currently available effect size measures for mediation have limitations that restrict their
use to specific mediation models. In particular, complex mediation models with moderators and
latent variables have no established effect size measures for indirect effects. In this study, I develop
a measure of effect size that addresses these limitations. This work has several components: 1)
derivation of an expression mathematically for an effect size for moderated mediation models with
manifest and latent variables, 2) evaluation of the measure in terms of established criteria for good
effect sizes, 3) derivation of an expression for the finite sample bias of the new measure and a bias-
corrected estimator, 4) evaluate the finite sample properties of the estimators using Monte Carlo
simulation, and 5) demonstrate the utility of the measure using empirical data. The example will be
a moderated mediation model with multiple mediators using the National Longitudinal Study of
Adolescent Health (AddHealth) that will examine the processes through which childhood
maltreatment affects educational attainment. The developments here extend the existing literature
on both effect size and mediation by developing a method of communicating the magnitude of
indirect effects in complex mediation models.
25. Statistical power analysis for logistic models with multiple covariates and interaction
terms: a Monte Carlo based approach
Haiyan Liu & Zhiyong Zhang
Power analysis and sample size planning are of particular interest in experimental design. In
existing approaches, the analysis is conducted based on either the likelihood ratio test, the score test,
or the Wald test, which works well for models with one predictor. However, it is not easy to extend
these tests to more complex models, for instance, models with confounders and interaction terms.
This study proposes to compute the power through Monte Carlo simulation, a general framework
that works for models with multiple predictors, interactions, and other situations. Simulation studies
are conducted to evaluate its performance. A demonstration of the method is provided.

55
26. Performance of the Weighted Root Mean Square Residual (WRMR) in Structural
Equation Modeling
Jin Liu, Ginger Jiang & Christine DiStefano
In structural equation modeling, the tenability of a model is evaluated by examining ad hoc fit
indices, which illustrate the fit of the tested model to the data. Overall model fit is typically assessed
by examining a variety of fit indices, such as the Chi-squared ratio test, Root Mean Squared Error of
Approximation, and the Comparative Fit Index. The Weighted Root Mean Square Residual
(WRMR) available in Mplus is an index that has been included to evaluate model fit by many
applied researchers; however, limited study has been conducted on the WRMR. One study (Yu,
2002) recommended that the WRMR may indicate acceptable fit when values are under 1.
Alternatively, the developers of Mplus (Muthen & Muthen, 2014) recommended that this index is
only an experimental fit index. Yet, applied researchers are currently using the WRMR for model
support (e.g., Wiesner & Schanding 2013). This study will investigate the performance of the
WRMR for categorical data to provide additional information about the performance of the index at
evaluating model fit. A variety of correctly and misspecified models will be tested and the WRMR
are compared with other well-known indices to examine fit under typically encountered conditions.
27. The impact of Likert point scale, number of items, theoretical reliability on reliability
estimates
Qimin Liu & A.R. Georgeson
The literature suggests that Cronbach’s alpha underestimates the theoretical reliability when used
with Likert point response scales. The current simulation study examines the reliability estimates of
Likert point scales under a variety of conditions and assesses the degree to which the reliability
estimate underestimates the theoretical reliability. Within each condition, the number of Likert
points, number of items, and theoretical reliability values were manipulated. Thus, the simulation
had 120 conditions: 6 Likert scale point levels (2, 3, 4, 5, 6, 7), 5 item number levels (8, 12, 16, 20,
40), and 4 theoretical reliability levels (.4, .6, .8, .9). We obtained 500 replications with n=350 for
each condition. Results show that the reliability estimates (as assessed with Cronbach’s alpha)
underestimate the theoretical reliability in Likert point scales for all conditions. However, the
reliability estimates improve as more points are added to the Likert scale. Increasing item numbers
also improves the reliability estimates. Theoretical reliability also seems to have effects on the
reliability estimate with Likert point scales. Recommendations for researchers are discussed.
28. Addressing Test Difficulty Variance In College Computer Based Testing
Xiaowen Liu & Eric Loken
Random item selection from an item bank is widely used in the measurement of learning
management systems, including those used in college classes. Unfortunately, random item selection
introduces the problem of large variance in test difficulties among students. We describe the
problem and look at three potential resolutions: stratifying the item pool by content and item
difficulty, estimating ability by item response theory (IRT), and equating test scores by adjusting for
test difficulty. We can demonstrate the problem by simulating a large item bank and randomly
sampling tests for examinees. By tracking the difficulty level of the items a student encounters, we
can calculate overall test difficulties and see the distribution across the population of students. We
will show that a substantial degree of variability exists, which means that students may be having
very different testing experiences. Stratifying the item pool by difficulty level, even coarsely, can
reduce the testing variance. It is also possible to do post-test adjustment based on the test difficulty
56
after gathering evidence for the whole student sample. Finally, IRT estimates of student ability
adjust for the pattern of items and are less biased than the standard practice currently in place.
29. Evaluation of Multi-Parameter Test Statistics for Multiple Imputation
Yu Liu & Craig K. Enders
In Ordinary Least Square regression researchers often are interested in whether a set of parameters
is different from zero. With complete data, this could be achieved using gain in prediction test,
hierarchical multiple regression, or an omnibus F test. However, in substantive research scenarios
missing data often exist. In the context of multiple imputation, one of the current state-of-art
missing data strategies, there are several different analogous multi-parameter tests of the joint
significance of a set of parameters, and these multi-parameter test statistics can be referenced to
various distributions to make statistical inferences. However, little is known about the performance
of these tests, especially in scenarios that are typical of behavioral science data (e.g., small to
moderate samples, etc.). We use Monte Carlo simulation techniques to examine the performance of
these multi-parameter test statistics for multiple imputation under a variety of realistic conditions.
We also provide a number of practical recommendations for substantive researchers.
30. Examination of Large Models with Ordinal Data
Heather L. McDaniel, Liyun Zhang, & Christine Distefano
Within the covariance structural modeling framework, robust estimators have been gaining in
popularity. Such estimation methods assist with estimation by correcting standard errors of
parameter estimates for attenuation and also adjusting fit indices when data are suboptimal, such as
non-normally distributed (e.g., Savalei, 2014). When categorical data are analyzed, robust methods
(often termed Diagonal Weighted Least Squares -DWLS) have advantages over more traditional
Weighted Least Squares/Categorical Variable Modeling methods, including the ability to analyze
larger models and the ability to use smaller sample sizes than were previously able (e.g., Bandalos,
2008, 2014; DiStefano & Morgan, 2014; Flora & Curran, 2004). While previous studies have
investigated the ability of DWLS methods to accommodate smaller sample sizes (e.g., Bandalos,
2008, 2014; DiStefano & Morgan, 2014), fewer studies have investigated the ability of DWLS to
accommodate larger models. This study performed a simulation to investigate the ability of the
Weighted Least Squares Mean- and Variance-Adjusted estimator available in Mplus. Models
included p = 16, p=36, and p=60 items with 2- and 5-category item level data and various levels of
model misspecification. Recovery of true item parameter values and accuracy of standard error of
parameter estimates, chi-square fit indices, robust versions of the comparative fit index, root mean
square error of approximation were evaluated.
31. Using Hierarchical Linear Growth Modeling to Identify Longitudinally
Outperforming School Districts from the United States District Population, 2009-2013
Elizabeth Monroe & Alex J. Bowers
School district effectiveness research is a growing field in education research, but it lacks a method
for identifying districts that significantly and longitudinally outperform peer districts from similar
community and local contexts. In this study, we analyze the US population of public school
districts over the five years 2009-2013. We built a two-level hierarchical linear growth model that
nests time in districts and has parameters on both the intercept, in 2009, and change in slope over
time, as well as including an AR1 autocorrelation specification. Using this model, we identify
school districts that significantly outperform or underperform their predicted longitudinal student
performance, given demographic and community covariates. The model’s covariates are variables
district administrators cannot control, such as student demographics and state funding. Therefore,

57
districts that outperform the model based on the residual analysis are significantly outperforming
their peers, after controlling for such characteristics. The aim of this study is to present a method
for selecting the most effective school districts in the United States, so that leaders of these districts
may share how they have led their school districts to success. Several outperforming school
districts are identified as potential sites for qualitative studies of district effectiveness.
32. Improvements to missing data treatment in presence of skipping fields: A new
possibility using Multiple Imputation
Esteban Montenegro, Youngha Oh, Kyle Lang, & Todd Little
Missing data is a common problem that can cause serious issues in human and social sciences
(Little & Schenker, 1995). Surveys and especially national surveys are often a big challenge due to
the different missing data patterns. One of the most common patterns and the problem of analyzing
data in large-scale surveys is when the skip pattern is present. For example, when a participant
answers no to a gate question (e.g., have you had surgery for your cancer?), then the next question
(e.g., how many surgeries have you had for your cancer) would be skipped. To impute missing data
and utilize the information of the gated variable, He et al. (2010) utilized what they called a
“deterministic imputation approach”, where a number zero was imposed in a question gated by a
previous question, to impute the skipped questions. The authors proposed that this approach took
into account the relation between the missing patterns and the questions gated by another question.
They even claimed that it is possible to use this kind of approach assuming MAR assumption. The
present study conducts a Monte Carlo simulation in R (R Core Team, 2015) to test the approach
proposed by He et al. (2010). Missing data are treated by multiple imputation (MI). The study
includes three different variables: binary, normal distributed and Poisson. Conditions compare MI
without imposing zeros vs. MI imposing zeros.
33. Analyzing the Effects of the Absence of Levels in Multilevel Modeling using TIMSS
Data
Breanna Morrison, Xinya Liang, & Wen-Juo Lo
Multilevel models are popular for handling data nested within multiple higher-level clusters. It
provides substantial power and accuracy if the levels of data are properly specified. However,
leaving out higher levels of nested data may result in biased standard errors and inaccurate variance
estimates for lower levels (Gilbert et. al., 2016). The current study investigates how reduced models
(ignoring a level of the nested structure) affects various outcomes in estimating students’ math
achievement from a variety of potential predictors. The analysis sample comes from TIMSS data at
the student, teacher, and school level. Complementing with literature, an exploratory analysis is first
conducted to identify predictors to be used in the three-level full model. Then two reduced two-
level models, one with students nested within schools, and the other one with students nested within
teachers, are compared to the full model. The evaluation criteria include model fit, parameter
estimates, standard errors, and variances explained at each level. The consequences of leaving out
levels in multilevel models will be discussed. This study is important due to the increased use of
multilevel modeling without fully understanding the consequences of leaving higher levels out of
these models.

58
34. Overcoming the Boundary Problem in Bayesian Growth Curve Modeling: A Data
Permutation Method for Testing Random Slopes
Robert Moulder & Xin Tong
Growth curve modeling is a common tool for measuring intraindividual change and interindividual
differences in intraindividual change over time. More and more researchers fit growth curve models
to their data using Bayesian methods, because Bayesian methods allow for both a high degree of
modeling flexibility and the use of prior information to impact parameter estimation. Within a
Bayesian framework, the random effects of a growth curve model are often assumed to have
gamma distributed priors, and thus usually result in gamma distributed posteriors. This creates a
problem during model selection as gamma distributions have a lower bound of zero. Thus, a
Bayesian Highest Posterior Density (HPD) interval will never cross zero, making determining
significance of a random slope parameter difficult. The existing methods for solving this boundary
problem are time consuming and may be technically difficult to implement. Therefore, in this study,
we demonstrate a way of using data permutations to efficiently determine the significance of a
random slope parameter. Simulations show that this method is adequate for determining the
existence of a random slope parameter at noise-to-random slope ratios of 2:1 and shows a strong
ability to select random slopes at noise-to-random slope ratios of 1:1 and lower.
35. The mediating effect of pre-medical school education attainment on undergraduate
medical school performance in the UK: A multilevel structural equation modelling
cohort study
Lazaro Mwakesi Mwandigha, Paul A. Tiffin, Adetayo S. Kasim, & Jan Boehnke
Several studies have demonstrated that both the United Kingdom Clinical Aptitude
Test (UKCAT) and medical school entrants’ Previous Education Attainment (PEA)
are predictive of undergraduate medical performance in the UK. This present study seeks to assess
whether the predictive validity of the UKCAT for medical school theory and skills based exam
outcomes throughout the five years of undergraduate medical school is mediated by an entrant’s
PEA. Selection data (UKCAT and PEA scores) and medical school outcomes were available for
2,107 medical school entrants enrolled in 19 UK medical schools in 2008 and followed up until
2013. Since the outcomes utilized were local measures derived from participating universities,
mediation effects were investigated using multilevel structural equation modelling with university
taken as high level variable. The results revealed statistically significant mediation effects of PEA in
the first two years of pre-clinical training (years one and two) and first year of clinical training (year
four) for theory based exams. No mediation effects were detected in any year of training for skills
based exams. The results suggest that, for the most part, the UKCAT adds value when used as a
selection tool over and above previous educational achievement.
36. Forecasting Potential School District Effectiveness Trends in Ohio State: Using
Bayesian Hierarchical Longitudinal Model to Inform Policy Decision-Making
Xinyu Ni, Alex J. Bowers & Yilin Pan
The purpose of this study is to apply a Bayesian statistical approach to a hierarchical growth
modeling framework to predict longitudinal U.S. school district effectiveness trajectories as a
means to inform cross-district improvement and evidence-based policymaking. Previous district
effectiveness research has successfully incorporated the use of time-nested hierarchical growth
models to identify significantly outperforming school districts from entire population in a state,
however, no research to date has attempted to build forecasting models to accurately predict future
school district performance. Providing reliable performance forecasting for local education agencies
could provide a new means to help inform decision-making by local and state-level policymakers.

59
In the present study we trained a time-nested Bayesian hierarchical growth model on the first three
years of test-score data from a seven-year longitudinal dataset of all school districts in Ohio
(n=610), and then predicted future four-year district effectiveness with Markov Chain Monte Carlo
(MCMC) techniques in the Rstan program. This model incorporated appropriate individual prior
distributions controlling for district demographic characteristics and specified an AR1
autocorrelation. Our results indicate that the majority of district trajectories can be forecasted with
acceptable accuracies, predicting individual local district performance trends for each district in
Ohio for the first time.
37. Comparison of Approaches to Examining Moderators of Change in Latent Change
Score Models
Holly O'Rourke & Kevin J. Grimm
When using latent change score (LCS) models, researchers often are interested in examining
moderators of longitudinal change, which traditionally have been investigated using a multiple
group approach (McArdle & Grimm, 2010). In this study, we proposed a new method for
examining moderators of longitudinal change in LCS models using definition variables, and
compared the definition variable approach to the multiple group approach. One benefit of using the
definition variable approach is the easy examination of moderators with more than two levels, or
continuous moderators. To this end, we conducted a simulation that used both approaches to
examine moderators of change in bivariate LCS models. Conditions included group differences in
fixed and random parameters, and number of levels and scale in moderating variables. For each data
set generated, we fit a LCS model to the data using a definition variable approach and a multiple
group approach. Results indicated that the multiple group and definition variable approaches
produced comparable and unbiased results fitting bivariate LCS models with categorical predictors,
although the definition variable approach models took more time to converge. The efficient
investigation of continuous moderators of change was the main benefit of using the definition
variable approach for bivariate LCS models.
38. Planned Missing Data Design with Larger Multi-Form Designs
Youngha Oh, Rong Chang, & Jaehoon Lee
Planned missing data (PMD) designs are becoming popular because of their extreme advantages.
Data collection is the most time-consuming and high cost part of conducting research. PMD can
make research cost effective, and it permits researchers a great deal of control over their studies
efficiently (Little & Rhemtulla, 2013). Especially, multi-form planned missing data designs allow
fewer questions for participants without causing fatigue and practice effects. They also have the
benefit of improving data quality (e.g., reliability and validity; Little & Rhemtulla, 2013). There are
several simulation studies for three-form planned missing data designs, yet no simulation study has
been conducted with the larger multi-form designs such as 6-form and 10-form. The advantage of
these larger designs (> 3-forms, e.g., 6-form, 10-form) is that researchers can address more
questions (Graham et al., 2006). Although previous research proved the 3-form design is
manageable for a small sample size, dealing with larger multiple forms has a disadvantage. The
fundamental disadvantage of larger designs is that it requires a very large sample size. Otherwise,
these designs are not appropriate. This study explores this question by using simulated 6-form and
10-form PMD. The purpose of this study is to identify how large sample size is required for the
larger multi-form designs. The simulation design involved three latent models; a one-time-point and
a two-time-point confirmatory factor analysis (CFA) model. Both full information maximum
likelihood (FIML) and multiple imputation (MI) were used to handle the missing data. This study
will focus on model convergence, parameter estimate bias, standard error bias, mean squared error

60
(MSE), and relative efficiency (RE) in order to evaluate the models. Results showed the larger form
reduced the convergence rates for the small sample size, as well as increased the parameter bias.
39. Using the Integrative Data Analysis Framework to Study Child Development
Fan Pan, Jin Liu, & Christine Distefano
The Behavioral and Emotional Screening System (BESS; Kamphaus & Reynolds, 2015) was
designed to be a reliable and accurate predictor of a variety of behavioral and emotional problems
of children is widely used by many schools in the United States and worldwide. However, the forms
include different items for different age groups (e.g., preschool, child, adolescent), making
examination of behavioral and emotional problems over time difficult. Typically, longitudinal
investigations require the same assessment at each time point. To combat this, the methodological
framework termed Integrative Data Analysis (IDA; Hussong & Curran, 2007) may allow for
examination of change over time when items differ, but construct definitions remain constant. This
study will pooled data across preschool and child forms to investigate the transition from preschool
to first grade. Using IDA, and a focus on internalizing problem behaviors, a mixture growth
modeling framework was used to examine patterns of development as children transitioned to the
school environment. The results uncovered different classes of development and growth, which
may be used to design interventions to assist young children.
40. A further exploration of the Principal-Component-Auxiliary approach for Missing
Data Imputation
Pavel Panko, Kyle Lang, & Todd Little
There are several strategies for including auxiliary variables for informing missing data handling
procedures, each with its own drawbacks. However, the recently established Principal-Component-
Auxiliary (PC-Aux) method maximizes the utility of the all-inclusive method while minimizing its
weaknesses. Through the use of principal components, the information-dense portion of the
auxiliary variables is used to inform missing data handling with a leaner set of predictors of
missingness. The current study examines the PC-Aux implementation for multiple imputation using
the R package paveR and compares paveR to other multiple imputation packages using Markov
Chain Monte Carlo methods.
41. Examining parametric bootstrap confidence intervals for indirect effects: Simulation,
application, and software implementation Ivan Jacob Pesigan, Iris Sun Rongwei, & Shu Fai Cheung
The parametric bootstrap (PB) method, sometimes called parametric simulation, is a useful
procedure for constructing confidence intervals for indirect effects. It is a re-sampling procedure
where a parametric model is fitted to the data. Afterwards, samples of random numbers are drawn
from this fitted data. Even though parametric assumptions are invoked for ˆa and ˆb, no parametric
assumptions are made about the distribution of ˆab.Similar to the non-parametric confidence
intervals, PB confidence intervals can be asymmetric and thus are useful in situations where the
sampling distribution of a parameter estimate is not necessarily normal. The parametric bootstrap
method, differs from the more commonly used non-parametric bootstrapping procedure wherein
cases are re-sampled. Because PB is not limited to using cases from the empirically obtained
sample,the sampling distribution produced is smoother than the non-parametric counterpart making
PB more accurate in higher confidence levels, smaller sample size, and when the sampling
distribution is highly skewed. Furthermore, since PB only requires summary data, it is useful for
examining indirect effects in other analytic methods such as meta-analysis. We summarize the
results of a simulation study comparing PB with other competing methods both in primary studies
61
and meta-analysis, particularly meta-analytic structural equation modeling; demonstrate the use of
the procedure in an applied setting; and discuss implementation of the procedure in R.
42. Consideration on validity and consistency of Value-Added school performance
measures
Yoon Ah Song & Brandon C. LeBeau
Linear mixed models (LMMs), also known as one kind of value added models (VAMs) (Lockwood
et al 2003) have been used to measure individual student growth and relative school performance in
education field. However, there are a few studies that explore whether the school performance
measure obtained from VAMs are valid or reliable measure of school performance (Rubin et al,
2004). This simulation study, therefore, will focus on exploring possible evidence to support the use
of VAMs by looking into how various model specifications and different random school
distributions affect school variance estimate and the consistency of school performance measures.
43. Comparing methods for adding control variables in Structural Equation Modeling
Suppanut Sriutaisuk & Sunthud Pornprasertmanit
Control variables or covariates are widely used since including them can provide more accurate
estimates and rule out alternative explanations. A Monte Carlo simulation was conducted to
examine the performance of four analysis models representing different covariate effect
specifications in Structural Equation Modeling. In addition to the analysis models, the design
conditions include the sizes of factor loadings, structural coefficients, coefficients from covariates
to latent variables (covariate effects), coefficients from covariates to manifest variables (DIF) and
sample size. As expected, the results indicated that the omission of the covariate led to biased
estimates in every condition, while the specification in which the covariate effects were included,
but no DIF, yielded biased estimates when DIF was nonzero. Further, whereas the analysis model
which included all possible paths from the covariate to manifest variables yielded a perfect fit and
unbiased unstandardized estimates across all conditions, the standardized structural coefficients
were misleading because the specification altered the meaning of the constructs through the change
of the latent variances. We further discuss how and when each method is appropriate. In general,
our recommendation is that researchers should specify covariates at the latent-level, and may free
more paths from covariates to manifest variables when necessary.
44. Evaluating intervention programs across multiple outcomes: Multivariate latent
growth modeling approaches
Congying Sun
Most intervention studies include multiple measures, but use the univariate approaches to evaluate
the intervention programs. It is unknown how the general literacy ability is influenced by the
intervention, and it is also unknown the extent to which the intervention effects might be general
versus specific. The current study evaluated five reading programs for adolescent struggling readers
(ASRs) using the multivariate latent growth modelling approaches. 665 6th – 8th students were
randomly assigned to one condition and received one year intensive reading instruction. They were
tested three times per semester on AimsWeb Reading Fluency as well as Word Attack, Letter-Word
Identification, Passage Comprehension, Reading Fluency and Spelling. The results suggested that
ASRs had an integrated literacy system measured by these six tests. The curve of factor model
showed significant growth in the literacy ability, but little variability in the amount of change across
students (autoregression R-square > .95). The factor of curve model failed to fit a common slope
factor due to the little variation in slopes and the low correlations among slopes. Based on these two
62
models, we found three programs showing significant treatment effects on the literacy ability, but
their treatment effects varied across measures.
45. Surfacing classifications of student interest in a multi-user virtual environment
Shane Tutwiler & Jason A. Chen
Latent growth modeling allows for changes in continuous constructs to be modeled over time. Post-
hoc analyses of such models often hint at the potential existence of latent profiles based on the
intercept and slope in the construct being measured. The authors (2016) previously measured the
decay in student interest in a science-based educational video game over time, and used the latent
intercept and slope variables as predictors of gains in auxiliary constructs such as science self-
efficacy. Post-hoc analyses hinted at the existence of two unique classes, with uniformly high (or
low) intercepts and slopes. Using the BCH method in MPlus (Asparouhov & Muthén, 2014), we
test the existence of these latent classes and their relationship to distal variables of interest.
46. A web-based effect-size calculator for t-tests, ANOVA, multiple regression, and
multilevel modeling
James Uanhoro
I present a web-based effect-size calculator for the computation of effect sizes in the context of t-
tests, analysis of variance (ANOVA), multiple regression, and multilevel modeling. The inputs for
the calculator are values which can be obtained from commonplace statistical software. Within the
context of t-tests, ANOVA, and multiple regression, non-central distributions are used to construct
confidence intervals, which are returned alongside point estimates of the different effect size
measures. This web-based calculator accomplishes this using the MBESS R package via the
OpenCPU API. Within the multilevel modeling context, point estimates for the different reduction
in variance estimates (pseudo R2) are computed.
47. Best Practices for Conducting Multiple Imputation in Latent Class Analysis When the
MAR Assumption Requires Covariates
Marcus Waldman & Katherine Masyn
Despite the burgeoning popularity of person-centered analyses using latent class models, there
exists very little guidance for applied researchers to appropriately treat missing data in the contexts
that researchers would most likely encounter. For example, consider the situation when the missing-
at-random (MAR) assumption is only tenable conditional on a set of auxiliary covariates and these
covariates themselves contain missing values. The lack of guidance to deal with missingness when
fitting latent class models is especially problematic given that multiple imputation (MI) for
multivariate data procedures assume that the missing values are drawn from a single-class
population. Consequently, the class enumeration process using the imputed data is likely to result in
an under-extraction of latent classes relative to the true number in the population (Enders, 2010;
Enders & Gottschall, 2011; Sterba, 2016). We propose a multiple imputation procedure that does
not assume the data are drawn from a single-class population. Instead, we draw multiple
imputations by sampling from the posterior distribution of a latent class model that includes
auxiliary covariates as indicators of class membership. We conduct a simulation study comparing
the proposed method to traditional, single-class approaches in high- vs. low- separation settings and
at varying rates of missingness. We discuss recommendations for specifying the number of classes
in the imputation model.
63
48. A pseudo-reliability coefficient for latent class models
Shuangshuang Xu, Yunxiao Chen, Yang Liu, & Shuangshuang Xu
The current study investigates a Mutual Information Index (MII) measure for latent class models
(LCMs), where the latent variables being measured are categorical. LCMs, including cognitive
diagnosis models (CDMs), are typically used when classifying individuals into subgroups based on
their item responses. The need for this study was highlighted by the fact that reliability is an
important measure of the quality of psychological tests, and that there lacks a consensus on the
definition of reliability measures for LCMs nevertheless. The proposed MII has desirable theoretical
properties and can be applied to both fixed and computerized adaptive testing designs. In our study,
we demonstrate that the MII increases as more items are added to the test, whereas the mean
classification error decreases. When 100 items are entered, the maximum overall MII will achieve
0.95. When more than 35 items are entered, the overall MII exceeds 0.8 and the corresponding
mean classification error is no more than 0.15. We also demonstrated with simulated data that the
model-data fit of calibrated CDMs/LCMs should be established prior to the calculation of any
measures of reliability and classification quality. Furthermore, we illustrate the use of the proposed
reliability measure with several empirical data.
49. Investigating Measurement Invariance across Ethnicity Groups on Students’
Perception of Math
Lihua Yang, Xinya Liang, & Wen-juo Lo
In confirmatory factor analysis (CFA), measurement invariance (MI) is essential for comparison of
latent factor scores across multiple groups. The traditional MI analysis typically starts with a fully
non-invariant model, and tests for configural, metric, and scalar invariance models using exact
invariance constraints. Alternatively, the Bayesian approach uses an informative prior on the
differences between group parameters to allow approximate measurement invariance. This study
empirically compares the two approaches using the scale with six items measuring “how people
important to you view mathematics” in PISA. Understanding potential influences on students’
perceptions of math from parents and peers can provide valuable information for facilitating the
educational process. Measurement invariance was tested for multiple ethnicity subpopulations. An
exploratory factor analysis has identified a two-factor structure, and items potentially crossly loaded
on the untargeted factors. Bayesian CFA is used for detecting the cross-loadings and determining
the final factor structure. We then compare the Bayesian approach to the traditional method for
multiple-group MI analyses. The sensitivity of outcomes to different Bayesian priors is also
examined. This study offers insight for different MI applications, and provides evidence for the
utility of the PISA scale for group-level analysis.
50. Deciding on Number of Classes in Latent Class Analysis Using Bayesian Non-
parametric Methods
Yuzhu Yang & Sarah Depaoli
Latent class analysis (LCA) is statistical tool for identifying unobserved groups (i.e., classes) and
assigning group membership for individual cases. Correctly deciding on the number of latent
classes can be essential to LCA. Traditional approaches to guiding the decision on the number of
classes include using model fit measures, such as Akaike’s Information Criterion (AIC), Bayesian
Information Criterion (BIC) and so forth. The issue with this information criterion (IC) based
approach is that the number of latent classes heavily relies on the performance of model selection
techniques, which has been criticized throughout the methodological literature. In this paper, we
propose an alternative approach, which applies the Bayesian non-parametric method in LCA.
Specifically, we estimate the number of latent classes using the Dirichlet process (DP) mixture

64
modeling technique. Instead of assuming a fix number of classes, DP estimates the number as a
parameter and allows this parameter to change with the data. One of the benefits of this non-
parametric method is that it can be more flexible in a dynamic modeling framework and a large-
scale data analysis situation. We conduct a simulation study that examines and compares DP with
two traditional LCA approaches including the IC-based method and the k-means clustering method.
We hypothesize that DP will outperform the traditional LCA methods when the number of classes is
getting larger and when the class proportions are getting more extreme. Implications and
recommendations to the applied researchers will be discussed.
51. Analyzing student high school mathematics among STEM college graduates:
Hierarchical Cluster Analysis Heatmap and Latent Class Analysis
Yihan Zhao & Alex J. Bowers
The purpose of this study is to connect recent innovations in mixture modeling and latent class
analysis (LCA) with “big data” visual analytics, namely cluster analysis heatmaps, to provide a
novel means to visualize the full data patterns in LCA studies. While LCA is a well-known method
to identify homogenous subgroups within heterogeneous data, researchers have lacked a means to
visualize the individual patterns within the latent classes. Alternatively, cluster analysis heatmaps
have been used extensively for the last 20 years to visualize large datasets and cluster individual
data patterns. In this study we present a combination of the methods and illustrate with an example,
in which we first identify a four subgroup LCA of students’ mathematics attitude in high school
based on 12 survey items from the nationally generalizable dataset Education Longitudinal Study of
2002 (ELS:2002), (n=3,389). We then visualize the entire set of data patterns within each latent
class using cluster analysis heatmaps in which each student’s responses is represented by color
blocks (from red to blue). This form of LCA and heatmap visualization provides a novel means for
researchers and practitioners to visualize the richness of the data around progression in high school
through college into STEM.

65
DATIC Workshops 2017
Structural Equation Modeling using Mplus
Instructor: D. Betsy McCoach June 5th-9th, 2017
This introductory workshop on Structural Equation Modeling covers basics of path analysis,
confirmatory factor analysis, and latent variable modeling. Using Mplus, participants will learn how to
build, evaluate, and revise structural equation models. Although the workshop does not require any prior
knowledge or experience with SEM, participants are expected to have a working knowledge of multiple
regression, as well as some experience using a statistical software program such as SPSS.
Longitudinal Modeling using MPlus
Instructor: D. Betsy McCoach June 15th-17th, 2017
During this a three-day workshop, students will learn how to model longitudinal data using Mplus. The
workshop focuses on fitting and interpreting autoregressive and growth curve models in Mplus.
Specifically, we will cover linear, polynomial, multiphase, non-linear growth curve models, multivariate
growth curve models, autoregressive models, and hybrid autoregressive/growth models for both
observed variables and latent constructs. Some prior knowledge and experience in Structural Equation
Modeling is recommended.
Dyadic Data Analysis Using Multilevel Modeling with R
Instructors: David A. Kenny & Randi Garcia June 19th-23rd, 2017
The workshop on dyadic data analysis will focus on data where both members of a dyad are measured
on the same set of variables. Among the topics to be covered are the actor-partner interdependence
model, the analysis of distinguishable and indistinguishable dyads, mediation and moderation of dyadic
effects, and over-time analyses of dyadic data. All analyses will be conducted using R, but no prior
knowledge or experience with R is required. Participants are expected to have a working knowledge of
multiple regression or analysis of variance. (This workshop is sold out for 2017. Check back in late
2017 for information about the 2018 workshop.)
Multilevel Modeling Using HLM
Instructor: D. Betsy McCoach July 17-21, 2017
This workshop covers basics and applications of multilevel modeling with extensions to more complex
designs. Participants will learn how to analyze both organizational and longitudinal (growth curve) data
using multilevel modeling and to interpret the results from their analyses. Although the workshop does
not require any prior knowledge or experience with multilevel modeling, participants are expected to
have a working knowledge of multiple regression as well as some experience using statistical software
(such as SPSS, SAS, R, Stata). All analyses will be demonstrated using the software HLMv7.
Instruction will consist of lectures, computer demonstrations of data analyses, and hands-on
opportunities to analyze practice data sets using HLM. The workshop emphasizes practical applications
and places minimal emphasis on statistical theory. The workshop takes place in a computer lab, so you
do not need to bring a laptop or software. The workshop is limited to 24 participants.
For more information, visit our website: www.datic.uconn.edu

66
Call for proposals: 2018 Modern Modeling Methods (M3) conference
The Modern Modeling Methods (M3) conference is an interdisciplinary conference designed to
showcase the latest modeling methods and to present research related to these methodologies. The
8th annual M3 conference will be held May 21nd-24th, 2018 at the University of Connecticut.
Keynote speakers for the 2018 conference include Dr. Tenko Raykov (MSU) and Dr. Peter
Molenaar (Penn State).
Submissions for the 2018 conference are due 2/1/18. We welcome both methodological research
papers and papers that illustrate novel applications of methodological techniques in the area of
modeling, broadly defined. Papers related to multilevel modeling, structural equation modeling,
mixture modeling, longitudinal modeling, and item response theory are especially encouraged.
Given the interdisciplinary focus of the conference, it is completely acceptable to present papers
that have been published or presented elsewhere. Presenters may select the length of the session that
they prefer: 30 minutes, 60 minutes, or 90 minutes. We also welcome proposals for multi-paper
symposia on thematically grouped topics. Generally, symposia sessions are 90 minutes in
length. We are also soliciting proposals for the poster. Students are also encouraged to submit
proposals, especially for the poster session.
Conference proposals for the Modern Modeling Methods conference may fall into one (or more) of
four categories: Methodological Innovation, Methodological Application, Methodological
Illustration, or Methodological Evaluation. Methodological Innovation proposals introduce a new
technique. Methodological Evaluation proposals present the results of empirical research evaluating
a methodology. Most often, these will involve simulation studies. Methodological Application
proposals present the methods and results of a real research study in which the technique was used.
Methodological Illustration proposals provide a pedagogical illustration of when and how to use the
technique; these papers are designed to help the audience be able to implement the technique
themselves.
There are three different types of presentations: Paper sessions (in which authors submit a paper),
Symposia (in which a group of authors submit a set of related talks/papers), and posters.
Methodological Research paper proposals should be no longer than 1000 words and should include
purpose, background, methods, results, discussion, and significance. Methodological Illustration
paper proposals should be no longer than 1,000 words and should include a description of the
methodology to be illustrated as well as an outline of the paper/talk. Proposals for symposia should
be include titles, authors, an abstract for the symposium, and brief descriptions/abstracts for all of
the paper presentations within the symposium. Symposium proposals may be longer than 1000
words if needed, but they should be less than 2000 words. Proposals for the poster session need only
submit an abstract: the 1000 word proposal is not required for poster session proposals.
Proposals for the 2018 conference are due February 1st , 2018. Notifications of presentation status
will be emailed by February 19th, 2018. For more information about the conference and to submit
conference proposals, please visit http://www.modeling.uconn.edu/ .

67
Latent GOLD® is the #1 package for latent class modeling
It has both a point and click menu (GUI), and a powerful, flexible syntax language to
estimate latent class, latent trait and extended models based on variables of different scale
types including continuous, ordinal, nominal, and count.
Types of models include:
co-developed with Jeroen K Vermunt
Latent Class (LC) Cluster Models
Discrete Factor (DFactor) Models
LC Regression Models
Latent Markov Transition Models*
LC Extensions of Multivariate IRT, and Factor Analysis
Multilevel Extensions
Step3 Modeling
*Accommodates over 100 time points!
View the new Latent GOLD® video tutorials:
http://www.statisticalinnovations.com/video-tutorials/
Download the demo program with hundreds of examples today!
Special Academic and Student rates are available.