Models for Quantifying Risk
40
7/26/2019 Models for Quantifying Risk http://slidepdf.com/reader/full/models-for-quantifying-risk 1/40 P REFACE The analysis and management of financial risk is the fundamental subject matter of the discipline of actuarial science, and is therefore the basic work of the actuary. In order to manage financial risk, by use of insurance schemes or any other risk management technique, the actuary must first have a framework for quantifying the magnitude of the risk itself. This is achieved by using mathematical models that are appropriate for each particular type of risk under consideration. Since risk is, almost by definition, probabilistic, it follows that the appropriate models will also be probabilistic, or stochastic, in nature. This textbook, appropriately entitled Models for Quantifying Risk , addresses the major types of financial risk analyzed by actuaries, and presents a variety of stochastic models for the actuary to use in undertaking this analysis. It is designed to be appropriate for a two- semester university course in basic actuarial science for third-year or fourth-year undergraduate students or entry-level graduate students. It is also intended to be an appropriate text for use by candidates in preparing for Exam MLC of the Society of Actuaries or Exam 3L of the Casualty Actuarial Society. One way to manage financial risk is to insure it, which basically means that a second party, generally an insurance company, is paid a fee to assume the risk from the party initially facing it. Historically the work of actuaries was largely confined to the management of risk within an insurance context, so much so, in fact, that actuaries were thought of as “insurance mathematicians ” and actuarial science was thought of as “insurance math.” Although the insurance context remains a primary environment for the actuarial management of risk, it is by no means any longer the only one. However, in recognition of the insurance context as the original setting for actuarial analysis and management of financial risk, we have chosen to make liberal use of insurance terminology and notation to describe many of the risk quantification models presented in this text. The reader should always keep in mind, however, that this frequent reference to an insurance context does not reduce the applicability of the models to risk management situations in which no use of insurance is involved. The text is written in a manner that assumes each reader has a strong background in calculus, linear algebra, the theory of compound interest, and probability. (A familiarity with statistics is not presumed.) This edition of the text is organized into three sections. The first, consisting of Chapters 1-4, presents a review of interest theory, probability, Markov Chains, and stochastic simulation, respectively. The content of these chapters is very much needed as background to later
-
Upload
sekar-deatama -
Category
Documents
-
view
231 -
download
0
Transcript of Models for Quantifying Risk

7/26/2019 Models for Quantifying Risk
http://slidepdf.com/reader/full/models-for-quantifying-risk 1/40
PREFACE
The analysis and management of financial risk is the fundamental subject matter of thediscipline of actuarial science, and is therefore the basic work of the actuary. In order to
manage financial risk, by use of insurance schemes or any other risk management technique,the actuary must first have a framework for quantifying the magnitude of the risk itself. This isachieved by using mathematical models that are appropriate for each particular type of risk
under consideration. Since risk is, almost by definition, probabilistic, it follows that theappropriate models will also be probabilistic, or stochastic, in nature.
This textbook, appropriately entitled Models for Quantifying Risk , addresses the major typesof financial risk analyzed by actuaries, and presents a variety of stochastic models for the
actuary to use in undertaking this analysis. It is designed to be appropriate for a two-semester university course in basic actuarial science for third-year or fourth-yearundergraduate students or entry-level graduate students. It is also intended to be anappropriate text for use by candidates in preparing for Exam MLC of the Society ofActuaries or Exam 3L of the Casualty Actuarial Society.
One way to manage financial risk is to insure it, which basically means that a second party,generally an insurance company, is paid a fee to assume the risk from the party initiallyfacing it. Historically the work of actuaries was largely confined to the management of risk
within an insurance context, so much so, in fact, that actuaries were thought of as “insurancemathematicians” and actuarial science was thought of as “insurance math.” Although theinsurance context remains a primary environment for the actuarial management of risk, it is
by no means any longer the only one.
However, in recognition of the insurance context as the original setting for actuarial analysisand management of financial risk, we have chosen to make liberal use of insuranceterminology and notation to describe many of the risk quantification models presented in this
text. The reader should always keep in mind, however, that this frequent reference to aninsurance context does not reduce the applicability of the models to risk management
situations in which no use of insurance is involved.
The text is written in a manner that assumes each reader has a strong background in calculus,linear algebra, the theory of compound interest, and probability. (A familiarity with statisticsis not presumed.)
This edition of the text is organized into three sections. The first, consisting of Chapters 1-4, presents a review of interest theory, probability, Markov Chains, and stochastic simulation,respectively. The content of these chapters is very much needed as background to later

7/26/2019 Models for Quantifying Risk
http://slidepdf.com/reader/full/models-for-quantifying-risk 2/40
iv PREFACE
material. They are included in the text for readers needing a comprehensive review of thetopics. For those requiring an original textbook on any of these topics, we recommend either
Broverman [6] or Kellison [16] for interest theory, Hassett and Stewart [12] for probability,Ross [26] for Markov Chains, and Herzog and Lord [13] for simulation.
The second section, made up of Chapters 5-14, addresses the topic of survival-contingent
payment models, traditionally referred to as life contingencies. The third section, consisting ofChapters 15-17, deals with the topic of models for interest rate risks.
The new material appearing in this edition has been added to the text to meet the new set oflearning objectives for Exam MLC, to be effective with the May 2012 administration of theexam. There are several major areas of expanded material:
(1) Part Three (Chapters 15-17) has been added to address the topic of interest rate risk,including an introduction to variable, or interest-sensitive , insurance and annuities.
(2) The new learning objectives provide that many of the models described in the text shouldalso be presented in the context of multi-state models, using the theory of Markov Chains.
Accordingly, we have inserted new Chapter 3 to provide background on Markov Chains,and have then inserted numerous applications of this theory to our actuarial modelsthroughout the text.
(3) In the prior edition of the text, the topic of contingent contract reserves was presentedin one large chapter. In the new edition, we have separated the topic into two chapters:
Chapter 10 covers net level premium benefit reserves only, and Chapter 11 addressesthe accounting notion of reserves as financial liabilities, as well as other policy values,
as suggested by the new learning objectives.
(4) Similarly, the topic of multiple decrements is now presented in two chapters: Chapter
13 addresses multiple decrement theory and Chapter 14 presents a number of applica-
tions of the theory, many in the context of multi-state models.
(5) Certain actuarial risk models are most efficiently evaluated through simulation, ratherthan by use of closed form analytic solutions. We have inserted new Chapter 4 to
provide theoretical background on the topic of stochastic simulation, and thendeveloped a number of applications of that theory to our actuarial models. Readerswho are preparing for SOA Exam MLC should be aware that this topic is not coveredon that examination. Accordingly we have placed all of the simulation applications inAppendix B in this edition.
(6) A number of minor topics have been deleted from the prior edition, including (a) the
central rate of failure, (b) use of the population functions , , x x
L T and , x
Y and (c) our
presentation of Hattendorf’s Theorem. Several notational changes have also beenmade.
The writing team would like to thank a number of people for their contributions to thedevelopment of this text.

7/26/2019 Models for Quantifying Risk
http://slidepdf.com/reader/full/models-for-quantifying-risk 3/40
PREFACE v
The original manuscript was thoroughly reviewed by Bryan V. Hearsey, ASA, of LebanonValley College and by Esther Portnoy, FSA, of University of Illinois. Portions of the
manuscript were also reviewed by Warren R. Luckner, FSA, and his graduate student LuisGutierrez at University of Nebraska-Lincoln. Kristen S. Moore, ASA, used an earlier draft asa supplemental text in her courses at University of Michigan. Thorough reviews of theoriginal edition were also conducted by James W. Daniel, ASA, of University of Texas,
Professor Jacques Labelle, Ph.D., of Université du Québec à Montréal, and a committeeappointed by the Society of Actuaries. A number of revisions in the Second Edition werealso reviewed by Professors Daniel and Hearsey; Third Edition revisions were reviewed byProfessors Samuel A. Broverman, ASA (University of Toronto), Matthew J. Hassett, ASA(Arizona State University), and Warren R. Luckner, FSA (University of Nebraska-Lincoln).All of these academic colleagues made a number of useful comments that have contributed
to an improved published text.
The new topics contained in this edition were researched for us by actuaries with consider-able experience in their respective fields, and we wish to acknowledge their valuable
contributions. They include Ronald Gebhardtsbauer, FSA (Penn State University) forSection 14.5, Ximing Yao, FSA (Hartford Life) for Chapter 16, and Chunhua (Amy) Meng,
FSA (Yindga Taihe Life) for Chapter 17.
The new material added to this Fourth Edition was also reviewed by Professor Luckner, as well
as by Tracey J. Polsgrove, FSA (John Hancock USA), Link Richardson, FSA (AmericanGeneral Life), Arthur W. Anderson, ASA, EA (The Arthur W. Anderson Group), Cheryl AnnBreindel, FSA (Hartford Life), Douglas J. Jangraw, FSA (Massachusetts Mutual Life), Robert
W. Beal, FSA (Milliman Portland), Andrew C. Boyer, FSA (Milliman Windsor), and MatthewBlanchette, FSA (Hartford Life), who also contributed to the Chapter 17 exercises.
Special thanks goes to the students enrolled in Math 287-288 at University of Connecticutduring the 2004-05 academic year, where the original text was classroom-tested, and to
graduate student Xiumei Song, who developed the computer technology material presented in
Appendix A.
Thanks also to the folks at ACTEX Publications, particularly Gail A. Hall, FSA, the projecteditor, and Marilyn J. Baleshiski, who did the typesetting and graphic arts for all editions.
Kathleen H. Borkowski designed the cover for the first two editions, and Christine Phelpsdid the same for the latter two editions.
Finally, a very special acknowledgment is in order. When the Society of Actuaries publishedits textbook Actuarial Mathematics in the mid-1980s, Professor Geoffrey Crofts, FSA, then
at University of Hartford, made the observation that the authors’ use of the generic symbol Z as the present value random variable for all insurance models and the generic symbol Y asthe present value random variable for all annuity models was confusing. He suggested that
the present value random variable symbols be expanded to identify more characteristics ofthe models to which each related, following the principle that the present value randomvariable be notated in a manner consistent with the standard International Actuarial Notation
used for its expected value. Thus one should use, for example, : x n Z in the case of the
continuous endowment insurance model and |n x
Y in the case of the n-year deferred annuity-

7/26/2019 Models for Quantifying Risk
http://slidepdf.com/reader/full/models-for-quantifying-risk 4/40
vi PREFACE
due model, whose expected values are denoted : x n A and | ,
n xa respectively. Professor
Crofts’ notation has been adopted throughout our textbook, and we wish to thank him for
suggesting this very useful idea to us.
We wish you good luck with your studies and your exam preparation.
Robin J. Cunningham, FSA Winsted, ConnecticutSan Rafael, California June 2011
Thomas N. Herzog, ASAReston, Virginia
Richard L. London, FSA
Storrs, Connecticut

7/26/2019 Models for Quantifying Risk
http://slidepdf.com/reader/full/models-for-quantifying-risk 5/40
267
CHAPTER TWELVE
MODELS DEPENDENT ON MULTIPLE SURVIVALS
(MULTI-LIFE MODELS)
All the discussion to this point in the text has focused on the complementary concepts of sur-vival and failure of a single entity, such as a single person under a life insurance policy or a lifeannuity. We consistently referred to the entity whose survival was being observed as our statusof interest , and we defined what constituted survival (and therefore failure) in each particularcase. This generic approach to the concept of survival will be continued in this chapter.
We now consider the case where the status of interest is itself made up of two or more entities,such as two separate individual lives. In actuarial science such models are said to involve multi-
ple lives and are known as multi-life models. We will develop the theory of multi-life models inthe two-life case first, and then show how it is easily extended to more than two lives.
We will also need to distinguish whether the two individual lives comprising a multi-lifestatus have independent or dependent future lifetimes. The assumption of independence willsimplify our work to some extent, and is presumed wherever needed throughout the chapter.Independence is not presumed for the discussion in Sections 12.5 and 12.6.
12.1 THE JOINT-LIFE MODEL
A joint -life status is one for which survival of the status requires the survival of all (or both,
in the two-life case) of the individual members making up the status. Accordingly, the status
fails upon the first failure of its component members.
12.1.1 THE TIME-TO-FAILURE R ANDOM VARIABLE FOR A JOINT-LIFE STATUS
Consider a two-life joint status, made up of lives that are ages x and y as of time 0. We use
the notation ( ) xy to denote such a status,1 and we use xyT to denote the random variable for
the future lifetime (or time-to-failure) of the status. From the definition of failure it is clear
that xyT will be the smaller of the individual future lifetimes denoted by xT and . yT That is,
min( , ). xy x yT T T (12.1)
Our analysis of the future lifetime random variable xy
T will parallel that for the individual
life xT presented in Section 5.3. Indeed, by using the generic concept of a status or entity,
the two cases of xyT and xT are really the same except for the different notation.
1 If numerical ages are used instead of the letters x and y, such as if 20 x and 25, y for example, the status is
denoted (20:25). The colon would also be used to denote the status ( : ). x n y n

7/26/2019 Models for Quantifying Risk
http://slidepdf.com/reader/full/models-for-quantifying-risk 6/40
268 CHAPTER TWELVE
12.1.2 THE SURVIVAL DISTRIBUTION FUNCTION OF xyT
We begin our analysis of the random variable xyT with its SDF, given by
( ) ( ) xy xyS t Pr T t (12.2)
and denoted by t xy p in standard actuarial notation. Since survival of the status itself requiresthe survival of both component members of the status, then assuming independence of theindividual lifetimes we have
,t xy t x t y p p p (12.3)
which is the bridge between joint-life and individual life functions. Equation (12.3) will al-
low us to evaluate many joint-life functions from a single-life tabular survival model.
12.1.3 THE CUMULATIVE DISTRIBUTION FUNCTION OF xyT
The CDF of xyT is given by
( ) 1 ( ) ( ), xy xy xy F t S t Pr T t (12.4)
and is denoted by t xyq in actuarial notation. It follows that
1t xy t xyq p (12.5a)
for all t . If the individual lifetimes are independent, then we can write
1
1 (1 )(1 ) .
t xy t x t y
t x t y t x t y t x t y
q p p
q q q q q q
(12.5b)
Equation (12.5b) illustrates a very basic concept in probability. t xyq denotes the probability
that the joint status fails before (or at) time t , which occurs if either or both of the individual
lives fail before (or at) time t . Since the events ( ) xT t and ( ) yT t are not mutually exclu-
sive, the probability of the union event, which is ,t xyq is given by the general addition rule
reflected in Equation (12.5b).
As in the individual life case discussed earlier in the text, the pre-subscript t is suppressed in
the special case of 1.t Thus we have
(1) ( 1) xy xy xy p S Pr T (12.6a)
and
1 (1) ( 1). xy xy xy xyq p F Pr T (12.6b)

7/26/2019 Models for Quantifying Risk
http://slidepdf.com/reader/full/models-for-quantifying-risk 7/40
MODELS DEPENDENT ON MULTIPLE SURVIVALS 269
EXAMPLE 12.1
If xT and yT are independent, and each is uniformly distributed over each year of age sepa-
rately, show that, for 0 1,t
2
(1 ) (1 ) .t xy x y y x x yq t q t q t q t q t q q SOLUTION
With independent lifetimes we have, from Equation (12.5b),
.t xy t x t y t x t yq q q q q
Under UDD this becomes
2
2 2 2
2(1 ) (1 ) ,
t xy x y x y
x x y y x y x y
x y y x x y
q t q t q t q q
t q t q q t q t q q t q q
t q t q t q t q t q q
as required.
12.1.4 THE PROBABILITY DENSITY FUNCTION OF xyT
The PDF of xyT is defined by
( ) ( ) ( ). xy xy xyd d f t F t S t dt dt
(12.7)
In the special case of independence, we have
( ) ( )
( )
[ ( ) ( )]
( ),
xy xy
t x t y
t x t y t y t x
t x t y y t t y t x x t
t x t y y t t y t x x t
t xy x t y t
d f t S t dt
d p pdt
d d p p p pdt dt
p p p p
p p p p
p
(12.8)
where we have used Equation (6.21) for t xd dt
p and .t yd dt
p

7/26/2019 Models for Quantifying Risk
http://slidepdf.com/reader/full/models-for-quantifying-risk 8/40
270 CHAPTER TWELVE
12.1.5 THE HAZARD R ATE FUNCTION OF xyT
Recall that a hazard rate function (HRF) measures the conditional instantaneous rate of fail-
ure at precise time t , given survival to time t . For individual lives in a life insurance context
we refer to the hazard rate as the force of mortality; in the context of a joint status it is more
appropriate to view the hazard rate as a force of failure rather than a force of mortality. Re-
gardless of the terminology used, the HRF is defined as
( )( ) .
( )
xy xy
xy
f t t
S t (12.9a)
In the special case of independent lives we have
( )( ) .
t xy x t y t
xy x t y t t xy
pt
p
(12.9b)
In standard actuarial notation the HRF is denoted by : , x t y t 2 so we have
: . x t y t x t y t (12.9c)
This shows that the force of failure acting on the joint status is the sum of the forces of fail-
ure (or forces of mortality) acting on the individual components (lives) in the case of inde-
pendent lives.
12.1.6 CONDITIONAL PROBABILITIES
The conditional failure probability, denoted by |n xq in the single-life case, has its counter-
part in the joint-life case. We define
| ( 1),n xy xyq Pr n T n (12.10)
the probability that the time of failure of the joint status occurs in the ( 1) st n time interval.3
Since failure of the status occurs with the first failure of the individual components, then
|n xyq denotes the probability that the first failure occurs in the ( 1) st n interval. Thus we
have
1
:
|
(1 )
n xy n xy n xy
n xy x n y n
q p p
p p
(12.11a)
: .n xy x n y n p q (12.11b)
2 Note that the joint status HRF is a function of t , with the identifying characteristics of its component members( x) and ( y) fixed at time 0.t To reinforce the idea that the joint status HRF is a function of t only, some texts
prefer the notation ( ). xy t (See, for example, Section 9.3 of Bowers, et al . [4] .)3 Recall the discrete random variable *, x K defined in Chapter 5 as the time interval of failure for the status ( x). Ifwe now define *
xy K as the random variable for the interval of failure of the joint status ( ), xy we have*
| ( 1).n xy xyq Pr K n

7/26/2019 Models for Quantifying Risk
http://slidepdf.com/reader/full/models-for-quantifying-risk 9/40
MODELS DEPENDENT ON MULTIPLE SURVIVALS 271
In the case of independent lives we can evaluate |n xyq from the life table using
1 1| .n xy n x n y n x n yq p p p p (12.12)
EXAMPLE 12.2
If xT and yT are independent, calculate the value of 2 | xyq given the following values:
1 2
1 2
.08 .09 .10
.10 .15 .20
x x x
y y y
q q q
q q q
SOLUTION
2 | xyq denotes the probability that the joint-life status fails in the third year, which is also
denoted by *( 3). xy Pr K Here we have
2 2 2: 2
2 2 2 2
|(1 )
(.92)(.91)(.90)(.85)[1 (.90)(.80)] .17932.
xy xy x y
x y x y
q p q p p p p
12.1.7 MOMENTS OF xyT
The expected value of xyT gives the complete expectation of future “lifetime” of the joint
status. It is denoted by xye
in actuarial notation and defined by
0[ ] ( ) xy xy xye E T t f t dt
(12.13a)
0,t xy p dt
(12.13b)
the joint status counterpart to Equation (5.48d). The second moment is given by
2 2
0[ ] ( ) , xy xy E T t f t dt
(12.14)
and the variance of xyT follows as
22( ) [ ] [ ] . xy xy xyVar T E T E T (12.15)
Similarly, we can define the curtate expectation of future lifetime for the joint status, the
counterpart to the single-life function of Section 6.3.4, as
1
xy k xy
k
e p
(12.16)

7/26/2019 Models for Quantifying Risk
http://slidepdf.com/reader/full/models-for-quantifying-risk 10/40
272 CHAPTER TWELVE
and the temporary curtate lifetime as
:1
.n
k xy xy nk
e p
(12.17)
Note that: xy n
e represents the average number of whole years of survival within the next n
years for the joint status ( ). xy
EXAMPLE 12.3
Let xT and yT be independent time-to-failure random variables, each with exponential dis-
tributions with hazard rates x and , y respectively. Find an expression for . xye
SOLUTION
We know that xt t x p e and ,
t t y p e
so under independence we have
( ). x yt t xy t x t y p p p e
This shows us that xyT has an exponential distribution with hazard rate , x y so
1[ ] . xy xy x y
e E T
12.2 THE LAST-SURVIVOR MODEL
A last - survivor status is one for which survival of the status requires the survival of any one
(or more) of its component members. That is, the status is said to survive as long as at least
one of its members survives, so that it fails only when all of its members have failed. Then thetime of failure of the status is the time of the last failure among its components, or the second
failure in the two-life case. Note that the n-year certain and continuous annuity, defined in Ex-
ample 8.14, is a special case of a last-survivor status, since the annuity pays until the second
failure out of (40) and 10 . The APV of this annuity is denoted40:10
a in actuarial notation.
12.2.1 THE TIME-TO-FAILURE R ANDOM VARIABLE
FOR A LAST-SURVIVOR STATUS
For a two-life last-survivor status composed of the individual lives ( ) x and ( y), we denote
the status itself by ( ) xy and the random variable for the future lifetime of the status by . xyT
Since the status fails on the last failure, then xyT will be the larger of the individual futurelifetimes xT and . yT That is
max( , ). xy x yT T T (12.18)

7/26/2019 Models for Quantifying Risk
http://slidepdf.com/reader/full/models-for-quantifying-risk 11/40
MODELS DEPENDENT ON MULTIPLE SURVIVALS 273
12.2.2 FUNCTIONS OF THE R ANDOM VARIABLE xyT
If xT and yT are independent, then it follows that the CDF of xyT is
( ) ( ) ( ) ( ). xy xy x y F t Pr T t F t F t (12.19a)
In actuarial notation we would write
.t xy t x t yq q q (12.19b)
The SDF of xyT can then be found as
( ) ( ) 1 ( ). xy xy xyS t Pr T t F t (12.20a)
In actuarial notation, again presuming the independence of xT and , yT we have
1
1
1 (1 )(1 )
.
t xy t xy
t x t y
t x t y
t x t y t x t y
t x t y t xy
p q
q q
p p
p p p
p p p
(12.20b)
Equation (12.20b) is very important, as it allows us to express last-survivor survival proba-
bilities in terms of single-life and joint-life functions, so we will be able to evaluate last-
survivor functions from a single-life survival model or life table. Although Equation
(12.20b) was derived here assuming the independence of xT and , yT the identity is also true
for dependent lifetimes xT and , yT as we shall see in Section 12.2.3.
The PDF of xyT is then found from the SDF as
:
( ) ( )
( )
,
xy xy
t x t y t xy
t x x t t y y t t xy x t y t
d f t S t dt
d p p pdt
p p p
(12.21)
and the HRF follows as
:( )( ) .
( )
xy t x x t t y y t t xy x t y t
xy xy t x t y t xy
f t p p pt
S t p p p
(12.22)
7/26/2019 Models for Quantifying Risk
http://slidepdf.com/reader/full/models-for-quantifying-risk 12/40
274 CHAPTER TWELVE
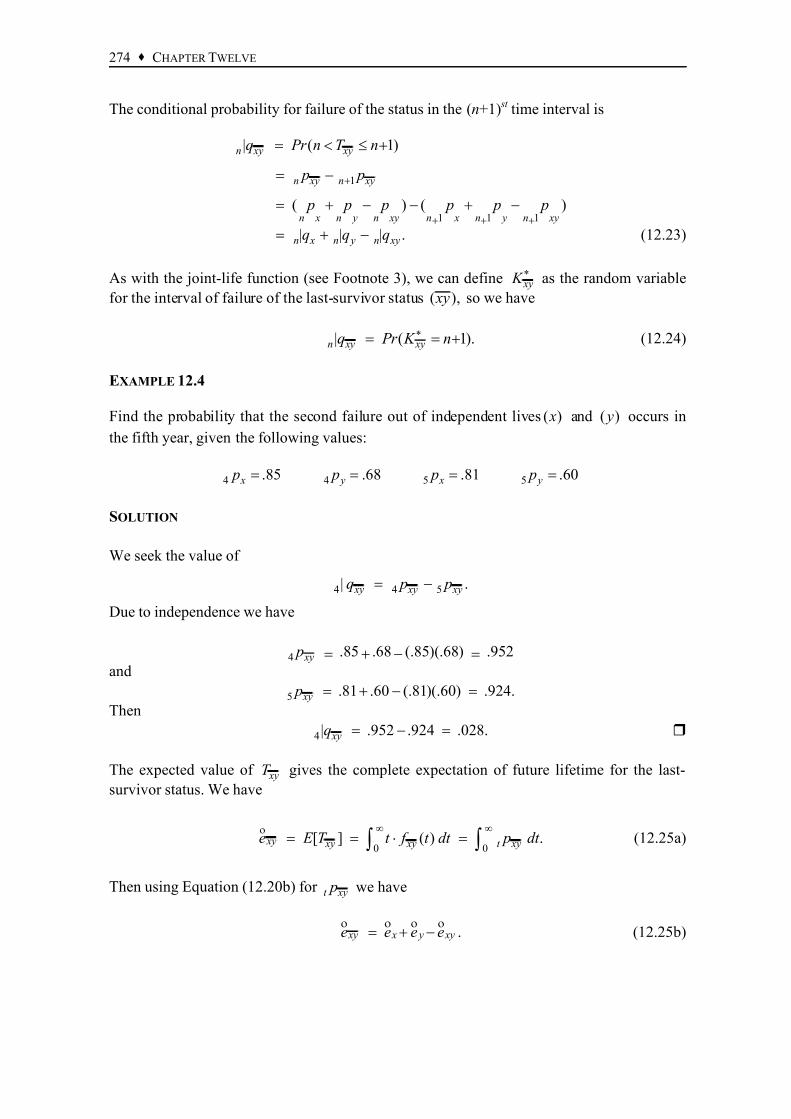
The conditional probability for failure of the status in the (n+1) st time interval is
1
1 1 1
| ( 1)
( ) ( )
| | | .
n xy xy
n xy n xy
n x n y n xy n x n y n xy
n x n y n xy
q Pr n T n
p p
p p p p p p
q q q
(12.23)
As with the joint-life function (see Footnote 3), we can define * xy K as the random variable
for the interval of failure of the last-survivor status ( ), xy so we have
*| ( 1).n xy xyq Pr K n (12.24)
EXAMPLE 12.4
Find the probability that the second failure out of independent lives ( ) x and ( ) y occurs in
the fifth year, given the following values:
4 4 5 5.85 .68 .81 .60 x y x y p p p p
SOLUTION
We seek the value of
4 4 5| . xy xy xyq p p
Due to independence we have
4 .85 .68 (.85)(.68) .952 xy p
and
5 .81 .60 (.81)(.60) .924. xy p
Then
4 | .952 .924 .028. xyq
The expected value of xyT gives the complete expectation of future lifetime for the last-
survivor status. We have
0 0[ ] ( ) . xy xy xy t xye E T t f t dt p dt
(12.25a)
Then using Equation (12.20b) for t xy p we have
. xy x y xye e e e
(12.25b)

7/26/2019 Models for Quantifying Risk
http://slidepdf.com/reader/full/models-for-quantifying-risk 13/40
MODELS DEPENDENT ON MULTIPLE SURVIVALS 275
The corresponding curtate expectation is
1
xy k xy x y xy
k
e p e e e
(12.26)
and the temporary curtate expectation is
: : : :1
.n
k xy xy n x n y n xy nk
e p e e e
(12.27)
EXAMPLE 12.5
Calculate 50:60 ,e
given that 50T and 60T are independent and each follows a survival distri-
bution given by 1100
( ) , x
x
for 0 100. x
SOLUTION
We recognize the given survival model to be uniform with 100, so we have
5050
50,t
t p
for 0 50,t 6040
40,t
t p
for 0 40,t and 50:6050 40
50 40,t
t t p
for
0 40.t We also know that 50e
25 and 60e
20. We find 50:60e
from
40
50:60 50:600
40
0
2 3 400
13
1 (50 )(40 )
20001 2000 45 14.67.
2000
t e p dt
t t dt
t t t
Then
50:60 25 20 14.67 30.33.e
12.2.3 R ELATIONSHIPS BETWEEN xyT AND xyT
Recall that xyT is the time of the first failure between ( ) x and ( ), y and xyT is the time of
the second failure. Then it follows that xyT is one of xT or yT and xyT is necessarily the
other one. Without knowing which one is which, it will still follow that
xy xy x yT T T T (12.28a)
and
. xy xy x yT T T T (12.28b)

7/26/2019 Models for Quantifying Risk
http://slidepdf.com/reader/full/models-for-quantifying-risk 14/40
276 CHAPTER TWELVE
From Equation (12.28a) we have
, xy x y xyT T T T (12.29)
which, upon taking expectations, leads directly to Equation (12.25b). By similar reasoning
we have ,t xy t xy t x t y p p p p (12.30)
from which Equation (12.20b) follows without assuming independence.
Even if xT and yT are independent, it should be clear that xyT and xyT are not. We can use
Equation (12.28b), along with other earlier results, to find the covariance of xyT and . xyT
We have
( , ) [ ] [ ] [ ] [ ] [ ] [ ], xy xy xy xy xy xy x y xy x y xyCov T T E T T E T E T E T T E T E T T T
by use of Equations (12.28b) and (12.29). But if xT and yT are independent, then
[ ] [ ] [ ], x y x y E T T E T E T
so we have
2
( , ) [ ] [ ] [ ] [ ] [ ] [ ]
.
xy xy x y xy x y xy
x y xy x y xy
x y x xy y xy xy
x xy y xy
Cov T T E T E T E T E T E T E T
e e ee e e
e e e e e e e
e e e e
(12.31)
Note that this covariance is always positive.
12.3 CONTINGENT PROBABILITY FUNCTIONS
For two individual statuses ( ) x and ( ), y we might be interested in the probability that ( ) x
will fail before ( ) y fails. A probability for an event addressing order of failures is called a
contingent probability. The event that ( x) fails before ( ) y is represented by the event. x yT T If xT and yT are independent, then we have
0( ) ( ) ( ) , x y x y Pr T T f t S t dt
(12.32a)

7/26/2019 Models for Quantifying Risk
http://slidepdf.com/reader/full/models-for-quantifying-risk 15/40
MODELS DEPENDENT ON MULTIPLE SURVIVALS 277
since if ( ) x fails at time t the event x yT T is satisfied if ( ) y has not yet failed at that time,
the probability of which is ( ). yS t In actuarial notation we have
1
0 0( ) . x y xy t x x t t y t xy x t Pr T T q p p dt p dt
(12.32b)
The “upper one” in 1 xyq is used to denote order of failure ( ( ) x must fail before ( y) to satisfy
the event), which we saw earlier in the symbol 1
: x n Z (see Section 7.1). The pre-subscript
indicates that the event is satisfied if ( ) x fails before ( ) y within unlimited time. The proba-
bility that ( ) x fails before ( ) y and within n years is therefore given by
1
0.
n
n xy t xy x t q p dt (12.33a)
Similarly we would have
1
0
.n
n xy t xy y t q p dt
(12.33b)
EXAMPLE 12.6
Show that1 1 .n xy n xy n xyq q q
SOLUTION
The result is intuitive. 1n xyq represents the probability that the first failure occurs before time
n and it is ( ), x and 1n xyq is the same probability with the first failure being ( ). y Together
they represent the probability that the first failure occurs before time n, which is .n xyq
Mathematically, using Equations (12.33a) and (12.33b) we have
1 1
0 0
:0 0( ) .
n n
n xy n xy t xy x t t xy y t
n n
t xy x t y t t xy x t y t n xy
q q p dt p dt
dt p dt q
The event that ( ) x fails after ( ) y is represented by , x yT T and we have
0( ) ( ) ( ) , x y x y Pr T T f t F t dt
(12.34a)
since if ( ) x fails at time t the event x yT T requires that ( ) y has already failed at that time,
the probability of which is ( ). y F t In actuarial notation we have

7/26/2019 Models for Quantifying Risk
http://slidepdf.com/reader/full/models-for-quantifying-risk 16/40
278 CHAPTER TWELVE
2
0
1
0 0
( ) (1 )
1 ,
x y xy t x x t t y
t x x t t xy x t xy
Pr T T q p p dt
p dt p dt q
(12.34b)
as expected. The probability that ( ) x fails after ( ) y and within n years is then
2 1
0(1 ) .
n
n xy t x x t t y n x n xyq p p dt q q (12.35)
EXAMPLE 12.7
Show that2 2 .n xy n xy n xyq q q
SOLUTION
Again the result is intuitive. Mathematically we have
2 2
0 0
0
(1 ) (1 )
( ) ,
n n
n xy n xy t x x t t y t y y t t x
n
t x x t t y y t t xy x t y t n x n y n xy n xy
q q p p dt p p dt
p p p dt q q q q
since : . x t y t x t y t
12.4 CONTINGENT CONTRACTS INVOLVING MULTI-LIFE STATUSES
All the material presented in Chapters 7 - 11 concerning contingent payment models and
contingent annuities, including their funding and reserving plans, is applicable to the two-
life statuses (joint and last-survivor) defined in this chapter. Indeed, the presentation
throughout Chapters 7 - 11 was made in general terms to facilitate its extension to the multi-
life case. Thus the general concept of a status with identifying characteristic x now can rep-
resent the joint-life status ( ) xy or the last-survivor status ( ). xy Throughout this section we
assume the independence of xT and yT when needed.
It is therefore unnecessary to duplicate the entire presentation in the earlier chapters simply sub-
stituting ( ) xy or ( ) xy for ( ). x Rather we will list only a very small selection of the relationships
we developed earlier, now recast in joint or last-survivor notation, to illustrate this point.
12.4.1 CONTINGENT PAYMENT MODELS (CHAPTER 7 MODELS)
If * xy K denotes the random variable for the time interval in which the joint status ( ) xy fails,
then

7/26/2019 Models for Quantifying Risk
http://slidepdf.com/reader/full/models-for-quantifying-risk 17/40
MODELS DEPENDENT ON MULTIPLE SURVIVALS 279
* xy K
xy Z v (12.36)
denotes the random variable for the present value of a unit paid at the end of that interval.
Further,
11[ ] |
k
xy xy k xyk A E Z v q
(12.37)
denotes the first moment of xy Z and
2 2 21
1
[ ] ( ) |k xy xy k xy
k
A E Z v q
(12.38)
denotes its second moment, from which the variance follows.
The extension to joint-life term insurance, deferred insurance, pure endowment, and en-
dowment insurance all follow directly from their Chapter 7 counterparts.
Similar remarks hold for continuous contingent payment models. We define
xyT xy Z v (12.39)
as the random variable for the present value of a unit paid at the precise time of failure of
( ), xy with
:0[ ] t
xy xy t xy x t y t A E Z v p dt
(12.40)
and
2
2 2:0
[ ] t xy xy t xy x t y t A E Z v p dt
(12.41)
as its first and second moments.
The same definitions apply for the last-survivor status, with some notational adjustments.
We have, for example,
1
1
[ ] | .k xy xy k xy
k
A E Z v q
(12.42a)
Substituting for 1|k xyq from Equation (12.23) we then have
. xy x y xy A A A A (12.42b)
In the case of the continuous function we have

7/26/2019 Models for Quantifying Risk
http://slidepdf.com/reader/full/models-for-quantifying-risk 18/40
280 CHAPTER TWELVE
0
:0
[ ] ( )
( )
,
t xy xy xy
t t x x t t y y t t xy x t y t
x y xy
A E Z v f t dt
v p p p dt
A A A
(12.42c)
using Equation (12.21) for the PDF of . xyT
12.4.2 CONTINGENT ANNUITY MODELS (CHAPTER 8 MODELS)
We can again substitute the joint-life status ( xy) or the last-survivor status ( ) xy for the generic
status of interest ( x) used in Chapter 8 to define annuities payable as long as a joint-life or last-
survivor status continues to survive. As in Chapter 8, such annuities can be paid as immediate,
due, or continuous. We would have, for example,
1
,k xy k xy
k
a v p
(12.43)
0
,k xy k xy
k
a v p
(12.44)
: 0
nt
t xy xy na v p dt (12.45)
and
: :
1 , xy n xy n
n xy
s a E
(12.46)
where
.nn xy n xy n x n y n xy E v p E E E (12.47)
The relationship between insurance and annuity functions, presented in Chapter 8, will also
hold in the multi-life cases. We would have, for example,
1 xy xy A d a (12.48)
and
1 . xy xy A a (12.49)
12.4.3 ANNUAL PREMIUMS AND R ESERVES
The annual benefit premium for a whole life joint-life insurance of unit amount is given by
the equivalence principle as
. xy
xy xy
A P
a
(12.50)
Note that since the contingent benefit pays on the first failure, the funding scheme should
stop at the first failure as well. In the case of a last-survivor status, we have

7/26/2019 Models for Quantifying Risk
http://slidepdf.com/reader/full/models-for-quantifying-risk 19/40
MODELS DEPENDENT ON MULTIPLE SURVIVALS 281
xy xy
xy
A P
a
(12.51)
if the funding continues until the second failure at which point the benefit is paid.
EXAMPLE 12.8
A contingent contract pays a benefit of amount b at the end of the year of the second failure
of independent lives ( ) x and ( ). y The net annual premium is 110 paid at the beginning of
each year while both ( ) x and ( ) y survive and 40 per year after the first failure. Find the
value of b, given the following values:
.80 8 7 .05 xy x y A a a d
SOLUTION
The APV of the benefit is . xyb A The APV of the premium stream is
110 40( ). xy xy xya a a
By the equivalence principle we have
( ) 40 40 30 x y xy x y xyb A A A a a a
or
1 .80[1 (.05)(8) 1 (.05)(7) .80] (40)(8) (40)(7) (30) ,.05
b
which solves for 1600.b
Benefit terminal reserves can easily be defined by the prospective method. For the joint-life
insurance we have
: :t xy x t y t xy x t y t V A P a (12.52)
if the status has not yet failed as of time t . For the last-survivor status, a bit more care is
needed. Although the status ( ) xy has not yet failed at time t , it is possible that one of its
component members may have already failed. Thus there are three cases for the reserve at
duration t , namely
: :t xy xy x t y t x t y t V A P a
(12.53a)
if both components ( ) x and ( ) y still survive,
t xy x t xy x t V A P a (12.53b)

7/26/2019 Models for Quantifying Risk
http://slidepdf.com/reader/full/models-for-quantifying-risk 20/40
282 CHAPTER TWELVE
if ( ) y has already failed and only ( ) x survives, or
t xy y t xy y t V A P a (12.53c)
if ( ) x has already failed and only ( ) y survives.
12.4.4 R EVERSIONARY ANNUITIES
A special type of two-life annuity is one that pays only after one of the lives has failed, and
then for as long as the other continues to survive. Such annuities are called reversionary an-
nuities.
If payment is made to the status ( y), provided it has not failed, but only after the failure ofthe status ( x), then the total condition for payment at time k is that ( x) has failed but ( y) has
not. The probability of this is
(1 ) ,k x k y k y k x k y k xyq p p p p p (12.54)
so the actuarial present value of a reversionary annuity payable under such circumstances
would be
|
1
( ) .k x y k y k xy y xy
k
a v p p a a
(12.55)
The result is intuitive. ya represents the APV of payment made for the lifetime of ( ), y and
xya is the APV of payment made for the joint lifetime of ( xy). We can read Equation (12.55)
as providing payment as long as ( ) y survives, but taking it away while ( ) x also survives, with
the net effect being payment made while ( ) y survives but after the failure of ( ). x
If the payment is made for n years at most, with the requirement that ( ) y has failed but ( ) x
has not, the APV would be
1
1
| :
: :( ) .
nk
k x k y
k
nk
k x k xy
k
y x n
x n xy n
a v p q
v p p a a
(12.56)
In the continuous case we have
| 0
0( ) .
t x y t y t x
t t y t xy y xy
a v p q dt
v p p dt a a
(12.57)

7/26/2019 Models for Quantifying Risk
http://slidepdf.com/reader/full/models-for-quantifying-risk 21/40
MODELS DEPENDENT ON MULTIPLE SURVIVALS 283
If a reversionary annuity is funded by annual premiums, the length of the premium-paying
period would be the joint lifetime, since upon failure of the joint status either payments
begin or the contract expires without value. If payments are to be made to ( x) after the fail-
ure of ( y), then use of the equivalence principle leads to the annual benefit premium
|
|( ) . y x x xy
y x xy xy
a a a
P a a a
(12.58)
The benefit reserve at duration t would again depend on what combination of ( x) and ( y) stillsurvive. If both are alive, the reversionary annuity contract is still in premium-paying status
so the reserve is
| | | :( ) ( ) .t y x y t x t y x x t y t V a a P a a (12.59a)
If ( x) only is alive the contract is beyond the premium-paying period and in payout status, so
the reserve is simply
|( ) .t y x x t V a a (12.59b)
If ( y) only is alive, no payment will ever be made so the contract has expired and the reserve
is zero.
EXAMPLE 12.9
Show that | | . xy x y y x xya a a a
SOLUTION
The result is intuitive. | x ya represents payments made if ( y) is alive but ( x) is not, | y xa repre-
sents payments made if ( x) is alive but ( y) is not, and xya represents payments made if both
are alive. The three cases are mutually exclusive. Together they provide payments if either
( x) or ( y) is alive, which is represented by . xya Mathematically,
| |
,
x y y x xy y xy x xy xy
x y xy
xy
a a a a a a a a
a a a
a
as required.
12.4.5 CONTINGENT INSURANCE FUNCTIONS
A contingent insurance is one for which payment of the unit benefit depends on the order of
failure among its component members. The insurance functions follow from the probability
functions introduced in Section 12.3. Here we consider only insurances with immediate
payment of claims.

7/26/2019 Models for Quantifying Risk
http://slidepdf.com/reader/full/models-for-quantifying-risk 22/40
284 CHAPTER TWELVE
A contingent insurance benefit paid at the failure of ( x) only if ( x) fails before ( y) has APV
given by
1
0.t
xy t xy x t A v p dt
(12.60)
If the benefit is paid at the failure of ( x) only if ( x) fails after ( y), the APV is
2 1
0(1 ) .t
xy t x x t t y x xy A v p p dt A A
(12.61)
EXAMPLE 12.10
Show that1 1
xy xy xy A A A
and2 2 . xy xy xy A A A
SOLUTION
1 1
0 0
:0
t t xy xy t xy x t t xy y t
t t xy x t y t xy
A A v p dt v p dt
v p dt A
2 2 11
1 1
xy xy x xy y xy
x y xy xy
x y xy xy
A A A A A A
A A A A
A A A A
12.5 MULTI-STATE MODEL R EPRESENTATION
The multi-life models presented thus far in this chapter can be easily represented as multi-
state models. We illustrate this idea in the two-life case, with extension to three or more
lives being apparent.
12.5.1 THE GENERAL MODEL
Consider two persons alive at ages x and y, respectively, at time t . The model is in State 1 as
long as both lives continue to survive. Since both lives are surviving at time t , it follows thatthe process begins in State 1 at that time. The model is illustrated in Figure 12.1 on the fol-
lowing page.

7/26/2019 Models for Quantifying Risk
http://slidepdf.com/reader/full/models-for-quantifying-risk 23/40
MODELS DEPENDENT ON MULTIPLE SURVIVALS 285
State 1
(Both ( x) and ( y)
Surviving)
State 2
(( x) Surviving
but ( y) Failed)
State 3
(( y) Surviving
but ( x) Failed)
State 4
(Both ( x) and ( y)
Failed)
FIGURE 12.1
Since the only decrement is failure, or death, it follows that any state, once left, cannot be
reentered. Therefore the event of being in State 1 at time ,t r given in State 1 at time t , is
the same as the event of never leaving State 1 over that time interval.
Similarly, the event of being in State i, for 2i or 3, at any time after entering that state is
the same as the event of never leaving that state once it has been entered. Note that transition
from State 2 to State 3, or from State 3 to State 2, is not possible.
Clearly State 4 is an absorbing state, which can never be left once it has been entered. We
also assume, in this model, that the simultaneous failure of ( ) x and ( ) y is not possible, so
direct transition from State 1 to State 4 cannot occur.4
12.5.2 THE JOINT-LIFE MODEL
By definition, the joint-life status continues to survive as long as the process is in State 1,and fails when the process transitions to either State 2 or State 3. For a discrete process
known to be in State 1 at time n, the probability of being in State 1 at time n r is
( ) *( )11 11[ 1 | 1] ,n n
n r n r r Pr X X p p (12.62a)
and for a continuous process known to be in State 1 at time t , the probability of being in
State 1 at time t r is
( ) *( )11 11[ ( ) 1 | ( ) 1] .t t
r r Pr X t r X t p p (12.62b)
In the single-life case, for a person alive (i.e., in State 1) at age x at discrete time n (orcontinuous time t ), the probability of being in State 1 at discrete time n r (or continuous
time )t r is r x p in all cases. That is,
4 This restriction is relaxed in Section 12.8.

7/26/2019 Models for Quantifying Risk
http://slidepdf.com/reader/full/models-for-quantifying-risk 24/40
286 CHAPTER TWELVE
( ) *( ) ( ) *( )11 11 11 11 .n n t t
r x r r r r p p p p p (12.63a)
In the multi-life case, assuming independence of ( ) x and ( ), y the corresponding probability
is .r xy r x r y p p p That is,
( ) *( ) ( ) *( )11 11 11 11 .n n t t
r xy r x r y r r r r p p p p p p p (12.63b)
For the joint-life model, we can write the APVs for annuities and insurances in multi-state
model notation by analogy to the single-life model as presented in Section 8.6 (for annuities)
and Section 7.6 (for insurances). Two examples of this are presented in Example 12.11, with
others left to the exercises (see Exercise 12-18).
EXAMPLE 12.11
Write the APVs for (a) the joint-life annuity-due and (b) the continuous joint-life insurance
in multi-state model notation.
SOLUTION
(a) For two persons alive at ages x and y, respectively, at time 0, the APV of a unit annuity-
due, by analogy to Equation (8.96), is
(0)11
0
,k xy k
k
a v p
(12.64)
where (0)11 ,k k xy k x k y p p p if ( ) x and ( ) y are independent.
(b) The unit continuous joint-life insurance is payable at the instant of transition from State1 to State 2 or from State 1 to State 3. These events are mutually exclusive, so the APV,
by analogy to Equation (7.80), is
(0)12 13110
( ) ( ) ,r xy r A v p r r dr
(12.65)
where (0)11r is defined in part (a), 12 ( ) , y r r and 13( ) . x r r
12.5.3 R EVERSIONARY ANNUITIES
Recall from Section 12.4.4 that the reversionary annuity with APV given by | y xa is payableto ( ) x after the failure of ( ). y In the multi-state model context, such an annuity is payable
if the process is in State 2. Then we would write
7/26/2019 Models for Quantifying Risk
http://slidepdf.com/reader/full/models-for-quantifying-risk 25/40
MODELS DEPENDENT ON MULTIPLE SURVIVALS 287
(0)| 12
1
,k y x k
k
a v p
(12.66)
where (0)12 .k k x k y k x k xy p q p p The APV for a reversionary annuity payable to ( ) y
after the failure of ( ) x follows by symmetry. (See Exercise 12-19.)
12.5.4 CONTINGENT INSURANCE FUNCTIONS
The continuous contingent insurance with APV given in standard actuarial notation by 1 xy A
is payable at the instant of transition from State 1 to State 3 in the multi-state model context.
The one with APV given by 2 xy A is payable at the instant of transition from State 2 to State
4. The reader is asked to write the APVs for these, and other, contingent insurances in multi-
state model notation in Exercise 12-20.
12.5.5 THE LAST-SURVIVOR MODEL
The last-survivor status continues to exist while any of its component members survive, so,
in the multi-state model context, the status is surviving while the process is in any of States
1, 2, or 3, and the status fails when the process transitions to State 4 from either State 2 or
State 3. APVs for last-survivor functions can be written in multi-state model notation by
analogy to APVs developed earlier. This is illustrated in the following example and in Exer-cise 12-21.
EXAMPLE 12.12
For two lives known to be surviving at time 0 at ages x and y, write the APVs for (a) the last-
survivor immediate annuity and (b) the last-survivor continuous whole life insurance.
SOLUTION
(a) The annuity is payable at the end of each year while either (or both) of ( x) and ( y) sur-
vive, which means the process is in any one of States 1, 2, or 3. These events are mutu-
ally exclusive, so the APV is
(0) (0) (0)11 12 13
1
,r r r r xy
r
a v p p p
(12.67a)
where (0)11 ,r r x r y p p p (0)
12 ,r r x r y p q and (0)13 ,r r y r x p p q assuming independ-
ence of ( ) x and ( ). y
(b) The insurance is payable at the instant of the second failure, with APV denoted by . xy
A
In the multi-state model context, it is payable at the instant of transition from State 2 to
State 4 or from State 3 to State 4. The APV is

7/26/2019 Models for Quantifying Risk
http://slidepdf.com/reader/full/models-for-quantifying-risk 26/40
288 CHAPTER TWELVE
(0) (0)24 3412 130
( ) ( ) ,r r r xy
A v p r p r dr
(12.67b)
where (0)12 ,r r x r y p q (0)
13 ,r r y r x p q 24 ( ) , x r r and 34 ( ) . y r r
12.5.6 SOLVING THE K OLMOGOROV FORWARD EQUATION
In this section we consider the Kolmogorov differential equation presented in Section 3.2.2
as it applies to the multi-life model of Section 12.5.1. As shown by the arrows in Figure12.1, not all transitions between states are possible, so the only non-zero forces of transition
are 12 ( ), s 13( ), s 24( ), s and 34 ( ). s
Suppose ( ) x and ( ) y are both alive at those ages at general time t , so that the process is in
State 1. Then ( )11
t r p denotes the probability that the process is still in State 1 (i.e., both are
still surviving) at time ,t r and ( )12
t r p denotes the probability that the process is in State 2
(i.e., ( ) x is surviving but ( ) y has failed) at time .t r (Note that ( )
13
t
r p is the same as ( )
12,t
r p
with the roles of ( ) x and ( ) y reversed.)
If the process is in State 2 at time t , then both ( )22t
r p and ( )24t
r p denote concepts of interest to
us. (Note that ( ) ( )21 23 0.)t t
r r p p Furthermore, both ( )33t
r p and ( )34t
r p are also concepts of
interest, but they are the same as ( )22t
r p and ( )24 ,t
r respectively, with the roles of ( ) x and
( ) y reversed.
It is clear that, for a process in State 4 at time t , ( ) ( ) ( )41 42 43 0t t t
r r r p p p and ( )44 1t
r p for all r .
The above analysis suggests that we need solve the Kolmogorov equation only for ( )11 ,t n p ( )12 ,t
n p ( )22 ,t
n p and ( )24 .t
n p We do this for ( )12
t n p in the following example, and defer the others
three cases to Exercises 12-22 and 12-23.
EXAMPLE 12.13
The symbol ( )12
t n denotes the probability that a process in State 1 at time t will be in State 2
at time ,t n where State 1 means both ( ) x and ( ) y are alive at those ages. To be in State 2
at time t n requires that ( ) y fails in, and ( ) x survives over, the interval ( , ].t t n (In actu-
arial notation this is denoted by ,n x n y p q assuming that ( ) x and ( ) y are independent
lives.) Show that the Kolmogorov equation can be solved for this result.
SOLUTION
In Equation (3.14a), 1i and 2 j so k takes on the values 1, 3, 4 in the summation. Then
we have

7/26/2019 Models for Quantifying Risk
http://slidepdf.com/reader/full/models-for-quantifying-risk 27/40
MODELS DEPENDENT ON MULTIPLE SURVIVALS 289
( ) ( ) ( )12 2112 11 12
( ) ( )32 2313 12
( ) ( )42 2414 12
( ) ( )12 2411 12
( ) ( ) (at 1)
( ) ( ) (at 3)
( ) ( ) (at 4)
( ) ( ),
t t t r r r
t t r r
t t r r
t t r r
d p p t r p t r k dr
p t r p t r k
p t r p t r k
p t r p t r
since 21 32 23 42( ) ( ) ( ) ( ) 0 s s s s for all s. Then integrating from 0r to r n we
have
( ) ( ) ( )12 2412 11 120 0 0
( ) ( ) .n n nt t t
r r r d p p t r dr p t r dr
The left side integrates to ( )12 ,t
n p as expected, since ( )0 12 0.t p The right side is more easily
understood when written in actuarial notation. We have
0 0,
n n
r xy y r r x r y x r p dr p q dr
since 12 ( )t r is the force of failure for ( ) y at age y r and 24 ( )t r is the force of fail-
ure for ( ) x at age . x r We can represent both integrals in contingent probability notation,
from Section 12.3, obtaining the result
( ) 2112 .t
n n xy n xy p q q
But 2 1 ,n xy n x n xyq q q so we can write our result as
( ) 1 112 ( )
1 1 (1 ) ,
t n n xy n x n xy
n xy n x
n x n y n x n x n x n y n x n y n x n y
p q q q
q q
p p p p p p p p p q
as requested.
12.6 GENERAL R ANDOM VARIABLE ANALYSIS
Consider again the case of two individual lives ( x) and ( y), with time-to-failure (or future
lifetime) random variables xT and , yT respectively. When xT and yT are independent, we
have seen how all discrete multi-life functions can ultimately be evaluated from a single-life
survival model, usually in life table form. But how do we evaluate multi-life functions ifindependence does not hold?

7/26/2019 Models for Quantifying Risk
http://slidepdf.com/reader/full/models-for-quantifying-risk 28/40
290 CHAPTER TWELVE
In theory we can proceed according to the general rules regarding the joint distribution of
two random variables, as presented in a basic probability course and reviewed in Section 2.4
of this text. We presume that we are given a joint density function of the random variables
xT and , yT denoted by , ( , ), x y x y f t t for 0 xt and 0, yt where xT and yT are not neces-
sarily independent.5 From the joint density function we can then determine all other desired
functions.
12.6.1 MARGINAL DISTRIBUTIONS OF x T AND yT
We can find the marginal densities of xT and yT by integrating the joint density function
across the opposite variable. Thus we have
,( ) ( , ) y
x x x y x y yt f t f t t dt (12.68a)
and
,( ) ( , ) . x
y y x y x y xt t f t t dt (12.68b)
From the separate marginal distributions we can evaluate any probability or other single-lifefunction as described in earlier chapters.
12.6.2 THE COVARIANCE OF x T AND yT
From the joint PDF of xT and yT we can find
,0 0[ ] ( , ) . x y x y x y x y x y E T T t t f t t dt dt
(12.69)
Then from the separate marginal PDF’s of xT and yT we find E [T x] and [ ], y E T and there-
fore
( , ) [ ] [ ] [ ]. x y x y x yCov T T E T T E T E T (12.70)
EXAMPLE 12.14
An electronic device relies on two essential components, denoted ( x) and ( y), for its opera-
tion. The joint density function of the lifetimes of ( x) and ( y), measured in months, is
, ( , ) ,27
x y x y x y
t t
f t t
for 0 3 xt and 0 3. yt
5 The case where xT and yT are independent will be contained within the general analysis as a special case.

7/26/2019 Models for Quantifying Risk
http://slidepdf.com/reader/full/models-for-quantifying-risk 29/40
MODELS DEPENDENT ON MULTIPLE SURVIVALS 291
(a) Show that xT and yT are not independent.
(b) Find the correlation coefficient of xT and . yT
SOLUTION
First we find the marginal density of xT as
3
,0
33
2
0 0
( ) ( , )
2 31 1 1 9( ) 3 ,27 2 27 2 18
x x x y x y y
x x y y x y y x
f t f t t dt
t t t dt t t t t
for 0 3. xt By the symmetry of the joint PDF it follows that
2 3( ) ,
18
y
y y
t f t
for 0 3. yt Next we find
3
3 32 3 2
0 00
1 1 2 3[ ] ( ) (2 3 ) 1.7518 18 3 2 x x x x x x x x x x E T t f t dt t t dt t t
and
3
3 32 2 3 2 4 3
0 0 0
1 1 1[ ] ( ) (2 3 ) 3.75,18 18 2 x x x x x x x x x x E T t f t dt t t dt t t
so
2( ) 3.75 (1.75) .6875. xVar T
Again by symmetry the same values apply to . yT Directly from the joint PDF we find
3 3
,0 0
3 32 2
0 0
33
3 2 2
0 0
32
0
32 3
0
[ ] ( , )
1 ( )27
1 1 127 3 2
1 9 4.527
1 4.5 1.5 3.27
x y x y x y x y x y
x y x y x y
x y x y y
y y y
y y
E T T t t f t t dt dt
t t t t dt dt
t t t t dt
t t dt
t t

7/26/2019 Models for Quantifying Risk
http://slidepdf.com/reader/full/models-for-quantifying-risk 30/40
292 CHAPTER TWELVE
(a)
We observe that
,( ) ( ) ( , ), x x y y x y x yt f t f t t
so xT and yT are not independent.
(b) From the results developed above we find
( , ) 3 (1.75)(1.75) .0625 x yCov T T
and therefore
,2
( , ) .0625 .09091.( ) ( ) (.6875)
x y
x y
T T
x y
Cov T T
Var T Var T
12.6.3 OTHER JOINT FUNCTIONS OF x T AND yT
If the individual domains of xT and yT are both all positive values, then their joint domain
will be the entire first quadrant, as illustrated in the following figure.
yt
( , ) x yt t
xt
FIGURE 12.2
The joint CDF of xT and yT is given by
, ,0 0( , ) ( ) ( , )
y xt t
x y x y x x y y x y F t t Pr T t T t f r s dr ds (12.71)
for 0 xt and 0, yt and , ( , ) 0 x y x y F t t for any other values of xt and/or . yt For exam-
ple, consider the case where 0 xt and 0, yt so the point ( , ) x yt t lies in the second
quadrant. Since the joint CDF represents ( ), x x y y Pr T t T t it is easy to see that the
joint CDF is zero, since the event x xT t cannot occur. Similar reasoning applies to a point
( , ) x yt t lying in the third or fourth quadrants.

7/26/2019 Models for Quantifying Risk
http://slidepdf.com/reader/full/models-for-quantifying-risk 31/40
MODELS DEPENDENT ON MULTIPLE SURVIVALS 293
If the joint domain of xT and yT does not cover the entire first quadrant, the joint CDF can
be non-zero in portions of the first quadrant where the joint PDF is zero. This is illustrated in
the following example.
EXAMPLE 12.15
Find the joint CDF for the joint distribution of Example 12.14.
SOLUTION
Consider the following figure:
yt
C D
3
A B
( , ) x yt t
0 xt
3
FIGURE 12.3
The joint PDF is non-zero only within Region A of the first quadrant. Within Region A the
joint CDF of xT and yT is given by
, ,0 0
0 0
2
0 0
2
0
2 2
2 2
0
( , ) ( , )
1 ( )27
1 127 2
1 127 2
1 1 1 ,
27 2 2 54
y x
y x
x y
y
y
t t
x y x y x y
t t
t t
t
x x
t x y x y
x x
F t t f r s dr ds
r s dr ds
r rs ds
t t s ds
t t t t t s t s
for 0 3 xt and 0 3. yt For a point ( , ) x yt t in Region B, the event x xT t is certain to
occur, since 3 xt in Region B. Therefore the joint CDF, which is ( ), x x y y Pr T t T t is the

7/26/2019 Models for Quantifying Risk
http://slidepdf.com/reader/full/models-for-quantifying-risk 32/40
294 CHAPTER TWELVE
same as ( ) y y Pr T t since ( ) 1. x x Pr T t Then we see that
, ( , ) ( ) x y x y y y F t t F t
for 3 xt and 0 3. yt By similar reasoning, for any point in Region C we have
, ( , ) ( ) x y x y x x F t t F t
for 0 3 xt and 3. yt In Region D both events x xT t and y yT t are certain to occur
so we have
, ( , ) 1 x y x y F t t
for 3 xt and 3. yt
The joint SDF of xT and yT is given by
, ,( , ) ( , ) , y x
x y x y x x y y x yt t S t t Pr T t T t f r s dr ds
(12.72)
for 0 xt and 0. yt For a ( , ) x yt t point in the second quadrant, the event x xT t is cer-
tain to occur so ( ) x x y y Pr T t T t is the same as ( ) ( ). y y y T y Pr T t S t Similar reasoning
for a ( , ) x yt t point in the fourth quadrant shows that ( ) x x y y Pr T t T t is the same as
( ) x x Pr T t ( ). xT xS t In the third quadrant, both events x xT t and y yT t are certain to
occur so , ( , ) 1 x y x yS t t for 0 xt and 0. yt
12.6.4 JOINT AND LAST-SURVIVOR STATUS FUNCTIONS
If the general joint SDF of xT and yT is evaluated at a common point, say , x yt t n then
we have
, ( , ) ( ) , x y x y xy n xyS n n Pr T n T n Pr T n p (12.73)
in actuarial notation. Therefore all joint life functions presented in Section 12.1 can be eval-
uated from the general joint SDF of xT and . yT Note that the relationship n xy n x n y p p p will
generally hold only if xT and yT are independent.
EXAMPLE 12.16
Suppose the device described in Example 12.14 fails upon the first failure of its two essen-
tial components. Find the probability that the device fails during its first month of operation.

7/26/2019 Models for Quantifying Risk
http://slidepdf.com/reader/full/models-for-quantifying-risk 33/40
MODELS DEPENDENT ON MULTIPLE SURVIVALS 295
SOLUTION
Since the device fails on the first failure of its components, then the two components form a
joint status. We seek the probability value given by 1 . xy xyq p The joint SDF of xT and
yT in Example 12.14 is given by
3 3
,1( , ) ( ) ,27 y x
x y x y t t S t t r s dr ds
so the joint status probability xy p is given by
3 3
, 1 1
33
2
1 1
3
1
32
1
1(1,1) ( )27
1 127 2
1 (4 2 )27
1 164 .27 27
xy x y p S r s dr ds
r rs ds
s ds
s s
Finally the desired probability is
16 111 1 .27 27 xy xyq p
If the general joint CDF of xT and yT is evaluated at the common point , x yt t n then we
have
, ( , ) ( ) , x y x y xy n xy F n n Pr T n T n Pr T n q
in actuarial notation. Thus we see that both the joint and last-survivor distributions can be
determined from the general joint distribution of xT and , yT where we find the SDF of the
joint status from the joint SDF of xT and yT and we find the CDF of the last-survivor status
from the joint CDF of xT and . yT
12.7 COMMON SHOCK – A MODEL FOR LIFETIME DEPENDENCY
A natural example of two lives ( ) x and ( ) y having dependent lifetimes might be a married
couple or a pair of business partners who travel together, or are otherwise exposed to a common
hazard factor, on a regular basis. We refer to this common hazard as a common shock .
To analyze the common shock model, we begin by hypothesizing that ( ) x is subject to a
hazard rate, or force of failure, denoted * , x t that takes into account only failure forces op-

7/26/2019 Models for Quantifying Risk
http://slidepdf.com/reader/full/models-for-quantifying-risk 34/40
296 CHAPTER TWELVE
erating at time t that are specific to ( ) x and not to ( ). y Similarly, * y t denotes failure forc-
es operating at time t that are applicable to ( ) y but not to ( ). x With regard only to the fail-
ure forces represented by * x t and * , y t we consider that ( ) x and ( ) y have independent
survival patterns because of the nature of the hazard factors included in * x t and * . y t
Next we assume that the common hazard, or common shock, to which both ( ) x and ( ) y are
subject can be represented by a constant (over time) hazard function, which we denote by
.ct We assume that the hazard forces unique to ( ), x reflected in * , x t and the hazard
forces reflected in the common shock hazard function ct are non-overlapping, so the total
force of failure to which ( ) x is subject is given by
* * .c
x t x t t x t (12.74a)
Similarly, the force of failure to which ( ) y is subject is given by
* * .c
y t y t t y t (12.74b)
The total force of failure operating on the joint-life status ( ) xy is given by
* *: . x t y t x t y t (12.75)
The three forces are additive because each represents hazard factors that are disjoint from each
other. Furthermore, the total joint force of failure contains only one (not two) since failure
of either ( ) x or ( ) y due to the common shock constitutes failure of the joint-life status.
The joint-life survival function in the common shock model can then be found from the joint-life force of failure. We have
0 :
* *0
**00 0
( )
* * .
t
x r y r
t
x r y r
t t t y r x r
dr t xy
dr
dr dr dr
t t x t y
p e
e
e e e
p p e
(12.76)
Note that *t x p is not the same as ,t x p since the latter survival probability takes into account
the common shock hazard factors but the former does not.
There is an alternative, and equivalent, way to develop the common shock model. Let * xT
and * yT denote the future lifetime random variables for ( ) x and ( ), y respectively, without
regard for the common shock hazard factors. Consistent with the discussion above, we as-

7/26/2019 Models for Quantifying Risk
http://slidepdf.com/reader/full/models-for-quantifying-risk 35/40
MODELS DEPENDENT ON MULTIPLE SURVIVALS 297
sume that * xT and *
yT are independent. Let S denote the future lifetime of either ( ) x or ( ) y
with regard to the common shock hazard factors only, where S is independent of both * xT
and *. yT Then it follows that the overall lifetime random variable for ( ) x is given by
*
min( , ), x xT T S
(12.77a)
and similarly the overall future lifetime random variable for ( ) y is given by
*min( , ). y yT T S (12.77b)
Note that whereas * xT and *
yT are independent, xT and yT are not independent since they
both involve the common shock hazard factors and depend on the common future lifetime
random variable S .
Since * xT and S are independent, however, it follows that the SDF of xT is the product of the
SDF’s of * xT and S . That is,
**( ) ( ) ( ) ,t
t x x x S t x p S t S t S t p e (12.78a)
where ( ) t S S t e since the random variable S has a constant hazard rate and therefore an
exponential distribution. Similarly, the SDF of yT is given by
**( ) ( ) ( ) .t
t y y y S t y p S t S t S t p e (12.78b)
We observe that ,t xy p given by Equation (12.76), is not equal to the product of t x p and
,t y p given by Equations (12.78a) and (12.78b), respectively, which shows that xT and yT
are not independent random variables.
EXAMPLE 12.17
A convenient way to illustrate the common shock model is to assume that both * xT and *
yT
have exponential distributions, and therefore constant hazard rates x and , y respectively.
Under this assumption, find an expression for the APV of a last-survivor whole life insur-
ance, with benefit paid at the moment of failure of the status.
SOLUTION
The overall force of failure for ( ) x is then , x t x where denotes the hazard of the
common shock, and the overall force of failure for ( ) y is . y t y The force of failure
for the joint-life status ( ) xy is : . x t y t x y Using results developed in Chapter 7,

7/26/2019 Models for Quantifying Risk
http://slidepdf.com/reader/full/models-for-quantifying-risk 36/40
298 CHAPTER TWELVE
State 1
(Both ( x) and ( y)
Surviving)
State 2
(( x) Surviving
but ( y) Failed)
State 3
(( y) Surviving
but ( x) Failed)
State 4
(Both ( x) and ( y)
Failed)
we then have
, x x
x
A
, y
y
y
A
and
, x y
xy x y
A
and xy A then follows as . x y xy A A A
Because of the common hazard factor, such as travel accidents, there is a non-zero probabil-ity of simultaneous failure of ( ) x and ( ). y When represented as a multi-state model, theearlier Figure 12.1 is modified as shown in Figure 12.4.
Figure 12.4
The only change in this model from our Figure 12.1 model is that 14 ( ), s the force of transi-
tion function for transition directly from State 1 to State 4 is now non-zero. This means that
the probability value
( )14 ( ) 4 | ( ) 1t
r p Pr X t r X t
can be satisfied by direct transition from State 1 to State 4. In the Figure 12.1 model, ( )14
t r p
could be satisfied only by transition from State 1 to State 2 to State 4 or by transition from
State 1 to State 3 to State 4.

7/26/2019 Models for Quantifying Risk
http://slidepdf.com/reader/full/models-for-quantifying-risk 37/40
MODELS DEPENDENT ON MULTIPLE SURVIVALS 299
12.8 EXERCISES
12.1 The Joint-Life Model
12-1 Show that
, xy x x yq q p q
assuming independence of the individual lifetimes xT and . yT
12-2 Let xT and yT be independent future lifetime random variables. Given .080, xq
2.004, 1 , y t x xq p t q and 21 ,t y y p t q both for 0 t 1, evaluate the PDF
of xyT at .50.t
12-3 Two microwave models, denoted Type I and Type II, follow survival models defined by
ln1.25, I x for 0, x and 1
9, II
x x
for 0 9, x respectively. Given that
both models are currently two years old, and that they have independent lifetimes,
find the probability that the first failure will occur between ages 3 and 6.
12-4 At all ages greater than 50, the force of failure for smokers is double that for non-
smokers. Suppose the age-at-failure random variable for nonsmokers has a uniform
distribution with 75. If (65) and (55) have independent lifetimes, where (65) is
a nonsmoker and (55) is a smoker, find the value of 65:55 .e
12-5 Let xT and yT be independent future lifetime random variables, each with an expo-
nential distribution with mean 20. Find the value of ( ). xyVar T
12.2 The Last-Survivor Model
12-6 Let 80T and 85T be independent random variables with uniform distributions with
100. Find the probability that the second failure occurs within five years.
12-7 Derive each of the following identities. Which of them require an assumption of theindependence of xT and ? yT
(a) t xy t x t y t xyq q q q
(b) ( ) xyT t x t y y t t y t x x t f t q p q p
(c) | | | | |n xy n x n y n y n x n x n yq q q q q q q

7/26/2019 Models for Quantifying Risk
http://slidepdf.com/reader/full/models-for-quantifying-risk 38/40
300 CHAPTER TWELVE
12-8 If xT and yT are independent, and each is uniformly distributed over each year of
age separately, show that
1/3 1/218( ) 12( ) . xy xy xyq q q
12-9 For independent lives ( ) x and ( ), y the force of failure is constant over each year of
age. Find the value of .75 .25: .25,
x y p
given that .08 xq and .06. yq
12-10 For the model of Exercise 12-5, find the value of ( , ). xy xyCov T T
12.3 Contingent Probability Functions
12-11 Coffee Maker I follows a survival model defined by 1.809
, I x x
for 0 9, x and
Coffee Maker II follows a survival model defined by 1.509 , II x x for 0 9. x The
two coffee makers have independent lifetimes. Find the probability that Coffee
Maker I fails before Coffee Maker II.
12.4 Contingent Contracts Involving Multi-Life Statuses
12-12 Let Z denote the present value random variable for a contingent contract that pays a
unit benefit at the end of the year of the first failure between ( ) x and ( ), y and an-
other unit benefit at the end of the year of the second failure. Find the value of
[ ], E Z given the values 9, 13, and .04. x ya a i
12-13 Let Y denote the present value random variable for a contingent annuity-due with
unit payment made during the first 15 years if at least one of ( ) x and ( ) y survive,
but made after the first 15 years only if exactly one of ( ) x and ( ) y survive. Find the
value of [ ], E Y given the following values:
159.80 11.60 7.60 | 3.70 x y xy xya a a a
12-14 Let * xy K denote the year of failure of the joint-life status ( ). xy Find the value of the
discount rate d , given the values *210, 7, and ( ) 27.
xy xy xy K a a Var a
12-15 Two lives ( ) x and ( ) y have independent and identically distributed future lifetimes.
Given the values .10, .06, x y xy P P P and .06,d find the value of . xy P

7/26/2019 Models for Quantifying Risk
http://slidepdf.com/reader/full/models-for-quantifying-risk 39/40
MODELS DEPENDENT ON MULTIPLE SURVIVALS 301
12-16 A discrete unit benefit contingent contract is issued to the last-survivor status ( ), xx
where the two future lifetime random variables xT are independent. The contract is
funded by discrete net annual premiums, which are reduced by 25% after the first
failure. Find the value of the initial net annual premium, under the equivalence prin-
ciple, given the values .40, .55, and 10.00. x xx x A A a
12-17 A continuous two-life annuity has actuarial present value 1180. The annuity pays at
annual rate 100 while both ( ) x and ( ) y survive, 70 while ( ) x survives after the
failure of ( ), y and 50 while ( ) y survives after the failure of ( ). x Find the value of
, xya given that 12 xa and 10. ya
12.5 Multi-State Model Representation
12-18 Using the multi-state model notation defined earlier, give formulas for each of the
following joint-life functions.(a)
: xy na (b) xy P (c)
: xy n A (d) 1
:( )
xy n P A
12-19 Using the model shown in Figure 12.1, give the formula for | x ya in multi-state model
notation.
12-20 Using the multi-state model notation defined earlier, give formulas for each of the
following continuous contingent insurance functions.
(a)1
xy A (b)1
xy A (c)2
xy A (d)2
xy A
12-21 Using the multi-state model notation defined earlier, give formulas for each of the
following last-survival functions.
(a) xy
a (b): xy n
a (c) 1: xy n
A (d) |n xy A
12-22 For two persons alive at ages x and y at time t , solve the Kolmogorov differential
equation for ( )11 ,t
n p writing the result in standard actuarial notation.
12-23 For a person alive at age x at time t , with ( ) y failed, solve the Kolmogorov differen-
tial equation for (a) ( )22t
n p and (b) ( )24 ,t
n p writing the results in standard actuarial no-
tation.

7/26/2019 Models for Quantifying Risk
http://slidepdf.com/reader/full/models-for-quantifying-risk 40/40
302 CHAPTER TWELVE
12.6 General Random Variable Analysis
12-24 Consider the joint density function of xT and yT given by
, 3
4( , ) ,(1 2 )
x y x y x y
f t t t t
for 0 xt and 0. yt Show that xT and yT are not independent.
12-25 For the survival model of Exercise 12-24, find ( ), xS t the marginal survival function
of . xT
12-26 For the survival model of Exercise 12-24, evaluate , (1,2). x y F
12-27 For the survival model of Exercise 12-24, evaluate , (1,2). x yS
12-28 For the survival model of Exercise 12-24, find an expression for .n xy
12-29 For the survival model of Exercise 12-24, find an expression for .n xyq
12.7 Common Shock – A Model for Lifetime Dependency
12-30 The APV for a last-survivor whole life insurance on ( ), xy with unit benefit paid at
the instant of failure of the status, was calculated assuming independent future life-
times for ( ) x and ( ) y with constant hazard rate .06 for each. It is now discovered
that although the total hazard rate of .06 is correct, the two lifetimes are not inde- pendent since each includes a common shock hazard factor with constant force .02.
The force of interest used in the calculation is .05. Calculate the increase in the
APV that results from recognition of the common shock element.
12-31 Lives ( ) x and ( ) y have independent future lifetime exponential random variables
* xT and *
yT with respect to risk factors unique to ( ) x and ( ), y respectively. As well,
both ( ) x and ( ) y are subject to a constant common hazard rate .01. Given that
.96 x p and .97, y p calculate the value of 5 . xy
12-32 For two persons alive at ages x and y at time t , show that the Kolmogorov differen-
tial equation for ( )14
t r p solves for
( )14 ,t
xyn n xy p q e
where is the constant common shock hazard described in Section 12.7.