Models for measuring and predicting shareholder value: A ...nv/80Sadhanapoornima.pdf · use peer...
24
S¯ adhan¯ a Vol. 30, Parts 2 & 3, April/June 2005, pp. 475–498. © Printed in India Models for measuring and predicting shareholder value: A study of third party software service providers N VISWANADHAM 1 and POORNIMA LUTHRA 2 1 The Logistics Institute – Asia Pacific and 2 Department of Information Systems, School of Computing, National University of Singapore, 10 Kent Ridge Crescent, Singapore 119260 e-mail: [email protected]; [email protected] Abstract. In this study, we use the strategic profit model (SPM) and the economic value-added (EVA to measure shareholder value). SPM measures the return on net worth (RONW) which is defined as the return on assets (ROA) multiplied by the financial leverage. EVA is defined as the firm’s net operating profit after taxes (NOPAT) minus the capital charge. Both, RONW and EVA provide an indication of how much shareholder value a firm creates for its shareholders, year on year. With the increasing focus on creation of shareholder value and core competen- cies, many companies are outsourcing their information technology (IT) related activities to third party software companies. Indian software companies have become leaders in providing these services. Companies from several other coun- tries are also competing for the top slot. We use the SPM and EVA models to analyse the four listed players of the software industry using the publicly available published data. We compare the financial data obtained from the models, and use peer average data to provide customized recommendations for each company to improve their shareholder value. Assuming that the companies follow these rules, we also predict future RONW and EVA for the companies for the financial year 2005. Finally, we make several recommendations to software providers for effectively competing in the global arena. Keywords. Shareholder value; strategic profit model (SPM); economic value-added (EVA). 1. Introduction With the increasing global competition, companies are focusing their efforts on creating shareholder value in order to survive the intense competition. In view of this, it is becoming important for companies to measure the value they create for their shareholders. Keeping track of the value created year-on-year enables companies to evaluate past decisions and make decisions that will improve shareholder value. With the increasing focus on core competencies, many companies are outsourcing their information technology (IT) related activities to third party software service providers. For 475
Transcript of Models for measuring and predicting shareholder value: A ...nv/80Sadhanapoornima.pdf · use peer...
Sadhana Vol. 30, Parts 2 & 3,April/June 2005, pp. 475–498. © Printed in India
Models for measuring and predicting shareholder value: Astudy of third party software service providers
N VISWANADHAM 1 and POORNIMA LUTHRA2
1The Logistics Institute – Asia Pacific and2Department of Information Systems,School of Computing, National University of Singapore, 10 Kent Ridge Crescent,Singapore 119260e-mail: [email protected]; [email protected]
Abstract. In this study, we use the strategic profit model (SPM) and the economicvalue-added (EVA to measure shareholder value). SPM measures the return onnet worth (RONW) which is defined as the return on assets (ROA) multiplied bythe financial leverage. EVA is defined as the firm’s net operating profit after taxes(NOPAT) minus the capital charge. Both, RONW and EVA provide an indicationof how much shareholder value a firm creates for its shareholders, year on year.
With the increasing focus on creation of shareholder value and core competen-cies, many companies are outsourcing their information technology (IT) relatedactivities to third party software companies. Indian software companies havebecome leaders in providing these services. Companies from several other coun-tries are also competing for the top slot. We use the SPM and EVA models toanalyse the four listed players of the software industry using the publicly availablepublished data. We compare the financial data obtained from the models, anduse peer average data to provide customized recommendations for each companyto improve their shareholder value. Assuming that the companies follow theserules, we also predict future RONW and EVA for the companies for the financialyear 2005. Finally, we make several recommendations to software providers foreffectively competing in the global arena.
Keywords. Shareholder value; strategic profit model (SPM); economicvalue-added (EVA).
1. Introduction
With the increasing global competition, companies are focusing their efforts on creatingshareholder value in order to survive the intense competition. In view of this, it is becomingimportant for companies to measure the value they create for their shareholders. Keepingtrack of the value created year-on-year enables companies to evaluate past decisions and makedecisions that will improve shareholder value.
With the increasing focus on core competencies, many companies are outsourcing theirinformation technology (IT) related activities to third party software service providers. For
475
476 N Viswanadham and Poornima Luthra
example, Indian software companies have become global leaders in providing these servicesdue to their access to lower cost labour and highly skilled workforce. These software serviceproviders have been facing severe backlash from the West where jobs are being lost dueto outsourcing. With such challenges, it becomes important for the companies to becomeaware of their position (in terms of shareholder value creation, revenue and expenditure) incomparison with their competitors. Knowing these will enable the companies to define andredefine their strategy to improve their profit margins and also capitalize on their individualstrengths to enhance shareholder value creation.
This paper is arranged as follows: we begin with a survey of present literature on shareholdervalue analysis and the models used to measure this value. We then introduce the four Indiansoftware companies that are used in this study. The companies have been given fictitious namesto provide confidentiality. Following this, we apply the models to the companies selected.We use the data provided by the models (in the period 2002–2004) to provide an in-depthanalysis of the companies and their competitive position, and the measures that each of themcan take to improve their shareholder value. In addition, we use the past data available to usto predict the shareholder value (RONW and EVA) for 2005.
2. Literature survey
Existing research on shareholder value is focused on determining the methods of measuringthis value, and applying these methods to study the creation of shareholder value for variousindustries. Copelandet al (1994) discuss the benefits of shareholder value measurementand Lambert & Burduroglu (2000) provide methods for measuring this value. Lambert &Burduroglu (2000) discuss SPM, while Stewartet al (2002) discuss EVA. Stapletonet al(2002) have applied the SPM to players of the athletic footwear industry. Walters (1999)develops the general operating value drivers for EVA. In this paper, two of the methods, thestrategic profit model (SPM) and economic value-added (EVA) are used.
Existing research concentrates on shareholder value analysis on manufacturing companies.The research in this paper introduces two methods of measuring shareholder value, and appliesthem to the Indian software industry. Such an analysis would enable firms in this industry toknow their competitive advantages and disadvantages, and provide focus on the key areas ofimprovement of shareholder value.
2.1 Measuring shareholder value
2.1a Value-based performance measurement:Performance measurement is the method ofassessing a company’s progress towards achieving its preset goals. Through key performancemeasures, an organisation’s strategy is linked to its operations. The objective of performancemeasurement and management is to increase the shareholder value, profitability, growth,competitiveness, quality, customer satisfaction, etc. of an organisation resulting in improvedperformance (Moncla & Arents-Gregory 2003).
An important concept in performance measurement is benchmarking. Benchmarking isthe systematic process of searching for the best business practices, innovative ideas andeffective operating procedures to fuel progress and improvement (Bogan & English 1994, p. 1).Benchmarking enables companies to compare their key performance measures internally orexternally. An organisation can study practices and measure performance from within itself,or against its industry peers. Benchmarking helps organisations refine their strategy throughthe re-examination of products, prices, practices, strategies, structures and services againstcompetitors and other industry leaders (Bogan & English 1994, p. 9).
Models for measuring and predicting shareholder value 477
A particular category of performance measures are financial performance measures. Finan-cial measures indicate to top-management whether their strategy execution is leading to bet-ter bottom-line results (Niven 2003, p. 19). The financial metrics are based on informationobtained from balance sheets, income statements and cashflow statements (Bogan & English1994, p. 57). Some examples of these metrics are revenue, gross profit, operating income, netincome, earnings per share, long-term debt, cash flow, debt/equity ration, etc. By adopting aperformance measurement system based on financial measures, companies can identify thekey performance metrics that would result in improved financial outcomes.
As customers place an increasing demand on companies to provide “value-added” services,it is becoming vital for companies to be able to measure the value of these services in orderto justify a premium price for the services and ensure continued profitability (Lambert &Burduroglu 2000). Many organisations have adopted a new breed of performance measuresthat are based on shareholder value, known as value-based management.
Shareholder value is the financial value created for shareholders by the companies in whichthey invest (Christopher & Ryals 1999, p. 2). A shareholder is any holder of one or more sharesin a company. The evidence of being a shareholder is in the form of a stock certificate. Theshareholder value theory states that a company creates this value when it meets or exceeds acost of capital that suitably reflects its investment risk (Lambert & Burduroglu 2000, p. 10).
Companies are choosing to employ a system of measuring shareholder value for manyreasons (Copelandet al1994, p. 22). First, value is the best metric of performance as it is theonly measure that is comprehensive and hence is useful for decision-making. By increasingshareholder value, companies can maximize the value for other stakeholders (customers,labour and government (through taxes paid) and suppliers of capital). Second, shareholdersare the only stakeholders of a company who simultaneously maximize everyone’s claim inseeking to maximize their own. Finally, companies that are unable to create shareholder valuewill find that capital flows away from them and towards their competitors who are creatingshareholder value.
The most common methods for measuring shareholder value are (Lambert & Burduroglu2000, p. 2):
• Customer satisfaction and customer value-added (CVA)• Total cost analysis• Profitability analysis• Strategic profit model (SPM)• Economic value-added (EVA)
The strategic profit model (SPM) and economic value-added (EVA) methods of measuringshareholder value are used here to analyse the Indian software industry. The advantages of theSPM and EVA models are that they enable the company to focus on shareholder value, are themost financially comprehensive of the above methods and provide a long-term orientation intheir analysis. They are reliable and consistent methods of measuring the value of business, andhow alternative strategies and investments will affect the company’s total shareholder value.Due to these advantages, the SPM and EVA models were chosen as methods of measuringshareholder value.
2.2 Strategic profit model (SPM)
The strategic profit model (SPM) measures the return on net worth (RONW) of a company.RONW is a tool that is used to measure the increase or decrease in the shareholder value
478 N Viswanadham and Poornima Luthra
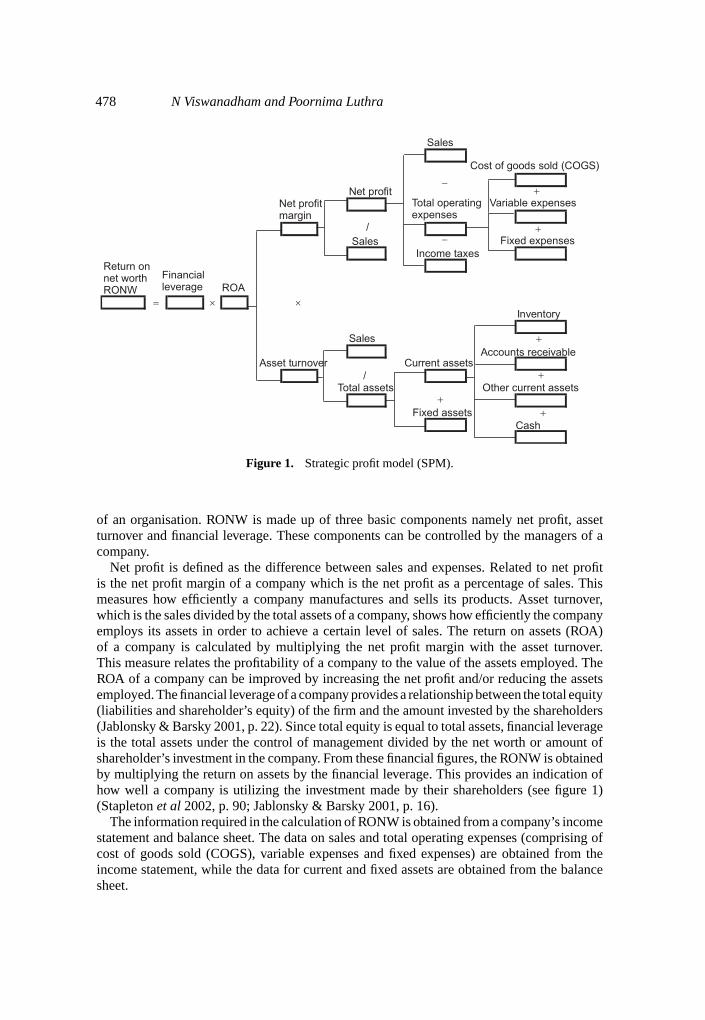
Figure 1. Strategic profit model (SPM).
of an organisation. RONW is made up of three basic components namely net profit, assetturnover and financial leverage. These components can be controlled by the managers of acompany.
Net profit is defined as the difference between sales and expenses. Related to net profitis the net profit margin of a company which is the net profit as a percentage of sales. Thismeasures how efficiently a company manufactures and sells its products. Asset turnover,which is the sales divided by the total assets of a company, shows how efficiently the companyemploys its assets in order to achieve a certain level of sales. The return on assets (ROA)of a company is calculated by multiplying the net profit margin with the asset turnover.This measure relates the profitability of a company to the value of the assets employed. TheROA of a company can be improved by increasing the net profit and/or reducing the assetsemployed. The financial leverage of a company provides a relationship between the total equity(liabilities and shareholder’s equity) of the firm and the amount invested by the shareholders(Jablonsky & Barsky 2001, p. 22). Since total equity is equal to total assets, financial leverageis the total assets under the control of management divided by the net worth or amount ofshareholder’s investment in the company. From these financial figures, the RONW is obtainedby multiplying the return on assets by the financial leverage. This provides an indication ofhow well a company is utilizing the investment made by their shareholders (see figure 1)(Stapletonet al2002, p. 90; Jablonsky & Barsky 2001, p. 16).
The information required in the calculation of RONW is obtained from a company’s incomestatement and balance sheet. The data on sales and total operating expenses (comprising ofcost of goods sold (COGS), variable expenses and fixed expenses) are obtained from theincome statement, while the data for current and fixed assets are obtained from the balancesheet.
Models for measuring and predicting shareholder value 479
A company can increase its RONW by implementing one of the following.
• Increase sales• Reduce operating expenses• Reduce total assets
We assume that the financial leverage of a company remains the same since asset reductionin one area (e.g. inventory or accounts receivable) would result in the cash being used in othermore productive assets.
2.3 Economic value-added (EVA)
Stern Stewart & Co (www.sternstewart.com/) created the EVA to aid managers in theirdecision-making by incorporating two basic concepts of finance. The first is that the objectiveof any business is to maximize the value created for the company’s shareholders. Second, thevalue of a company is dependent on the extent to which shareholders expect earnings to begreater than or less than the cost of capital. A continuous increase in EVA will result in anincrease in the market value of the company.
EVA has been adopted by many companies including Coca Cola Inc, DuPont, AT&T,Quaker Oats and General Motors. In a Stern Stewart Research Special Report (Stewartet al2002), companies that implemented the EVA in the 1990s outperformed their peers by anaverage of 8·3% per annum over the five years following its adoption, and created total excessshareholder wealth of $116 billion. The report also showed that even in periods of economicslowdown, EVA clients earned a total return of 36·5% and beat the S&P 500 by a total of69·8%.
The reason so many companies have adopted the EVA and have realized financial benefitsare due to the advantages of its use. EVA highlights the areas of the company that create value.This enables managers to take decisions on increasing the efficiency of their capital and oper-ations by focusing work on areas with higher productivity. EVA-based financial managementgives managers superior information, motivation, empowerment and accountability to ensurethat their decisions create the greatest amount of shareholder value. EVA aligns the decisionsmanagers take with the creation of shareholder wealth.
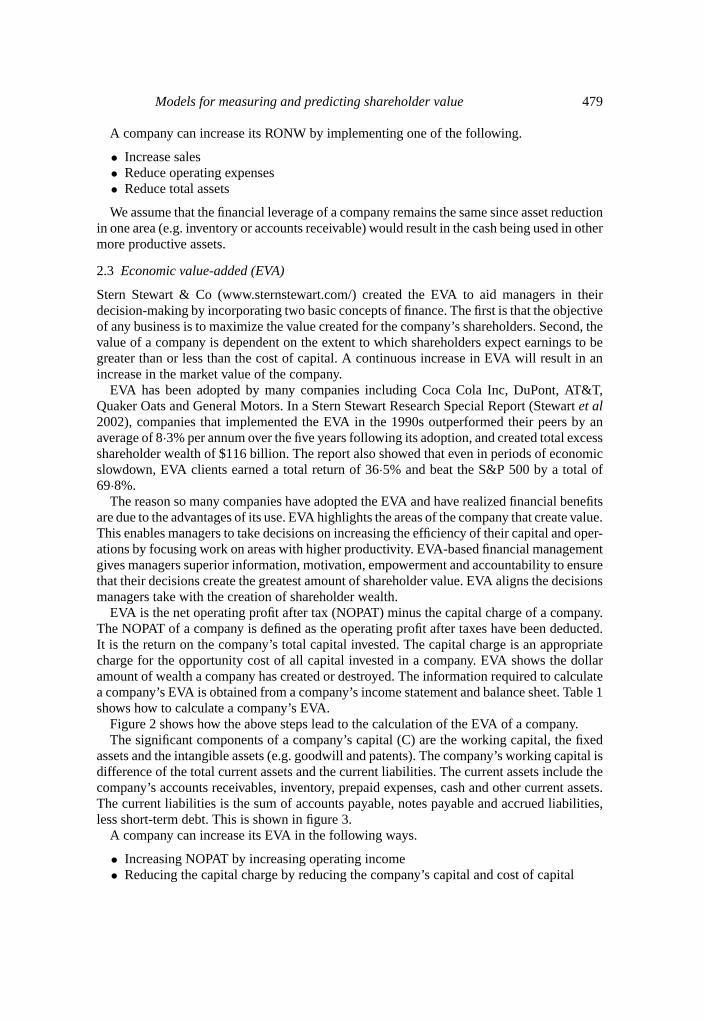
EVA is the net operating profit after tax (NOPAT) minus the capital charge of a company.The NOPAT of a company is defined as the operating profit after taxes have been deducted.It is the return on the company’s total capital invested. The capital charge is an appropriatecharge for the opportunity cost of all capital invested in a company. EVA shows the dollaramount of wealth a company has created or destroyed. The information required to calculatea company’s EVA is obtained from a company’s income statement and balance sheet. Table 1shows how to calculate a company’s EVA.
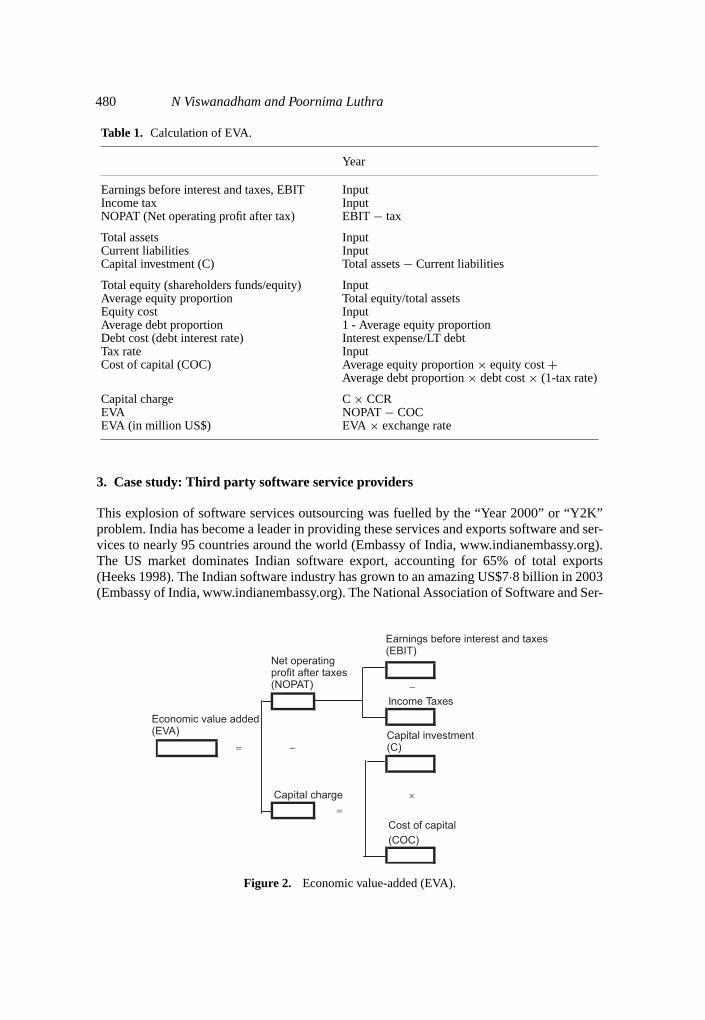
Figure 2 shows how the above steps lead to the calculation of the EVA of a company.The significant components of a company’s capital (C) are the working capital, the fixed
assets and the intangible assets (e.g. goodwill and patents). The company’s working capital isdifference of the total current assets and the current liabilities. The current assets include thecompany’s accounts receivables, inventory, prepaid expenses, cash and other current assets.The current liabilities is the sum of accounts payable, notes payable and accrued liabilities,less short-term debt. This is shown in figure 3.
A company can increase its EVA in the following ways.
• Increasing NOPAT by increasing operating income• Reducing the capital charge by reducing the company’s capital and cost of capital
480 N Viswanadham and Poornima Luthra
Table 1. Calculation of EVA.
Year
Earnings before interest and taxes, EBIT InputIncome tax InputNOPAT (Net operating profit after tax) EBIT− tax
Total assets InputCurrent liabilities InputCapital investment (C) Total assets− Current liabilities
Total equity (shareholders funds/equity) InputAverage equity proportion Total equity/total assetsEquity cost InputAverage debt proportion 1 - Average equity proportionDebt cost (debt interest rate) Interest expense/LT debtTax rate InputCost of capital (COC) Average equity proportion× equity cost+
Average debt proportion× debt cost× (1-tax rate)
Capital charge C× CCREVA NOPAT − COCEVA (in million US$) EVA × exchange rate
3. Case study: Third party software service providers
This explosion of software services outsourcing was fuelled by the “Year 2000” or “Y2K”problem. India has become a leader in providing these services and exports software and ser-vices to nearly 95 countries around the world (Embassy of India, www.indianembassy.org).The US market dominates Indian software export, accounting for 65% of total exports(Heeks 1998). The Indian software industry has grown to an amazing US$7·8 billion in 2003(Embassy of India, www.indianembassy.org). The National Association of Software and Ser-
Figure 2. Economic value-added (EVA).
Models for measuring and predicting shareholder value 481
Figure 3. Detailed EVA showing variables that affect its value.
vice Companies (NASSCOM) predicts that Indian software services export revenues willincrease by between 30 and 32% in 2004 to around 16·3 billion dollars (www.nasscom.org).
The software companies chosen in this study provide consulting as well as informationtechnology (IT) related services on a global scale. Their markets include USA, Canada, AsiaPacific, Japan and Europe. The objective of these companies is to define, optimize and aligntheir client’s business strategy with technology initiatives. The services provided includeenterprise IT programs, communications and IT product development, engineering productdesign and data management. These services help address the following issues: streamliningprocesses with IT, managing IT enabled processes, optimizing IT resources and creating betterbusiness value. The clientele of the above companies come from a wide range of industriesincluding engineering and utilities, financial services, healthcare, life sciences, manufacturing,retail and distribution, technology, telecom and transportation.
4. Applying the models
In this section we analyse the performance of four software service providers. We name themA, B, C and D for the sake of anonymity. Table 2 compares these companies in terms of
Table 2. Comparison of software industry players considered here (2004).
Company name Revenue (Rs. crores) Number of employees (above)
A 5260 29000B 4761 25000C 2636 12000D 1667 6000
482 N Viswanadham and Poornima Luthra
revenues and number of employees.The financial data for the years 2002–2004 of A, B, Cand D obtained from the published balance sheets and income statements is entered into theSPM and EVA models to observe how the decisions that managers make affect the RONWand EVA, and hence shareholder value. Using the Microsoft Excel spreadsheet, “what-if”analysis to improve shareholder value can be carried out easily (Stapletonet al2002, p. 93).The results obtained highlight the areas of improvement and can be used by the managers ofthese software companies to provide a direction for their strategy formulation.
In the next few sections, each of the four firms is analysed. This analysis is performed onecompany at a time. In 2002 and 2003, the software industry experienced a slowdown due tocurrency appreciation, pricing pressures and higher wage costs. These gave rise to a declinein the financial data and ratios of the companies in 2003. By analysing the companies in 2003,we develop strategies based on the ‘worst-case’ financial data. D’s 2004 financial data werenot available at the time of writing this report, and hence comparison of the firms was onlypossible for the years 2002–2003.
The goal of our analyses is to find ways to improve the RONW and EVA by 15% or to thepeer group average level depending on each firm’s situation. First, the company is comparedto the peer group average. Next, strategies are proposed that investigate the changes in thedifferent variables of the two models to achieve a desired goal. These strategies are consideredin isolation, one variable at a time. We then present our recommendations for each company,which may involve varying one or more variables to achieve the desired result. We comparethese recommendations with the financial data obtained from the balance sheet and incomestatement of A, B and C for the year ending March 2004. Lastly, we predict the level of RONWand EVA if the firms follow our recommendations of a 15% increase RONW and EVA forthe year 2005, with the exception of D, whose RONW and EVA is predicted for 2004.
4.1 Assumptions
There are several assumptions that have been made in using the SPM and EVA models toanalyse the main players of the software industry. For the purpose of this exercise, and in thespirit of comparison, it is assumed that these companies compete in the same markets makingthe comparisons more valid and meaningful.
Strategic profit model (SPM) assumptions:
(1) The model assumes that the total operating expense is the sum of the cost of goods sold(COGS), variable expenses and fixed expenses. This is to overcome the difference indefinitions of these terms among the companies to enable comparison.
(2) The SPM is designed to allow changes of one variable to be monitored. However, in thecase of sales, the model has been modified. Changes in sales cause changes in the totaloperating expense and the accounts receivable for the software companies. For instance,when sales increase, the level of total operating expenses and accounts receivable alsoincrease. The value of these two variables as a percentage of sales is first calculated. It isassumed that this percentage remains constant through the changes in sales, and is usedto compute the new value of total operating expenses and accounts receivable. It is alsoassumed that when changing any of the other variables (excluding sales), the remainingvariables remain unchanged.
(3) The variables that can be altered for this model are sales, total operating expenses, inven-tory, accounts receivables and fixed assets. Fixed expenses are not controllable in the
Models for measuring and predicting shareholder value 483
short-run since most rentals and insurance policies that constitute this variable, are over along period of time (30–40 years). In addition, changes in the cash reserves of a companywill not lead to significant changes in the total assets since the cash will be reinvested intothe business.
Economic value-added (EVA) assumptions:
(1) It is assumed that when changing any of the variables (Net Operating Profit afterTax (NOPAT), capital investment or cost of capital), the remaining variables remainunchanged.
(2) In the calculation of the change in Earnings before Interest and Tax (EBIT) required toachieve the change in NOPAT as predicted by the model, the income tax rate is assumedto be constant. The income tax rate is equal to the income tax divided by EBIT.
(3) The variables that can be controlled for the EVA model are the NOPAT, capital investment(C), and the cost of capital (COC). By altering these variables, improvements in EVA canbe obtained.
4.2 Strategic profit model (SPM)
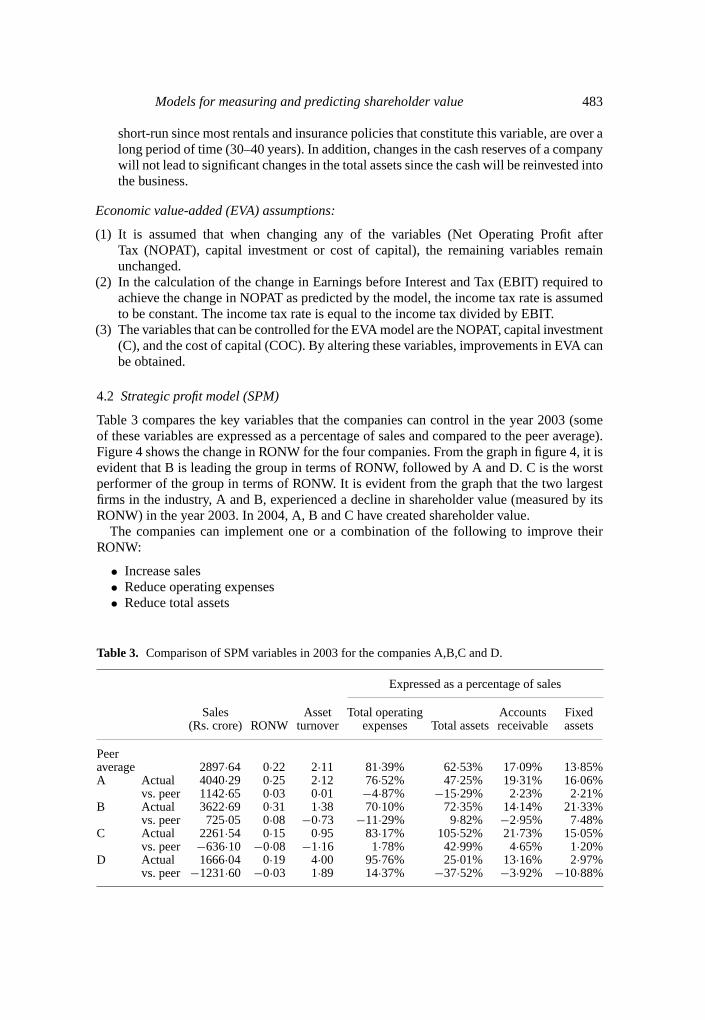
Table 3 compares the key variables that the companies can control in the year 2003 (someof these variables are expressed as a percentage of sales and compared to the peer average).Figure 4 shows the change in RONW for the four companies. From the graph in figure 4, it isevident that B is leading the group in terms of RONW, followed by A and D. C is the worstperformer of the group in terms of RONW. It is evident from the graph that the two largestfirms in the industry, A and B, experienced a decline in shareholder value (measured by itsRONW) in the year 2003. In 2004, A, B and C have created shareholder value.
The companies can implement one or a combination of the following to improve theirRONW:
• Increase sales• Reduce operating expenses• Reduce total assets
Table 3. Comparison of SPM variables in 2003 for the companies A,B,C and D.
Expressed as a percentage of sales
Sales Asset Total operating Accounts Fixed(Rs. crore) RONW turnover expenses Total assets receivable assets
Peeraverage 2897·64 0·22 2·11 81·39% 62·53% 17·09% 13·85%A Actual 4040·29 0·25 2·12 76·52% 47·25% 19·31% 16·06%
vs. peer 1142·65 0·03 0·01 −4·87% −15·29% 2·23% 2·21%B Actual 3622·69 0·31 1·38 70·10% 72·35% 14·14% 21·33%
vs. peer 725·05 0·08 −0·73 −11·29% 9·82% −2·95% 7·48%C Actual 2261·54 0·15 0·95 83·17% 105·52% 21·73% 15·05%
vs. peer −636·10 −0·08 −1·16 1·78% 42·99% 4·65% 1·20%D Actual 1666·04 0·19 4·00 95·76% 25·01% 13·16% 2·97%
vs. peer −1231·60 −0·03 1·89 14·37% −37·52% −3·92% −10·88%
484 N Viswanadham and Poornima Luthra
Figure 4. Graph showing variation in RONW over time for A, B, C and D.
4.3 Economic value-added (EVA)
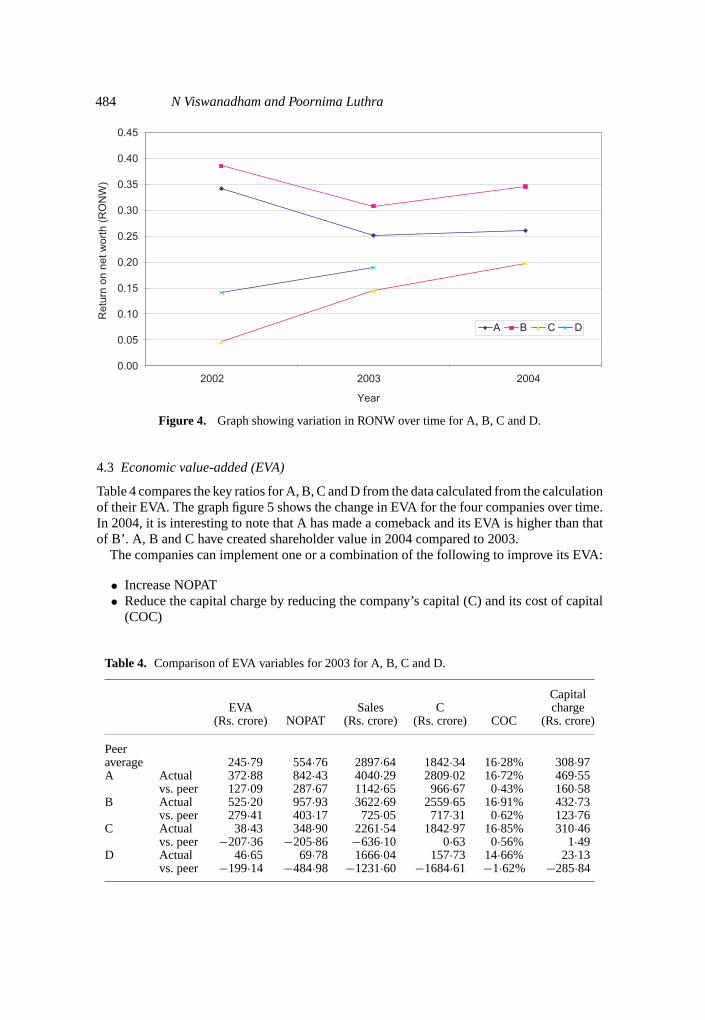
Table 4 compares the key ratios for A, B, C and D from the data calculated from the calculationof their EVA. The graph figure 5 shows the change in EVA for the four companies over time.In 2004, it is interesting to note that A has made a comeback and its EVA is higher than thatof B’. A, B and C have created shareholder value in 2004 compared to 2003.
The companies can implement one or a combination of the following to improve its EVA:
• Increase NOPAT• Reduce the capital charge by reducing the company’s capital (C) and its cost of capital
(COC)
Table 4. Comparison of EVA variables for 2003 for A, B, C and D.
CapitalEVA Sales C charge
(Rs. crore) NOPAT (Rs. crore) (Rs. crore) COC (Rs. crore)
Peeraverage 245·79 554·76 2897·64 1842·34 16·28% 308·97A Actual 372·88 842·43 4040·29 2809·02 16·72% 469·55
vs. peer 127·09 287·67 1142·65 966·67 0·43% 160·58B Actual 525·20 957·93 3622·69 2559·65 16·91% 432·73
vs. peer 279·41 403·17 725·05 717·31 0·62% 123·76C Actual 38·43 348·90 2261·54 1842·97 16·85% 310·46
vs. peer −207·36 −205·86 −636·10 0·63 0·56% 1·49D Actual 46·65 69·78 1666·04 157·73 14·66% 23·13
vs. peer −199·14 −484·98 −1231·60 −1684·61 −1·62% −285·84
Models for measuring and predicting shareholder value 485
Figure 5. EVA over time for A, B, C and D.
4.4 Company A
4.4a A’s status in 2003 based on SPM and EVA:A has the highest sales revenue of thefour companies. Its RONW and EVA have declined from 2002 to 2003 due to reduced netprofit margins and reduced asset turnover. This is due to the company experiencing higheroperating costs and hence reduced profit margins, as well as increased total assets. A had ahigher EVA than B in 2002 and is in keen competition with B for revenues.
4.4b Strategies for improvement:Table 5 summarizes the key financial measures in whichA is better than the peer average, and those in which it is performing worse than the peeraverage.
The three basic strategies that A’s management can use to improve its RONW are to increasesales, decrease total operating expenses or reduce assets. Assuming that A desires to increaseits RONW by 15%, each of these changes is independently evaluated. A 15% increase inRONW will translate into an increase of RONW to 0·29. By using the SPM to analyse A’sfinancial data, the areas for improvement are determined.
Table 5. Summary of A’s positive and negative financial measures for 2003.
Better than peer average Lower than peer average
• Sales • Accounts receivable• RONW • Fixed assets• Total operating expenses • Capital investment (C)• Asset turnover • Cost of capital (COC)• Total assets • Capital charge• EVA• NOPAT
486 N Viswanadham and Poornima Luthra
A’s declining RONW is due to its decreasing profit margins. A could increase its sales orreduced its operating expenses. This would improve the company’s profit margin. In orderto improve the RONW by 15%, A would have to increase sales by 2·85%. This translatesinto an increase of Rs. 117 crores in sales revenues. To achieve the increase in RONW, thecompany would have a corresponding increase in total operating expenses, inventory andaccounts receivable. The asset turnover increases helping to improve the RONW.
The second strategy available to A’s managers is to reduce expenses. Assuming all elseremains the same, the total operating expenses would have to decrease by 3·49% or Rs. 110crores to achieve a 15% increase in RONW. A’s total operating expenses are just below the peeraverage but are higher than its closest competitor B. Since A’s profit margins have sufferedover the past year, a slight reduction in its operating expenses will increase its RONW.
The last strategy that A’s managers can adopt is to reduce the total assets. This can beachieved by reducing accounts receivable and fixed assets. The company would not benefitfrom a reduction in inventory since inventory is a very small proportion of total assets andhence its influence on the asset turnover and hence ROA is minimal. Again, by holding all elseconstant, the change of each of these is evaluated independently. To achieve the desired levelof RONW, A would have to reduce its accounts receivable by about 29% which translates toa reduction in Rs. 233 crores. This change is substantial and could result in lost sales due toa tighter credit policy. The company could reduce its fixed assets by 35% or Rs. 229 croresto improve its RONW by 15%. However, such a large reduction may not be realistic dueto assets being an integral part in the running of the business and assets not being easy tosell.
To improve its EVA, A can adopt three main strategies: increase NOPAT, reduce C orreduce COC. A’s EVA (Rs. 372·88 crore) is above the industry peer average. Hence, A’smanagement’s should aim to increase its EVA by 15% to Rs. 428·81 crore.
To achieve an EVA of Rs. 428·81 crore, A’s management would have to increase NOPATby about 6% or Rs. 56 crores. To achieve this increase, A would have to increase its EBIT byabout 6%, assuming that the income tax rate remains constant. Alternatively, A’s managementcould reduce its C or COC. By reducing both of these by 12%, A would be able to reducethe capital charge by 12% to Rs. 413·63 crore, to achieve the EVA of Rs. 428·81 crore. Thistranslates into reducing C by Rs. 335 crores and COC to 14·72%.
4.4c Recommendations:From the data obtained from the SPM, it can be observed that A hasthe highest sales revenue and hence increasing sales by a significant amount may be difficult.Though A’s total operating expenses as a percentage of sales are below the peer average, it ishigher than that of B. A’s accounts receivables and fixed assets as a percentage of sales areabove the peer average. However, it should be noted that A’s total assets as a percentage ofsales are less than the peer average owing to the company’s policies on holding less cash.
From the above observations, it appears that A’s efforts to increase its RONW by 15% maybe best spent on a combination of reducing total operating expenses, accounts receivables andfixed assets. The model demonstrates, for example, that a modest decrease in total operatingexpenses of 1·3% (Rs. 39·7 crores), coupled with a reduction of 12% (Rs. 93 crores) inaccounts receivables and about 10·5% in fixed assets, will result in a 15% increase in RONW.These changes are easier to achieve than if the variables are modified independently.
From the EVA model, it can be seen that A’s NOPAT is well above the peer average, whileits capital charge is the highest of the group. Therefore, A’s strategy should be to decrease itscapital charge to achieve an increase in EVA of 15%. A can adopt a combination of reducingthe C and COC. A can, for example, reduce its C by 7·44% and COC to 15·91%. This would
Models for measuring and predicting shareholder value 487
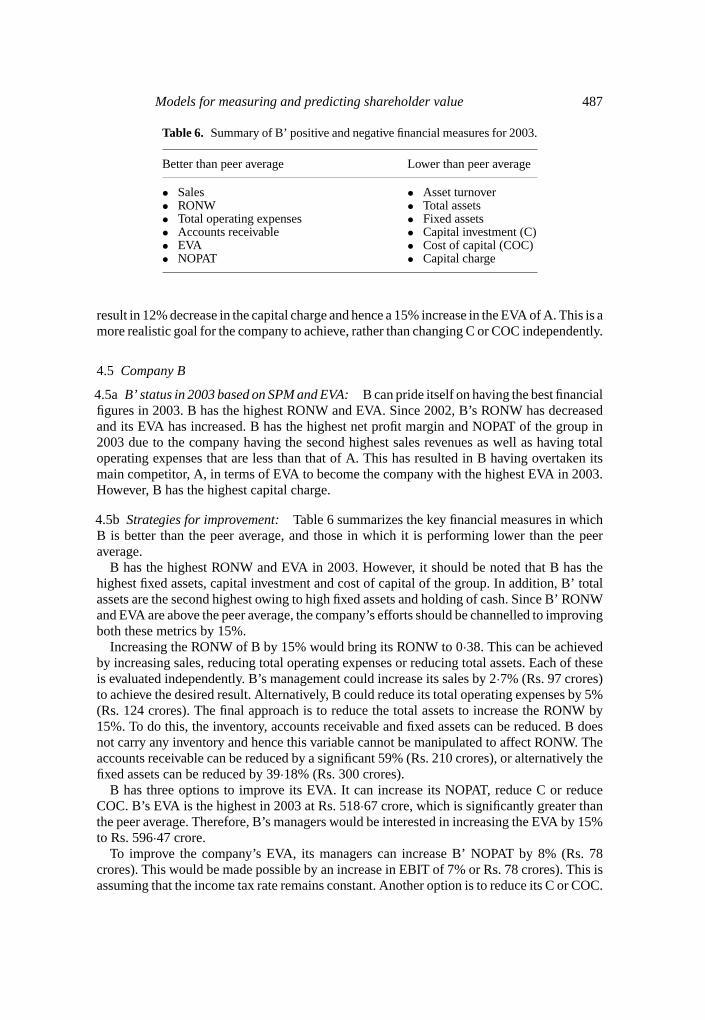
Table 6. Summary of B’ positive and negative financial measures for 2003.
Better than peer average Lower than peer average
• Sales • Asset turnover• RONW • Total assets• Total operating expenses • Fixed assets• Accounts receivable • Capital investment (C)• EVA • Cost of capital (COC)• NOPAT • Capital charge
result in 12% decrease in the capital charge and hence a 15% increase in the EVA of A. This is amore realistic goal for the company to achieve, rather than changing C or COC independently.
4.5 Company B
4.5a B’ status in 2003 based on SPM and EVA:B can pride itself on having the best financialfigures in 2003. B has the highest RONW and EVA. Since 2002, B’s RONW has decreasedand its EVA has increased. B has the highest net profit margin and NOPAT of the group in2003 due to the company having the second highest sales revenues as well as having totaloperating expenses that are less than that of A. This has resulted in B having overtaken itsmain competitor, A, in terms of EVA to become the company with the highest EVA in 2003.However, B has the highest capital charge.
4.5b Strategies for improvement:Table 6 summarizes the key financial measures in whichB is better than the peer average, and those in which it is performing lower than the peeraverage.
B has the highest RONW and EVA in 2003. However, it should be noted that B has thehighest fixed assets, capital investment and cost of capital of the group. In addition, B’ totalassets are the second highest owing to high fixed assets and holding of cash. Since B’ RONWand EVA are above the peer average, the company’s efforts should be channelled to improvingboth these metrics by 15%.
Increasing the RONW of B by 15% would bring its RONW to 0·38. This can be achievedby increasing sales, reducing total operating expenses or reducing total assets. Each of theseis evaluated independently. B’s management could increase its sales by 2·7% (Rs. 97 crores)to achieve the desired result. Alternatively, B could reduce its total operating expenses by 5%(Rs. 124 crores). The final approach is to reduce the total assets to increase the RONW by15%. To do this, the inventory, accounts receivable and fixed assets can be reduced. B doesnot carry any inventory and hence this variable cannot be manipulated to affect RONW. Theaccounts receivable can be reduced by a significant 59% (Rs. 210 crores), or alternatively thefixed assets can be reduced by 39·18% (Rs. 300 crores).
B has three options to improve its EVA. It can increase its NOPAT, reduce C or reduceCOC. B’s EVA is the highest in 2003 at Rs. 518·67 crore, which is significantly greater thanthe peer average. Therefore, B’s managers would be interested in increasing the EVA by 15%to Rs. 596·47 crore.
To improve the company’s EVA, its managers can increase B’ NOPAT by 8% (Rs. 78crores). This would be made possible by an increase in EBIT of 7% or Rs. 78 crores). This isassuming that the income tax rate remains constant. Another option is to reduce its C or COC.
488 N Viswanadham and Poornima Luthra
By reducing each of these by 17%, B can reduce the capital charge by the same percentageto Rs. 361·46 crore. This can be achieved by reducing C by Rs. 453 crore and COC from17·16% to 14·12%.
4.5c Recommendations:B should focus on areas that are under-performing relative to thepeer group. Since B has the lowest total operating expenses as a percentage of the sales andits accounts receivable is less than the peer average, B should focus on increasing sales andreducing the total assets so as to improve the asset turnover, and hence RONW. SPM predictsthat the usage of a strategy targeting these few factors would be the best solution. In this case,for example, an increase in sales of just 2·1% or Rs. 77 crores) combined with a decrease infixed assets of 14·6% or about Rs. 113 crores would result in the 15% increase in RONW.These changes complement each other to achieve the desired results with less drastic changes.
It should be noted that B holds a large portion of cash. The company may consider reducingthe cash held, thereby helping to improve the asset turnover and hence RONW.
B managers should aim to increase its EVA by 15% to Rs. 596·47 crore. The company’scapital charge is higher than the peer average and needs to be reduced. This is partly dueto B having the highest cost of capital. Given these conditions, B can adopt a strategy thatcombines increasing NOPAT with reducing C and COC (in turn, reducing capital charge). Forexample, B could increase NOPAT by 3·35% or Rs. 32 crores, reducing C by 6·24% (Rs. 160crores) and reducing COC to 16·4%. This would reduce capital charge by 10% resulting in anincrease in EVA of 15%. By controlling a few variables, the company is better able to achieveits target EVA to improve shareholder value, without being required to make extremely drasticchanges.
4.6 Company C
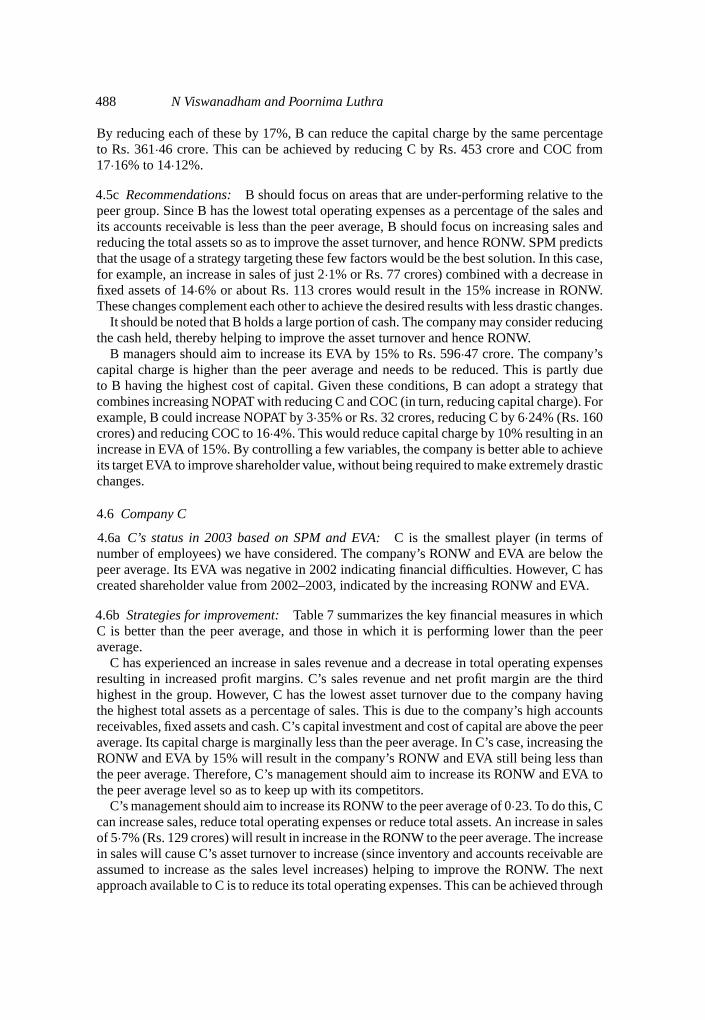
4.6a C’s status in 2003 based on SPM and EVA:C is the smallest player (in terms ofnumber of employees) we have considered. The company’s RONW and EVA are below thepeer average. Its EVA was negative in 2002 indicating financial difficulties. However, C hascreated shareholder value from 2002–2003, indicated by the increasing RONW and EVA.
4.6b Strategies for improvement:Table 7 summarizes the key financial measures in whichC is better than the peer average, and those in which it is performing lower than the peeraverage.
C has experienced an increase in sales revenue and a decrease in total operating expensesresulting in increased profit margins. C’s sales revenue and net profit margin are the thirdhighest in the group. However, C has the lowest asset turnover due to the company havingthe highest total assets as a percentage of sales. This is due to the company’s high accountsreceivables, fixed assets and cash. C’s capital investment and cost of capital are above the peeraverage. Its capital charge is marginally less than the peer average. In C’s case, increasing theRONW and EVA by 15% will result in the company’s RONW and EVA still being less thanthe peer average. Therefore, C’s management should aim to increase its RONW and EVA tothe peer average level so as to keep up with its competitors.
C’s management should aim to increase its RONW to the peer average of 0·23. To do this, Ccan increase sales, reduce total operating expenses or reduce total assets. An increase in salesof 5·7% (Rs. 129 crores) will result in increase in the RONW to the peer average. The increasein sales will cause C’s asset turnover to increase (since inventory and accounts receivable areassumed to increase as the sales level increases) helping to improve the RONW. The nextapproach available to C is to reduce its total operating expenses. This can be achieved through
Models for measuring and predicting shareholder value 489
Table 7. Summary of C’s positive and negative financial measures for 2003.
Better than peer average Lower than peer average
• Sales• RONW• Total operating expenses• Asset turnover• Total assets• Accounts receivable• Fixed assets• EVA• NOPAT• Capital investment (C)• Cost of capital (COC)• Capital charge
an 8% decrease in expenses, which translates to a Rs. 150 crore decrease, keeping all elseconstant. The increase in RONW to the peer average can also be achieved by reducing theinventory, accounts receivable or fixed assets. However, when evaluated independently, thesefigures are a very small proportion of the total assets and even if they are reduced to zero, theimpact of the RONW is not significant to increase the RONW to the peer average.
C’s managers should increase its EVA to the peer average of Rs. 244·16 crores. They can doso by implementing one or a combination of the following strategies: increase NOPAT, reduceC and/or reduce COC. C’s managers could increase NOPAT by 58·97%, which translates toan increase in Rs. 205 crores. To achieve this increase in NOPAT, assuming that the incometax rate is constant, C’s EBIT would have to increase by 50·1% or Rs. 205 crore. C’s managerscould also independently decrease its C or COC by 66% to achieve the increase in EVA. Thisdecrease in C or COC would decrease the company’s capital charge to Rs. 104·74 crore.
4.6c Recommendations:Given C’s condition, it is vital that the company improve its netprofit margin. This can be achieved by increasing sales, which is less than the peer average.It should be noted that C’s total assets, accounts receivables and fixed assets as a percentageof sales are above the peer average. By using a combination of strategies, C should aim toincrease its RONW. This approach would not result in very drastic changes having to be madeby the company. To increase the RONW to the peer average of 0·23, C can, for example,increase sales by 5·5% (Rs. 123 crores) and reduce accounts receivables by 32% (Rs. 168crores) and reduce fixed assets by 12% (Rs. 40 crores). These changes are more realistic forthe company to achieve. C’s cash at hand is also very high and accounts for most of the totalassets of the company. Hence, C should aim to reduce the amount of cash held.
C’s C and COC are above the peer average and need to be reduced. Hence, C’s strategy toimprove its EVA to the peer average can be achieved by increasing NOPAT by 29% (Rs. 101crores) and reducing C by 18% (Rs. 343 crores), as well as reducing COC to 13·72%. Thesechanges would result in the capital charge being reduced by 3·4%.
4.7 Company D
4.7a D’s status in 2003 based on SPM and EVA:D has the lowest sales revenue and is hencethe smallest player among the four companies. D ranks third in terms of RONW and EVA.
490 N Viswanadham and Poornima Luthra
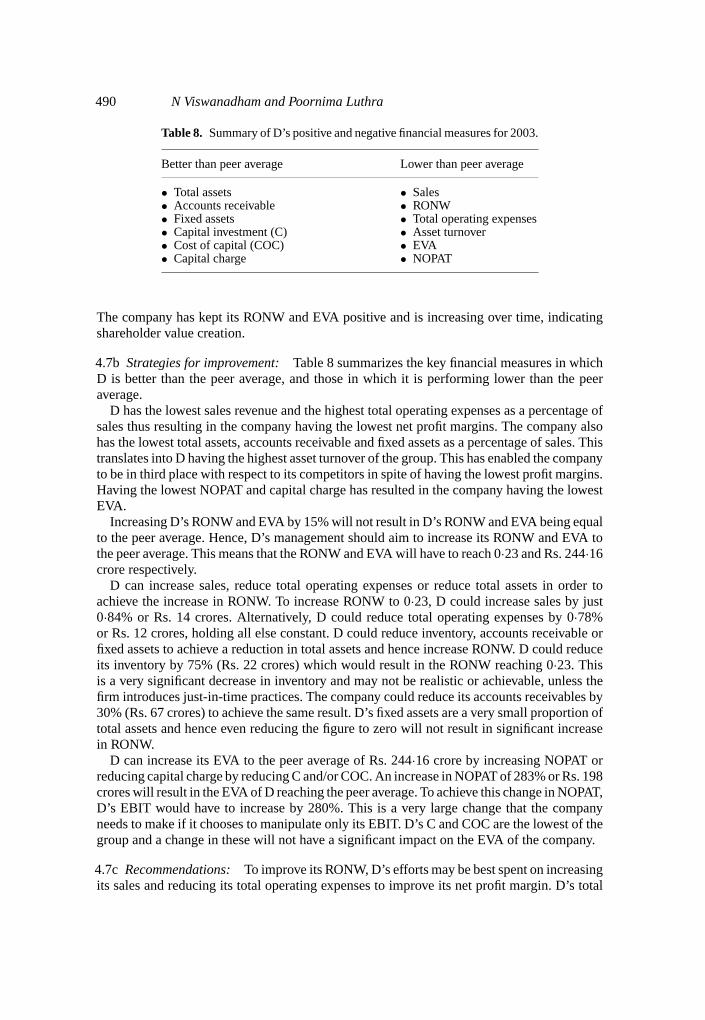
Table 8. Summary of D’s positive and negative financial measures for 2003.
Better than peer average Lower than peer average
• Total assets • Sales• Accounts receivable • RONW• Fixed assets • Total operating expenses• Capital investment (C) • Asset turnover• Cost of capital (COC) • EVA• Capital charge • NOPAT
The company has kept its RONW and EVA positive and is increasing over time, indicatingshareholder value creation.
4.7b Strategies for improvement:Table 8 summarizes the key financial measures in whichD is better than the peer average, and those in which it is performing lower than the peeraverage.
D has the lowest sales revenue and the highest total operating expenses as a percentage ofsales thus resulting in the company having the lowest net profit margins. The company alsohas the lowest total assets, accounts receivable and fixed assets as a percentage of sales. Thistranslates into D having the highest asset turnover of the group. This has enabled the companyto be in third place with respect to its competitors in spite of having the lowest profit margins.Having the lowest NOPAT and capital charge has resulted in the company having the lowestEVA.
Increasing D’s RONW and EVA by 15% will not result in D’s RONW and EVA being equalto the peer average. Hence, D’s management should aim to increase its RONW and EVA tothe peer average. This means that the RONW and EVA will have to reach 0·23 and Rs. 244·16crore respectively.
D can increase sales, reduce total operating expenses or reduce total assets in order toachieve the increase in RONW. To increase RONW to 0·23, D could increase sales by just0·84% or Rs. 14 crores. Alternatively, D could reduce total operating expenses by 0·78%or Rs. 12 crores, holding all else constant. D could reduce inventory, accounts receivable orfixed assets to achieve a reduction in total assets and hence increase RONW. D could reduceits inventory by 75% (Rs. 22 crores) which would result in the RONW reaching 0·23. Thisis a very significant decrease in inventory and may not be realistic or achievable, unless thefirm introduces just-in-time practices. The company could reduce its accounts receivables by30% (Rs. 67 crores) to achieve the same result. D’s fixed assets are a very small proportion oftotal assets and hence even reducing the figure to zero will not result in significant increasein RONW.
D can increase its EVA to the peer average of Rs. 244·16 crore by increasing NOPAT orreducing capital charge by reducing C and/or COC. An increase in NOPAT of 283% or Rs. 198crores will result in the EVA of D reaching the peer average. To achieve this change in NOPAT,D’s EBIT would have to increase by 280%. This is a very large change that the companyneeds to make if it chooses to manipulate only its EBIT. D’s C and COC are the lowest of thegroup and a change in these will not have a significant impact on the EVA of the company.
4.7c Recommendations:To improve its RONW, D’s efforts may be best spent on increasingits sales and reducing its total operating expenses to improve its net profit margin. D’s total
Models for measuring and predicting shareholder value 491
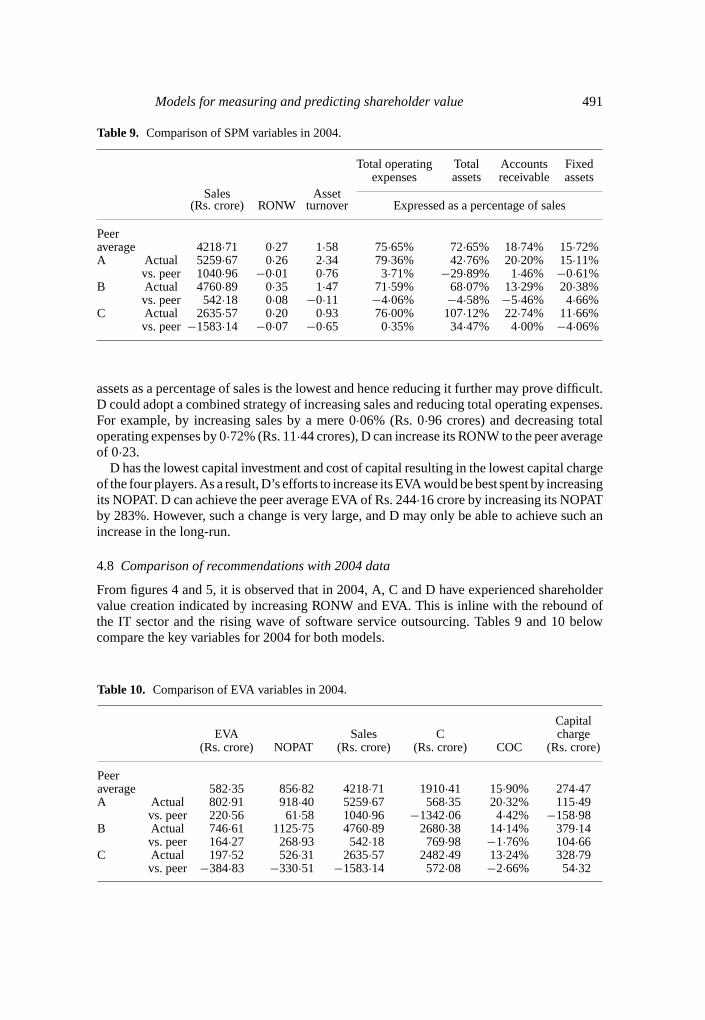
Table 9. Comparison of SPM variables in 2004.
Total operating Total Accounts Fixedexpenses assets receivable assets
Sales Asset(Rs. crore) RONW turnover Expressed as a percentage of sales
Peeraverage 4218·71 0·27 1·58 75·65% 72·65% 18·74% 15·72%A Actual 5259·67 0·26 2·34 79·36% 42·76% 20·20% 15·11%
vs. peer 1040·96 −0·01 0·76 3·71% −29·89% 1·46% −0·61%B Actual 4760·89 0·35 1·47 71·59% 68·07% 13·29% 20·38%
vs. peer 542·18 0·08 −0·11 −4·06% −4·58% −5·46% 4·66%C Actual 2635·57 0·20 0·93 76·00% 107·12% 22·74% 11·66%
vs. peer−1583·14 −0·07 −0·65 0·35% 34·47% 4·00% −4·06%
assets as a percentage of sales is the lowest and hence reducing it further may prove difficult.D could adopt a combined strategy of increasing sales and reducing total operating expenses.For example, by increasing sales by a mere 0·06% (Rs. 0·96 crores) and decreasing totaloperating expenses by 0·72% (Rs. 11·44 crores), D can increase its RONW to the peer averageof 0·23.
D has the lowest capital investment and cost of capital resulting in the lowest capital chargeof the four players. As a result, D’s efforts to increase its EVA would be best spent by increasingits NOPAT. D can achieve the peer average EVA of Rs. 244·16 crore by increasing its NOPATby 283%. However, such a change is very large, and D may only be able to achieve such anincrease in the long-run.
4.8 Comparison of recommendations with 2004 data
From figures 4 and 5, it is observed that in 2004, A, C and D have experienced shareholdervalue creation indicated by increasing RONW and EVA. This is inline with the rebound ofthe IT sector and the rising wave of software service outsourcing. Tables 9 and 10 belowcompare the key variables for 2004 for both models.
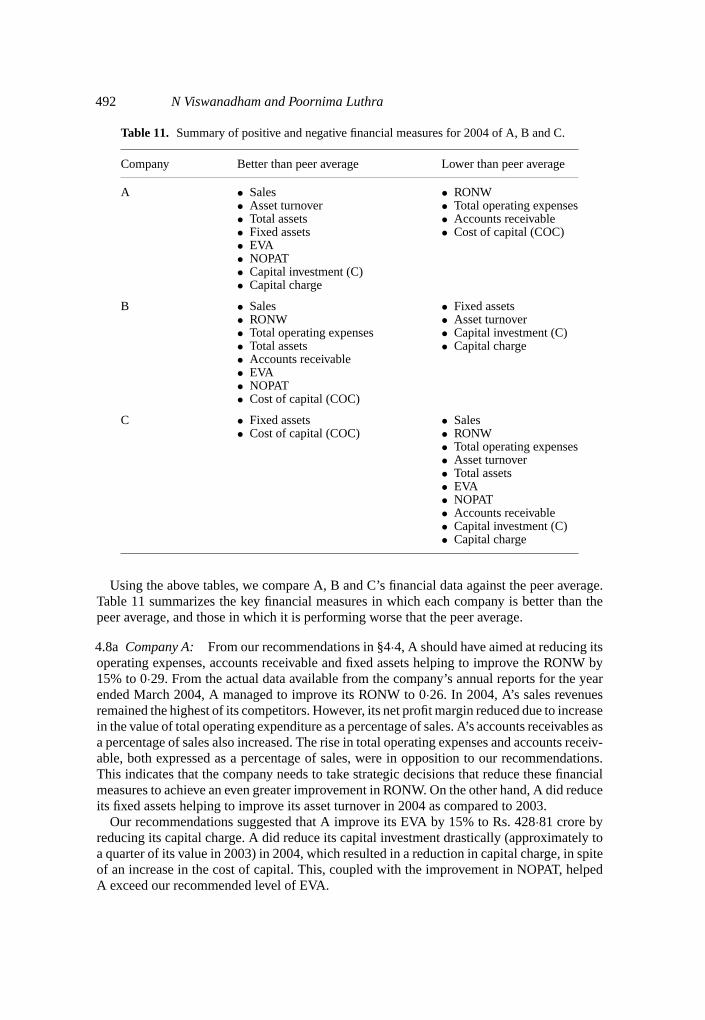
Table 10. Comparison of EVA variables in 2004.
CapitalEVA Sales C charge
(Rs. crore) NOPAT (Rs. crore) (Rs. crore) COC (Rs. crore)
Peeraverage 582·35 856·82 4218·71 1910·41 15·90% 274·47A Actual 802·91 918·40 5259·67 568·35 20·32% 115·49
vs. peer 220·56 61·58 1040·96 −1342·06 4·42% −158·98B Actual 746·61 1125·75 4760·89 2680·38 14·14% 379·14
vs. peer 164·27 268·93 542·18 769·98 −1·76% 104·66C Actual 197·52 526·31 2635·57 2482·49 13·24% 328·79
vs. peer −384·83 −330·51 −1583·14 572·08 −2·66% 54·32
492 N Viswanadham and Poornima Luthra
Table 11. Summary of positive and negative financial measures for 2004 of A, B and C.
Company Better than peer average Lower than peer average
A • Sales • RONW• Asset turnover • Total operating expenses• Total assets • Accounts receivable• Fixed assets • Cost of capital (COC)• EVA• NOPAT• Capital investment (C)• Capital charge
B • Sales • Fixed assets• RONW • Asset turnover• Total operating expenses • Capital investment (C)• Total assets • Capital charge• Accounts receivable• EVA• NOPAT• Cost of capital (COC)
C • Fixed assets • Sales• Cost of capital (COC) • RONW
• Total operating expenses• Asset turnover• Total assets• EVA• NOPAT• Accounts receivable• Capital investment (C)• Capital charge
Using the above tables, we compare A, B and C’s financial data against the peer average.Table 11 summarizes the key financial measures in which each company is better than thepeer average, and those in which it is performing worse that the peer average.
4.8a Company A: From our recommendations in §4·4, A should have aimed at reducing itsoperating expenses, accounts receivable and fixed assets helping to improve the RONW by15% to 0·29. From the actual data available from the company’s annual reports for the yearended March 2004, A managed to improve its RONW to 0·26. In 2004, A’s sales revenuesremained the highest of its competitors. However, its net profit margin reduced due to increasein the value of total operating expenditure as a percentage of sales. A’s accounts receivables asa percentage of sales also increased. The rise in total operating expenses and accounts receiv-able, both expressed as a percentage of sales, were in opposition to our recommendations.This indicates that the company needs to take strategic decisions that reduce these financialmeasures to achieve an even greater improvement in RONW. On the other hand, A did reduceits fixed assets helping to improve its asset turnover in 2004 as compared to 2003.
Our recommendations suggested that A improve its EVA by 15% to Rs. 428·81 crore byreducing its capital charge. A did reduce its capital investment drastically (approximately toa quarter of its value in 2003) in 2004, which resulted in a reduction in capital charge, in spiteof an increase in the cost of capital. This, coupled with the improvement in NOPAT, helpedA exceed our recommended level of EVA.
Models for measuring and predicting shareholder value 493
A’s RONW in 2004 is slightly less than the peer average. However, A, being the leadingcompany in terms of RONW, should aim to increase it by 15%, and not to the peer average.A should in future aim to reduce its operating expenditure and accounts receivable to helpimprove its RONW by 15% to 0·30. The company should aim to reduce its cost of capital,though this is largely dependent on macroeconomic conditions, to help improve its EVA by15% to Rs. 923·35 crore.
4.8b Company B: From our analysis in §4·5, B should have increased its sales and reducedits fixed assets to achieve a 15% increase in RONW to 0·38 from 0·31. B’s RONW increasedto 0·35 in 2004, slightly less than the recommended 0·38. B remained in second place in termsof sales revenues. Its sales increased by 31·42%. However, B’s operating expenses increasedreducing its net profit margins. The company reduced its total assets through a reduction infixed assets and accounts receivables helping to improve its asset turnover and RONW. ThoughB’s fixed assets as a percentage of sales have reduced, it is still above the peer average, andfurther reduction needs to take place. B’s cash as a percentage of sales revenue has reducedhelping to improve the asset turnover and hence RONW. Since B’s RONW is above the peeraverage, the firm should take measures to reduce its fixed assets to improve its asset turnoverto achieve a 15% increase in RONW to 0·40.
In terms of B’s EVA, we suggested that the company increase its NOPAT, reduce its capitalinvestment and cost of capital. B has managed to achieve all three of these in 2004. Its EVA in2004 far exceeded our predictions of Rs. 596·47 crore. Since EVA in 2004 is above the peeraverage, B should aim to increase its EVA by 15% to Rs. 858.61 crores. This can be achievedby a further reduction in its capital change charge by reducing its capital investment.
4.8c Company C: C, despite experiencing lower financial rations, has been creating valuefor its shareholders through a continuous increase in RONW and EVA since 2002. Our rec-ommendations suggest that C drastically increase its market share by increasing its salesrevenues. In addition, we suggested that C reduce its accounts receivable and fixed assets.From the data available in 2004, it can be seen that C improved its profit margins by increas-ing sales by more than 16%, which is three times as much as what we had recommended, andreducing its operating expenditure as a percentage of sales. The company has also reducedits fixed assets as a percentage of sales. However, its accounts receivables and cash, bothas a percentage of sales, have increased resulting in a reduction in asset turnover. C hasincreased its RONW to 0·20, which is slightly less that the recommended 0·23. C should, inthe future, aim to increase its RONW to the peer average of 0·27, by further increasing its mar-ket share and hence sales revenue, as well as reducing its operating expenditure and accountsreceivable.
Based on C’s data from 2003, we recommended that the company increase its NOPAT andreduce its capital charge by reducing its capital investment and cost of capital. The companydid increase its NOPAT in 2004 due to its increased sales revenues. However, C’s capital chargehas increased due to an increase in capital investment which was greater than its reduction incost of capital. The increase in NOPAT resulted in C’s EVA increasing to Rs. 197·52 crore,which was less than the peer average in 2003 (244·16). C should aim to increase its EVAto the peer average of Rs. 582·35 crore by increasing its NOPAT (through increased marketshare and lower operating expenditure) as well as reducing its capital investment.
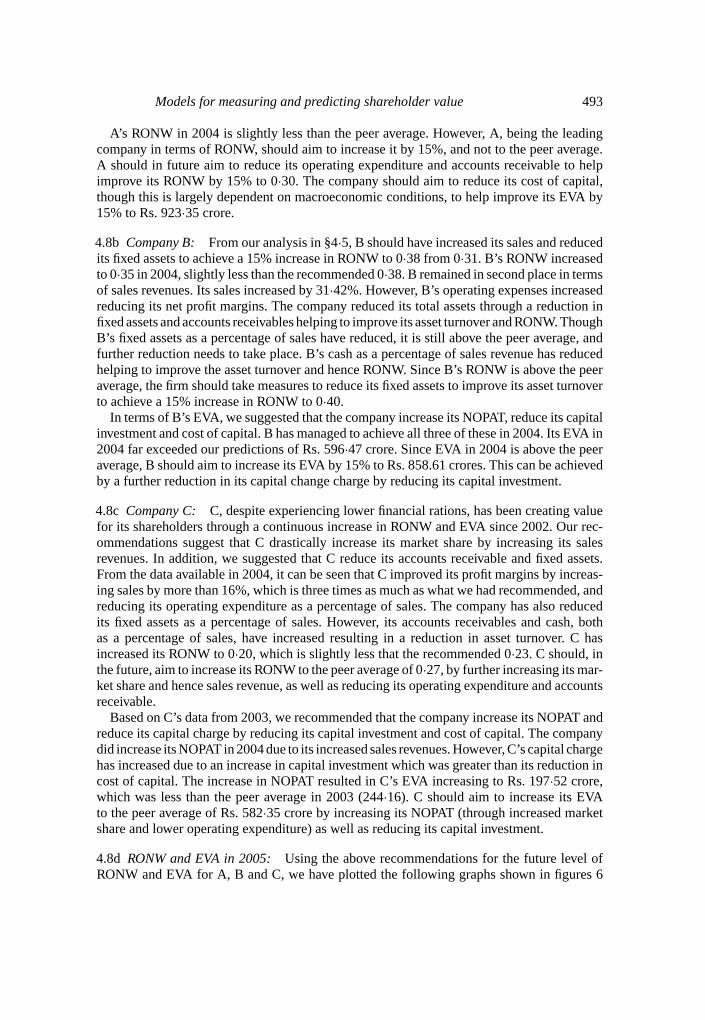
4.8d RONW and EVA in 2005: Using the above recommendations for the future level ofRONW and EVA for A, B and C, we have plotted the following graphs shown in figures 6
494 N Viswanadham and Poornima Luthra
Figure 6. Future SPM for A, B, C and D.
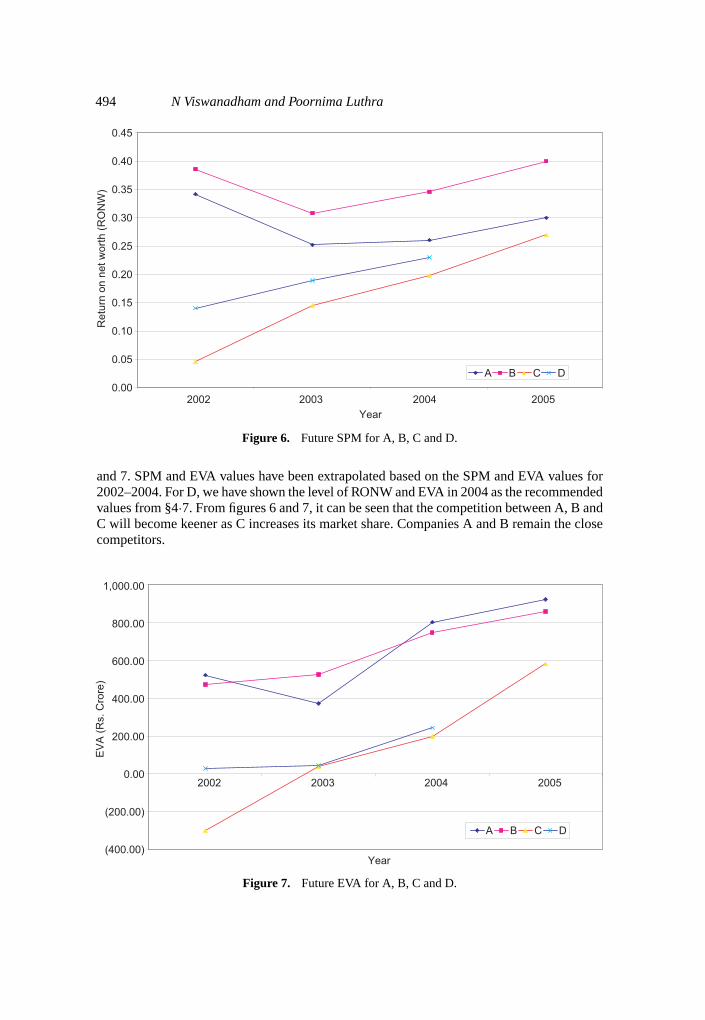
and 7. SPM and EVA values have been extrapolated based on the SPM and EVA values for2002–2004. For D, we have shown the level of RONW and EVA in 2004 as the recommendedvalues from §4·7. From figures 6 and 7, it can be seen that the competition between A, B andC will become keener as C increases its market share. Companies A and B remain the closecompetitors.
Figure 7. Future EVA for A, B, C and D.
Models for measuring and predicting shareholder value 495
5. Discussion and future work
The global software industry is facing a number of challenges. The cost of software productionand maintenance is escalating. The high profit margins and the employment potential ofthe industry attracted the attention of all countries and companies. Companies in this fieldare facing increased pressure from the true globalization of this industry. Our discussionhere is concerned with three different aspects of the software industry, about the modellingmethodology used in this paper, risks faced by the software industry due to globalization, needfor developing managerial best practices, and finally a few remarks on the software industryin India.
5.1 SPM and EVA
In this study, we have used two models SPM and EVA to measure shareholder value. From ourdiscussions companies seem to generally use EVA. SPM provides a very clear picture of theexpenses and assets of the companies. Companies wishing to assess the impact of decisionsthat may shift expenses or assets (such as outsourcing) on shareholder value can use the SPM.On the other hand, companies who wish to take into account the capital charge (i.e. cost ofcapital) into the assessment of shareholder value should use the EVA model. Companies maywish to use both the models as we have done in this study. In doing so, we are able to obtain aclear picture of the determinants of shareholder value and the impact of changes in a variety ofcomponents. This provides us with a holistic understanding of shareholder value, and may aidtop management when making decisions such as outsourcing that affect shareholder value.
5.2 Risks for third party software service providers
Outsourcing of software services has become common and Indian software companies havereceived much attention in recent times. This globalization and doing business with companiesin the West creates risks of its own. The volatility in foreign exchange markets such asthe appreciating Indian Rupee and undervalued Chinese Yuan, pressure on billing rates andhigher employee costs are further reducing profit margins for these companies. The industry isexperiencing volume growth and many of the players we examined in this report are reportingan increase in customer acquisitions. Also, customers are demanding partners rather than justservice providers. A few of the Indian software companies are changing towards this trendby providing more value-added services and moving up the value chain. Indian softwarecompanies are acquiring the capabilities to create business value through high-quality servicesfor their customers.
The biggest risk the software industry faces now is its dependence on US and Europe fortheir contracts. In fact, a large proportion of their revenue comes from finance and manufac-turing firms and from North America. During the recent economic downturn, manufacturingexperienced extreme pressure on their IT spending. Indian software companies for examplehave spent difficult years in the recent past. The companies should thus aim to diversify theirclient base, both across different industries and regions to lower their exposure to revenuevolatility.
Human resources form a big part of the contributor and also expenditure in a knowledgebased industry of this kind. There are several issues with these resources. They are very mobilesometimes creating intellectual property loss. Like in many other businesses, the demandfor software services by private and public sector companies is uncertain and forecastingtechniques are used. Many software companies hire people in the expectation of a new business
496 N Viswanadham and Poornima Luthra
line or technology in the future. In some cases, such deals never come through and they areleft with an excess of employees on their payroll. This is similar to the “bull-whip” effectof the manufacturing industry. The industry also faces problems such as idle manpowerin between contracts, and high attrition rates. With expected continuation in wage hikes,companies could consider paying performance-based salaries to help reduce the wage costs. Inaddition, companies could employ their programmers on a contract-basis. This “on demand”style employment could help software companies deal with increased wage costs. In additionto this, companies need to increase their marketing spend and build lasting customer andemployee relationships to reduce the attrition rates and increase sales revenues.
5.3 Indian software companies
The Indian software industry is currently dominated by five major players: Tata ConsultancyServices, Wipro Technologies, Infosys Technologies Limited, Satyam Computer ServicesLimited and HCL Technologies Ltd. During our analysis, we found the need for Indian soft-ware companies to reduce their fixed assets, accounts receivable and operating expenditure.The largest components of fixed assets are machinery and furniture/ fixtures. Given the natureof the industry, companies should consider allowing staff to work from home. Doing thiswould reduce the office space required. To reduce accounts receivable, Indian software com-panies could reduce their order-to-cycle time by accelerating their payment schedules. Thetwo largest components of operating expenditure are travel and salaries. Companies shouldincrease the use of video conferencing and the internet to communicate with their clients.Employees can go to the customer-site during the integration stage of the project implemen-tation. This would help to lower the travelling expenditure.
Indian software companies need to reduce their cost of capital. In India, the cost of capitalis generally regarded to be in the 15–20% range (PricewaterhouseCoopers 1999), and in somecases, even higher. From the EVA model, Indian software companies have cost of capitalsin the range of 13% to 20%. In the US, on the other hand, the cost of capital is in the 8–12% range (PricewaterhouseCoopers 1999). Inflationary pressures, higher perceived businessrisk and market imperfections are sighted as the main reason for the higher cost of capital(PricewaterhouseCoopers 1999). While macroeconomic conditions and market imperfectionsare beyond the control of these companies, Indian software companies could try to enhancetheir business focus, improve investor perception, diversify to reduce revenue volatility, andensure that they comply with strict reporting norms that encourage corporate transparency aswell as increase their investor base. By filing for patents, Indian software companies can gainfinancial rewards through licensing and royalty revenues. This may change the fact of theircompany and pave the way for the industry in the future.
In addition, there is a need for innovation in software products. For some time now, therehave been no new products. Also, firms need to focus on knowledge management to helpimprove their efficiency and the speed at which they deliver results to their customers. Indiansoftware companies need to become more patent-savvy like their US counterparts. By creatinga new idea of doing something and filing for a patent, Indian software companies can not onlygain financial rewards through licensing and royalty revenues, but they can change the faceof their company, and pave the way for the industry in the future. By increasing the numberof patents to its name, a company proves to its clients that it has technological expertise, andthe company can use this to build confidence in its customers and increase its client-base.
Models for measuring and predicting shareholder value 497
5.4 Development of best practices
There is a growing need for the development of ‘best-practices’ for the Indian softwareindustry management. Such practices have been developed for manufacturing industries. In thesoftware area, software engineering focuses on the technical aspect of the business. There havebeen tremendous developments such as the capability maturity model, software developmenttools, communication platforms etc. What is needed is the development of managerial ‘best-practices’ for service industries. Right now the software industry is following the same patternas the auto industry of the sixties. Will the software industry follow the path of the heavyindustry? Only time will tell.
6. Conclusions
Our study is significant in extending the measurement of shareholder value using SPM andEVA to listed third party software providers. Reducing fixed assets, accounts receivables andoperating expenditure have been identified as areas that require attention by the companiesin this industry. However, these results are limited due to the data being restricted to pub-lished income statements and balance sheets. Future work should address the need for ‘best-practices’ for the industry. Currently Indian software service providers are choice partners forsoftware out sourcing. A frequently raised question about the future of Indian software indus-try is “how long the bullish trend is likely continue” with competition looming from severalcountries such as China. Global competitive analysis of the software industry or a SWOTanalysis of the Indian software industry may reveal strategies for continued predominance ofthe Indian software industry.
This study can be extended to various other sectors of the Indian economy including theIndian logistics industry and outsourcing industry, and to study the impact of new technologies(such as radio frequency identification, RFID) on shareholder value.
References
Albright C 2003Outsourcing for outsized gains(Marakon Assoc. Res.) www.marakon.com (seeWebsites)
Bogan C E, English M J 1994Benchmarking for best practices, winning through innovative adaption(McGraw-Hill)
Christopher M, Ryals L 1999 Supply chain strategy: Its impact on shareholder values.Int. J. Logistics.Manage.10: 2
Copeland T, Koller T, Murrin J 1994Valuation: Measuring and managing the value of companies2ndedn (John Wiley & Sons)
Harrington L 2000 Outsourcing boom ahead?Industry Week249(1): 51Jablonsky S F, Barsky N P 2001The manager’s guide to financial statement analysis2nd edn
(New York: John Wiley & Sons)Kaplan R S, Norton D P 1996Translating strategy into the balanced scorecard(Harvard: Business
School Press)Moncla B, Arents-Gregory M 2003Corporate performance management: Turning strategy into action:
Better Management.com.Niven P R 2003Balanced scorecard step-by-step for government and nonprofit agencies(New York:
John Wiley & Sons)Pellet J 2001Reinventing customer value. The Chief Executive, December
498 N Viswanadham and Poornima Luthra
PricewaterhouseCoopers 1999Cost of capital: Survey of issues and trends in IndiaLambert D M, Burduroglu R 2000 Measuring and selling the value of logistics.Int. J. Logistics
Manage.11(1): 1–17Stapleton D, Hanna J B, Johnson S Y, Johnson J, Markussen D 2002Measuring logistics performance
using the strategic profit model, Int. J. Logistics Manage.13(1): 89–107Stewart G B, Ellis M, Budington D 2002Stern Stewart’s EVA clients outperform the market and their
peers(Stern Stewart Research)Walters D 1999 The implications of shareholder value planning and management for logistics decision
making.Int. J. Phys. Distrib. Logistics Manage.29(4): 240–258Woelfel C J 1994Financial statement analysis(Chicago, IL: Probus)
Websites
A Technologies, www.A.comB Technologies Limited, www.B.comC Computer Services, www.C.comD Technologies Ltd, www.DBtems.comEmbassy of India, www.indianembassy.orgMarakon Associates Research, www.marakon.comNational Association of Software and Services Companies (NASSCOM), www.nasscom.orgStern Stewart & Co., www.sternstewart.com.Tata Consultancy Services, www.tcs.comUnderstanding balance sheets, www.ameritrade.com.Understanding income statements, www.ameritrade.com.