Modelling Time as a Circular Scale - Harvard University · Modelling Time as a Circular Scale...
68
Chronobiology Assessing a circular pattern Describing Circadian and Seasonal Patterns Modelling Stationary Circadian an Seasonal Patterns References Modelling Time as a Circular Scale Department of Epidemiology Miguel Angel Luque Fernandez, Bizu Gelaye, Tyler Vander Weele, Hernandez-Diaz S, Michelle A. Williams, Collaborators: Ananth C.V, Qui C, Sanchez S.E, Cynthia Ferre, Anna Maria Siega-Riz, Claudia Holzman, Daniel Enquobahrie, Nancy Dole January 29, 2014 HSPH-Department of Epidemiology Modelling Time as a Circular Scale
Transcript of Modelling Time as a Circular Scale - Harvard University · Modelling Time as a Circular Scale...
ChronobiologyAssessing a circular pattern
Describing Circadian and Seasonal PatternsModelling Stationary Circadian an Seasonal Patterns
References
Modelling Time as a Circular Scale
Department of EpidemiologyMiguel Angel Luque Fernandez,
Bizu Gelaye, Tyler Vander Weele, Hernandez-Diaz S, Michelle A. Williams,
Collaborators:Ananth C.V, Qui C, Sanchez S.E, Cynthia Ferre, Anna Maria Siega-Riz,
Claudia Holzman, Daniel Enquobahrie, Nancy Dole
January 29, 2014
HSPH-Department of Epidemiology Modelling Time as a Circular Scale

ChronobiologyAssessing a circular pattern
Describing Circadian and Seasonal PatternsModelling Stationary Circadian an Seasonal Patterns
References
Table of contents
1 ChronobiologyDefinitionTimeCircular Time: Sine and Cosine FunctionsCircular Time: Sine and Cosine Functions
2 Assessing a circular patternThe examples used in this presentation: Work in progressTime plotPeriodogram
3 Describing Circadian and Seasonal PatternsGrouping Data
4 Modelling Stationary Circadian an Seasonal PatternsGLMsCosionor ModelCubic Splines
5 References
HSPH-Department of Epidemiology Modelling Time as a Circular Scale

ChronobiologyAssessing a circular pattern
Describing Circadian and Seasonal PatternsModelling Stationary Circadian an Seasonal Patterns
References
1 Chronobiology: Circular Time andTrigonometric Functions
HSPH-Department of Epidemiology Modelling Time as a Circular Scale

ChronobiologyAssessing a circular pattern
Describing Circadian and Seasonal PatternsModelling Stationary Circadian an Seasonal Patterns
References
DefinitionTimeCircular Time: Sine and Cosine FunctionsCircular Time: Sine and Cosine Functions
Chronobiology Definition and Time
Definition
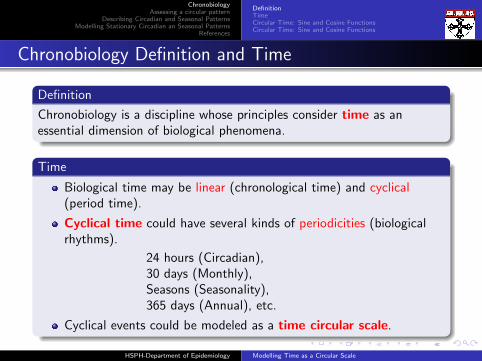
Chronobiology is a discipline whose principles consider time as anessential dimension of biological phenomena.
Time
Biological time may be linear (chronological time) and cyclical(period time).
Cyclical time could have several kinds of periodicities (biologicalrhythms).
24 hours (Circadian),30 days (Monthly),Seasons (Seasonality),365 days (Annual), etc.
Cyclical events could be modeled as a time circular scale.
HSPH-Department of Epidemiology Modelling Time as a Circular Scale

ChronobiologyAssessing a circular pattern
Describing Circadian and Seasonal PatternsModelling Stationary Circadian an Seasonal Patterns
References
DefinitionTimeCircular Time: Sine and Cosine FunctionsCircular Time: Sine and Cosine Functions
Chronobiology Definition and Time
Definition
Chronobiology is a discipline whose principles consider time as anessential dimension of biological phenomena.
Time
Biological time may be linear (chronological time) and cyclical(period time).
Cyclical time could have several kinds of periodicities (biologicalrhythms).
24 hours (Circadian),30 days (Monthly),Seasons (Seasonality),365 days (Annual), etc.
Cyclical events could be modeled as a time circular scale.
HSPH-Department of Epidemiology Modelling Time as a Circular Scale
ChronobiologyAssessing a circular pattern
Describing Circadian and Seasonal PatternsModelling Stationary Circadian an Seasonal Patterns
References
DefinitionTimeCircular Time: Sine and Cosine FunctionsCircular Time: Sine and Cosine Functions
Chronobiology Definition and Time
Definition
Chronobiology is a discipline whose principles consider time as anessential dimension of biological phenomena.
Time
Biological time may be linear (chronological time) and cyclical(period time).
Cyclical time could have several kinds of periodicities (biologicalrhythms).
24 hours (Circadian),
30 days (Monthly),Seasons (Seasonality),365 days (Annual), etc.
Cyclical events could be modeled as a time circular scale.
HSPH-Department of Epidemiology Modelling Time as a Circular Scale

ChronobiologyAssessing a circular pattern
Describing Circadian and Seasonal PatternsModelling Stationary Circadian an Seasonal Patterns
References
DefinitionTimeCircular Time: Sine and Cosine FunctionsCircular Time: Sine and Cosine Functions
Chronobiology Definition and Time
Definition
Chronobiology is a discipline whose principles consider time as anessential dimension of biological phenomena.
Time
Biological time may be linear (chronological time) and cyclical(period time).
Cyclical time could have several kinds of periodicities (biologicalrhythms).
24 hours (Circadian),30 days (Monthly),
Seasons (Seasonality),365 days (Annual), etc.
Cyclical events could be modeled as a time circular scale.
HSPH-Department of Epidemiology Modelling Time as a Circular Scale
ChronobiologyAssessing a circular pattern
Describing Circadian and Seasonal PatternsModelling Stationary Circadian an Seasonal Patterns
References
DefinitionTimeCircular Time: Sine and Cosine FunctionsCircular Time: Sine and Cosine Functions
Chronobiology Definition and Time
Definition
Chronobiology is a discipline whose principles consider time as anessential dimension of biological phenomena.
Time
Biological time may be linear (chronological time) and cyclical(period time).
Cyclical time could have several kinds of periodicities (biologicalrhythms).
24 hours (Circadian),30 days (Monthly),Seasons (Seasonality),
365 days (Annual), etc.
Cyclical events could be modeled as a time circular scale.
HSPH-Department of Epidemiology Modelling Time as a Circular Scale

ChronobiologyAssessing a circular pattern
Describing Circadian and Seasonal PatternsModelling Stationary Circadian an Seasonal Patterns
References
DefinitionTimeCircular Time: Sine and Cosine FunctionsCircular Time: Sine and Cosine Functions
Chronobiology Definition and Time
Definition
Chronobiology is a discipline whose principles consider time as anessential dimension of biological phenomena.
Time
Biological time may be linear (chronological time) and cyclical(period time).
Cyclical time could have several kinds of periodicities (biologicalrhythms).
24 hours (Circadian),30 days (Monthly),Seasons (Seasonality),365 days (Annual), etc.
Cyclical events could be modeled as a time circular scale.
HSPH-Department of Epidemiology Modelling Time as a Circular Scale

ChronobiologyAssessing a circular pattern
Describing Circadian and Seasonal PatternsModelling Stationary Circadian an Seasonal Patterns
References
DefinitionTimeCircular Time: Sine and Cosine FunctionsCircular Time: Sine and Cosine Functions
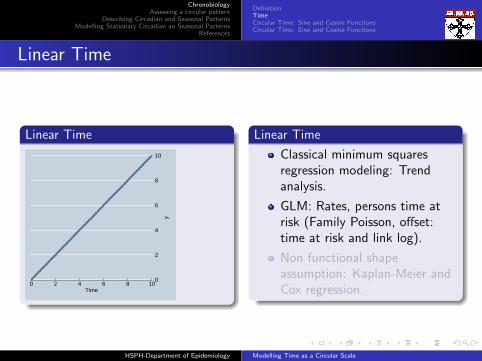
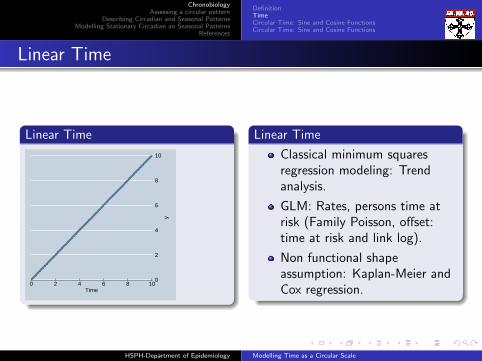
Linear Time
Linear Time
0
2
4
6
8
10
y
0 2 4 6 8 10Time
Linear Time
Classical minimum squaresregression modeling: Trendanalysis.
GLM: Rates, persons time atrisk (Family Poisson, offset:time at risk and link log).
Non functional shapeassumption: Kaplan-Meier andCox regression.
HSPH-Department of Epidemiology Modelling Time as a Circular Scale
ChronobiologyAssessing a circular pattern
Describing Circadian and Seasonal PatternsModelling Stationary Circadian an Seasonal Patterns
References
DefinitionTimeCircular Time: Sine and Cosine FunctionsCircular Time: Sine and Cosine Functions
Linear Time
Linear Time
0
2
4
6
8
10
y
0 2 4 6 8 10Time
Linear Time
Classical minimum squaresregression modeling: Trendanalysis.
GLM: Rates, persons time atrisk (Family Poisson, offset:time at risk and link log).
Non functional shapeassumption: Kaplan-Meier andCox regression.
HSPH-Department of Epidemiology Modelling Time as a Circular Scale
ChronobiologyAssessing a circular pattern
Describing Circadian and Seasonal PatternsModelling Stationary Circadian an Seasonal Patterns
References
DefinitionTimeCircular Time: Sine and Cosine FunctionsCircular Time: Sine and Cosine Functions
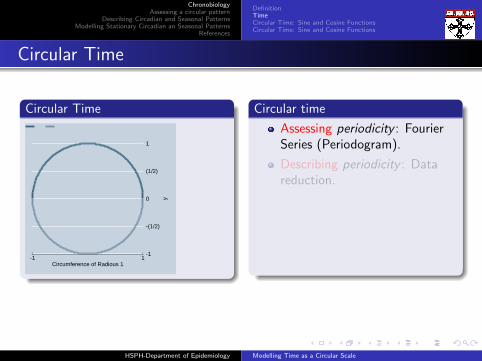
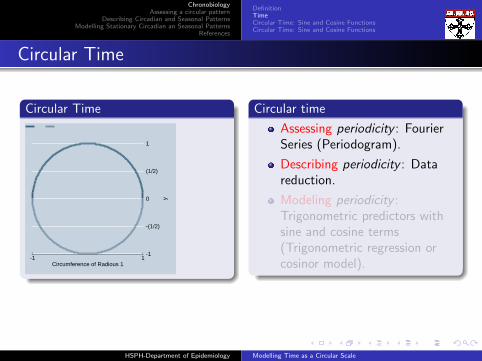
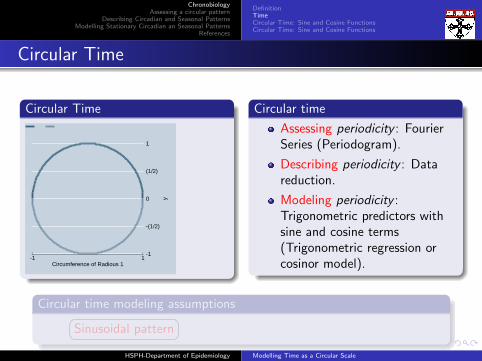
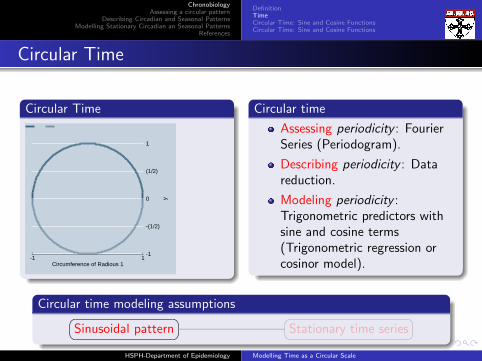
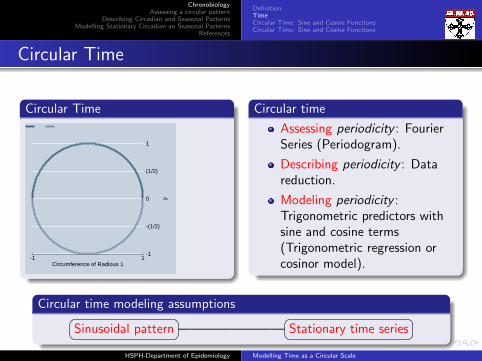
Circular Time
Circular Time
-1
0
1
-(1/2)
(1/2)y
-1 1Circumference of Radious 1
Circular time
Assessing periodicity : FourierSeries (Periodogram).
Describing periodicity : Datareduction.
Modeling periodicity :Trigonometric predictors withsine and cosine terms(Trigonometric regression orcosinor model).
Circular time modeling assumptions�� ��Sinusoidal pattern ————————�� ��Stationary time series
HSPH-Department of Epidemiology Modelling Time as a Circular Scale
ChronobiologyAssessing a circular pattern
Describing Circadian and Seasonal PatternsModelling Stationary Circadian an Seasonal Patterns
References
DefinitionTimeCircular Time: Sine and Cosine FunctionsCircular Time: Sine and Cosine Functions
Circular Time
Circular Time
-1
0
1
-(1/2)
(1/2)y
-1 1Circumference of Radious 1
Circular time
Assessing periodicity : FourierSeries (Periodogram).
Describing periodicity : Datareduction.
Modeling periodicity :Trigonometric predictors withsine and cosine terms(Trigonometric regression orcosinor model).
Circular time modeling assumptions�� ��Sinusoidal pattern
————————�� ��Stationary time series
HSPH-Department of Epidemiology Modelling Time as a Circular Scale
ChronobiologyAssessing a circular pattern
Describing Circadian and Seasonal PatternsModelling Stationary Circadian an Seasonal Patterns
References
DefinitionTimeCircular Time: Sine and Cosine FunctionsCircular Time: Sine and Cosine Functions
Circular Time
Circular Time
-1
0
1
-(1/2)
(1/2)y
-1 1Circumference of Radious 1
Circular time
Assessing periodicity : FourierSeries (Periodogram).
Describing periodicity : Datareduction.
Modeling periodicity :Trigonometric predictors withsine and cosine terms(Trigonometric regression orcosinor model).
Circular time modeling assumptions�� ��Sinusoidal pattern ————————�� ��Stationary time series
HSPH-Department of Epidemiology Modelling Time as a Circular Scale

ChronobiologyAssessing a circular pattern
Describing Circadian and Seasonal PatternsModelling Stationary Circadian an Seasonal Patterns
References
DefinitionTimeCircular Time: Sine and Cosine FunctionsCircular Time: Sine and Cosine Functions
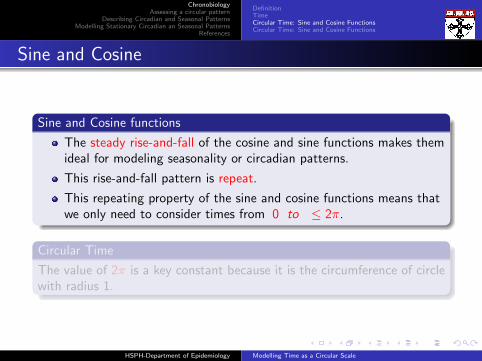
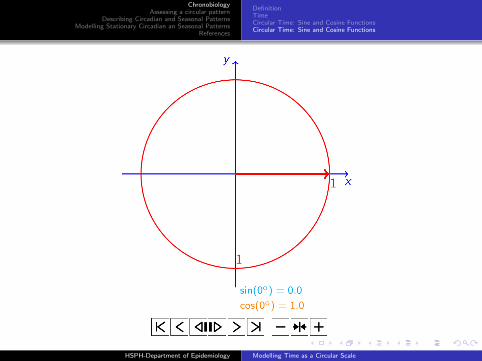
Sine and Cosine
Sine and Cosine functions
The steady rise-and-fall of the cosine and sine functions makes themideal for modeling seasonality or circadian patterns.
This rise-and-fall pattern is repeat.
This repeating property of the sine and cosine functions means thatwe only need to consider times from 0 to ≤ 2π.
Circular Time
The value of 2π is a key constant because it is the circumference of circlewith radius 1.
HSPH-Department of Epidemiology Modelling Time as a Circular Scale

ChronobiologyAssessing a circular pattern
Describing Circadian and Seasonal PatternsModelling Stationary Circadian an Seasonal Patterns
References
DefinitionTimeCircular Time: Sine and Cosine FunctionsCircular Time: Sine and Cosine Functions
Sine and Cosine
Sine and Cosine functions
The steady rise-and-fall of the cosine and sine functions makes themideal for modeling seasonality or circadian patterns.
This rise-and-fall pattern is repeat.
This repeating property of the sine and cosine functions means thatwe only need to consider times from 0 to ≤ 2π.
Circular Time
The value of 2π is a key constant because it is the circumference of circlewith radius 1.
HSPH-Department of Epidemiology Modelling Time as a Circular Scale
ChronobiologyAssessing a circular pattern
Describing Circadian and Seasonal PatternsModelling Stationary Circadian an Seasonal Patterns
References
DefinitionTimeCircular Time: Sine and Cosine FunctionsCircular Time: Sine and Cosine Functions
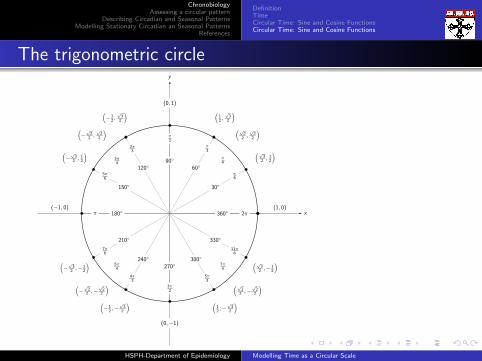
The trigonometric circle
x
y
0◦
30◦
60◦90◦
120◦
150◦
180◦
210◦
240◦
270◦300◦
330◦
360◦
π6
π4
π3
π2
2π3
3π4
5π6
π
7π6
5π4
4π3
3π2
5π3
7π4
11π6
2π
(√3
2 ,12
)(√
22 ,√
22
)(
12 ,√
32
)
(−√
32 ,
12
)(−√
22 ,√
22
)(− 1
2 ,√
32
)
(−√
32 ,−
12
)(−√
22 ,−
√2
2
)(− 1
2 ,−√
32
)
(√3
2 ,−12
)(√
22 ,−
√2
2
)(
12 ,−
√3
2
)
(−1, 0) (1, 0)
(0,−1)
(0, 1)
HSPH-Department of Epidemiology Modelling Time as a Circular Scale
ChronobiologyAssessing a circular pattern
Describing Circadian and Seasonal PatternsModelling Stationary Circadian an Seasonal Patterns
References
DefinitionTimeCircular Time: Sine and Cosine FunctionsCircular Time: Sine and Cosine Functions
HSPH-Department of Epidemiology Modelling Time as a Circular Scale

ChronobiologyAssessing a circular pattern
Describing Circadian and Seasonal PatternsModelling Stationary Circadian an Seasonal Patterns
References
DefinitionTimeCircular Time: Sine and Cosine FunctionsCircular Time: Sine and Cosine Functions
Circular Time
Trigonometric Functions
Link: Sum of Sine and Cosine
Together the cosine and sinefunctions can represent anypoint on the curve and thecircle.
They are called TrigonometricFunctions.
The rate of change in cos(x) isgiven by sin(x) and vice versa.ddx cos(x) = −sin(x)ddx sin(x) = cos(x)
Sum of Sine and Cosine functions
c©MA Luque-FernandezHSPH-Department of Epidemiology Modelling Time as a Circular Scale
ChronobiologyAssessing a circular pattern
Describing Circadian and Seasonal PatternsModelling Stationary Circadian an Seasonal Patterns
References
DefinitionTimeCircular Time: Sine and Cosine FunctionsCircular Time: Sine and Cosine Functions
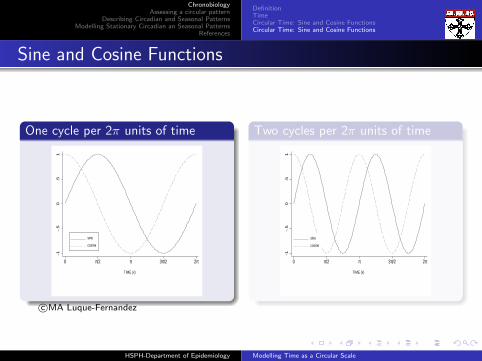
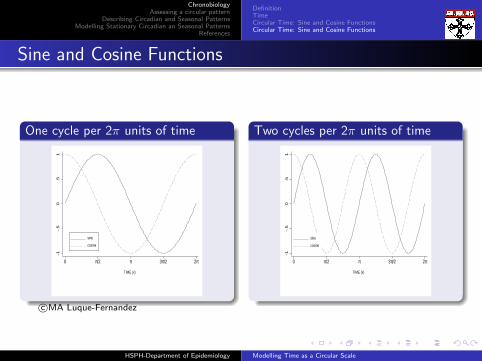
Sine and Cosine Functions
One cycle per 2π units of time
-1-.
50
.51
0 p/2 p 3p/2 2p
TIME (x)
sine
cosine
Two cycles per 2π units of time
-1-.
50
.51
0 p/2 p 3p/2 2p
TIME (x)
sine
cosine
c©MA Luque-Fernandez
HSPH-Department of Epidemiology Modelling Time as a Circular Scale
ChronobiologyAssessing a circular pattern
Describing Circadian and Seasonal PatternsModelling Stationary Circadian an Seasonal Patterns
References
DefinitionTimeCircular Time: Sine and Cosine FunctionsCircular Time: Sine and Cosine Functions
Sine and Cosine Functions
One cycle per 2π units of time
-1-.
50
.51
0 p/2 p 3p/2 2p
TIME (x)
sine
cosine
Two cycles per 2π units of time
-1-.
50
.51
0 p/2 p 3p/2 2p
TIME (x)
sine
cosine
c©MA Luque-Fernandez
HSPH-Department of Epidemiology Modelling Time as a Circular Scale

ChronobiologyAssessing a circular pattern
Describing Circadian and Seasonal PatternsModelling Stationary Circadian an Seasonal Patterns
References
DefinitionTimeCircular Time: Sine and Cosine FunctionsCircular Time: Sine and Cosine Functions
2 Assessing a circular pattern
HSPH-Department of Epidemiology Modelling Time as a Circular Scale

ChronobiologyAssessing a circular pattern
Describing Circadian and Seasonal PatternsModelling Stationary Circadian an Seasonal Patterns
References
DefinitionTimeCircular Time: Sine and Cosine FunctionsCircular Time: Sine and Cosine Functions
Table of contents
1 ChronobiologyDefinitionTimeCircular Time: Sine and Cosine FunctionsCircular Time: Sine and Cosine Functions
2 Assessing a circular patternThe examples used in this presentation: Work in progressTime plotPeriodogram
3 Describing Circadian and Seasonal PatternsGrouping Data
4 Modelling Stationary Circadian an Seasonal PatternsGLMsCosionor ModelCubic Splines
5 References
HSPH-Department of Epidemiology Modelling Time as a Circular Scale

ChronobiologyAssessing a circular pattern
Describing Circadian and Seasonal PatternsModelling Stationary Circadian an Seasonal Patterns
References
The examples used in this presentation: Work in progressTime plotPeriodogram
The examples used in this presentation: Work in progress
Modeling Vitamin D Serum Concentrations ina population of pregnant women.
Data were drawn from an observationalmulticentric nested case-control study of2,583 pregnant women using existingdata and banked serum samples in theUSA.Objective: To test the presence of aseasonal variation of 25OHD serumconcentrations.We model maternal individualmeasurements of 25OHD serumconcentrations (not repeat measurementwithin individuals).
Modeling the time of onset of PretermDelivery
Data were drawn from 476 women whodelivered live births at three Hospitals inLima, Peru, from January 2009 throughJuly 2010.Objective: To model the time of onset ofdelivery in a sample of women whodelivered a preterm infant.We model maternal self-reported time ofonset of delivery.
HSPH-Department of Epidemiology Modelling Time as a Circular Scale
ChronobiologyAssessing a circular pattern
Describing Circadian and Seasonal PatternsModelling Stationary Circadian an Seasonal Patterns
References
The examples used in this presentation: Work in progressTime plotPeriodogram
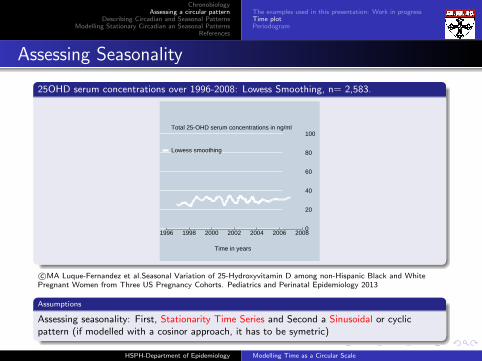
Assessing Seasonality
25OHD serum concentrations over 1996-2008: Lowess Smoothing, n= 2,583.
0
20
40
60
80
100
1996 1998 2000 2002 2004 2006 2008
Time in years
Total 25-OHD serum concentrations in ng/ml
Lowess smoothing
c©MA Luque-Fernandez et al.Seasonal Variation of 25-Hydroxyvitamin D among non-Hispanic Black and WhitePregnant Women from Three US Pregnancy Cohorts. Pediatrics and Perinatal Epidemiology 2013
Assumptions
Assessing seasonality: First, Stationarity Time Series and Second a Sinusoidal or cyclicpattern (if modelled with a cosinor approach, it has to be symetric)
HSPH-Department of Epidemiology Modelling Time as a Circular Scale
ChronobiologyAssessing a circular pattern
Describing Circadian and Seasonal PatternsModelling Stationary Circadian an Seasonal Patterns
References
The examples used in this presentation: Work in progressTime plotPeriodogram
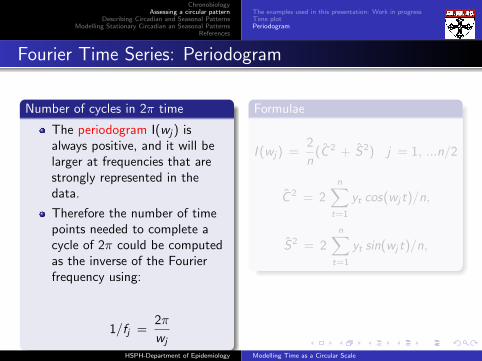
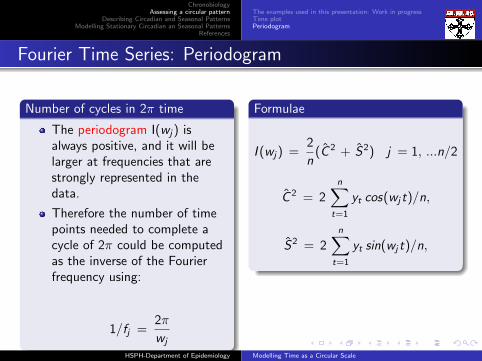
Fourier Time Series: Periodogram
Number of cycles in 2π time
The periodogram I(wj) isalways positive, and it will belarger at frequencies that arestrongly represented in thedata.
Therefore the number of timepoints needed to complete acycle of 2π could be computedas the inverse of the Fourierfrequency using:
1/fj =2π
wj
Formulae
I (wj) =2
n(C 2 + S2) j = 1, ...n/2
C 2 = 2n∑
t=1
yt cos(wj t)/n,
S2 = 2n∑
t=1
yt sin(wj t)/n,
HSPH-Department of Epidemiology Modelling Time as a Circular Scale
ChronobiologyAssessing a circular pattern
Describing Circadian and Seasonal PatternsModelling Stationary Circadian an Seasonal Patterns
References
The examples used in this presentation: Work in progressTime plotPeriodogram
Fourier Time Series: Periodogram
Number of cycles in 2π time
The periodogram I(wj) isalways positive, and it will belarger at frequencies that arestrongly represented in thedata.
Therefore the number of timepoints needed to complete acycle of 2π could be computedas the inverse of the Fourierfrequency using:
1/fj =2π
wj
Formulae
I (wj) =2
n(C 2 + S2) j = 1, ...n/2
C 2 = 2n∑
t=1
yt cos(wj t)/n,
S2 = 2n∑
t=1
yt sin(wj t)/n,
HSPH-Department of Epidemiology Modelling Time as a Circular Scale

ChronobiologyAssessing a circular pattern
Describing Circadian and Seasonal PatternsModelling Stationary Circadian an Seasonal Patterns
References
The examples used in this presentation: Work in progressTime plotPeriodogram
Example
Periodogram of 25OHD serum concentrations and highest frequency
0.083 Highest frequency: Annual cycle (12 months)
-6.0
0-4
.00
-2.0
00.
002.
004.
006.
00
Tot
al 2
5OH
D le
vel
Log
Per
iodo
gram
0.00 0.05 0.10 0.15 0.20 0.25 0.30 0.35 0.40 0.45 0.50
Frequency
Evaluated at the natural frequencies
c©MA Luque-Fernandez et al.Seasonal Variation of 25-Hydroxyvitamin D among non-Hispanic Black and White PregnantWomen from Three US Pregnancy Cohorts. Pediatrics and Perinatal Epidemiology 2013
HSPH-Department of Epidemiology Modelling Time as a Circular Scale

ChronobiologyAssessing a circular pattern
Describing Circadian and Seasonal PatternsModelling Stationary Circadian an Seasonal Patterns
References
The examples used in this presentation: Work in progressTime plotPeriodogram
3 Describing Circadian and SeasonalPatterns
HSPH-Department of Epidemiology Modelling Time as a Circular Scale

ChronobiologyAssessing a circular pattern
Describing Circadian and Seasonal PatternsModelling Stationary Circadian an Seasonal Patterns
References
The examples used in this presentation: Work in progressTime plotPeriodogram
Table of contents
1 ChronobiologyDefinitionTimeCircular Time: Sine and Cosine FunctionsCircular Time: Sine and Cosine Functions
2 Assessing a circular patternThe examples used in this presentation: Work in progressTime plotPeriodogram
3 Describing Circadian and Seasonal PatternsGrouping Data
4 Modelling Stationary Circadian an Seasonal PatternsGLMsCosionor ModelCubic Splines
5 References
HSPH-Department of Epidemiology Modelling Time as a Circular Scale

ChronobiologyAssessing a circular pattern
Describing Circadian and Seasonal PatternsModelling Stationary Circadian an Seasonal Patterns
References
Grouping Data
Data reduction
Data reduction is one ofthe simplest methods forinvestigating a circadian,seasonal or annualpattern.
A common method ofdata reduction is to groupthe data into 24 hours, 12months, seasons, etc.
Care needs to be takenwhen interpretingestimates, as theyrepresent the averagerates in each stratum.
Example:Circular Plot 25OHD serumconcentrations
Jan 28.7
Feb 27.9
Mar 24.6
Apr 27.5
May 27.9
Jun 30.8
Jul 32.5
Aug 33.3
Sep 31.0
Oct 30.1
Nov 29.6
Dec 27.3
c©MA Luque-Fernandez et al.Seasonal Variation of 25-Hydroxyvitamin D among non-HispanicBlack and White Pregnant Women from Three US Pregnancy Cohorts. Pediatrics and PerinatalEpidemiology 2013
HSPH-Department of Epidemiology Modelling Time as a Circular Scale
ChronobiologyAssessing a circular pattern
Describing Circadian and Seasonal PatternsModelling Stationary Circadian an Seasonal Patterns
References
Grouping Data
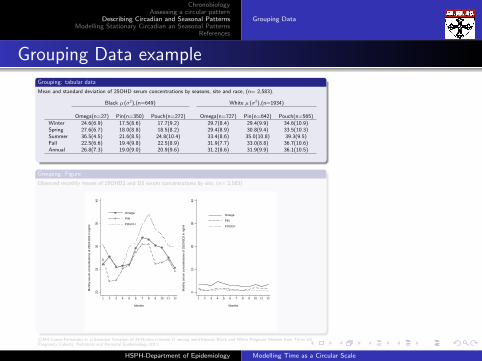
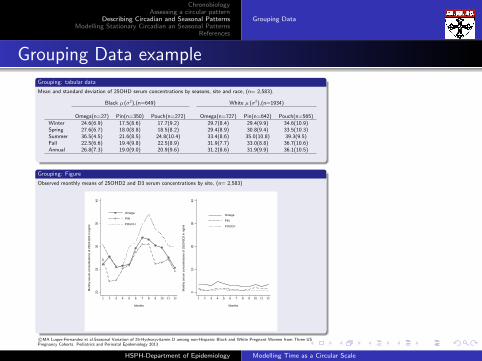
Grouping Data exampleGrouping: tabular data
Mean and standard deviation of 25OHD serum concentrations by seasons, site and race, (n= 2,583).
Black µ (σ2),(n=649) White µ (σ2),(n=1934)
Omega(n=27) Pin(n=350) Pouch(n=272) Omega(n=727) Pin(n=642) Pouch(n=565)
Winter 24.6(6.9) 17.5(8.6) 17.7(9.2) 29.7(8.4) 29.4(9.9) 34.6(10.9)Spring 27.6(6.7) 18.0(8.8) 18.5(8.2) 29.4(8.9) 30.8(9.4) 33.5(10.3)Summer 36.5(4.5) 21.6(8.5) 24.8(10.4) 33.4(8.6) 35.0(10.8) 39.3(9.5)Fall 22.5(6.6) 19.4(9.8) 22.5(8.9) 31.9(7.7) 33.0(8.8) 36.7(10.6)Annual 26.8(7.3) 19.0(9.0) 20.9(9.6) 31.2(8.6) 31.9(9.9) 36.1(10.5)
Grouping: Figure
Observed monthly means of 25OHD2 and D3 serum concentrations by site, (n= 2,583)
2025
3035
40
Mon
thy
seru
m c
once
ntra
tions
of 2
5(O
H)D
3 in
ng/
ml
1 2 3 4 5 6 7 8 9 10 11 12
Months
Omega
PIN
POUCH
010
2030
40
Mon
thy
seru
m c
once
ntra
tions
of 2
5(O
H)D
2 in
ng/
ml
1 2 3 4 5 6 7 8 9 10 11 12
Months
Omega
PIN
POUCH
c©MA Luque-Fernandez et al.Seasonal Variation of 25-Hydroxyvitamin D among non-Hispanic Black and White Pregnant Women from Three USPregnancy Cohorts. Pediatrics and Perinatal Epidemiology 2013
HSPH-Department of Epidemiology Modelling Time as a Circular Scale
ChronobiologyAssessing a circular pattern
Describing Circadian and Seasonal PatternsModelling Stationary Circadian an Seasonal Patterns
References
Grouping Data
Grouping Data exampleGrouping: tabular data
Mean and standard deviation of 25OHD serum concentrations by seasons, site and race, (n= 2,583).
Black µ (σ2),(n=649) White µ (σ2),(n=1934)
Omega(n=27) Pin(n=350) Pouch(n=272) Omega(n=727) Pin(n=642) Pouch(n=565)
Winter 24.6(6.9) 17.5(8.6) 17.7(9.2) 29.7(8.4) 29.4(9.9) 34.6(10.9)Spring 27.6(6.7) 18.0(8.8) 18.5(8.2) 29.4(8.9) 30.8(9.4) 33.5(10.3)Summer 36.5(4.5) 21.6(8.5) 24.8(10.4) 33.4(8.6) 35.0(10.8) 39.3(9.5)Fall 22.5(6.6) 19.4(9.8) 22.5(8.9) 31.9(7.7) 33.0(8.8) 36.7(10.6)Annual 26.8(7.3) 19.0(9.0) 20.9(9.6) 31.2(8.6) 31.9(9.9) 36.1(10.5)
Grouping: Figure
Observed monthly means of 25OHD2 and D3 serum concentrations by site, (n= 2,583)
2025
3035
40
Mon
thy
seru
m c
once
ntra
tions
of 2
5(O
H)D
3 in
ng/
ml
1 2 3 4 5 6 7 8 9 10 11 12
Months
Omega
PIN
POUCH
010
2030
40
Mon
thy
seru
m c
once
ntra
tions
of 2
5(O
H)D
2 in
ng/
ml
1 2 3 4 5 6 7 8 9 10 11 12
Months
Omega
PIN
POUCH
c©MA Luque-Fernandez et al.Seasonal Variation of 25-Hydroxyvitamin D among non-Hispanic Black and White Pregnant Women from Three USPregnancy Cohorts. Pediatrics and Perinatal Epidemiology 2013
HSPH-Department of Epidemiology Modelling Time as a Circular Scale

ChronobiologyAssessing a circular pattern
Describing Circadian and Seasonal PatternsModelling Stationary Circadian an Seasonal Patterns
References
Grouping Data
3 Modelling Stationary Circadian anSeasonal Patterns
HSPH-Department of Epidemiology Modelling Time as a Circular Scale

ChronobiologyAssessing a circular pattern
Describing Circadian and Seasonal PatternsModelling Stationary Circadian an Seasonal Patterns
References
Grouping Data
Table of contents
1 ChronobiologyDefinitionTimeCircular Time: Sine and Cosine FunctionsCircular Time: Sine and Cosine Functions
2 Assessing a circular patternThe examples used in this presentation: Work in progressTime plotPeriodogram
3 Describing Circadian and Seasonal PatternsGrouping Data
4 Modelling Stationary Circadian an Seasonal PatternsGLMsCosionor ModelCubic Splines
5 References
HSPH-Department of Epidemiology Modelling Time as a Circular Scale
ChronobiologyAssessing a circular pattern
Describing Circadian and Seasonal PatternsModelling Stationary Circadian an Seasonal Patterns
References
GLMsCosionor ModelCubic Splines
Generalized Linear Models
GLM specification
yi = β0 + β1 xi where E (y) = µ and µ = Xβ
yi ∼ N(µi , σ2i )
GLM
Time (months) is fitted as a categorical independent variable (xi ).
Usually we will use a Gaussian or a Poisson family with a link log.
A disadvantage is that it assumes complete independence betweenmonths.
For many seasonal patterns this is unlikely to be true, as neighboring unitof time (months) are likely to be positively correlated.
Although we can use Generalized Linear Mixed Models or a randomintercept model.
HSPH-Department of Epidemiology Modelling Time as a Circular Scale

ChronobiologyAssessing a circular pattern
Describing Circadian and Seasonal PatternsModelling Stationary Circadian an Seasonal Patterns
References
GLMsCosionor ModelCubic Splines
GLM Example
Observed monthly means, standard deviation and differences of 25OHD serum concentrations, (n= 2,583).
Number 25(OH)D 25(OH)D Absolute Relative differenceMonth of women tested Mean Std. Dev. difference and 95%CI in percentage (%)January 221 29.6 11.0 Ref. Ref.February 202 26.9 11.5 -2.68[(-4.83) to (-0.54)] -9.1March 233 25.5 10.8 -4.17[(-6.17) to (-2.16)] -14.1April 270 27.5 11.1 -2.11[(-4.07) to (-0.14)] -7.1May 241 28.8 10.7 -0.80[(-2.79) to 1.18] -2.7June 207 30.8 11.3 1.14 [(-0.97) to 3.25] 3.9July 191 33.6 10.9 4.01 (1.89 to 6.13) 13.5August 215 34.4 11.1 4.76 (2.68 to 6.84) 16.1September 197 31.0 10.2 1.40 [(-0.63) to 3.44] 4.7October 232 31.1 11.3 1.49 [(-0.57) to 3.54] 5.0November 202 29.6 10.4 -0.04[(-2.08) to 1.99] -0.1December 172 28.2 11.0 -1.41[(-3.60) to 0.77] -4.8
Figure. Observed monthly means of 25OHD serum concentrations, (n= 2,583)
0
10
20
30
40
25O
HD
mea
n co
ncen
trat
ion
in n
g/m
g
1 2 3 4 5 6 7 8 9 10 11 12
c©MA Luque-Fernandez et al. Seasonal Variation of 25-Hydroxyvitamin D among non-Hispanic Black and White Pregnant Women from Three US PregnancyCohorts. Pediatrics and Perinatal Epidemiology 2013
HSPH-Department of Epidemiology Modelling Time as a Circular Scale
ChronobiologyAssessing a circular pattern
Describing Circadian and Seasonal PatternsModelling Stationary Circadian an Seasonal Patterns
References
GLMsCosionor ModelCubic Splines
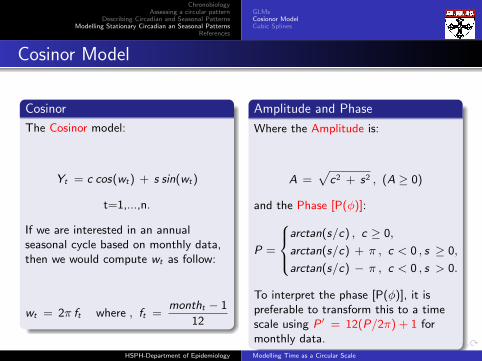
Cosinor Model
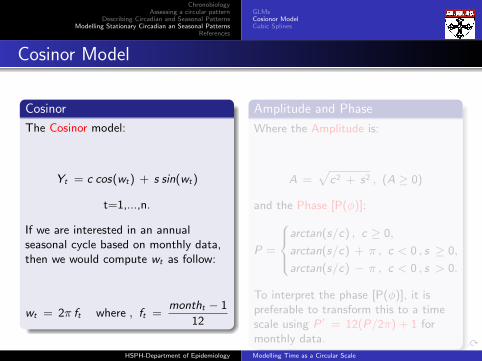
Cosinor
The Cosinor model:
Yt = c cos(wt) + s sin(wt)
t=1,...,n.
If we are interested in an annualseasonal cycle based on monthly data,then we would compute wt as follow:
wt = 2π ft where , ft =montht − 1
12
Amplitude and Phase
Where the Amplitude is:
A =√
c2 + s2 , (A ≥ 0)
and the Phase [P(φ)]:
P =
arctan(s/c) , c ≥ 0,
arctan(s/c) + π , c < 0 , s ≥ 0,
arctan(s/c) − π , c < 0 , s > 0.
To interpret the phase [P(φ)], it ispreferable to transform this to a timescale using P ′ = 12(P/2π) + 1 formonthly data.
HSPH-Department of Epidemiology Modelling Time as a Circular Scale
ChronobiologyAssessing a circular pattern
Describing Circadian and Seasonal PatternsModelling Stationary Circadian an Seasonal Patterns
References
GLMsCosionor ModelCubic Splines
Cosinor Model
Cosinor
The Cosinor model:
Yt = c cos(wt) + s sin(wt)
t=1,...,n.
If we are interested in an annualseasonal cycle based on monthly data,then we would compute wt as follow:
wt = 2π ft where , ft =montht − 1
12
Amplitude and Phase
Where the Amplitude is:
A =√
c2 + s2 , (A ≥ 0)
and the Phase [P(φ)]:
P =
arctan(s/c) , c ≥ 0,
arctan(s/c) + π , c < 0 , s ≥ 0,
arctan(s/c) − π , c < 0 , s > 0.
To interpret the phase [P(φ)], it ispreferable to transform this to a timescale using P ′ = 12(P/2π) + 1 formonthly data.
HSPH-Department of Epidemiology Modelling Time as a Circular Scale

ChronobiologyAssessing a circular pattern
Describing Circadian and Seasonal PatternsModelling Stationary Circadian an Seasonal Patterns
References
GLMsCosionor ModelCubic Splines
Cosinor Modelling Example
Fitted Means: Univariate example
Modelled distribution of 25OHD serum concentrations, n=2,583
m=29.6; 95%CI(28.2-31.1)
f=8 months
Amplitude=4.22; 95%CI(3.3-5.1)
2628
3032
34S
erum
con
cent
ratio
n 25
(OH
)D fi
tted
valu
es in
ng/
ml
1 2 3 4 5 6 7 8 9 10 11 12
Months
c©MA Luque-Fernandez et al. Seasonal Variation of 25-Hydroxyvitamin D among non-Hispanic Black and White Pregnant Womenfrom Three US Pregnancy Cohorts. Pediatrics and Perinatal Epidemiology 2013
HSPH-Department of Epidemiology Modelling Time as a Circular Scale
ChronobiologyAssessing a circular pattern
Describing Circadian and Seasonal PatternsModelling Stationary Circadian an Seasonal Patterns
References
GLMsCosionor ModelCubic Splines
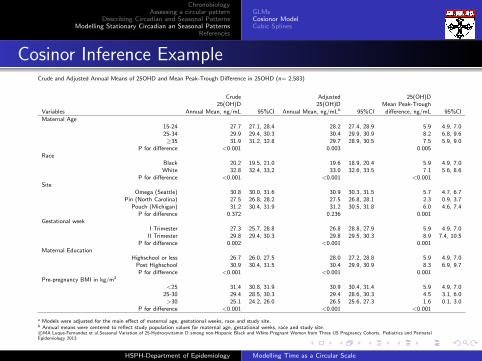
Cosinor Inference ExampleCrude and Adjusted Annual Means of 25OHD and Mean Peak-Trough Difference in 25OHD (n= 2,583)
Crude Adjusted 25(OH)D25(OH)D 25(OH)D Mean Peak-Trough
Variables Annual Mean, ng/mL 95%CI Annual Mean, ng/mLb 95%CI difference, ng/mL 95%CI
Maternal Age15-24 27.7 27.1, 28.4 28.2 27.4, 28.9 5.9 4.9, 7.025-34 29.9 29.4, 30.3 30.4 29.9, 30.9 8.2 6.8, 9.6≥35 31.9 31.2, 32.8 29.7 28.9, 30.5 7.5 5.9, 9.0
P for difference <0.001 0.003 0.005Race
Black 20.2 19.5, 21.0 19.6 18.9, 20.4 5.9 4.9, 7.0White 32.8 32.4, 33,2 33.0 32.6, 33.5 7.1 5.6, 8.6
P for difference <0.001 <0.001 <0.001Site
Omega (Seattle) 30.8 30.0, 31.6 30.9 30.3, 31.5 5.7 4.7, 6.7Pin (North Carolina) 27.5 26.8, 28.2 27.5 26.8, 28.1 2.3 0.9, 3.7
Pouch (Michigan) 31.2 30.4, 31.9 31.2 30.5, 31.8 6.0 4.6, 7.4P for difference 0.372 0.236 0.001
Gestational weekI Trimester 27.3 25.7, 28.8 26.8 28.8, 27.9 5.9 4.9, 7.0
II Trimester 29.8 29.4, 30.3 29.8 29.5, 30.3 8.9 7.4, 10.5P for difference 0.002 <0.001 0.001
Maternal EducationHighschool or less 26.7 26.0, 27.5 28.0 27.2, 28.8 5.9 4.9, 7.0
Post Highschool 30.9 30.4, 31.5 30.4 29.9, 30.9 8.3 6.9, 9.7P for difference <0.001 <0.001 0.001
Pre-pregnancy BMI in kg/m2
<25 31.4 30.8, 31.9 30.9 30.4, 31.4 5.9 4.9, 7.025-30 29.4 28.5, 30.3 29.4 28.6, 30.3 4.5 3.1, 6.0>30 25.1 24.2, 26.0 26.5 25.6, 27.3 1.6 0.1, 3.0
P for difference <0.001 <0.001 <0.001
a Models were adjusted for the main effect of maternal age, gestational weeks, race and study site.b Annual means were centered to reflect study population values for maternal age, gestational weeks, race and study site.c©MA Luque-Fernandez et al.Seasonal Variation of 25-Hydroxyvitamin D among non-Hispanic Black and White Pregnant Women from Three US Pregnancy Cohorts. Pediatrics and Perinatal
Epidemiology 2013
HSPH-Department of Epidemiology Modelling Time as a Circular Scale
ChronobiologyAssessing a circular pattern
Describing Circadian and Seasonal PatternsModelling Stationary Circadian an Seasonal Patterns
References
GLMsCosionor ModelCubic Splines
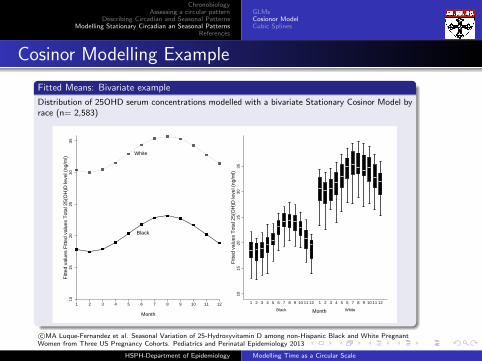
Cosinor Modelling Example
Fitted Means: Bivariate example
Distribution of 25OHD serum concentrations modelled with a bivariate Stationary Cosinor Model byrace (n= 2,583)
White
Black
1015
2025
3035
Fitt
ed v
alue
s F
itted
val
ues
Tot
al 2
5(O
H)D
leve
l (ng
/ml)
1 2 3 4 5 6 7 8 9 10 11 12
Month
1015
2025
3035
Fitt
ed v
alue
s T
otal
25(
OH
)D le
vel (
ng/m
l)
Black White
1 2 3 4 5 6 7 8 9 10 11 12 1 2 3 4 5 6 7 8 9 10 11 12
Month
c©MA Luque-Fernandez et al. Seasonal Variation of 25-Hydroxyvitamin D among non-Hispanic Black and White PregnantWomen from Three US Pregnancy Cohorts. Pediatrics and Perinatal Epidemiology 2013
HSPH-Department of Epidemiology Modelling Time as a Circular Scale

ChronobiologyAssessing a circular pattern
Describing Circadian and Seasonal PatternsModelling Stationary Circadian an Seasonal Patterns
References
GLMsCosionor ModelCubic Splines
Cubic Splines
A cubic spline function with K knots is given by:
f (x) =3∑
j=0
β0jxj +
k∑l=1
βi (x − tl)3 +,
where tl , l = 1, ..., k are the k knots. And x is related with the outcome as:
yi = f (xi ) + εi
HSPH-Department of Epidemiology Modelling Time as a Circular Scale

ChronobiologyAssessing a circular pattern
Describing Circadian and Seasonal PatternsModelling Stationary Circadian an Seasonal Patterns
References
GLMsCosionor ModelCubic Splines
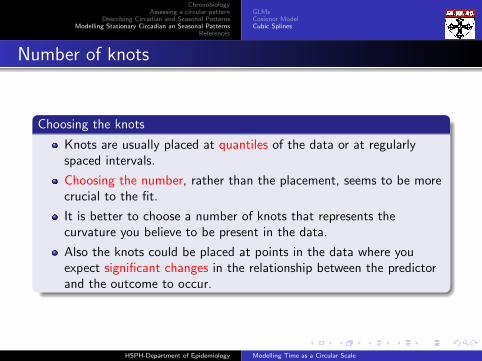
Number of knots
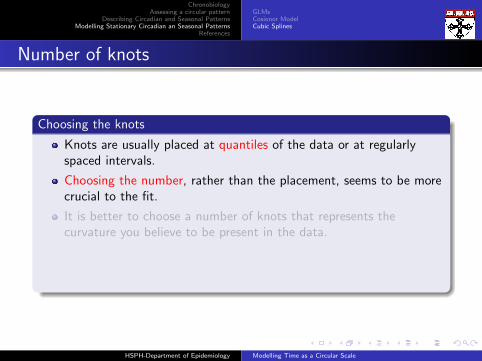
Choosing the knots
Knots are usually placed at quantiles of the data or at regularlyspaced intervals.
Choosing the number, rather than the placement, seems to be morecrucial to the fit.
It is better to choose a number of knots that represents thecurvature you believe to be present in the data.
Also the knots could be placed at points in the data where youexpect significant changes in the relationship between the predictorand the outcome to occur.
HSPH-Department of Epidemiology Modelling Time as a Circular Scale
ChronobiologyAssessing a circular pattern
Describing Circadian and Seasonal PatternsModelling Stationary Circadian an Seasonal Patterns
References
GLMsCosionor ModelCubic Splines
Number of knots
Choosing the knots
Knots are usually placed at quantiles of the data or at regularlyspaced intervals.
Choosing the number, rather than the placement, seems to be morecrucial to the fit.
It is better to choose a number of knots that represents thecurvature you believe to be present in the data.
Also the knots could be placed at points in the data where youexpect significant changes in the relationship between the predictorand the outcome to occur.
HSPH-Department of Epidemiology Modelling Time as a Circular Scale
ChronobiologyAssessing a circular pattern
Describing Circadian and Seasonal PatternsModelling Stationary Circadian an Seasonal Patterns
References
GLMsCosionor ModelCubic Splines
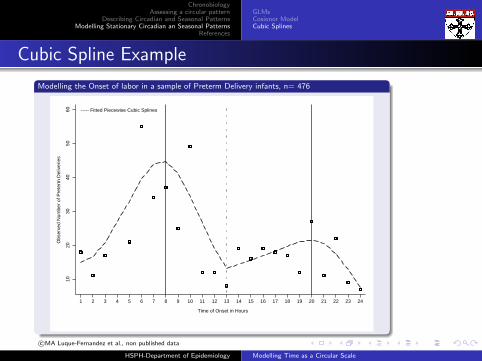
Cubic Spline Example
Modelling the Onset of labor in a sample of Preterm Delivery infants, n= 476
----- Fitted Piecewise Cubic Splines
1020
3040
5060
Obs
erve
d N
umbe
r of
Pre
term
Del
iver
ies
1 2 3 4 5 6 7 8 9 10 11 12 13 14 15 16 17 18 19 20 21 22 23 24
Time of Onset in Hours
c©MA Luque-Fernandez et al., non published data
HSPH-Department of Epidemiology Modelling Time as a Circular Scale
ChronobiologyAssessing a circular pattern
Describing Circadian and Seasonal PatternsModelling Stationary Circadian an Seasonal Patterns
References
References
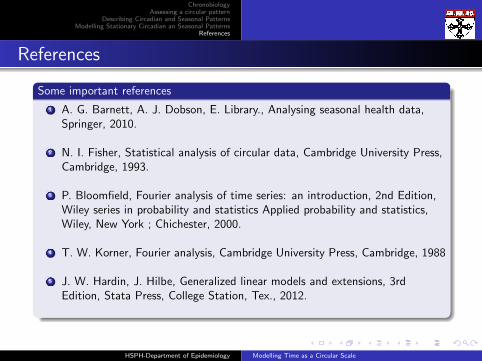
Some important references
1 A. G. Barnett, A. J. Dobson, E. Library., Analysing seasonal health data,Springer, 2010.
2 N. I. Fisher, Statistical analysis of circular data, Cambridge University Press,Cambridge, 1993.
3 P. Bloomfield, Fourier analysis of time series: an introduction, 2nd Edition,Wiley series in probability and statistics Applied probability and statistics,Wiley, New York ; Chichester, 2000.
4 T. W. Korner, Fourier analysis, Cambridge University Press, Cambridge, 1988
5 J. W. Hardin, J. Hilbe, Generalized linear models and extensions, 3rdEdition, Stata Press, College Station, Tex., 2012.
HSPH-Department of Epidemiology Modelling Time as a Circular Scale