Modelling the Kinetic of Biogas Production from Co …€” This work investigated the use of...
8
Abstract— This work investigated the use of laboratory batch anaerobic digester to derive kinetics parameters for anaerobic co-digestion of pig waste and grass clippings. Laboratory experiment data from 10 litres batch anaerobic digester operating at ambient mesophilic temperature of 37 0 C and pH of 6.9 was used to derive parameters for modified Gompertz model. The carbon/nitrogen (C/N) ratio of Pig waste was found to be 16.16 and grass clippings to be 20.54. Through co- digestion in ratio of 1:1, the C/N ratio settled at 17.28. The actual biogas yield was found to be 7725 ml/g COD. In the model of biogas production prediction, the kinetics constants of A (ml/g COD), μ (ml/g COD. day), λ (day) was 7920.70, 701.35, 1.61 respectively with coefficient of determination (R 2 ) of 0.9994. Modified Gompertz plot showed better correlation of cumulative biogas production and these results show biogas production can be enhanced from co-digestion of substrates. Keywords— Anaerobic, Co-digestion, Kinetics, Mesophilic Temperature, Modified Gompertz I. INTRODUCTION HE energy consumption worldwide is spontaneously increasing due to industrialization, population growth and state of development in both developing and developed countries. The need for alternative sources of Manuscript received April 13, 2016; revised April 19, 2016. This work was supported in part by University of Johannesburg, Process Energy Environmental station (PEETS) and City of Johannesburg South Africa. Anthony Njuguna Matheri; is with Department of Chemical Engineering; University of Johannesburg; Doornfortein, Johannesburg 2028 South Africa; Cell: +27616986335 ([email protected]) Mohamed Belaid; Senior lecturer and HOD at Department of Chemical Engineering; University of Johannesburg; Doornfortein, Johannesburg 2028 South Africa; Tel: +27115596402 ([email protected]) Tumisang Seodigeng; Senior lecturer at Department of Chemical Engineering; Vaal University of Technology; Private Bag X021- Vanderbijilpark-1911, Andries Potgieter Blvd South Africa; Tel: +27169509734 ([email protected]) Catherine Jane Ngila; Professor and HOD at Department of Analytical Chemistry; University of Johannesburg; P.O. Box 17011, Doornfortein, Johannesburg 2028 South Africa; Tel: 27115596169 ([email protected]) energy for centralized and decentralized power generation has led to researchers looking for alternative source of renewable energy. With the fast depletion of non-renewable energy sources such as fossil fuel, coal and petroleum which has led to global climate change, human health problems and environmental degradation. The commercial production of biogas and other alternative energy source such as solar energy, wind energy, hydropower, geothermal will definitely give a drive for the development of the economy. Energy derived from biogas is used in the form of fuel, heat and electricity. It is desirable to create sustainable and with zero carbon emissions world-wide energy system [1, 2]. Biogas is a renewable source of energy derived from biodegradable substrates such as agricultural wastes, animal wastes, domestic wastes, crops and industrial waste. It is produced by anaerobic digestion, which is a biochemical process in absence of oxygen. The main product of biogas is methane and carbon dioxide [3, 4]. II. BIOCHEMICAL PROCESS OF ANAEROBIC DIGESTION Biogas production follows four fundamentals processes. These processes include; hydrolysis, acidogenesis, acetogenesis and methanogenesis [5]. Fig. 1 shows a simplified generic anaerobic digestion process [6]. The anaerobic system is as the result of complex interactions among different of bacteria. The major functional groups of bacteria according to their metabolic reactions are [7]: Fermentative bacteria, hydrogen‐producing acetogenic bacteria, hydrogen‐consuming acetogenic bacteria, carbon dioxide reducing methanogens and aceticlastic methanogens. A.Hydrolysis Organic waste used in anaerobic digestion are originally made up of large carbon molecules called biomass. In the first stage of the AD process, they are hydrolyzed into smaller soluble molecules [8]. The products from this stage are normally monosaccharaides from carbohydrates, amino acids from proteins, and long-fatty acids and glycerine from lipids. Hydrolysis is mediated by extracellular enzymes produced by fermentative bacteria including cellulases, Modelling the Kinetic of Biogas Production from Co-digestion of Pig Waste and Grass Clippings Anthony Njuguna Matheri 1 , Member, IAENG, Mohamed Belaid 2 , Member, IAENG, Tumisang Seodigeng 3 , Catherine Jane Ngila 4 T Proceedings of the World Congress on Engineering 2016 Vol II WCE 2016, June 29 - July 1, 2016, London, U.K. ISBN: 978-988-14048-0-0 ISSN: 2078-0958 (Print); ISSN: 2078-0966 (Online) WCE 2016
-
Upload
nguyencong -
Category
Documents
-
view
212 -
download
0
Transcript of Modelling the Kinetic of Biogas Production from Co …€” This work investigated the use of...
Abstract— This work investigated the use of laboratory batch
anaerobic digester to derive kinetics parameters for anaerobic
co-digestion of pig waste and grass clippings. Laboratory
experiment data from 10 litres batch anaerobic digester
operating at ambient mesophilic temperature of 37 0C and pH
of 6.9 was used to derive parameters for modified Gompertz
model. The carbon/nitrogen (C/N) ratio of Pig waste was found
to be 16.16 and grass clippings to be 20.54. Through co-
digestion in ratio of 1:1, the C/N ratio settled at 17.28. The
actual biogas yield was found to be 7725 ml/g COD. In the
model of biogas production prediction, the kinetics constants of
A (ml/g COD), μ (ml/g COD. day), λ (day) was 7920.70, 701.35,
1.61 respectively with coefficient of determination (R2) of
0.9994. Modified Gompertz plot showed better correlation of
cumulative biogas production and these results show biogas
production can be enhanced from co-digestion of substrates.
Keywords— Anaerobic, Co-digestion, Kinetics, Mesophilic
Temperature, Modified Gompertz
I. INTRODUCTION
HE energy consumption worldwide is spontaneously
increasing due to industrialization, population growth
and state of development in both developing and
developed countries. The need for alternative sources of
Manuscript received April 13, 2016; revised April 19, 2016. This work
was supported in part by University of Johannesburg, Process Energy
Environmental station (PEETS) and City of Johannesburg South Africa.
Anthony Njuguna Matheri; is with Department of Chemical
Engineering; University of Johannesburg; Doornfortein, Johannesburg
2028 South Africa; Cell: +27616986335 ([email protected])
Mohamed Belaid; Senior lecturer and HOD at Department of Chemical
Engineering; University of Johannesburg; Doornfortein, Johannesburg
2028 South Africa; Tel: +27115596402 ([email protected])
Tumisang Seodigeng; Senior lecturer at Department of Chemical
Engineering; Vaal University of Technology; Private Bag X021-
Vanderbijilpark-1911, Andries Potgieter Blvd South Africa; Tel:
+27169509734 ([email protected])
Catherine Jane Ngila; Professor and HOD at Department of Analytical
Chemistry; University of Johannesburg; P.O. Box 17011, Doornfortein,
Johannesburg 2028 South Africa; Tel: 27115596169 ([email protected])
energy for centralized and decentralized power generation
has led to researchers looking for alternative source of
renewable energy.
With the fast depletion of non-renewable energy sources
such as fossil fuel, coal and petroleum which has led to
global climate change, human health problems and
environmental degradation. The commercial production of
biogas and other alternative energy source such as solar
energy, wind energy, hydropower, geothermal will
definitely give a drive for the development of the economy.
Energy derived from biogas is used in the form of fuel, heat
and electricity. It is desirable to create sustainable and with
zero carbon emissions world-wide energy system [1, 2].
Biogas is a renewable source of energy derived from
biodegradable substrates such as agricultural wastes, animal
wastes, domestic wastes, crops and industrial waste. It is
produced by anaerobic digestion, which is a biochemical
process in absence of oxygen. The main product of biogas is
methane and carbon dioxide [3, 4].
II. BIOCHEMICAL PROCESS OF ANAEROBIC DIGESTION
Biogas production follows four fundamentals processes.
These processes include; hydrolysis, acidogenesis,
acetogenesis and methanogenesis [5]. Fig. 1 shows a
simplified generic anaerobic digestion process [6].
The anaerobic system is as the result of complex
interactions among different of bacteria. The major
functional groups of bacteria according to their metabolic
reactions are [7]: Fermentative bacteria,
hydrogen‐producing acetogenic bacteria,
hydrogen‐consuming acetogenic bacteria, carbon dioxide
reducing methanogens and aceticlastic methanogens.
A. Hydrolysis
Organic waste used in anaerobic digestion are originally
made up of large carbon molecules called biomass. In the
first stage of the AD process, they are hydrolyzed into
smaller soluble molecules [8]. The products from this stage
are normally monosaccharaides from carbohydrates, amino
acids from proteins, and long-fatty acids and glycerine from
lipids. Hydrolysis is mediated by extracellular enzymes
produced by fermentative bacteria including cellulases,
Modelling the Kinetic of Biogas Production
from Co-digestion of Pig Waste and Grass
Clippings
Anthony Njuguna Matheri1, Member, IAENG, Mohamed Belaid2, Member, IAENG, Tumisang
Seodigeng3, Catherine Jane Ngila4
T
Proceedings of the World Congress on Engineering 2016 Vol II WCE 2016, June 29 - July 1, 2016, London, U.K.
ISBN: 978-988-14048-0-0 ISSN: 2078-0958 (Print); ISSN: 2078-0966 (Online)
WCE 2016

amylases, proteases, lipases and protease [9]. This process is
reported to be a rate-limiting stage in anaerobic digestion
while its inhibition is dependent on the type of substrates
used during the process and temperature of the digester [9].
Lipids
Monosaccharides Amino Acids LCFA
Carbohydrates Protein
Acetate Hydrogen and Carbon dioxide
Electron Sinks e.g. Lactate, Ethanol, Butyrate and Propionate
Methane and Carbon dioxide
Methanogenesis
Disintegration
Hydrolysis
Acidogenesis
Acetogenesis
Biomass
Fig.1. Degradation steps of anaerobic digestion process.
B. Acidogenesis
Acidogenesis, also known as acid formation stage, is the
second step of anaerobic digestion. It is usually the fastest
reaction in the overall anaerobic digestion process [10]. This
process involves further breaking down of the simple
molecules created through hydrolysis to a mixture of
organic acid (lactate, butyrate, ethanol and propionate),
hydrogen and carbon dioxide. The bacteria responsible for
this stage are called acidogenesis (fermentative) bacteria or
hydrogen‐producing acetogenic bacteria. Apparently, the
main product of this process is depended on the anaerobic
microbial species present, and culture conditions. At low
partial pressure of hydrogen, acetate and /or hydrogen
dominate the product, while at high partial pressure of
hydrogen; ethanol or organic acid is produced [11, 12].
Since acidogenesis bacteria are strictly anaerobic, thus
obligate and facultative such as Peptococcus anaerobes,
Clostridium ssp, and Lactobacillus and Escherichia coli are
involved for the removal of oxygen, whenever available
[13]. During acidogenesis, an acidic environment in the
digester is created due to the generation of ammonia, H2,
CO2, H2S, shorter volatile fatty acids, carbonic acids,
alcohols, as well as trace amounts of other by-products [14].
The volatile fatty acid concentration accumulated in the
digester have a significant impact in the overall performance
of the process, since acetic and butyric acids are the
preferred precursor for methane formation [15].
C. Acetogenesis
In the third stage, the products from acidogenesis are
completely converted to acetate, hydrogen and carbon
dioxide by group of bacteria know as hydrogen‐consuming
acetogenic bacteria or acetogenic bacteria [16]. The entire
products from this stage are used up for methane
production. During this process, 17% of the energy is
converted to acetic acid and 13% to hydrogen [10]. Table 1
shows the reactions and free energy changes of lactate,
ethanol, butyrate, propionate, methanol, hydrogen‐CO2 and
Palmitate during acetogenesis.
Acetogenic organisms are the connection between
hydrolysis/acidogenesis and methanogenesis [16].
Acetogenesis is regarded as the most important stage, as it
produces the main substrate for the last stage which are
hydrogen, carbon dioxide and acetate. Tesfaye [15] reported
that methanogenic bacteria are unable to process any
substrate other than acetate, carbon dioxide and hydrogen.
Thus, the performance of this stage is depended on the
hydrogen partial pressure. If the hydrogen partial pressure is
kept below 10-3 atm, hydrogen, acetate and carbon dioxide
dominate the product, but if the hydrogen partial pressure is
above the standard fatty acids will be produced which
makes methanogenesis unfavorable. The pressure is
controlled through efficient removal of hydrogen by
hydrogen-consuming organisms such as hydrogenotrophic
methanogens. Acetogenic bacteria are also sensitive to
physical changes such as fluctuation in organic loading rate
[17].
TABLE I
STOICHIOMETRY AND CHANGE OF FREE ENERGY (ΔG°΄) FOR
ACETOGENIC REACTIONS [18].
Compound Reaction ΔG°‘(kJ/mole) Eqn
Lactate
CH3CHOHCOO‐ +
2H2O→CH3COO‐ +
HCO3 ‐+ H+ + 2H2
-4.20 (1)
Ethanol
CH3CH2OH +
H2O→CH3COO‐ +
H+ + 2H2
9.60 (2)
Butyrate
CH3CH2CH2COO‐ +
2H2O→2CH3COO‐ +
H+ + 2H2
48.10 (3)
Propionate
CH3CH2COO‐ +
3H2O→CH3COO‐ +
HCO3 + H+ + 3H2
79.10 (4)
Methanol
4CH3OH +
2CO2→3CH3COOH
+ 2H2O
-2.90 (5)
Hydrogen‐CO2
2HCO3 ‐ + 4H2 + H+
→ CH3COO‐ +
4H2O
-70.30 (6)
Palmitate
CH3‐(CH2)14‐COO‐ +
14H2O →
8CH3COO‐ + 7H+ +
14H2
345.6 (7)
Proceedings of the World Congress on Engineering 2016 Vol II WCE 2016, June 29 - July 1, 2016, London, U.K.
ISBN: 978-988-14048-0-0 ISSN: 2078-0958 (Print); ISSN: 2078-0966 (Online)
WCE 2016
D. Methanogenesis
Methanogenes is the final stage of anaerobic digestion
where hydrogen, carbon dioxide and acetate are converted
to methane [19]. The formation of methane involves two
biological reactions. The primary reaction is where acetate
is degraded to methane and carbon dioxide as referred in
―(8)‖ [20].
243 COCHCOOHCH . (8)
The second reaction occurs when methanogenic archea
reduce carbon dioxide using hydrogen as electro donor to
form methane and water as indicated in ―(9)‖ [16].
OHCHCOH 2422 24 (9)
This reaction is known as a rate limiting stage in
anaerobic digestion. During this process, 65-70% of
methane is produced from acetate, then 27-30% from
hydrogen and carbon dioxide [8, 16, 17]. Products from this
process are the ones that make up the majority of the biogas.
The metabolism and activity of microorganism governing
this stage are highly affected by the change or fluctuation of
pH and temperature than any other microbial balance in the
digester [9]. In addition, methane producing bacteria are
mostly likely to cease growth due to inhibition of ammonia
to anaerobic process [21].
III. PARAMETERS AFFECTING ANAEROBIC
DIGESTION
The activity of biogas production depends on various
parameters like temperature, partial pressure, pH, hydraulic
retention time, C/N ratio, pre-treatment of feedstock, trace
of metals (trace elements) and concentration of substrate [2,
22-24].
A. Temperature
The anaerobic process is so sensible to temperature;
change of acetic acid (acetate) to methane depends mostly
on temperature but conversion to acetic acid will not affect
much by slight temperature variations. Grimberg et al., [25]
reported that the environmental temperature has a major
influence on the anaerobic microbial systems, which affects
the metabolic rate, ionization equilibria, substrate solubility
and fats. Higher temperature affects the activity of
hydrogenotropic methanogens in the anaerobic process and
enriches hydrogen producing bacteria and spore forming
bacteria [25]. Mesophilic digestion temperature is
considered to be most suitable for anaerobic digestion on
the ranges of 35-37 . In thermophilic digestion, 55 is
considered to be ideal [26]. Table II shows different thermal
stages, process temperatures and typical hydraulic retention
times for the AD process.
TABLE II
THERMAL STAGES, PROCESS TEMPERATURE AND TYPICAL
HYDRAULIC RETENTION TIMES [27].
Thermal stages Process temperature
(0C) HRT(days)
Psychrophilic <20 From 70-80
Mesophilic From 30-42 From 14-40
Thermophilic From 43-55 From 14-20
B. pH
The pH-value is the measure of alkalinity/acidity of a
solution [28]. It affects the production of biogas because
each group of the microorganisms have different optimum
pH range. Methanogenic bacteria have an optimum pH
between 6.5 and 7.5. They are extremely sensitive to pH.
The fermentative micro-organisms are less sensitive to pH
since they have wide optimum pH range between 4.0 and
8.5. Low pH level favours the production of acids such as
butyric acid, propionic acids and acetic mainly at pH of 4.0.
At pH higher than 8.0, ammonia is mainly produced. The
presence of volatile fatty acids (VFAs) tends to decrease the
pH and can lower the methanogenic bacteria activity and
hence the biogas production [29].
C. Volatile fatty acid
The VFA‘s uptake play a crucial role in the whole
degradation kinetics of organic waste digestion, as the
accumulation of the intermediate products, VFAs, is the
rate-limiting step [25]. High concentrations VFAs in the
digester lower the pH, inhibit methanogenic activity and
cause possible failure of the anaerobic digestion process
[25].
D. Carbon/Nitrogen ratio
The carbon/nitrogen (C/N) ratio represent the relationship
between the amount of carbon and nitrogen present in
organic substrate. The optimal C/N ratio for anaerobic
digestion is considered to be in the range of 15-30 [30]. If
the C/N ratio is too high, the nitrogen is consumed rapidly
by the methanogens bacteria to meet their protein
requirement and is no longer available to react on the left-
over carbon content in the material. As a result the biogas
production is reduced [30]. If the C/N ratio is too low,
nitrogen is liberated and accumulates in the form of
ammonia [30]. This increases the pH of the digestates.
When pH value rises higher than 8.5, it begins to exert a
toxic effect on the methanogenic bacteria [30]. To maintain
Proceedings of the World Congress on Engineering 2016 Vol II WCE 2016, June 29 - July 1, 2016, London, U.K.
ISBN: 978-988-14048-0-0 ISSN: 2078-0958 (Print); ISSN: 2078-0966 (Online)
WCE 2016

the C/N level of the digester substrate at optimum levels,
substrate of high C/N ratio can be co-digested with substrate
of low C/N ratio [30].
E. Retention time
Retention time is the time required to degrade the organic
matter (substrate) completely and for bacterial to grow. The
retention time depends on process temperature and batch
composition, meaning retention time for waste treated in a
mesophilic condition than thermophilic conditions [31], the
residence time is generally positively correlated with
methane content. There are two important types of retention
time that include; solid retention time (SRT) and hydraulic
retention time (HRT). SRT is the average time the bacteria
(solids) are in the anaerobic digester, and HRT is the
volume of the biological reactor per influent flow rate in
time, which is defined by following equation: Digestion
time inside the reactor is one of the main factors influencing
the CH4 yield [31]. Effective hydraulic retention time
depends on the type of substrate, loading rate, and reaches
up to a couple of weeks. Shorter HRT usually results in
accumulation of VFAs, whereas at HRT longer than
optimal, the digester components are not effectively utilized
[31].
F. The organic loading rate (OLR)
The organic loading rate (OLR) is the amount of volatile
solids (VS) to be fed into the digester each day in a
continuous process. As the OLR increases, the biogas yield
increases to some extent but above the optimal organic
loading rate, the volatile solids degradation and biogas yield
decreases due to overloading [32]. The maximum possible
OLR depends on the process temperature and its retention
time.
G. Toxicity
Mineral ions, especially of trace elements are among the
materials that inhibit the growth of bacteria in a digester.
Small amount of mineral (calcium, sodium, potassium,
sulphur, magnesium and ammonium) stimulate the
microorganisms growth, but higher concentrations have a
toxic and inhibition effect [26]. Heavy metals such as zinc,
nickel, cobalt, copper, lead and chromium are essential for
bacterial growth in very small quantities, but higher
quantities have a toxic bacteria effect. Organic solvents and
antibiotic also inhibit the bacteria. Recovery of digesters can
only be achieved by flushing the content, cessation of
feeding, or diluting the contents to lower the concentration
of inhibitory substances to below the toxic level [26].
H. Ammonia
Studies in the past have showed that ammonia is an
important source of nitrogen for bacteria, low
concentrations of ammonia is valuable to the process [33],
although some findings showed that the specific activity of
methanogenic bacteria decreases with increasing in
concentrations of ammonia [33]. The mechanisms ammonia
inhibition are change in the intracellular pH, increase of
maintenance energy requirement as well as inhibition of a
specific enzyme reaction [33]. And high concentration of
ammonia in the digester decreases the deamination activity
of proteolytic bacteria [34].
I. Agitation/Mixing
Mixing is required to maintain fluid homogeneity, hence
process stability, temperature distribution, within a digester.
The objectives of mixing are to combine the incoming
substrate with the bacteria, to reduce the formation of scum,
and to avoid pronounced temperature gradients within the
digester. Very rapid mixing can disrupt the microbial
balance while too slow stirring can cause short-circuiting
and inadequate mixing. [26].
J. Dilution
Water should be added, if necessary, to the substrate to
generate a slurry which is neither too thick nor too thin. If a
slurry is diluted too much, the solid particles may settle
down in the digester and may not get degraded properly. If
the slurry is too thick, it may be difficult to stir and may
impede the flow of gas to the upper part of the digester.
Different systems can handle different levels of slurry
density, generally in the range of 10-25% of solids [26].
K. Solid Residue/Slurry
When the anaerobic degradation is nearly complete, the
solid residue or digestate is removed and is normally cured
aerobically and screened for items such as plastic pieces,
glass, shards etc., before being disposed on land as fertilizer
[26].
L. Grinding
Grinding or breaking down of substrate into small pieces
before feeding them into the digester will decrease the
retention time in digestion and enhance biogas production.
Since materials grinded increases their surface area of
contact with anaerobic bacteria and thus simplifying the
digestion process [35].
M. Co-digestion
Studies show that co-digestion is a way of minimising
HRT and improving methane production [36]. The other
substrate should be manure which is dominated by high
levels of organisms that have the ability to hydrolyse lingo-
cellulose material. Co-digestion of biomass waste can
produce more methane than manure itself, but the challenge
in this process is to achieve completely break down of
organic material in stage of hydrolysis [36]. The importance
of co-digestion is to stabilize conditions or other parameters
in digestion process such as C:N ratio as well as pH,
Proceedings of the World Congress on Engineering 2016 Vol II WCE 2016, June 29 - July 1, 2016, London, U.K.
ISBN: 978-988-14048-0-0 ISSN: 2078-0958 (Print); ISSN: 2078-0966 (Online)
WCE 2016
macronutrients and micronutrients, inhibitors and dry
material [36].
N. Substrate pre-treatment
Pre-treatment is done to increase the efficiency of
anaerobic digestion technology and increase the production
of biogas [37]. Pre-treatment can be classified as thermal,
mechanical, biochemical pre-treatment. Pre-treatment is
necessary since the nature of a substrate has an effect on the
rate of biogas production [37].
IV. MODELLING OF ANAEROBIC DIGESTION
The option to convert biogas to natural gas is purely
relevant in large scale production. Development of
appropriate models are the best steps for complete process.
For nearly 40 years, scientists have developed and improved
on the anaerobic digestion models of organic substances
[38]. Primary modelling allows to determine optimal
working conditions or parameters which are theoretically
possible, to analyse and estimate variety of different process
possibilities. The most prominent advantages of the use of
the models in anaerobic digestion is [7]; This reduce
additional costs for continuous and repeated experiments,
the possibility of saving time and money in the process of
technology/process selection, rapid comparison of options
and comparison of the system performance in a quantitative
instead of a qualitative way allows in many cases for easier
decision‐making [7], monitoring parameters, possibility of
minimizing risks and enhance plant efficiency. By using
model, ‗what if‘ scenarios can be examined in a quantitative
way in respect of what the effects of potential risks are [7].
Biogas can be produced from co-digestion of various
substrates. In the present study, anaerobic digestion of pig
waste and grass clippings were studied in laboratory experiments in a 10 liters digester under constant
temperature of 37 0C. The data obtained from this
experiment was used to check fitness of modified Gompertz
equation that well described kinetics of biogas production.
Several researchers [39-44] have used modified Gompertz
equation that was developed by Zwietering et al. [6] for
kinetics of biogas production. Kinetics parameters A (ml/g
COD)-biogas production potential, μ (ml/g COD. day)-
maximum biogas production rate and λ (day)-lag phase
period were estimated. The modelling of the biogas
production help to analyse kinetic models and other
parameters that can be used to design and scale-up of
laboratory experiments into industrial size applications.
V. METHODOLOGY
Pig waste were collected from a farm in Gauteng
province while grass clippings were collected from
University of Johannesburg, South Africa. Waste
characterization was done to ascertain the composition.
These included physical and chemical composition with
regards to C/N ratio, volatile solids, total solids and
elemental analysis for carbon, nitrogen, sulphur and
hydrogen in accordance with the standard method (APHA
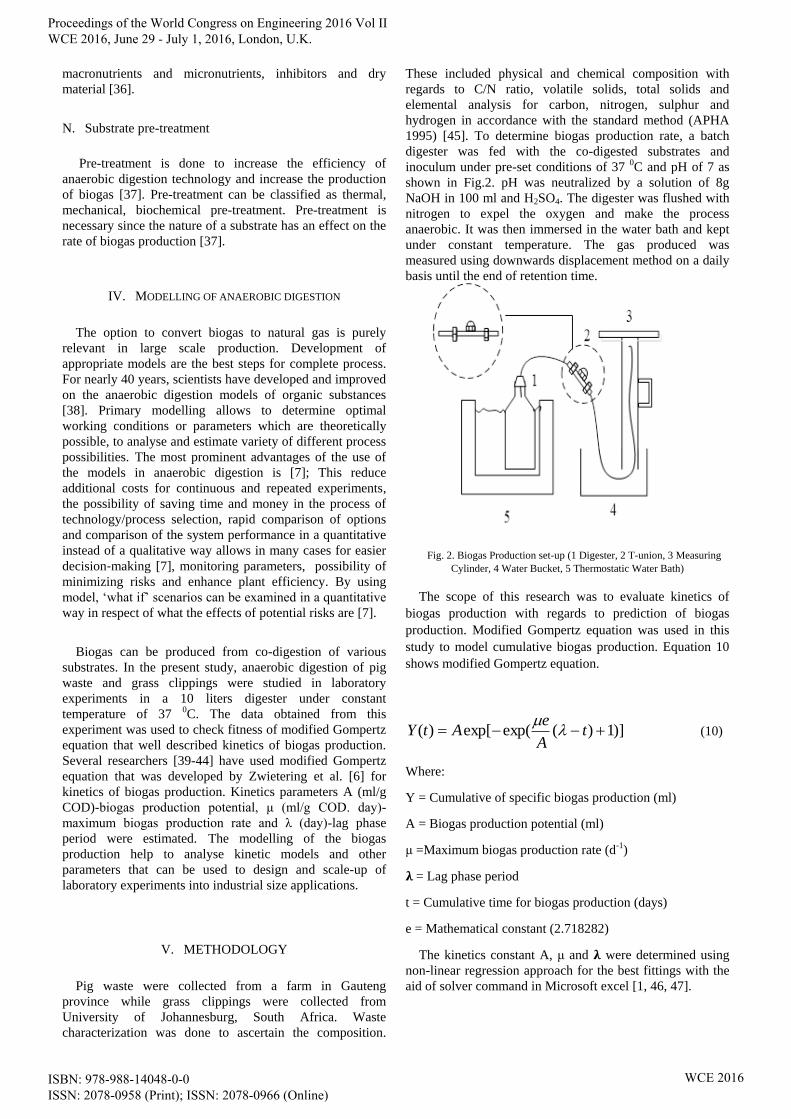
1995) [45]. To determine biogas production rate, a batch
digester was fed with the co-digested substrates and
inoculum under pre-set conditions of 37 0C and pH of 7 as
shown in Fig.2. pH was neutralized by a solution of 8g
NaOH in 100 ml and H2SO4. The digester was flushed with
nitrogen to expel the oxygen and make the process
anaerobic. It was then immersed in the water bath and kept
under constant temperature. The gas produced was
measured using downwards displacement method on a daily
basis until the end of retention time.
Fig. 2. Biogas Production set-up (1 Digester, 2 T-union, 3 Measuring
Cylinder, 4 Water Bucket, 5 Thermostatic Water Bath)
The scope of this research was to evaluate kinetics of
biogas production with regards to prediction of biogas
production. Modified Gompertz equation was used in this
study to model cumulative biogas production. Equation 10
shows modified Gompertz equation.
)]1)(exp(exp[)( tA
eAtY
(10)
Where:
Y = Cumulative of specific biogas production (ml)
A = Biogas production potential (ml)
μ =Maximum biogas production rate (d-1)
𝛌 = Lag phase period
t = Cumulative time for biogas production (days)
e = Mathematical constant (2.718282)
The kinetics constant A, μ and 𝛌 were determined using
non-linear regression approach for the best fittings with the
aid of solver command in Microsoft excel [1, 46, 47].
Proceedings of the World Congress on Engineering 2016 Vol II WCE 2016, June 29 - July 1, 2016, London, U.K.
ISBN: 978-988-14048-0-0 ISSN: 2078-0958 (Print); ISSN: 2078-0966 (Online)
WCE 2016

VI. RESULTS AND DISCUSSION
In this study, co-digestion of pig waste and grass
clippings were evaluated for the purpose of getting the bio-
methane potentials and bio-chemical kinetics at optimum
temperature (37 0C) and initial pH of 7. Table III shows the
substrate characterization. Grass clippings were found to
contain more volatile solids compared to pig waste which
had more nutrients. The elemental analysis of pig waste
indicated low C/N ratio compared to grass clippings.
Through co-digestion, the C/N ratio increased to 17.28.
TABLE III
SUBSTRATE CHARACTERIZATION
Parameters Grass clippings Pig waste
C 19.1 42.26
H 1.04 0.7
N 0.93 2.62
S 0 0
TS (g) 0.88 0.77
VS (g) 0.64 0.56
TS (%) 64.08 55.7
VS (%) 87.88 76.8
C/N ratio 20.54 16.16
Where:
C – Carbon
H – Hydrogen
N – Nitrogen
S – Sulphur
TS – Total Solids
VS – Volatile Solids
TS is the sum of dissolved solids and suspended solids.
TS and pH are important to assess anaerobic digestion
process efficiency [14, 19]. VS is the organic portion of TS
that biodegrade in anaerobic process. C/N ratio is an
important factor in bacteria stability in anaerobic process.
The C/N ratio required for production of biogas is from 15-
30 [43, 48]. TS and VS are calculated using ―(2)‖ and ―(3)‖
respectively while C/N ratio is calculated using ―(4)‖.
MMMwet
burneddriedVS
(%) (11)
MM
wet
driedTS (%) (12)
Where:
Mdried = Amount dried sample (mg)
Mwet = Amount of wet sample (mg)
Mburned = Amount of burned sample (mg)
)*()*(
)*()*(
NNSC
ff
fF
FF
SF
N
C
(13)
Where:
F = First substrate
S = Second substrate
Cf = Carbon composition for the first substrate
Cs = Carbon composition for the second substrate
Nf = Nitrogen composition for the first substrate
Ns = Nitrogen composition for the second substrate
A good substrate characterisation is important on
modelling and especially on prediction of biogas potential
from different substrates. The moisture content (MC) of
substrates ranged from 55-95%. These indicated that the
substrates had enough moisture content for AD. The volatile
solids (VS) of substrate ranged from 55-65%. These
indicated that the substrates were rich in organic solid
content that was to be converted to biogas as highlighted by
Zhang et al., (2012) [49]. C/N ratio was important factor in
bacteria stability in anaerobic process. Higher C/N ratio is
adventurous to digestion stability, high carbon content
provided carbon content required for bacteria growth and
hence production of biogas. The increased in carbon content
gave rise to more carbon dioxide formation and lowered the
pH value. Low C/N ratio indicates higher nitrogen content
to carbon and thus causes ammonia accumulation. Ammonia
accumulation leads to increase in pH above 8.5 which again
leads to low methane production according to Mojapelo et
al., (2014) [48]. The C/N ratio was from 15-30 for pig waste
and grass clippings required for production of biogas.
The study of biogas production from Pig waste and grass
clippings were conducted in a laboratory batch anaerobic
digester. Biogas production was monitored and measured
until there was no more biogas produced. The modified
Gompertz model was used to fit the cumulative biogas
production using non-linear regression as shown in Fig. 3.
Fig. 3. Biogas Prediction using Modified Gompertz model for pig
waste/grass.
Proceedings of the World Congress on Engineering 2016 Vol II WCE 2016, June 29 - July 1, 2016, London, U.K.
ISBN: 978-988-14048-0-0 ISSN: 2078-0958 (Print); ISSN: 2078-0966 (Online)
WCE 2016

Fig. 3 shows effect of mesophilic temperature on AD 37 0C. It was observed that there was shorter lag phase which
indicated the digester had essential microbes and enriched
seeding (inoculum) to enhance anaerobic digestion.
Between 1-10 days the rate of conversion increased with
retention time. This was because with time, the conversion
rate/percent of reactants to products increased. Temperature
played an important role in dissociating old /reactant
particle to form new species. Conversion rate increased with
increased in temperature. And conversion of reactants
increased with time, until an equilibrium state was reached.
The kinetics parameters evaluated are shown in Table IV.
The kinetics constants A (ml/g COD)-Biogas production
potential, μ (ml/g COD. day)-maximum biogas production
rate, λ (day)-lag phase period were 7920.70, 701.35, 1.61
respectively with R2- coefficient of determination of 0.9994
[1].
TABLE IV
MODIFIED GOMPERTZ PARAMETERS
Digester Temp
Biogas
Yield
(ml)
Modified Gompertz
parameters (model) R2
A ml 𝛌 (d) μ d-1
Pig Waste
Grass
Clippings 37 0C 7725.0 7920.70 701.35 1.61 0.94
VII. CONCLUSION
Biogas production from co-digestion of pig waste and
grass clippings was established to be feasible at a
temperature of 37 0C. The application of modified Gompertz
equation in studying the biogas production was able to
predict biogas production with retention time.
ACKNOWLEDGEMENT
The author wish to express their appreciation to Process
Energy Environmental and Technology Station (PEETS)
funded by South Africa National Energy Development
Institute (SANEDI) and Technology Innovation Agency
(TIA), City of Johannesburg (COJ) through Prof. Charles
Mbohwa, Mr. Thabo Maahlatsi and Mr. Mlawule Mashego,
Chemical Engineering and Applied Chemistry Departments
at the University of Johannesburg for allowing us to work in
their laboratories. Dr. Robert Huberts for assisting with
some of the equipment for analysis. Dr. Jeffrey Bosire
Orina, Martin Magu and Agbenyeku Emmanuel for
technical support.
REREFENCES
[1] M.O.L. Yusuf, A. Debora, and D.E. Ogheneruona, Ambient
temperature kinetic assessment of biogas production from co-
digestion of horse and cow dung. Research in Agricultural
Engineering, 2011. 57(3): p. 97-104.
[2] G.K. Latinwo and S.E. Agarry,Modelling the Kinetics of Biogas
Production from Mesophilic Anaerobic Co-Digestion of Cow Dung
with Plantain Peels. International Journal of Renewable Energy
Development (IJRED), 2015. 4(1): p. 55-63.
[3] T.O. Omer and M.O. Fedalla, Engineering design and Economic
Evaluation of a family—sized biogas project in Nigeria.
Technovation, 2002.
[4] A.S. Sambo, B. Garba, and B.G. Danshehu, Effect of some operating
parameters on biogas production rate. Renewable Energy, 1995.
6(3): p. 343-344.
[5] A. Tiehm, K. Nickel, M. Zellhorn, Neis,U., Ultrasonic waste
activated sludge disintegration for improving anaerobic stabilization.
Water Research, 2001. 35(8): p. 2003-2009.
[6] T.R. Sreekrishnan., S. Kohli, and V. Rana, Enhancement of biogas
production from solid substrates using different techniques––a
review. Bioresource technology, 2004. 95(1): p. 1-10.
[7] M. Henze, Biological wastewater treatment: principles, modelling
and design. London: IWA Publ, 2008: p. 401-437.
[8] J.C. Sabonnadière, Renewable energy technologies John Wiley &
Sons, 2010. 146.
[9] G. Forgács, Biogas production from citrus wastes and chicken
feather: pretreatment and co-digestion. 2012: Chalmers University of
Technology.
[10] J.J. Cheng, Biomass to renewable energy processes. 2009: CRC press.
[11] M. Čater, M. Zorec, and R.M. Logar, Methods for improving
anaerobic lignocellulosic substrates degradation for enhanced biogas
production. Springer science reviews, 2014. 2(1-2): p. 51-61.
[12] D. Dueblein and A. Steinhauser, Biogas from waste and renewable
resources. 2008.
[13] J. Elias, Study on Renewable Biogas Energy Production from
Cladodes of Opuntia ficus-indica. 2010, aau.
[14] M. Schön,, Numerical modelling of anaerobic digestion processes in
agricultural biogas plants. Vol. 6. 2010: BoD–Books on Demand.
[15] T.T. Tesfaye, Potential for biogas production fromslaughter houses
residues in Bolivia: Systematic approach and solutions to problems
related to biogas production at psychrophilic temperature. 2011.
[16] J. Popov, Model based optimization of biogas production at SNJ
plant. 2010.
[17] W. Parawira, Anaerobic Treatment of Agricultural Residues and
Wastewater-Application of High-Rate Reactors. 2004: Lund
University.
[18] T. Bond and M.R. Templeton, ―History and future of domestic biogas
plants in the developing world. Energy for Sustainable
Development‖. 2011: p. 347-354.
[19] T.Z.D. De Mes, A.J.M. Stam, J.H. Reith, G. Zeeman, Methane
production by anaerobic digestion of wastewater and solid wastes.
Bio-methane & Bio-hydrogen, 2003.
[20] B.S. Zeb, Q. Mahmood, and A. Pervez, Characteristics and
performance of anaerobic wastewater treatment (a review). Journal of
Chemical Society of Pakistan, 2013. 35(1): p. 1-6.
[21] D. Dueblein and A. Steinhauser,Biogas from waste and renewable
resources. 2008.
[22] S. Rao, A. Retter, and P.J. Hobbs, Effect of biomass hydrolysis on
biogas production.
[23] R. Sundararajan, S. Jayanthi, and R. Elango, Anaerobic digestion of
organic fractions of municipal solid waste and domestic sewage of
Coimbatore. Indian Journal of Environmental Health, 1997. 39(3): p.
193-196.
[24] A.N. Matheri., M. Belaid, S. Tumisang, C.J. Ngila., The Kinetic of
Biogas Rate from Cow Dung and Grass Clippings. 7th IIENG
International Conference of latest trends in Engineering and
Technology (ICLTET‘2015) Pretoria, South Africa, November 2015. ,
2015.
[25] S.J. Grimberg, D. Hilderbrandt, M. Kinnunen, S. Rogers., Anaerobic
digestion of food waste through the operation of a mesophilic two-
phase pilot scale digester–assessment of variable loadings on system
performance. Bioresource technology, 2015. 178: p. 226-229.
[26] T. Abbasi, S.M. Tauseef, and S.A. Abbasi, Biogas energy. Vol. 2.
2011: Springer Science & Business Media.
[27] R. Noshy Optimization of bioenergy solutions at different farm scales.
2013: p. 17-84.
[28] T. Al Seadi, D. Rutz, H. Prassl, M. Kottner, T .Finsterwalder, S. Volk,
R. Janssen., Biogas Handbook.–University of Southern Denmark
Esbjerg. 2008, ISBN 978-87-992962-0-0.
[29] L. Appels, J. Baeyens, J. Degrere, R. Dewil., Principles and potential
of the anaerobic digestion of waste-activated sludge. Progress in
energy and combustion science, 2008. 34(6): p. 755-781.
Proceedings of the World Congress on Engineering 2016 Vol II WCE 2016, June 29 - July 1, 2016, London, U.K.
ISBN: 978-988-14048-0-0 ISSN: 2078-0958 (Print); ISSN: 2078-0966 (Online)
WCE 2016

[30] A.P. Annachhatre,, Dry anaerobic digestion of municipal solid waste
and digestate management strategies. 2012, Asian Institute of
Technology.
[31] F. Monnet, An introduction to anaerobic digestion of organic wastes.
Remade Scotland, 2003: p. 1-48.
[32] B. Rincon, et al., The effect of organic loading rate on the anaerobic
digestion of two phase, olive mill solid residue derived from fruits
with low ripening J Chem Technol Biotechnology 2007. 82:2.
[33] Y.R. Chen, J.J. Cheng, and K.S. Creamer, Inhibition of anaerobic
digestion process: a review. Bioresource technology, 2008. 99(10): p.
4044-4064.
[34] A. Khalid, K.T. Klasson, S.R. Drescher, W. Ridenour, A.P. Borole,
M.H. Al-Dahhan., The anaerobic digestion of solid organic waste.
Waste Management, 2011. 31(8): p. 1737-1744.
[35] M.A. Hassan, and M. Haddad, The feasibility of family biogas
production from mixed organic wastes in Palestinian rural areas.
Faculty of Graduated Studies, An-Najah National University, 2004.
[36] E. Ryckebosch, M. Drouillon, and H. Vervaeren, Techniques for
transformation of biogas to biomethane. Biomass and bioenergy,
2011. 35(5): p. 1633-1645.
[37] X. Wang, G. Yang, Y. Feng, G. Ren, X. Han., Optimizing feeding
composition and carbon–nitrogen ratios for improved methane yield
during anaerobic co-digestion of dairy, chicken manure and wheat
straw. Bioresource Technology, 2012. 120: p. 78-83.
[38] M. Gerber and R. Span, An analysis of available mathematical models
for anaerobic digestion of organic substances for production of
biogas. Proc. IGRC, Paris, 2008.
[39] I. Syaichurrozi and S. Sumardiono, Biogas production kinetic from
vinasse waste in batch mode anaerobic digestion. World applied
sciences journal, 2013. 26(11): p. 1464-1472.
[40] I Nyoman, W. and J. Seno, The kinetic of biogas production rate from
cattle manure in batch mode. International Journal of chemical and
biological Engineering, 2010. 3(1): p. 39-45.
[41] B. Zhu., et al., Characteristics and biogas production potential of
municipal solid wastes pretreated with a rotary drum reactor.
Bioresource technology, 2009. 100(3): p. 1122-1129.
[42] S. Adiga, R. Ramja. B.B. Shankar, J.H. Patil, C. Geetha., Kinetics of
anaerobic digestion of water hyacinth, poultry litter, cow manure and
primary sludge: A comparative study. International Proceedings of
Chemical, Biological and Environmental Engineering (IPCBEE),
2012. 42: p. 73-78.
[43] J.H. Patil, M.A. Raj, P.L. Muralidhara, S.M. Desai, G.K.M. Raju.,
Kinetics of anaerobic digestion of water hyacinth using poultry litter
as inoculum. International Journal of Environmental Science and
Development, 2012. 3(2): p. 94-98.
[44] A. Nopharatana, P.C. Pullammanappallil, and W.P. Clarke, Kinetics
and dynamic modelling of batch anaerobic digestion of municipal
solid waste in a stirred reactor. Waste management, 2007. 27(5): p.
595-603.
[45] E.W. Rice, L. Bridgewater, and A.P.H.A Association., Standard
methods for the examination of water and wastewater. 2012:
American Public Health Association Washington, DC.
[46] L. Yu, et al., Mathematical modeling in anaerobic digestion (AD). J
Bioremed Biodeg S, 2013. 4: p. 2.
[47] L. Syaichurrozi and S. Sumardiono, Predicting kinetic model of
biogas production and biodegradability organic materials: biogas
production from vinasse at variation of COD/N ratio. Bioresource
technology, 2013. 149: p. 390-397.
[48] N. Mojapelo, E.Muzenda, R. Kigozi, A.O. Aboyadi.,, Bio-methane
potential of the organic fraction of municipal solid waste. 2014.
[49] Y. Zhang, C.J. Banks, and S. Heaven, Co-digestion of source
segregated domestic food waste to improve process stability.
Bioresource technology, 2012. 114: p. 168-178.
Proceedings of the World Congress on Engineering 2016 Vol II WCE 2016, June 29 - July 1, 2016, London, U.K.
ISBN: 978-988-14048-0-0 ISSN: 2078-0958 (Print); ISSN: 2078-0966 (Online)
WCE 2016