Modelling the Crossing Behavior of Pedestrian at ... the Crossing Behavior of Pedestrian at...
8
Modelling the Crossing Behavior of Pedestrian at Uncontrolled Intersection in Case of Mixed Traffic Using Adaptive Neuro Fuzzy Inference System Harsh J. Amin Department of Civil Engineering, IIT Guwahati, Guwahati-781039, India Email: [email protected] Rutvij N. Desai and Priyesh S. Patel Department of Civil Engineering, L.D College of Engineering, Ahmedabad-380015, India Department of Computer Engineering, Nirma University, Ahmedabad-382481, India Email: {rd271989, priyesh.jas26}@gmail.com Abstract—Critical gap is the most important parameter associated with gap acceptance study especially in case of delay and capacity estimation. Many studies are reported on gap acceptance behavior of pedestrian but most of them confined to developed country where traffic is homogeneous and traffic rules are strictly followed. Uncontrolled intersections in case of developed countries control the traffic and pedestrian movements based on priorities but in India, no one follows the stop and yield signs, even the rules of zebra crossings. It creates more conflicts and increases delay to both. This paper systematically analyzes the behavior of pedestrian during the gap acceptation at two four legged TWSC intersection located at Ahmedabad in state of Gujarat, India. Data on gap acceptance behavior is obtained by video recording technique and analyzed the various parameters relate to crossing behavior of pedestrian. The critical gaps for pedestrians estimated by raff method and results shows that values of critical gap estimated are as low as 3.20 sec. which is smaller than reported in other studies. An Adaptive Neuro Fuzzy Inference System (ANFIS) has been established to estimate the possibilities of accepting a given gap or lag considering the combinations of different parameters which affects the crossing behaviors of pedestrians. Nine different combinations are considered. However, the age of the pedestrian is found to be most important variable in crossing behavior compared to other. Index Terms—pedestrian, gap acceptance, critical gap, anfis, mixed traffic, TWSC intersection I. INTRODUCTION Urbanization and traffic growth rapidly increasing in Indian cities as increasing in economic growth of India. It has resulted in increase in delay to vehicular traffic and occurrences of fatalities. Manuscript received February 20, 2014; revised December 11, 2014. Now these days, many passengers are diverted to public transports and increase in the use of public transportation trips. Public transport trips are normally connected to walk trips either destination or origin or both and sometimes at mode transfer points. Therefore passengers may need cross the road either at intersections or at mid-block sections for many reasons. Now these days, many variety of vehicles are available in India like car, scooter, bike, auto rickshaw as fast moving vehicles and cycle, pedal rickshaw etc. as slow moving vehicles. All these vehicles share the same roadway width without any physical separation and resulted in heterogeneity condition in India. The effects of heterogeneity and reckless walking behavior of pedestrian creates sever conflicts and fatalities. It has resulted in reduction of pedestrian’s safety. As per data from National crime records bureau, 10,125 pedestrian deaths were reported for the year 2007 in India. The precise number of pedestrians injured and killed is difficult to get and could be approximately 40,000 deaths annually in India. More than half of injured and killed pedestrians were young men in 16 to 45 age group [1]. In spite of these fatalities and accidents, limited studies are reported on gap acceptance behavior of pedestrians in Indian condition. This paper attempts to model the gap acceptance behavior of pedestrian at TWSC intersections in order to analyze and evaluate the performance of TWSC intersections. Before starting the gap acceptance study, the term of gap should be clarified. Ashworth and Green [2] measured gap from front of following vehicle to rear of the first vehicle. Polus [3] defined it as the time interval between two successive vehicles in road stream. Along with term of gap comes another term lag. Lag is defined as the time interval between the arrivals of pedestrian at a stop line and the arrivals of the first vehicle at upstream side of the conflicts zone [3]. Critical gap is most Journal of Traffic and Logistics Engineering Vol. 2, No. 4, December 2014 263 ©2014 Engineering and Technology Publishing doi: 10.12720/jtle.2.4.263-270
Transcript of Modelling the Crossing Behavior of Pedestrian at ... the Crossing Behavior of Pedestrian at...
Modelling the Crossing Behavior of Pedestrian at
Uncontrolled Intersection in Case of Mixed
Traffic Using Adaptive Neuro Fuzzy Inference
System
Harsh J. Amin Department of Civil Engineering, IIT Guwahati, Guwahati-781039, India
Email: [email protected]
Rutvij N. Desai and Priyesh S. Patel Department of Civil Engineering, L.D College of Engineering, Ahmedabad-380015, India
Department of Computer Engineering, Nirma University, Ahmedabad-382481, India
Email: {rd271989, priyesh.jas26}@gmail.com
Abstract—Critical gap is the most important parameter
associated with gap acceptance study especially in case of
delay and capacity estimation. Many studies are reported
on gap acceptance behavior of pedestrian but most of them
confined to developed country where traffic is homogeneous
and traffic rules are strictly followed. Uncontrolled
intersections in case of developed countries control the
traffic and pedestrian movements based on priorities but in
India, no one follows the stop and yield signs, even the rules
of zebra crossings. It creates more conflicts and increases
delay to both. This paper systematically analyzes the
behavior of pedestrian during the gap acceptation at two
four legged TWSC intersection located at Ahmedabad in
state of Gujarat, India. Data on gap acceptance behavior is
obtained by video recording technique and analyzed the
various parameters relate to crossing behavior of pedestrian.
The critical gaps for pedestrians estimated by raff method
and results shows that values of critical gap estimated are as
low as 3.20 sec. which is smaller than reported in other
studies. An Adaptive Neuro Fuzzy Inference System
(ANFIS) has been established to estimate the possibilities of
accepting a given gap or lag considering the combinations of
different parameters which affects the crossing behaviors of
pedestrians. Nine different combinations are considered.
However, the age of the pedestrian is found to be most
important variable in crossing behavior compared to other.
Index Terms—pedestrian, gap acceptance, critical gap,
anfis, mixed traffic, TWSC intersection
I. INTRODUCTION
Urbanization and traffic growth rapidly increasing in
Indian cities as increasing in economic growth of India. It
has resulted in increase in delay to vehicular traffic and
occurrences of fatalities.
Manuscript received February 20, 2014; revised December 11,
2014.
Now these days, many passengers are diverted to
public transports and increase in the use of public
transportation trips. Public transport trips are normally
connected to walk trips either destination or origin or
both and sometimes at mode transfer points. Therefore
passengers may need cross the road either at intersections
or at mid-block sections for many reasons. Now these
days, many variety of vehicles are available in India like
car, scooter, bike, auto rickshaw as fast moving vehicles
and cycle, pedal rickshaw etc. as slow moving vehicles.
All these vehicles share the same roadway width without
any physical separation and resulted in heterogeneity
condition in India. The effects of heterogeneity and
reckless walking behavior of pedestrian creates sever
conflicts and fatalities. It has resulted in reduction of
pedestrian’s safety. As per data from National crime
records bureau, 10,125 pedestrian deaths were reported
for the year 2007 in India. The precise number of
pedestrians injured and killed is difficult to get and could
be approximately 40,000 deaths annually in India. More
than half of injured and killed pedestrians were young
men in 16 to 45 age group [1]. In spite of these fatalities
and accidents, limited studies are reported on gap
acceptance behavior of pedestrians in Indian condition.
This paper attempts to model the gap acceptance
behavior of pedestrian at TWSC intersections in order to
analyze and evaluate the performance of TWSC
intersections.
Before starting the gap acceptance study, the term of
gap should be clarified. Ashworth and Green [2]
measured gap from front of following vehicle to rear of
the first vehicle. Polus [3] defined it as the time interval
between two successive vehicles in road stream. Along
with term of gap comes another term lag. Lag is defined
as the time interval between the arrivals of pedestrian at a
stop line and the arrivals of the first vehicle at upstream
side of the conflicts zone [3]. Critical gap is most
Journal of Traffic and Logistics Engineering Vol. 2, No. 4, December 2014
263©2014 Engineering and Technology Publishingdoi: 10.12720/jtle.2.4.263-270
important parameter in gap acceptance behavior. Critical
gap is the minimum gap time that is acceptable to a
pedestrian, intending to cross a conflicting stream. For a
consistent pedestrian its value lies between largest
rejected gap and accepted gap. It is very difficult to
measure the critical gap in field. Its value differs from
pedestrian to pedestrian, time to time, intersection to
intersection, type of movement and traffic situations. All
these factors make an estimation of critical gap a
complex and tedious process.
Various literatures defined the term of critical gap in
different manners. Greenshield defined critical gap is the
gap range that has equal number of rejection and
acceptance. Raff and Hart [4] defined it as size of gaps
whose number of rejected gap longer than it is equal to
number of accepted gap shorter than it. The Highway
Capacity Manual (HCM 2000) [5] defines the term of
critical gap as “the time in seconds below which a
pedestrian will not attempt to begin crossing the street”.
It is assumed that if the given gap is greater than the
critical gap, the pedestrian will cross, but if the given gap
is smaller than the critical gap, pedestrian will not cross.
The term adequate gap is used in the Manual on Uniform
Traffic Control Devices (MUTCD) and is assumed to be
the same as the critical gap in the HCM (2000) [5], [6].
Estimation of critical gap under heterogeneous traffic
condition is more complex than that under homogeneous
traffic conditions. Gap acceptance process becomes
complex due to non-adherence to the rules of priorities,
improper parking facilities, weak lane discipline,
improper lane marking, and variation among the static
and dynamic characteristics of vehicles types. In India
more than 60% of pedestrians creates forcefully gaps in
traffic stream. It affect the natural behavior of traffic
stream and cause delay and decline the capacity of
network with increase in accidents and fatalities.
Model of gap acceptance behavior of pedestrian,
considering more realistic scenario and behavior, have
attempted in this paper by using different combinations
of pedestrian and traffic parameters. The evaluation of set
of explanatory attributes in decision process is affected
by imprecision and uncertainty. Fuzzy logic plays an
important role in the human ability to make decision in
an environment of uncertainty and imprecision. For the
present study, we use neuro-fuzzy approach to establish
the model of gap acceptance of pedestrian at TWSC
intersection. MATLAB is used to develop an Adaptive
Neuro-Fuzzy Inference System (ANFIS), which provides
an optimization scheme to find the parameters in the
fuzzy system that best fit the data. A network-type
structure is similar to a neural network [7]. The present
study attempt an estimation of critical gap by Raff
method and develop a model to estimate possibilities of
accepting a given gap or lag based on different traffic and
pedestrian attributes using ANFIS.
This paper is organized in 8 sections, including this
section. Section 2 discusses the background and the
literature review on the gap acceptance studies while the
data collection and extraction is discussed in Section 3.
Estimation of critical gap and the detailed structure of
ANFIS given in Section 4 & 5 respectively. In section 6
development of the model is discussed and in Section 7
discussed the validation of model. Section 8 concludes
the paper by presenting important conclusions, and
pointing the directions for further research.
II. BACKGROUND LITERATURE REVIEW
Large number of studies has been reported on gap
acceptance behavior of driver since last three decades but
only limited studies are reported on behavior of
pedestrian. Several procedures have been developed in
literature to estimate the critical gap as closely as
possible. Normally, accepted or rejected gaps, age,
gender and speed of pedestrian as well as speed of the
conflicts vehicles are used as the basis for estimation of
critical gap.
Moore [8] found the relation between walking speed
and gap acceptance. He noticed that the pedestrians who
accepted longer gaps decreased their crossing speeds and
concluded that those who accepted long gaps like 7 s
walked at a speed of 1.20 m/s while those accepting gaps
smaller than 3 s walked at 1.57 m/s. Cohen et al. [9]
noticed that no one accepting a gaps smaller than 1.5 s
and everyone accepting a gaps longer than 10.5 s while
they also noticed 92% of pedestrians crossed a 7.0 m
wide road when the available gap was 7 s. DiPietro and
King [10] concluded that if the waiting time on the curb
is increases, accepted gaps becomes longer. Palamarthy
et al. [11] noticed that pedestrians preferred an overall
gap than separate gaps in individual traffic streams. Das
et al. [12] collected the data with using video recording
of a crossing in India, and found the gaps rejected by
older pedestrians were accepted by young pedestrians,
but it was not found any difference between male and
female pedestrians in gap acceptance. Brewer et al. [13]
have collected data of pedestrians crossing from 42 study
sites of seven different country and they evaluated the
gap acceptance behavior of crossing pedestrians based on
a two-part analysis: behavioral analysis and statistical
analysis. Zhao [14] analyzed gap acceptance behavior of
pedestrian at two way stopped controlled intersection and
established micro simulation model using VISSIM and
CORSIM and concluded that compared to CORSIM
model, the VISSIM model provides more detailed
information, such as the individual pedestrian
characteristics and behavior, the length of crosswalks,
and even the marking length on the crosswalks. Grebert [15] observed pedestrian waiting time at the
curb before crossing a road plays a key role in decision
and it was found that very long waiting time lost patience
of the pedestrians and resulted in illegal crossing. Wang
et al. [16] modeled the gap acceptance behavior of
pedestrian when they jaywalk outside crossing facilities,
based on non-intrusive observations from real pedestrian
vehicle interaction scenarios, using binary logit technique.
Yannis et al [17] analyzed the gap acceptance behavior
of pedestrian for mid-block street in urban areas and
concluded that pedestrians’ decision to cross the street
depends on the traffic gap, the waiting time, type of the
Journal of Traffic and Logistics Engineering Vol. 2, No. 4, December 2014
264©2014 Engineering and Technology Publishing
incoming vehicle and the presence of illegally parked
vehicles. Ottomanelli et al. [18] made model based on
decision of pedestrians during gap acceptance at
midblock section using Adaptive Neuro Fuzzy Inference
System and concluded that ANFIS model allow to
reproduce human approximate reasoning, providing
reliable and useful results within soft computing
environment with low data requirements. Kadali and
Vedagiri [19] modeled the behavior of pedestrian during
road crossing at the uncontrolled midblock location in
India under mixed traffic condition using multiple linear
regression (MLR) technique and concluded that increase
in the pedestrian waiting time at curb or at median they
may loses their patience and lead to increase in rolling
gap behavior and accepted gap size will increase when
they accept the lag. They also concluded that speed of the
conflicts vehicle plays major important role in gap
acceptance behavior. Chandra et al. [20] analyzed gap
acceptance data collected at 17 locations in five cities of
India and demonstrated the effect of carriageway width
(number of lanes), directional movements, traffic volume
and pedestrians’ characteristics on the gaps acceptance
study.
A critical review of available literature indicates that
the gap acceptance is function of the accepted and
rejected gaps, age, waiting time, gender and speed of
pedestrian, speed and type of conflicts vehicles. Many of
above literature conducted their study in developed
country but only few of them conducted for mixed traffic
condition as same as in India. The present study attempt
an estimation of critical gap by Raff method and develop
a model to estimate possibilities of accepting a given gap
or lag based on realistic attributes of traffic and
pedestrian using ANFIS.
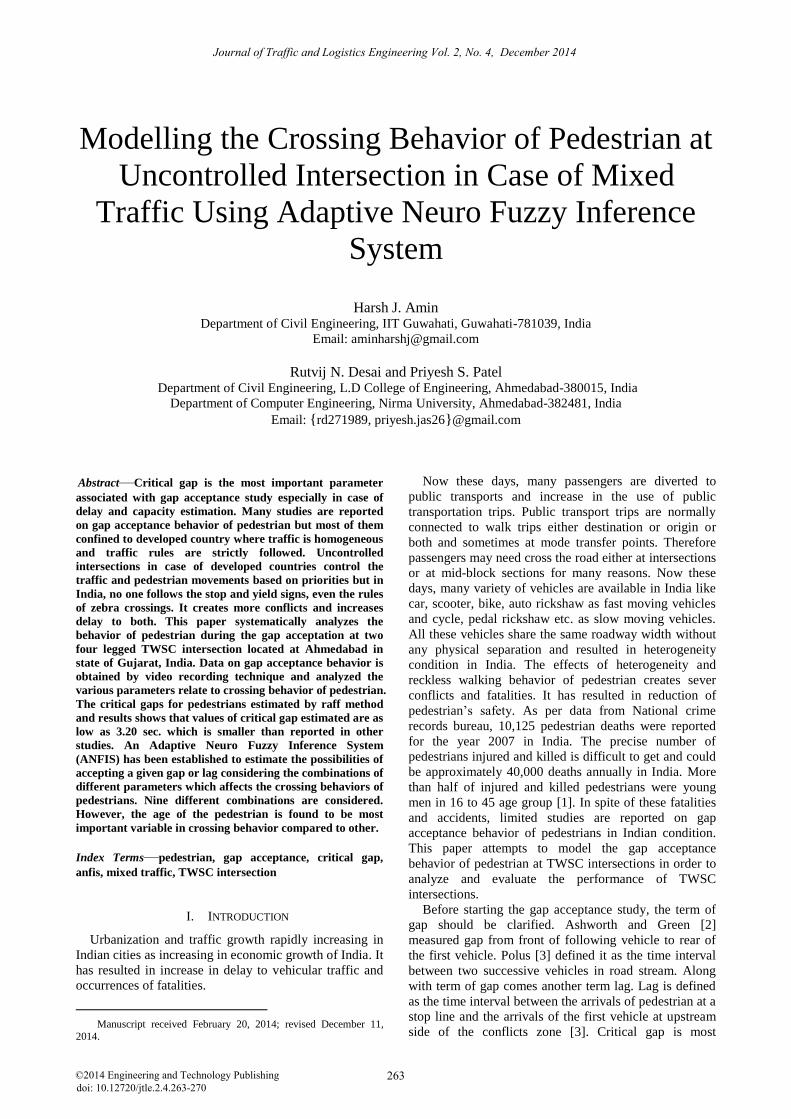
III. DATA COLLECTION AND EXTRACTION
Data for this study were collected at two right angle
two way stopped controlled intersections in semi-urban
areas of Ahmedabad in state of Gujarat. Gujarat is
located in western part of India. Both intersections were
almost similar in geometry with four lanes on major
street approach and two lane on minor street approach.
Geometry of the intersections are shown in Fig. 1. All
sites were located in plain terrain and adequate sight
distances were available for each movement. It was not
possible to conduct the videography of both roads
therefore we conducted the videography only for major
road as pedestrian movement on major road was more
than that of minor road. The total approach traffic on
major stream was in the range of 800 vehicles per hour
(vph) to 2500 vph and on the minor stream were in the
range of 350 vph to 1100 vph.
Video recording technique was adopted for data
collection. Data were collected on first week of January
2014 during as this month do not present extreme
weather conditions in western India. Video recording was
done during morning peak time (9.00-12.00 A.M) on
weekdays. Six video cameras had used to find out
various parameters like vehicle arrival rate, accepted and
rejected gap/lag time, age of pedestrian, speed and type
of conflict vehicle and speed of the pedestrian. Four
video cameras were placed on roof of the building nearby
intersection in such a way that possible to catch various
traffic attributes like speed of the conflicts vehicle, speed
of the pedestrian, type of conflicts vehicle and gap/lag
time. Two video cameras were placed at road level with
using tripod of around 4 feet long to obtain age of
pedestrians. Lags/gaps were measured with an accuracy
of 0.01th of second. Age of the pedestrian is grouped in
three category: young (below 30 years), middle (30 to 50
years) and old (more than 50 years).
The data extraction resulted in observations for 254
pedestrians, and the total lags/gaps (both accepted and
rejected) are 433. The total data set extracted of 254
pedestrians includes 191 male and 63 female; 72 young
pedestrian, 134 mid-age, and 48 old pedestrians.
(a) (b)
Figure. 1. Schematic diagram of intersection 1 (a) and intersection 2 (b)
IV. MEASUREMENT OF CRITICAL GAP From the set of collected data, it is observed that
minimum accepted lag is 1.27 second and minimum
Journal of Traffic and Logistics Engineering Vol. 2, No. 4, December 2014
265©2014 Engineering and Technology Publishing
accepted gap is 1.08 second. From the observation of the
data, it is concluded that young pedestrian accepted
smaller gaps than old age pedestrian. Aggressiveness
behavior of the young pedestrian is clearly reflected in
collected data. While old age pedestrians are accepting
longer gaps compared to other two category. Almost no
gap is rejected by young pedestrian longer than 6.5 sec.
but around 12 % of old age pedestrian reject a gap of 6.5
sec. Furthermore, it was observed from collected data that
if speed of the conflict vehicle is high, pedestrian
searching for higher gap.
(a)
(b)
Figure 2 (a) and (b): Critical gap estimated by raff method for both intersections
The values of the critical gap is calculated using Raff
method proposed by Raff in 1950 [4]. Raff method is
based on macroscopic model and it is the earliest method
for estimating the critical gap which is used in many
countries because of its simplicity. According to Raff
method, sum of cumulative number of accepted gaps 𝐹𝑎
and rejected gaps 𝐹𝑟 is equal to 1 then a gap of length t is
equal to critical gap 𝑡𝑐. It means the number of rejected
gaps larger than critical gap is equal to the number of
accepted gaps smaller than critical gap. Raff method
gives the median value of the critical gap [21]. The
separate analysis for critical gap, combining gap and lag
data, for both intersections is given in Table II. These
values are quite smaller than the critical gaps reported in
other studies, given in Table I. The present study
develops a model to estimate possibilities of accepting a
given gap or lag using different combinations of collected
parameters. Data for this study were collected at two right
angle two way stopped controlled intersections in semi-
urban areas of Ahmedabad in state of Gujarat.
TABLE I. CRITICAL GAP OF PEDESTRIAN IN DIFFERENT COUNTRIES
Year Author’s name Country Critical gap in
second
1953 Moore United Kingdom 3.00 to 7.00
1955 Cohen et al. United Kingdom 1.50 to 7.00
1970 DiPietro and King United States of
America 3.00 to 10.00
2003 Zhao and Wu China 5.79
2005 Das et al. India 8.00
2006 Brewer et al. United States of
America 5.30 to 9.40
Source: Chandra et al. [20]
TABLE II. CRITICAL GAP FOR BOTH INTERSECTIONS
Critical gap in second Intersection 1 Intersection 2
Overall 3.20 3.45
Young pedestrian 3.05 3.30
Old pedestrian 3.40 3.65
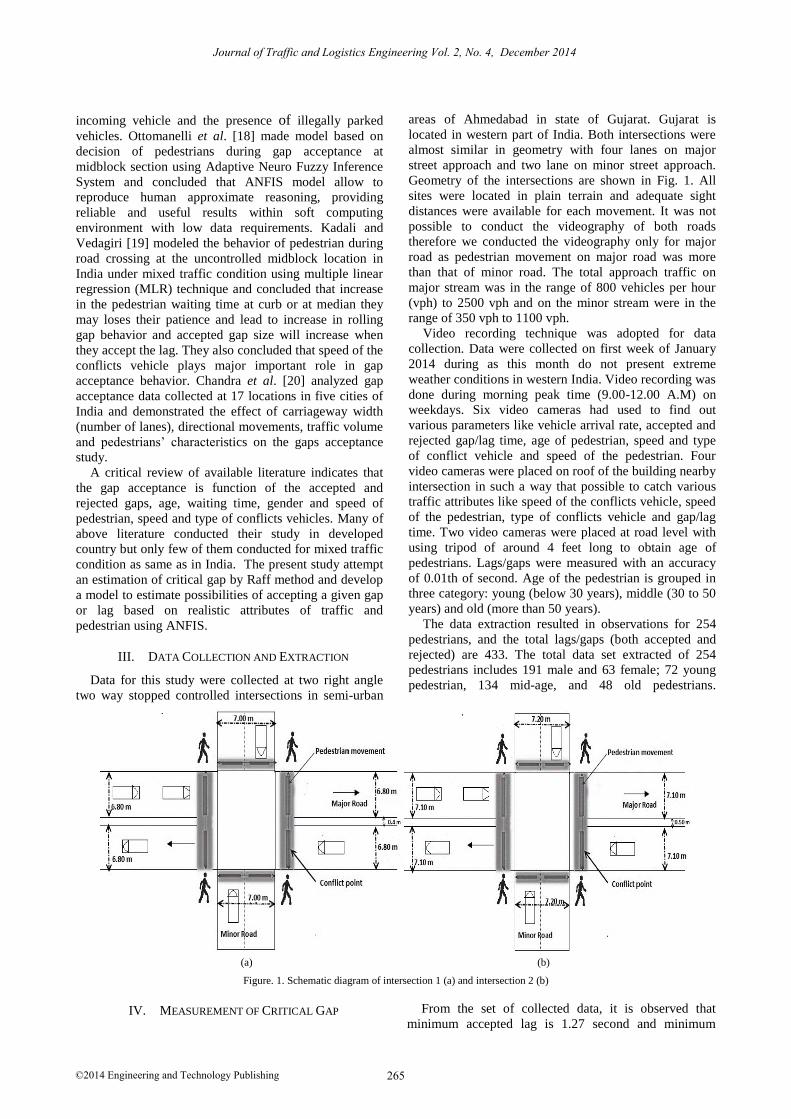
V. ARCHITECTURE OF ANFIS
An Adaptive Neuro Fuzzy Inference System uses two
fuzzy logic and neural network approaches. When these
two systems are linked, they may qualitatively and
quantitatively obtain an appropriate result that will
include either calculative abilities of neural network or
fuzzy intellect. This makes it possible to combine the
advantages of neural network and fuzzy logic. A network
obtained this way could use excellent training algorithms
that neural networks have at their disposal to obtain the
parameters that would not have been possible in fuzzy
logic. ANFIS structure is organized of two part same as
Fuzzy system; First is introductory or antecedent part and
second is concluding parts which are connected together
by a set of rules. We may recognize five different layers
in the structure of ANFIS which makes it as a multi-layer
network. A kind of this network, which is demonstrated
in five different layers, is shown in Fig. 1. This system
contains two inputs (x and y) and one output (Z) which is
associated with the following rules:
Rule 1 If (x is A1) and (y is B1) then Z1=p1x+q1y+r1
Rule 2 If (x is A2) and (y is B2) then Z2=p2x+q2y+r2
where A and B are the input, Z is the output and p, q and
r is a set of consequent parameters of rule. If we consider
the output of each layer in the ANFIS network as (ith
node
output in jth
layer) then we may explain the various layers
functions of this network as follows.
Figure 3. Structure of ANFIS (Source: maharani et al. [22])
Journal of Traffic and Logistics Engineering Vol. 2, No. 4, December 2014
266©2014 Engineering and Technology Publishing
Layer 1 is the fuzzification layer where every node i in
this layer is an adaptive node with a node function,
),(,1 xO Aii for i = 1, 2
),(,1 yO Bii for i
where Ai is the membership grade of x in Ai is fuzzy
set and Bi is the membership of y in Bi fuzzy set. In
this model, fuzzification nodes have a bell activation
function. A bell activation function, which has a regular
bell shape, is specified as,
b
i
i
A
a
cxx
2
1
1)(
(2)
where (ai, bi, ci) is the parameter set. The bell-shaped
function varies with these parameters, thus exhibiting
various forms of membership function for fuzzy set A.
Parameters in this layer are called premise parameters.
Layer 2 is the rule layer. Each node in this layer
corresponds to a single Sugeno-type fuzzy rule whose
output is the product of all the incoming signals:
)()(,2 yxO BiAiii , for i = 1, 2. (3)
Each node output represents the firing strength of a
rule.
Layer 3 is the normalized layer. Every node in this
layer is a fixed node labeled N. The ith
node calculates the
ratio of the ith
rule's firing strength to the sum of all rules'
firing strengths:
,21
,3
i
iiO for i = 1, 2. (4)
Outputs of this layer are called normalized firing
strengths. Layer 4 is the defuzzification layer. Every node
i in this layer is an adaptive node with a node function:
)(,4 iiiiiii ryqxpfO (5)
where ANFIS is a normalized firing strength from layer 3
and (pi, qi, ri) is the parameter set of this node. These
parameters are called consequent parameters. Layer 5 is
represented by a single summation node. Which
computes the overall ANFIS output as the summation of
all defuzzification nodes:
i
i
i
ii
i
iii
f
fO
,5 (6)
Briefly, second layer executes the fuzzy AND of the
antecedent part of the fuzzy rules, the third layer
normalizes the membership functions (MFs), the fourth
layer executes the consequent part of the fuzzy rules, and
finally the last layer computes the output of fuzzy system
by summing up the outputs of layer fourth [7], [23], [22].
VI. DEVELOPMENT OF ANFIS
An Adaptive Neuro-Fuzzy Interface System (ANFIS)
has been developed using Fuzzy Logic toolbox in
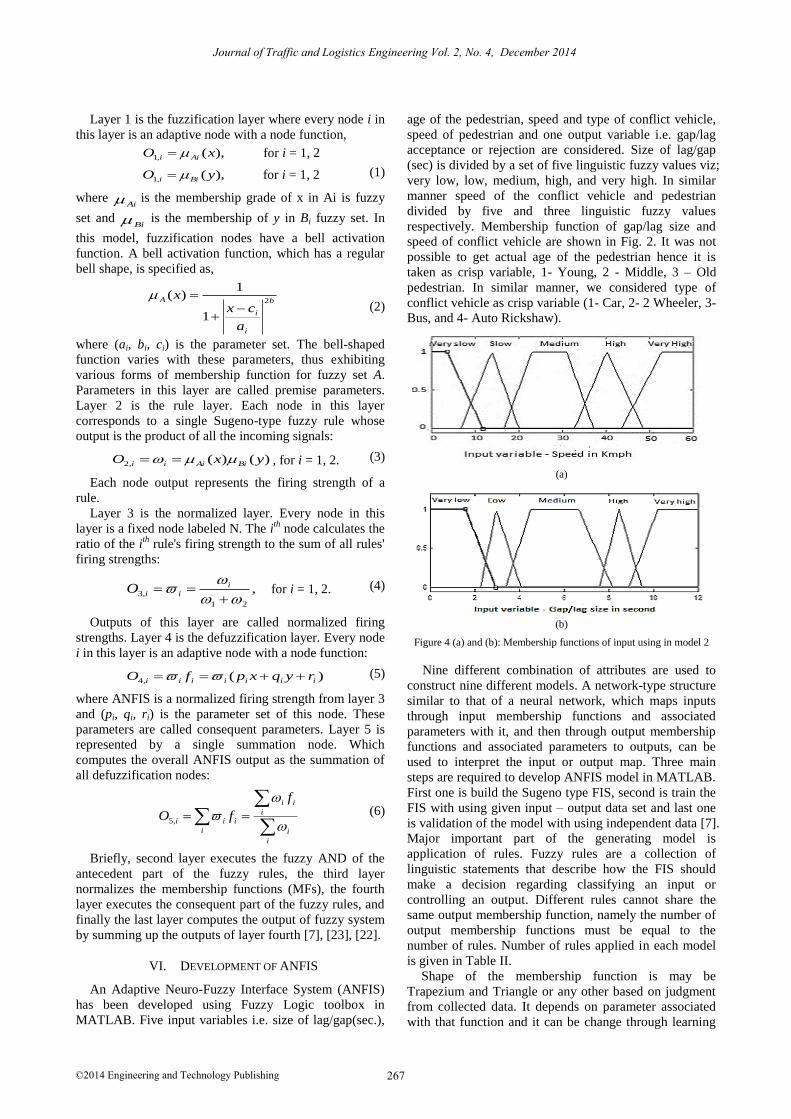
MATLAB. Five input variables i.e. size of lag/gap(sec.),
age of the pedestrian, speed and type of conflict vehicle,
speed of pedestrian and one output variable i.e. gap/lag
acceptance or rejection are considered. Size of lag/gap
(sec) is divided by a set of five linguistic fuzzy values viz;
very low, low, medium, high, and very high. In similar
manner speed of the conflict vehicle and pedestrian
divided by five and three linguistic fuzzy values
respectively. Membership function of gap/lag size and
speed of conflict vehicle are shown in Fig. 2. It was not
possible to get actual age of the pedestrian hence it is
taken as crisp variable, 1- Young, 2 - Middle, 3 – Old
pedestrian. In similar manner, we considered type of
conflict vehicle as crisp variable (1- Car, 2- 2 Wheeler, 3-
Bus, and 4- Auto Rickshaw).
(a)
(b)
Figure 4 (a) and (b): Membership functions of input using in model 2
Nine different combination of attributes are used to
construct nine different models. A network-type structure
similar to that of a neural network, which maps inputs
through input membership functions and associated
parameters with it, and then through output membership
functions and associated parameters to outputs, can be
used to interpret the input or output map. Three main
steps are required to develop ANFIS model in MATLAB.
First one is build the Sugeno type FIS, second is train the
FIS with using given input – output data set and last one
is validation of the model with using independent data [7].
Major important part of the generating model is
application of rules. Fuzzy rules are a collection of
linguistic statements that describe how the FIS should
make a decision regarding classifying an input or
controlling an output. Different rules cannot share the
same output membership function, namely the number of
output membership functions must be equal to the
number of rules. Number of rules applied in each model
is given in Table II.
Shape of the membership function is may be
Trapezium and Triangle or any other based on judgment
from collected data. It depends on parameter associated
with that function and it can be change through learning
Journal of Traffic and Logistics Engineering Vol. 2, No. 4, December 2014
267©2014 Engineering and Technology Publishing
= 1, 2 (1)
process. The computation of these parameters (or their
adjustment) is facilitated by a gradient vector, which
provides a measure of how well the fuzzy inference
system is modeling the input/output data for a given set
of parameters. Once the gradient vector is obtained, any
of several optimization routines could be applied in order
to adjust the parameters so as to reduce some error
measure. An ANFIS uses either back propagation or a
combination of least squares estimation and back
propagation for parameter estimation. Associated
parameter can be changed and adjusted automatic with
using training data. This training process is used out to
reduce and minimize the error between the actual
observed output (Field data) and estimated output by
model. Around 75 % extracted data is used to calibrate
the models. Error Tolerance which is related to size of
error is used to create a training stopping criterion. In this
case, behavior of error is unknown hence, it was set to 0.
Notice how the checking error decreases up to a certain
point in the training and then it increases. This increase
represents the point of model over fitting. ANFIS chooses
the model parameters associated with the least checking
error. Least error is found on 40th
epoch hence it is set
with 40.
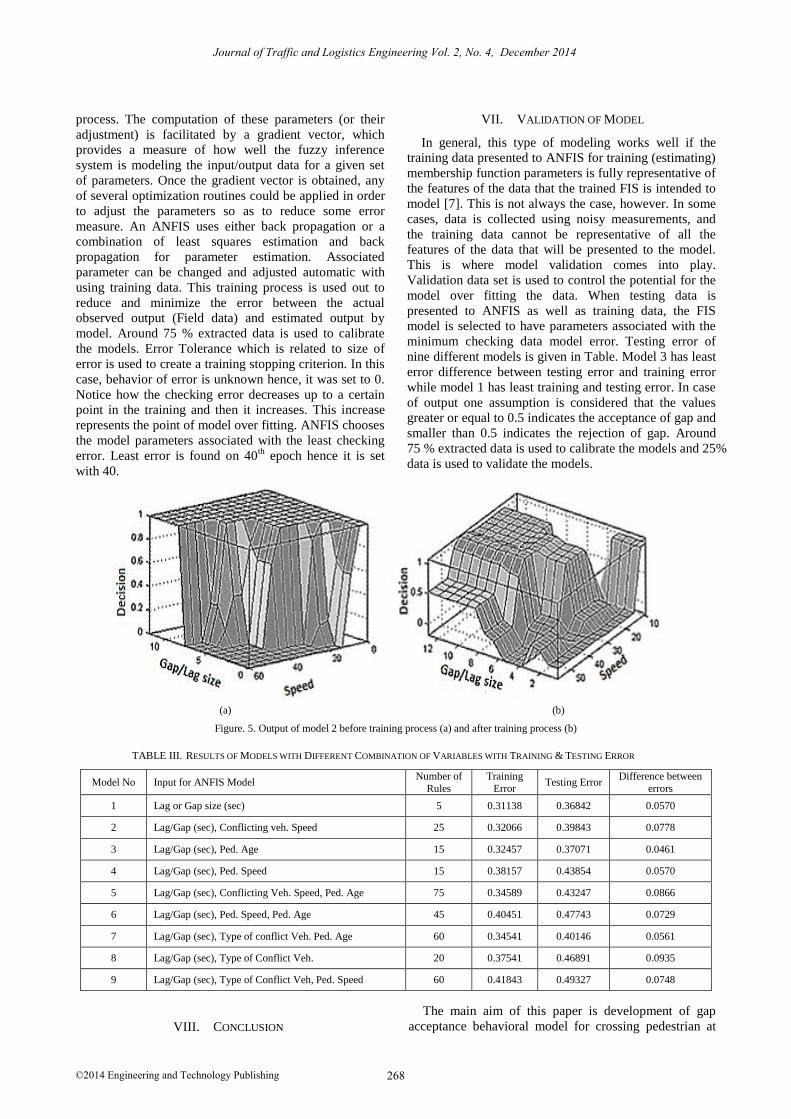
VII. VALIDATION OF MODEL
In general, this type of modeling works well if the
training data presented to ANFIS for training (estimating)
membership function parameters is fully representative of
the features of the data that the trained FIS is intended to
model [7]. This is not always the case, however. In some
cases, data is collected using noisy measurements, and
the training data cannot be representative of all the
features of the data that will be presented to the model.
This is where model validation comes into play.
Validation data set is used to control the potential for the
model over fitting the data. When testing data is
presented to ANFIS as well as training data, the FIS
model is selected to have parameters associated with the
minimum checking data model error. Testing error of
nine different models is given in Table. Model 3 has least
error difference between testing error and training error
while model 1 has least training and testing error. In case
of output one assumption is considered that the values
greater or equal to 0.5 indicates the acceptance of gap and
smaller than 0.5 indicates the rejection of gap. Around
75 % extracted data is used to calibrate the models and 25%
data is used to validate the models.
(a) (b)
Figure. 5. Output of model 2 before training process (a) and after training process (b)
TABLE III. RESULTS OF MODELS WITH DIFFERENT COMBINATION OF VARIABLES WITH TRAINING & TESTING ERROR
Model No Input for ANFIS Model Number of
Rules
Training
Error Testing Error
Difference between
errors
1 Lag or Gap size (sec) 5 0.31138 0.36842 0.0570
2 Lag/Gap (sec), Conflicting veh. Speed 25 0.32066 0.39843 0.0778
3 Lag/Gap (sec), Ped. Age 15 0.32457 0.37071 0.0461
4 Lag/Gap (sec), Ped. Speed 15 0.38157 0.43854 0.0570
5 Lag/Gap (sec), Conflicting Veh. Speed, Ped. Age 75 0.34589 0.43247 0.0866
6 Lag/Gap (sec), Ped. Speed, Ped. Age 45 0.40451 0.47743 0.0729
7 Lag/Gap (sec), Type of conflict Veh. Ped. Age 60 0.34541 0.40146 0.0561
8 Lag/Gap (sec), Type of Conflict Veh. 20 0.37541 0.46891 0.0935
9 Lag/Gap (sec), Type of Conflict Veh, Ped. Speed 60 0.41843 0.49327 0.0748
VIII. CONCLUSION
The main aim of this paper is development of gap
acceptance behavioral model for crossing pedestrian at
Journal of Traffic and Logistics Engineering Vol. 2, No. 4, December 2014
268©2014 Engineering and Technology Publishing
four legged two way stop controlled intersection using an
ANFIS. Video recording technique was adopted for data
collection & extraction. The various parameters that are
used in making of model including accepted and rejected
gap/lag time, age and speed of pedestrian, speed and type
of conflict vehicles. Nine different combinations of
attributes are used to construct nine different models. By
observing the testing and training errors value Model 1
has minimum errors. Also the difference between the
training and testing error for Model 1, Model 3, Model 4
and Model 7 is minimum as compared to others. But
Model 4 and Model 7 have more training and testing
error as compared to Model 1 and Model 3. Model 8 has
highest error difference while Model 9 has highest
training and testing error. The value of critical gap is 3.55
sec. which is obtained from Model 1. In other words 50%
decision is more than 3.55 sec. However the age of the
pedestrian is most effective parameter of pedestrian
crossing behavior while type of conflicting vehicle
producing least effect on decision process compared to
other variables.
Limited studies in the past have conducted on the gap
acceptance behavior of pedestrian at four legged TWSC
intersection under mixed traffic condition. Walking trips
of passengers day by day increasing as increasing public
transport modes (BRTS, Metro, Mono rail etc.). Thus
understanding the behavior of pedestrian is necessary in
constructing delay models. In this study we collected
data from only two intersections located at Ahmedabad.
We plan to collect data at more number of intersections
located at different region of India and develop the
models which include the waiting time, number of
rejection, travel time and more, to obtain the realistic
behavior.
REFERENCES
[1] Special Report. Pedestrian Safety. NIMHANS BISP Fact Sheet. [Online]. Available:
http://www.nimhans.kar.nic.in/epidemiology/epidem_who2.htm
[2] R. Ashworth and B. D. Green, "Gap acceptance at an uncontrolled intersection," Traffic Engineering and Control, vol. 7, no. 11, pp.
676-678, March 1966.
[3] A. Polus, "Gap acceptance characteristics at unsignalised urban intersection," Traffic Engineering and Control, vol. 24, no. 5, pp.
255-258, May 1983.
[4] M. S. Raff and J. W. Hart, "A volume warrent for urban stop signs," in Eno Foundation For Highway Traffic Control,
Saugatuck, Connecticut, 1950.
[5] HCM, Highway Capacity Manual, SR 209, Transportation Research Board, National Research Counsil, Washington D.C.,
1985, 1994, 2000.
[6] J. L. Gattis and S. T. Low, "Gap acceptance at typical stop controlled intersection," Journal of Transportation Engineering,
vol. 125, no. 3, pp. 201-207, July 1999.
[7] J. P. Sangole, G. R. Patil, and P. S. Patare, "Modelling gap acceptance behavior of two-wheelers at uncontrolled intersection
using neuro fuzzy," Procedia Social and Behavioral Science, vol. 20, pp. 927-941, Aug. 2011
[8] R. L. Moore, "Pedestrian choice and judgment," Journal of the
Operational Research Society, vol. 4, pp. 3-10, Mar. 1953. [9] J. Cohen, E. J. Dearnaley and C. E. M. Hansel, "The risk taken in
crossing a road," Journal of the Operational Research Society, vol.
6, no. 2, pp. 120-128, Sept. 1955. [10] C. M. DiPietro and L. E. King, "Pedestrian gap-acceptance," in
Highway Research Record, Washington, D.C, 1970, pp. 80-91.
[11] S. Palamarthy, H. Mahmassan, and R. Machemehl, "Models of
pedestrian crossing behavior at unsignalized intersection," Center
for Transportation Research, Austin, 1994.
[12] S. Das, C. F. Mansk, and M. D. Manuszak, "Walk or wait? An empirical analysis of street crossing decisions," Journal of
Applied Economics, vol. 20, pp. 529-548, Mar. 2005.
[13] M. A. Brewer, K. Fitzpatrick, J. A. Whitacre, and D. Lord, "Exploration of pedestrian gap-acceptance behaviour at selected
locations," Transportation Research Record, Washington, D.C.,
pp. 132-140, July 2006. [14] Y. Zhao, "Exploration of pedestrian gap acceptance at twsc
intersections using simulation," in Proc. ITE Western District
Annual Meeting, Mar. 2012. [15] J. Grebert, "Pedestrian safety consideration enhancement," SICA
Project Proposal Report, SIMBA Project, Jan. 2008.
[16] T. Wang, J. Wu, P. Zheng, and M. McDonald, "Study of pedestrians’ gap acceptance behavior when they jaywalk outside
crossing facilities," in Proc. 13th International IEEE Annual
Conference on Intelligent Transportation Systems, Madeira Island, Portugal, Sept. 2010.
[17] G. Yannis, E. Papadimitriou, and A. Theofilatos, "Pedestrian gap
acceptance for mid-block street crossing," in Proc. 12th WCTR, Lisbon, Portugal, July 2010.
[18] M. Ottomanelli, L. Caggiani, G. Iannucci, and D. Sassanelli, "An
adaptive neuro fuzzy inference system for simulation of pedestrian’s behaviour at unsignalized roadway crossings,"
Advance in Intelligent and Soft Computing, vol. 75, pp. 255-262,
2010. [19] V. P. Kadali B R, "Modelling pedestrian road crossing behaviour
under mixed traffic condition," European Transport\Trasporti
Europei, vol. 55, no. 3, Dec. 2013. [20] S. Chandra, R. Rastogi, and V. R. Das, "Descriptive and
parametric analysis of pedestrian gap acceptance in mixed traffic
conditions," KSCE Journal of Civil Engineering, vol. 18, no. 1, pp. 284-293, Jan. 2014.
[21] A. Gavulová, "Use of statistical techniques for critical gap
estimation.," in Proc. 12th International Conference Reliability and Statistics in Transportation and Communication,
Lomonosova, Oct. 2012. [22] V. S. Ghomsheh, M. A. Shoorehdeli, and M. Teshnehlab,
"Training anfis structure with modified pso algorithm," in Proc.
15th Mediterranean Conference on control & Automation, Athens
– Greece, July 2007.
[23] M. Mehrabi and S. M. Pesteei, "An adaptive neuro-fuzzy
inference system (anfis) modelling of oil retention in a carbon dioxide air-conditioning system," in Proc. International
Refrigeration and Air Conditioning Conference, Iran, July 2010.
Harsh J. Amin holds a degree of bachelor of Civil Engineering from Gujarat University
located at Ahmedabad, India in 2011. He is pursuing in his final year of M.Tech from
Indian Institute of Technology Guwahati,
India in Transportation System Engineering. His M.Tech thesis is related to gap
acceptance study at uncontrolled intersection
in case of mixed traffic condition and weak lane discipline. He is engaged in this study
since last one year. Mr. Amin has student memberships of Institute of
Transportation Engineering (ITE) and American society of Civil Engineering (ASCE).
Rutvij N. Desai holds a degree of bachelor of Civil Engineering and master of Engineering
in Transportation from Gujarat University
located at Ahmedabad, India in 2011 and 2013 respectively. He has conducted research
during his masters on pedestrian modelling.
Since few months, he is engaged with one of the leading Transportation Company of India
as an Asst. Engineer. He is student member
of Indian Road Congress (IRC).
Journal of Traffic and Logistics Engineering Vol. 2, No. 4, December 2014
269©2014 Engineering and Technology Publishing
Priyesh S. Patel is pursuing his Bachelor of
Technology in Computer Engineering from
Nirma University located at Ahmedabad,
India. His project is on Neural Network and optimization technique. He is engaged with
his project since last few months. He
developed this skills during his project time and he is awarded by some leading
companies of IT sectors for his works and
technical skills.
Journal of Traffic and Logistics Engineering Vol. 2, No. 4, December 2014
270©2014 Engineering and Technology Publishing