Modelling the cost of gas supply outages and their substitution as … · 2017-11-14 · Modelling...
20
Modelling the cost of gas supply outages and their substitution as a way of assessing Security of Supply Measures Presentation to the 2 nd AIEE Energy Symposium “Current and Future Challenges to Energy Security” Sergio Ascari Gas Advisor, Florence School of Regulation Senior Consultant, ref4e Rome, 3 November 2017 1
Transcript of Modelling the cost of gas supply outages and their substitution as … · 2017-11-14 · Modelling...

Modelling the cost of gas supply outages and their substitution as a way of
assessing Security of Supply Measures
Presentation to the 2nd AIEE Energy Symposium
“Current and Future Challenges to Energy Security”
Sergio Ascari
Gas Advisor, Florence School of Regulation
Senior Consultant, ref4e
Rome, 3 November 20171

Acknowledgments
• The paper is based on the methodological part of an empirical Study on “The role of gas storage in internal market and in ensuring security of supply”
• Carried out by ref4e (Italy), E-Bridge (Germany) and AF-Mercados (Spain) on behalf of the Energy Commission (DG Energy)
• Based on previous “Stress Tests” by ENTSO-G
• Full Study available on http://ec.europa.eu/energy/en/studies
• Full financial support of the European Commission is gratefully acknowledged
• Any responsibility is only with the author. The European Commission is by no means responsible for the methodology and results.
2

Security of Supply: from policy principle to practical assessment of Measures
• Security of Supply, notably for natural gas, is one of the pillars of European energy policy and the subject of a (recently amended) EU Regulation (2017/1938)
• It can be pursued by several Measures: Expansion of storage sites and inventories
Enhancement of reverse flow capacity
Construction of alternative pipelines or LNG terminals
Energy efficiency
Resort to alternative fuels
• Do benefits of Measures aimed at SoS enhancement outweigh their costs?
3

Security of Supply: Benefits vs. Costs
• The evaluation of costs of (infrastructure-related) measures can be performed by methodologies that are well known to companies and regulators
• Benefits of SoS Measures mostly amount to avoided cost of disruptions, which typically include : purchase of spot supplies (mostly LNG);
resort to alternative, usually more costly and/or polluting energy sources (electricity, LPG, fuel oil, coal, fuelwood);
in extreme cases, the outage of energy supply, with industry activity halted and people left “in the cold”.
• Traditional Cost-Benefit Analysis: Measures worth if: (Avoided cost of Outage) x (Prob. of Outage) > (Cost of Measures)
4

Evaluating costs of missing gas replacement
• ENTSOG’s 2014 Study showed that in the worst considered case (6-month all-Russian disruption): 42% replaced by domestic production, pipeline
contract margins and storage, at low incremental costs
35% of missing gas replaced by (mostly spot) LNG;
22% gas deficit, mostly covered by alternative sources;
• However, LNG and other market-traded gas resources tend to “overshoot” in case of supply disruptions or demand shocks, as shown by past crisis cases
5

6
Price impact of gas crisis: Katrina 2005
Figure 4.3.3. Evolution of US gas production and Henry Hub spot prices after the
Katrina hurricane
Source: EIA
Katrina

7
Figure 4.3.5. Evolution of monthly gas imports in EU27 and Dutch and Italian spot
prices
Source: Platts and Eurostat
Ukrainian crisis Jan.
2009
Price impact of gas crisis: Ukraine 2009

8
Price impact of gas crisis: Fukushima 2011
Figure 4.3.4. Evolution of LNG prices and LNG imports in Japan
Source: Analysis on World Gas Intelligence data

Gas price modelling
• Study simulates price hikes, by means of an econometric model of gas hub prices
• Econometric models of hub prices already developed for U.S. markets (Brown & Yücel, 2008)
• Ref4e estimated similar models for TTF, PSV
• Main explanatory variables: Oil prices
Storage changes
Temperatures (as degree-days)
Supply shocks (e.g. 2009 Ukraine crisis)
9

Gas price econometric model
10
Constant 2.702528
TTF Day Ahead Prices 0.247526
Brent price (lagged 3 months)
0.023917
Ukraine January 2009 crisis supply loss
-0.078791
12th monthly differences of German storage filling level
3.171682
Average degree days (NW Europe)
0.005019

Gas price modelling of crises: simulation• In Europe, over 90% of non-Russian gas is now priced at hubs• World LNG market not perfect regional spikes possible
11
Model simulation of September-February and Februaryonly disruptions of all Russian supplies 2014-15

Valuation of missing gas (lost load)
1. End user price as a measure of gas value
Includes gas transmission and distribution cost 50 €/MWh
“Floor” evaluation: does not include consumer surplus
2. Value of alternative fuels (e.g. light fuel oil, electricity)
Consumers typically use them where gas is not available
Adjusted by (differential) environmental cost 90-300 €/MWh
3. UK Contingent Valuation Study of VOLL for electricity
On a per/kWh basis, adjusted by per capita income and national consumption level 200-700 €/MWh
12

The probability of disruptions
• Costs of SoS Measures are certain, but disruptions are not
• Balance of benefits and costs depends on the probability of disruption
• Historically, unplanned disruptions are limited and rare (less than 0.5% of expected supplies from outside EU)
• Probability can be “weighted” by adding risk aversion or by more sophisticated approaches to probability
Beyond scope of presentation, not common in CBA
• Otherwise, researchers may calculate break-even probability, yielding pB = C
13

Example: Assessment of storage based Measures
• Based on ENTSOG results @ EU level (+CH-Baltics)
• Simulation: LNG & hub prices to follow model forecasts, based on average Brent prices of last 15 years
• Simulating generalization of different levels of Mandatory inventories or Strategic storage
• Assuming replacement of missing gas in case of crisis by:
LNG+Norway (estimated by econometric model of hub price or oil-related)
Alternative fuel (coal or light fuel oil, LFO) in power stations, where generation capacity is available (based on ENTSO-E data)
Coal/LFO cost corrected by (differential) environmental cost and transformation efficiency @ 2014 prices: 87-101 €/MWh
For any further missing gas, load loss cost estimated at 150-350 €/MWh (income & climate-adjusted from a UK Study)
14

Estimated Costs of Supply Replacement
15
ReplacementOption
Potential role(ENTSOG 2014 Study)*
Evaluation approach
Average cost of simulated year(€/MWh)
EU production 4% Market price 24.5
Pipeline imports 10% Contract price 23.3
Storage 28% Market pricebefore crisis
21.4
LNG spot 35% Market price 24.5
Light fuel oil 22% Market price + external cost diff.
87
Coal .. Market price + external cost diff.
99
No replacement .. Cost of lost loadUK adjusted by per capita GDP
150 - 350
(*) Based on worst scenario: 6-month Russian supply disruption, September-February, average winter condition with a 14-day cold spell in February

Assessment of storage based Measures: Main Results
• Balance of benefits and costs depends on the probability of disruption, prudently assumed at
2% : 6-month all Russian supplies followed by cold spell
10%: 1-month Russian supply transit through Ukraine
• Costs of generalised Storage Measures are always larger than probability weighted benefits @EU level
• Benefit-costs balance even worse for increased strategic storage
• Generalisation of strategic storage (as currently required in Italy and Hungary) would be cost-effective only with a 26% probability
16
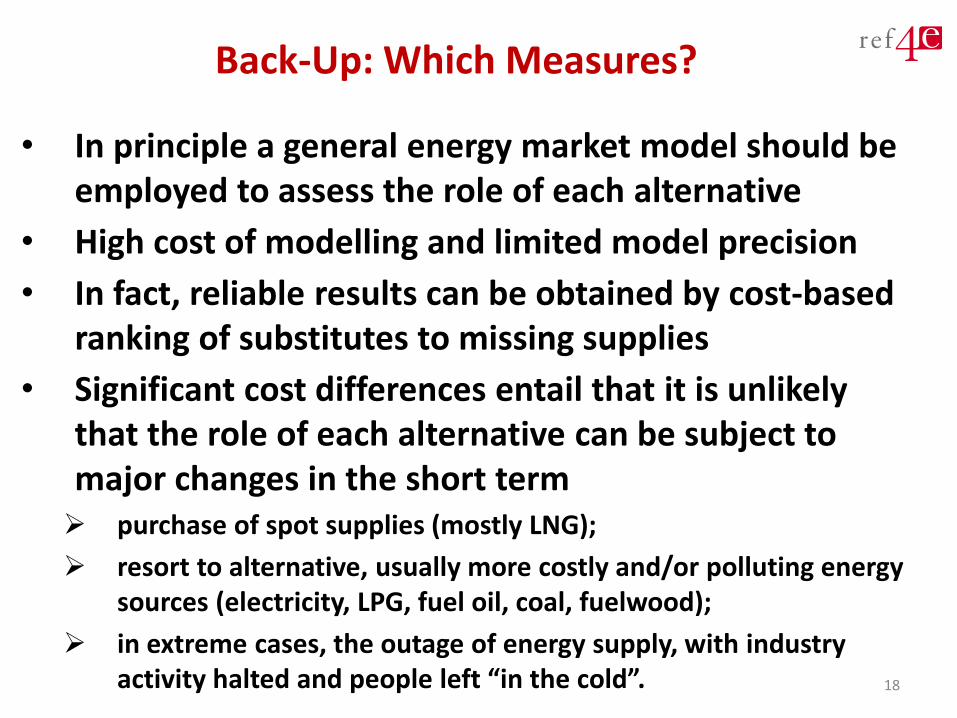
Back-Up: Which Measures?
• In principle a general energy market model should be employed to assess the role of each alternative
• High cost of modelling and limited model precision
• In fact, reliable results can be obtained by cost-based ranking of substitutes to missing supplies
• Significant cost differences entail that it is unlikely that the role of each alternative can be subject to major changes in the short term purchase of spot supplies (mostly LNG);
resort to alternative, usually more costly and/or polluting energy sources (electricity, LPG, fuel oil, coal, fuelwood);
in extreme cases, the outage of energy supply, with industry activity halted and people left “in the cold”. 18

ENTSOG Stress Tests: expected deficit under worst scenario
19

Backup: Gas price modelling for legacy contracts
• LNG and pipeline supply (Norway, partly Russia) in competitive and liquid markets to follow hub prices
• LNG & pipeline prices oil-related in other markets (estimated by Ref4E econometric models)
• Mix of oil- and hub-related prices used for each supply point, in line with best known information (IGU and research information)
• Oil prices unaffected by gas disruption scenarios
20