Modelling the control of epidemics by behavioural changes in response to awareness of disease Savi...
27
Modelling the control of epidemics by behavioural changes in response to awareness of disease Savi Maharaj (joint work with Adam Kleczkowski) University of Stirling
-
date post
21-Dec-2015 -
Category
Documents
-
view
213 -
download
0
Transcript of Modelling the control of epidemics by behavioural changes in response to awareness of disease Savi...
Modelling the control of epidemics by behavioural changes in
response to awareness of disease
Savi Maharaj(joint work with Adam Kleczkowski)
University of Stirling
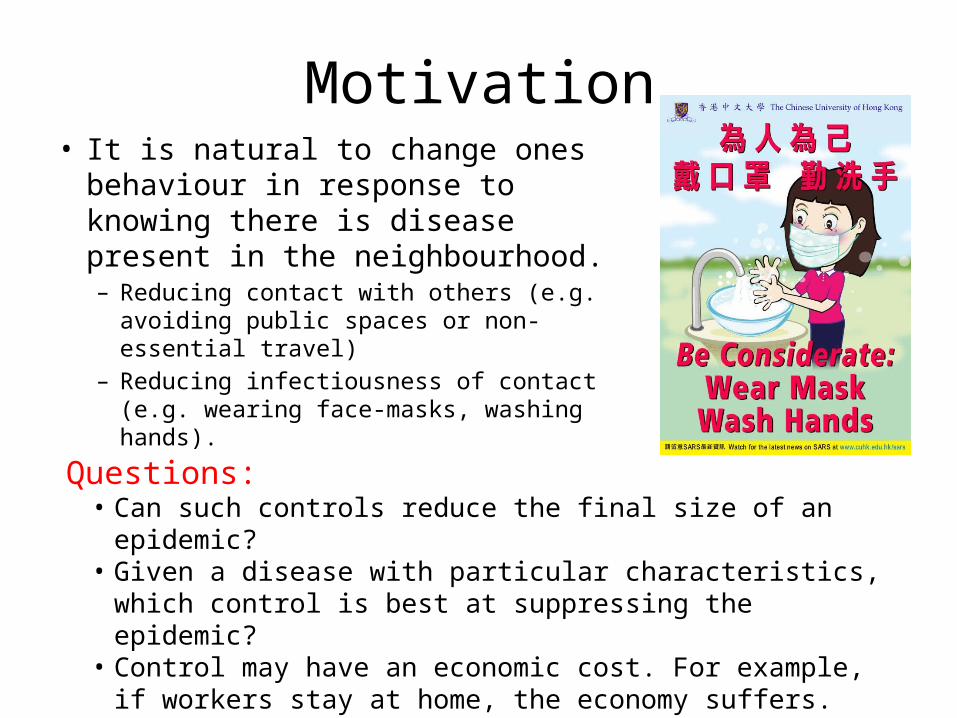
Motivation• It is natural to change ones
behaviour in response to knowing there is disease present in the neighbourhood. – Reducing contact with others (e.g. avoiding
public spaces or non-essential travel) – Reducing infectiousness of contact (e.g.
wearing face-masks, washing hands).Questions: • Can such controls reduce the final size of an epidemic? • Given a disease with particular characteristics, which control is best at
suppressing the epidemic?• Control may have an economic cost. For example, if workers stay at
home, the economy suffers. Which response yields the best cost/benefit tradeoff?
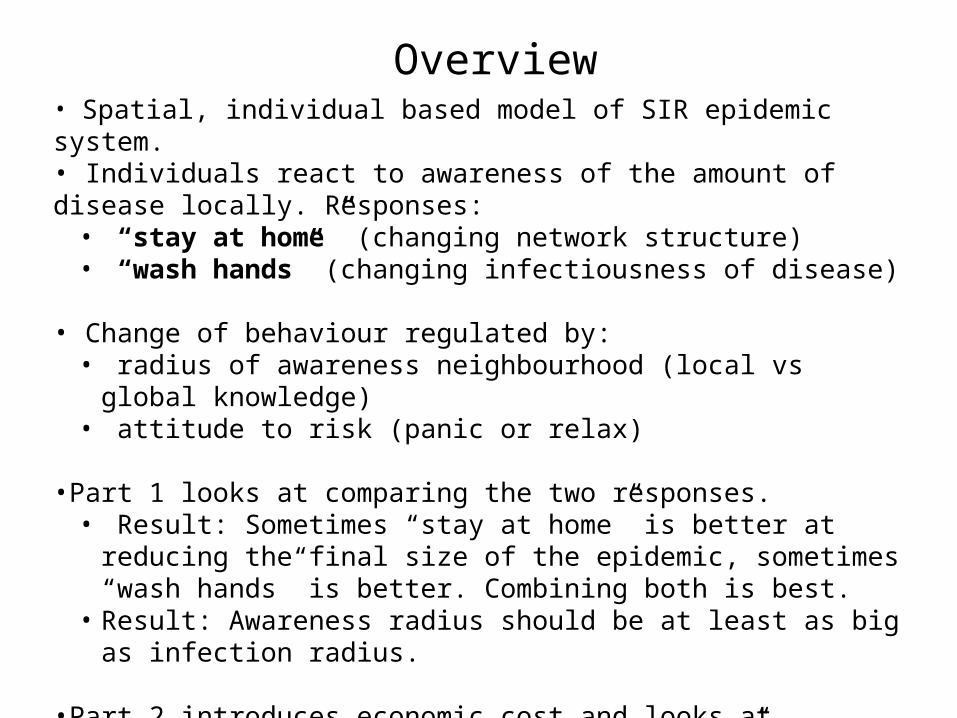
Overview• Spatial, individual based model of SIR epidemic system.• Individuals react to awareness of the amount of disease locally. Responses: • “stay at home” (changing network structure)• “wash hands” (changing infectiousness of disease)
• Change of behaviour regulated by:• radius of awareness neighbourhood (local vs global knowledge)• attitude to risk (panic or relax)
•Part 1 looks at comparing the two responses.• Result: Sometimes “stay at home” is better at reducing the final size of
the epidemic, sometimes “wash hands” is better. Combining both is best.• Result: Awareness radius should be at least as big as infection radius.
•Part 2 introduces economic cost and looks at cost/benefit tradeoff for the “stay at home” response:• Result: If epidemic can be suppressed, panic! Otherwise, relax.
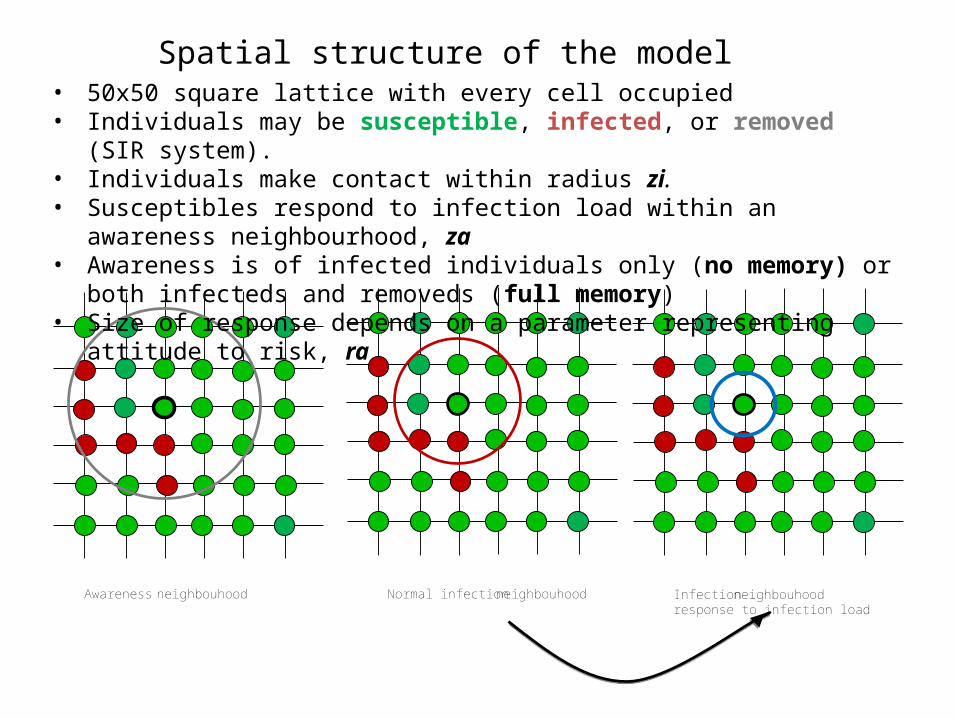
Awareness neighbouhood Normal infection neighbouhood Infection neighbouhoodresponse to infection load
• 50x50 square lattice with every cell occupied• Individuals may be susceptible, infected, or removed (SIR system).• Individuals make contact within radius zi.• Susceptibles respond to infection load within an awareness neighbourhood, za• Awareness is of infected individuals only (no memory) or both infecteds and
removeds (full memory)• Size of response depends on a parameter representing attitude to risk, ra
Spatial structure of the model
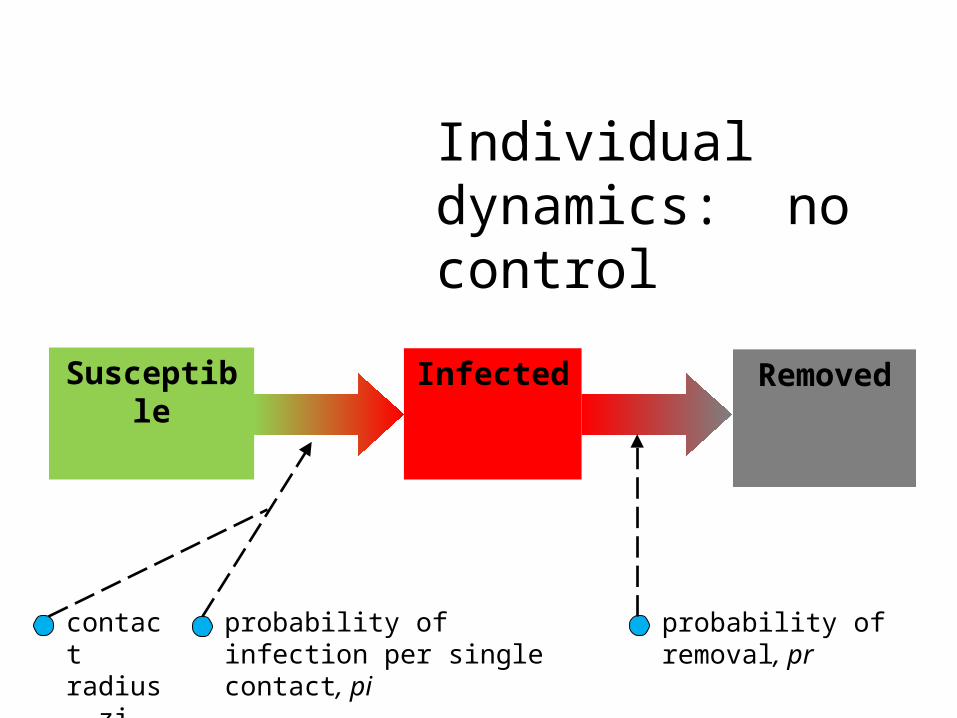
Susceptible
Infected Removed
probability of infection per single contact, pi
probability of removal, pr
Individual dynamics: no control
contact radius, zi
Susceptible contact radius,
zi
Infected Removed
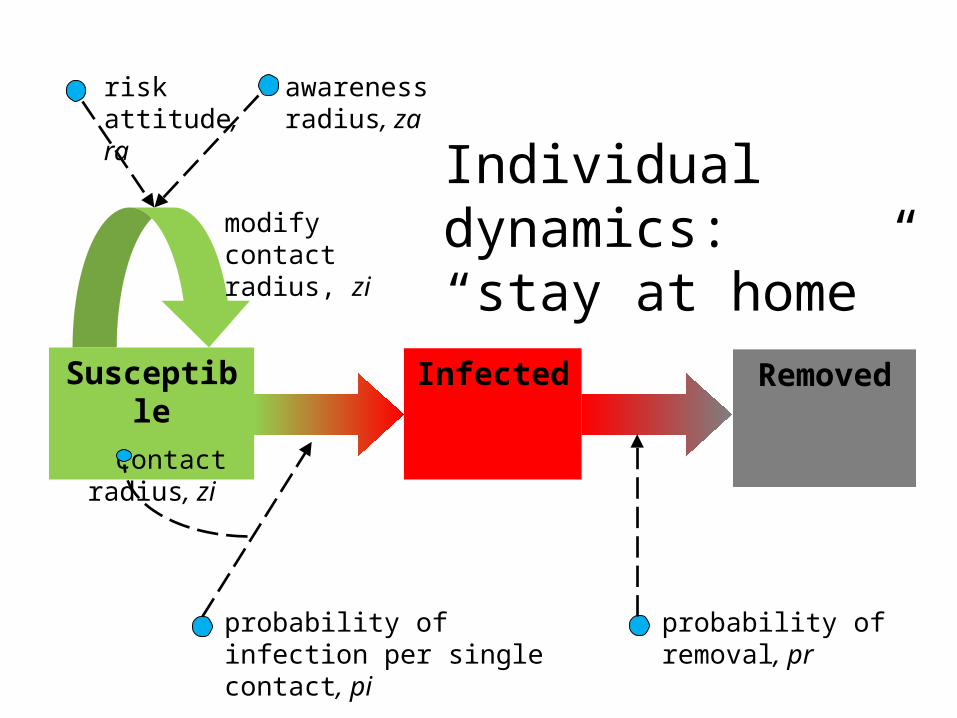
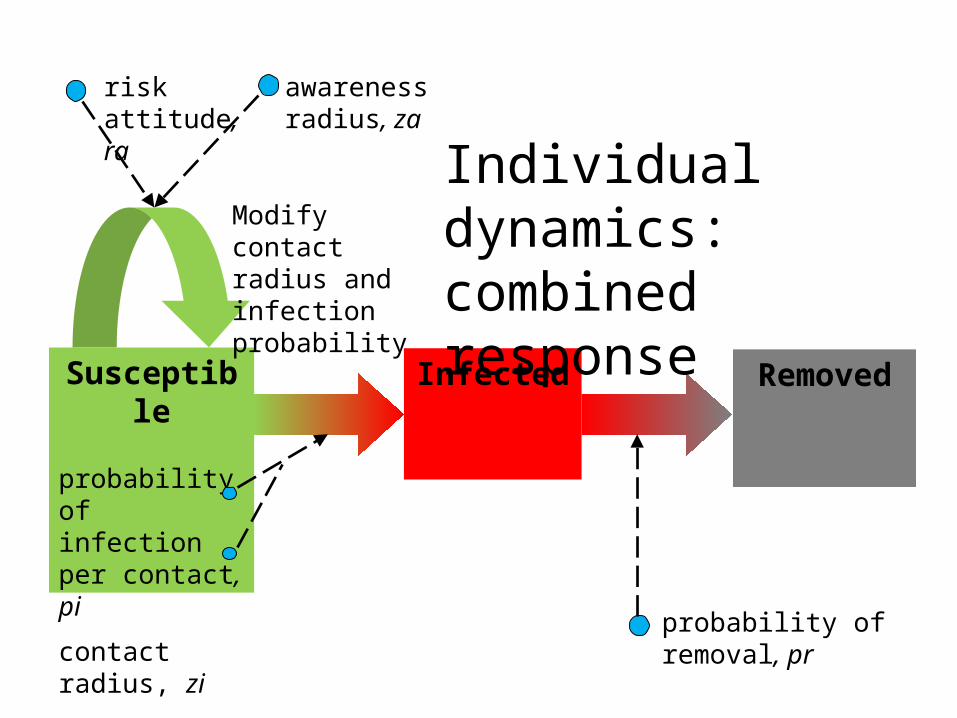
awareness radius, za
probability of infection per single contact, pi
probability of removal, pr
risk attitude, ra
modify contact radius, zi
Individual dynamics: “stay at home”
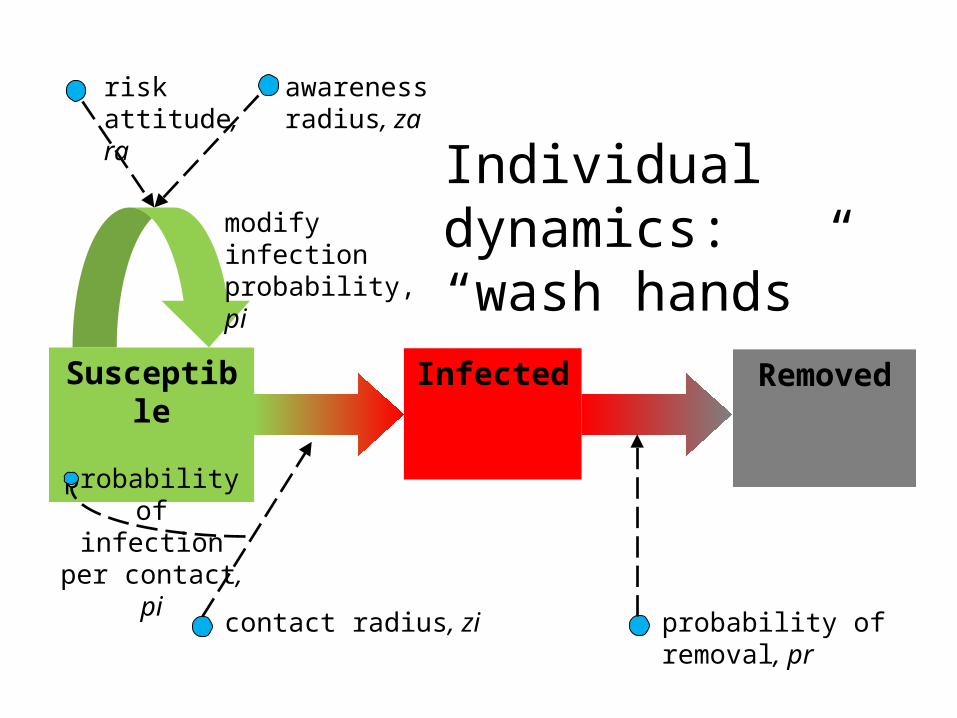
Susceptible probability of infection per
contact, pi
Infected Removed
awareness radius, za
contact radius, zi probability of removal, pr
risk attitude, ra
modify infection probability, pi
Individual dynamics: “wash hands”
Susceptible probability of infection per contact, pi
contact radius, zi
Infected Removed
awareness radius, za
probability of removal, pr
risk attitude, ra
Modify contact radius and infection probability
Individual dynamics: combined response
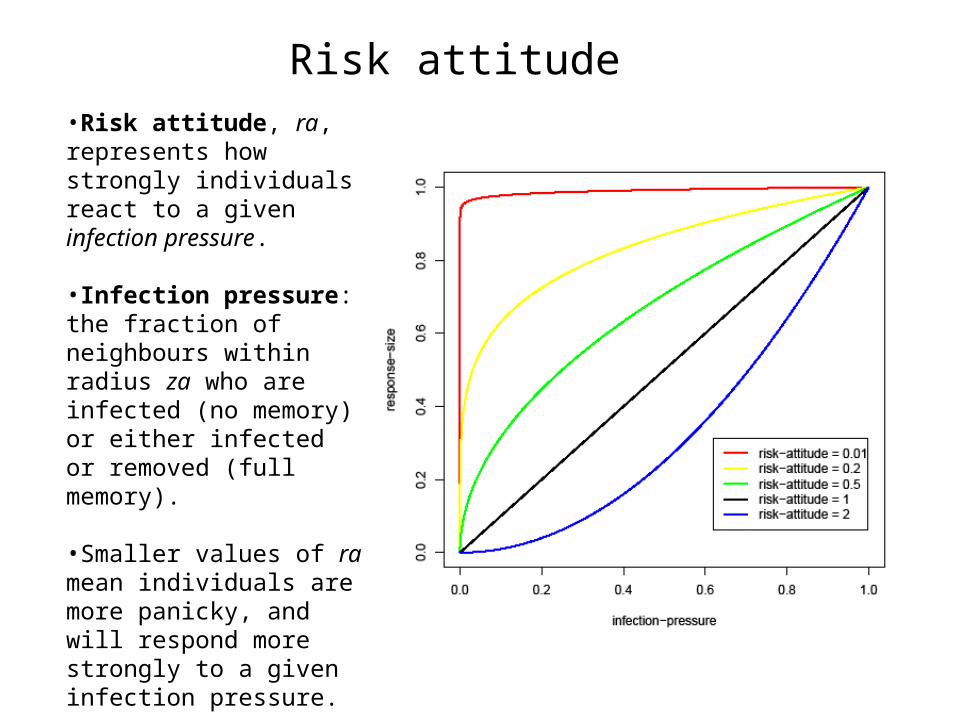
Risk attitude•Risk attitude, ra, represents how strongly individuals react to a given infection pressure.
•Infection pressure: the fraction of neighbours within radius za who are infected (no memory) or either infected or removed (full memory).
•Smaller values of ra mean individuals are more panicky, and will respond more strongly to a given infection pressure.
•Larger values of ra mean that individuals are more relaxed and have a weaker response.
Tools
• Simulations created with NetLogo http://ccl.northwestern.edu/netlogo/
• Experiments executed on a network of PC workstations via Condor http://www.cs.wisc.edu/condor/
• Data analysed with the R statistical tool http://www.r-project.org/
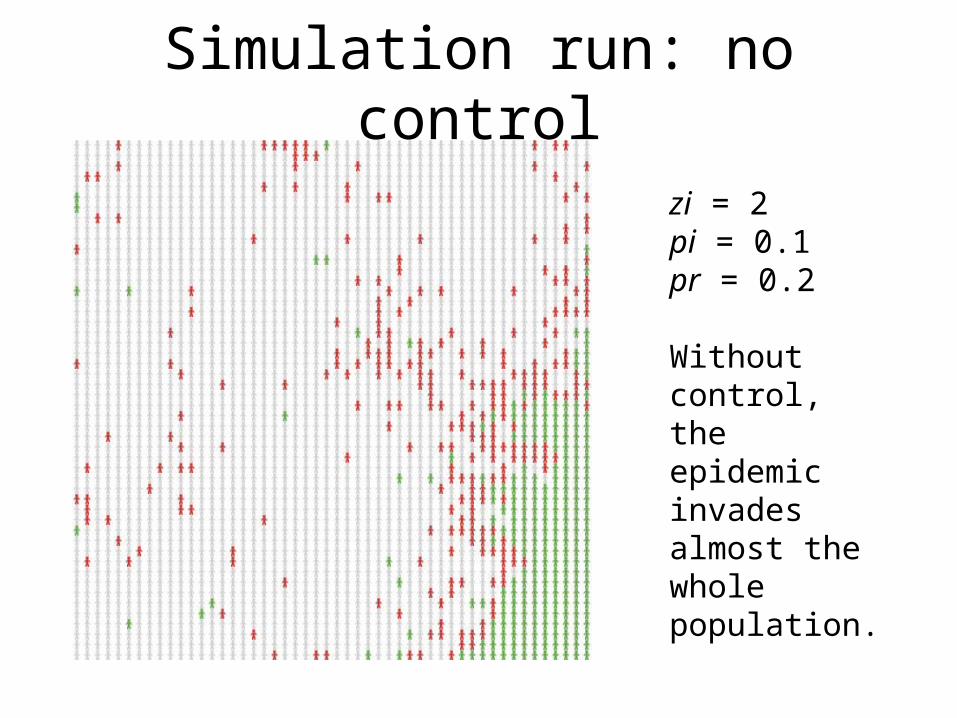
Simulation run: no control
zi = 2pi = 0.1pr = 0.2
Without control, the epidemic invades almost the whole population.
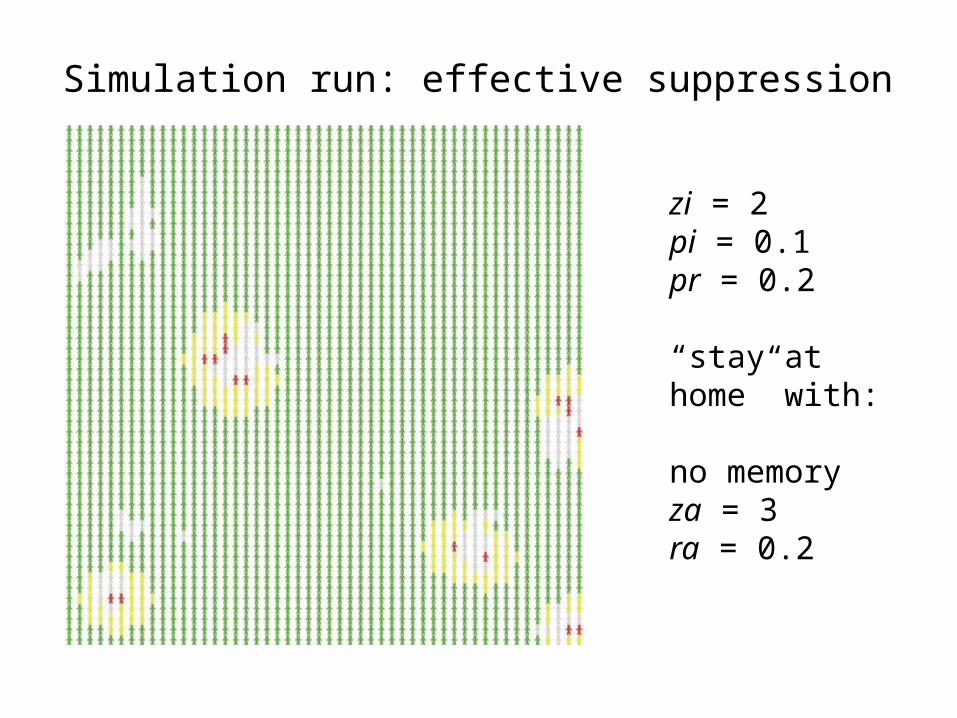
Simulation run: effective suppression
zi = 2pi = 0.1pr = 0.2
“stay at home” with:
no memoryza = 3ra = 0.2
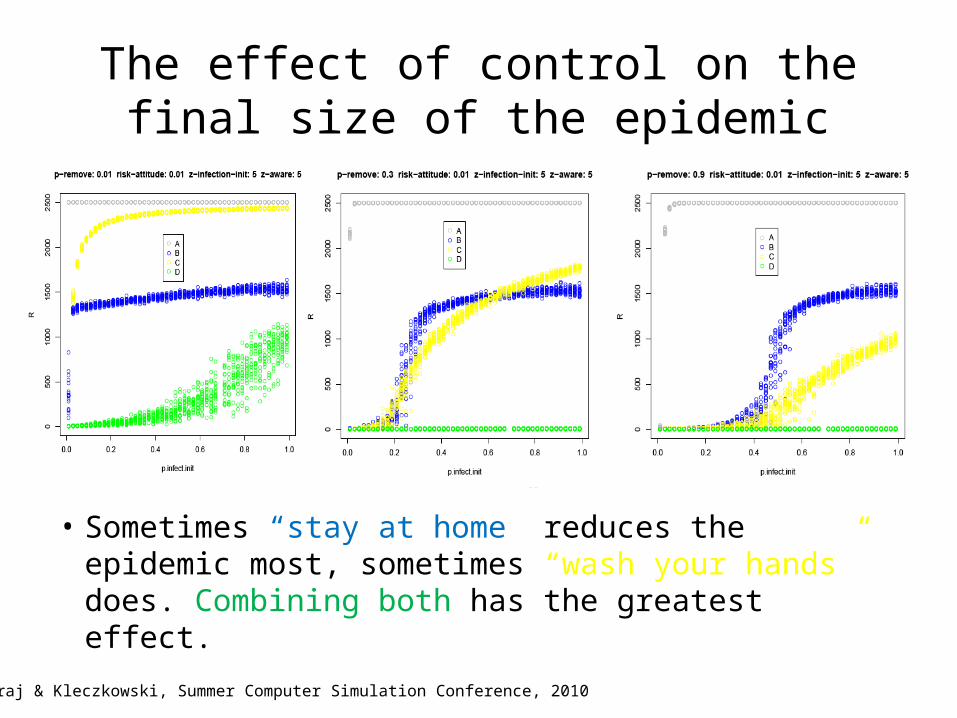
The effect of control on the final size of the epidemic
• Sometimes “stay at home” reduces the epidemic most, sometimes “wash your hands” does. Combining both has the greatest effect.
Maharaj & Kleczkowski, Summer Computer Simulation Conference, 2010
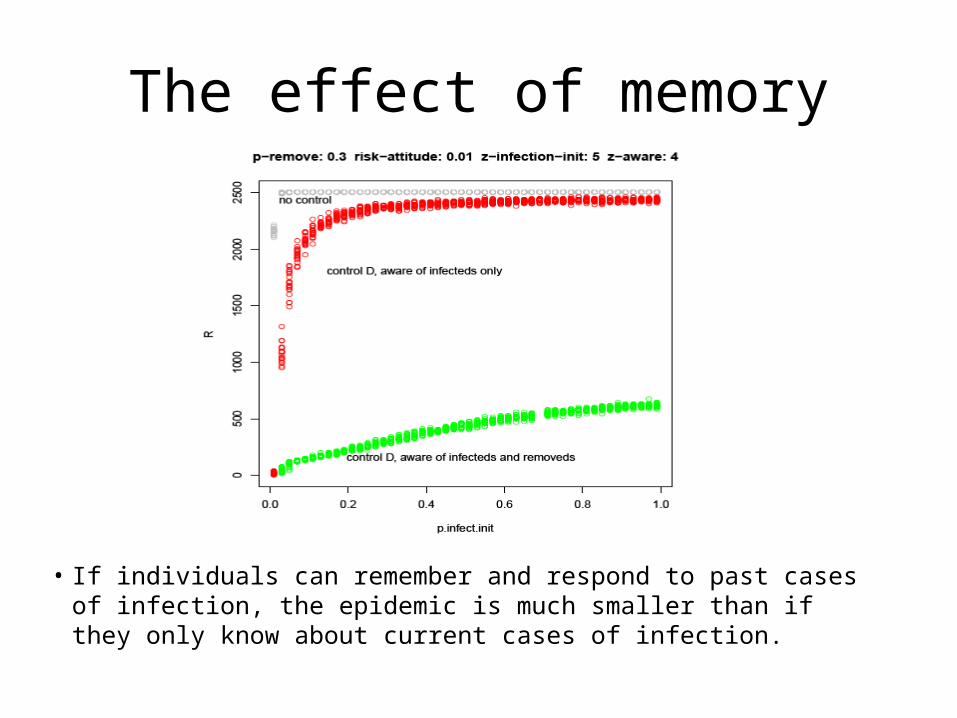
The effect of memory
• If individuals can remember and respond to past cases of infection, the epidemic is much smaller than if they only know about current cases of infection.
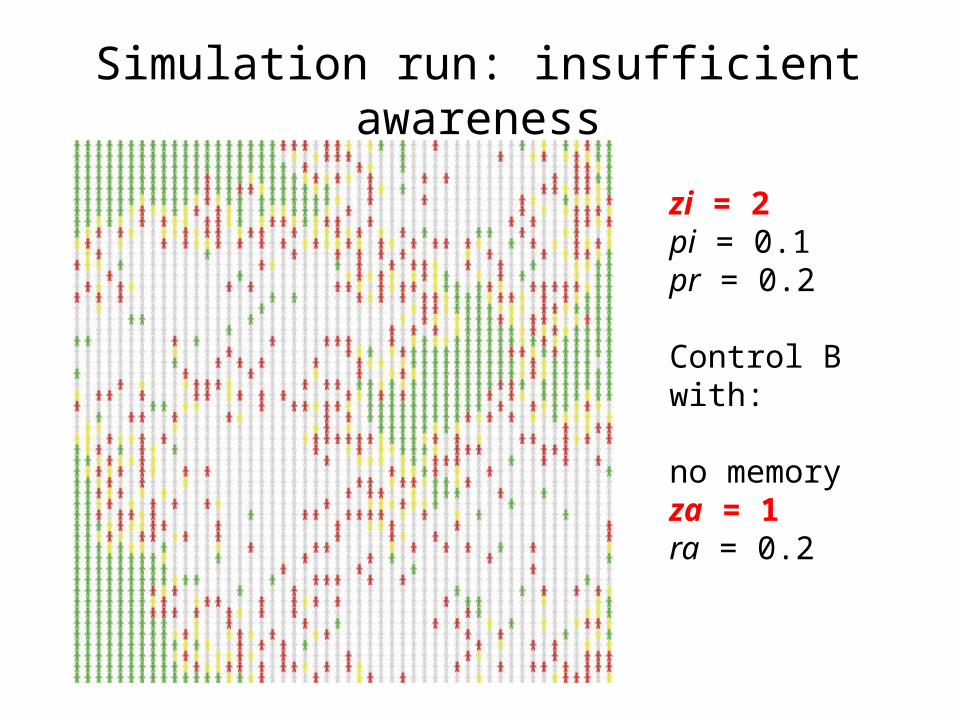
Simulation run: insufficient awareness
zi = 2pi = 0.1pr = 0.2
Control B with:
no memoryza = 1ra = 0.2
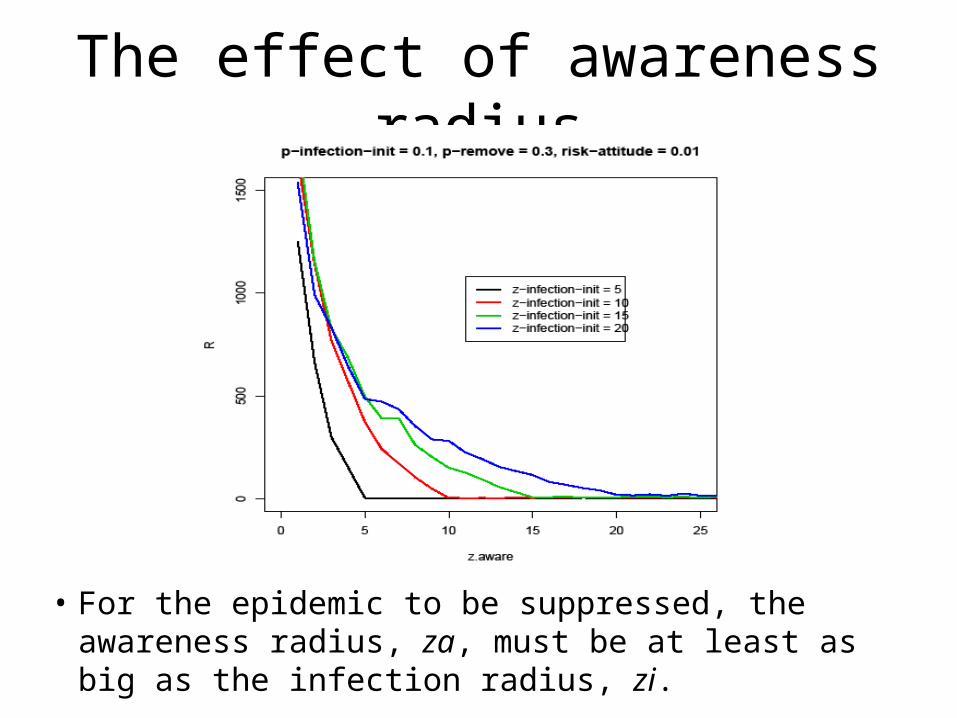
The effect of awareness radius
• For the epidemic to be suppressed, the awareness radius, za, must be at least as big as the infection radius, zi.
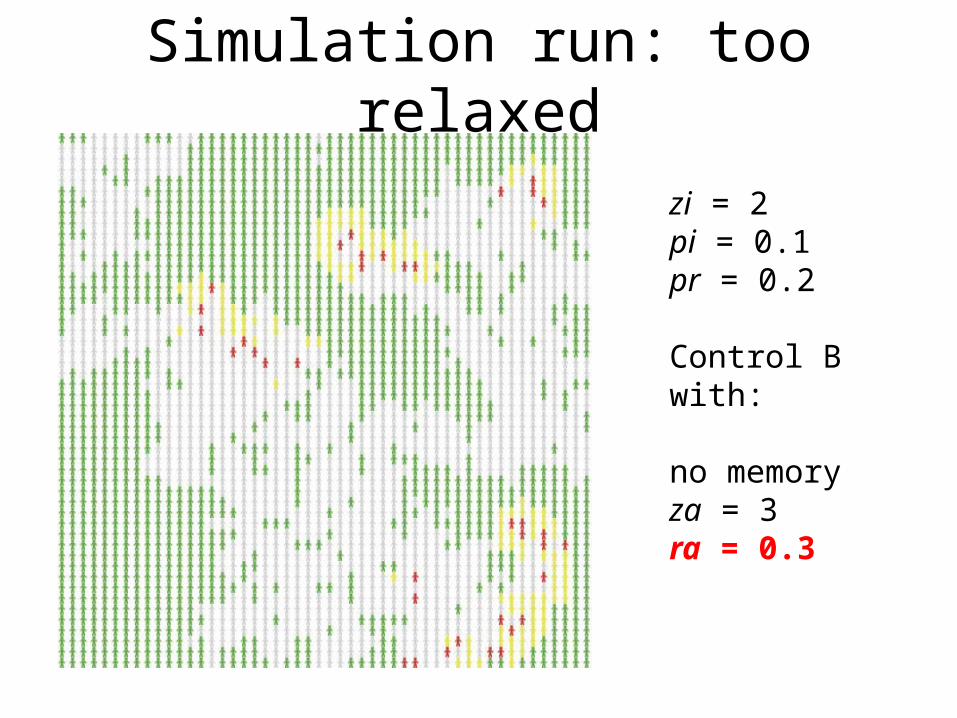
Simulation run: too relaxed
zi = 2pi = 0.1pr = 0.2
Control B with:
no memoryza = 3ra = 0.3
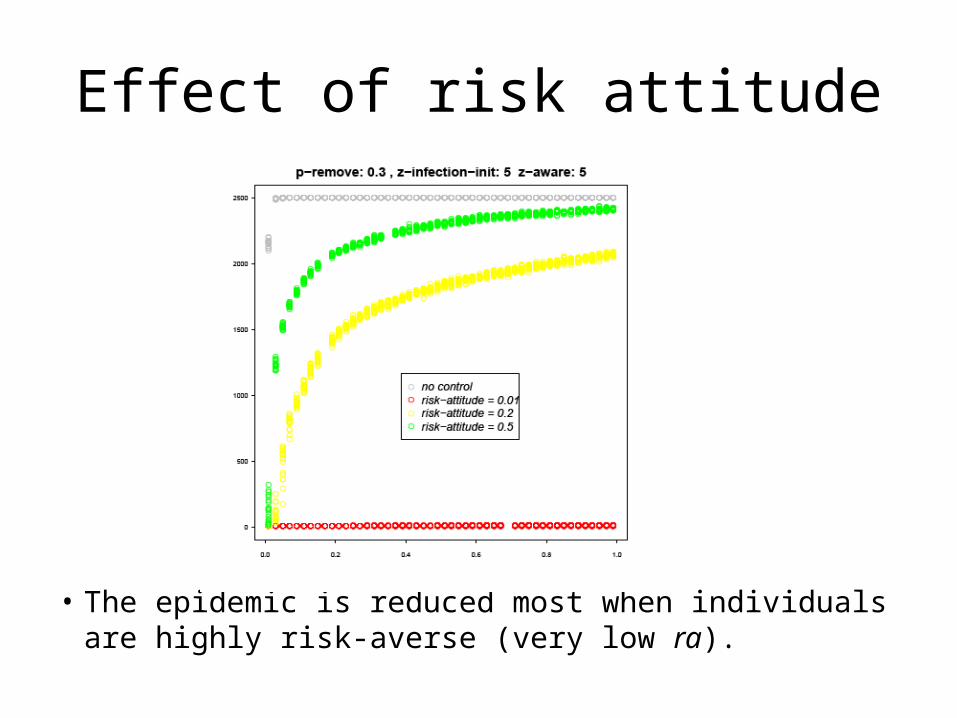
Effect of risk attitude
• The epidemic is reduced most when individuals are highly risk-averse (very low ra).
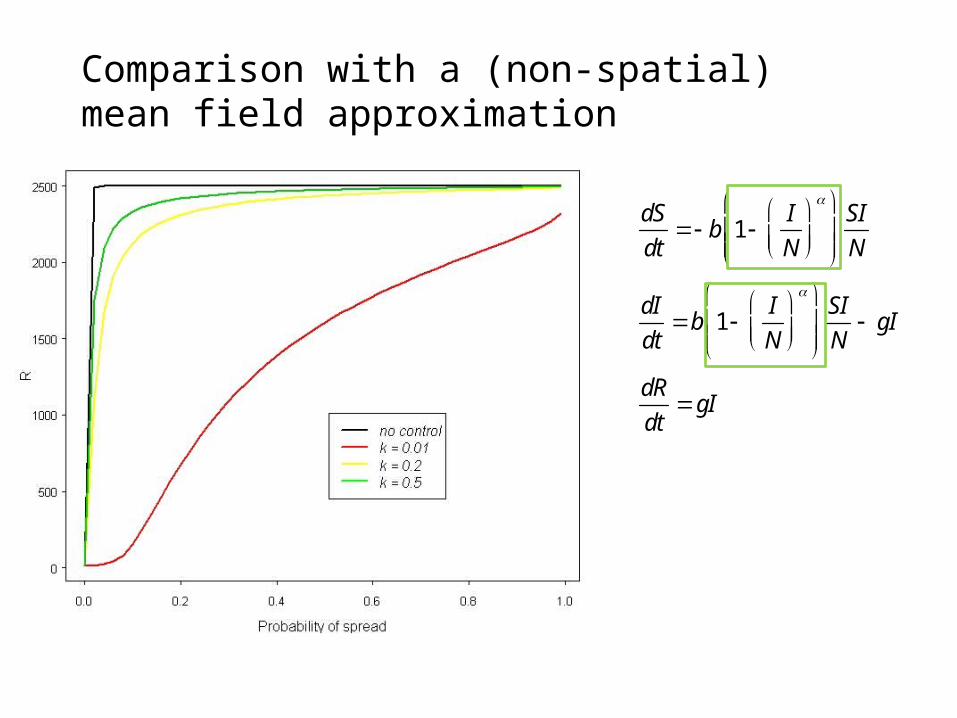
dS
dt b 1
I
N
SI
N
dI
dtb 1
I
N
SI
N gI
dR
dtgI
Comparison with a (non-spatial) mean field approximation
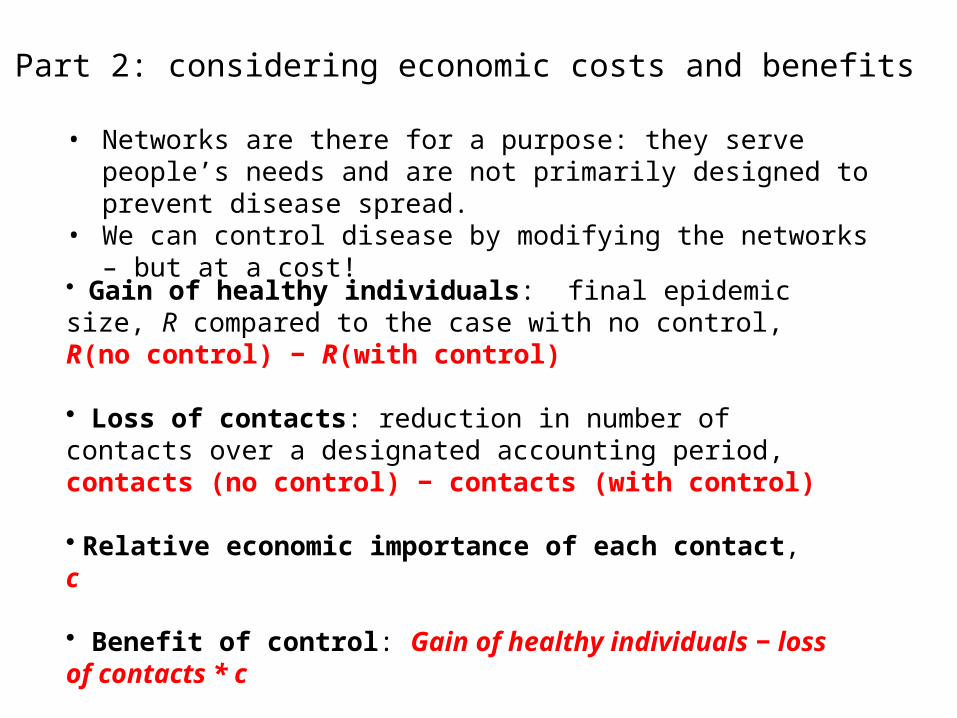
Part 2: considering economic costs and benefits
• Networks are there for a purpose: they serve people’s needs and are not primarily designed to prevent disease spread.
• We can control disease by modifying the networks – but at a cost!
• Gain of healthy individuals: final epidemic size, R compared to the case with no control, R(no control) − R(with control)
• Loss of contacts: reduction in number of contacts over a designated accounting period, contacts (no control) − contacts (with control)
• Relative economic importance of each contact, c
• Benefit of control: Gain of healthy individuals − loss of contacts * c
0.0 0.2 0.4 0.6 0.8 1.0
0
500
1000
1500
2000
2500
pi
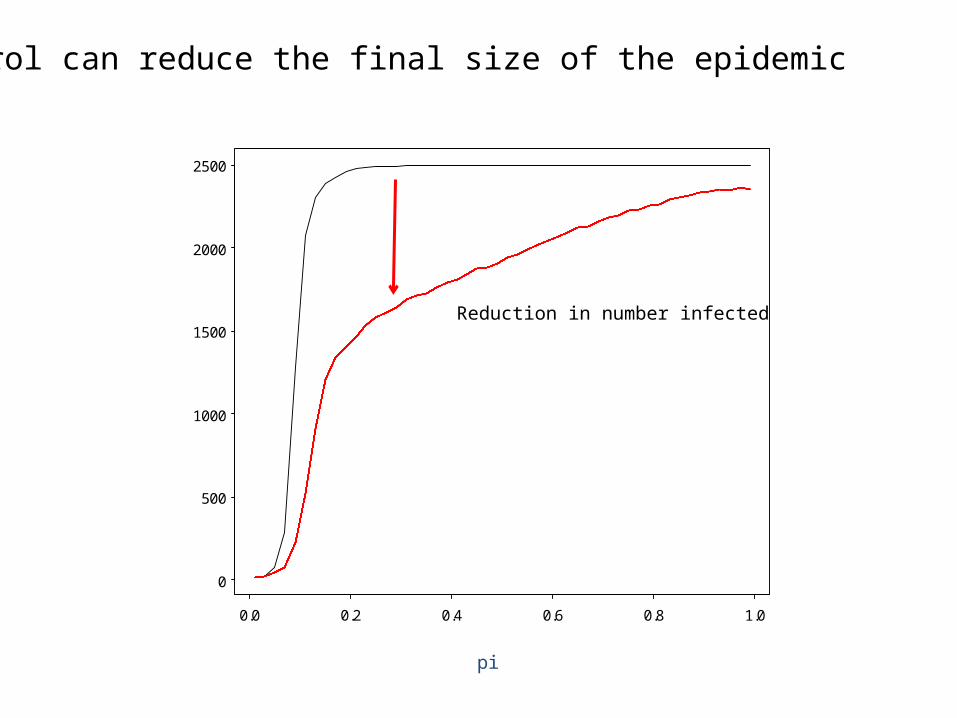
Control can reduce the final size of the epidemic
Reduction in number infected
0.0 0.2 0.4 0.6 0.8 1.0
11000
12000
13000
14000
15000
pi
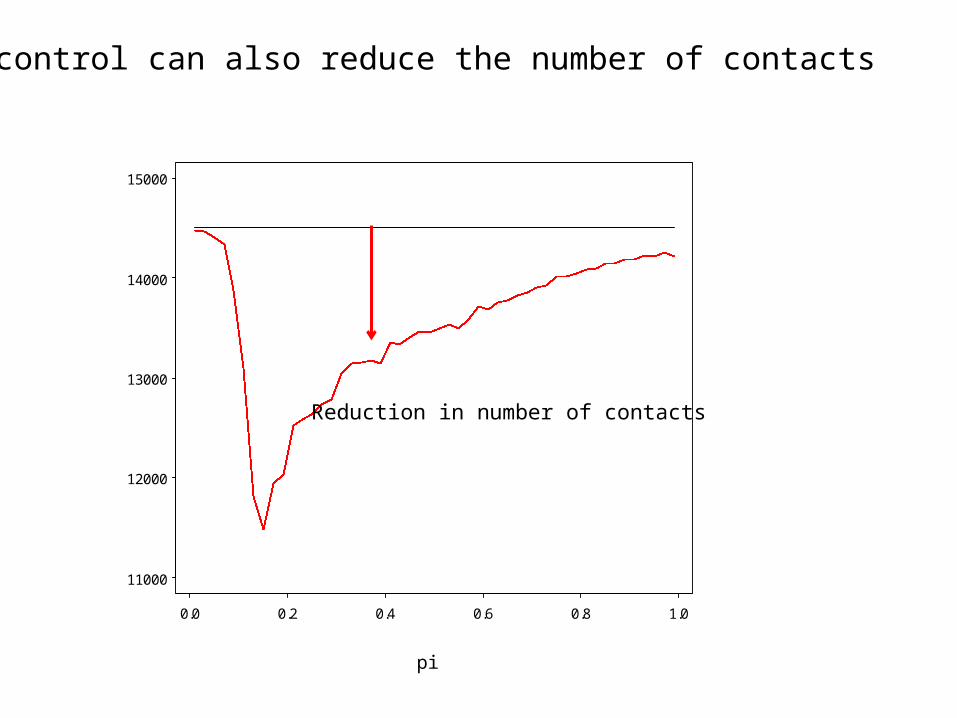
But control can also reduce the number of contacts
Reduction in number of contacts
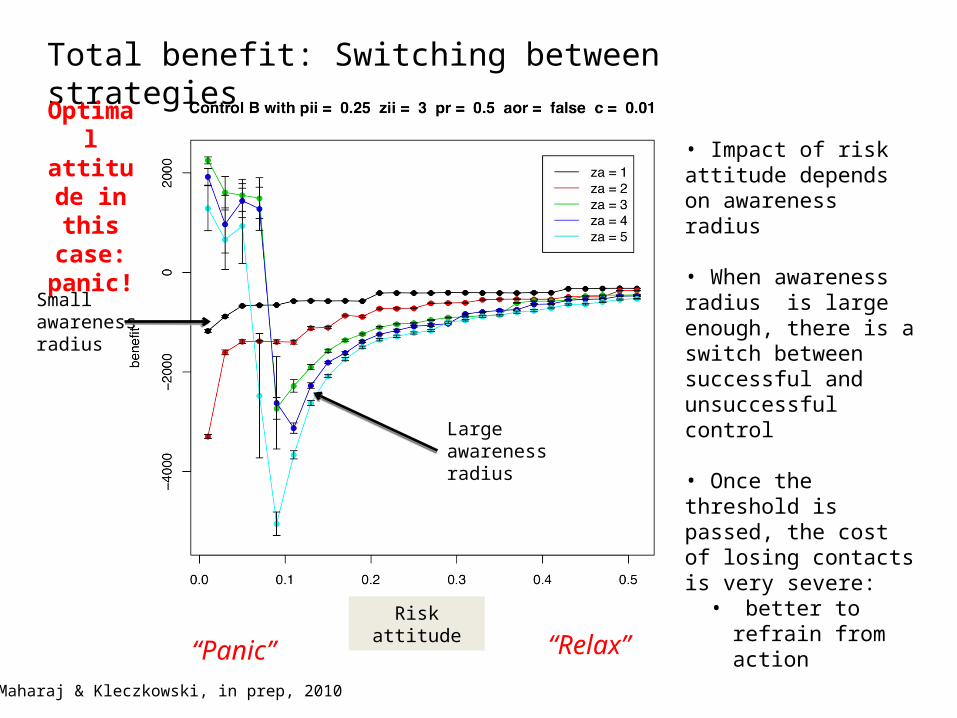
“Panic” “Relax”
Total benefit: Switching between strategies
Risk attitude
Optimal attitude in this case:
panic!
Small awareness radius
Largeawareness radius
• Impact of risk attitude depends on awareness radius
• When awareness radius is large enough, there is a switch between successful and unsuccessful control
• Once the threshold is passed, the cost of losing contacts is very severe:• better to refrain
from action
Maharaj & Kleczkowski, in prep, 2010
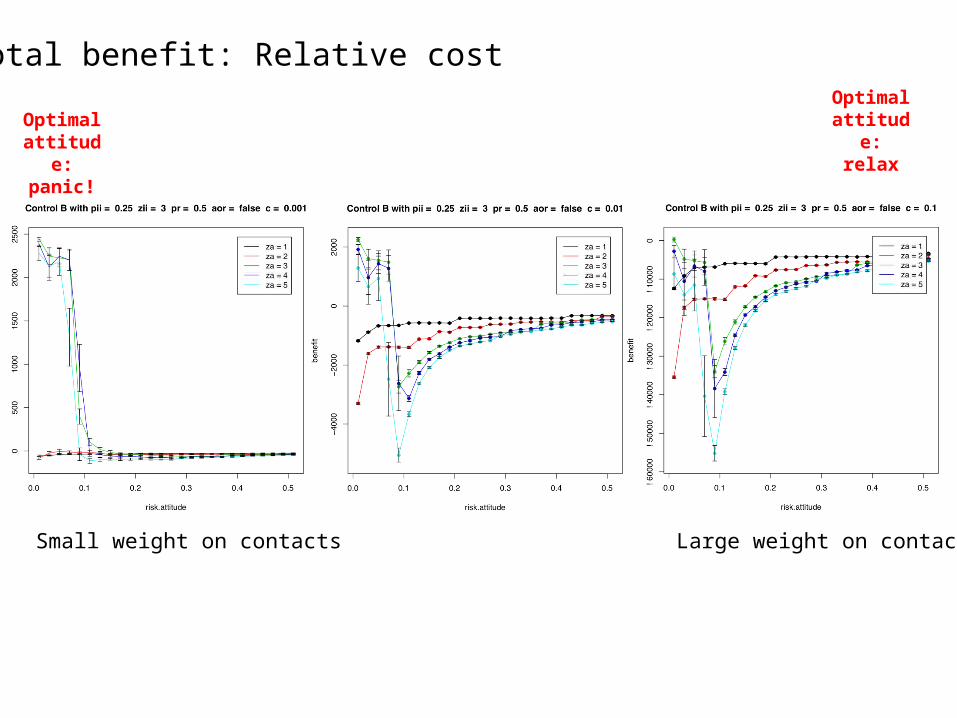
Total benefit: Relative cost
Optimal attitude:
panic!
Optimal attitude:
relax
Small weight on contacts Large weight on contacts
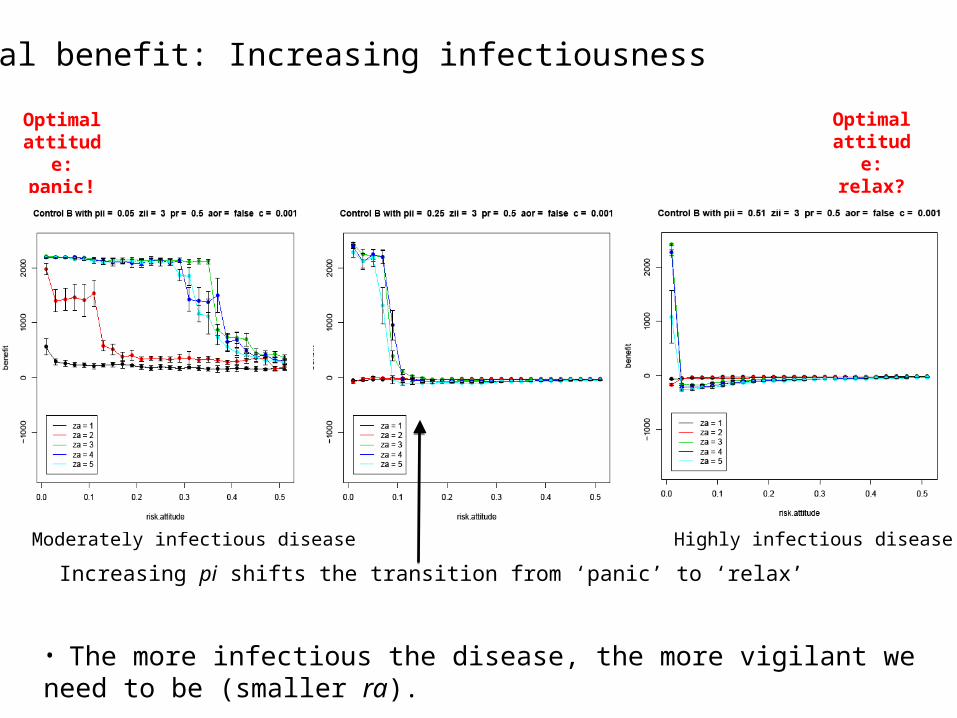
Increasing pi shifts the transition from ‘panic’ to ‘relax’
Total benefit: Increasing infectiousness
Optimal attitude:
panic!
Optimal attitude:
relax?
Moderately infectious disease Highly infectious disease
• The more infectious the disease, the more vigilant we need to be (smaller ra).
Conclusions and future work• Some intriguing results so far - further examination
needed!• Extend cost-benefit analysis to “wash hands” control• Examine different contact networks (small-world, scale-
free,…)• Validation against data from real epidemics (Can you
help us get such data?)• Formalization of model in process algebra.
– Are current PAs sufficiently expressive? • More accurate mean-field approximation (perhaps
using pair-approximation techniques?)

Thank you!