Modelling retention in liquid chromatography as a function...
13
Journal of Chromatography A, 869 (2000) 27–39 www.elsevier.com / locate / chroma Modelling retention in liquid chromatography as a function of solvent composition and pH of the mobile phase 1 * ´ ´ Rosa Berges , Victoria Sanz-Nebot, Jose Barbosa Department of Analytical Chemistry, University of Barcelona, Avda. Diagonal 647, 08028 Barcelona, Spain Abstract The aim of this work was to develop a model that accurately describes retention in liquid chromatography (LC) as a function of pH and solvent composition throughout a large parameter space. The variation of retention as a function of the solvent composition, keeping other factors constants, has been extensively studied. The linear relationship established N between retention factors of solutes and the polarity parameter of the mobile phase, E , has proved to predict accurately T retention in LC as a function of the organic solvent content. Moreover, correlation between retention and the mobile phase pH, measured in the hydroorganic mixture, can be established allowing prediction of the chromatographic behavior as a function of the eluent pH. The combination of these relationships could be useful for modelling retention in LC as a function of solvent composition and pH. For that purpose, the retention behavior on an octadecyl silica column of a group of diuretic compounds covering a wide range of physico-chemical properties were studied using acetonitrile as organic modifier. The suggested model accurately describes retention of ionizable solutes as concomitant effects of variables included and is applicable to all solutes studied. We also aimed to establish an experimental design that allows to reproduce to a good approximation the real retention surface from a limited number of experiments, that is from a limited number of chromatograms. Ultimately, our intention is to use the model and experimental design for the simultaneous interpretive optimization of pH and proportion of organic solvent of the mobile phase to be used in the proposed separation. 2000 Elsevier Science B.V. All rights reserved. Keywords: Retention modelling; Mobile phase composition; Diuretics 1. Introduction ever, separations are still being developed in a non- systematic manner, often by trial-and-error, which Liquid chromatography (LC) is a routine method involves several disadvantages. The most evident for solving many practical analytical problems. In disadvantage is the long development time that is addition to the broadening of its applications, ad- required to select experimental conditions that are vances have been made in our fundamental under- not necessarily the optimum ones, and often are not standing of the separation mechanisms in LC. How- as good as might be expected from this powerful technique. The most important aspect of method development *Corresponding author. Tel.: 134-93-4021-279; fax: 134-93- in LC is the achievement of sufficient selectivity 4021-213. 1 (relative retention). Usually, the methods are focus- Present address: Unitat de Recerca en Farmacologia, Institut sed on optimizing the concentration of organic ´ ` Municipal d’Investigaccio Medica (IMIM), Doctor Aiguader 80, E-08003 Barcelona, Spain. solvent in the mobile phase. However, the pH of the 0021-9673 / 00 / $ – see front matter 2000 Elsevier Science B.V. All rights reserved. PII: S0021-9673(99)00915-2
Transcript of Modelling retention in liquid chromatography as a function...

Journal of Chromatography A, 869 (2000) 27–39www.elsevier.com/ locate /chroma
Modelling retention in liquid chromatography as a function ofsolvent composition and pH of the mobile phase
1 *´ ´Rosa Berges , Victoria Sanz-Nebot, Jose BarbosaDepartment of Analytical Chemistry, University of Barcelona, Avda. Diagonal 647, 08028 Barcelona, Spain
Abstract
The aim of this work was to develop a model that accurately describes retention in liquid chromatography (LC) as afunction of pH and solvent composition throughout a large parameter space. The variation of retention as a function of thesolvent composition, keeping other factors constants, has been extensively studied. The linear relationship established
Nbetween retention factors of solutes and the polarity parameter of the mobile phase, E , has proved to predict accuratelyT
retention in LC as a function of the organic solvent content. Moreover, correlation between retention and the mobile phasepH, measured in the hydroorganic mixture, can be established allowing prediction of the chromatographic behavior as afunction of the eluent pH. The combination of these relationships could be useful for modelling retention in LC as a functionof solvent composition and pH. For that purpose, the retention behavior on an octadecyl silica column of a group of diureticcompounds covering a wide range of physico-chemical properties were studied using acetonitrile as organic modifier. Thesuggested model accurately describes retention of ionizable solutes as concomitant effects of variables included and isapplicable to all solutes studied. We also aimed to establish an experimental design that allows to reproduce to a goodapproximation the real retention surface from a limited number of experiments, that is from a limited number ofchromatograms. Ultimately, our intention is to use the model and experimental design for the simultaneous interpretiveoptimization of pH and proportion of organic solvent of the mobile phase to be used in the proposed separation. 2000Elsevier Science B.V. All rights reserved.
Keywords: Retention modelling; Mobile phase composition; Diuretics
1. Introduction ever, separations are still being developed in a non-systematic manner, often by trial-and-error, which
Liquid chromatography (LC) is a routine method involves several disadvantages. The most evidentfor solving many practical analytical problems. In disadvantage is the long development time that isaddition to the broadening of its applications, ad- required to select experimental conditions that arevances have been made in our fundamental under- not necessarily the optimum ones, and often are notstanding of the separation mechanisms in LC. How- as good as might be expected from this powerful
technique.The most important aspect of method development
*Corresponding author. Tel.: 134-93-4021-279; fax: 134-93- in LC is the achievement of sufficient selectivity4021-213.
1 (relative retention). Usually, the methods are focus-Present address: Unitat de Recerca en Farmacologia, Institutsed on optimizing the concentration of organic´ `Municipal d’Investigaccio Medica (IMIM), Doctor Aiguader 80,
E-08003 Barcelona, Spain. solvent in the mobile phase. However, the pH of the
0021-9673/00/$ – see front matter 2000 Elsevier Science B.V. All rights reserved.PI I : S0021-9673( 99 )00915-2

´28 R. Berges et al. / J. Chromatogr. A 869 (2000) 27 –39
mobile phase is also a powerful parameter for represents the variation of the retention factor for aoptimizing selectivity when separating ionizable weak monoprotic acid, HA, with the hydrogen ioncompounds. Variations in the mobile phase pH may activity in the mobile phase, a . The dissociation1Hmeasily lead to important variations in selectivity constant in the acetonitrile–water mixture used asbecause the degree of ionization of solute, stationary mobile phase is represented by K ; y is the activity2a Amphases and mobile phase additives (e.g., ion-pairing coefficient of the dissociated acid in the mobilereagents) may be affected by the pH [1]. Therefore, phase that can be calculated by the classical Debye–the most useful way to maintain a reasonable k9 ¨ 9 9Huckel equation; and k and k are the two2HA Arange and to achieve a good selectivity for the limiting retention factors of the undissociated andresulting separation is to vary simultaneously the pH fully dissociated acid, respectively. For a weak
1and the solvent strength of the mobile phase. monoprotic base, BH , a similar equation can beIf selectivity optimization procedures are to be written:
developed, a model to describe the chromatographicK y 1a BHretention in LC (represented by the retention factor, m]]]9 9k 1 k1BH B a 1k9) as a function of the parameters to be optimized, Hm
]]]]]]k9 5 (3)pH and proportion of organic solvent is needed: K y 1a BHm]]]1 1k9 5 F a ,w (1)1s d a 1H Hm
where a is the hydrogen ion activity (a 51 1H H where K is defined as the dissociation constant ofa2pH110 ) and w the fraction of organic modifier in the the protonated base (BH ) in the hydroorganic
mobile phase. Lopes-Marques and Schoenmakers [2] 9 9mixture used as mobile phase, and k and k are1BH Bderived and evaluated several mathematical models, the limiting retention factors of the protonatedwhich combined effects of pH and percentage of compound and the undissociated base, respectively.organic solvent, using different equations for each of Eqs. (2) and (3) include the pH values in thethe single parameters to be optimized. They obtained hydroorganic mixture used as mobile phase insteadthe best results by assuming retention factors to vary of the traditionally values in water, and take intoquadratically with w, and the equation derived con- account the effect of activity coefficients [7].tains nine coefficients and two variables. However, 9Establishing the variation of the coefficients k ,HAtoo many coefficients are undesirable because many 9 9 9k , k , k and K in Eqs. (2) and (3) with the2 1A BH B achromatograms are required to their initial estima- proportion of organic modifier, one can obtain ation. Moreover, the modelling function derived was equation that express the retention factor for acidicproved to be remarkably insensitive to changes in the and basic solutes as a function of both pH andvalues of some of the nine coefficients, suggesting concentration of organic solvent in the mobile phase.that they have no physical meaning. Models derived The dissociation constant, K , cannot be assumed toaby first describing the retention factor as a function be independent of w. The relationships between Kaof pH and then assuming the coefficients in that for different type of compounds and the proportionequation to be a function of organic solvent propor- of organic solvent have been extensively studied andtion are preferred over models derived the other way are well known [10,11]. The variation of retention asaround [2]. a function of the solvent composition (keeping other
The theory for studying the pH dependence of relevant factors constant) has been extensivelychromatographic retention for ionizable solutes in studied. The linear solvation energy relationship
´liquid chromatography were proposed by Horvath et (LSER) formalism [12–14] have been widely used toal. [3] and verified by different authors for different predict retention in liquid chromatography. When atype of compounds [1,4–9]. The expression: system with a fixed pair of solute and stationary
phase is considered [15]:Ka]]]9 9k 1 k 2HA A a y1 2H A *log k9 5 log k9 1 sp 1 ab 1 ba (4)s dm m s m m m]]]]]]k9 5 (2)Ka The independent term and the coefficients in Eq. (4)]]]1 1 a y1 2H Am m depend on solute and stationary phase parameters;

´R. Berges et al. / J. Chromatogr. A 869 (2000) 27 –39 29
*the solvatochromic p parameter evaluates solvent International Olympic Committee [29]. We alsom
dipolarity /polarizability [16]; and the solvatochromic aimed to establish an experimental design that allowsparameters a and b evaluate solvent hydrogen reproducing to a good approximation the real re-m m
bond acidity [17] and solvent hydrogen bond basicity tention surface from limited number of experiments,[18] of the mobile phase, respectively. Taking into that is a limited number of chromatograms. Ultimate-account that b values for acetonitrile–water mix- ly, our intention is to use the model and experimentalm
tures, used here as mobile phases, are nearly constant design for the simultaneous interpretive optimization[19,20] and the observed correlation between the of pH and proportion of organic solvent of thenormalized Dimroth and Reichardt polarity parame- mobile phase to be used in the proposed separation.
N Nter, E , [21] and p* and a parameters, E 50.0091T T
0.415p*10.465 a [22], Eq. (4) can be reduced tothe single solvent parameter-dependent expression: 2. Experimental
Nlog k9 5 C 1 eE (5) 2.1. Chemicals and reagentsT
The linear correlation between the chromatographic Acetonitrile for chromatography (Merck, Darm-retention, represented by the logarithm of the re- stadt, Germany) and water obtained by a Milli-Q
N ´tention factor, and the E polarity parameter have purification system (Millipore Iberica, Barcelona)T
been used to predict the chromatographic behavior of were used. Ammonium acetate, concentrated phos-different types of compounds as a function of the phoric acid, potassium bromide and potassium hy-proportion of organic modifier in the eluent [15,23– drogenphthalate (dried at 1108C before use) were all26]. In acetonitrile–water mixtures rich in water this from Merck and analytical-reagent grade.exists as a structural region without disruptions on Acetazolamide, amiloride (hydrochloride), ben-the structure of water molecules. At percentages of droflumethiazide, benzthiazide, bumetanide, can-acetonitrile–water of approximately 20% the struc- renone (potassium salt), chlorothiazide, chlor-ture of the mixtures changes and presents micro- thalidone, diclorfenamide, ethacrynic acid,heterogeneity. Eq. (5) fits data very well within each furosemide, hydrochlorothiazide, spironolactone, tri-one of these structural regions, for most solutes over amterene and trichlormethiazide were purchased
´wide ranges of acetonitrile composition in the mobile from Sigma Quımica (Alcobendas, Madrid, Spain).phase [15] and provides a useful tool for predicting Molecular structures of these diuretics are shown inretention due to the good linearity obtained and Fig. 1. Stock standard solutions of 1 mg/ml werebecause a suitable prediction of retention for a prepared by dissolving the compound in a 50:50specific solute in a fixed stationary phase can be (v /v) acetonitrile–water mixture except for triam-achieved from only two experimental measurements terene and diclorfenamide, which were dissolved inof k9 at two different mobile phase composition mobile phase. All these solutions were stored in thewithin one of the structural regions of the acetoni- dark at 48C. Working solutions were daily preparedtrile–water mixtures [20,27]. Because of its accuracy by 10-fold dilution of the stock standard solutions inand simplicity, we judged it to be the best available mobile phase; stock solution of diclorfenamide wasas descriptor of retention as a function of percentage used without dilution.of organic solvent in the mobile phase.
In this work, an experimental study was made in 2.2. Apparatusorder to establish the effects of concomitant varia-tions of pH and acetonitrile in the mobile phase on The chromatographic equipment consisted of anretention of a series of diuretic compounds covering ISCO (Lincoln, NE, USA) Model 2350 pump, ana wide range of acid–base properties. These type of injector valve with a 10-ml sample loop and a
4substances are widely used therapeutically in the variable-wavelength absorbance detector (V , ISCO)treatment of congestive heart failure and hyperten- operating at 275 nm. The chromatographic systemsion [28], and are included in the list of compounds was controlled by ChemResearchE Chromatographicbanned in sport by the Medical Commission of the Data Management Controller software (version 2.4)

´30 R. Berges et al. / J. Chromatogr. A 869 (2000) 27 –39
Fig. 1. Molecular structures for the diuretic compounds studied.

´R. Berges et al. / J. Chromatogr. A 869 (2000) 27 –39 31
provided by ISCO. A 5-mm LiChrosphere 100 RP-18 utes were injected individually to avoid mutual(Merck) column (25034 mm I.D.) was used at room interferences.temperature. Retention behavior for a group of compounds
The e.m.f. measurements used to evaluate the pH including acidic (furosemide, bumetanide, ethacrynicof the mobile phase were done with a Model 2002 acid and canrenoic acid), weakly acidic (chloro-potentiometer (60.1 mV) (Crison Instruments, Bar- thiazide and trichlormethiazide) and basic solutescelona, Spain) using an Orion 8102 ROSS combina- (amiloride and triamterene) were used to assess thetion pH electrode (Orion Research, Boston, MA, validity of the proposed model for substances withUSA). All solutions were thermostated externally at different acid–base properties.2560.18C. The electrodes were stabilized in the All model-fitting calculations were performed withappropriate acetonitrile–water mixtures prior to the the SigmaPlot for Windows (version 4.00) curvee.m.f. measurements, which were performed in trip- fitter. This program uses the Marquardt–Levenberglicate to ensure potentiometric system stability. algorithm to find the coefficients of the independent
variable(s) that give the best fit between a givenfunction and experimental data. The iterative algo-
2.3. Chromatographic procedure rithm seeks the values of the parameters that mini-mize the sum of the squared differences between the
The concomitant effects of acetonitrile concen- values of the observed and predicted values for thetration and pH were studied for all solutes on the data until the convergence is achieved, that isLiChrosphere column. Mobile phases used were differences between the residual sum of squares nomixtures of acetonitrile and a 0.1 mol / l ammonium longer decreases significantly.acetate at different proportions of organic solvent,ranged from 10 to 60% (v/v). At each composition,different pH values were studied, spread over the pH 3. Results and discussionrange from 3 to 7, by adding concentrated phosphor-ic acid to the hydroorganic mobile phase. The Acetonitrile–water mixtures are suitable for chro-aqueous component of the eluent was filtered matography of neutral and weak acid diuretics [32],through a 0.45-mm filter (MSI, Reactivos Scharlau, but for chromatography of basic and more acidicBarcelona, Spain) before use. Mobile phases were compounds control of the pH of the eluent by addingfiltered through a 0.22-mm filter (MSI, Reactivos a phosphate buffer [32–34] is needed. Moreover,Scharlau), degassed under a stream of helium and the good peak symmetry of the basic diuretics is onlyflow-rate was maintained at 1 ml /min. obtained if an organic competing base [32,35,36] or
The pH of the mixed mobile phases were mea- an ammonium salt [37] is added to the acidic eluent.sured using a 0.05-mol /kg potassium hydro- For these reasons we chose in our study a C18
genphthalate solution as primary standard buffer stationary phase and a mobile phase consisting ofreference, dissolved in the appropriate acetonitrile– acetonitrile and a 0.1 mol / l ammonium acetatewater medium, and a combination pH electrode as solution, while the pH of the hydroorganic eluentdescribed in previous works [15,30]. was adjusted with concentrated phosphoric acid.
The hold-up time, t , was established for every Retention factors (k9) for the diuretic compounds0
mobile phase tested by injection of a 0.01% potas- were obtained at different percentages of acetonitrilesium bromide solution in water and monitoring the in the mobile phase and at different pH, ranged fromeluate at 200 nm [31]. The retention factors (k9) for 10 to 60% (v/v) and from 3 to 7, respectively.all the diuretic compounds at each mobile phase Owing to the large retention times for spironolactoneassayed were determined from four different in- in mobile phases with percentages of acetonitrilejections of the diuretic compounds working solutions below 35% (v/v), its retention factors have not beenusing the expression: k9 5 (t 2 t ) /t , where t is determined in the whole range studied.R 0 0 0
the hold-up time and t is the retention time of each The pH were measured in the hydroorganic mix-R
compound obtained from the peak maximum. Sol- tures using a 0.05 mol /kg potassium hydrogenphtha-

´32 R. Berges et al. / J. Chromatogr. A 869 (2000) 27 –39
late solution as primary standard reference, dissolved pounds have carboxylic acid groups with pK valuesa
in the appropriate acetonitrile–water medium and a between 3 and 6 depending on the compound [9,40],combination electrode. These measurements can be and plots of k9 versus the pH showed the expectedperformed as easily as in water as described in sigmoidal behavior [3]. Therefore, Eqs. (2) and (3)previous work [15,30] by the use of the operational can be used to describe the retention behavior as adefinition of pH: function of pH for all solutes considered. From the
practical point of view, there is not a great influenceE 2 EPS X]]] of the activity coefficient values and these twopH 5 pH 1 (6)X PS g
equations can be simplified if activities are consid-where pH and E are pH and electromotive force ered equal to concentrations.PS PS
(e.m.f.) of the primary standard reference solution, Considering Eqs. (2) and (3), at each organicpH and E are pH and e.m.f. of the mobile phase, solvent concentration these equations describe aX X
and g50.059 V at 258C. Rapid stabilization and sigmoidal function. The curves are different forgood accuracy, precision and reproducibility for pH different organic solvent concentrations in mobile
9 9 9 9measurements up to 7 in acetonitrile–water systems phase, because k , k , k , k and K vary with2 1HA A BH B a
are obtained [15]. pH measurements in mixed mobile the percentage of acetonitrile in the mobile phase,phase permit the interpretation of chromatographic but the general form of the equation is maintained.results without extrapolation of pH values from Establishing functions for the variations of theaqueous solutions. limiting retention factors and K with the proportiona
According to Eq. (5), logarithms of the retention of organic modifier and substituting them into Eq.factors of the diuretic compounds studied correlate (2) (acidic compounds) or into Eq. (3) (basic solutes)linearly with the polarity parameter of mobile phases we obtain a modelling function for k9 as a functioncontaining 25–50% (v/v) acetonitrile with correla- of both pH and concentration or organic solvent.tion coefficients higher than 0.99. On the other hand, Dissociation constants for some of the diureticthe series of diuretics considered includes com- compounds studied have been potentiometricallypounds with large differences in molecular structures determined in acetonitrile–water mixtures with con-(Fig. 1) and their chromatographic behavior as a centrations of organic solvent up to 70% (w/w) [9].function of the mobile phase pH depends on their Here we are assuming that K for solutes in thea
acid–base properties. Depending on their acid–base hydroorganic mixture constituting the mobile phasebehavior, diuretics can be classified into four groups are known or that they can be estimated or extrapo-[38]: basic (potassium-sparing diuretics, such as lated from the values in aqueous medium and theamiloride and triamterene), neutral (aldosterone an- variation of K values of these type of substances ina
tagonists, such as spironolactone), weakly acidic acetonitrile–water mixtures [42,43]. Otherwise, the(carbonic anhydrase inhibitors, such as acetazola- number of coefficients to be adjusted in the generalmide and diclorfenamide; thiazides and related com- model derived should be increased.
9pounds, such as chlorthalidone) and acidic com- k represents the retention factor of the proton-HA
pounds (canrenoic acid and loop diuretics, such as ated form of an acid, HA. Its variation with per-furosemide, bumetanide and ethacrynic acid). Neu- centage of acetonitrile in the mobile phase, repre-tral compounds are neither basic nor acidic and their sented by the normalized Dimroth and Reichardtretention is independent of pH. Weakly acidic com- polarity parameter, should logically follow Eq. (5):pounds have sulphonamide groups with pK valuesa N9log k 5 C 1 e E (7)HA HA HA Thigher than 7 [9,39,40] and all are uncharged in thepH range investigated and no significant effect of pH 9and analogously for k :2Aon retention factors are observed. According to their
NpK values [9,39,40] basic compounds present posi-a 9log k 5 C 1 e E (8)2 2 2A A A Ttively charged amine groups over the pH rangestudied and their chromatographic retention is low Substituting Eqs. (7) and (8) into Eq. (2) we obtainand also constant. The more acidic diuretic com- an expression that describes the variation of the

´R. Berges et al. / J. Chromatogr. A 869 (2000) 27 –39 33
retention factors for acidic solutes as a combined The initial parameters values used by the curvefunction of pH and concentration of organic modifier fitter to find the equation model should be as close asin the mobile phase: possible to the real values because a good initial
estimate guarantee better and faster results. TheN N(C 1e E ) (C 21e 2E )HA HA T A A T10 1 10 ? K /a y1 2 strategy to select the initial values for C , e , C 2a H A HA HA Am m
]]]]]]]]]]]]k9 5 9and e in Eq. (9) is based on the fact that k and2A HA1 1 K /a y1 2a H Am m 9k are the retention factors for the undissociated2A(9) and fully dissociated acid. These parameters can be
1 estimated from the experimental retention data corre-For a weak monoprotic base, BH , a similar equa-sponding to the highest and lowest pH values attion can be obtained by substituting the expressions
N every concentration of acetonitrile in the mobile9 9for variation of k and k with E (analogous to1BH B T phase for analytes with approximately pK valuesaEqs. (7) and (8)) in Eq. (3):9within 4 and 6, which constitute an estimation of kHA
N N(C 11e 1E ) (C 1e E ) 9and k values, and applying Eqs. (7) and (8). The2BH BH T B B T A10 1 10 ? K y /a1 1a BH Hm m same can be said for the estimation of initial values]]]]]]]]]]]]]k9 5 1 1 K y /a1 1a BH Hm m for basic compounds, C , e , C and e .1 1BH BH B B
The coefficients found to describe the retention(10)behavior of these solutes using Eqs. (9) or (10) are
where K is defined as the dissociation constant ofa listed in Table 1, together with the sums of squares1the protonated base, and BH and B represent the of the residuals (SSQ) and the relative root mean
protonated compound and the undissociated base, squared differences (RRMSD), to indicate the qual-respectively. ity of the description of retention data. The SSQ is
calculated from the differences between the observed3.1. Retention modelling retention factors and those calculated from Eqs. (9)
(acid solutes) or (10) (basic compounds). In general,Retention behavior for a group of compounds the small the SSQ the higher the fitness. By the
including acidic (furosemide, bumetanide, ethacrynic nature of this definition solutes that show largeacid and canrenoic acid), weakly acidic (chloro- retention factors, and thus large absolute deviations,thiazide and trichlormethiazide) and basic solutes tend to show the largest sums of squares. This is the(amiloride and triamterene) were used to assess the reason why solutes such as ethacrynic acid andvalidity of the proposed model for substances with bumetanide show large values of the SSQ listed indifferent acid-base properties. Table 1. The RRMSD, obtained by calculating the
Table 1Results of the application of the retention model proposed to all the experimental retention data available (N.40) for each solute considered(coefficients describe chromatographic retention in terms of Eq. (9) for acids, and in terms of Eq. (10) for basic compounds)
a bSubstance C e C e SSQ RRMSD (%) N2 2HA HA A A
Furosemide 29.05 11.44 210.06 11.57 2.24 10.1 45Ethacrynic acid 211.13 14.72 214.40 17.23 65.73 13.9 46Bumetanide 213.08 16.90 212.87 15.13 58.34 11.9 46Canrenoic acid 212.09 15.22 212.18 14.20 4.12 7.3 49Trichlormethiazide 27.07 8.90 26.29 5.91 1.38 7.4 45Chlorothiazide 23.93 4.39 22.02 1.18 0.05 6.2 45
Substance C e C e SSQ RRMSD N1 1BH BH B B
Amiloride 23.54 3.37 3.09 22.21 0.06 15.9 45Triamterene 26.11 6.87 25.91 7.11 0.12 11.0 25
a 29 9SSQ, sum of squares of the residuals5o k 2 k .s dobs. pred. ]]]]]]b 2 29 9 9RRMSD, relative root mean squared differences51000 o(k 2 k ) /o(k )obs. pred. obs.œ
´34 R. Berges et al. / J. Chromatogr. A 869 (2000) 27 –39
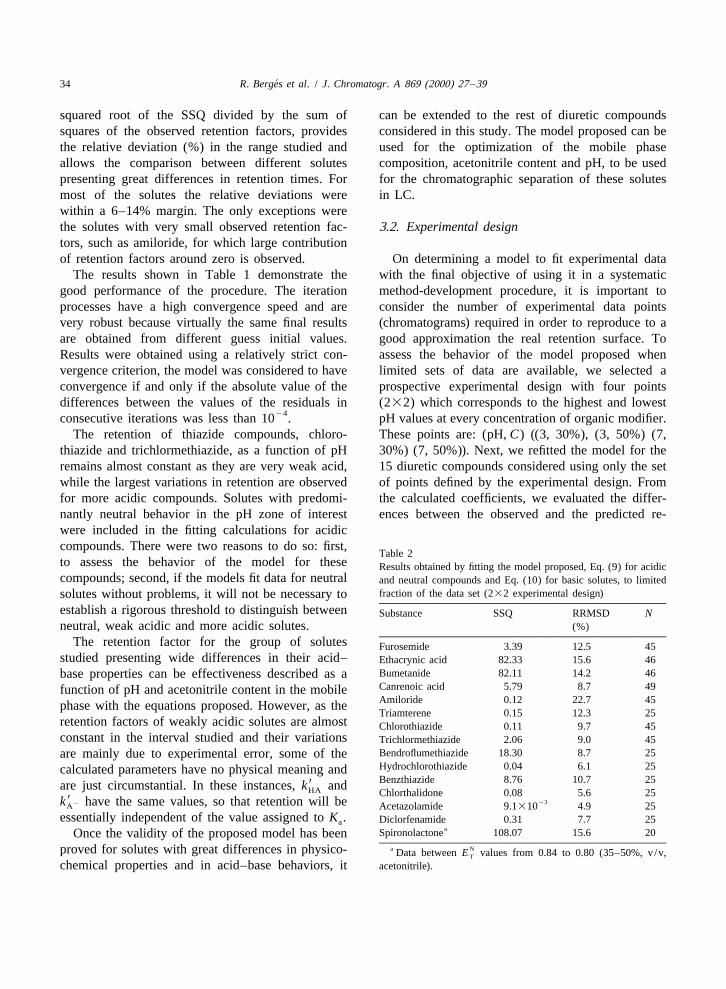
squared root of the SSQ divided by the sum of can be extended to the rest of diuretic compoundssquares of the observed retention factors, provides considered in this study. The model proposed can bethe relative deviation (%) in the range studied and used for the optimization of the mobile phaseallows the comparison between different solutes composition, acetonitrile content and pH, to be usedpresenting great differences in retention times. For for the chromatographic separation of these solutesmost of the solutes the relative deviations were in LC.within a 6–14% margin. The only exceptions werethe solutes with very small observed retention fac- 3.2. Experimental designtors, such as amiloride, for which large contributionof retention factors around zero is observed. On determining a model to fit experimental data
The results shown in Table 1 demonstrate the with the final objective of using it in a systematicgood performance of the procedure. The iteration method-development procedure, it is important toprocesses have a high convergence speed and are consider the number of experimental data pointsvery robust because virtually the same final results (chromatograms) required in order to reproduce to aare obtained from different guess initial values. good approximation the real retention surface. ToResults were obtained using a relatively strict con- assess the behavior of the model proposed whenvergence criterion, the model was considered to have limited sets of data are available, we selected aconvergence if and only if the absolute value of the prospective experimental design with four pointsdifferences between the values of the residuals in (232) which corresponds to the highest and lowest
24consecutive iterations was less than 10 . pH values at every concentration of organic modifier.The retention of thiazide compounds, chloro- These points are: (pH, C) ((3, 30%), (3, 50%) (7,
thiazide and trichlormethiazide, as a function of pH 30%) (7, 50%)). Next, we refitted the model for theremains almost constant as they are very weak acid, 15 diuretic compounds considered using only the setwhile the largest variations in retention are observed of points defined by the experimental design. Fromfor more acidic compounds. Solutes with predomi- the calculated coefficients, we evaluated the differ-nantly neutral behavior in the pH zone of interest ences between the observed and the predicted re-were included in the fitting calculations for acidiccompounds. There were two reasons to do so: first,
Table 2to assess the behavior of the model for these Results obtained by fitting the model proposed, Eq. (9) for acidiccompounds; second, if the models fit data for neutral and neutral compounds and Eq. (10) for basic solutes, to limited
fraction of the data set (232 experimental design)solutes without problems, it will not be necessary toestablish a rigorous threshold to distinguish between Substance SSQ RRMSD Nneutral, weak acidic and more acidic solutes. (%)
The retention factor for the group of solutes Furosemide 3.39 12.5 45studied presenting wide differences in their acid– Ethacrynic acid 82.33 15.6 46
Bumetanide 82.11 14.2 46base properties can be effectiveness described as aCanrenoic acid 5.79 8.7 49function of pH and acetonitrile content in the mobileAmiloride 0.12 22.7 45phase with the equations proposed. However, as theTriamterene 0.15 12.3 25
retention factors of weakly acidic solutes are almost Chlorothiazide 0.11 9.7 45constant in the interval studied and their variations Trichlormethiazide 2.06 9.0 45
Bendroflumethiazide 18.30 8.7 25are mainly due to experimental error, some of theHydrochlorothiazide 0.04 6.1 25calculated parameters have no physical meaning andBenzthiazide 8.76 10.7 259are just circumstantial. In these instances, k andHA Chlorthalidone 0.08 5.6 25
239k have the same values, so that retention will be2A Acetazolamide 9.1310 4.9 25essentially independent of the value assigned to K . Diclorfenamide 0.31 7.7 25a
aSpironolactone 108.07 15.6 20Once the validity of the proposed model has beena Nproved for solutes with great differences in physico- Data between E values from 0.84 to 0.80 (35–50%, v/v,T
chemical properties and in acid–base behaviors, it acetonitrile).

´R. Berges et al. / J. Chromatogr. A 869 (2000) 27 –39 35
tention values for all the data set. The results are (7) and (8), a conventional linear regression methodgiven in Table 2 and they enabled us to obtain a gives the result in a minimal amount of time. Thisrough idea of the degree of approximation for small overhead in computation time is more thanpredictions made. compensated by the increasing ease with which the
The initial values for the parameters C , e , whole process can be conducted. Dissociation con-HA HA
C and e (acidic and neutral solutes) or C , stants for some of the diuretic compounds studied2 2 1A A BH
e , C and e (basic solutes) can be estimated have been potentiometrically determined in acetoni-1BH B B
from the points of the experimental design, and trile–water mixtures with concentrations of organicapplying Eqs. (7) and (8) or the equivalent equations solvent up to 70% (w/w) [9]. For the rest of solutesfor bases. The additional model fittings required for an estimation of the K in the acetonitrile–watera
the initial-guess procedure do not cause a significant mixtures constituting the mobile phase have beenincrease in the time required for the whole process performed from values described in aqueous mediumbecause for the linear relationships described by Eqs. [39–41] and taking into account variations of this
NFig. 2. Retention surfaces as a function of pH and the E polarity parameter of the mobile phase obtained by fitting the four data selected inT
the experimental design to Eq. (9). Solutes (acidic diuretics): (a) furosemide, (b) ethacrynic acid, (c) bumetanide and (d) canrenoic acid.Symbol: (d) experimental retention data over the whole parameter space.

´36 R. Berges et al. / J. Chromatogr. A 869 (2000) 27 –39
dissociation constants when increasing acetonitrile and organic modifier concentration, where the re-concentration for similar compounds [9,42,43]. tention factors are small, can be high. But, in
Figs. 2 and 3 show the retention surfaces for some general, the model gives very good results withof solutes studied, obtained by fitting four initial relative deviations between experimental and pre-
Nexperimental data, as a function of pH and E dicted data from 5 to 15% for most of the solutesT
polarity parameter of the mobile phase. Experimental over the whole parameter space considered. The onlyretention data over the whole parameter space are exceptions are basic compounds such as amiloridealso plotted together with the predicted surfaces to and triamterene that not fit well to the general modeldemonstrate the accuracy of the predictions done. of variation of k9 values with pH (Eq. (3)) as it wasThe relative deviations at certain combination of pH found in a previous work [7]. Judging from the
NFig. 3. Retention surfaces as a function of pH and the E polarity parameter of the mobile phase obtained: (1) by fitting the four dataT
selected in the experimental design to Eq. (10): (a) amiloride, (b) triamterene (basic diuretics); (2) by fitting the four data selected in theexperimental design to Eq. (9): (c) trichlormethiazide (weakly acid diuretic), (d) spironolactone (neutral diuretic). Symbol: (d) experimentalretention data over the whole parameter space.

´R. Berges et al. / J. Chromatogr. A 869 (2000) 27 –39 37
results using an experimental design of four points it organic mobile phase pH to 3.5 is shown in Fig. 5.is possible to predict retention factors for compounds All solutes are well separated in an analysis time ofwith different acid–base properties accurately. 28 min with the exception of triamterene and aceta-
Our ultimate aim is not to describe retention, but zolamide for which an experimental selectivity ofto optimize separations. The model described by Eqs. 1.10 is obtained. This little deviations from the(9) and (10) can be used to predict retention of predicted behavior can be due to the inaccuracies indiuretic compounds as a function of the acetonitrile the models for the basic diuretics [7]. Thus, thecomposition and the pH of the mobile phase ranged predicted composition of the mobile phase gives us afrom 30 to 50% (v/v) and from 3 to 7, respectively. very good approximation to the experimental con-From only four experimental data for each com- ditions to be used.pound retention factors can be calculated over thewhole parameters space studied and selectivity (a 5
9 9k /k ) between adjacent solutes can be obtained. 4. Conclusions2 1
Three-dimensional graphs of the minimum selectivi-ty (a ) as a function of pH and concentration of Chromatographic retention in LC can be describedmin
acetonitrile are represented in Fig. 4. The highest mathematically as a function of pH and solventminimum relative retention indicates the experimen- composition of the mobile phase. The retentiontal conditions in which the optimum separation is factors modelling system developed by first describ-obtained. The highest a value of 1.17 is predicted ing the k9 as a function of pH and then assuming themin
between triamterene and acetazolamide around 40% coefficients of this equation to be a function ofN(v /v) acetonitrile (E 50.82) in the mobile phase composition proved to be very effective for com-T
and at a pH between 3 and 3.5. pounds covering a wide range of acid–base prop-The chromatographic separation for the 15 com- erties. Moreover, the model proposed can be used for
pounds considered in a mobile phase containing 40% the optimization of the mobile phase composition(v /v) acetonitrile and 60% (v/v) 0.1 mol / l am- because using a experimental design of four ex-monium acetate solution, to which concentrated perimental data it is possible to predict retentionphosphoric acid has been added to adjust the hydro- factors accurately over the whole parameter space
NFig. 4. Three-dimensional graph of minimum selectivity (a ) as a function of pH and the E polarity parameter for the mixture of the 15min T
diuretic compounds studied.

´38 R. Berges et al. / J. Chromatogr. A 869 (2000) 27 –39
Fig. 5. Chromatogram obtained with the optimum mobile phase predicted. Peaks: (1) amiloride, (2) triamterene, (3) acetazolamide, (4)chlorothiazide, (5) hydrochlorothiazide, (6) chlorthalidone, (7) diclorfenamide, (8) trichlormethiazide, (9) furosemide, (10) canrenone, (11)benzthiazide, (12) bendroflumethiazide, (13) bumetanide, (14) ethacrynic acid and (15) spironolactone. See text for experimental conditions.
[5] P. Chaminade, A. Baillet, D. Ferrier, B. Bourguignon, D.L.considered. We have incorporated the model derivedMassart, Anal. Chim. Acta 280 (1993) 93.into selectivity optimization procedures and it has
[6] J.E. Hardcastle, M. He, B. Begum, R. Vermillionsalsbury, J.proved to be effective and accurate. Chromatogr. A 691 (1995) 225.
´[7] J. Barbosa, R. Berges, V. Sanz-Nebot, J. Chromatogr. A 823(1998) 411.
[8] S. Heinisch, S.L. Rocca, Chromatographia 48 (1998) 237.References ´ ´[9] B.E. Torres-Lapasio, J.R. Medina-Hernandez, M.J. Garcıa-Alvarez-Coque, Anal. Chim. Acta 287 (1994) 201.
´ ´ ´[1] P.J. Schoenmakers, S. van Molle, C.M.G. Hayes, L.G.M. [10] J. Barbosa, I. Marques, G. Fonrodona, D. Barron, R. Berges,Uunk, Anal. Chim. Acta 250 (1991) 1. Anal. Chim. Acta 347 (1997) 385.
´[2] R.M. Lopes-Marques, P.J. Schoenmakers, J. Chromatogr. [11] J. Barbosa, R. Berges, I. Toro, V. Sanz-Nebot, Talanta 44592 (1992) 157. (1997) 1271.
´ ´[3] C. Horvath, W. Melander, I. Molnar, Anal. Chem. 49 (1977) [12] P.C. Sadek, P.W. Carr, R.M. Doherty, M.J. Kamlet, R.W.142. Taft, M.H. Abraham, Anal. Chem. 57 (1985) 2971.
´ ´[4] F. Szokoli, Nemeth, J. Inczedy, Chromatographia 29 (1990) [13] M.J. Kamlet, R.M. Doherty, J.M. Abboud, M.H. Abraham,265. R.W. Taft, J. Pharm. Sci. 75 (1986) 338.

´R. Berges et al. / J. Chromatogr. A 869 (2000) 27 –39 39
[14] W.J. Cheong, P.W. Carr, Anal. Chem. 61 (1989) 1524. [31] C.F. Poole, S.K. Poole, in: Chromatography Today, Elsevier,´[15] J. Barbosa, R. Berges, V. Sanz-Nebot, J. Chromatogr. A 719 Amsterdam, 1991.
(1996) 27. [32] F. de Croo, W. van den Bosche, P. de Moerloose, J.[16] M.J. Kamlet, J.L. Abboud, R.W. Taft, J. Am. Chem. Soc. 99 Chromatogr. 325 (1985) 395.
´ ´ ´ ´(1977) 6027. [33] P. Campıns-Falco, R. Herraez-Hernandez, A. Sevillano-Cab-[17] R.W. Taft, M.J. Kamlet, J. Am. Chem. Soc. 98 (1976) 2886. eza, J. Liq. Chromatogr. 14 (19) (1991) 3575.
´[18] M.J. Kamlet, R.W. Taft, J. Am. Chem. Soc. 98 (1976) 377. [34] M. Saarinen, H. Siren, M.L. Riekkola, J. Liq. Chromatogr.[19] T.M. Krygowski, P.K. Wrona, U. Zielkowska, Tetrahedron 16 (18) (1993) 4063.
´41 (20) (1985) 4519. [35] S.F. Cooper, R. Masse, R. Dugal, J. Chromatogr. 489 (1989)[20] Y. Marcus, Y. Migron, J. Phys. Chem. 95 (1991) 400. 65.
´ ´ ´ ´[21] C. Reichardt, in: Solvents and Solvent Effects in Organic [36] P. Campıns-Falco, R. Herraez-Hernandez, A. Sevillano-Cab-Chemistry, VCH Verlagsgellschaft, Weinheim, 1988. eza, J. Chromatogr. 612 (1993) 245.
[22] M.J. Kamlet, J.L. Abboud, R.W. Taft, Prog. Phys. Org. [37] R. Ventura, T. Nadal, P. Alcalde, J.A. Pascual, J. Segura, J.Chem. 13 (1981) 485. Chromatogr. A 655 (1993) 233.
´ ´ ´ ´[23] B.P. Johnson, M.G. Khaledi, J.G. Dorsey, Anal. Chem. 58 [38] J. Florez, J.A. Armijo, Farmacos diureticos, in: J. Florez,´(1986) 2354. J.A. Armijo, A. Mediavilla (Eds.), Farmacologıa Humana,
´ ´[24] J.J. Michels, J.G. Dorsey, J. Chromatogr. 457 (1988) 85. Ediciones Cientıficas y Tecnicas S.A, Barcelona, 1992, p.[25] P.T. Ying, J.G. Dorsey, Talanta 38 (1991) 237. 721.[26] M.M. Hsieh, J.G. Dorsey, J. Chromatogr. 631 (1993) 63. [39] U.G.G. Hennig, R.E. Moskalyk, L.G. Chatten, D.L. Rabens-[27] H. Kovacs, A. Ladksomen, J. Am. Chem. Soc. 113 (1991) tein, Analyst 106 (1981) 565.
5596. [40] A.C. Moffat, J.V. Jackson, M.S. Moss, in: B. Widdop (Ed.),[28] I.M. Weiner, in: A. Goodman, Gilman, T.W. Rall, A.S. Nies, Clarke’s Isolation and Identification of Drugs in Pharma-
P. Taylor (Eds.), Goodman and Gilman’s The Pharmaco- ceuticals, Body Fluids and Post-mortem Material, 2nd ed.,logical Basis of Therapeutics, Pergamon, New York, 1990, p. The Pharmaceutical Press, London, 1986.708. [41] A. Lant, Drugs 29 (1985) 162.
´ ´[29] International Olympic Committee, Prohibited classes of [42] J. Barbosa, I. Marques, G. Fonrodona, D. Barron, V. Sanz-substances and prohibited methods, in: IOC Medical Code Nebot, Trends Anal. Chem. 16 (1997) 140.
´ ´and Explanatory Document, IOC, Laussane, Switzerland, [43] J. Barbosa, G. Fonrodona, I. Marques, S. Butı, I. Toro,1995. Trends Anal. Chem. 16 (1997) 104.
[30] J. Barbosa, V. Sanz-Nebot, Fresenius J. Anal. Chem. 353(1995) 148.