ansa scripting for automated pedestrian marking and simulation input

Modelling Pedestrian Circulation in Rail Transit Stations Using Micro-Simulation
1
Galiza*/Kim**/Ferreira*/Laufer**
*University of Queensland
**PTV-Asia Pacific
ATRF 2009Venue: Auckland, New Zealand
Date: September 30, 2009

Introduction
Increased public transport use (bus & rail)
2
Photo courtesy of ITSRR-NSW
Photo courtesy of ITSRR-NSW
Increased congestion esp. during peak periods…

Problem Statement
Traditional design &
evaluation of pedestrian
facilities � maintaining
a desirable pedestrian
level-of-service (PLOS)
3
level-of-service (PLOS)
Walkway Levels of Service (Fruin 1987)

Issues on Pedestrian Analysis
• Cultural differences
• Traveller composition/distribution
• Type of facilities & environment factors
�Designing pedestrian facilities complying
4
�Designing pedestrian facilities complying with local characteristics?
Micro-simulation Traffic models (MSTMs)
widely accepted tools…
5
…guidelines available (FHWA 2004; Austroads 2006; Faber Maunsell 2007).

Why not also use micro-simulation for pedestrian analysis?
6
Micro-simulation pedestrian software (e.g.
VISSIM®, SimWalk®, Legion®, NoMad®)

Conventional Pedestrian Circulation Analysis
7
Use of link-node network & spreadsheets…

Advantages of Pedestrian Micro-simulation
• Flexible geometric irregularities
• Non-uniform passenger arrivals
• Greater number of influencing factors
• Visual pedestrian interactions
8
• Visual pedestrian interactions

Disadvantages of Micro-simulation
9
• Time-consuming & expensive
• Considerable input data
• Extensive calibration, validation & verification
• Micro-simulation as black boxes

Data Collection
Sufficient time & resources input data collection
• Static data - scaled station plans, locations of temporary equipment, trash
10
locations of temporary equipment, trash bins, obstructions, & ticket vending machines.
• Dynamic data - train arrivals, pedestrian volumes & characteristics.

Modelling Criteria
• No modelling criteria - MSPM calibration
• MSTM criteria applied
�percent deviation (observed - modelled volumes)
11
volumes)
� or GEH statistics - pedestrian volumes
( )
OM
OMGEH
+
−=
22

Possible Scenarios (Station analysis)
• Rolling stock changes
• Additional services
• Service delay impacts
12
• Service delay impacts
• Passenger volumes changes
• Platform arrival changes
• Passenger evacuation

VISSIM® Pedestrian Simulation
• Vehicles & pedestrians simulated individually
• Pedestrian behaviour defined individually
• Area based modelling
• Multiple level representation
• Pedestrian dynamic route choice
13
• Pedestrian dynamic route choice
Driving force in the desired direction of
motion
Forces from borders
Forces from fellow
pedestrians
Driving force in the desired direction of
motion
Forces from borders
Forces from fellow
pedestrians

North Melbourne Station (NMS): Case Study
• located north of
Melbourne CBD
• contains six
platforms
14
platforms
• four ramps - northern
end
• 3 platforms for NB &
SB

Base Model Operational Characteristics
• Simulated during AM peak hour (7:30 –8:30AM)
• Services current timetable – May 2008
Platform
Number1 2 3 4 5 6 Total
No. of
Services
(Trains)
12 9 16 7 10 3 57
Rail Frequency for the AM Peak Period
(Laufer 2008)
15
timetable – May 2008
• Patronage October 2007
• receives ~3,000 persons alighting
• 40% exit &60% transfer
(Trains)

Base Model Network Coding
• platforms &
concourses -
pedestrian areas
• connections between
16
• connections between
levels - ramps
• shelters, poles &
other furniture -
obstacles

Base Model Calibration
17
Good network depiction

Base Model Calibration
Platform Simulation Volumes (Laufer 2008)
Pedestrian MovementObserved Modelled
Absolute
Difference
Percentage
Difference
Platform 1 – Entering 609 591 18 3%
Platform 1 – Leaving 422 448 -26 6%
Platform 2 & 3 –
18
Platform 2 & 3 –
Entering275 282 -7 3%
Platform 2 & 3 –
Leaving764 701 63 8%
Platform 4 & 5 –
Entering110 105 5 5%
Platform 4 & 5 –
Leaving1,079 1072 7 1%
Total 3,259 3199 60 2%

Model Performance Measures
19
Platform Occupancy in the SB Direction (Laufer 2008)

Model Performance Measures…
20
Platform 1 Pedestrian Level-of-service from Fruin (1971)

Lessons Learned
• Illustrated how the NMS can be modelled using pedestrian micro-simulation.
• Identified procedure & data
21
• Identified procedure & data requirements
• Produces broad number of quantitative outputs.
• Visualization for qualitative congestion measure.

Lessons Learned
• Requires considerable data and manpower.
• More expensive than traditional analysis.
22
traditional analysis.
• Capital investment on software.
• No agreed upon calibration guidelines.
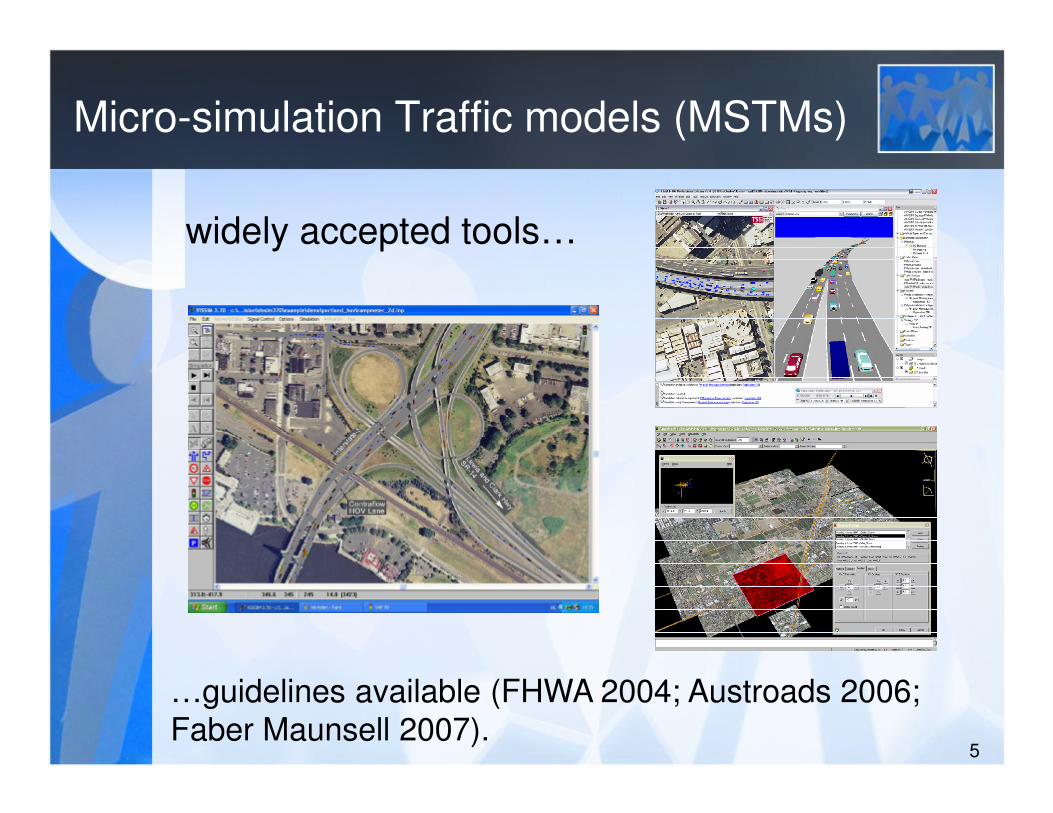
Conclusions and Future Research
• Simulation - powerful tool for passenger flow analysis.
• Provides numerical results & graphical animations.
23
• Investigate pedestrian characteristics for Australian conditions.
• Establish guidelines for MSPM use.

Thank you for listening, that ends the presentation…
24
Your questions, comments& suggestions are most welcome…