Modelling of Air Flow in Impacted Polyurethane · PDF fileCellular Polymers, Vol. 21, No. 5,...
26
343 Cellular Polymers, Vol. 21, No. 5, 2002 Modelling of Air Flow in Impacted Polyurethane Foam Modelling of Air Flow in Impacted Polyurethane Foam N.J. Mills* and G. Lyn School of Metallurgy and Materials University of Birmingham Received: 18 July 2002 Accepted: 19 September 2002 ABSTRACT Polyurethane (PU) chip foam was characterised for air flow resistance, using a modification of the BS 4443 method, and for compressive impact response. A finite difference model was developed for the air flow in the impacted foam, including the effects of strain on foam permeability. It successfully predicted a non-uniform stress distribution across foam block of diameter > 100 mm, and showed that air flow is responsible for some but not all the hysteresis in this distribution for impact velocities > 3 m/s. Air pressure measurements, made in narrow vertical cavities inside impacted blocks of the foam, confirm the air pressure contribution to the total stress. INTRODUCTION Jones and Fesman (1) described air flow measurements on open-cell polyurethane (PU) foam. They linked the air flow values to microstructural parameters (cell size, the proportion of open cell faces, and foam density). They attributed a correlation, between the air flow values with ball rebound values (for impact speed 3 m/s), to viscous air-flow losses in the impact. They found that the pressure gradient through the foam was a non-linear function of air flow velocity v (approximately v 1.4 ). The equation used by Hilyard and Collier (2) for the pressure gradient was ∆P L K v B v = + η ρ 2 (1) where ∆P is the pressure drop across a foam length L, and v the air velocity. *Correspondence address: Metallurgy and Materials, University of Birmingham, Birmingham B15 2TT. Tel. 0121 414 5185, Fax 0121 414 5232, e-mail [email protected]
-
Upload
truongthuan -
Category
Documents
-
view
213 -
download
0
Transcript of Modelling of Air Flow in Impacted Polyurethane · PDF fileCellular Polymers, Vol. 21, No. 5,...

343Cellular Polymers, Vol. 21, No. 5, 2002
Modelling of Air Flow in Impacted Polyurethane Foam
Modelling of Air Flow in Impacted PolyurethaneFoam
N.J. Mills* and G. Lyn
School of Metallurgy and MaterialsUniversity of Birmingham
Received: 18 July 2002 Accepted: 19 September 2002
ABSTRACTPolyurethane (PU) chip foam was characterised for air flow resistance, usinga modification of the BS 4443 method, and for compressive impact response.A finite difference model was developed for the air flow in the impacted foam,including the effects of strain on foam permeability. It successfully predicteda non-uniform stress distribution across foam block of diameter > 100 mm,and showed that air flow is responsible for some but not all the hysteresis inthis distribution for impact velocities > 3 m/s. Air pressure measurements,made in narrow vertical cavities inside impacted blocks of the foam, confirmthe air pressure contribution to the total stress.
INTRODUCTION
Jones and Fesman(1) described air flow measurements on open-cellpolyurethane (PU) foam. They linked the air flow values to microstructuralparameters (cell size, the proportion of open cell faces, and foam density).They attributed a correlation, between the air flow values with ballrebound values (for impact speed 3 m/s), to viscous air-flow losses in theimpact. They found that the pressure gradient through the foam was anon-linear function of air flow velocity v (approximately v1.4). Theequation used by Hilyard and Collier(2) for the pressure gradient was
∆PL K
vB
v= +η ρ 2 (1)
where ∆P is the pressure drop across a foam length L, and v the air velocity.
*Correspondence address: Metallurgy and Materials, University of Birmingham,Birmingham B15 2TT. Tel. 0121 414 5185, Fax 0121 414 5232, [email protected]
3Mills paper 5/11/02, 1:19 pm343

344 Cellular Polymers, Vol. 21, No. 5, 2002
N.J. Mills and G. Lyn
The first term on the right hand side was attributed to laminar air flow, whilethe second was attributed to turbulent air flow. η is the air viscosity = 18x 10-6 Pa s, and ρ its density = 1.29 kg m-3. The foam material ‘constants’are the permeability K (m2) and the inertial flow coefficient B (m). Theirmaximum air velocity was 0.6 m/s, less than that caused by typical impactson foam. They showed that B and K, for several types of virgin PU foam,were functions of the applied compressive strain.
Sims and Pentrakoon(3) measured the air pressure, during impacts at2.4 m/s, inside vertical voids of different sizes in blocks (150 mm by150 mm by 50 mm) of virgin polyester PU foam of density 59 kg m-3.Their graphs of air pressure vs. time had approximately the same shapeas graphs of striker deceleration vs. time. Although the air pressurecontribution to the total stress was considerable, they did not quantify therelationship.
Hong et al(4) used a porous elastic theory to model the uniaxialcompression of oil and air filled PU foams. One of their material constants(Skempton’s pore pressure build-up coefficient) has no meaning in termsof polymer foam microstructure. They compressed the foam uniaxially ina cylinder, from which the air could not escape; consequently there wasan isothermal air compression contribution to the total stress. Theirmeasurements, at extremely low-strain rates, could not validate the modelpredictions for high strain rates. Their axisymmetric explicit finitedifference model took the foam permeability to be 10-9 m2, from therange(5) of values 10-8 to 10-10 m2, rather than determine it experimentally.The changeover, from zero air pressure contribution to no air escape,was predicted to occur between strain rates of 100 and 1000 s-1, for acylinder of height and diameter 65 mm.
Gibson and Ashby(5) reported tests on an air-filled flexible PU foam ofrelative density 0.035 at strain rates up to 20 s-1 (the sample size is notmentioned); they claim there were no strain rate effects, hence nocontribution to the stress from the air viscosity. They argue that, for thereported data on open cell foams, the Reynolds number of the air flowis sufficiently low that the flow is laminar rather than turbulent.
Lyn and Mills(6) carried out impacts of an instrumented headform ontoremoulded polyurethane (PU) foam mats of a range of thickness. Theymodelled the impacts using ABAQUS implicit Finite Element Analysis
3Mills paper 5/11/02, 1:19 pm344

345Cellular Polymers, Vol. 21, No. 5, 2002
Modelling of Air Flow in Impacted Polyurethane Foam
(FEA), with a hyperelastic compressible foam material model. However,the predicted headform forces on loading were underestimated by about35%, compared with experimental data at the same foam deflection. Inthe FEA modelling, both the air flow resistance and the polymerviscoelasticity were ignored.
In the current paper, the air flow resistance of the PU chip foam ischaracterised. The air flow in an impacted foam is modelled, allowing forthe variation of foam permeability with strain, using a finite differencemethod. The model is validated using experimental impact data, and airpressure measurements in cavities inside impacted blocks of the foam.Quantification of the air and polymer contributions in impacted foamcould be useful in modelling headform impacts on large foam productssuch as crash mats - see BS EN 12503(7)
FOAM MATERIALS
The slabstock process for polyurethane flexible open-cell foam producessome scrap, which is diced into pieces of 5 to 10 mm diameter. Thesepieces, of different colours and hardness, are mixed with isocyanate andpolyol chemicals and remoulded. British Vita is a major UK source of suchremoulded (or ‘chip’) PU foam. The remoulded PU foam tested was a sheetcut to be 0.1 m thick. The foam nominal density was 4 lb/ft3 (64 kg m-3),and the measured density was 63 kg m-3. Figure 1 shows SEM photographsof two chips in the foam. In chip A there is little prestrain so only a fewcell edges are bent, whereas in chip B the high compressive prestrain inthe horizontal direction caused the cells to be flattened and many edgesto be bent. The prestrain occurs due to the compression of the chips inthe remoulding process(8) prior to the polymerisation of the ‘adhesive’.
MODELLING OF CHIP FOAM COMPRESSIVE RESPONSE
The model combines the polymer structure response and the air flowcontribution. It ignores cross-effects, such as increased air pressurestabilising the cell edges against bending, increasing the foam compressiveresistance. Hence the separate contributions, at a given strain and strainrate, can be added to give the total stress on the foam. The polymercontribution will be considered first.
3Mills paper 5/11/02, 1:19 pm345

346 Cellular Polymers, Vol. 21, No. 5, 2002
N.J. Mills and G. Lyn
Hyperelastic Model for the Open-cell Foam
The foam uniaxial compressive response, measured at moderate strainrates under conditions where the air flow contribution is negligible, isfitted with a set of adjustable parameters from Ogden’s(9) strain energyfunction for compressible hyperelastic solids. This is
U Ji
ii
N
i
i i i i i= + + −( ) + −( )
=
−∑ 23
112
11 2 3
µα
λ λ λβ
α α α α β (2)
where λI are the principal extension ratios, J = λ1 λ2 λ3 measures the totalvolume, the µi are shear moduli, N is an integer, and αi and βi curve-fittingnon-integral exponents. The latter are related to Poisson’s ratio νi by
β ν
νii
i
=−1 2
(3)
The compressive stress σ1 for uniaxial compression along the 1 axis isgiven by
σ
λµα
λα αβ1
11
1
2= −( )−
=∑ i
ii n
i i iJ,
(4)
Mills and Gilchrist(10) showed that a two-modulus Ogden hyperelasticmodel gave a reasonable approximation to the properties of PU foam,and successfully predicted the indentation by flat-faced indenters. For theremoulded PU foam of density 64 kg m-3, the fitting parameters found
Figure 1 SEM photographs of chips in the unloaded foam, a) with little strain,b) with a large compressive strain
(a) (b)
3Mills paper 5/11/02, 1:22 pm346

347Cellular Polymers, Vol. 21, No. 5, 2002
Modelling of Air Flow in Impacted Polyurethane Foam
by Lyn and Mills(6) were used – see Table 1. Both N terms contribute tothe strong compressive hardening when the strain > 0.6. The α = -2 termcan be linked to rubberlike elasticity of extending foam cell edges,whereas the α = 8 term mainly models the touching of foam edges at highcompressive strains. The elastic anisotropy of the foams, found to be theorder of 10%, was ignored.
UPdednoberrofsretemarapnoitcnufygreneniartss’nedgO1elbaTmaof
N suludomraehsµ aPk
tnenopxE α oitars’nossioP ν
1 81 8 0
2 2.1 2- 54.0
Heat Transfer in the Compressed Open-cell Foam
There is forced convection when the foam is compressed, as the air flowsrapidly past the foam cell edges. Mills and Gilchrist(11) analysed heattransfer from the air to the polymer faces in compressed closed cellfoams; there is no convection inside these small cells, so heat transfer wasby diffusion in still air. Comparison with the experimental responsessuggests near isothermal conditions exist in these materials for impactsat 5 m/s, if the cell size was less than a few mm. For open-cell PU foams,the better heat transfer in the air ensures that the situation is nearisothermal. Hence the conditions are assumed to be isothermal.
Foam Boundary Conditions
Figure 2a shows the 1-Dimensional air flow model. The length L of thefoam slab is much greater than the half width w, so the air flow is only inthe z direction. There is zero air flow across the plane of symmetry at thevertical midplane of the foam block. In the finite difference model, thefoam slab is split into planar slices of thickness ∆z. In the axisymmetricversion of the model (Figure 2b) the foam is a vertical cylinder, split intoconcentric annuli of thickness ∆r. In the following, ‘slice’ means slice orannulus.
The foam is compressed between two flat steel anvils, so is under uniaxialcompression. It is assumed that:
3Mills paper 5/11/02, 1:22 pm347

348 Cellular Polymers, Vol. 21, No. 5, 2002
N.J. Mills and G. Lyn
a) the foam strain is homogeneous, i.e. there are no localised high-deformation bands. This is reasonable for PU foam. Sims andBennett(12) took short exposure photographs during the impact ofPU foam specimens. Bulging was observed for specimens with largecentral voids, but there were no signs of deformation bands. If thestrain is uniform in the y direction, there is no air flow in the ydirection.
Figure 2 Finite Difference models of foam impacted at velocity V by a flatstriker, while resting on flat table, a) 1-dimensional air flow in a long foamblock, b) axisymmetric air flow in a foam cylinder
(a)
(b)
3Mills paper 5/11/02, 1:22 pm348

349Cellular Polymers, Vol. 21, No. 5, 2002
Modelling of Air Flow in Impacted Polyurethane Foam
b) the polymer is not rate-dependent (viscoelastic). This simplificationis made to keep the model simple. Zhu et al(13) modelled the effectsof non-linear viscoelasticity on the slow compressive response offlexible PU foams, and showed a significant effect at high foamcompressive strains.
c) there is instant sealing of the foam upper (and lower) surface, whenit is contacted by the striker surface. This causes the air flow to bepurely in the z direction of Figure 2a. The foam surfaces are flatcompared with the cell diameters. Cut edges in surface partial cellsreadily fold over, so the air flow resistance of this layer should behigher than other parts of the foam.
d) the Poisson’s ratio of the foam is effectively zero for compression.Zhu et al(13) showed this is a good approximation for compressivestrains exceeding 10%.
e) the initial impact velocity is small compared with the speed of soundthrough the foam, so sound pressure waves can be ignored. Voronina(14)
gave the sound velocity in a PU foam of density 32 kg m-3 as 190 m/s, forfrequencies of 0.5 to 2 kHz. The time for such a wave to reboundthrough a 0.1 m thick foam is about 1 ms. There are signs, on thepost-collapse impact force-time graphs, of damped pressureoscillations on a slightly shorter scale (Figure 3).
Air Flow Law
The model, using the air flow equation (1), assumes that the flowresistance only depends on the pressure differential, and not on theabsolute pressure. Hence errors may arise when the pressure is muchgreater than atmospheric. Hilyard and Collier(2) predicted complexequations for the variation of the permeability K and the inertial flowcoefficient B with the applied compressive strain ε. Their data, for strains< 0.6, did not validate the high strain region of these equations.Therefore both their equations and experimental correlations were used(step 2 in the next section).
Explicit Finite Difference Calculations
In the model, the 20 slices decrease in volume as the foam is compressedin the y direction. The finite difference approximation considers eachslice as a reservoir of gas at a constant pressure pi, and localises the gas
3Mills paper 5/11/02, 1:22 pm349

350 Cellular Polymers, Vol. 21, No. 5, 2002
N.J. Mills and G. Lyn
flow resistance to intervening ‘pipes’ (Figure 4). The time interval ∆tbetween steps was chosen to be the shortest that was stable; typically 1 µsfor a 200 mm diameter cylinder and 0.1 µs for a 100 mm diametercylinder. In the model a flat-based striker of mass m and initial velocity V0hits the foam and compresses it uniaxially. This mass moves with a singledegree of freedom, so the position of its lower flat face is defined by asingle y coordinate. The main calculation steps, repeated at intervals ∆tuntil the striker has rebounded from the foam, are of the:
1) strain increase, due to the striker velocity acting for the time interval ∆t.
2) foam air flow parameters for the new strain, either by using therelationships proposed by Hilyard and Collier(2)
B B
RR
K KRR
= − −−( ) −( )
−( ) = − −
−( ) −( )
−( )0
3
0
3
211 1
11
1 11
εε
ε εε
ε (5)
where R is the foam relative density, and the subscripted variablesare those at zero strain, or by using the experimentally determinedrelationships
Figure 3 Force oscillations on a 2 ms scale in 200 mm square specimens,impacted from 1 m (no central hole) and 0.5 m (central hole)
3Mills paper 5/11/02, 1:24 pm350
351Cellular Polymers, Vol. 21, No. 5, 2002
Modelling of Air Flow in Impacted Polyurethane Foam
B B K K= −( ) = −0 01 0 73 1 0 83. ( . )ε ε (6)
3) pressure increase in each slice, due to the strain increase, assumingno change in the gas content, using the ideal gas law
PV/T = constant (7)
where P is the absolute pressure, V the volume, and T the absolutetemperature
4) pressure difference ∆Pi between slices i and i+1 = Pi+1 - Pi
5) flow velocity vi through the pipe to the right of the slice i, calculatedfrom the pressure gradient ∆Pi , using an inversion of equation (1).The sign of v is the same as the sign of ∆Pi
6) net volume gain ∆Vi of each slice, in the time interval, due to the flowvelocities
∆V v vi i i= −−1
for the 1-D model and
∆V r v r vi i i i i= −− −1 1
for the axisymmetric model.
7) new slice pressures PN, from the net volume gain, using
P i P i
V tzN O( ) ( )= +
1∆ ∆∆
(8)
Figure 4 Treatment of gas flow between 3 layers in the Finite Differencemodel. The chambers contain air at constant pressure, while the pipes act asthe flow resistance
3Mills paper 5/11/02, 1:26 pm351

352 Cellular Polymers, Vol. 21, No. 5, 2002
N.J. Mills and G. Lyn
for the 1-D model and
P i P i
V tr rN O
i
( ) ( )= +
1
∆ ∆∆
(9)
for the axi-symmetric model. The slice pressures were stored as ‘old’values PO for the next time increment.
8) mean air pressure, across the foam upper surface.
9) mean compressive stress in the foam, adding the contributions fromthe PU structure (using Ogden’s hyperelastic strain energy function)and the mean air pressure.
10) impact force as the product of the foam mean compressive stressand its top surface area.
11) deceleration of the falling mass, using Newton’s 2nd law,
12) new striker velocity, from the deceleration and time interval.
13) height h of the foam block, from the striker velocity and the oldheight.
14) energy input (output) as a numerical integral of the striker forceversus the foam deflection when the deflection was increasing(decreasing).
It is assumed, for foam cylinders with a small central hole, that the airpressure in this hole will be the same as the air pressure contribution tothe total stress at the centre of an intact cylinder.
Predictions
The key variables in the axisymmetric model are the:
1) diameter D of the cylindrical foam block. D was > 100 mm, to avoidmacroscopic buckling, which may occur if h >D (the height h was 100 mm).
2) impact velocity V0.
Unless otherwise stated, the striker mass was 5 kg. Figure 5 showspredicted stress strain curves for two cylinder diameters, using the
3Mills paper 5/11/02, 1:27 pm352

353Cellular Polymers, Vol. 21, No. 5, 2002
Modelling of Air Flow in Impacted Polyurethane Foam
Figure 5 Predicted compressive stress strain curve for 100 mm highcylinders, using K0 = 5.4 x 10⁻⁹ m2, and B0 = 130 µµµµµm: a) 250 mm diameterimpacted by 5 kg at V0 = 4.4 m/s, b) 500 mm diameter impacted by 25 kgat V0 = 10 m/s, compared with predictions for an ‘ideally-soft’ foam with nogas loss from, and the Ogden strain energy function
3Mills paper 5/11/02, 1:27 pm353

354 Cellular Polymers, Vol. 21, No. 5, 2002
N.J. Mills and G. Lyn
experimentally determined parameters, for uncompressed 64 kg m-3
density PU chip foam, of initial permeability K0 = 2.1 x 10⁻⁹ m2, and airinertia coefficient B0 = 3.4 x 10⁻⁴ m. All the predictions use equations (5)for the strain variation of the air flow parameters, unless otherwise stated.In Figure 5 the comparison curves are for two idealised foam types:
a) no gas loss from a foam of zero Poisson’s ratio, and zero polymercontribution (i.e. a very soft polymer), so the applied stress is given by
σ ε
ε=
− −p
R0
1(10)
b) the uniaxial compressive stress strain curve, calculated from theOgden strain energy function using the parameters in Table 1.
For a 100 mm diameter chip foam cylinder, impacted at 3.1 m/s, thepredicted contribution from the air flow is negligible (less than 5 kPa)when the compressive strain is > 80% and the foam stress is > 100 kPa.For a 250 mm diameter foam cylinder impacted at 4.4 m/s (Figure 5a)the predicted loading curve is significantly above the Ogden function, butfar below the ‘closed cell’ limit. Figure 5b is a prediction for a 500 mmdiameter foam cylinder impacted at 10 m/s, by a 25 kg mass. Thepredicted loading curve approaches the ‘closed cell’ upper limit. Forunloading, the mean air pressure eventually becomes negative, so thepredicted foam stress is less than the Ogden function. Therefore, forloading the PU foam, the predicted mean stress lies between the Ogdenopen-cell and the soft, closed-cell foam limits. As the size of the foamblock increases and the impact velocity increases, the predicted meanstress increases relative to the Ogden function.
The model predicts the following phenomena:
a) There is a non-uniform stress distribution across the upper andlower surfaces of the impacted foam block. Figure 6 shows thedistribution, at a range of times, across a 500 mm diameter foamcylinder. The surface pressure is always atmospheric, but duringloading the stress distribution is approximately an inverted parabola.During unloading, when the mean stress is low, more complexS-shaped distributions can occur. Later, there is a positive parabolicdistribution.
3Mills paper 5/11/02, 1:28 pm354

355Cellular Polymers, Vol. 21, No. 5, 2002
Modelling of Air Flow in Impacted Polyurethane Foam
Figure 6 Predicted stress profiles, at times from 2 to 14 ms, across a 500 mmdiameter foam cylinder, impacted by a 5 kg mass at 10 m/s
b) Graphs, of the central foam stress versus the mean foam stress showhysteresis between the loading and unloading responses. Themagnitude of this hysteresis does not change very much with thespecimen size, and this is confirmed by experimental data (Table 2).Figure 7a shows a predicted graph for the 250 mm diameter sampleimpacted at 4.43 m/s.
c) For foam cylinders with a small central hole, the predicted slope ofa graph of central air pressure versus the mean foam stress, duringloading, increases from 0.20 to 0.47 as the cylinder diameter Dincreases (Table 3).
d) There is a hysteresis loop when the central air pressure is plottedagainst the mean foam stress for loading and unloading. The airpressure may become negative during unloading. Figure 7b comparesthe predictions with experimental data for a 200 mm square sample.
3Mills paper 5/11/02, 1:28 pm355

356 Cellular Polymers, Vol. 21, No. 5, 2002
N.J. Mills and G. Lyn
The stresses in the foam are only high when the compressive strains arevery high, so these are high strain phenomena for the PU foam.
To predict a high slope for the air pressure vs. stress relationship, Hilyard andCollier’s equations (5) must be used for the strain dependence of the air flowparameters. If the experimental equations (6) are used, the mean slope of theloading curve is zero. Hence the high strain ( ε > 0.7) values of B and K arecritical to the success of the simulation. The air flow resistance of the highlycompressed foam determines the features in Figure 7.
The amount of hysteresis in Figure 7 increases slightly if the impactvelocity of the striking mass is increased. However the maximum strainin the foam also increases.
elohonhtiwsnemicepsnostsettcapmI2elbaT
nemicepShtdiw
mm
thgiehporDm
erusserplartnecfoepolSrofhpargssertsmaof.sv
gnidaol
fo%06ta%siseretsyHssertskaep
aPk
latnemirepxE detciderP latnemirepxE detciderP
001 5.0 71.1 70.1 31
051 5.0 65.1 90.1 01 7
002 0.1 79.0 81.1 41 11
052 0.1 snoitallicso 02.1 21 7
elohlartnecahtiwsnemicepsnostsettcapmI3elbaT
htdiwnemicepSmm
thgiehporDm
ssertsmaof.sverusserpriafoepolSgnidaolrofhparg
latnemirepxE detciderP
001 5.0 61.0 02.0
051 5.0 91.0 32.0
002 0.1 04.0 64.0
052 0.1 53.0 74.0
3Mills paper 5/11/02, 1:28 pm356

357Cellular Polymers, Vol. 21, No. 5, 2002
Modelling of Air Flow in Impacted Polyurethane Foam
Figure 7 Comparison of predicted — — — and measured ______ a) centralstress in a 250 mm square block with no hole, b) central air pressure in a200 mm square block with a hole, vs. the mean foam stress for 5 kg impactsat 4.4 m/s
3Mills paper 5/11/02, 1:28 pm357

358 Cellular Polymers, Vol. 21, No. 5, 2002
N.J. Mills and G. Lyn
EXPERIMENTAL METHOD
Air Flow Measurements
Equipment for BS 4443-6: Method 16(15) was used. In the standard, thepressure differential is fixed at 125 Pa, and the gas flow rate through a25 mm long specimen is measured. Here the gas flow rate was fixed andthe pressure differential was measured with an electronic differentialpressure transducer, with 35 kPa range, connected to the chambersupstream and downstream of the sample holder. Samples of 50 by50 mm cross-section, with 25 or 50 mm length were used.
The rig was fitted with orifice-type gas flow meters, with ranges of 0 to25, 10 to 100 and 100 to 500 litres/min. The largest meter was used forthe majority of the tests, with the rig connected to a compressed air supplythat provided air flow rates up to 500 litres/min. The foam wascompressed, in a direction perpendicular to the air flow direction, tostrains of between 0 and 70% prior to the measurements. To achieve astrain of 50%, a block of 100 mm high, by 50 mm wide, by 50 mm longwas compressed to a height of 50 mm and inserted into the sampleholder. To achieve higher air velocities, a modified sample holder wasused with a cross sectional area of 39 by 39 mm, with the same 50 mmsample length.
The steady state gas flow Q in m3 s-1, and the differential pressure ∆p weremeasured. The air velocity v through the foam is given by
v = Q/A (11)
where A is the cross-sectional area of the foam. If the downstream relativepressure is significantly greater than atmospheric, as occurs with thesmallest range flow meter, the real air velocity through the foam will belower than that computed using equation (11). However with the500 litres/min meter, there was no need for a correction. The pressuregradient through the foam was calculated as ∆p/L0 where L0 is the originalfoam length.
There was a concern that, at high air flow rates, large pressure gradientsthrough the foam could compress the foam in the direction of air flow.Therefore, measurements were made of the position of the foamupstream surface position, using a Penny and Giles linear resistivedisplacement transducer, connected via a Pico ADC12 Analogue toDigital converter to a PC. A coarse wire mesh supported the foam
3Mills paper 5/11/02, 1:28 pm358

359Cellular Polymers, Vol. 21, No. 5, 2002
Modelling of Air Flow in Impacted Polyurethane Foam
downstream surface, so the change in L could be measured. Themeasurements showed negligible compression of the foam length.
A check was made of the effect of sealing the surfaces of the rebondedfoam to the sample holder using EVA hot melt adhesive.
Air Pressure Measurements During Compressive Impacts onFoam
The test rig (Figure 8) had a freely-falling steel flat striker of mass 5.59 kg,fitted with a linear accelerometer, aligned vertically. It was dropped fromheights from 0.5 to 1.0 m. The deceleration and pressure data wascaptured digitally with 12-bit accuracy, sampling at 1 kHz, using a Picomodel ADC-212 analogue to digital converter. Numerical integrationwas used to convert the striker acceleration vs. time data into strikerposition vs. time. From this the strain in the foam could be computed.Newton’s 2nd law gave the force on the striker, hence the averagecompressive stress on the top surface of the foam.
A model 6005 Kistler quartz pressure transducer, of range 1000 bar andsensitivity 9.0 pC/bar, was fitted with its 6 mm diameter flat face flushwith the surface of the lower flat anvil, at its centre. The transducer eithermeasures the compressive foam stress at a central location on the foamlower surface, or for a sample with a central vertical cavity, the airpressure in that cavity. A 1 MN quartz load cell, in the support for thelower anvil, could measure the compressive force acting on the anvil.
Foam from a 100 mm thick mat was used(6). Blocks of dimension L byL were cut from the 100 mm thick foam mat with a band-saw, where
Figure 8 Compressive impact test rig with flat striker, and pressuretransducer in the lower flat anvil
3Mills paper 5/11/02, 1:28 pm359

360 Cellular Polymers, Vol. 21, No. 5, 2002
N.J. Mills and G. Lyn
L = 100, 150, 200 or 250 mm. Separate blocks were prepared with a13 mm diameter hole drilled along their vertical central axis. Thespecimens were secured in place on the anvil, using some double-sidedadhesive tape, to avoid them moving off the anvil in the rebound phase.The tests were repeated three times for each foam sample.
EXPERIMENTAL RESULTS
Air Flow Measurements
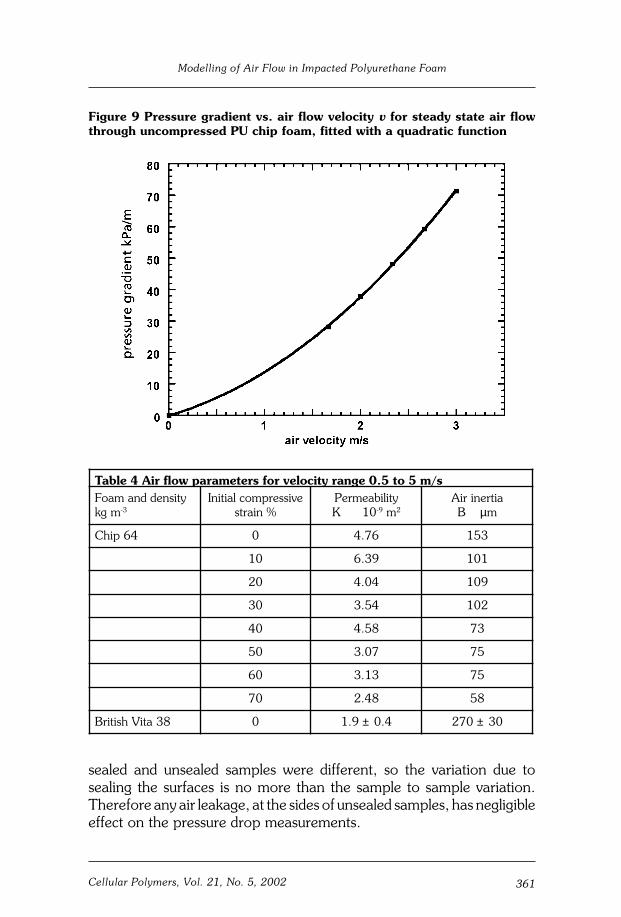
Data for the pressure gradient vs. v was fitted with a quadratic function,using the programme Kaleidograph. (Figure 9). The values of K and B inequation (1) were calculated from the linear and quadratic coefficientsusing the density and viscosity of air at atmospheric pressure and thesample length. Table 4 gives values for the various foams. The values forthe chip foam were respectively 2.5 times, and 8 times larger than, thevalues (K = 2.06 x 10⁻⁹ m-2 and B = 17.5 x 10⁻⁶ m) reported by Hilyardand Collier(2) for the virgin PU foam they labelled J. They did not identifythe foams tested, and differences in the foam density, cell size, and in theproportion of closed faces would affect the constants. The air velocities,for most of the measurements reported here, were 10 times higher thanin Hilyard and Collier’s measurements. The flow constants of the virginPU flexible open-cell foam of density 38 kg m-3 (Table 4) are closer tothose for the chip foam than to the values quoted by Hilyard and Collier(2).
Values of 1/B and 1/K were plotted against the compressive strain(Figure 10), and fitted with linear relationships (equations (6)). There isscatter in the data, and the lines do not extrapolate to zero values whenthe strain is 1 – R (R is the relative density); the air flow resistance is infinitewhen the foam is compressed to a solid.
Equation (5) proposed by Hilyard and Collier, when plotted as B/B0 vs.strain, is nearly linear with a slope of –1.17. Their equation for K/K0 hasa positive curvature when plotted against strain, and lies well below theK/K0 data from Figure 10.
Air flow tests were made on 6 uncompressed samples taken fromdifferent parts of the foam mat. The standard deviations for K and B werefound to be 13% and 11% of the respective means. The effect, of sealingthe surfaces of the rebonded foam to the sample holder, on thedifferential pressure for a given flow rate, was found be less than 5%. The
3Mills paper 5/11/02, 1:28 pm360
361Cellular Polymers, Vol. 21, No. 5, 2002
Modelling of Air Flow in Impacted Polyurethane Foam
sealed and unsealed samples were different, so the variation due tosealing the surfaces is no more than the sample to sample variation.Therefore any air leakage, at the sides of unsealed samples, has negligibleeffect on the pressure drop measurements.
Figure 9 Pressure gradient vs. air flow velocity v for steady state air flowthrough uncompressed PU chip foam, fitted with a quadratic function
s/m5ot5.0egnaryticolevrofsretemarapwolfriA4elbaTytisneddnamaoF
mgk 3-evisserpmoclaitinI
%niartsytilibaemreP
01K 9- m2aitreniriA
B µm
46pihC 0 67.4 351
01 93.6 101
02 40.4 901
03 45.3 201
04 85.4 37
05 70.3 57
06 31.3 57
07 84.2 85
83atiVhsitirB 0 9.1 ± 4.0 072 ± 03
3Mills paper 5/11/02, 1:28 pm361

362 Cellular Polymers, Vol. 21, No. 5, 2002
N.J. Mills and G. Lyn
Compressive Impact Tests on PU Foam Blocks of DifferentSizes
Figure 7a shows the central surface stress measured for a 1 m drop ontoa 250 mm square foam block, plotted against the mean foam stress.There is a hysteresis loop for loading /unloading, with a nearly constant12 kPa reduction in pressure on the unloading phase. Table 2 gives datafor the other specimen sizes.
For a 200 by 200 mm specimen (Figure 11), there is an initial stressplateau at 8 kPa with an oscillation superimposed, whereas for the100 by 100 mm specimen there is no sign of a stress plateau. The plateaucannot be the contribution of the air pressure, which, if there is no air loss,produces a 100 kPa Young’s modulus. It is evidence of a cross effect,whereby ‘trapped’ air stabilises the shape of the foam cells, and delaystheir collapse until the applied stress exceeds 8 kPa.
Figure 10 Variation in the air flow parameters B and K with compressivestrain, fitted with straight lines
3Mills paper 5/11/02, 1:28 pm362

363Cellular Polymers, Vol. 21, No. 5, 2002
Modelling of Air Flow in Impacted Polyurethane Foam
Air Pressure Measurements During Compressive Impacts onFoam
In a plot of central air pressure versus the mean foam stress for the200 mm square sample (Figure 7b), the slope of the loading relationshipis about 0.4. Values for other specimen sizes are given in Table 3.Figure 12 shows the pressure in the central air cavity and foam meanstress versus time for the 150 by 150 mm square sample. The air pressurevariation is almost in phase with the variation of the mean foam stress.
VALIDATION OF THE MODEL WITH EXPERIMENTAL DATA
The model has no arbitrary parameters, that could ‘improve’ thepredictions. The only approximation is that a foam block of width anddepth L is modelled as an axisymmetric cylinder of diameter L. Thepredicted slopes of central foam pressure vs. the mean foam stress, forfoam blocks with no central hole (Table 2), are within 0.3 of the
Figure 11 Initial part of the stress-strain curve for a 200 mm squarespecimen, impacted from 1 m, compared with that for a 100 mm squarespecimen, impacted from 0.5 m
3Mills paper 5/11/02, 1:28 pm363

364 Cellular Polymers, Vol. 21, No. 5, 2002
N.J. Mills and G. Lyn
experimental values. Since experimental loading slopes > 1 are consistentwith the pressure distribution across the surface of the foam being aninverted parabola, of the type shown in Figure 6. Figure 7a comparespredictions with experimental data for the 250 mm square sample. Theexperimental data has oscillations of the mean stress on loading, but thereis good agreement in the general shapes of the graphs. The predictedhysteresis, expressed as the pressure differential between loading andunloading, half way to the maximum stress, is 60% of the observedvalues. Some of the experimental hysteresis must be due to a cause otherthan gas flow; one possibility is that there is slight lateral bulging of thefoam on loading, so the friction at the foam/metal interface leads to ahigher pressure at the centre of the foam (a ‘friction hill’).
The predicted slopes of the graphs of central air pressure versus meanfoam stress, for impacted foam blocks with central holes (Table 3), areslightly larger than the experimental slopes. They show the same trendwith specimen diameter. Figure 7b compares predictions with experimentaldata for the 200 mm square sample- the agreement is better on loadingthan on unloading. However, the longer period of negative pressure on
Figure 12 Air cavity pressure and foam mean stress versus time for a 150 mmsquare sample with hole, impacted from 1 m
3Mills paper 5/11/02, 1:28 pm364

365Cellular Polymers, Vol. 21, No. 5, 2002
Modelling of Air Flow in Impacted Polyurethane Foam
unloading could be due to the foam adhering slightly to the metal platens.Given that this prediction depends critically on the high strain values ofthe foam constants B and K, which have not been measured directly, theagreement is acceptable.
DISCUSSION
Quantitative comparisons, of air pressures within a foam cavity with thefoam mean stress, have been made for the first time. The traces are farless ‘noisy’ than those reported by Sims and Pentrakoon(3). The airpressure contribution explains why the central surface stress is higher ina foam specimen than the mean stress. It is intended in future to measurethe pressure distribution across a large PU foam block during an impacttest, using an array of transducers across the support table surface; thiswould confirm details of the air flow model.
The permeability K of the PU chip foam is twice as large as that of a virginPU foam of density 38 kg m-3. The greater density of the chip foam shoulddecrease the K value, while the incomplete bonding of chips, and gapsbetween some chips, which create inter-chip passages for air flow shouldincrease it. Hilyard and Collier suggest that B is related to the roughnessof the flow passages and their irregular nature, but these parameters aredifficult to quantify. In the pre-compressed chips, many cell edges arebent and close to neighbours, and this increases the number of obstaclesto the air flow, and may increase the irregularity of the passages.Recently(16) air pressure drops through open-cell aluminium foams havebeen predicted using a regular Kelvin cell model - the same mechanismsof streamline and turbulent air flow were invoked. As the manufacturingprocess for these Duocell foams starts with open-cell PU foams havinglarge cells, the modelling could be appropriate for the PU foams studiedhere, which have similar cell shapes and foam relative densities. Thepredicted pressure gradient vs. air velocity plots had a similar shape tothose in Figure 9, but the pressure gradients were a factor of 8 smaller.Much of this difference can be explained, as the mean PU foam cell sizeis 20% of that of the metal foams. In future it may be possible to predictthe air flow parameters of PU foams from the foam geometry. However,no one has investigated experimentally the nature of the air flow on thescale of foam cells.
An axisymmetric finite difference model for air flow appears able to predictmost of the phenomenon in compressive impact tests on PU foams.
3Mills paper 5/11/02, 1:28 pm365

366 Cellular Polymers, Vol. 21, No. 5, 2002
N.J. Mills and G. Lyn
Comparisons, of predictions with the measured mean foam pressure andair cavity pressures for a range of specimen sizes, validate the model.However the predictions are critically dependent on the air flow parametersat compressive strains higher than those for which air flow measurementshave been made. Consequently they depends on Hilyard and Collier’smodel of the high strain behaviour of the parameters B and K.
The compressive stress-strain relationship of chip foam at low strain ratesis more linear in the 0 to 20% strain range, than is virgin PU foam; thepre-compression of some chips means that they do not exhibit an initialcollapse plateau. The composite nature of the foam, with individual chipsvarying in moduli, means that the initial collapse of one chip has a minoreffect on the macroscopic response of the foam. The lower Young’smodulus of chip foam, compared with virgin foam of the same relativedensity and polyurethane type, means that the it is more affected byimpact velocity, via air flow effects. This allows the material to be soft forstatic loads yet large mats can be stiffer at impact rates. It is intended touse the air flow model to improve the FEA modelling of head impacts(6)
on PU foam mats.
ACKNOWLEDGEMENTS
We thank Dr G.L.A Sims of the Manchester Materials Science Centre,UMIST, for the loan of the Air Flow Value rig. G.L. thanks EPSRC forfinancial support in the form of a research studentship.
REFERENCES
1. Jones R.E., and Fesman G., J. Cell. Plast., 1, (1965) 200.
2. Hilyard N.C. and Collier P., Cell. Polym., 6, (1987) 9.
3. Sims, G.L.A. and Pentrakoon D., Cell. Polym., 16, (1997), 431.
4. Hong, J.H. et al, paper 980965 in Polymer Composites andPolymeric Materials, SP-1351, (1998), S.A.E. Warrendale, PA.
5. Gibson L.J. and Ashby M.F., Cellular Solids, Pergamon Press,Oxford, (1988) pp 178-181.
6. Lyn G. and Mills N.J., Sports Eng., 4, (2001), 153.
7. BS EN 12503:2001 Sports mats, British Standards Institution,London.
3Mills paper 5/11/02, 1:28 pm366

367Cellular Polymers, Vol. 21, No. 5, 2002
Modelling of Air Flow in Impacted Polyurethane Foam
8. Neuray M.P., Rompola T. et al, Polyurethanes Conference 2000, 37.
9. Ogden R.W., Proc. Roy. Soc. Lond., A 328, (1972) 567.
10. Mills, N.J. and Gilchrist, A., Cell. Polym., 19, (2000) 389.
11. Mills, N.J. and Gilchrist, A. Cell. Polym., 16, (1997), 87.
12. Sims G.L.A. and Bennett J.A., Poly. Eng. & Sci., 38, (1998) 134.
13. Zhu H., Mills N.J. & Knott J.F., J. Mech. Phys. Solids, 45, (1997),1875.
14. Voronina N., Appl. Acoustics, 55, (1998) 67.
15. BS 4443-6:1991 Methods of test for flexible cellular materials: 16Determination of air flow value, British Standards Institution,London.
16. Fourie J.G. and Du Plessis J.P., Chem Eng. Sci., (2002) 57, 2781.
slobmyS
A aeranoitcesssorc B tneiciffeocwolflaitrenimaof
D rednilycforetemaid F ecrof
h thgieh J = λ1 λ2 λ3 latotfoerusaememulov
K ytilibaemrepmaof L htgnel
m ssam N regetni
P erusserpetulosba p0 sllecnierusserpsaglaitini
∆P laitnereffiderusserp Q etarwolf
r ecnatsidlaidar R ytisnedevitaler
∆t lavretniemit T erutarepmetetulosba
v yticolevwolfria V emulov
V0 yticolevrekirtslaitini w htdiw
α i βilargetni-nongnittif-evruc
stnenopxeε niartsgnireenigneevisserpmoc
η ytisocsivria λImaoffosoitarnoisnetxelapicnirp
µi,iludomraehs νi
oitars’nossioP
ρ ytisnedria σ1ssertsevisserpmoc
3Mills paper 5/11/02, 1:28 pm367

368 Cellular Polymers, Vol. 21, No. 5, 2002
N.J. Mills and G. Lyn
3Mills paper 5/11/02, 1:28 pm368