
MODELLING OF A CAPILLARY DISCHARGE SOFT X-RAY LASER ...
159
MODELLING OF A CAPILLARY DISCHARGE SOFT X-RAY LASER TEH CHEW PENG THESIS SUBMITTED IN FULFILLMENT OF THE REQUIREMENTS FOR THE DEGREE OF DOCTOR OF PHILOSOPHY DEPARTMENT OF PHYSICS FACULTY OF SCIENCE UNIVERSITY OF MALAYA KUALA LUMPUR 2013
Transcript of MODELLING OF A CAPILLARY DISCHARGE SOFT X-RAY LASER ...

MODELLING OF A CAPILLARY DISCHARGE SOFT X-RAY LASER
TEH CHEW PENG
THESIS SUBMITTED IN FULFILLMENT OF THE REQUIREMENTS FOR THE DEGREE OF
DOCTOR OF PHILOSOPHY
DEPARTMENT OF PHYSICS FACULTY OF SCIENCE
UNIVERSITY OF MALAYA KUALA LUMPUR
2013

UNIVERSITI MALAYA
ORIGINAL LITERARY WORK DECLARATION
Name of Candidate: (I.C/Passport No: )
Registration/Matric No:
Name of Degree:
Title of Project Paper/Research Report/Dissertation/Thesis (“this Work”):
Field of Study:
I do solemnly and sincerely declare that:
(1) I am the sole author/writer of this Work; (2) This Work is original; (3) Any use of any work in which copyright exists was done by way of fair dealing and for
permitted purposes and any excerpt or extract from, or reference to or reproduction of any copyright work has been disclosed expressly and sufficiently and the title of the Work and its authorship have been acknowledged in this Work;
(4) I do not have any actual knowledge nor do I ought reasonably to know that the making of this work constitutes an infringement of any copyright work;
(5) I hereby assign all and every rights in the copyright to this Work to the University of Malaya (“UM”), who henceforth shall be owner of the copyright in this Work and that any reproduction or use in any form or by any means whatsoever is prohibited without the written consent of UM having been first had and obtained;
(6) I am fully aware that if in the course of making this Work I have infringed any copyright whether intentionally or otherwise, I may be subject to legal action or any other action as may be determined by UM.
Candidate’s Signature Date
Subscribed and solemnly declared before,
Witness’s Signature Date
Name: Designation:
HEDP-ML
Typewritten Text
Teh Chew Peng
HEDP-ML
Typewritten Text
HEDP-ML
Typewritten Text
SHC070018
HEDP-ML
Typewritten Text
781126-14-5462
HEDP-ML
Typewritten Text
HEDP-ML
Typewritten Text
PhD
HEDP-ML
Typewritten Text
MODELLING OF A CAPILLARY DISCHARGE SOFT X-RAY LASER
HEDP-ML
Typewritten Text
COMPUTATIONAL LASER PHYSICS
HEDP-ML
Typewritten Text

iii
Abstract
This work presents a numerical study of a Neon-like Argon capillary discharge x-
ray laser. We outline the theoretical framework and present the results of the numerical
investigations of a one-dimensional single-fluid magneto-hydrodynamics (MHD) model,
with separate electron and ion temperatures, of a capillary-discharge collisional soft x-
ray laser. The MHD equations are solved by the Lagrangian cylindrical geometry
approach. The effects of the gas filling pressure on the plasma densities and
temperatures during the implosion-pinch phase have been investigated. In addition, gas
filling pressure effects on the laser intensity for soft x-ray lasing conditions at a
wavelength of 46.9 nm of argon filled gas inside the capillary have been analyzed. The
results are compared with experimental measurements at the operating pressure ranges
(0.1 – 0.4 mbar). Besides this, other input parameters such as capillary radius, peak
current and current rise-time have also been considered in this study to optimize lasing
conditions. The MHD model has also been studied to investigate the possibility of a
nitrogen x-ray laser operating at the wavelength of 13.4 nm.

iv
Abstrak
Kerja ini membentangkan kajian berangka suatu laser sinar-x nyahcas rerambut
Argon bak Neon. Kami menggariskan rangka kerja teori dan membentangkan keputusan
siasatan berangka model magneto-hidrodinamik (MHD) bendalir tunggal dalam satu-
dimensi, dengan suhu elektron dan ion berasingan, bagi suatu laser sinar-x lembut
perlanggaran nyahcas rerambut. Persamaan MHD diselesaikan dengan pendekatan
geometri silinder Lagrangian. Kesan tekanan isian gas ke atas ketumpatan dan suhu
plasma semasa fasa letupan-picit (pinch) telah disiasat. Di samping itu, kesan tekanan
isian gas ke atas intensiti laser untuk keadaan laser sinar-x lembut pada panjang
gelombang 46.9 nm dengan isian gas argon di dalam tiub rerambut telah dianalisis.
Keputusan dibandingkan dengan ukuran eksperimen pada julat tekanan kendalian (0.1 –
0.4 mbar). Selain daripada ini, parameter input yang lain seperti jejari rerambut, arus
puncak dan masa naik bagi arus juga telah dipertimbangkan dalam kajian ini untuk
mengoptimumkan keadaan untuk menghasilkan laser. Model MHD juga telah dikaji
untuk menyiasat kemungkinan kendalian laser sinar-x nitrogen pada panjang gelombang
13.4 nm.

v
Acknowledgement
I would like to express my deep graditude to Professor Dr. Kwek Kuan Hiang
and Professor Dr. Bernardine R. Wong Cheng Kiat, my research supervisors, for their
patient guidance, enthusiastic encouragement and useful critiques of this research work.
I would like to thank Associate Professor Dr. Chin Oi Hoong for her valuable
discussion and comments. I work also like to thank Mr. Zainal, the technicians of the
laboratory of physics department for this help in offering me the resources in running
the program. My grateful thanks are also extended to my colleagues, Tony Hii King
Ung, Vanessa Phung and Patrik Lim, for their spiritual support on this project. Special
thanks to University Malaya to provide me Postgraduate Research Funds (PPP), Project
No. PS307/2008C and PS330/2009C. Finally, an honorable mention goes to our
families and friends for their understandings and supports on me in completing this
project. Without helps of the particular that mentioned above, I would face many
difficulties while doing this.

vi
Table of Contents
Page
Abstract iii
Abstrak iv
Acknowledgements v
List of figures ix
List of tables xiii
Chapter 1 Introduction
1.1 Extreme Ultraviolet and Soft X-ray Sources 1.1.1 Synchrotron Sources 1.1.2 Non-linear Harmonic Generation 1.1.3 Plasma Sources
1.1.3.1 Laser-produced Plasma Sources 1.1.3.2 Capillary Discharge Plasma Sources
1.2 X-ray Laser Sources 1.3 Applications of Short Wavelength Radiation 1.4 Overview of X-ray Lasers 1.5 Thesis Overview
1
1 3 4 5 8 10 10 11 12 14
Chapter 2 Theoretical Background
2.1 Introduction 2.2 Fundamental Laser Theory 2.3 Specific Concepts in X-ray Lasing
2.3.1 Recombination Pumping 2.3.1.1 X-ray Laser Experiments Using
Recombination Pumping 2.3.2 Collisional Excitation Pumping
2.3.2.1 X-ray Laser Experiments Using Collisional Excitation Pumping
2.4 Capillary Discharge Driven Plasmas 2.4.1 Magneto-hydrodynamic Model 2.4.2 Coupled Rate Equation of The Plasma 2.4.3 Lagrangian Grid Structure 2.4.4 Numerical Method 2.4.5 Boundary Conditions
16
16 16 22 26 30
31 34
34 36 38 39 40 41
Chapter 3 Numerical Study of a Capillary Discharged Neon-like Argon X-Ray Laser
3.1 Properties of Argon Plasma in Equilibrium
42
42

vii
3.2 Population and gain requirements for Ne-like Ar 3.3 Case Study: Ionization Dynamics and One-dimensional MHD
Model 3.4 The Initial Parameters 3.5 Results of MHD Simulations 3.6 Argon Ionization And Energy Level Populations 3.7 Gain Factor Time Dependence 3.8 Influence of Opacity on Gain Coefficients 3.9 Comparison with Other Experiments
3.9.1 Case 1: Rocca’s experiment (1994) 3.9.2 Case 2: Niimi’s experiment (2002) 3.9.3 Case 3: Heinbuch’s experiment (2005)
46 49
49 50 54 56 57 59 59 62 64
Chapter 4 Laser System Optimization of Ne-like Ar Soft X-ray Laser
4.1 Dependences of plasma parameters and gain factor on the pressure
4.2 Dependences of the pressure-optimized gain factor on the current peak value
4.3 A High Current Experiment Study 4.4 System Optimization Study of 100 kA Current Peak
68
68
71
74 78
Chapter 5 Modeling of Capillary Discharge X-ray Image Output Using a Ray-tracing Code
5.1 Ray Trajectories And Formalism 5.2 Geometry of Code 5.3 Numerical Results And Discussions 5.4 Analysis of Capillary Discharge Soft X-ray Laser Experiments
89
91 95 97 103
Chapter 6 Modelling of a Nitrogen X-ray Laser Pumped By Capillary Discharge
6.1 Introduction 6.2 Principle of Recombination Pumping 6.3 A Case Study
107
107 107 109
Chapter 7 Conclusion 117
Appendix
A. Published Work B. Ray-tracing Code C. The Derivation of The Energy Balance with Thermal Diffusion
for Electrons and Ions D. The Derivation of The Magnetic Field Transport and Diffusion
Equation
119
120 137 140
141

viii
References 142

ix
List of Figures
Page 1.1 The wavelength and photon energy ranges and designations of the
electromagnetic spectrum from Infrared (IR) to x-ray regions. 2
1.2 Schematic illustration of an undulator used to produce x-ray radiation through oscillating electron motion. Figure taken from Attwood [3].
4
1.3 Harmonic spectrum produced in 13 torr of Ne by 806 nm high intensity laser. Harmonic number 65 would correspond to a wavelength of 12.4 nm. Figure is adapted from Macklin [5].
5
1.4 Schematic diagram of a laser-produced plasma. 8 1.5 Comparison of relative brightness of difference types of EUV and soft
x-ray sources. Where markers are shown these represent nominal values for the indicated wavelength. This figure is adapted from Reference [9] and a comparison of other sources with relatively lower brightness can be found therein.
9
1.6 Schematic diagram of the LiH capillary-discharge setup. Figure is adapted from reference [10].
10
2.1 Schematic diagram of a gain medium that supports lasing. 18 2.2 Energy-level diagram and relevant excitation and decay processes of an
atomic three-level system. 20
2.3 Recombination scheme for C VI ion. Figure taken from reference [21]. 28 2.4 Three-level laser energy diagram with collisional pumping processes
shown. 32
2.5 Schematic diagram of energy levels involved in the collisionally excited Ne-like 3p-3s laser in Se and Ar. Taken from Ref. [19].
34
2.6 X-ray pinhole photograph of a pulsed power driven (exploding wire) z-pinch plasma exhibiting extreme axial non-uniformity due to instabilities (Taken from [19]).
35
3.1 Argon ionization fractions dependences on plasma electron temperature for atom density 18 3
0 2 10 cmN −×.
45
3.2 Average plasma charge Z for the Argon atom with density 18 3
0 2.0 10 cmN −× as a function of temperature. 45
3.3 The contour of gain in 3p 1S0 – 3s 1P1 transition as function of the electron temperature and density.
48
3.4 Basic parameters of discharge in capillary with diameter of 3 mm filled with argon at a initial gas filling pressure of 0.15 mbar for I0 = 16 kA and rise time 50 ns. (a) The plasma time-space flow diagram; blue line corresponds to the discharge current at outer boundary; (b) contour lines of the decimal logarithm of the electron density (measured cm-3) on the (t, r) plane; (c) contour lines of the electron temperature (measured in eV).
51
3.5 Contour lines of the percentage of electric current (which normalized over 16 kA of peak discharge current) inside the region with radius r and time t.
54
3.6 Substantial changes of ionization fraction as a function of the time. 55 3.7 Population densities of Ar ions as a function of time. 56 3.8 The spatial and temporal evolution of gain. 57 3.9 The spatial and temporal evolution of gain after taking opacity effect
into account. 58
3.10 Basic parameters of a discharge in a capillary of diameter of 4 mm 61

x
filled with argon at a initial gas filling pressure of 700 mTorr for I0 = 39 kA and rise time 30 ns. (a) The plasma time-space flow diagram; the dotted line corresponds to the discharge current at outer boundary; (b) contour lines of the logarithm of the electron density (measured cm-3) on the (t, r) plane; (c) contour lines of the electron temperature (measured in eV); (d) contour lines of the fraction of ion Ar8+; (e) contour lines of the gain (measured cm-1).
3.11 Basic parameters of discharge in capillary with diameter of 3 mm filled with argon at a initial gas filling pressure of 150 mTorr for I0 = 27 kA and rise time 50 ns. (a) The plasma time-space flow diagram; dotted line corresponds to the discharge current at outer boundary; (b) contour lines of the decimal logarithm of the electron density (measured cm-3) on the (t, r) plane; (c) contour lines of the electron temperature (measured in eV); (d) contour lines of the fraction of ion Ar8+; (e) contour lines of the gain (measured cm-1).
63
3.12 Basic parameters of discharge in capillary with diameter of 3.2 mm filled with argon at a initial gas filling pressure of 700 mTorr for I0 = 22 kA and rise time 30 ns. (a) The plasma time-space flow diagram; dotted line corresponds to the discharge current at outer boundary; (b) contour lines of the decimal logarithm of the electron density (measured cm-3) on the (t, r) plane; (c) contour lines of the electron temperature (measured in eV); (d) contour lines of the fraction of ion Ar8+; (e) contour lines of the gain (measured cm-1).
65
4.1 (a) Maximum compression time versus initial gas filling pressure, (b) Temporal evolution of electron density, (c) Temporal evolution of electron temperature.
69
4.2 Time dependences of the gain factor for alumina capillary (r0 = 1.5 mm, rise time 50 ns, Imax = 16 kA) for various initial gas filling pressures (in mbar).
70
4.3 Current wave form for 13.5 kA, 16 kA and 19 kA which are extracted from the experiments of Tan [17].
71
4.4 The electron densities and electron temperature on the axis of the capillary during the maximum compression with various initial gas filling pressures for the peak discharge, Imax, of 13.5 kA (black dash line), 16 kA (black solid line) and 19 kA (black dot-dash line) which superposed from the Fig. 3.3.
72
4.5 Dependence of gain factor peak value with opacity effect included on the initial gas filling pressures for current peak of 13.5 kA (dashed line) and 19 kA (solid line).
73
4.6 Basic parameters of discharge in capillary with diameter of 4 mm filled with argon at a initial gas filling pressure of 1.3 Torr for I0 = 190 kA and rise time 18 ns. (a) The plasma time-space flow diagram; dotted line corresponds to the discharge current at outer boundary; (b) contour lines of the decimal logarithm of the electron density (measured cm-3) on the (t, r) plane; (c) contour lines of the electron temperature (measured in eV); (d) contour lines of the fraction of ion Ar8+; (e) contour lines of the gain (measured cm-1).
76
4.7 Contour lines of the percentage of electric current (which normalized over 190 kA of peak discharge current) inside the region with radius r and time t.
77
4.8 (a) Radial motion of outer plasma mass elements, (b) Temporal evolution of electron temperature, (c) Temporal evolution of electron
80

xi
density (d) Temporal evolution of gain; for various initial gas filling pressures (in mbar) for 100 kA of current peak, 50 ns of current rise time and 6 mm of capillary diameter.
4.9 (a) Radial motion of outer plasma mass elements, (b) Temporal evolution of electron temperature, (c) Temporal evolution of electron density (d) Temporal evolution of gain; for various initial gas filling pressures (in mbar) for 100 kA of current peak, 75 ns of current rise time and 6 mm of capillary diameter.
82
4.10 (a) Radial motion of outer plasma mass elements, (b) Temporal evolution of electron temperature, (c) Temporal evolution of electron density (d) Temporal evolution of gain; for various initial gas filling pressures (in mbar) for 100 kA of current peak, 100 ns of current rise time and 6 mm of capillary diameter.
83
4.11 Electron density and temperature at peak of the gain of each configuration.
85
4.12 The gain values versus initial gas filling pressure in each configuration. 86 5.1 Coordinate definitions for cylindrical geometry 91 5.2 Electron profile from Eq. (5.12). 93 5.3 Ray trajectories obtained from the electron profile, Eq. (5.7). 94 5.4 The geometry of the code. The plasma is divided into cells along the
propagation axis. 95
5.5 Electron density profile at maximum compression by current pulse of 16 kA peak current having rise time about 50 ns with 20 cm long capillaries of 3 mm diameter filled with 0.15 mbar of pure argon gas.
98
5.6 Ray trajectories with stimulated electron density profile for propagation along z at the initial point of 34 10 cm−× with different launching angles.
99
5.7 Determination of initial launch angle. 99 5.8 Gain profile at maximum compression by current pulse of 16 kA peak
current having rise time about 50 ns with 20 cm long capillaries of 3 mm diameter filled with 0.15 mbar of pure argon gas.
100
5.9 Integrated intensity obtained as a function of z. Rays are launched at the time of pinch. The red bold solid curve is obtained with the same code but without refraction effects.
101
5.10 The image of the plasma column at various points along the capillary. 102 5.11 The images of the plasma column in the exit of the capillary and the
pinhole. 102
5.12 Comparison experiment at data and the simulation in a 3 mm diameter capillary excited by current pulse of 16 kA peak current having a first half cycle duration of about 50 ns. The full line is meant to guide the eye.
104
5.13 Comparison data of the experiment and the simulation in 3 mm in diameter capillary, excited by current pulse of 19 kA peak current having a first half cycle duration of about 50 ns.
105
6.1 Temperature dependences of nitrogen ionization fractions evaluated according to PrismSPECT code for initial nitrogen atom density N0 = 1 x 1018 cm-3.
108
6.2 Time dependence of the capillary current (dashed line) and trajectories of nitrogen plasma elements inside the capillary which simulated from Helios-CR code.
110
6.3 The evolution of core temperatures and densities of ion and electron simulated from Helios-CR code.
111

xii
6.4 Temporal and spatial evolution of ionization fraction of nitrogen simulated from Helios-CR code.
113
6.5 XRD signals (left axis) and current measurements (right axis) are shown as a function of the time. The legend shows the filter transmission energy (300 – 455 eV Ti, 300 – 575 eV Cr, and 300 – 855 eV Ni). Here the measurement with the initial pressures of N2 molecules of 0.6 Torr which extracted from Ref. [74].
114
6.6 Time-integrated transmission grating spectroscopy results at four different initial gas densities, 0.6, 1.0, 1.4, and 1.8 Torr. Bottom x axis is the spectrum wavelength λ in nanometers. The Top x axis is the spectrum wavelength E in eV, extracted from Ref. [74].
115

xiii
List of Tables
Page 1.1 Examples of observed x-ray lasers. 14 3.1 The ionization potential was extracted from [43] and peak abundance of
Argon was calculated using PrismSPECT code [44]. 44
4.1 The summary of the plasma output during the pinch at 2.5 mbar initial gas filling pressure, 100 kA peak current, 6mm capillary diameter and at the various current rise time.
81
4.2 Suggestion of range for the initial gas filling pressures in each capillary diameter.
88
5.1 The prepulse time delay that corresponding to optimum initial gas filling pressure.
105

1
Chapter 1
Introduction
1.1 Extreme Ultraviolet and Soft X-ray sources
The extreme ultraviolet (EUV) and soft x-ray spectral regions are two of the
more challenging regions of the electromagnetic spectrum within which to develop
radiation sources and the applications for these sources. There is no exact definition of
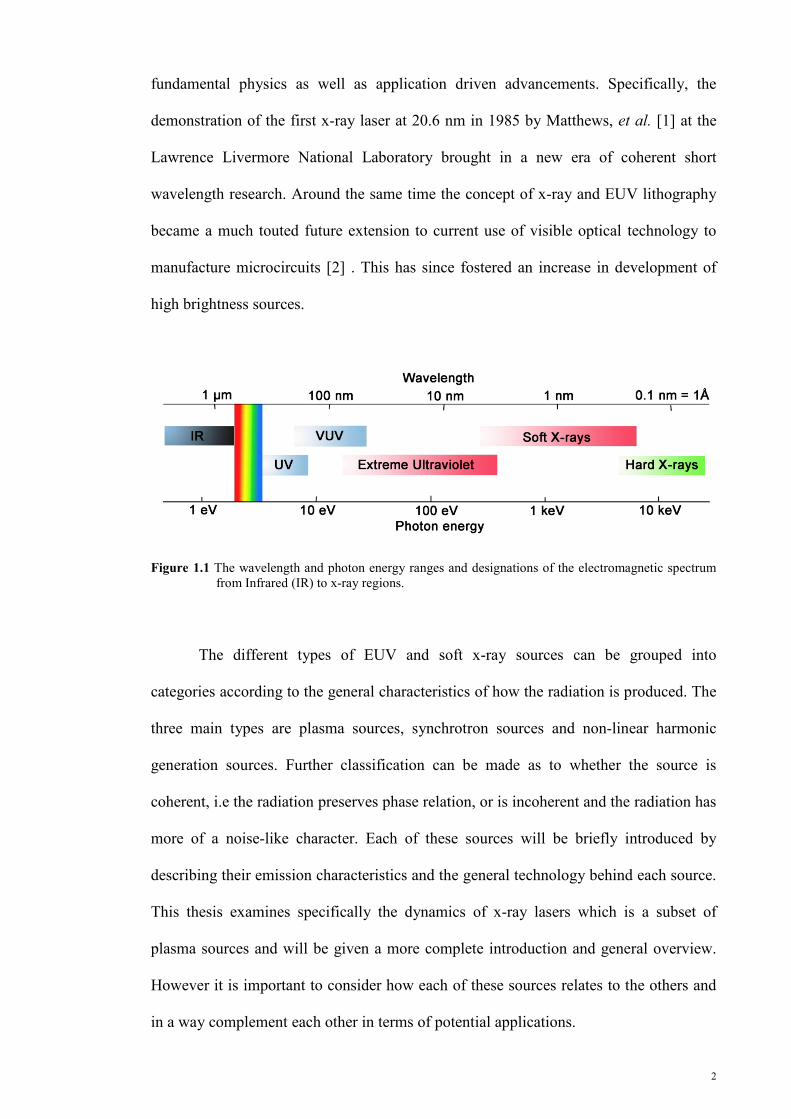
the wavelengths for which these two regions encompass, but a rough guideline is shown
in Figure 1.1 with the EUV region extending from about 110 nm to approximately 40
nm, and the soft x-ray region spanning 40 nm to nearly 0.1 nm. The difficulty with
working at these wavelengths is mainly due to the optical properties of materials in the
EUV and soft x-ray regions. The complex index of refraction in solids at these
wavelengths is characterized by strong absorption and weak reflectivity. Hence there is
a general lack of transmissive and refractive optical materials for such things as
windows and lenses. Most gases also begin to absorb strongly below 110 nm due to the
first ionization threshold occurring for photons of this energy. This requires either a low
pressure or vacuum environments to transmit or propagate the short wavelength
radiation to wherever it is to be used. In general these two technical difficulties have
hindered the development of radiation sources in this region compared with the visible
spectrum. Applications of EUV radiation have also lagged behind those for optical
radiation due to the lack of well developed and mature sources. By contrast, visible and
ultraviolet lasers were invented in the early 1960s and have undergone nearly 40 years
of development. These can now be found in a myriad of applications from
communications to medicine.
However the last few decades have been somewhat of a renaissance for activity
in EUV and soft x-ray research. This has been due to some achievements of
2
fundamental physics as well as application driven advancements. Specifically, the
demonstration of the first x-ray laser at 20.6 nm in 1985 by Matthews, et al. [1] at the
Lawrence Livermore National Laboratory brought in a new era of coherent short
wavelength research. Around the same time the concept of x-ray and EUV lithography
became a much touted future extension to current use of visible optical technology to
manufacture microcircuits [2] . This has since fostered an increase in development of
high brightness sources.
Figure 1.1 The wavelength and photon energy ranges and designations of the electromagnetic spectrum from Infrared (IR) to x-ray regions.
The different types of EUV and soft x-ray sources can be grouped into
categories according to the general characteristics of how the radiation is produced. The
three main types are plasma sources, synchrotron sources and non-linear harmonic
generation sources. Further classification can be made as to whether the source is
coherent, i.e the radiation preserves phase relation, or is incoherent and the radiation has
more of a noise-like character. Each of these sources will be briefly introduced by
describing their emission characteristics and the general technology behind each source.
This thesis examines specifically the dynamics of x-ray lasers which is a subset of
plasma sources and will be given a more complete introduction and general overview.
However it is important to consider how each of these sources relates to the others and
in a way complement each other in terms of potential applications.

3
EUV and soft x-rays can be produced in three ways; by synchrotron sources,
non-linear harmonic generation and plasma sources.
1.1.1 Synchrotron sources
The synchrotron source as a radiating source in the EUV and soft x-ray has been
in widespread use since the early 1950s. It has become a reliable source of radiation for
basic research and a test bed for many applications. Synchrotron radiation itself is a
byproduct of the motion of accelerated charged particles. Large facilities such as the
Advanced Light Source (ALS) at the Lawrence Berkeley Laboratory utilize storage
rings where the electron beam is circulated and then used to produce radiation. Special
insertion devices are placed in the path of the electron beam to produce radiation with
specific characteristics, such as wavelength spectrum and spectral qualities. Two
general types of insertion devices called undulators and wigglers are in common use
today. These devices are periodic arrays of magnets which cause the electron beam to
deflect due to the Lorentz force and undergo oscillatory motion and give off
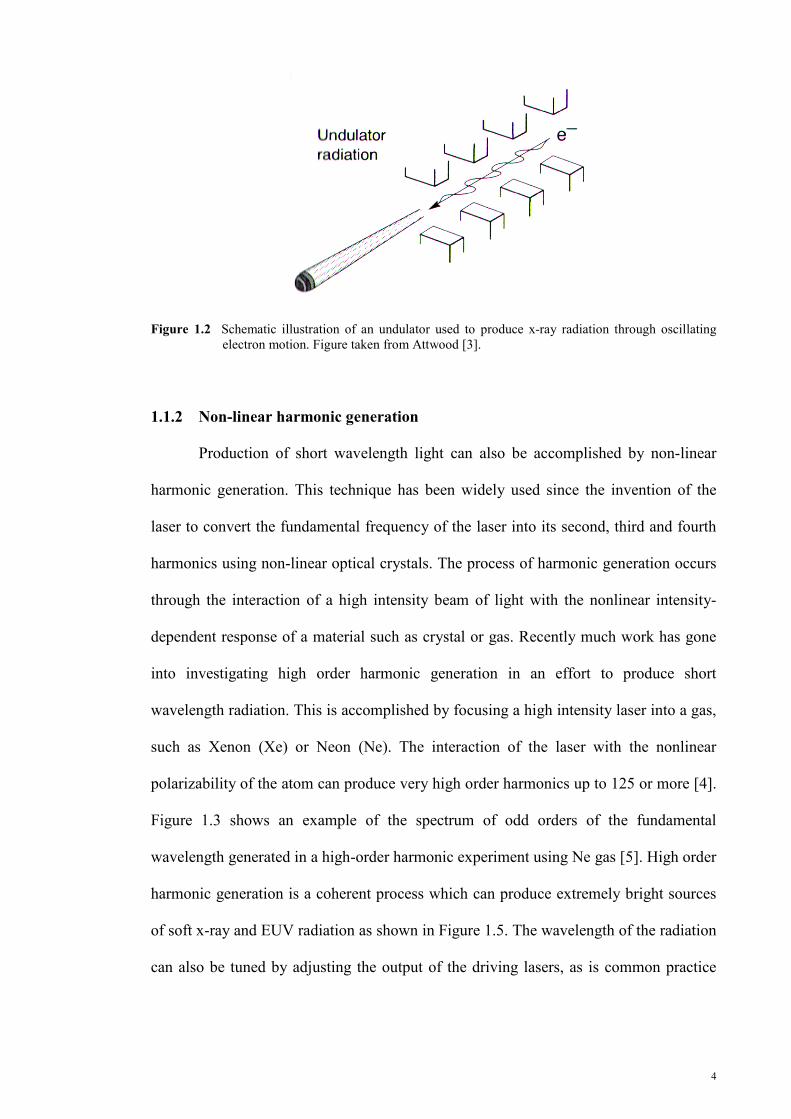
synchrotron radiation. Fig. 1.2 shows a schematic diagram of an undulator. The actual
spectrum is different in undulators and wigglers. Undulators produce periodic narrow
bands of radiation due to interference effects while wigglers produce a more continuous
spectrum. One important characteristic of synchrotron radiation is its partial coherence
as opposed to the laser-produced plasma and capillary discharge source which are
essentially incoherent. This makes synchrotron radiation almost laser-like which is
important for applications which require a degree of coherency.
4
Figure 1.2 Schematic illustration of an undulator used to produce x-ray radiation through oscillating electron motion. Figure taken from Attwood [3].
1.1.2 Non-linear harmonic generation
Production of short wavelength light can also be accomplished by non-linear
harmonic generation. This technique has been widely used since the invention of the
laser to convert the fundamental frequency of the laser into its second, third and fourth
harmonics using non-linear optical crystals. The process of harmonic generation occurs
through the interaction of a high intensity beam of light with the nonlinear intensity-
dependent response of a material such as crystal or gas. Recently much work has gone
into investigating high order harmonic generation in an effort to produce short
wavelength radiation. This is accomplished by focusing a high intensity laser into a gas,
such as Xenon (Xe) or Neon (Ne). The interaction of the laser with the nonlinear
polarizability of the atom can produce very high order harmonics up to 125 or more [4].
Figure 1.3 shows an example of the spectrum of odd orders of the fundamental
wavelength generated in a high-order harmonic experiment using Ne gas [5]. High order
harmonic generation is a coherent process which can produce extremely bright sources
of soft x-ray and EUV radiation as shown in Figure 1.5. The wavelength of the radiation
can also be tuned by adjusting the output of the driving lasers, as is common practice

5
today. Also phase matching techniques in gas-filled capillaries have significantly
increased the efficiency of the harmonic output at the shorter wavelengths [6].
Figure 1.3 Harmonic spectrum produced in 13 torr of Ne by 806 nm high intensity laser. Harmonic number 65 would correspond to a wavelength of 12.4 nm. Figure is adapted from Macklin et al. [5].
1.1.3 Plasma sources
EUV and soft x-ray sources contain information about their physical plasma
state. The physics of plasmas involves interaction between many charged particles on a
microscopic scale through the electric and magnetic fields associated with their
positions and velocities. Fortunately, by consideration of macroscopic, collective
interactions where the charges are described in terms of charge densities and currents
may simplify this extremely complex many body problem. In general the radiation
consists of a broad spectral continuum, plus narrow line emission from the various
ionization stages of those elements present. The process in which radiation is emitted
from plasmas consists of three main types called free-free, bound-free and bound-bound.
The free-free process is often called bremsstrahlung radiation. Such radiation is due to
the interaction of free electrons as they collide and undergo changes in acceleration
which gives rise to the release of radiative energy via photons. This process produces a
continuous or broadband spectrum since radiation can be procured at all wavelengths. In

6
contrast the free-bound spectrum process involves the capture of a free electron by an
ion whereby the energy gained is given off by the release of a photon. This also
produces a continuous spectrum due to the just mentioned continuous range of electron
energies. This process is also referred to as recombination radiation.
In plasma the bound-bound radiative process involves the specific electronic
transition in an ion between two states bound to the nucleus of the ion. The energy level
structure of the ion, just as in neutral atoms, is composed of discrete states which are
described by quantum mechanical wavefunctions characterized by principal, orbital and
spin quantum numbers. The states are arranged in energy according to these quantum
numbers. However the binding energy between the charged nucleus and remaining
electrons of an ion is larger than that of a neutral atom due to the additional net charge
on the nucleus. This causes the energy level separation of states to be higher in the ion.
When an electron makes a transition from an upper energy states to a lower energy
states a photon is emitted with exactly the energy of the separation of the states. In ions
this energy level separation can correspond to the photon energies extending into the
EUV and soft x-ray wavelength regions. Thus bound-bound radiation gives rise to so-
called line radiation since the emitted wavelength is discrete. In addition the frequency
spread or linewidth of the radiation can be quite narrow due the specific characteristics
of the transition. Such emission is termed narrowband. In some ions the energy level
structure has many closely-spaced levels. When emission occurs from each of these
closely-spaced levels the wavelengths are very similar and tend to overlap each other
creating a quasi-continuous spectrum. Hence plasma sources in general are comprised
of continuous radiation and line radiation at specific wavelengths.
The actual emission spectrum of plasma is solely determined by the state of
plasma and, of course, the components or ionic species contained in the plasma. The
state of the plasma can be defined in general by two fundamental parameters,

7
temperature and density. In collisionally dominated plasma (common to laboratory
plasmas) each of the constituent particles, i.e. the ions and electrons, will tend to form a
Maxwellian distribution of velocities due to equipartition of energy through collision
with each other [7]. The only parameter that defines this distribution is the temperature
such that the plasma may be described as having an electron temperature and an ion
temperature, Te and Ti, respectively. Hence the temperature describes the kinetic and/or
thermal energy of the electrons and ions. Furthermore due to plasma neutrality the
corresponding electron density and ion density in the plasma are related by, e i ii
n Z n=∑ ,
where ne is the electron density, ni is the ion density of species i, and Zi is the charge
state of species i.
The consequence of describing the plasma by its temperature and density is quite
far reaching. However for the purposes here describing short wavelength radiation from
plasmas, a few general comments can be made to illustrate some qualitative issues.
Considering weakly ionized plasma the effect of increasing the electron temperature by
some means generally causes a shift to higher ionization levels through collisional
ionization. Thus the spectrum of radiation would then originate from higher ion stages
or states thereby accessing more energetic transitions and producing shorter
wavelengths. The effect of increasing electron density for a given ion density increases
the charge state by the above neutrality relation. It also goes directly to creating
increased populations of excited levels that are capable of radiating thereby increasing
the amount of radiation emitted.
The following sub-sections describe the techniques for generating plasmas in
order to produce EUV and soft x-ray radiation. These are laser-produced plasma sources
and capillary discharge plasma sources.

8
1.1.3.1. Laser-produced plasma sources
The laser-produced plasma has been extensively studied as a mean of producing
short wavelength radiation [8]. The laser plasma is created by focusing an intense
pulsed laser on a target made of heavy element such as tungsten, tin, etc. The schematic
diagram of laser-produced plasma is shown in Fig. 1.4. The laser radiation is absorbed
by the material and quickly forms plasma of dense highly ionized material due to the
heating caused by the absorption of laser radiation. The heating causes the plasma to
become increasingly ionized thus creating highly charged ions with many electrons
removed. Intense x-ray and EUV emission is produced in the form of line and
broadband continuum radiation. An approximation to the emission spectrum of a laser-
produced plasma can be made by considering the plasma to be a blackbody radiator at
some temperature. This ignores the characteristic line radiation, which can be very
significant, but serves to illustrate the general emission character. The blackbody
approximation to laser-produced plasma at an electron temperature of 177 eV is shown
in Fig. 1.5.
Figure 1.4 Schematic diagram of a laser-produced plasma.
Fig. 1.5 is an adaptation of a useful diagram conceived by Ceglio [9] in which
different EUV and soft x-ray sources may be compared with respect to their individual
brightness defined by the quantity (photons/ (sec mm2 mrad2 .01% bandwidth)). A word
of caution is needed here in interpreting this figure. A judicious definition of spectral

9
brightness may tend to place one type of source above the other and make it appear
more intense and thus give the connotation of being better. In this case short duration
narrow band sources such as laser-produced plasmas (considering line radiation) are
favored by the definition mentioned above. As the remaining types of sources are
discussed and related to this figure it is important to consider that it is only a relative
comparison. In fact as the sources are discussed it will become evident that different
sources are suited to different tasks and therefore should only be absolutely compared in
terms of analyzing each source in its competitiveness for a specific use or application.
Figure 1.5 Comparison of relative brightness of difference types of EUV and soft x-ray sources. Where markers are shown, these represent nominal values for the indicated wavelength. This figure is adapted from Reference [9] and a comparison of other sources with relatively lower brightness can be found therein.

10
1.1.3.2. Capillary discharge plasma sources
Another example of a plasma source is the capillary-discharge shown on Figure
1.6. The plasma in a capillary discharge is confined inside a small bore or capillary a
few mm in diameter. The plasma is generated by the electrical breakdown of the
evacuated insulating capillary itself or by the electrical breakdown of a gas or other
vapor contained within the bore. These plasmas are excited by high current pulses and
can generate intense continuous spectra as well as line radiation. More details will be
described in the next chapter.
Figure 1.6 Schematic diagram of the LiH capillary-discharge setup. Figure is adapted from reference [10].
1.2 X-ray laser sources
X-ray lasers are a subset of plasma sources since they utilize plasmas as the
active medium by which amplification of the radiation occurs. These sources are the
major subject of this work, thus they are only addressed here to describe how they fit in
with the other sources being compared and discussed. They are the brightest sources
available at their unique concentration of light into a small directed beam of very

11
narrow linewidth. They are coherent sources as well, making them suitable for special
applications such as interferometry and holography. The Neon-like Argon (Ar8+ ) laser
at 46.9 nm was demonstrated in 1994 by Rocca, et al. [11] at Colorado State University
using plasma produced in a capillary by an electrical discharge. Chapter 2 will give a
more detailed introduction and overview of x-ray lasers and lay the groundwork for the
investigations in x-ray laser plasma dynamics studied for this thesis.
1.3 Applications of Short Wavelength Radiation
Much of the advancements in short wavelength radiation sources have been due
to the demand for such in certain applications. One very important application
mentioned earlier is extreme ultraviolet lithography. As integrated circuits become more
complex they must pack more features into essentially the same amount of physical
space. Typically this has been done by reducing the wavelength in optical lithography in
order to increase the resolution and produce finer and finer features. However as the
features continue to shrink below 0.1 μm, optical lithography will cease to provide the
needed resolution. Thus the use of EUV radiation has come to the forefront as the
source necessary to carry on the technology past the 0.1 μm limit. Much effort has gone
into developing laser plasma and capillary discharge sources due to their demand for
use in EUV lithography [12, 13].
X-ray microscopy has become an important tool in the ever-increasing need for
imaging equipment in the biological and nano-structure fields. These microscopes use
laser plasma sources as well as synchrotron sources for a variety of demanding high
resolution imaging needs [14].
In general short wavelength sources tend to be somewhat large and expensive.
Synchrotron sources tend to be the costliest and most complex of the short wavelength
sources due to the overheads associated with the electron storage ring. Laser plasma and

12
harmonic generation sources usually require expensive high energy lasers drive.
Electrical discharge sources are probably the least complicated and can be made very
compact. Due to the demands of the applications mentioned above there is a need to
reduce the size and cost in order to make these sources more practical. For instance in
EUV lithography the capillary discharge requires much less space and costs
significantly less than a comparable source utilizing laser-produced plasma. An EUV
microscope may also one day be constructed utilizing a capillary discharge source
which would be no larger that present day scanning electron microscopes.
Application driven development is a strong force behind the technology of short
wavelength sources. These sources will therefore evolve in directions dictated by the
specific areas. For instance the capillary discharge with its small footprint and high
average power could be applied to microscopy and lithography. High harmonic
generation with its high peak power and coherence properties will probably find use in
studies of dynamics systems, such as pump-probe diagnostics. X-ray lasers are already
being used as tools to do interferometry of high density plasmas in support of fusion
research and are just beginning to find applications in chemical research as well. In
addition, the scaling down in size of sources makes them more accessible to small scale
laboratories which will in turn lead to the development and realization of more
applications.
1.4 Overview of X-ray Lasers
X-ray lasers have been briefly introduced in the context of comparing the
different types of short wavelength radiation sources. A more general overview will
now be given to introduce some of the specific types of x-ray lasers not already
mentioned and describe past and current efforts to achieve lasing in the EUV and soft x-
ray regions. To date all successful x-ray lasers have operated in plasmas. There are two
13
main reasons behind this fact. Firstly, it has already been mentioned that x-ray
transitions arise from the electronic transitions in highly charged ions. Thus a plasma is
directly suited to providing ionized species for which x-ray radiation may be produced.
The second reason is that plasmas can generally satisfy the requirements and provide
the appropriate conditions for producing a laser medium at short wavelengths. This is by
no means inevitable since the requirements are quite stringent, but plasmas can provide
the right conditions under the right circumstances. The details of the latter are the major
focus of this work and will be developed in the following chapters.
Until recently most x-ray lasers were produced in laser-produced plasmas using
very high energy large driver systems. The lasers used to produce the plasmas had pulse
energies in the few hundred of joule range or more and generally occupied large
facilities. It is not surprising that with such high energy lasers the plasmas generated
were very high temperature plasmas composed of highly stripped ions. This was the
case for the first x-ray laser in 24x ionized Se. Since the first x-ray laser, many more
lasers have been demonstrated in highly ionized plasmas. In fact there exist particular
types of ions that have been most successful for producing lasers. For instance Se24+ has
the same number of remaining electrons as does neutral Neon, hence it is termed a Ne-
like ion. Another example would be C5+ which has only one remaining electron and
therefore is similar to hydrogen and is termed a H-like ion. The electronic configuration
of these ions then is similar to their neutral counterpart. It has been found that by scaling
a known laser transition in a neutral species to the similar transition in the neutral-like
ion there exists a good chance of creating a laser. This is the basis of isoelectronic
scaling and it will be discussed in detail in Section 2.3 of Chapter 2. With that in mind
the Hydrogen-like, Neon-like, and also the Nickel-like ions have been found to be
successful ion species to create x-ray lasers.

14
To date, EUV and soft x-ray lasers have been observed from nearly 70 nm down
to 3.6 nm. Table 1.1 shows a sample list of some of the observed x-ray lasers [15]. Note
that in some cases lasing occurs at multiple wavelengths.
Table 1.1 Examples of observed x-ray lasers. This is adapted from reference [15].
Ne-like ionic species
Lasing wavelength (nm)
Ni-like ionic species
Lasing wavelength (nm)
Y29+ 15.5 Au54+ 3.56 Sr28+ 16.41; 16.65 W46+ 4.31 Se24+ 20.64; 20.98 Ta45+ 4.48 Ge22+ 23.22; 23.63 Eu35+ 6.58 Ar8+ 46.88 Yb42+ 8.11
Recent advances in capillary discharge x-ray lasers and small scale high energy
lasers have formed a new class of x-ray lasers based on the “table-top” concept. Thus
instead of large driver systems, x-ray lasers can now be built and developed in smaller
laboratory environments. In the case of capillary discharge the electrical driver systems
are quite modest in size and can even be made quite compact [16] such that a capillary
discharge x-ray laser can effectively fit on a table-top. High-power, ultrashort pulse
lasers or so called table-top terawatt lasers are also being inverstigated as the driver for
x-ray lasers as well. The latter is especially suited to the optical-field ionized x-ray laser
which is a special class of x-ray laser based on a highly non-equilibrium plasma.
1.5 Thesis Overview
The objective of this research is to study the dynamics of the plasma in a
capillary-discharge of soft x-ray lasers through magneto-hydrodynamic (MHD)
modelling. Throughout the end of the research, qualitative trends in the kinetics of ions
and the design of Z-pinch will be suggested.

15
This introduction has illustrated the types of sources available in the EUV and
soft x-ray regions and briefly discussed the technologies behind each source. Particular
emphasis has been placed on x-ray lasers, which is the topic of this thesis.
In Chapter 2 some basic concepts of the laser will be developed and then
extended to x-ray lasers. This is followed by a discussion of two of the main methods to
produce x-ray lasers in plasmas, i.e., recombination pumping and collisional pumping.
A discussion of the theory behind the capillary-discharge x-ray laser will be given since
it provides the basis for simulation investigation for this type of x-ray laser. In addition
background theory will be described for modelling of a capillary-discharge soft x-ray
laser.
Chapter 3 describes a numerical study of a collisional excitation pumping of
capillary discharge neon-like argon soft x-ray laser based on Helios-CR [17] simulation.
Through this study, in Chapter 4, the optimization of gain for specific configurations
[18] can be estimated.
However, the electron density profile will also bend the ray and its will influence
the output intensity of laser. Due to this, Chapter 5 describes the modelling of a
capillary discharge soft x-ray out intensity based on the ray tracing code.
In chapter 6, the feasibility of a nitrogen-recombination soft x-ray laser using
capillary discharge Z-pinch has been examined in order to search for shorter wavelength
to enable for the technology.
Finally, Chapter 7 summarizes the work and gives concluding remarks on the
relevance of the work presented with respect to the field of x-ray lasers.

16
Chapter 2
Theoretical Background
2.1 Introduction
The main focus of the work presented in this thesis is the analysis and description
of the plasma dynamics associated with the operation of x-ray lasers. In this chapter the
basic framework will be developed for the investigations undertaken in two different
types of x-ray lasers.
To begin, the general concepts of fundamental laser theory will be given and then
extended to x-ray lasers. Once the basics have been established the specific scheme of
collisionally excited x-ray lasers will be introduced. This will provide the basis for the
detailed modelling of such lasers in Chapter 3. Next both x-ray pumping schemes will
be described since it forms the background for operation of the capillary discharge
driven x-ray laser. In addition, plasma concepts necessary to understand the capillary
discharge-driven x-ray laser will be given. These concepts introduce the key plasma
conditions and parameters that are crucial to successful x-ray laser operation. The final
section of this chapter will provide the theory behind plasmas to establish the key
parameters in the plasma dynamics relevant to the capillary discharge driven x-ray laser.
2.2 Fundamental Laser Theory
The term "laser" is defined as Light Amplification by Stimulated Emission of
Radiation [19]. Laser operates on the principle of amplification (i.e., the gain in
intensity of a photon beam as it passes through atoms in a medium such as solid or gas.)
This amplification occurs due to stimulated emission which is the photon-induced
radiative decay of an atomic transition. To help illustrate the concept of gain, consider a
simple two-level atomic system consisting an upper energy level or state, u, and a lower

17
energy level, l, with the corresponding energy separation 0ul u lE E E∆ = − > . The lasing
transition is between these two levels and has a wavelength ulλ . Fig. 2.1 shows an
elongated column consisting of the two-level atoms representing a gain medium of
amplifier length z that supports lasing, it grows exponentially over the length L. Then,
as it reaches the saturation intensity I(L) or Isat, it no longer grows at that rate. It then
begins to extract most of energy from the medium to the right of L and grows at an
approximately linear rate over the remaining length Y. The intensity of the laser beam
grows exponentially from some initial value 0I as it traverses a distance z along the
medium according to the equation,
( ) ( )0
g v zI z I e= , Equation Section 2(2.1)
where ( )g v is the frequency dependent gain coefficient and has dimensions of inverse
of the length and is usually expressed in cm-1. The gain coefficient is further defined
according to [15],
( ) ( ) uul u l
l
gg v v N Ng
σ
= −
, (2.2)
where ulσ is the stimulated emission cross section for the transition from the upper laser
level, u, to the lower laser level, l and Nu and Nl are the population densities of the upper
laser level, u, to the lower laser level, l. For exponential growth it is clear that ( ) 0g v >
or
1u l
l u
N gN g
>
. (2.3)
Eq. (2.3) describes the necessary condition for a laser that a population inversion
must exist. That is, the population density (number per unit volume) of the upper level,
uN , must be larger than the lower level lN times the statistical weight ratio u lg g for
the upper and lower levels.

18
In a collection of atoms in thermodynamic equilibrium at a temperature T the
population of the levels is governed by the Boltzmann distribution of
E kTu l u lN N g g e−∆= where k is Boltzmann constant. This clearly does not fulfill the
necessary requirement of a population inversion since the ratio u lN N is always less
than the unity. Thus the population inversion must be created by “pumping” which is
general term used to describe a variety of processes that can promote population to the
upper energy level. Pumping will be described in more detail after some discussion of
the stimulated emission cross section.
Amplifier length
Exponential growth
Lineargrowth
L Y
z ( ) ( )= 0g v zI z I e
Isat
I0 I(z) I(L) I(L+Y)
Figure 2.1 Schematic diagram of a gain medium that supports lasing
The lasing transition is characterized by the stimulated emission cross section
which has a dimension of area and measured in units of cm2. This cross section
HEDP-ML
Typewritten Text
Saturation Intensity
HEDP-ML
Typewritten Text
HEDP-ML
Typewritten Text
HEDP-ML
Typewritten Text
HEDP-ML
Typewritten Text

19
describes the probability of a stimulated emission event occurring on that transition. The
actual form of the stimulated emission cross section depends on the type of emission
broadening that occurs for the radiation. In gas lasers the broadening is typically
dominated by Doppler effects caused by the thermal motion of the ions and leads to
Gaussian lineshape profile for the cross section. The stimulated emission cross section
at the center of the Gaussian frequency spread for Doppler broadening is given by [19],
3
8 2ul
ul ulMAkT
λσπ π
=
, (2.4)
where M is the mass of the ion, T is the ion temperature, and Aul is the spontaneous
transition probability. Other broadening mechanisms lead to similar expressions for the
stimulated emission cross section.
The two-level atomic system used for the above description does not include
sufficient levels to describe the concept of pumping of the upper laser level and the
creation of a population inversion. Thus the three-level laser system shown in Fig. 2.2
will now be used. It will be shown later that this system is also directly relevant to
specific x-ray laser level models. The three atomic energy level or states are spaced
according to their energy separation such that the upper level is at Eu, the lower level is
at El and the lowest lying energy level, 0 (which could be a ground state), is at E0. The
upper and lower levels are subject to natural relaxation or decay processes to the next
lower lying level. The upper and lower states may radiatively decay by spontaneous
emission or they may also decay non-radiatively by collisions with other atoms. These
decay processes shown in Fig. 2.2 and collectively labeled as γ for each of the
downward pathways. Pumping to the upper energy level from the state 0 is
accomplished through either collisional processes or absorption of radiation and is
indicated by the rate 0uΓ . Pumping can also occur to the lower level via these same
processes and is described by the rate 0lΓ .

20
The rate of change of population in the upper and lower levels can be described
by a set of rate equations [19]. For the steady state case the equations can be set equal to
zero and are given by,
( )0 0 0
0 0 0
0
0.
uu u ul u
ll u ul l l
dN N Ndt
dN N N Ndt
γ γ
γ γ
= Γ − + =
= Γ + − = (2.5)
0
u
l
Eu
El
E0
Laser
Γ0u
Γ0l
γ ul
γ 0u
γ 0l
Figure 2.2 Energy-level diagram and relevant excitation and decay processes of an atomic three-level
system.
The ratio of the population upper state to the lower state is determined from these
equations. It is often the case in atomic systems that the decay rate is purely radiative;
therefore it is possible to set γ = A for each of the downward pathways. In addition
when 0lA is large, 0uA is usually small due to consideration of the energy level
separation. Thus solving Eq. (2.5) under these conditions yields the following for the
ratio of the upper and lower population levels,

21
( )
0
0 0
11
u l
l l u ul
N AN A
≡+Γ Γ
. (2.6)
In order for a population inversion to exist in steady state, the ratios of the
pumping and the radiative decay must be such that Eq. (2.6) is greater than unity. More
importantly, Eq. (2.6) indicates that it is better to have a very fast decay out of the lower
level and a fast pumping to the upper level as compared to the lower level. It should also
be noted that the population inversion will only last so long as the pumping is applied.
In the case where the pumping is only on for a period of time greater than the lifetime of
the upper level, 1 ulA , but not continuous, the operation of the laser is termed quasi-
steady state. This is an important concept in x-ray lasers.
In addition to the steady state operation just described, the three-level system can
be used to illustrate the transient inversion scheme. In this case it is assumed that there
is no decay out of lower laser level. Thus the laser is said to be self terminating. This
will also be of important to a specific x-ray laser pumping scheme to be discussed later.
Eqn (2.5) cannot be set to zero since the time dependence is of interest in this case. To
further simplify the equations, 0uγ is assumed to be negligible on the time scales of
interest and thus the upper level decay time is simply 1 ulAτ = . Silfvast [19] shows that
under these conditions the ratio of the upper level to the lower level is given by,
( )0
0
1
1 1
tu
l tl
u
N eN t e
τ
τ
τ
−
−
−= Γ
+ − − Γ
. (2.7)
The maximum duration the inversion will last (and hence the gain) is given by
setting 0 0lΓ = and solving for τ with 1u lN N = . This yields a value of 1.6 ulAτ = .
Thus the transient pumped laser can be characterized by a short gain duration depending
upon the exact value of the spontaneous decay rate of the upper energy level.

22
2.3 Specific Concepts in X-ray Lasing
The basic concepts and fundamental relations just described apply to lasers in
general, whether x-ray, visible or infrared. However the fundamental parameters that
define lasing, such as the stimulated emission cross section and gain, are somewhat
different for x-ray lasers. In addition, the pumping requirements for x-ray lasers are
significantly more demanding than for other lasers operating at longer wavelengths.
This is mainly due to the nature of the highly energetic energy levels involved in the x-
ray laser transitions. The concepts specific to x-ray lasers will now be addressed by
examining some scaling relations.
In order to access x-ray transitions it is necessary to strip electrons from atoms
and create highly ionized species. This is one reason why plasmas are an ideal medium
to create x-ray lasers. As an example consider a lasing transition between two bound
levels with principal quantum numbers n1 = 3 and n2 = 2 in a H-like ion. The energy
level separation is given by ( )12
2 2 22 113.6 1 1nE Z n n∆ = − − (in eV) where Z is nuclear
charge. In H-like B4+ (Z = 5), for example, the n1 = 3 to n2 = 2 transition has an energy
separation of 47 eV which corresponds to an x-ray wavelength of 26.3 nm. Likewise H-
like Carbon (Z = 6) has a wavelength of 18.2 nm for the same transition. This type of
scaling of wavelength with Z for a given transition in an ion with a neutral-like
electronic configuration is termed isoelectronic scaling. Hydrogen was used here as a
simple example for which the energy separation is easily calculated, but isoelectronic
scaling applies to other ion species as well even if the Z2 scaling is not maintained. For
instance Se24+ has essentially the same relative energy level structure as neutral Ne.
Isoelectronic scaling is most useful in utilizing known lasing transitions in neutral atoms
and then proceeding along the same electronic configuration in highly charged ions to
identify possible lasing transitions at short wavelengths.

23
In H-like ions the spontaneous transition probability scales as 4 HulZ A where H
ulA is
the probability for the same transition in hydrogen. The lifetime of the upper level is
given by the inverse of the spontaneous transition probability or ( ) 14 HulZ A
−. This
illustrates that for H-like ions upper level lifetimes scale as 41 Z ; thus the lifetimes
decrease rapidly for increasing nuclear charge of the ion. (In the special case of the
transient inversion laser mentioned in Section 2.2 the gain duration lasts only on the
order of this lifetime and this effectively restricts the lengths of x-ray laser gas mediums
unless traveling wave excitation is used). Typical upper level lifetimes in the x-ray
region are picoseconds to femtoseconds. This reduction in lifetime duration also applies
in general to non H-like ions, but the same scaling cannot be used.
The stimulated emission cross section generally decreases with wavelength as can
be seen for the case of Doppler broadening in Eq. (2.4). However there is an implicit
wavelength dependence on Aul that should be included before continuing with a scaling
relation. The spontaneous transition rate can be expressed in terms of the oscillator
strength for the transition, ful, charge of the electron, e, the permittivity of a vacuum, ε0,
the mass of electron, me and speed of light, c, which is fairly constant for a given
transition along isoelectronic sequences [15]. Thus Aul can be written as [19],
( )
2
20
2 ulul
e u l ul
e fAm c g g
πε λ
= . (2.8)
The stimulated emission cross section follows from substitution of Eq. (2.8) into
(2.4) which gives,
( )
2
0
28 2
ul luul
e u l
e f Mm c g g kT
λ πσπ ε π =
, (2.9)
where the wavelength dependence is explicitly seen to be not as strong but still
decreases significantly at shorter wavelength. One might conclude that the gain would

24
also decrease, however this is generally not the case with x-ray lasers. In fact x-ray
lasers usually exhibit high gain values with decreasing wavelength.
The basis of increasing gain with decreasing wavelength is that the reduction in
stimulated emission cross section is compensated by the ability to produce a much
higher inversion density at shorter wavelengths [19]. This is where pumping becomes
very important in producing the large upper level state level densities. To see how much
high densities are achieved, consider a collisional mixing argument based on the
specific case of electron collisional excitation. (This concept will be discussed in greater
detail in Sec 2.3.2). In plasmas composed of free electrons and ions, collisions occur
frequently. In the case of electron-electron collisions, the number of collisions per unit
time depends on the temperature and density of the electrons in the plasma. The electron
collisions can cause both excitation and de-excitation of levels. If the collisional de-
excitation rate of the upper level approaches that radiative decay rate out of the lower
level the population inversion will begin to be destroyed. This effectively places an
upper limit on the electron density in the plasma and still be able to support a population
inversion. This maximum electron density is readily calculated [15] and is given by,
( ) ( )
1 224max 30
3
5.1 10 cmele
ul ul ul
kTAnA Gλ
−×= , (2.10)
where ulλ must be given in Angstroms, ekT is the electron temperature in eV, and ulG
is the Gaunt correction factor that originates from the collisional rate and usually has a
value between 0.1-1 [15]. Most lasers, lasing from visible to x-ray wavelengths, operate
very close to this maximum electron density [19]. Since in a plasma the relation
between ion density and electron density is e i ii
n Z n=∑ , then it could be expected that
the ion density, and hence the upper laser level density, would scale in the same manner
since 0uN N∝ . Therefore considering Eq. (2.9) and (2.2) the gain coefficient would

25
scale as 21 λ . Hence the gain can increase with decreasing wavelength if sufficient
pumping is available. The scaling done here does not apply to every type of pumping
mechanism possible; however it does illustrate the general trend seen with many
pumping methods in x-ray lasers [19].
Values for the gain coefficient g in x-ray lasers can range from 1 to hundreds in
units of cm-1. Thus it is seen that even short gain lengths can produce considerable gL
products and hence large amplification.
However, there are two conditions which lead to gain reduction and extinction
and they can become important in x-ray lasers just as in longer wavelength lasers. The
first condition is collisional mixing which has just been described above and led to the
relationship in Eq. (2.10). Exceeding the maximum electron density causes destruction
of population inversion and hence reduction of the gain. The second condition is
radiation trapping which reduces the decay rate of the lower state level due to the
immediate reabsorption of a photon emitted from the lower state level to level 0, thus
re-exciting level l. This trapping is dependent on the ground state density N0. Silfvast
[19] shows that radiation trapping begins to increase Nl when the value of 0 0l N bσ
becomes greater than 1.46 where b is the radius of the gain medium.
Another consequence of the limited gain duration is that x-ray lasers mainly
operate in a mode termed as amplified spontaneous emission. This is stimulated
emission without feedback as in an optical laser with an external high reflecting cavity
surrounding the active medium. With short gain duration one must consider the light
propagation time that limits the distance that mirrors can be placed relative to the ends
of the medium and the number of passes allowed. Some experiments have been
attempted with a single mirror that allow double pass amplification, however the plasma
environments associated with x-ray lasers and the close proximity of the mirrors cause
rapid degradation of the mirror reflectivity, if not catastrophic damage [15].
26
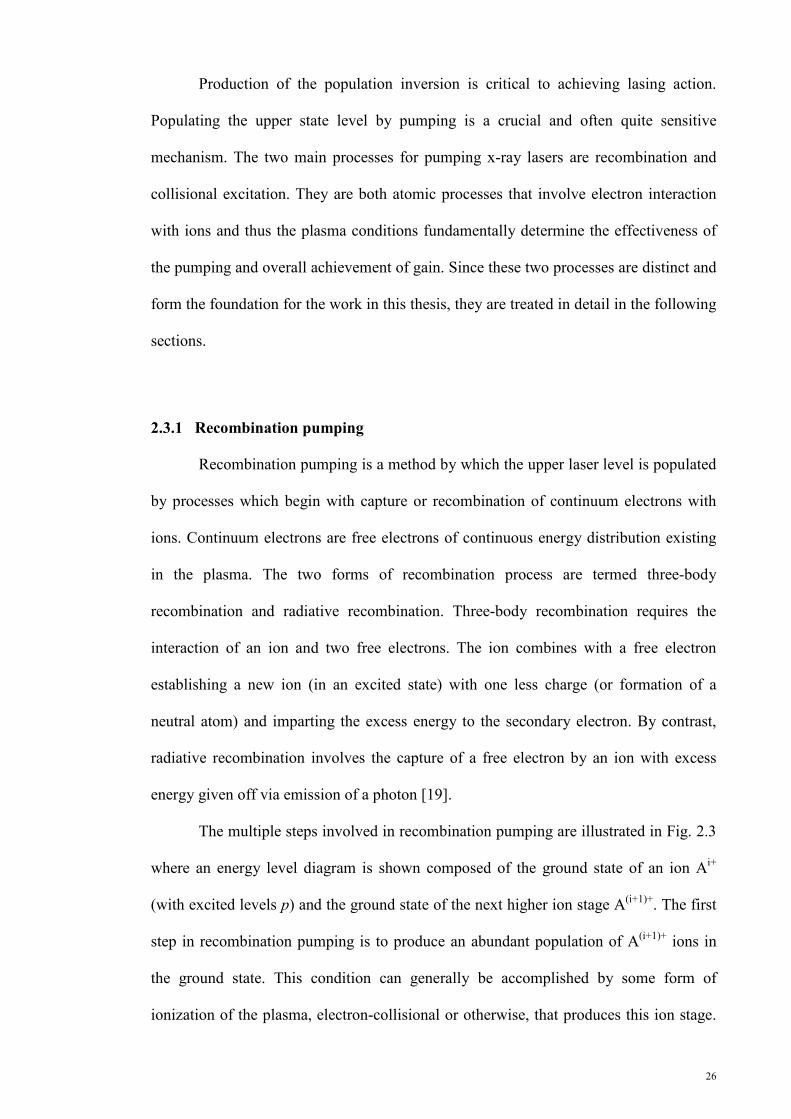
Production of the population inversion is critical to achieving lasing action.
Populating the upper state level by pumping is a crucial and often quite sensitive
mechanism. The two main processes for pumping x-ray lasers are recombination and
collisional excitation. They are both atomic processes that involve electron interaction
with ions and thus the plasma conditions fundamentally determine the effectiveness of
the pumping and overall achievement of gain. Since these two processes are distinct and
form the foundation for the work in this thesis, they are treated in detail in the following
sections.
2.3.1 Recombination pumping
Recombination pumping is a method by which the upper laser level is populated
by processes which begin with capture or recombination of continuum electrons with
ions. Continuum electrons are free electrons of continuous energy distribution existing
in the plasma. The two forms of recombination process are termed three-body
recombination and radiative recombination. Three-body recombination requires the
interaction of an ion and two free electrons. The ion combines with a free electron
establishing a new ion (in an excited state) with one less charge (or formation of a
neutral atom) and imparting the excess energy to the secondary electron. By contrast,
radiative recombination involves the capture of a free electron by an ion with excess
energy given off via emission of a photon [19].
The multiple steps involved in recombination pumping are illustrated in Fig. 2.3
where an energy level diagram is shown composed of the ground state of an ion Ai+
(with excited levels p) and the ground state of the next higher ion stage A(i+1)+. The first
step in recombination pumping is to produce an abundant population of A(i+1)+ ions in
the ground state. This condition can generally be accomplished by some form of
ionization of the plasma, electron-collisional or otherwise, that produces this ion stage.

27
Note that ionization also serves the purpose of producing free electrons which
contribute to the three-body recombination process. At this point it is assumed that the
plasma has a temperature given by Te. The next step is the actual recombination of the
electrons with the A(i+1)+ ions to form the next lower ion stage. The three body
recombination process favors populating the upper lying levels in contrast to radiative
recombination which favors the lower lying levels. This will be seen more clearly when
the actual functional form of the rates is given. In collisional recombination, collisional
mixing of the upper levels occurs on a very rapid timescale due to the small energy
separation of the levels and quickly distributes population amongst the levels pN
according to the Saha equation [20],
( )
32 2
1 20 2
p
e
Ei kTi
p ee e
hN n N p em kTπ
−+ ++
=
, (2.11)
where pE is the ionization potential of any level p and h is the Planck constant. The
third step is the critical part of recombination pumping and involves the cooling of the
plasma. As the plasma cools the population in the upper levels decreases according to
Eq. (2.11). Since the energy spacing between levels increase toward the lower lying
levels there will be a level such that, with cooling, the collisional process becomes
negligible compared to radiative decay from that level. Since population is still moving
into the upper level, but not being depleted due to collisional processes, and the lower
level is emptying due to radiative decay, a population inversion can be achieved which
then leads to lasing between the upper and lower level as shown in Fig. 2.3.

28
Figure 2.3 Recombination scheme for C VI ion. Figure taken from reference [21].
Recombination processes such as three body recombination can be defined by
rates that are useful for quantifying the downward movement of population in levels
according to simple rate equations. The rate, R, of a process is found by averaging the
product of the cross section for the process and the velocity of the interaction particles
over a velocity distribution, usually Maxwellian. This is written as ( )R v vσ= . The
cross section σ is generally found by quantum mechanical scattering calculations
taking into account the initial and final wavefunctions of the interacting particles. To get
the number of reactions per unit time per unit volume, R is multiplied by the number
density of the two interacting particles. For electrons and ions interacting this would be
e in n R [19].
It is useful now to examine the functional forms of the recombination rates in
order to gain an understanding of how the inversions in recombination lasers are

29
affected by the plasma parameters, namely temperature and electron density. The
radiative recombination rate has the functional dependence [22],
3 2
,p eE T p
rr pe
ER e
T
∝
, (2.12)
where p is the particular energy level in the ion, Ep is the ionization potential of that
level and Te is the plasma electron temperature. The three-body recombination also has
the following functional dependence [23],
3 , 3
1p eE Tbr p
e
R eT
∝ . (2.13)
The important consequence of the radiative rate as seen in Eq. (2.12) is that it is
biased toward lower bound states and is less effective at populating higher levels such
as an upper laser level. This is in contrast to the three-body rate which tends to populate
the upper levels and has a much stronger dependence on the electron temperature. It is
also important to note that the actual rate for three-body recombination is proportional
to the square of the electron density since it requires the additional electron interaction
whereas the radiative rate is only proportional to electron density.
Population inversions are created by populating upper lying levels by three-body
recombination and then allowing thermal redistribution to move population to the upper
laser level as discussed above. In order to preferentially pump the upper levels, strong
cooling is generally required and the three-body rate must exceed the radiative rate.
Otherwise the inversion will be destroyed by direct pumping of the lower levels. In
addition the three body rate per unit time per unit volume is actually proportional to
2 3e i en n n≈ since there are two electrons involved in the process. Thus the strong
temperature dependence and the cubic scaling with electron density place much
significance on the plasma parameters. This forces the plasma conditions necessary to
produce a population inversion to be within a limited range of temperature and density
parameter space.

30
2.3.1.1 X-ray laser experiments using recombination pumping
The experimental realization of recombination pumped x-ray lasers is often
hindered by the demands on the plasma conditions necessary to produce inversions. In
this brief section two methods to produce recombination lasers will be discussed based
on collisionally ionized plasma and optical field ionized plasmas.
The collisionally ionized plasma as a medium for a recombination laser suffers
from the apparently incompatible requirements of first producing a high temperature
highly-ionized plasma and then trying to cool it rapidly to produce a population
inversion. However it is possible to accomplish this by creating a laser-produced plasma
and then allowing it to expand and thereby cool adiabatically. Actually at first glance
this technique seems almost assured of producing a population inversion. That is, when
a plasma expands and cools it would be expected that at some position and at some
point in time the temperature and density would be appropriate for efficient pumping. It
has worked in some cases, most notably the H-like C5+ which operates on the
3 2n n= → = transition at 18.2 nm [15]. Various methods to enhance the cooling
through conduction or radiation have also been implemented [15].
Optical field ionization of a gas was recently proposed as a method to produce a
highly non-equilibrium plasma for which recombination x-ray laser output might be
achieved [24]. This scheme attempts to overcome some of the thermal problems in
collisionally ionized plasmas for recombination x-ray lasers by utilizing the strong
electric field of ultrafast, high intensity laser pulse to ionize electrons from atoms or
ions within a time period significantly less than the recombination time of the plasma. If
a long plasma filament could be created by the laser, and the plasma was imbedded in a
cold background, plasma conditions could be appropriate for extremely rapid
recombination leading to an inversion even to the ground state instead of an excited
state as discussed above. Experiments have been conducted where a pre-formed laser-

31
produced plasma has been generated and then allowed to expand and cool and
subsequently followed by optical field ionization with a short pulse high intensity laser.
Gain has been reported using this technique in H-like Li at 13.5 nm [25].
2.3.2 Collisional excitation pumping
The most successful mechanism of pumping in x-ray lasers to date is electron-
collisional excitation pumping. It is also the most straightforward approach to
populating the upper laser level. The success of this approach is firmly grounded in well
known visible and infrared lasers which utilize this mechanism [19]. In terms of x-ray
lasers one can again consider iso-electronic scaling of known visible lasers to shorter
wavelengths.
To illustrate the concept of collisional excitation pumping a three-level laser
system like that in Fig 2.2 will be used. It is shown here again in Fig. 2.4 but the
collisional processes are explicitly diagrammed as the pumping mechanism to the upper
laser level. The analysis of the system in quasi-steady state is also exactly analogous to
the discussion given in Section 2.2 that leads to the condition for an inversion given by
Eq. (2.6). However it is useful to introduce the electron collisional excitation rate
functional dependencies on the plasma parameters as was done in the previous section.
Pumping of the upper laser level via electron collisional excitation is found to
have the following functional dependence [23],
00 0( )u eE T
u u eK e E T−∆∝ ∆ , (2.14)
where 0e un K is the pumping rate from the ground state to the upper level, 0uE∆ is the
energy level separation 0uE E− and eT is the plasma electron temperature. Collisional
de-excitation serves to depopulate the upper laser level as well as empty the lower laser
level. The de-excitation rate is found from the principle of detailed balance which

32
relates the rate of an atomic process with the rate of its inverse process. Utilizing this
principle yields the following,
ul eE Tlul lu
u
gK K eg
∆= , (2.15)
where lg and ug are the statistical weight for the lower and upper levels,
respectively.
Figure 2.4 Three-level laser energy diagram with collisional pumping processes shown.
This implies the following relation for de-excitation of the lower level,
( )0 01l l eK E T∝ ∆ . (2.16)
Similar relations hold for collisional de-excitation of the upper laser level to the
lower laser level and to the ground state.
Considering again the three level system shown in Fig. 2.4, the energy spacing is
generally such that 0 0u l ulE E E∆ > ∆ ∆ . The de-excitation rate out of the lower laser
level is usually quite rapid and, by energy gap considerations, larger than the rate out of
the upper laser level to the ground state [19]. However, the de-excitation rate of the
upper laser level to the lower laser level is therefore much greater due to the smaller
energy gap. Thus, in order to establish a population inversion, it is usually necessary to
have a fast radiative decay rate of the lower laser level to overcome the collisional de-

33
population of the upper laser level. In addition, the upper laser level should be a
metastable level in that is does not decay too rapidly via spontaneous radiative decay to
the ground. The metastable level requirement is important when the pumping rate to the
lower level is significant as can be the case with direct electron collisional excitation.
As mentioned in Chapter 1 the Ne-like iso-electronic sequence has been quite
successful in producing collisionally excited x-ray lasers. This is fundamentally due to
the stability of the closed shell configuration to further ionization and, thus, the Ne-like
stage exists over a wide range of plasma temperatures and densities. Fig. 2.5 shows the
three level energy diagram for the Se24+ and Ar8+ Ne-like lasers. These lasers utilize the
2p53p – 2p53s transition pumped from the 2p6 ground state shown. Pumping occurs to
the upper laser level by electron collisional excitation on a forbidden 0l∆ = transition
or monopole transition [15].
Fig 2.5 (b) focuses on the energy level diagram for Argon with given radiative
transition rates for the upper to lower laser level and the rate for the lower level to the
ground state. Substituting the rates into Eq. (2.6) gives 17u lN N ≈ , where the ratio of
the pumping rates is approximately unity for Ne-like excitation. A population inversion
is therefore assured. The only factors that could reduce gain in this system are electron-
collisional mixing and radiation trapping. For the Ne-like Ar capillary discharge
max 19 31 10en cm−≈ × by Eq. (2.10) with 60 80 eVekT − (see Chapter 3). Likewise the
trapping factor 0 0l N bσ can be approximated with Eq. (2.4) and is estimated to be close
to the value for which trapping would slightly reduce the inversion.

34
Figure 2.5 Schematic diagram of energy levels involved in the collisionally excited Ne-like 3p-3s laser in Se and Ar. Taken from Ref. [15].
2.3.2.1 X-ray laser experiments using collisional excitation pumping
The previous section provided some basic concepts for understanding
collisionally pumped x-ray lasers and also provided some background of the successful
Ne-like scheme. Pumping by collisional excitation has proven much more fruitful than
recombination pumping in terms of the number of demonstrated x-ray lasers. This is
generally due to the less restrictive conditions on the plasma parameters for collisional
pumping. For instance all the lasers included in Table 1.1 are collisionally pumped
lasers. The two main techniques to produce the plasmas for these x-ray lasers are again
laser-produced plasmas and the recently demonstrated electrically-driven capillary
discharge plasma [11].
2.4 Capillary Discharge Driven Plasmas
The basic theory of the capillary discharge plasma, used to drive the Ne-like Ar
laser, will now be described to provide a foundation for future chapters which deal
directly with the dynamics of these plasmas. The first types of capillary discharges date
back to the early 1960’s and were investigated for the purposes of producing EUV and
soft x-ray radiation [26]. The devices themselves are conceptually simple and consist of
a narrow capillary channel made of an insulating material placed between two

35
electrodes. A high voltage electrical circuit usually containing a capacitor is discharged
through the capillary, creating a plasma.
As stated previously early capillary discharge devices were mainly used for their
ability to produce incoherent short wavelength radiation. It has not been until just
recently that they were examined for the possibility of amplification of short wavelength
radiation [27]. The primary reason behind this was the accepted notion that long column
electrical discharge plasmas can be extremely non-uniform and would not support
lasing action. The basis for this belief rested on many decades of research with large
pulsed power devices, mainly Z- pinches and theta-pinches [15]. An example of non-
uniformity in a z-pinch is shown in Fig 2.6 where the plasma along the axis is broken up
and exhibits so-called instabilities. It is well known that electron density gradients in
plasma cause refraction of light. The plasma of Fig. 2.6 indicates a very non-uniform
plasma density such that any beam traversing the length would be subject to refraction.
Such refraction losses would probably destroy any ability to achieve amplification along
the length.
Figure 2.6 X-ray pinhole photograph of a pulsed power driven (exploding wire) z-pinch plasma
exhibiting extreme axial non-uniformity due to instabilities (Taken from [15]).
Demonstration of the first capillary discharge x-ray laser put an end to the notion
of the non-uniformity of discharge created plasma [28]. The axial uniformity of the
capillary discharge is one of the important characteristics that make it possible for
amplifying short wavelength radiation. The concept of the discharge uniformity will be
addressed in later chapters.

36
In order to produce the high electron densities and electron temperatures
necessary to pump an x-ray laser in discharge devices a sufficient amount of energy
must be transferred to the plasma in a relatively short period of time. Once the discharge
is created the energy is deposited into the plasma through the current that flows through
the column. If the current is of sufficient strength, a “pinch” will form which is the
collapse of the plasma column due to the self-generated azimuthal magnetic field
associated with the longitudinal current.
The pinched discharge can be treated as a balance between the inward electro-
magnetic forces and the outward fluid pressure forces, where the fluid is the idealistic
representation of the free electron density and ion density. This is the basis of the
equilibrium pinch and is used here to illustrate the constriction of plasma particles.
2.4.1 Magneto-hydrodynamic model The one dimensional single-fluid Magneto-hydrodynamic (MHD) model is
based on the method of describing the Z-pinch discharge plasma as a hydro-
magnetic fluid. The basic MHD equations used are depicted below.
The continuity equation (mass conservation) is given by
( ) 0,tρ ρ∂+∇ ⋅ =
∂u (2.17)
where ρ is mass density and u is the plasma fluid velocity. Generally, in any steady state
process, the rate at which mass enters a system is equal to the rate at which mass leaves
the system. In this system, the continuity equation is automatically satisfied.
The momentum conservation equation is solved in the one-fluid
approximation where the plasma electrons and ions are assumed to flow together as
a single fluid. The momentum equation is governed by
( )e i rP P P qt
ρ ∂= −∇ + + + + ×
∂u J B (2.18)

37
where Pe, Pi and Pr are the thermal pressures due to electrons, ions and radiation,
respectively. B is the magnetic field induced by the axial current and J is the axial
component of the electric current density. Here, q is the von Neumann artificial
viscosity [29] which is included in the equation of motion to handle shocks.
The energy balance with thermal diffusion for electrons and ions are
described by (refer Appendix C)
( )( )
( )
( )
2, 2
,
4
,
e ev e e e e
e iv e Abs Emis
eq
T V E VC V T Pt V t
T TC R R
t
ηκπ
∂ ∂ ∂ = ∇ ⋅ ∇ + ∇× − + ∂ ∂ ∂
−− + −
B
(2.19)
( ) ( ), , .e ii i
v i i i i v ieq
T TT E V VC V T P C qt V t t t
κ−∂ ∂ ∂ ∂ = ∇ ⋅ ∇ − + + − ∂ ∂ ∂ ∂
(2.20)
where Cv,α, Tα, Eα, Pα and κα are, respectively, the specific heat, temperature (in eV),
specific internal energy, pressure and thermal conductivity [30], of the electrons (α = e)
and ions (α = i). While V is the specific volume, the second term in Eq. (2.19) is the
joule heating term, η is defined as the plasma electrical resistivity [31], RAbs and REmis
are the radiation absorption and emission terms [32], and teq is the electron-ion
collisional coupling term.
The difference between the temperature diffusion equations for the electrons and
ions is the absence of the Joule heating term in the ion equation. Since the currents are
mainly due to the lighter electrons, the energy is transferred to the ion through the
collision specified by the term involving teq.
The magnetic field transport and diffusion equation reads
( ) ( ) .4dtηπ
∂= ∇ ⋅∇ − ∇⋅
B B u B (2.21)
This equation is obtained using Maxwell equations and generalized Ohm’s law with the
time variation of the electric field being neglected [33] (refer Appendix D).

38
2.4.2 Coupled rate equation of the plasma
The non-local thermal equilibrium (non-LTE) atomic level population density of
excited levels in ion species is coupled by the various atomic processes occurring in the
plasma. We adopted the collisional-radiative model to obtain the population. The rate
equation for atomic level i can be written as:
L LN Ni
i ij j jii j i j
dn n W n Wdt ≠ ≠
= − +∑ ∑ (2.22) where the first term on the right hand side refers to depopulation of level i. On the other
hand, the second term accounts for population of level i. ni is the number density of
level i, and NL is the total number of levels in the system. For upward transitions (i < j),
the depopulating rate [17] is
(excitations)(ionizations)
e ij ij ijij
e ij ij ij
n C B JW
n γ β+= + +Ω
(2.23)
while for downward transitions (i > j), the populating rate [17] is
( )2
(deexcitations)
(recombinations)e ji ji ji ij
ji RR DRe ji e ji ji
n D A B JW
n nδ α α
+ += + + (2.24)
where ne is the electron density; ijJ is the frequency-averaged mean intensity of the
radiation field over a line profile; Cij, γij, Dij, and δji are rate coefficients for collisional
excitation, ionization, deexcitation, and recombination; Aji, Bij and Bji are, respectively,
the Einstein coefficients for spontaneous emission, and stimulated absorption and
emission; βij is the photoionization rate; Ωij is the autoionization rate; RRjiα is the
radiative recombination rate coefficient; and DRjiα is the dielectronic recombination rate
coefficient [34-37].

39
2.4.3 Lagrangian grid structure
These MHD equations have been adopted in the Lagrangian reference frame [38,
39] using the specific volume expression, that considers, a frame moving with the fluid
at velocity u. The geometry is cylindrical with symmetry in the θ and z directions. The
position of each cell and the velocity on cell boundary are determined by
.dr udt
= (2.25)
All dynamical values in the equations evolve as a function of position r from the
capillary axis at a time t. Zoning can be adjusted in such a way that the initial length of a
zone differs from one region to the next. Conservation of mass implies that element
masses do not change during the simulation, so that within every zone of the grid [40]
( ) .dm r rdrρ π= (2.26)
This also implies that element masses do not change during the simulation.
Considering an element with initial boundaries roi and roi-1 and initial density ρoi, the
mass is given by [41]
( )2 21 .i oi oi oim r rρ π −= − (2.27)
Physically, m is the amount of mass per radian per cm in the plasma.
The boundaries move in response to forces. The mass density at any time is
related to the boundary positions by
( )2 21
.ii
i i
mr r
ρπ −
=−
(2.28) The average radius corresponds to the center-of-mass coordinate. Assuming a
uniform density, the average of a cylinder element is related to the boundary radii by
2 2
1 .2
i ii
r rR −+= (2.29)

40
2.4.4 Numerical method
Eq. (2.17) – (2.21) represent a set of five nonlinear coupled partial differential
equations in five unknowns. These equations can be changed to Lagrangian frame of
reference by using Eq. (2.26). m is now an independent Lagrangian variable and r
becomes a dependent variable. Hence, we now write the system of equations in terms of
m. The equations were solved numerically in a manner similar to the methods of Ref.
[42]. The scheme entailed dividing the plasma into N zones and then finite differencing
the equations [43], using implicit numerical solution to find B, Te and Ti, and an explicit
solution to find u and r. Both r and u are defined at the grid nodes (cell boundary) while
B, Te and Ti are defined at the cell centres located midway between the grid nodes. Each
cell or zone is split into two subzones based on the midpoint of each cell.
To initialize the calculation, various initial and boundary conditions are given to
the code. These will be discussed in next section. The code begins by dividing the
plasma into N radial zones. Then the mass of each zone, m, is determined (Eq. (2.27)),
and the sub-zonal masses are defined as half the zonal mass. The nodal mass is defined
as the sum of the neighbouring sub-zonal masses. The nodal, zonal and sub-zonal
masses all remain fixed throughout the calculation.
The basic steps of the procedure are first to calculate the velocity u from Eq.
(2.18), then calculating the radius r from (2.25). Equations (2.19) – (2.21) are next
solved to find B, Te and Ti. Then the variables are shifted and the algorithm repeats,
calculating new values in terms of the previous ones. The time steps t∆ are not constant
but instead are allowed to vary subject to constraints. The stability requirement for this
scheme is given approximately by the Courant-Friedrichs-Lewy (CFL) hydrodynamics
stability condition in [43].

41
2.4.5 Boundary conditions The boundary conditions which have been applied to the hydrodynamic
equations (2.17) – (2.21) correspond to the simplest approximation of capillary
discharge x-ray lasers. If the radius of the capillary (the outer boundary) is denoted by r0
and assuming that no particle moves through the plasma-vacuum interface, we have
0 0
0,e ir r r r
T Tr r= =
∂ ∂ = = ∂ ∂ (2.30)
( )0 0.u r = (2.31)
The magnetic field at the outer boundary is constrained by the Biot-Savart law to
be given by:
( ) ( )0
0
0.2,
I tB r
r= (2.32)
where the current
( ) ( )0 sin .I t I tω= (2.33)
The boundary conditions at the radial axis are
0 0
0,e ir r
T Tr r= =
∂ ∂ = = ∂ ∂ (2.34)
( )0 0,u = (2.35)
and
( )0 0.B = (2.36)
In the following chapter, the set of hydrodynamic equations, expressed via
Lagrangian grids subject to the above boundary conditions, will be solved numerically.

42
Equation Section 3 Chapter 3
Numerical Study of a Capillary Discharged
Neon-like Argon X-Ray Laser
The purpose of these model calculations is to suggest qualitative trends in the
kinetics of neon-like ions and the design of Z-pinch. In this chapter model calculations
of the behaviour of neon-like soft x-ray laser for Argon will be presented. The gain
coefficients for 2s22p53p (J = 0) to 2s22p53s (J = 1) transition (which occurs at 46.9 nm
in argon) have been calculated and the maximum gain to be expected from the
collisionally pumped neon-like laser scheme has been predicted. Further, the plasma
conditions under which this gain can be expected to occur, and the appropriate Z-pinch
design and external parameter inputs that will achieve these plasma conditions have
been determined.
As a first estimation of the absolute gain of the 3p 1S0 – 3s 1P1 transition, the
fraction of neon-like argon ions are calculated over a broad range of plasma conditions
and then the population inversion density of the laser transitions are determined for the
same set of plasma conditions. Combining these two sets of the results enables the
computation of the maximum gain and the plasma conditions for which it is obtained.
By then, magneto hydrodynamic (MHD) models for discharge-driven soft x-ray lasers
are used to predict the input parameters that are needed to produce these plasma
conditions.
3.1 Properties of Argon Plasma in Equilibrium
Hot dense plasmas are essentially fully ionized, that is, every atom has at least one
electron removed. In fact the temperatures are sufficiently high that most atoms have
many fewer bound electrons than protons in the nucleus. The ionization state (number

43
of electrons removed) depends primarily on the binding energies of the various
electrons and on the electron plasma temperature. Typically the outer electrons in a
multi-electron atom are bound by only a few electron volts, while the core K, L, and M
shell electrons (principal quantum numbers n = 1, 2, and 3) are closer to the nucleus and
held more tightly, with binding energies of hundreds or thousands of electron volts.
Table 3.1 gives the binding energies of argon which have been compiled by NIST [44].
The first column presents the degree of ionization of the Argon atom while the second
column shows the energy in electron volts required to remove an electron from that
ionization state.
Argon, in its neutral state, has 18 electrons. The first row of Table 3.1 indicates
that 15.8 eV of energy is needed to remove one electron, creating the Ar1+ ion. The
energy required to remove an additional electron is 27.6 eV, forming the Ar2+ ion.
Subsequently, having removed eight electrons, there are 10 electrons remaining (Ar8+),
forming a closed shell in a neon-like (1s2 2s2 2p6) configuration. The high symmetry of
the closed shell makes removal of an additional electron much more difficult; hence,
they maintain their stability even when faced with temporal, spatial, and other changes
and the ionization potential (binding energy) jumps significantly to 422.5 eV for neon-
like argon. This remarkable threshold grows for further electron removal can be
considered an ionization bottleneck for a plasma of a given temperature.
As a first estimation of absolute gain of this transition, the fractional abundance of
charge states is evaluated using steady-state ionization model [45]. PrismSPECT [46] is
a collisional-radiative spectral analysis code designed to simulate the atomic and
radiative properties of laboratory and astrophysical plasmas and it solves the equation of
state and provides radiative properties for plasma in non-local thermodynamic
equilibrium (non-LTE) and local thermodynamic equilibrium (LTE) state. To obtain a
neon-like argon state (Ar8+) the equilibrium argon plasma must be heated to a

44
temperature of about 41 eV (Table 3.1). The ionization population fraction in the range
1 10000 eVeT − for a given electron number density 18 32.0 10 cmeN −× are depicted
in Fig. 3.1. The electron number density 18 32.0 10 cmeN −× has been chosen to be
shown in this section, because it is the electron number density that has been achieved
during the pinch of the case study in the section 3.5. The maximum ionization
population fraction of neon-like Ar8+ ion 8f 0.95+ is accomplished at temperature
41 eVeT . The temperature range of Ne-like ionization state is approximately between
10 – 200 eV. It should be remembered that the steady-state ionization model neglects
the time taken to ionize the plasma. The average charge Z as function of temperature
(see Fig. 3.2) has two regions where it changes quickly and has two temperature
plateaus 1 20 60 eVeT − (at 8Z ) and 2 400 1000 eVeT − (at 16Z ). The
ionization plateaus can be understood from to the ionization bottleneck of the electron
configuration of the argon atom.
Table 3.1 The ionization potential was extracted from [44] and peak abundance of Argon was calculated using PrismSPECT code [46].
Ionization Potential, eV Abundance Temperature, eV
0 15.8 0.9411 1.0 1+ 27.6 0.9609 1.8 2+ 40.7 0.8732 3.1 3+ 59.7 0.8780 5.2 4+ 75.1 0.7430 8.9 5+ 91.0 0.5475 13.0 6+ 124.3 0.5551 17.5 7+ 143.5 0.2395 21.0 8+ 422.5 0.9478 41.0 9+ 479.7 0.5431 95.0 10+ 540.0 0.3871 125.0 11+ 618.7 0.3493 155.0 12+ 685.9 0.3167 185.0 13+ 755.2 0.2888 220.0 14+ 855.8 0.3683 250.0 15+ 918.4 0.2740 310.0 16+ 4120.7 0.9074 800.0 17+ 4426.2 0.5711 2500.0

45
Figure 3.1 Argon ionization fraction dependence on plasma electron temperature for atom density 18 3
0 2 10 cmN −× .
Figure 3.2 Average plasma charge Z for the Argon atom with density 18 3
0 2.0 10 cmN −× as a function of temperature.

46
3.2 Population and gain requirements for Ne-like Ar
From the proceeding section, the electron temperature needed to obtain Ne-like
Argon was identified. Yet in existence of laser regime, the transition of finer structure of
ion has to be taken into account. So in the scheme of yielding a 46.9 nm laser line, the
population inversion of 3p 1S0 – 3s 1P1 transition has been studied and this was usually
measured by the gain.
For Doppler-broadening, the gain (G) of a radiative transition which consists the
population density of an upper laser level u and a lower laser level l is expressed as [15]
318 2
q qq i u lul ul ul u
i u l
M n nG A gkT g g
λπ π
+ ++ = −
, (3.1)
where ulλ represents the transition wavelength ulA is the transition probability
(radiative decay rate), iT is the temperature of ion, qjn + is the ion population density in
the level j of ion q+ having statistical weight gj, k is the Boltzmann constant, and Mi is
the ionic mass.
In Helios-CR, the relative level populations are q q qj jm n n+ + += , where qn +
represents the total (summed over all of the levels of the ion under investigation)
number density of the q+ ion. Therefore, Eq. (3.1)can be rewritten for gain per total Ne-
like Ar ion density ( 8 8ulG n+ + in units of (cm-4), where q = 8 denotes the Ne-like Ar) as
8 31 8 8
38 1/2
1.01 10ul u lul ul u
i u l
G m mA gn T g g
λ+ − + +
+
×= −
, (3.2)
where λ and iT are expressed in Å and eV, respectively. The right-hand side of Eq.
(3.2) consists of terms only related to Ne-like Ar. Hence, it represents inherent
characteristics of gain on a transition in Ne-like Ar for a given Ne and Ti.
To estimate the absolute value of gain, the population density of ions can be
related to ionization balance by writing
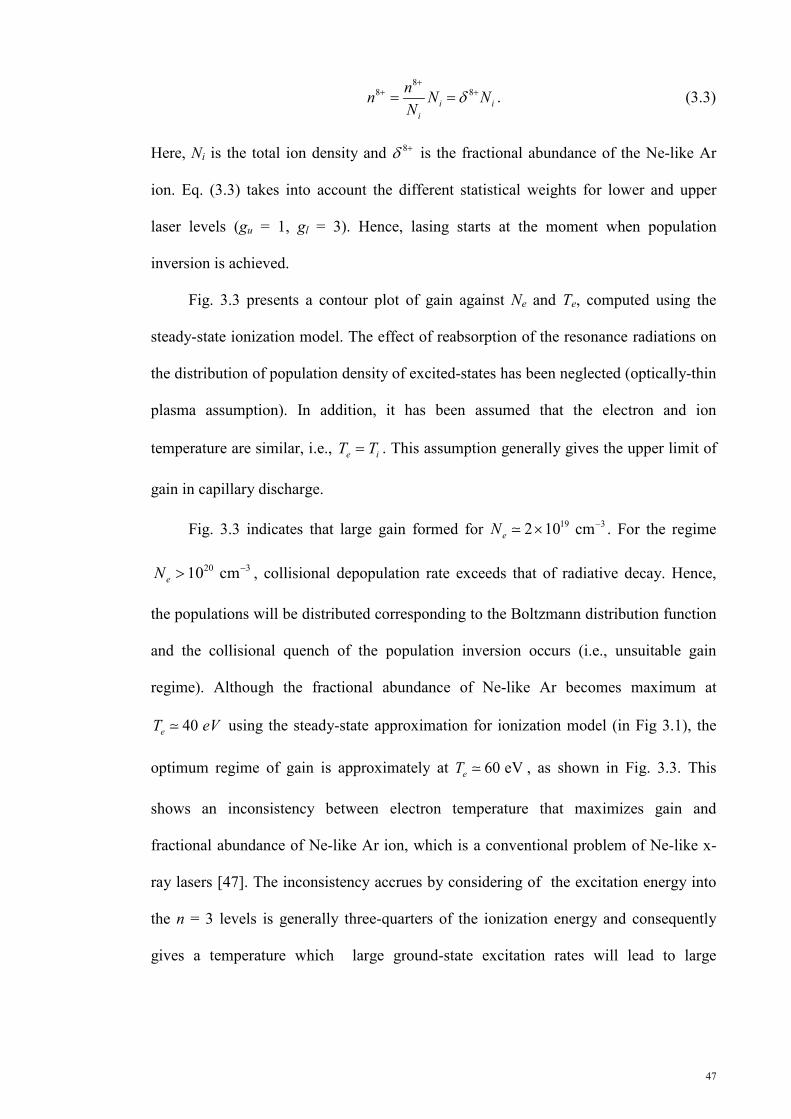
47
8
8 8i i
i
nn N NN
δ+
+ += = . (3.3)
Here, Ni is the total ion density and 8δ + is the fractional abundance of the Ne-like Ar
ion. Eq. (3.3) takes into account the different statistical weights for lower and upper
laser levels (gu = 1, gl = 3). Hence, lasing starts at the moment when population
inversion is achieved.
Fig. 3.3 presents a contour plot of gain against Ne and Te, computed using the
steady-state ionization model. The effect of reabsorption of the resonance radiations on
the distribution of population density of excited-states has been neglected (optically-thin
plasma assumption). In addition, it has been assumed that the electron and ion
temperature are similar, i.e., =e iT T . This assumption generally gives the upper limit of
gain in capillary discharge.
Fig. 3.3 indicates that large gain formed for 19 32 10 cm−×eN . For the regime
20 310 cmeN −> , collisional depopulation rate exceeds that of radiative decay. Hence,
the populations will be distributed corresponding to the Boltzmann distribution function
and the collisional quench of the population inversion occurs (i.e., unsuitable gain
regime). Although the fractional abundance of Ne-like Ar becomes maximum at
40 eT eV using the steady-state approximation for ionization model (in Fig 3.1), the
optimum regime of gain is approximately at 60 eVeT , as shown in Fig. 3.3. This
shows an inconsistency between electron temperature that maximizes gain and
fractional abundance of Ne-like Ar ion, which is a conventional problem of Ne-like x-
ray lasers [47]. The inconsistency accrues by considering of the excitation energy into
the n = 3 levels is generally three-quarters of the ionization energy and consequently
gives a temperature which large ground-state excitation rates will lead to large

48
ionization rates if the electron density is adequate (the relaxation time for the ionization
balance 11 110 en− ) [48].
The collisions between particles in the plasma transfer energy from particle to
particle in a random manner, thereby heating the plasma and ionizing the atoms.
Normally, multiple ionization states are developed, each with its own characteristic
emission lines, leading to a rich spectrum of lines. However, by carefully controlling the
temperature and density of the plasma, the population of specific ionization species can
be preferentially established. Generally, such high temperatures and densities are
established at, or close to the pinch radius.
Under certain plasma conditions (electron density of 0.1 – 4 x 1019 cm-3, and
electron temperature ≈ 40 – 90 eV, as shown in Fig.3.3), collisional electron impact
excitation of the ground state Ne-like ions produces a population inversion between the
3p (J=0) and the 3s (J=1) levels resulting in amplification at the 46.9 nm wavelength.
Figure 3.3 The contour of gain of the 3p 1S0 – 3s 1P1 transition as function of the electron temperature and density.
49
3.3 Case Study: Ionization Dynamics and One-dimensional MHD Model
In plasmas created by fast capillary discharge, ionization dynamics are extremely
important, in particular for low-Z atom species, due to the very fast time scales of
changing hydrodynamical plasma parameters at the pinching time leading to ionization
state distributions which are far from their steady-state values. The time scales for
atomic processes are large compared to the time scales for the change of the plasma
parameters, so the transient effects become more prominent. Hence, in order to estimate
the non-equilibrium effects on gain of Ne-like Ar ion, only the time progression of the
ground states is reproduced during the calculation of hydrodynamical plasma
parameters using the one-dimensional, two-temperatures MHD model with cylindrical
geometry which is solved in the Lagrangian reference frame.
As a case study, an experiment described in Ref. [18] has been selected. The
stimulation of every discharge consists of three steps:
a) Time and radial dependencies of electron temperature, mass plasma density and
electron density are assessed by the MHD code Helios-CR [17].
b) Time dependencies of energy level populations and ionization fractions for Ne-
like Ar ions are evaluated by the kinetic code [17].
c) Time dependencies of gain on the capillary axis are estimated according to Eq.
(3.2).
3.4 The Initial Parameters
Using the general physical model outlined in chapter 2, the discharge channel can
be stimulated with specific values of the controlling parameters. The parameters of a
working discharge x-ray laser reported in Ref. [18] are used. Here the radius of the
capillary has been fixed at 0.15 cm, and current rise time is about 50 ns. For this basic

50
situation, the filling pressures and the current profiles are varied to investigate the
impact of these variations on the plasma.
For the simulations, we use the HELIOS-CR code described in Ref. [17]. It is a
code which designed to study the progression of radiating plasmas in 1-dimension. The
dynamics of plasmas heated by external radiation sources or by laser beams in planar,
cylindrical, or spherical configuration can be studied in this code. It is also a modelling
platform that can design for non-LTE and LTE plasmas in one dimension.
The capillary is prefilled with neutral argon to a certain initial filling pressure. In
this case study, the pressure 0.15mbar is used. The initial ion density can be written as
6 30 ,41.1 10 (in cm )i an P N − −= × × (3.4)
where P0 denotes the initial gas filling pressure and Na is Avogadro’s number. In the
experiment, a pre-pulse current was used to pre-ionized the capillary just before the
arrival of the main current so that a uniform plasma discharge that is favourable for
lasing is obtained. In order to initiate the discharges in the simulation, the filling gas
was artificially pre-ionized by setting its initial electron temperature to 0.25 eV. The
peak discharge current used is 16 kA. These are the typical values used in the laser of
Ref. [18].
3.5 Results of MHD simulations
In the capillary discharge regime, the plasma column created by the injected
current pulse induces a fast radial collapse towards the axis, producing a shock wave
that compresses and heats the plasma column with a large density of Ne-like ions, with
a very high axial uniformity and a large length to diameter ratio of the order of 1000:1.
In Ne-like schemes, the plasma tends to readily adopt the Ne-like stage due to ionization
bottlenecks. Under certain plasma conditions (electron density of 0.1 – 4 x 1019 cm-3,
and electron temperature ≈ 40 – 90 eV, as shown in Fig.3.3), the soft x-ray laser of 46.9

51
nm produces from a population inversion between the 3p (J=0) and the 3s (J=1) levels
by using collisional electron impact excitation of the ground state Ne-like ions.
Fig. 3.4 presents the calculated temporal evolution of a capillary discharge with a
peak current of 16 kA and 0.15 mbar gas filling pressure. The temporal evolution of the
trajectories of argon plasma elements inside the channel of this configuration is
illustrated in Fig. 3.4a. Here, the blue line represents the discharge current which
extracted from experiment. Figure 3.4b shows contour plots of the logarithm of the
electron density measured in cm-3 while Figure 3.4c shows the electron temperature
measured in eV. These figures also provide quantitative information about the
distribution of the plasma parameters inside the channel at different times. Some
characteristic features are discussed below.
Figure 3.4 Basic parameters of discharge in capillary with diameter of 3 mm filled with argon at a
initial gas filling pressure of 0.15 mbar for I0 = 16 kA and rise time 50 ns. (a) The plasma time-space flow diagram; blue line corresponds to the discharge current at outer boundary; (b) contour lines of the natural logarithm of the electron density (measured cm-3) on the (t, r) plane; (c) contour lines of the electron temperature (measured in eV).

52
The evolution of Z-pinch plasma can be depicted by the balance between the
magnetic pressure and the thermal pressure or so called the magnetic piston as described
by Eq. (2.18). In the early stages (t < 20 ns) the plasma does not compress immediately
but actually tries to expand due to the fact that the plasma pressure exceeds other forces.
However, this expansion is constrained by the rigid wall of the capillary. The pressure
in the outer zones of the plasma is due to both the initial filling pressure and Joule
heating. Generally, the current tends to flow in the outer part of the cylindrical plasma,
and Joule heating occurs due to the current passing through the plasma. This heating
results in an increase in pressure which can be sufficiently high for the outer regions of
the plasma to initially expand before being accelerated inward by the magnetic piston.
When the discharge current has reached a value such that the magnetic pressure is
greater than the thermal pressure (i.e., for t > 20 ns), the plasma is compressed inward
toward the axis. At the same time, a vacuum region starts to form near the wall and a
converging shock wave is developed which propagates towards the channel axis. The
shock waves eventually meet at the axis, and are subsequently reflected. During
compression, the plasma becomes hotter due to Joule and shock heating, and the
thermal pressure increases, essentially ionizing the argon. Before the time 50 ns, when
the total current has been increasing to the maximum value, the discharge current is
high and the Lorentz force dominates. Thus, the compression phase ceases. When the
thermal pressure balances the magnetic pressure, the plasma reaches maximum
compression (t ≈ 43.5 ns) and then expands (t > 43.5 ns). During the compression, the
plasma has been finally produced to high density and temperature plasma on the axis, as
shown in Fig. 3.4b and 3.4c. At t = 43.5 ns, the temperature Te reaches the value of 70
eV and should rapidly cool down. The value of electron density Ne at the pinch is about
183 10× cm-3. A hot plasma core with the radius rcore = 0.266 mm and central mass
density 4 31.22 10 g cmρ −= ×core is formed. However, after compression the shock
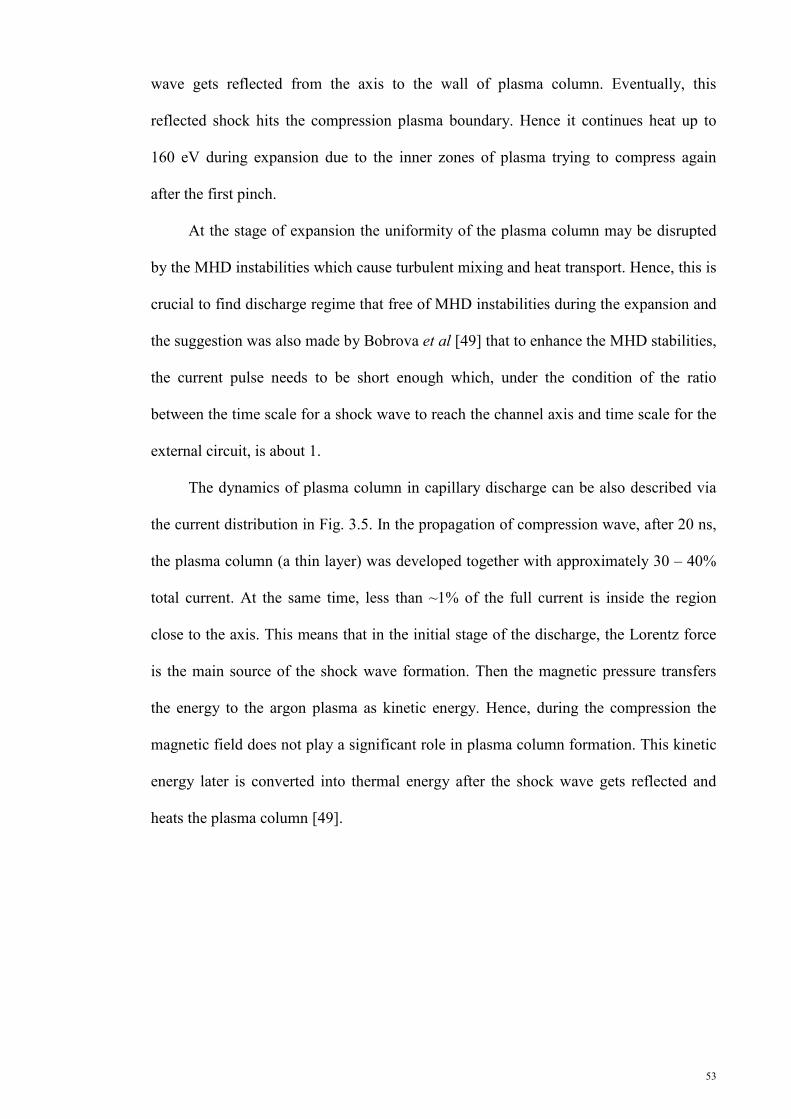
53
wave gets reflected from the axis to the wall of plasma column. Eventually, this
reflected shock hits the compression plasma boundary. Hence it continues heat up to
160 eV during expansion due to the inner zones of plasma trying to compress again
after the first pinch.
At the stage of expansion the uniformity of the plasma column may be disrupted
by the MHD instabilities which cause turbulent mixing and heat transport. Hence, this is
crucial to find discharge regime that free of MHD instabilities during the expansion and
the suggestion was also made by Bobrova et al [49] that to enhance the MHD stabilities,
the current pulse needs to be short enough which, under the condition of the ratio
between the time scale for a shock wave to reach the channel axis and time scale for the
external circuit, is about 1.
The dynamics of plasma column in capillary discharge can be also described via
the current distribution in Fig. 3.5. In the propagation of compression wave, after 20 ns,
the plasma column (a thin layer) was developed together with approximately 30 – 40%
total current. At the same time, less than ~1% of the full current is inside the region
close to the axis. This means that in the initial stage of the discharge, the Lorentz force
is the main source of the shock wave formation. Then the magnetic pressure transfers
the energy to the argon plasma as kinetic energy. Hence, during the compression the
magnetic field does not play a significant role in plasma column formation. This kinetic
energy later is converted into thermal energy after the shock wave gets reflected and
heats the plasma column [49].
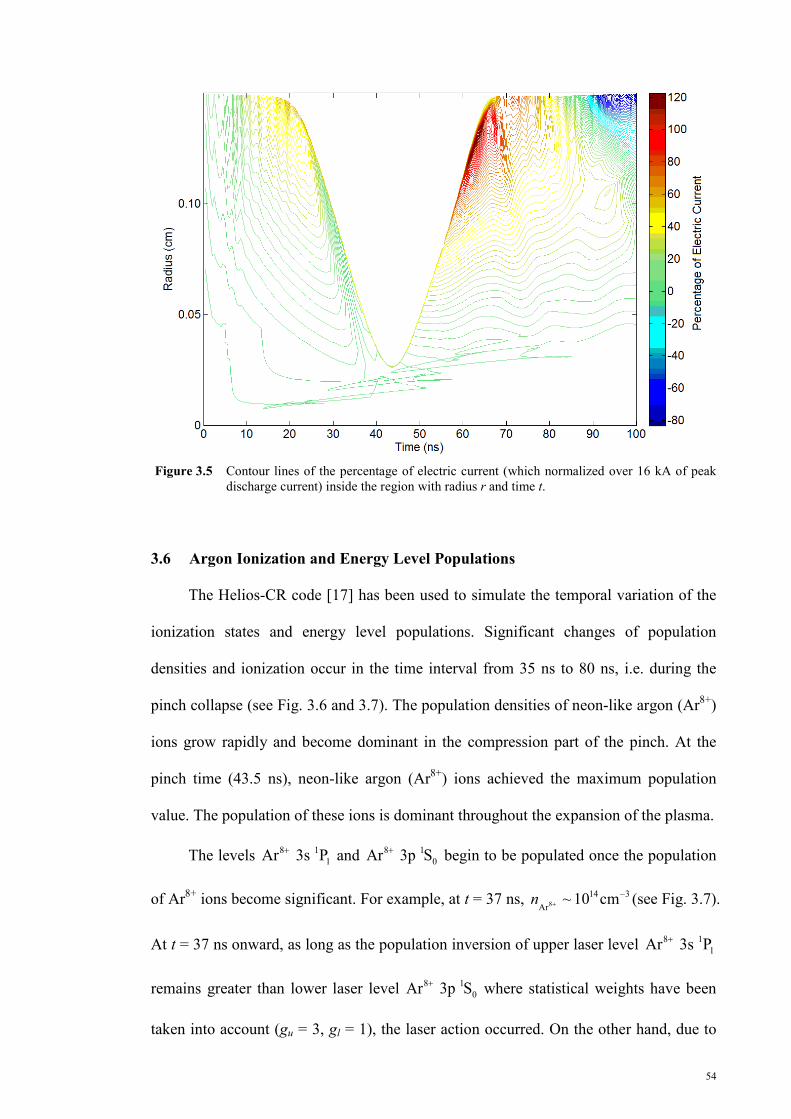
54
Figure 3.5 Contour lines of the percentage of electric current (which normalized over 16 kA of peak
discharge current) inside the region with radius r and time t.
3.6 Argon Ionization and Energy Level Populations
The Helios-CR code [17] has been used to simulate the temporal variation of the
ionization states and energy level populations. Significant changes of population
densities and ionization occur in the time interval from 35 ns to 80 ns, i.e. during the
pinch collapse (see Fig. 3.6 and 3.7). The population densities of neon-like argon (Ar8+)
ions grow rapidly and become dominant in the compression part of the pinch. At the
pinch time (43.5 ns), neon-like argon (Ar8+) ions achieved the maximum population
value. The population of these ions is dominant throughout the expansion of the plasma.
The levels 8 11Ar 3s P+ and 8 1
0Ar 3p S+ begin to be populated once the population
of Ar8+ ions become significant. For example, at t = 37 ns, 814 3
Ar~ 10 cmn +
− (see Fig. 3.7).
At t = 37 ns onward, as long as the population inversion of upper laser level 8 11Ar 3s P+
remains greater than lower laser level 8 10Ar 3p S+ where statistical weights have been
taken into account (gu = 3, gl = 1), the laser action occurred. On the other hand, due to

55
the ionization bottleneck of Ar8+, the density of its population was maintained at a high
level as expected, compared with other species of ions.
Figure 3.6 Substantial changes of ionization fraction as a function of time.
A comparison of Ne-like Ar ionization states shown in Fig. 3.1 using a steady-
state approximation and Fig. 3.6 on the capillary axis using a time-dependent ionization
calculation shows that in the transient ionizing plasma, the ionization state distribution
shifts to higher temperature as compared to the steady-state approximation. For example,
the Ne-like Ar fraction in Fig. 3.6 has a value about 0.95 at Te ≈ 70 eV (which is shown
in Fig. 3.4 (c)), while the steady-state approximation at the same temperature predicts a
value ≈ 0.7. In other words, a time -dependent ionization calculation required higher
electron temperature to achieve maximum Ne-like ionization state. This is because of
the finite relaxation time in the case of steady state [45]. In addition, after the pinch time
(> 43.5 ns), Fig. 3.6 shows the lag of ionization fraction due to high Te and low Ne,

56
which means long time of recombination or freezing of charge states as compared with
steady-state ionization model.
Figure 3.7 Population densities of Ar ions as a function of time.
3.7 Gain factor time dependence
The time dependence of small signal gain factor G is determined by the time
dependences of both laser level populations 10
83p S
n + and 11
83s P
n + . Fig. 3.8 shows the radial
and temporal evolution of the gain of the case above (a non-ablating alumina capillary
with radius r0 = 1.5 mm filled with initial gas filling pressure of 0.15 mbar, current
pulse with T1/4 = 50 ns and current peak value Imax = 16 kA). The gain factor has a shape
of very short peak with maximum value G(tG) = 0.94 cm-1 on the capillary axis at the
time tG = 44.5 ns (see Fig. 3.8) where the corresponding electron density is 3.3 x 10¹⁸
cm-3 and electron temperature is 72 eV. The peak value of gain is achieved during the
pinch time. The active laser medium is created for a relatively short period

57
approximately equal to 3.5 ns (Full width half maximum (FWHM) of the gain peak was
considered). This gain value was fulfilled with plasma conditions (electron density of
0.1 – 4 x 1019 cm-3, and electron temperature ≈ 40 – 90 eV, as shown in Fig.3.3).
Figure 3.8 The spatial and temporal evolution of gain.
3.8 Influence of Opacity on Gain Coefficients
The effect of opacity (i.e., reabsorption) on the gain coefficient has been
investigated. The static optical depth (τul) at line centre (λul) on a radiative transition
between the levels u and l is defined by [15]
( )ul ulK Lτ λ= , (3.5)
where L is the effective length of the plasma. K(λul) is the absorption coefficient as
( )1/22
2ul c u ul uli
McK r N fkT
πλ λ
=
(3.6)

58
where ful is the absorption oscillator strength between the levels u and l, c the speed of
the light in vacuum, M the atomic mass of the ion, rc is the classical radius of an
electron, k is the Boltzmann constant, Ti the ion temperature and Nu is the number
density of the upper level u.
In order to estimate the opacity effect, the absorption coefficient of each
Lagrangian cell is calculated based on the outputs from Helios-CR. Basically the ion
temperature and the number density of the upper level u were post-processed into the
calculation of absorption coefficient. Fig. 3.9 reveals that the opacity effect reduces the
gain due to overpopulation of lower laser level for these conditions.
Figure 3.9 The spatial and temporal evolution of gain after taking opacity effect into account.
Here, the value of the peak gain has been reduced to 0.54 cm-1 from a maximum
of 0.94 cm-1 in the absence of opacity effects. This reduction of gain is due to the
overheating of ions at the maximum compression time, close to the axis of the capillary.

59
3.9 Comparison with Other Experiments
Up to this point, no data can be compared with the experiment of [18], because the
only available experiment output is laser intensity. So in order to investigate the
accuracy of simulation MHD model, Helios-CR code [17], other experiments (i.e.
Rocca [50], Niimi [51] and Heinbuch [52]) are considered in this section.
These three experiments were chosen because they had more define parameters
such as the size of laser was imaged and the time of compression was roughly captured
in their studies. These experiments inputs and outputs later will help in verify the results
of the simulation from Helios-CR code for each case. In the way, the dynamic of plasma
in Z-pinch which has been studied in section 3.5 – 3.8 using Helios-CR code can be
explained and understood more.
3.9.1 Case 1: Rocca’s experiment
Rocca’s experiment [50] showed a sequence of time-resolved pinhole images of
the soft x-ray emitting region of the plasma column as a function of time for a 39 kA
peak current with a half-period of about 60 ns, discharging through a 4 mm diameter, 12
cm long capillary filled with argon at 700 mTorr pressure.
The image obtained at 26 ns from the beginning of the current pulse show the
emission from cylindrical shell and the diameter of the soft x-ray emitting region is 3.5
mm. The FWHM diameter of the radiating region of the plasma column at the time of
maximum compression (about 41 ns) is measured to be ~200 and ~300 μm with and
without a thick carbon foil filter which filters out radiation with λ > 30 nm, respectively.
Fig. 3.10 presents the calculated temporal evolution of a capillary discharge with a peak
current of 39 kA and 700 mTorr gas filling pressure. The temporal evolution of the
trajectories of argon plasma elements inside the channel of this configuration is
illustrated in Fig. 3.10a. Here, the dotted line represents the discharge current. Fig.

60
3.10b shows contour plots of the logarithm of the electron density measured in cm-3
while Fig. 3.10c shows the electron temperature measured in eV. Fig. 3.10d shows
contour plots of the fraction of ion Ar8+ and Fig. 3.10e shows contour plots of the gain
measured in cm-1. These figures also provide quantitative information about the
distribution of the plasma parameters inside the channel at different times.
By comparison, the simulated results from Helios-CR in Fig. 3.10 shows that the
plasma column pinches at 45 ns (this estimate agrees with Rocca’s calculation [50])
with a maximum compression of 1 mm diameter. The corresponding electron density is
1.3 x 1019 cm-3, the corresponding electron temperature is 64 eV, the fraction of Ar8+ ion
is 0.89, the gain without opacity effect is 3.17 cm-1 and the gain with opacity effect is ~1
cm-1. The simulated pinch time differs by 4 ns as compared to the measured pinch time.
This small shift can be accounted for. The size of plasma column during maximum
compression in the simulation is greater than that of the experiment because only the
FWHM radiating region of the plasma column was measured in the experiment. Hence,
the actual size of plasma column should be bigger than that reported, so it gave good
agreement with the simulation. The size simulated radiating region of the plasma
column will be estimated in section 5.4 and the size of diameter is predicted to be about
400 μm.
The requirement of the temperature and density of the plasma were falling in an
adequate regime that estimated in section 3.2. However the calculated gain is much
higher than the estimation value in Fig. 3.3. This is because the calculated gain was
generated from the non-local thermodynamic equilibrium (non-LTE) model, while the
results displayed in Fig. 3.3 used the LTE model. In order words, the plasma was far
from its equilibrium state.

61
Figure 3.10 Basic parameters of a discharge in a capillary of diameter of 4 mm filled with argon at a initial gas filling pressure of 700 mTorr for I0 = 39 kA and rise time 30 ns. (a) The plasma time-space flow diagram; the dotted line corresponds to the discharge current at outer boundary; (b) contour lines of the logarithm of the electron density (measured cm-3) on the (t, r) plane; (c) contour lines of the electron temperature (measured in eV); (d) contour lines of the fraction of ion Ar8+; (e) contour lines of the gain (measured cm-1).
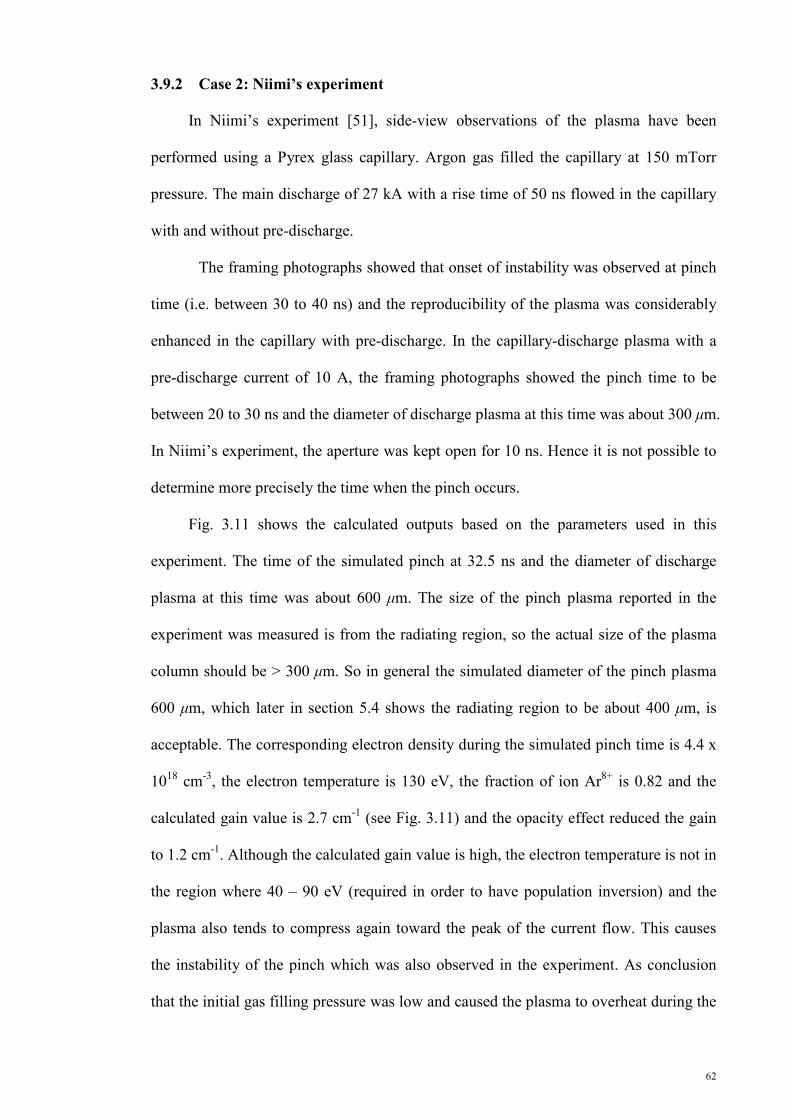
62
3.9.2 Case 2: Niimi’s experiment
In Niimi’s experiment [51], side-view observations of the plasma have been
performed using a Pyrex glass capillary. Argon gas filled the capillary at 150 mTorr
pressure. The main discharge of 27 kA with a rise time of 50 ns flowed in the capillary
with and without pre-discharge.
The framing photographs showed that onset of instability was observed at pinch
time (i.e. between 30 to 40 ns) and the reproducibility of the plasma was considerably
enhanced in the capillary with pre-discharge. In the capillary-discharge plasma with a
pre-discharge current of 10 A, the framing photographs showed the pinch time to be
between 20 to 30 ns and the diameter of discharge plasma at this time was about 300 μm.
In Niimi’s experiment, the aperture was kept open for 10 ns. Hence it is not possible to
determine more precisely the time when the pinch occurs.
Fig. 3.11 shows the calculated outputs based on the parameters used in this
experiment. The time of the simulated pinch at 32.5 ns and the diameter of discharge
plasma at this time was about 600 μm. The size of the pinch plasma reported in the
experiment was measured is from the radiating region, so the actual size of the plasma
column should be > 300 μm. So in general the simulated diameter of the pinch plasma
600 μm, which later in section 5.4 shows the radiating region to be about 400 μm, is
acceptable. The corresponding electron density during the simulated pinch time is 4.4 x
1018 cm-3, the electron temperature is 130 eV, the fraction of ion Ar8+ is 0.82 and the
calculated gain value is 2.7 cm-1 (see Fig. 3.11) and the opacity effect reduced the gain
to 1.2 cm-1. Although the calculated gain value is high, the electron temperature is not in
the region where 40 – 90 eV (required in order to have population inversion) and the
plasma also tends to compress again toward the peak of the current flow. This causes
the instability of the pinch which was also observed in the experiment. As conclusion
that the initial gas filling pressure was low and caused the plasma to overheat during the

63
pinch. So lasing action did not occur in this experiment, which was also corroborated in
the simulation.
Figure 3.11 Basic parameters of discharge in capillary of diameter 3 mm filled with argon at a initial gas filling pressure of 150 mTorr with I0 = 27 kA and rise time 50 ns. (a) The plasma time-space flow diagram; the dotted line corresponds to the discharge current at the outer boundary; (b) contour lines of the decimal logarithm of the electron density (measured cm-3) on the (t, r) plane; (c) contour lines of the electron temperature (measured in eV); (d) contour lines of the fraction of ion Ar8+; (e) contour lines of the gain (measured cm-1).

64
3.9.3 Case 3: Heinbuch’s experiment
In Heinbuch’s experiment [52], laser amplification was obtained on Ne-like Ar
plasma column generated in an aluminium-oxide capillary of 3.2 mm interior diameter
and 21 cm length filled with pre-ionized Ar gas at an optimized pressure 0.7 Torr. The
plasma was excited by current pulses of ≈ 22 kA peak amplitude that were monitored
with a Rogowski coil. The pulse had 10% to 90% rise time of approximately 60 ns.
The pinch was reported to have occurred at about 40 ns after the beginning of the
main current pulse and the plasma column reached its minimum diameter of 200 – 300
μm. The laser was successfully operated from shot to shot variation of the peak of the
excitation current pulse for 1500 consecutive shots at repetition rates up to 12 Hz.
Comparing with the simulated results shown in Fig. 3.12, the plasma column
pinches at about 60 ns with a maximum compression diameter of about 1.5 mm. The
corresponding electron density is 2.6 x 1018 cm-3, the corresponding electron
temperature is 46 eV, the fraction of ion Ar8+ is 0.98, the gain without opacity effect is
0.18 cm-1 and the gain with opacity effect is 0.11 cm-1.
The gain peak value dropped as the electron temperature was too low. It is
suggested that the initial gas filling pressure needs to decrease to, say 500 mTorr. A
reduced mass density inside the capillary would cause the shock to pinch faster and
cause the plasma to get heated more easily than at 700 mTorr pressure.
On the other hand, the difference between the measured pinch time and the
simulated pinch time is about 20 ns. This discrepancy can be explained as follows:
1500 consecutive shots were measured in the experiment, the plasma inside the
capillary was in a pre-discharge state every shot. The first shot of the experiment was
predicted (using Helios-CR code) about the same with a single pulse was considered in
the simulated case where uniform initial electron temperature of 0.25 eV and electron
density (vary according to initial gas filling pressure) were performed. In the simulation,

65
every single shot was treated as identical. In contrast, for 1500 consecutive shots in the
experiments, the pre-discharge plasma will be well developed based on the previous
shots. So the pinch time would be even earlier and the pinch diameter would be smaller
were expected.
Figure 3.12 Basic parameters of discharge in a capillary with diameter of 3.2 mm filled with argon at a initial gas filling pressure of 700 mTorr for I0 = 22 kA and rise time 30 ns. (a) The plasma time-space flow diagram; dotted line corresponds to the discharge current at outer boundary; (b) contour lines of the decimal logarithm of the electron density (measured cm-3) on the (t, r) plane; (c) contour lines of the electron temperature (measured in eV); (d) contour lines of the fraction of ion Ar8+; (e) contour lines of the gain (measured cm-1).

66
Based on the comparison of these three experiments, the simulated pinch time has
been shifted forward by about 5 ns. Results in Ref. [52] revealed that, in contrast to the
some artificial adjustment of the classical transport coefficients described in many
published reports using single-fluid MHD simulation, the effect of neutral atoms should
taken into account using two-fluids MHD equations to better estimate pinching time.
However, the discrepancy may also be related to initial plasma condition (for example,
pre-ionization) in capillary discharge [53, 54].
A perusal of Fig.3.3, Fig. 3.4 and Fig. 3.8 shows that the initial conditions, for
instance, the initial gas filling pressure, the peak current form and the radius of the
capillary need to be further optimized to produce the higher gain coefficient of the Ne-
like Ar x-ray laser. These will be shown in chapter 4 in which a detailed study of the
influence of the input parameters to the optimization of the system is performed.
On the other hand, the results show an overheating of ions at pinching time near
the axis of the capillary, which reduces the gain. In reality, the function of ion
temperature is caused to reduce gain owing to line broadening (see. Eq. (3.1)), and (ii)
to increase the gain due to reduction of opacity effect [55]. The latter one has nonlinear
effect on the population distributions.
In addition, the results show that the maximum gain coefficient for Rocca’s
experiment occurred on the capillary axis was about 1 cm-1 and the effective gain
coefficient in that experiment was somewhat lower than this value (~0.6 cm-1), which
may be due to the refraction loss. Although the effects of the wall ablation and the effect
of neutral atoms on the plasma dynamics have not been taken into account in the
calculation, the estimated value for gain has agreement with all experiments that were
considered [15].
The estimated diameter size of the plasma during the pinch was also in range of
acceptance region. The estimation of the diameter of the radiating plasma will be further

67
discussed in Chapter 5 in which refraction losses are included. In order to obtain the
laser amplification, it is necessary to produce a plasma that satisfies the lasing condition
and provides a laser gain. These require that the temperature and density of the plasma
have to be within an adequate regime as suggested in section 3.2.
In conclusion, from the study of three experiments above, the Helios-CR code was
able to give a good agreement with the experimental results. Tan’s experiment [18] has
been simulated by Helios-CR code whereby the dynamics of the plasma can be
understood quantitatively. Although the output of Tan’s experiment only provided the
information of laser intensity, the diameter of radiating region during maximum
compression can be estimated to be < 500 μm (the simulated radius of plasma column
from Helios-CR is about 0.266 mm) and the actual pinch time may occur at 48 ns after
initiation of the discharge current, whereby the stimulated pinch time is predicted to be
at 43.5ns (based on the evaluation of three experiments, the simulated pinch time has
been shifted forward by about 5 ns).

68
Chapter 4
Laser System Optimization of Ne-like Ar Soft X-ray Laser
The experiment of Tan [18] was studied in the previous chapter which showed
that the plasma’s electron temperature was 72 eV and its electron density was 3.3 x 10¹⁸
cm-3 during pinch time. This pair of values estimated the gain of the 3p 1S0 – 3s 1P1
transition to be about 1 cm-1 in Fig. 3.3. This indicates that, with suitable adjustment of
plasma conditions during the pinch, there is the possibility of obtaining a higher gain 3p
1S0 – 3s 1P1 transition than achieved in the case study studied in the previous chapter.
Hence, this motivates the study of laser system optimization of Ne-like Ar soft x-ray
laser in this chapter.
In these models, the relevant experimental parameters are the capillary radius r0,
initial argon gas filling pressure p0, discharge current peak value Imax and its quarter
period T1/4. Hence, the optimization is performed in the four-dimensional space (r0, p0,
Imax, T1/4) of the experimental parameters, taking the peak values of the gain factor G(tG)
where tG is the pinch time (when the minimum plasma radius of the capillary), electron
temperature and electron density as the criteria to be achieved.
4.1 Dependences of plasma parameters and gain factor on the pressure
The simulations of the capillary discharge dynamics for r0 = 1.5 mm, T1/4 = 50 ns,
Imax = 16 kA at various initial gas filling pressures p0 of argon have been performed.
Fig. 4.1(a) shows that the pinch time tG on reaching the minimum radius of the capillary
is tuned by the choice of the initial gas filling pressure p0. For lower values of p0 the
pinch time tG on reaching the minimum plasma radius of the capillary occurs at an
earlier time. This is because, for the lower initial values of p0, the mass density inside
the capillary is reduced which makes the plasma easier to compress and to heat.

69
Fig. 4.1(b) and (c) show the temporal evolution of the electron density and
electron temperature on the axis of the capillary at various initial gas filling pressures.
The electron density increases with increasing initial gas filling pressure. On the other
hand, the values of electron temperature decrease with increasing initial gas filling
pressure.
Figure 4.1 (a) Maximum compression time versus initial gas filling pressure, (b) Temporal evolution of
electron density, (c) Temporal evolution of electron temperature.
The gain factor time-dependences have been also calculated for various initial gas
filling pressures p0. The values of the gain factor are very sensitive to the changes of

70
initial gas filling pressure p0 [cf. Fig. 4.2]. The highest value of the peak gain on the axis
G(tG) is achieved for p0 = 0.15 mbar (see Fig.4.2). The corresponding peak value of
electron temperature ( ),max 72 eVe GT t = results in highly ionized plasma with abundance
of Ar8+ (see Fig.3.4c) and with the electron density ( ) 18 33.3 10 cme GN t −= × (see Fig.
3.4b).
Figure 4.2 Time dependences of the gain factor on the axis of alumina capillary (r0 = 1.5 mm, rise time 50 ns, Imax = 16 kA) for various initial gas filling pressures (in mbar).

71
4.2 Dependences of the pressure-optimized gain factor on the current peak value
Fig. 4.3 shows the peak discharge currents ranging from 13.5 kA to 19 kA
obtained from the experiments of Tan [18].
0 20 40 60 80 100 1200
5
10
15
20
Curre
nt (k
A)
Time (ns)
19 kA
16 kA
13.5 kA
Figure 4.3 Current wave form for 13.5 kA, 16 kA and 19 kA which are extracted from the experiments of Tan [18].
In Fig. 4.4, displays a contour plot of electron density versus electron temperature
(where temporal information has been suppressed) at various gas filling pressures. The
results of electron temperature Te,max (tG) and electron density Ne (tG) for 13.5 kA, 16 kA
and 19 kA are summarized in Fig. 4.4. The range of electron temperature Te,max (tG)
broadens with the increase in the peak discharge current, Imax, i.e., from 40 – 70 eV (for
Imax = 13.5 kA), 45 – 85 eV (Imax = 16 kA) to 58 – 100 eV (for Imax = 19 kA) with the
range of p0 0.11 – 0.35 mbar; whereas the range of electron density Ne (tG) (2 – 6 x 10¹⁸
cm-3) for 19 kA of peak discharge current is higher than the range of electron density Ne
(tG) (0.8 – 2 x 1018 cm-3) for 13.5 kA of peak discharge current with the same range of
initial gas filling pressures of 0.11 – 0.35 mbar. While the electron densities Ne (tG) in

72
the range of 4.2 – 1.6 x 1018 cm-3 for 16 kA of peak discharge current. So Fig. 4.4
describe the case of initial input parameters, i.e. r0 = 1.5 mm, T1/4 = 50 ns and the range
of p0 is from 0.11 – 0.35 mbar remain unchanged, the increment of Imax give effect of
the increment of the range of electron temperatures Te,max (tG) and electron densities Ne
(tG). This further increase the gain values, G(tG). However, this increment of the gain
values, G(tG), will hit the maximum value. This gives that the limitation of Imax would
be implied to avoid electron density Ne (tG) is too high and resulting optical thick plasma;
also to prevent from high electron temperatures Te,max (tG) as the outcome ions Ar8+
abundance are demolished and low gain values G(tG) would be obtained.
Figure 4.4 The electron densities and electron temperature on the axis of the capillary during the maximum compression with various initial gas filling pressures for the peak discharge, Imax, of 13.5 kA (black dash line), 16 kA (black solid line) and 19 kA (black dot-dash line) which superposed from the Fig. 3.3.
Note that, the rightmost points of each Imax line in Fig. 4.4 is corresponds to p0 =
0.11 mbar. If p0 has been fixed to 0.11 mbar and all other parameters remain unchanged,
the results show that for higher discharge current, the compression by the magnetic

73
piston is more severe and hence, faster shock front speed. This gives rise not only to
higher electron temperature, but also to higher electron density. This leads to
overheating of the plasma so that the conditions suitable for lasing are destroyed. In
order to reduce the electron temperature, higher initial gas filling pressure is needed
when high discharge currents are needed.
Fig. 4.5 shows the dependency of the gain factor peak values G(tG), with opacity
effect included, on the initial gas filling pressures for discharge current peak of 13.5 kA
(dashed line) and 19 kA (solid line) which were calculated from the non-LTE model. A
comparison with the contour gain factor G(tG) of Fig. 4.4 which was calculated from
LTE model, shows only a slight difference at these peak discharge currents in the gain
factors G(tG) derived from the LTE and non-LTE models become even bigger at higher
peak discharge currents, as will be shown in the following sections.
0.10 0.15 0.20 0.25 0.30 0.350.0
0.2
0.4
0.6
0.8
1.0
Gai
n (c
m-1)
Initial Gas Filling Pressure (mbar)
0.00
0.02
0.04
0.06
0.08
0.10
Gai
n (c
m-1)
Figure 4.5 Dependence of gain factor peak value with opacity effect included on the initial gas filling
pressures for current peak of 13.5 kA (dashed line) and 19 kA (solid line).

74
The calculated pressure range for the peak current of 13.5 kA, which fulfill the
electron profile (electron density of 0.1 – 4 x 1019 cm-3, and electron temperature ≈ 40 –
90 eV, as shown in Fig.3.3), is 0.09 mbar < p0 < 0.23 mbar, which compares favourably
with 0.10 mbar < p0 < 0.22 mbar which was measured by Tan [18].
The calculated pressure range for the peak current of 19 kA, which fulfill the
electron profile (electron density of 0.1 – 4 x 1019 cm-3, and electron temperature ≈ 40 –
90 eV, as shown in Fig.3.3), is 0.17 mbar < p0 < 0.39 mbar. Tan’s experiment [18],
measures the range of the pressure as 0.14 mbar < p0 < 0.37 mbar. Hence, the pressure
ranges calculated from the simulations agree well with the experimental measurements.
To summarize, the initial gas filling pressures that seen to play an important role
in determining the optimum electron parameters, i.e. electron density of 0.1 – 4 x 10¹⁹
cm-3 and electron temperature ≈ 40 – 90 eV, required for lasing action.
In sections 4.1 and 4.2, the influence of initial gas filling pressures, p0 and of the
electric current peak value, Imax, on the electron profiles have been studied. However,
the rise time T1/4 and the size of the capillary radius r0, were kept fixed in these two
sections. Section 4.3 describes an experiment conducted at a high current peak value of
190 kA. We use the results obtained to motivate the optimization of the four parameters
(p0, Imax, T1/4, r0) at a high current of 100 kA, as discussed in section 4.4.
4.3 A High Current Experiment Study
There is great interest in the study of laser optimization schemes at high current
peak values to sustain a more powerful laser output. However, this requires the
generation of significantly hotter and denser plasma columns [50, 56], which in turn
demands a substantial scaling up of excitation power density.
In Gonzalez’s experiment [57], the plasma columns were generated utilizing
current pulses with rise time of about 18 ns and peak amplitude of 190 kA. Utilizing this

75
discharge, Ar plasma columns were generated in capillaries of diameter 4 mm filled
with 1.3 Torr of Ar gas. Time resolved soft x-ray spectra and pinhole images of the
plasma were obtained. The paper also reported the experimental data and its comparison
with model computations [56, 58, 59] which suggested that dense (> 1 x 1020 cm-3)
argon plasma columns of 300 μm diameter with electron temperatures >250 eV had
been generated.
The inputs (p0 = 1.5 Torr, Imax = 190 kA, T1/4 = 18 ns, r0 = 2 mm) from Gonzalez’s
experiment are used in the Helios-CR code to generate a higher degree of ionization
than the required Ar8+, as shown in Fig. 4.6. Plasma columns with maximum degree of
ionization were of most interest to Gonzalez et al [57] for the development of shorter
wavelength light. From Fig. 4.6 see that the 3p 1S0 – 3s 1P1 transition of Ne-like Ar at
46.9 nm cannot occur at during the pinch time. However, this transition should be
detectable before the pinch time due to the high fraction of Ar8+ ions and high gain
factor just before the pinch time.
On the other hand, it was found in the previous calculations from Helios-CR that
the high current (Fig. 4.6a) results in a much larger shock-induced plasma temperature
change, as it is natural to expect from the much larger amplitude and shorter duration of
the current pulse, as compared with lower current (Fig. 3.4a). The depth of the layer in
front of the hot dense shock is of the order of 100–200 μm and is defined by the heat
conductivity in the low density gas, and to a lesser extent by the process of
electromagnetic field diffusion. Heat conduction enables a high electron temperature
which results in the high degree of ionization observed.

76
Figure 4.6 Basic parameters of discharge in capillary with diameter of 4 mm filled with argon at a initial gas filling pressure of 1.3 Torr for I0 = 190 kA and rise time 18 ns. (a) The plasma time-space flow diagram; the dotted line corresponds to the discharge current at outer boundary; (b) contour lines of the decimal logarithm of the electron density (measured cm-3) on the (t, r) plane; (c) contour lines of the electron temperature (measured in eV); (d) contour lines of the fraction of ion Ar8+; (e) contour lines of the gain (measured cm-1).
Fig. 4.7 is the percentage of electric current which is normalized over 190 kA of
peak discharge current inside the region of radius r and time t. More than 50% of the
electric current at outermost region of the plasma was generated from 2 to 13 ns after
the current flows into the capillary. At 6 ns after current flows, almost full (100%)
electric current was detected at outermost region of the plasma. Also, when the heat
wave and the magnetic wave arrive on axis, the maximum of the current density and

77
joule dissipation arrives at the centre of the capillary as in the Ne-like Ar soft-x-ray
laser case. Quickly after that, within 1–2 ns, the front of the shock wave arrives to form
the hot dense plasma column. Mass continues to be supplied, and after several more
nanoseconds the plasma starts to cool due to expansion, radiation losses and current
decay. The total current flowing inside the compressed plasma column is a small
fraction, i.e. of the order of 1% of the total current at the center of the axis in Fig. 4.7.
However for 190 kA peak discharge current, the electron temperature Te,max(tG) =
250 eV and electron density Ne (tG) = 1.7 x 1020 cm-3 (in Fig. 4.6) generated at
maximum compression during the pinch time, are beyond the optimum range of the
electron profile (electron density of 0.1 – 4 x 1019 cm-3, and electron temperature ≈ 40 –
90 eV, as shown in Fig.3.3) making it difficult for lasing in Ne-like Ar with such
conditions. Hence, due to this reason, it is reasonable to suggest that a combination of
several factors including a smaller current, i.e. 100 kA, and some adjustment of pinch
radius and other parameters might lead to option lasing conditions.
Figure 4.7 Contour lines of the percentage of electric current (which normalized over 190 kA of peak discharge current) inside the region with radius r and time t.

78
4.4 System Optimization Study of 100 kA Current Peak
The results of the experiment of Gonzalez et al [57] as discussed in section 4.3
motivates the suggestion of 100 kA peak current. The investigation of the plasma
dynamics in capillary discharge involves many parameters, such as the initial radius 0r ,
the initial pressure 0p , and the current rise time T1/4. With a high current peak, a larger
inner capillary diameter is needed to yield a plasma column sufficient to deliver a higher
energy of laser output. A total of 9 simulations at 100 kA peak current, with several
current rise times from 50 ns to 100 ns, with varying capillary diameters from 6 mm to
10 mm at various gas filling pressures have been studied. The objective is to determine
the optimum laser gain and the trends arising from each input.
Fig. 4.8 (a) shows that, all else being fixed at 100 kA peak current, 50 ns rise time
and 6 mm capillary diameter, the pinch time tp is tuned by the choice of the initial gas
filling pressure p0. Fig. 4.8 (b), (c) and (d) respectively show the values of electron
density, electron temperature and gain with respect to the time of as a function of initial
gas filling pressure. As the initial gas filling pressure is increased, the pinch time shifts
gradually to later times and the pinch radius gradually increases; the electron density
and electron temperature are decreasing if compared at the respective pinch time. Due to
the high velocity compression, among all pressures p0, the electron temperature abruptly
increases to reach or surpass the optimal values for lasing (50 – 80 eV) as previously
discussed in Chapter 3. Also, when the kinetic energy of the shock wave reaches the
capillary axis, it causes an abrupt increase in the ion temperature. Overionization of the
dense plasma, increased Doppler broadening, and collisional thermalization then result
in a decrease in the gain, thus terminating the laser pulse [50].
Most of the maximum gains occur at 2 or 5 ns before the pinch time. The gain
remains high if compared with the value of gain (about 1 cm-1) obtained in Chapter 3.
This is because the high currents used here are higher than the low current employed in

79
Chapter 3. This means that there are more electrons than previously which cause more
collision excitation processes to occur during the compression. Hence, larger numbers
of electrons populate the upper laser level resulting in a larger population inversion.
However, the maximum gain values shown in Fig. 4.8 differ from the values
obtained in Fig. 3.3. This is because the gain values shown in Fig. 3.3 were generated
from the assumption of time independent collision radiative model and the values
obtained can only serve as a guide for the lower limit of the gain. On the other hand, the
gain shown in Fig 4.9 (d) was calculated by using time dependent collision radiative
model.
From Fig. 4.8 (d), the maximum gain occurs at 2.0 mbar at which a pinch occurs
at 65.5 ns with 923 μm diameter of plasma column, 5 × 1019 cm-3 electron density and
74 eV of electron temperature at the pinch time. The maximum gain occurs at 62 ns
with the gain value of 4.16. The value of electron density and temperature during the
gain maximum are 2.42 × 1019 cm-3 and 71 eV.
Calculations [60] show that lowering of gas pressure will lead to a higher gain
coefficient. This is because the reduced total gas mass enables compression to smaller
volumes (in the radial direction), resulting in a hotter and dense plasma. The increase in
temperature increases the pumping rate to the upper laser level, leading to increasing
gain. However, this advantage is lost when the pressure is lowered below optimum. In
this lower pressure regime, the electron temperature of the pinched plasma becomes too
high and it will thermalize the population inversion built between the 3s-2p Ne-like
Argon.
The duration of the gain is calculated from the full width half maximum of the
gain value. As the capillary pressure increases, the duration of the gain becomes longer.
This is because at lower capillary pressure, the plasma gets heated very fast and is
unable to sustain the gain as compared to the case of higher capillary pressure.

80
Figure 4.8 (a) Radial motion of outer plasma mass elements, (b) Temporal evolution of electron temperature, (c) Temporal evolution of electron density (d) Temporal evolution of gain; for various initial gas filling pressures (in mbar) for 100 kA of current peak, 50 ns of current rise time and 6 mm of capillary diameter.
At a capillary pressure of 0.8 mbar, the pinch occurs around the peak of current,
but the highest gain among the maximum gain of this configuration happens at capillary
pressure of 2.0 mbar which the pinch occurs at 65.5 ns, that is 15.5 ns prior to the
current peak. What happens if the rise time of peak current has been changed? Will the
pinch occur much later? Will the highest gain among maximum gain happen at the
pinch where the current is at its peak?

81
Fig. 4.9 and Fig 4.10 report the study of trend of the 75 ns and 100 ns current rise
time, respectively. Fig. 4.9 shows the output parameter of the variation of initial gas
filling pressure with fixed inputs of 100 kA peak current, rise time of 75 ns and the
diameter of the capillary of 6 mm. At capillary pressure of 1.9 mbar, the pinch pinches
at about the peak of current (75 ns) in this configuration and it gives the highest value
among the maximum gain values. In fact, the maximum gain of initial gas filling
pressure from 1.4 to 2.1 mbar are almost the same.
Fig. 4.10 shows the output parameter of the variation of initial gas filling pressure
with fixed inputs of 100 kA peak current, rise time of 100 ns and the diameter of the
capillary of 6 mm. At capillary pressure of 3.25 mbar, the pinch pinches at the peak of
current, but the highest gain among the maximum gain of this configuration happens at
capillary pressure of 2.5 mbar in which the pinch occurs at 93 ns, subsequent to the
current peak which occurred 7 ns earlier.
From Fig. 4.8, Fig. 4.9 and Fig. 4.10, the inputs of 100 kA peak current and the
diameter of the capillary of 6 mm remain unchanged, while the rise time of peak
currents were changed from 50 ns to 75 ns and then to 100 ns. The Table 5.1 is shown
the summary of the plasma output during the pinch at 2.5 mbar of the initial gas
pressure.
Table 4.1 The summary of the plasma output during the pinch at 2.5 mbar initial gas filling pressure, 100 kA peak current, 6mm capillary diameter and at the various current rise time.
Current Rise Time (in ns) 50 75 100 Pinch Time, tc (in ns) 70.5 82 93 Pinch Radius, rc (in μm) 615 503 532 Electron Density, Ne,p (in cm-3) 4.0 x 10¹⁹ 4.9 x 10¹⁹ 4.2 x 10¹⁹ Electron Temperature, Te,p (in eV) 63 61 55

82
Figure 4.9 (a) Radial motion of outer plasma mass elements, (b) Temporal evolution of electron
temperature, (c) Temporal evolution of electron density (d) Temporal evolution of gain; for various initial gas filling pressures (in mbar) for 100 kA of current peak, 75 ns of current rise time and 6 mm of capillary diameter.

83
Figure 4.10 (a) Radial motion of outer plasma mass elements, (b) Temporal evolution of electron
temperature, (c) Temporal evolution of electron density (d) Temporal evolution of gain; for various initial gas filling pressures (in mbar) for 100 kA of current peak, 100 ns of current rise time and 6 mm of capillary diameter.
In the case of 100 kA discharge current, 6 mm capillary diameter, 75 ns rise time
the maximum gain of 4.2 cm-1 appears to be insensitive to the gas filling pressure which
ranged from 1.4 ≤ p0 ≤ 3.0 mbar as shown in Fig.4.10 (d).

84
The system that fulfills the electron profiles (i.e., electron density of 0.1 – 4 x 10¹⁹
cm-3, and electron temperature ≈ 40 – 90 eV, as shown in Fig.3.3) required a rise time of
75 ns and 6 mm capillary diameter. In addition, the range of initial gas filling pressures
that required for this simulation is 1.4 mbar < p0 < 3.0 mbar.
Next, what are the effects if the capillary diameter is varied? Fig. 4.11 shows the
plasma parameters corresponding to the maximum gain of each configuration which Fig.
4.12 shows the gain values and the corresponding gas filling pressure of the capillary
for each different configuration. 3 major sets of the capillary diameters, 6 mm (red
colour), 8 mm (black colour) and 10 mm (blue colour), were shown in Fig. 4.11 and Fig.
4.12. In each major set, 3 different rise times, 50 ns, 75 ns and 100ns, were studied.
In Fig. 4.11, the rise time of 100 ns always give the highest electron densities and
the narrowest range of electron temperatures (on the axis of capillary during the peak of
gain) among same set of capillary diameters. Whereas the rise time of 50 ns always give
the lowest electron densities and the widest range of electron temperatures (on the axis
of capillary during the peak of gain) for same set of capillary diameters. The 6 mm
capillary diameter (red colour) usually gave the higher electron densities and narrower
range and smaller values of electron temperatures than the other capillary diameters. On
the other hand, the 10 mm capillary diameter (blue colour) generally gave lower
electron densities with wider range and bigger values of the electron temperatures as
opposed to the other capillary diameters.
Fig. 4.12 shows that larger diameters of capillary (10 mm in blue colour) results in
narrower ranges of initial gas filling pressure. However, smaller diameters of capillary
(6 mm in red colour) gives wider ranges of initial gas filling pressure. The effect of
changing the diameter of capillary (the channel radius r0) is not straightforward due to
the difficulty in keeping the temperature steady during the radius parameter study. The
equilibrium temperature can be estimated by the following simplified equation [61]:

85
Equation Chapter (Next) Section 4 ( ) dissk T S∇⋅ ∇ =
, (4.1)
with k denoting the thermal conductivity and T the temperature. dissS is the power
dissipation density, which is given by
2 2
maxdiss 2 2
0
J ISrσ π σ
= ≈ . (4.2)
Here, σ is the electrical conductivity, J the current density, maxI the current and 0r the
channel radius. In first order, the left hand side of (4.1) is proportional to 20r− . Thus, in
order to keep T constant, the right hand side must have the same 0r dependence. Using
(4.2), maxI should be varied proportional to 0r to achieve this [61]. However, this does
not well describe the selection of input parameters such as initial gas filling pressure.
Figure 4.11 Electron density and temperature at peak of the gain of each configuration.

86
Figure 4.12 The gain values versus initial gas filling pressure in each configuration.
Further, let us consider a cylindrical column of fully ionized quasineutral plasma,
with an axial electric field, producing an axial current density, j, and associated
azimuthal magnetic field, B. As the current flows through its own magnetic field, a
pinch is generated with an inward radial force density of ×j B . In a steady state the
balancing forces yield:
( )e ip p p∇ = ∇ + = ×j B
, (4.3)
where p∇
is the magnetic pressure gradient, pe (pi)is the electron (ion) pressure. Then
from Maxwell's equation ∇ × B = μ0 j and the ideal gas law p = N k T, we obtain the
Bennett relation
( ) 20max2
4l e iN k T T Iµπ
+ = , (4.4)
where Nl is the line density at the pinch, Te (Ti) is the electron (ion) temperature, and k is
the Boltzmann constant. For simplicity, assume that e iT T= and substitute 2lN Nr=
where N is the number of electrons per volume. Eq. (4.4) can be written as

87
2 20, , 04
4e p p e pN r kT Iµπ
= , (4.5)
where subscript p indicate the values at the pinch. To fulfil the plasma condition, the
approximate relations can be written as [56]:
2 2, 0 0* constant,e p pN r z N r = (4.6)
where *z is the ion charge. For Ne-like Argon, * 8z = . Then Eq. (4.6) can be rewritten
as:
2max
, 20 0
* e pIz TN r
. (4.7)
The velocity of the shock wave inside the channel can be estimated to be of the
order of the Alfvén velocity [62],
( )1 2
04ABv
πρ= , (4.8)
with the magnetic field max 02B I rµ π= and 0 0 AMN Nρ = where M is atomic mass
and NA is the Avogadro constant. Assuming the characteristic time for compression,
0c At r v= , we obtain the relation,
2
0 01/4
max
2 Ac
r MN NT t
Iπ π
µ= = . (4.9)
From Eq. (4.6), (4.7) and (4.9), the rough estimation of input parameters of maxI ,
1/4T , 0r and 0p can be set to obtain the values of ,,p e pr N as the required plasma
parameters.
Consider 100 kA of current as one of the input parameters. From Fig. 4.12, an
increase of 0r decrease the role of dissipative effects decrease (Eq. (4.2)). To maintain
the electron temperature within the required range, the range of initial pressure becomes
narrower and it values become smaller. However, if 0r decreases, the initial pressure
range becomes wider and the values of pressure have to be bigger (Eq. (4.7)). This is

88
because the effect of change of radius is faster than the changes of the initial pressure to
maintain the electron temperature and the current. The rise time of the current can be
estimated in Eq. (4.9). Here, it has been assumed that the pinch always compresses
during the peak of the current. To conclude, for each set of initial conditions p0, r0, Imax
and T1/4, the various values of pr and ,e pN can be obtained so as to coincide with the
plasma conditions that are required.
Hence, in the case 100 kA discharge current, a high gain output can be expected
from each capillary diameter and the current rise time. The range of initial gas filling
pressures is suggested in this simulation that fulfills the plasma conditions (i.e., electron
density of 0.1 – 4 x 1019 cm-3, and electron temperature ≈ 40 – 90 eV, as shown in
Fig.3.3) are shown in Table 5.2.
Table 4.2 Suggestion of range for the initial gas filling pressures in each capillary diameter. Capillary Diameter (mm) 6 8 10 Current rise time which high gain output expected (ns) 75 100 100
Initial gas filling pressure which high gain output expected (mbar) 1.9 0.8 0.5
Suggested range for the initial gas filling pressure which fulfills the plasma condition (mbar) 1.4 – 3.0 0.8 – 2.25 0.3 – 1.25
As a summary, the electron profiles (electron density of 0.1 – 4 x 1019 cm-3, and
electron temperature ≈ 40 – 90 eV, as shown in Fig.3.3) were playing role to determine
the range of initial gas filling pressure. In order to simulate the profile of the laser
intensity for the experiment, the gain still remain as one of the main factors. But not all
light beams are amplified and are detected into the CCD signal. Refraction effect due to
high electron density gradients around the time of lasing may play a vital role in the
amplification process of the laser beam. This factor has been taken into the account in
next chapter.

89
Equation Section 5 Chapter 5
Modelling of Capillary Discharge X-ray Image Output
Using a Ray-tracing Code
In the capillary discharge scheme a fast current pulse rapidly separates the plasma
column from the capillary walls and compresses it, creating a high temperature plasma
column of small diameter and cylindrical symmetry which has been studied in the
previous chapters. Under certain plasma conditions (electron density of 0.1 – 4 x 10¹⁹
cm-3, and electron temperature 40 – 90 eV, as shown in Fig.3.3) the fast capillary-
discharge generates amplification of the J = 0 – 1 soft x-ray line of neon-like argon at
46.9 nm.
Soft x-ray lasers have small lateral dimensions in high-density plasmas, resulting
in electron density gradients which cause refraction effects to the amplified x-ray
radiation. This refraction is responsible for strong optical losses and for a beam intensity
distribution dominated by characteristic side lobes with large divergence.
The index of refraction is related to the electron density en through [63]
1 e
c
nn
η = − , (5.1)
where the critical electron density cn is defined as
2 2
23 302 2
4 5 10 cmec
m cne
π ελ
−= = × , (in c.g.s unist) (5.2)
which c as the speed of light. Here, λ is the laser wavelength of 46.9 nm.
Some previous works describe the beam propagation and amplification in a
plasma with various electron densities distributions. London [64] in 1988 analyzed the
propagation and amplification of exploding foil x-ray lasers. An analytical 3-
dimensional model was approximated to treat parabolic density and gain profile were

90
calculated along the ray trajectories. The model was later extended to treat constant and
quartic gain profile beam patterns. London [64] concluded that the model with parabolic
density and gain profile does not agree qualitatively with the experimental data.
However, the pattern from a quartic gain profile having a dip in the center of the plasma
can produce a profile with off-axis peaks, in better agreement with the experimental
data. In addition, the main observed features can be reproduced with a parabolic density
profile and a quartic gain profile.
Subsequently, Fill [65] also studied the beam propagation of a ray within a plasma
with a density gradient. His analysis has been limited in two dimensions, using
Cartesian or cylindrical geometry. Linear, quadratic, exponential, and Gaussian electron
density distributions have been considered for plane and curved targets, in which exact
solutions of paraxial-ray equations have been derived and have been compared with
numerical solutions. Rocca et al. [66] used the model and the solution of the parabolic
density profile, derived and simplified by London [64], to estimate the electron density
in the gain region of a discharge-driven soft x-ray laser. Chilla and Rocca [67] studied
the beam optics of a capillary discharge, which has been described by a model with a
one-dimensional density gradient, assuming parabolic density profile.
In this chapter, the analysis of the soft x-ray beam propagation and amplification
in a plasma of cylindrical geometry for arbitrary gain and density profiles has been
studied by using Matlab software (Appendix B). The characteristics of the laser beam
intensity distribution of highly saturated capillary discharge 46.9 nm soft x-ray laser are
reported. By measuring, in different simulated conditions, the far field intensity
distribution of laser beam produced in the elongated capillary channels, an amplification
regime has been obtained. The features of laser amplification in the plasma column will
be analyzed by comparing the experimental results with theoretical simulations based
on two-dimensional ray-tracing code.

91
5.1 Ray Trajectories And Formalism
The ray propagation equation is satisfied the rays propagating across the plasma
column [68]:
d drds ds
η η = ∇
, (5.3)
where s is the arc length of the ray trajectory and η denotes the local refractive index.
This ray propagation equation can be solved as a function of path, s, defined by the
cylindrical coordinates, r is position of the ray in radial direction measured from the
centre of capillary axis, θ is the angular position of the ray and z is the capillary length,
as shown in Fig. 5.1.
Tube radius, r
Tube axis
er
eθ
ez
θ
dθ/dz
dr/dz
Figure 5.1 Coordinate definitions for a cylindrical geometry
The paraxial approximation is used, i.e. the angle between the ray and the tube
axis is sufficiently small that ( ds dz ). Rays can be launched randomly within certain
angles. Rays with too large initial angle will quickly escape from the plasma region and
do not contribute to the light emission from the exit plane of the capillary. Also, due to
1-D (radial direction) MHD model which has been studied in previous chapter, the

92
refractive index is changing only along the radial direction ( 0η θ∂ ∂ = and 0zη∂ ∂ = ),
which leads to
( )2
2 lnd r ddz dr
η= , (5.4)
2
2 0dr d drdz dz dz
θ θ+ = . (5.5)
The set of differential equations (Eq. (5.4) and (5.5)) to calculate a particular ray
trajectory, have to be solved until the ray exits the plasma. A system with the first order
differential equations of Eq. (5.4) and (5.5) can be expressed as,
( )' 1 1, ' '
', ',
dr d dr rdz dr dz r
dr drdz dz
θη θη
θ θ
= = −
= = (5.6)
which can be numerically solved using the Runge-Kutta method. Considering only the
rays with a small angle with the axis ( ds dz ), 'r is the angle between the tangent to
the ray and the tube axis in the plane ( ,z re e ). In the same way, 'θ is the angle between
the tangent to the ray and the tube axis in the plane ( ,z θe e ) (Fig. 5.1).
A large number of rays have to be considered to represent the profile for the
intensity emitted by the plasma, with z, r, and θ. The maximum angle for 'θ and 'r
defines an emission cone are limited by the initial position (r0, θ0). These initial values
are obtained by taking uniformly distributed random numbers. The angles of emission
'θ are limited to a range of a few milli-rad and this is because the ratio of length of
capillary and the size of radius of capillary is always >100:1. This number is critical to
produce an intense beam laser [19]. The initial radial position r can vary from 0 to Rtube
(radius of emitted plasma), the initial longitudinal position Z from 0 to Ztube (the length
of capillary) and initial angle θ ranges from 0 to 2π.

93
Finally the propagation of the ray is calculated using Eq. (5.6). This simulation
has to be performed for over 106 rays where have been distributed uniformly in 1000 ×
1000 rays in the x-y plane to model refractive effects. In order to verify the accuracy, a
ray-tracing code has been developed. The code was tested against the result of Girard
[69].
The electron density for the plasma was given [69] by
( ) ( )( ) ( )( )( )2 20 00
2r r a r r a
enn r e e− − − += + (5.7)
where n0 is the maximum density, a is the profile width and r0 is the Gaussian central
radius with n0 = 1026 m−3, r0 = a = 3 × 10⁻⁴ m as shown in Fig. 5.2. Here, the electron
density profile shows a dip in the centre of the axis.
Figure 5.2 Electron profile from Eq. (5.7).
Fig.5.3 shows some typical ray trajectories which have been generated using the
ray-tracing program for the electron density profile according to Eq. (5.7) or Fig. 5.2.
The capillary tube was 60 cm long with a diameter of 1 mm following Girard [69]. Each

94
launched point had 3 randomly chosen launch angles, θ’, i.e 1, 0 and -1 mrad. These are
denoted by the upper, middle and lower line in each of the launch points in Fig. 5.3. It
can be observed that refraction bended the rays in a direction opposite to the direction of
the electron density gradient. The effects of refraction are significant for plasmas at high
electron densities and high gradients. Rays launched within the hollow of the electron
density and at small angles (θ’ in between -1 to 1 mrad), would remain within the
‘hollow’ region.
Figure 5.3 Ray trajectories obtained from the electron profile, Eq. (5.7).
During propagation within the plasma, each ray would be positioned at its own r,
θ, r’ and θ’ at every step size of z due to the effect of the electron density gradient.
When the rays exit the plasma at the end of the capillary, with no more influence from
the electron density gradient, the ray would just move along a straight line according to
last values of r’ and θ’.
However, in imaging of soft x-ray laser, the generation of laser intensity is an
important calculation to predict the output of the experiments. The electron density

95
gradient and the gain profile have always to be taken into account in the evaluation of
the laser intensity.
5.2 Geometry of Code
The ray tracing Matlab code developed in Appendix A is to calculate the ray
trajectories and laser intensities along the three axes, i.e in r, θ and z direction. This ray
tracing code works as a post-processor to the Helios-CR MHD code which gives the
temporal and spatial evolution of the gain, the electron density and plasma width in the
radial direction.
Fig. 5.4 depicts the code geometry. The initial rays are launched on an equally
spaced grid in the first cell, consisting of 1000 × 1000 rays in the x-y plane. The values
of r0 and θ0 corresponding to each grid point is determined and the range of r’ and θ’ are
identified. Subsequent position of the rays for every step size of z are numerically
solved using the Runge-Kutta method.
Tube radius, r
Tube axis
er
eθ
ez
θ
1st cell2nd cell
Last cell
Figure 5.4 The geometry of the code. The plasma is divided into cells along the propagation axis.

96
The intensity is amplified as the ray propagates through the gain regions. The
amplifying formula is [70]
( )0 1g zjI eg
∆= − , (5.8)
where 0g is small-signal gain, z∆ is the ray path in each cell and j is the plasma
emissivity. Eq. (5.8) is valid in the first cell only, where the rays are launched. The
emissivity j is generally assumed to be homogeneous along the z-axis [70]. Hence,
( )
2
0 24u ulrj N hv A
zπ=
∆. (5.9)
The emissivity depends on the population of the upper level uN , the laser photon
energy hv0, the radius r of the region, and the Einstein coefficient for spontaneous
emission ulA between the two lasing levels. The emission is then amplified along the
trajectory [71] via:
( ) ( ) ( )1/2
g z zzI z z e I zz z
∆ + ∆ = + ∆ (5.10)
where ( )I z and ( )g z represent the ray intensity and the gain profile, respectively,
along the ray trajectory. The gain profile is
( ) ( )0
1sat
gg zI zI
=+
, (5.11)
where satI is the value of the saturation intensity. For efficient extraction of the energy
stored in the laser medium it is desirable to operate in conditions such as to saturate the
gain. The saturation is commonly quantified in the x-ray laser literature in terms of the
gain-length product necessary for saturation of the gain medium. This parameter is
highly dependent on the geometry of the plasma column and on the effects of refraction.
The saturation intensity depends only on a few basic atomic parameters [72]. Here,

97
( )u
satstim
A hvI
σ×
= , (5.12)
where uA is the total upper laser level depopulation rate, hv is the laser photon energy
and stimσ is the stimulated emission cross section. Atomic model calculations [3] of gain
saturation for the 46.9 nm line of Ne-like Ar give 15 27.8 10 cmstimσ −× and
11 11.3 10 suA −× and with these the saturation intensity is 7 26.8 10 W/cmsatI × .
The model is used to simulate the performance of a pinhole imaging system by
only transmitting the rays falling on the pinhole and then calculating intensity
distribution on a detector plane placed at a chosen distance away from the pinhole. The
modelled detector is a grid of cells similar in size as the pixels of the CCD, and the
number of rays striking each pixel of the detector is counted. The grid pitch is adjusted
to get good statistics on the counts. The intensity distribution on the detector can be
displayed as a contour plot, or as radial intensity profiles by making a plot of the counts
in each of the pixels on a straight line passing through the centre of the detector.
5.3 Numerical Results and Discussion
The electron density profile considered in section 5.1 was generated by an
analytic expression, Eq. (5.7). However, in the following discussion, the electron
density profile follows Fig. 5.5 which was generated from the dynamics of the capillary
plasma column previously discussed in chapter 3. The measurements discussed below
were conducted using 20 cm long capillaries of 3 mm diameter filled with 0.15 mbar of
pure argon gas, excited by a current pulse of 16 kA peak current having a first half cycle
duration of about 50 ns at the maximum compression of the plasma.
To illustrate the operation of the ray-tracing program, Fig. 5.6 shows ray
trajectories launched from an arbitrary point 34 10 cm−× from the axis along various
angles. The rays encounter the electron density profile during propagation. And, the

98
simulated calculation in Fig 5.6 has been extrapolated to the capillary length of 20 cm in
order to show the refraction effects. In Fig. 5.5, the electron density profile is
concentrated in between -0.26 mm to 0.26 mm and electron density profile is
symmetrical along radial direction. When the rays are launched at angles of 1 and 2
mrad, the rays quickly escape from the plasma region. On the other hand, rays launched
at 0, -1 and -2 mrad are refracted within the region of -0.26 mm to 0.26mm which is
also the high electron density gradient region.
Figure 5.5 Electron density profile at maximum compression by current pulse of 16 kA peak current having rise time about 50 ns with 20 cm long capillaries of 3 mm diameter filled with 0.15 mbar of pure argon gas.
The range of initial launch angle is determined by the size of plasma column, see
Fig. 5.7. If the full diameter of the capillary is considered, the maximum range of the
launch angle would be 15 mrad. However, the range of initial launch angle will be
reduced due to the diminished radius of plasma column. So, in the case of electron
density profile in Fig. 5.5, the size of plasma is 0.026 cm and the length of the capillary

99
is 20 cm. Hence, the maximum range of the launch angle is restricted to 2.6 mrad. Due
to the complexity of the effect of refraction, twice the width of the initial launched angle
is used to minimize the rays missing out from the region of high electron density profile.
Hence, we use a 4 mrad range of initial launch angle.
Figure 5.6 Ray trajectories with simulated electron density profile for propagation along z at the initial point of 34 10 cm−× at various launching angles.
z = 20 cm
Cap
illar
y di
amet
er,
d =
0.3
cm 15 mrad.
launch angle depends on the size of plasma.
size
of t
he
plas
ma
Figure 5.7 Determination of initial launch angle.

100
Also, since the high gain region is focused between -0.26 to 0.26 mm in Fig. 5.8,
the gain drops tremendously once the rays propagate out of this region. For example, the
ray launched at an angle of 2 mrad is saturated much earlier than other rays in Fig. 5.9,
resulting in a much lower intensity. The intensity also gets saturated after traversing 8
cm along the length of the capillary beyond which the ray exits the plasma column.
Note that the intensity of the ray launched at 1 mrad is similar to the intensity of the ray
launched at 2 mrad, but the ray’s intensity is slightly higher than the ray launched at 2
mrad. This is because the ray launched at 1 mrad remains in the region of high gain
longer than the ray launched at 2 mrad. The intensities of the rays launched at 0 and -1
mrad are about the same with the intensity of the ray without refraction effects. This
implies that the rays do not experience refraction effects after propagating down the 20
cm long capillary and the rays largely remain within the high gain region. For the ray
launched at -2 mrad, its intensity is not as high as the ray launched at 0 and -1 mrad
because for most of its path the ray is in the region of 0.10 to 0.25 mm where the gain
is has a negative gradient.
Figure 5.8 Gain profile at maximum compression by current pulse of 16 kA peak current having rise
time about 50 ns with 20 cm long capillaries of 3 mm diameter filled with 0.15 mbar of pure argon gas.

101
Figure 5.9 Integrated intensity obtained as a function of z. Rays are launched at the time of pinch. The
red bold solid curve is obtained with the same code but without refraction effects.
Fig. 5.9 shows that the intensities of the rays which were refracted out of the
plasma region at the end of 20 cm length of the capillary were 1 or 2 orders of
magnitude lower than the intensities of the rays which were concentrated inside the
plasma column.
Fig. 5.10 shows cross-sectional images of plasma column at various lengths
along the capillary. For the capillary length of 10 cm, the intensity of inner zone plasma
is about 107 W/cm2, while the intensity of outer zone plasma is about 106 W/cm2. The
difference between the inner and outer zones was only 1 order of magnitude. In Fig.
5.10, this difference was not detectable due to the intensity was normalized from scale
intensity of 20 cm capillary long. As the capillary lengthens, the cross sectional image
area of plasma column increase. The intensity at the centre of plasma column also
increases exponentially, whereas the intensity of the outer region of the plasma column
grows linearly after 10 cm capillary length.

102
Fig. 5.11 shows the images of plasma column at the exit of the capillary and
pinhole. The figure has been cropped to focus on the central 0.1 × 0.1 cm2 region. The
distance between the pinhole and the exit of the capillary is 1 cm. So the divergence of
the rays is not critical at the pinhole. Hence, images from both points look similar.
Figure 5.10 The image of the plasma column at various different lengths along the 20 cm long capillary.
Figure 5.11 The images of the plasma column in the exit of the capillary and the pinhole.

103
In Chapter 3 it was mentioned that the size of plasma column during maximum
compression in the simulation was greater than that of the experiment because only the
FWHM radiating region of the plasma column was measured in the experiment. Here,
the FWHM radiating region of the plasma column was calculated, and then it should be
smaller than the actual size of plasma column. In the Helios-CR calculation, the size of
plasma column was about 520 μm (in diameter). In Fig. 5.10 and Fig 5.11, the size of
radiating region was simulated about 400 μm (in diameter) which is in reasonable
agreement with the estimation from experiment.
5.4 Analysis of Capillary Discharge Soft X-ray Laser Experiments
In this section the theoretical tools developed in the previous section are used to
analyze experimental results of amplification at 46.9 nm in Ne-like argon in the plasma
column of a compressional capillary discharge.
Fig. 5.12 (Fig. 5.13) shows the comparison of the experimental data and
simulation data from 3 mm diameter capillary, excited by a current pulse of 16 kA (19
kA) peak current having a first half cycle duration of about 50 ns. In Fig. 5.12, the
optimum intensity of this configuration occurred at 0.18 mbar of initial gas filling
pressure in the experimental observation. For initial gas filling pressures lower than 0.11
mbar, the plasma move too quickly, causing the ions to over-heat and since the Ar8+
population is not sustainable, so the intensity dropped tremendously. Conversely, at
initial gas filling pressure higher than 0.28 mbar, the plasma moves too slowly and the
ions become under-heated and Ar8+ population are not able to be produced, so the
intensity also drops tremendously.
In Fig. 5.12, on the other hand, showed the integrated intensity of the 46.9 nm
Ne-like Ar line as a function of the initial gas filling pressure for three different time
delays, i.e. 2, 6 and 12 µs at 16 kA peak current. The prepulse current was set at 16 A

104
for all the experiments. Comparison of the experimental results in Fig. 5.12 show that
the optimum gas filling pressure is affected by the choice of the prepulse time delay.
Specially, the optimum gas filling pressures increase with increasing time delay, which
is shown in Table 5.1. At high prepulse time delay the intensity-pressure curve flattens.
These shifts are due to the effect of time delays of prepulse current to the absorption of
the laser output by the plasma plume, which is ejected out of capillary, and also to the
changes in the pressure in the capillary channel during the prepulse [18]. The effects of
the time delays of prepulse current on the ion density distribution and electron
temperature were not taken into consideration in this work. The uniform distribution of
ion density and electron temperature were only taken into account in simulation regime.
Hence, the shifts of optimum initial gas filling pressures due to the effect of prepulse
were not detectable in simulation calculation. However the shape of the intensity
prediction was given a good agreement compared to the experiment of the prepulse
current’s time delay of 2 µs.
0.08 0.12 0.16 0.20 0.24 0.281
10
100
1000
10000
Inte
nsity
(a.u
.)
Pressure (mbar)
2 micro-sec delay 6 micro-sec delay 12 micro-sec delay
Experimental Data from Tan and Kwek
Simulated Data
Figure 5.12 Comparison experiment at data and the simulation in a 3 mm diameter capillary excited by
current pulse of 16 kA peak current having a first half cycle duration of about 50 ns. The full line is meant to guide the eye.

105
Table 5.1 The prepulse time delay that corresponding to optimum initial gas filling pressure.
Prepulse Time Delay (µs) 2 4 6 Optimum Initial Gas Filling Pressure (mbar) 0.18 0.20 0.22
At 19 kA peak current, however, the dependence of intensity on pressure shows a
discrepancy with respect to the experimental results, as shown in Fig. 5.13. A possible
reason for the discrepancy is that the experimental intensity output was measured from
12 µs time delay of 16 A prepulse current. Unfortunately, laser intensities for smaller
time delays were not collected in the experiment. So, in analogy with the prediction of
Fig. 5.12, we conjecture that the simulated laser intensity output may agree more closely
if compared to the experimental intensity output for reduced time delay of the 16 A
prepulse current. However, the influence of prepulse current is critical in experimental
[18] setup. Incorporation of the effects of prepulse into the MHD model is an open
problem for future study.
0.05 0.10 0.15 0.20 0.25 0.30 0.35 0.401
10
100
1000
10000
100000
Experiment Data
19.0 kA
Inte
nsity
(a.u
.)
Pressure (mbar)
Simulated Data
Figure 5.13 Comparison data of the experiment and the simulation in 3 mm in diameter capillary,
excited by current pulse of 19 kA peak current having a first half cycle duration of about 50 ns.

106
As conclusion, a ray tracing code has been developed to consider refractive
effects on photon propagation in cylindrical capillary discharge plasma where radial
electron density exists. A refracting system described by Girard [69] was chosen to
verify the code developed by the author and the preliminary results have been presented
in section 5.1.
The propagation of a ray during the maximum compression of the initial inputs
of 16 kA maximum current load with the rise time of 50 ns, 3 mm size of capillary
diameter, 20 cm of capillary length filled with 0.15 mbar Argon gas has been studied.
The refraction effects of the differences of the initial launch angles have been also
explained based on the electron density profile and gain profile. The effect of refraction
was not so critical in a high electron density profile. However, for electron densities the
rays escaped out of the plasma column due to refraction effect, causing a reduction in
the intensity of 1 or 2 orders magnitude of lower than the intensity of the rays within the
plasma column.
The cross sectional images of the capillary at different lengths of the column
were shown. Tthe numerical pinhole images have been obtained using the same imaging
set-up as in experiment [18]. Finally, the comparison data of the experiment and the
simulation in 3 mm in diameter capillary, excited by a current pulse of 16 kA and 19 kA
peak current having a first half cycle duration of about 50 ns have been performed and,
showing a reasonable agreement with experimental data.

107
Equation Chapter 1 Section 6 Chapter 6
Modelling of a Nitrogen X-ray Laser Pumped By Capillary Discharge
6.1 Introduction
In previous chapters, successfully modeled capillary discharge of Ar8+ ion gas
leading to lasing at 46.9 nm wavelength was presented. The simulation gave good
agreement with experimental results. In view of this success, we are interested to apply
the simulation to the study of the capillary discharge of hydrogen-like nitrogen ions.
This system is of interest because the 13.4 nm laser line has industrial application.
Section 6.2 discusses the ionization processes leading to the generation of the N6+ ion.
Section 6.3 investigates the prediction of Vrba [73] that lasing action leading to 13.4 nm
wavelength line can be produced for a specific configuration.
6.2 Principle of Recombination Pumping
In general, a capillary-discharge establishes a hot ionized plasma in a long
narrow cylinder. During the pinch plasma expansion, non-equilibrium under-cooled
plasma produce recombination pumping of hydrogen-like ions inside the capillary. If
the recombination pumping scheme is applied to a capillary filled with nitrogen gas, the
excited hydrogen-like nitrogen ion (N6+) will be created:
7 6N e e N e+ ++ + → + . (6.1)
From the upper level of the Balmer alpha transition n = 3 → n = 2, the required
excited state N6+ will be formed, and 13.4 nm lasing wavelength may expect to be
produced. Due to this reason, the recombination pumping needs to be efficiently excited
to the upper laser level, and yield a high concentration of fully stripped ions N7+. A high
electron density is also required.

108
The fractional abundance of charged states is evaluated using steady-state
ionization model by using the PrismSPECT [46] code. The results are shown in Fig. 6.1.
To obtain a hydrogen-like nitrogen state (N6+ or N VII) the equilibrium nitrogen plasma
must be heated to a temperature of about 80 eV. The ionization population fraction is
determined in the range 1 10000 eVeT − for a given electron number density,
18 31.0 10 cmeN −× , which has been chosen for this study. The temperature range of H-
like ionization state is approximately between 50 – 400 eV. A prevailing concentration
of fully stripped N7+ (or N VIII) ions is formed if the plasma electron temperature
exceeds 150 eV.
It should be remembered that the steady-state ionization model neglects the time
dependence. During pinch compression, the plasma is heated and gets cooled during the
pinch decay. In order to obtain fully stripped N7+ (or N VIII) ions during pinch
compression, the electron temperature should be higher than that assigned for
equilibrium plasma, in this case, >150 eV [73].
1 10 100 10000.0
0.2
0.4
0.6
0.8
1.0
Ioni
zatio
n Fr
actio
n
Electron Temperature (eV)
N VIII N VII N VI N V N IV N III N II N I
Figure 6.1 Temperature dependences of nitrogen ionization fractions evaluated according to PrismSPECT code for initial nitrogen atom density N0 = 1 × 1018 cm-3.

109
6.3 A Case Study
A critique of the work of Vrba et al. [73] has been done for the nitrogen level
dynamics. They reported that the core electron temperature was 150 eV and the electron
density was of the order of 1.5 x 1020 cm-3 by using MHD and the FLY atomic code
[74]. However, when parameter inputs similar to Vrba were used in the Helios-CR code,
no gain was detected. To investigate the veracity of the Helios-CR code an experiment
of Kampel [75] has been examined.
In the work of Kampel [75], the possibility of realizing a Hα nitrogen
recombination laser (3 → 2 transition) at wavelength of 13.4 nm was examined, using a
capillary discharge Z pinch. The experiment was conducted with 60 kA load peak
current and 70 ns rise time to generate a Z-pinch plasma in a 90-mm-long and 5-mm-
diameter capillary. An initial gas filling pressure of 0.6 Torr was applied inside the
capillary.
Fig. 6.2, 6.3 and 6.4 are the results obtained from Helios-CR simulation. Fig. 6.2
shows the time dependence of the capillary current (dashed line) and trajectories of
nitrogen plasma elements inside the capillary. In the early stages (t < 20 ns) the plasma
does not compress immediately due to the fact that the plasma pressure exceeds other
forces. However, the plasma is constrained by the rigid wall of the capillary. Both the
initial filling pressure and Joule heating are the main contributors to the pressure in the
outer zones of the plasma. Generally, the current tends to flow in the outer part of the
cylindrical plasma, and Joule heating occurs due to the current passing through the
plasma. This heating results in an increase in pressure which can be sufficiently high for
the outer regions of the plasma to initially expand before being accelerated inward by
the magnetic piston.
When the discharge current has reached a value such that the magnetic pressure
exceeds the thermal pressure (i.e., for t > 25 ns), the plasma is compressed inward

110
toward the axis. At the same time, a vacuum region starts to form near the wall and a
converging shock wave is developed at 25 ns which propagates from the wall to the
channel axis (see Fig. 6.3). The shock waves eventually meet at the axis, and are
subsequently reflected. During compression, the plasma becomes hotter due to Joule
and shock heating, and the thermal pressure increases, essentially ionizing the nitrogen.
The time of the first contraction or pinching of the plasma was about 53 ns (as shown in
Fig. 6.2).
Figure 6.2 Time dependence of the capillary current (dashed line) and trajectories of nitrogen plasma elements inside the capillary which simulated from Helios-CR code.
Before the time 70 ns, when the total current has been increasing to the
maximum value, the discharge current is high and the Lorentz force dominates. Thus,
the compression phase ceases. When the thermal pressure balances the magnetic
pressure, the plasma reaches maximum compression and then expands. During the
compression, the plasma has been finally produced to high density and temperature
plasma on the axis (as shown in Fig. 6.3). At t = 53 ns, the temperature Te reaches the
value of 95 eV and should rapidly cool down. The value of electron density Ne at the

111
pinch is about 192 10× cm-3. However, after compression the shock wave gets reflected
from the axis to the wall of plasma column. Hence it heats up again to 90 eV for
electron temperature during the second pinch at about 100 ns.
0 20 40 60 80 100 120 140 1600
20
40
60
80
100
Tem
pera
ture
(eV)
Time (ns)
ion electron
5.0x10¹⁸
1.0x10¹⁹
1.5x10¹⁹
2.0x10¹⁹
2.5x10¹⁹
Dens
ity (c
m-3)
Figure 6.3 The evolution of core temperatures and densities of ion and electron simulated from Helios-
CR code.
In any event, the results shown in Fig. 6.3 indicate that the electron temperature
and density do not fulfil the requirements as suggested as Vrba [73] (i.e. electron
temperature of 150 eV and electron density of 1020 cm-3). Hence, it is unlikely that laser
action may occur under the condition given by Vrba [73].
Quick changes of electron temperature during the plasma pinch and decay lead
to ionization and excitation non-equilibrium. Substantial changes of ionization of
nitrogen were found at different time (see Fig. 6.4). At the pinch time of 53 ns, the inner
region of the plasma has 80% of N5+, the middle region of the plasma has 80% of N6+
and outer region of the plasma has about 95% of N7+. Hence, multiple ionizations
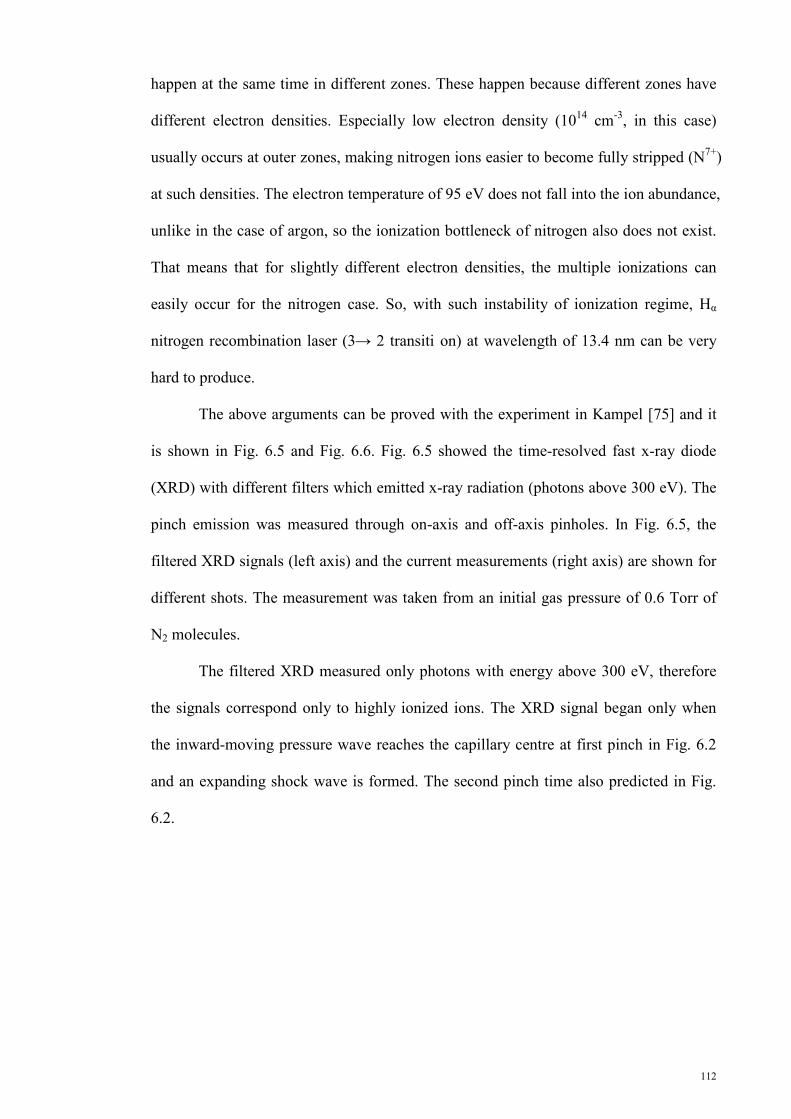
112
happen at the same time in different zones. These happen because different zones have
different electron densities. Especially low electron density (1014 cm-3, in this case)
usually occurs at outer zones, making nitrogen ions easier to become fully stripped (N7+)
at such densities. The electron temperature of 95 eV does not fall into the ion abundance,
unlike in the case of argon, so the ionization bottleneck of nitrogen also does not exist.
That means that for slightly different electron densities, the multiple ionizations can
easily occur for the nitrogen case. So, with such instability of ionization regime, Hα
nitrogen recombination laser (3 → 2 transiti on) at wavelength of 13.4 nm can be very
hard to produce.
The above arguments can be proved with the experiment in Kampel [75] and it
is shown in Fig. 6.5 and Fig. 6.6. Fig. 6.5 showed the time-resolved fast x-ray diode
(XRD) with different filters which emitted x-ray radiation (photons above 300 eV). The
pinch emission was measured through on-axis and off-axis pinholes. In Fig. 6.5, the
filtered XRD signals (left axis) and the current measurements (right axis) are shown for
different shots. The measurement was taken from an initial gas pressure of 0.6 Torr of
N2 molecules.
The filtered XRD measured only photons with energy above 300 eV, therefore
the signals correspond only to highly ionized ions. The XRD signal began only when
the inward-moving pressure wave reaches the capillary centre at first pinch in Fig. 6.2
and an expanding shock wave is formed. The second pinch time also predicted in Fig.
6.2.

113
Figure 6.4 Temporal and spatial evolution of ionization fraction of nitrogen simulated from Helios-CR code.
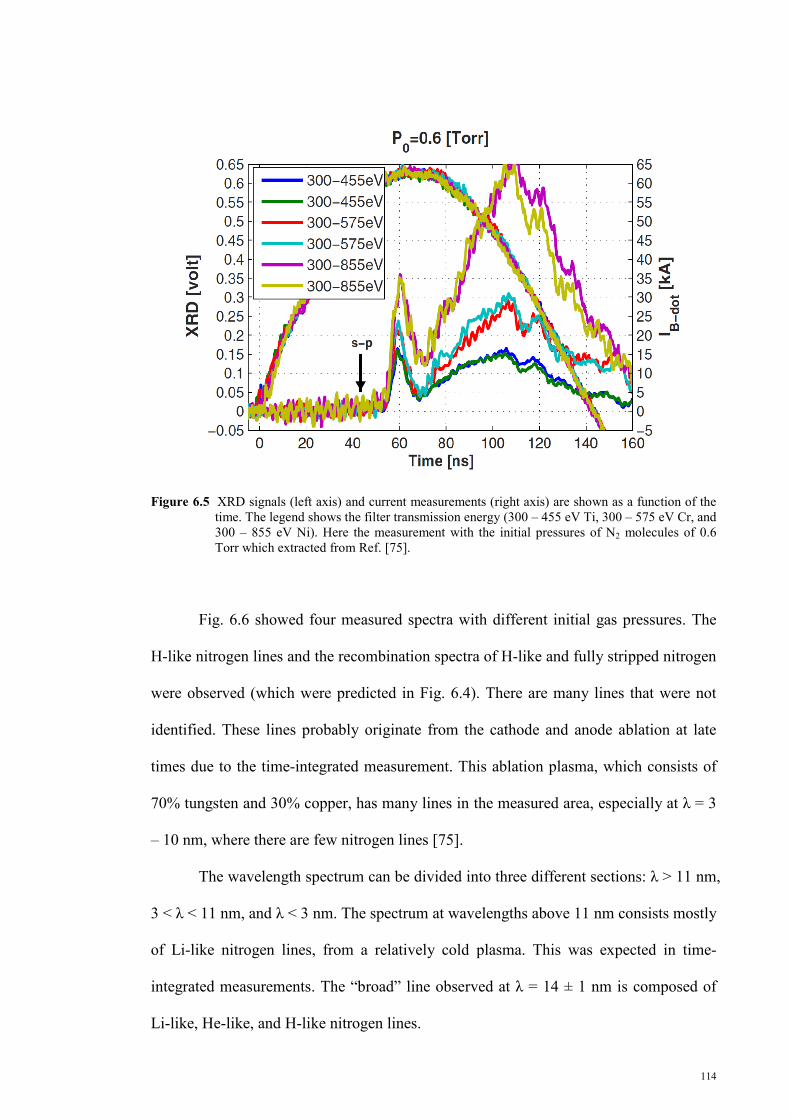
114
Figure 6.5 XRD signals (left axis) and current measurements (right axis) are shown as a function of the time. The legend shows the filter transmission energy (300 – 455 eV Ti, 300 – 575 eV Cr, and 300 – 855 eV Ni). Here the measurement with the initial pressures of N2 molecules of 0.6 Torr which extracted from Ref. [75].
Fig. 6.6 showed four measured spectra with different initial gas pressures. The
H-like nitrogen lines and the recombination spectra of H-like and fully stripped nitrogen
were observed (which were predicted in Fig. 6.4). There are many lines that were not
identified. These lines probably originate from the cathode and anode ablation at late
times due to the time-integrated measurement. This ablation plasma, which consists of
70% tungsten and 30% copper, has many lines in the measured area, especially at λ = 3
– 10 nm, where there are few nitrogen lines [75].
The wavelength spectrum can be divided into three different sections: λ > 11 nm,
3 < λ < 11 nm, and λ < 3 nm. The spectrum at wavelengths above 11 nm consists mostly
of Li-like nitrogen lines, from a relatively cold plasma. This was expected in time-
integrated measurements. The “broad” line observed at λ = 14 ± 1 nm is composed of
Li-like, He-like, and H-like nitrogen lines.
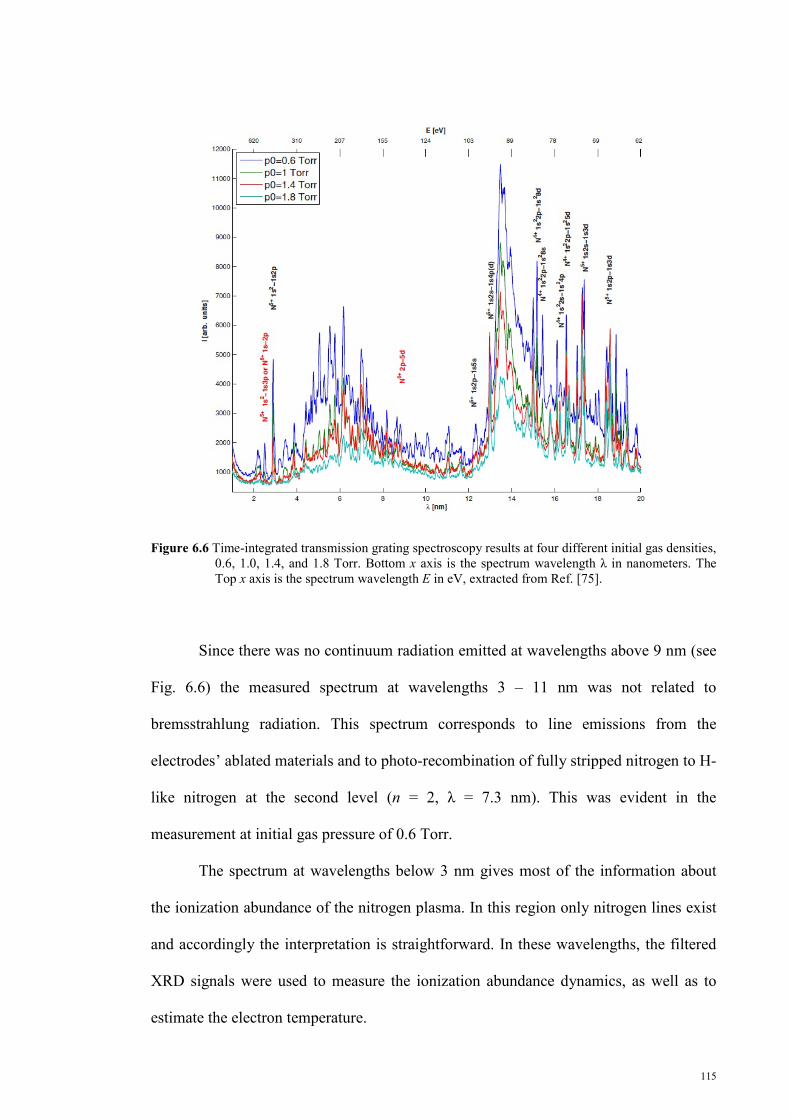
115
Figure 6.6 Time-integrated transmission grating spectroscopy results at four different initial gas densities, 0.6, 1.0, 1.4, and 1.8 Torr. Bottom x axis is the spectrum wavelength λ in nanometers. The Top x axis is the spectrum wavelength E in eV, extracted from Ref. [75].
Since there was no continuum radiation emitted at wavelengths above 9 nm (see
Fig. 6.6) the measured spectrum at wavelengths 3 – 11 nm was not related to
bremsstrahlung radiation. This spectrum corresponds to line emissions from the
electrodes’ ablated materials and to photo-recombination of fully stripped nitrogen to H-
like nitrogen at the second level (n = 2, λ = 7.3 nm). This was evident in the
measurement at initial gas pressure of 0.6 Torr.
The spectrum at wavelengths below 3 nm gives most of the information about
the ionization abundance of the nitrogen plasma. In this region only nitrogen lines exist
and accordingly the interpretation is straightforward. In these wavelengths, the filtered
XRD signals were used to measure the ionization abundance dynamics, as well as to
estimate the electron temperature.

116
Kampel [75] suggested the required plasma condition, that the pinch electron
temperature needs to reach about 140 eV and the pinch electron densitiy to be about 5 –
10 × 1020 cm-3. The demonstrated pinch electron temperature reported was less than 100
eV. This agrees with our simulation. In this work, Kampel’s suggestions were tested,
but the Hα nitrogen recombination laser (3 → 2 transition) at wavelength of 13.4 nm
was not obtainable even the required plasma condition has been achieved. The main
reason was the population inversion of 3 → 2 transition at wavelength of 13.4 nm was
not produced in PrismSPECT. So, lasing at 13.4 nm wavelength using excited
hydrogen-like nitrogen ion (N6+) by a capillary discharge was not achieved and this
contradicted Vrba’s result [73].

117
Chapter 7
Conclusion
In this work, the capillary discharge soft x-ray laser was modeled. Chapter 1
introduced the various types of short wavelength electromagnetic radiation sources
which was followed in Chapter 2 by a consideration of the concepts underlying the laser,
i.e., recombination pumping and collisional pumping. The theory of the capillary-
discharge x-ray laser was given since it provided the basis for the simulation
investigation of the type of x-ray laser considered in this thesis. In addition background
theory for the numerical modelling of a capillary-discharge soft x-ray laser was
described.
A numerical study of a capillary discharge Neon-like Argon x-ray laser was
reported in Chapter 3. Specifically, the soft x-ray laser was modeled using a one-
dimensional single-fluid magneto-hydrodynamics (MHD) model, with separate electron
and ion temperatures. The MHD equations were solved by the Lagrangian cylindrical
geometry approach. The effects of 4 input parameters (the capillary radius r0, initial
argon gas filling pressure p0, discharge current peak value Imax and its quarter period T1/4)
on the electron density and electron temperature were studied. Initially, the behaviour of
plasma dynamics for a capillary discharge (preliminary case study) with a peak current
of 16 kA, a diameter capillary of 3 mm and 0.15 mbar initial gas filling pressure have
been presented in Chapter 3. This configuration produced 70 eV electron temperature
and 183 10× cm-3 electron density at the pinch and these fulfill the required electron
profiles (i.e. the electrons have to be in the temperature range of 40 – 90 eV and with a
number density range of 1 – 40 × 1018 cm-3) in order to obtain lasing action.
Comparison of simulation results was made to the experiments of Tan and Kwek [18],
Rocca [50], Niimi [51] and Heinbuch [52] which showed good agreement with the

118
experiments. These agreements led a confident foundation to understanding the laser
system and to further optimize the laser conditions.
Hence, the effect of each input parameter in the optimization of the system has
been analyzed in Chapter 4. Due to this, the influence of the changes of peak current
from 13.5 kA to 19 kA on the choice of the initial gas filling pressures have been
studied. The simulation range of the initial gas filling pressures obtained agreed well
with the experimental results. Consequently, the effects of the current rise time and the
changes of the capillary radius were further analyzed in the study of optimization at 100
kA peak current. Combinations of the input parameters leading to optimized gain profile
were suggested for this laser system.
Subsequently, the effects of refraction on the output intensity were studied. So
the intensity output was modelled with ray tracing code in Chapter 5. In addition, the
numerical images of the plasma column at different lengths along the capillary and at
the pinhole have been obtained. The diameter of the radiating plasma and laser intensity
has been estimated which agreed well with the experimental results.
In view of the success of the modelling on neon-like argon laser system, we applied the
simulation to study the capillary discharge of hydrogen-like nitrogen in Chapter 6. The
simulated results agreed well with experimental data of Kampel [75] in contrast to the
conjecture of Vrba [73]. A simulation was performed to test Kampel’s suggestion that
lasing action at 13.4 nm wavelength should occur at 150 eV electron temperature. We
found that the Hα nitrogen recombination 13.4 nm laser line cannot be realized even
though the required plasma condition has been achieved due to insufficient inversion
population (3 → 2 transition) for the hydrogen-like nitrogen ion (N6+).

119
Appendix
A. Published Work
B. Ray-tracing Code
C. The Derivation of The Energy Balance with Thermal Diffusion for Electrons
and Ions
D. The Derivation of The Magnetic Field Transport and Diffusion Equation

120
A. Published Work
1. Teh C. P., Bernardine R. W., and Kwek K. H. (2009) Computational modelling of
A Fast Capillary Dsicharge Soft X-ray Laser. In Yahya Abu Hasan, Norhashidah
Mohd. Ali and Ahmad Izani Md. Ismail (eds) 5th Asian Mathematical Conference
Proceedings (Volume II), June 2009, pp 473 - 479. ISBN: 978-967-5417-54-2.
2. Teh C. P., Wong B. R., and Kwek K. H. (2012) Modelling of fast capillary-
discharge for soft x-ray lasers. In Luis Bilbao, Fernando Minotti and Hector Kelly
(eds) 14th Latin American Workshop on Plasma Physics (LAWPP 2011), 20-25
November 2011, Journal of Physics: Conference Series 370, pp 012036.
doi:10.1088/1742-6596/370/1/012036 (IOP Publishing).

Proceedings of the 5th Asian Mathematical Conference, Malaysia 2009
COMPUTATIONAL MODELING OFA FAST CAPILLARY DISCHARGE SOFT X-RAY LASER
1Teh Chew Peng, 2Bernardine Renaldo Wong Cheng Kiat and 1Kwek Kuan Hiang1 Department of Physics, University of Malaya, 50603 Kuala Lumpur.
2 Institute of Mathematical Sciences, University of Malaya, 50603 Kuala Lumpur.e-mail: [email protected]
Abstract. In this work we present the results of the numerical investigations of the one-dimensional single-fluidmagneto-hydrodynamics (MHD) model, with separate electron and ion temperatures, of a capillary dischargecollisional soft x-ray laser. The MHD equations are solved by the Lagrangian cylindrical geometry approach. Theeffects of the gas filling pressure and discharge current on the plasma densities and temperatures, and implosion-pinch phase for soft x-ray lasing conditions have been analyzed. The results are compared with experimentalmeasurements of the operating pressure ranges.
1 Introduction
Soft x-ray lasers are invaluable tools for studying high-density plasmas and permitting one to see smallerfeatures in microscopy, to write finer patterns in lithography and to generate shorter pulses. These lasers haveapplications for the materials science community, both inside and outside the laboratory, by supplying detailedinformation about the atomic structure of new and existing materials. These in turn lead to new scientificunderstandings, perhaps through surface science, chemistry and physics, providing feedback to the enablingtechnologies. Development of soft x-ray spectral region is presently in a rapid growth and interchange amongscience and technology.
In 1984, soft x-ray lasers were first demonstrated in plasmas generated by powerful laser drivers in largelaboratories [1, 2]. However, the large pump lasers for this kind of soft x-ray laser experiments are onlyavailable at a few large laser facilities in the world due to their large size, complexity, and extremely high cost.Therefore the demonstration of a capillary discharge soft x-ray laser operating in the transition of Ne-like ionsby Rocca et al [3] in 1994 opened the possibility to develop compact, efficient and simpler soft x-ray laser. Thissimilar demonstration had then been only repeated by Ben-kish et al [4] in 2001, followed by the work of Niimiet al [5] and Tomassetti et al [6] in the following year. The quest for improving these systems still continues byparallel efforts involving theory and computer simulations of the experiments to understand the laboratoryobservation and to optimize the resulting energy density. Even after more than a decade, systems with improvedperformance and efficiency are still being reported [7].
In this paper, the capillary discharge soft x-ray laser described by Tan and Kwek [8] is modeled using two-temperature, one dimensional single-fluid magneto-hydrodynamics (MHD) equations. The details of thegoverning equations and the computational simulation will be applied and shown. The model was thenutilized to numerically evaluate the time and radial dependences of capillary plasma characteristics of fastcapillary discharges with current rise time of around 35 ns and peak currents ranging between 9 to 19 kA in acapillary 3 mm in diameter filled with pre-ionized argon gas. The results were then compared with experimentaldata [8] from different initial argon filled pressures for a set of the discharge currents. The effects of the gasfilling pressure and discharge current on the plasma densities and temperatures, during implosion-pinch phasefor soft x-ray lasing conditions were analyzed. Optimal discharge parameters and plasma conditions have beencomputed.
2 Physical model
2.1 Magneto-hydrodynamics model
The one dimensional single-fluid MHD model is based on the method of describing the Z-pinchdischarge plasma as a hydro-magnetic fluid. The basic MHD equations used are depicted below.
The continuity equation (mass conservation) is given by
( ) 0,t
u (1)

where ρ is mass density and u is the plasma fluid velocity. Generally, in any steady state process, the rate atwhich mass enters a system is equal to the rate at which mass leaves the system. In this system, thecontinuity equation is automatically satisfied.
The momentum conservation equation is solved in the one-fluid approximation where the plasmaelectrons and ions are assumed to flow together as a single fluid. The momentum equation is governed by
e i rP P P qt
u
J B (2)
where Pe, Pi and Pr are the thermal pressures due to electrons, ions and radiation, respectively, B is themagnetic field induced by the axial current and J is the axial component of the electric current density. Here, qis the von Neumann artificial viscosity [9] which is included in the equation of motion to handle shocks.
The energy balance for electrons and ions are described by
2
, 2,
4
e ie ev e e e e Abs Emis
eq
T TT EV VC V T P R R
t V t t
B (3)
, .e ii i
v i i i ieq
T TT E V VC V T P q
t V t t t
(4)
where Cv,α, Tα, Eα, Pα and κα are, respectively, the specific heat, temperature (in eV), specific internal energy,pressure and thermal conductivity [10], of the electrons (α = e) and ions (α = i). While V is the specific volume,the second term is the joule heating term, η is defined as the plasma electrical resistivity [11], RAbs and REmis
are the radiation absorption and emission terms [12], and teq is the electron-ion collisional coupling term.The difference between the temperature diffusion equations for the electrons and ions is the absence of the
Joule heating term in the ion equation. Since the currents are mainly due to the lighter electrons, the energy istransferred to ion through the collision specified by the term involving teq.
The magnetic field transport and diffusion equation reads
.4dt
BB u B (5)
This equation is obtained using Maxwell equations and generalized Ohm’s law with the time variation of theelectric field being neglected [13].
2.2 Coupled rate equation of the plasma
The non-local thermal equilibrium (non-LTE) atomic level population density of excited levels in ion speciesis coupled by the various atomic processes occurring in the plasma. We adopted the collisional-radiative modelto obtain the population. The rate equation for atomic level i can be written as:
L LN Ni
i ij j jii j i j
dnn W n W
dt
(6)
where Wij and Wji represent the depopulating and populating rates between levels i and j, ni is the numberdensity of level i, and NL is the total number of levels in the system. For upward transitions (i < j),
(excitations)
(ionizations)e ij ij ij
ije ij ij ij
n C B JW
n
(7)
while for downward transitions (i > j),
2
(deexcitations)
(recombinations)
e ji ji ji ij
ji RR DRe ji e ji ji
n D A B JW
n n
(8)
where ne is the electron density; ijJ is the frequency-averaged mean intensity of the radiation field over a line
profile; Cij, γij, Dij, and δji are rate coefficients for collisional excitation, ionization, deexcitation, andrecombination; Aji, Bij and Bji are Einstein coefficients for spontaneous emission, and stimulated absorption and
emission; βij is the photoionization rate; Ωij is the autoionization rate; RRji is the radiative recombination rate
coefficient; and DRji is the dielectronic recombination rate coefficient [14 – 17].

3 Numerical Solution
3.1 Lagrangian grid structure
These MHD equations have been adopted in the Lagrangian reference frame [18, 19] using the specificvolume expression, that is, a frame moving with the fluid at velocity u. The geometry is cylindrical withsymmetry in the θ and z directions. The position of each cell and the velocity on cell boundary are determinedby
.dr
udt (9)
All dynamical values in the equations evolve as a function of position r from the capillary axis at a time t.Zoning can be adjusted in such a way that the initial length of a zone differs from one region to the next. Massconservation in this Lagrangian code assumes that no mass crosses between zones, so that within every zone ofthe grid
( ) .dm r rdr (10)
This also implies that element masses do not change during the simulation. Considering an element with initialboundaries roi and roi-1 and initial density ρoi, the mass is given by
2 21 .i oi oi oim r r (11)
Physically, m is the amount of mass per radian per cm in the plasma.The boundaries move in response to forces. The mass density at any time is related to the boundary positions
by
2 21
.ii
i i
m
r r
(12)
The average radius corresponds to the center-of-mass coordinate. Assuming a uniform density, the average of acylinder element is related to the boundary radii by
2 21 .
2i i
i
r rR (13)
3.2 Numerical method
Equations (1) – (5) represent a set of five nonlinear coupled partial differential equations in five unknowns.These equations can be changed to Lagrangian frame of reference by using eqn. (10). m is now an independentLagrangian variable and r becomes a dependent variable. Hence, we now write the system of equations in termsof m. The equations were solved numerically in a manner similar to the methods of Ref. 20. The schemeentailed dividing the plasma into N zones and then finite differencing the equations [21], using implicitnumerical solution to find B, Te and Ti, and an explicit solution to find u and r. Both r and u are defined at thegrid nodes (cell boundary) while B, Te and Ti are defined at the cell centres located midway between the gridnodes. Each cell or zone is split into two subzones based on the midpoint of each cell.
To initialize the calculation, various initial and boundary conditions are given to the code. These will bediscussed in next section. The code begins by dividing the plasma into N radial zones. Then the mass of eachzone, m, is determined (eqn. (11)), and the sub-zonal masses are defined as half the zonal mass. The nodal massis defined as the sum of the neighbouring sub-zonal masses. The nodal, zonal and sub-zonal masses all remainfixed throughout the calculation.
The basic steps of the procedure are first to calculate the velocity u from eqn. (2), then calculating the radiusr from (9). Equations (3) – (5) are next solved to find B, Te and Ti. Then the variables are shifted and thealgorithm repeats, calculating new values in terms of the previous ones. The time steps t are not constant butinstead are allowed to vary subject to constraints. The stability requirement for this scheme is givenapproximately by the Courant-Friedrichs-Lewy (CFL) hydrodynamics stablity condition in [21].
3.3 Boundary conditions
The boundary conditions which have been applied to the hydrodynamic equations (1) – (5) correspondto the simplest approximation of capillary discharge x-ray lasers, that is, if we let r0, the radius of thecapillary (the outer boundary) and no particle moves through the plasma-vacuum interface, we have
0 0
0,e ir r r r
T Tr r
(14)

0 0,u r (15)
and the magnetic field at the outer boundary is constrained by the Biot-Savart law:
0
0
0.2,
I tB r
r (16)
0 sin .I t I t (17)
The boundary conditions at axis are
0 0
0,e ir r
T Tr r
(18)
0 0,u (19)
and
0 0.B (20)
3.4 Initial conditions
Using the general physical model outlined in section 2, we can simulate the discharge channel with specificvalues of the controlling parameters. The parameters of a working discharge x-ray laser reported in Ref. 8 areused. Here the radius of the capillary has been fixed at 0.15 cm and current rise time is about 35 ns. For thisbasic situation, the filling pressures and the current profiles are varied to investigate the impact of thesevariations on the plasma. Initially, the pre-ionized plasma is assumed to be uniformly distributed with Te = Ti =1 eV .
For the simulations, we use the HELIOS-CR code described in Ref. 22. It is a modeling platform that canhandle LTE and non-LTE plasmas in one dimension.
4 The control parameters
The capillary is prefilled with neutral Argon to a certain initial filling pressure. In this study, the pressurerange is from 0.09 mbar to 0.45mbar. The initial ion density can be written as
6 30 ,41.1 10 (in cm )i an P N (21)
where P0 denotes the initial gas filling pressure and Na is the Avogadro’s number. In this case, the capillarychannel is prefilled with pre-ionized gas of uniform density and temperature. However, the comparison betweentheory and experiment are less straightforward. This is because the experimental parameters involved pre-pulsecurrent in which the distribution of the ion density and number of density are non-uniform.
The peak discharge currents are varied from 9 kA to 19 kA and 2π/ω = 140 ns is used. There are the typicalvalues used in the laser of Ref. 8.
5 Result and discussion
Figure 1 presents the calculated results for a capillary discharge with a peak current of 16 kA and 0.25 mbargas filling pressure. The zone boundary position of this configuration is illustrated in Fig. 1a. The dotted linerepresents the discharge current. Figure 1b shows contour plots of the logarithm of the electron densitymeasured in /cm3 while Figure 1c shows the electron temperature measured in eV. These figures also providequantitative information about the distribution of the plasma parameters inside the channel at different times.Some characteristics features are discussed below.
The dynamics of Z-pinch plasma can be described by the balance between the thermal pressure and themagnetic pressure or so called the magnetic piston as described by Eqn. (2). In the early stages (t < 18.5 ns) theplasma does not compress immediately but actually tries to expand due to the fact that the plasma pressureexceeds other forces. However, this expansion is constrained by the rigid wall of the capillary. The pressure inthe outer zones of the plasma is due to both the initial filling pressure and Joule heating. Generally, the currenttends to flow in the outer part of the cylindrical plasma, and Joule heating occurs due to current passing throughthe plasma. This heating results in an increase in pressure which can be sufficiently high for the outer regions ofthe plasma to initially to expand before being accelerated inward by the magnetic piston.
When the discharge current has reached a value such that the magnetic pressure is larger than the thermalpressure (t > 18.5 ns), the plasma is compressed inward onto the axis. At the same time, a shock wave is formedwhich propagates towards the channel axis. The shock waves eventually meet at the axis, and are subsequentlyreflected. During compression, the plasma becomes hotter due to Joule and shock heating, and the thermalpressure increases. Although, after the time 35 ns, when the total current has dropped from the maximum value,
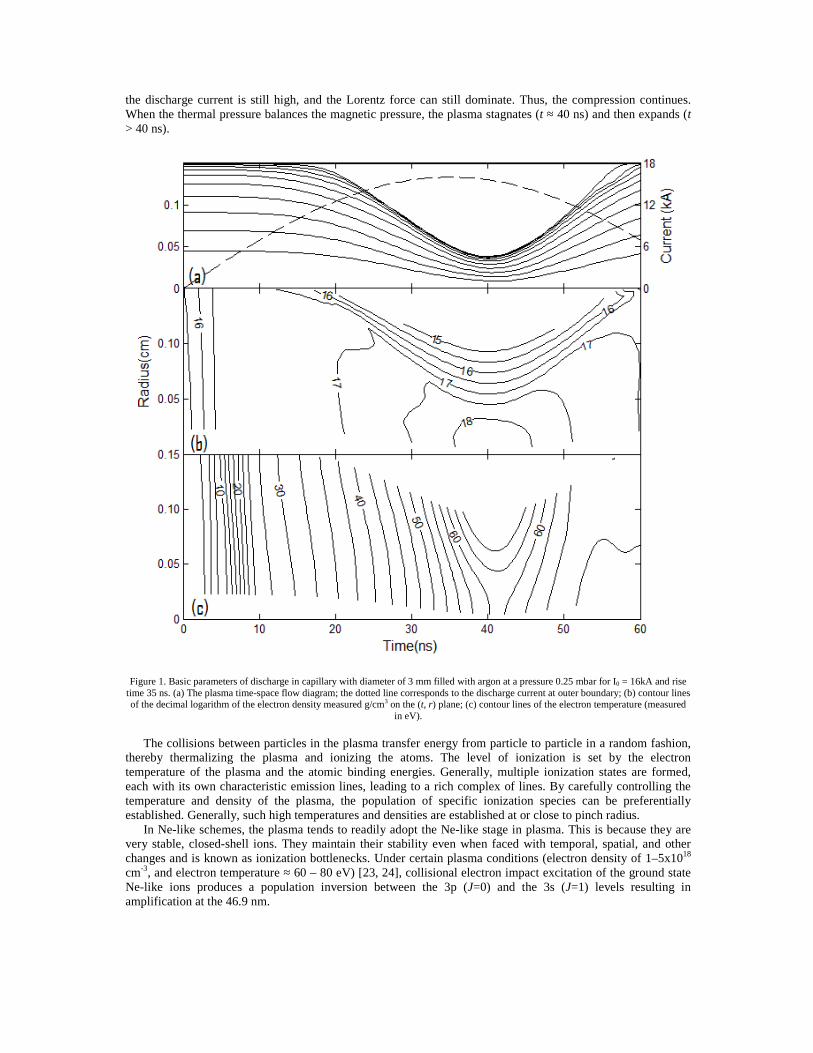
the discharge current is still high, and the Lorentz force can still dominate. Thus, the compression continues.When the thermal pressure balances the magnetic pressure, the plasma stagnates (t ≈ 40 ns) and then expands (t> 40 ns).
Figure 1. Basic parameters of discharge in capillary with diameter of 3 mm filled with argon at a pressure 0.25 mbar for I0 = 16kA and risetime 35 ns. (a) The plasma time-space flow diagram; the dotted line corresponds to the discharge current at outer boundary; (b) contour linesof the decimal logarithm of the electron density measured g/cm3 on the (t, r) plane; (c) contour lines of the electron temperature (measured
in eV).
The collisions between particles in the plasma transfer energy from particle to particle in a random fashion,thereby thermalizing the plasma and ionizing the atoms. The level of ionization is set by the electrontemperature of the plasma and the atomic binding energies. Generally, multiple ionization states are formed,each with its own characteristic emission lines, leading to a rich complex of lines. By carefully controlling thetemperature and density of the plasma, the population of specific ionization species can be preferentiallyestablished. Generally, such high temperatures and densities are established at or close to pinch radius.
In Ne-like schemes, the plasma tends to readily adopt the Ne-like stage in plasma. This is because they arevery stable, closed-shell ions. They maintain their stability even when faced with temporal, spatial, and otherchanges and is known as ionization bottlenecks. Under certain plasma conditions (electron density of 1–5x10¹⁸
cm-3, and electron temperature ≈ 60 – 80 eV) [23, 24], collisional electron impact excitation of the ground stateNe-like ions produces a population inversion between the 3p (J=0) and the 3s (J=1) levels resulting inamplification at the 46.9 nm.

5.1 Effect of Initial Filling Pressure
From the MHD simulation, the pressure range that gives the electron densities and temperatures that fulfilledthe plasma conditions for lasing is between 0.17 to 0.33 mbar. In the case of the peak current fixed at 16 kA,when the initial filling pressure is increased, the magnetic piston leaving the capillary wall is delayed and thestagnation time shifts gradually to the later times. This results in higher electron density and lower electrontemperature during pinch time in higher gas filling pressures. Initial gas filling pressures below this range werenot selected due to the plasma being overheated. On the other hand, initial gas filling pressures higher than thisrange were also not selected because the plasma temperature is too low.
These results have been compared with the experimental data from Ref. 8, as reproduced in Fig. 2, whichshow that lasing actions occur between 0.12 to 0.28 mbar. Here, the solid line is used to guide the eye. However,from our MHD simulation, we determine that the range of gas filling pressures for lasing actions fulfillingplasma condition is between 0.17 to 0.33 mbar (the range bordered by dashed lines). Experimentally, lasingaction occurs at lower pressures as compared to our simulation results. This may be due to the fact that thesimulation model does not include pre-ionization due to the application of a pre-pulse current.
0.08 0.12 0.16 0.20 0.24 0.28 0.321
10
100
1000
10000
Lase
r Int
ensit
y (a
.u.)
Pressure (mbar)
MHD Calculation
Figure 2. Comparison between experimental data and simulation data. The main discharge current is 16 kA.
5.2 Effect of Main Discharge Current
Simulations were also carried out for different peak discharge current ranging from 9 kA to 19 kA. Theinitial gas filling pressure has been fixed to 0.15 mbar and all other parameters remain the same. The resultsshow that for higher discharge current, the compression by the magnetic piston is more severe. This gives risenot only to higher electron temperature, but also higher density. Overheating of the plasma occurs so that thecondition suitable for lasing is destroyed. In order to lower down the electron temperature, higher initial gasfilling pressure needed for high discharge current in order to fulfill the plasma conditions. The comparison ofthe ranges of initial filling pressure for 10.5 kA, 16 kA and 19 kA are shown in Table 1.
Table 1. Comparison between experimental data and simulation data with different discharge peak currents.
Peak of Discharge Current, I0
(kA)Simulation Pressure Range
(mbar)Experiment Pressure Range
(mbar)10.5 0.10 – 0.15 0.09 – 0.1616.0 0.17 – 0.33 0.12 – 0.2819.0 0.23 – 0.41 0.14 – 0.37

6 Conclusion
The preliminary results from an MHD modeling of a fast capillary discharge for soft x-ray lasers have beencompared with experiment results. In order to get better agreement with respect to experimental data, the MHDshould include pre-pulse of the current.
7 Acknowledgments
This work has been supported by the Postgraduate Research Fund (PPP) Project No. PS307/2008C, theMOSTI Research grant Grant No. 04-01-03SF0202 and the Fundamental Research Grant Scheme (FRGS),Grant No. FP072/2007C.
8 References
1. D.L. Matthews, P.L. Hagelstein, M.D. Rosen, M.J. Eckart, N.M. Ceglio, A.U. Hazi, H. Medecki, B.J.MacGowan, J.E. Trebes, B.L. Whitten, E.M. Campbell, C.W. Hatcher, A.M. Hawryluk, R.L. Kauffman,L.D. Pleasance, G. Rambach, J.H. Scofield, G. Stone, and T.A. Weave, Phys. Rev. Lett. 54 110 (1985)
2. S. Suckewer, C.H. Skinner, H. Milchberg, C. Keane, and D. Voorhees, Phys. Rev. Lett. 55 175 (1985)3. J.J. Rocca, V.N. Shlyaptsev, F.G. Tomasel, O.D. Cortazar, D.Hartshorn, and J.L.A. Chilla, Phys, Rev. Lett.
73 2192 (1994)4. A. Ben-Kish, M. Shuker, R.A. Nemirovsky, A. Fisher, A. Ron and J.L. Schwob, Phys. Rev. Lett. 87 015002-
1-4 (2001)5. G. Niimi, Y. Hayashi, N. Sakamoto, M.K. Nakajima, A. Okino, M. Watanabe, K. Horioka and E. Hotta,
IEEE Trans. Plasma Sci. 30 616–21 (2002).6. G. Tomassetti, A. Ritucci, A. Reale, L. Plladino, L. Reale, A.V. Kukhlevsky, F. Flora, L. Mezi, J. Kaiser, A.
Faenov and T. Pikuz, Eur. Phys. J. D 19 73–7 (2002).7. S. Heinbuch, M. Grisham, D. Martz and J. J. Rocca, Opt. Express 13 4050–5 (2005).8. C.A. Tan and K.H. Kwek, Phy. Rev. A 75 043808 (2007).9. J. von Neumann and R.D. Richtmyer, J. Applied Phys. 21 232 (1950).10. L. Spitzer, Physics of Fully Ionized Gases, 2nd ed. (Interscience, New York, 1962).11. S.V. Dresvin, Physics and Technology of Low Temperature Plasmas (Iowa State University Press, 1977).12. J.J. MacFarlane, Comp. Phys. Comm. 56 259 (1989).13. N.H. Burnett and A.A. Offenberger, J. Appl. Phys. 45 2155 (1974).14. A.C. Kolb and R.W.P. McWhirter, Phys. Fluids 7 519 (1964)15. C. Colombant and G.F. Tonon, J. Appl. Phys. 44 3524 (1973)16. N. Nakano and H. Kuroda, Phys. Rev. A 27 2168 (1983)17. D. Mihalas and B. Weibel-Mihalas, Foundations of Radiation Hydrodynamics (Dover, New York, 1999)18. Y.B. Zel’dovich and Y.P. Raizer, Physics of Shock Waves and High-Temperature Hydrodynamics
Phenomena (Academic, New York, 1966) Vol 1.19. J.D. Jackson, Classical Electrodynamics (Wiley, New York, 1975).20. K.V. Roberts and D.E. Potter, Methods in Computational Physics, edited by B. Alder, S. Fernbach and M.
Rotenberg (Academic, New York, 1970) Vol 9.21. R.D. Richtmyer and K.W. Morton, Difference Methods for Initial Value Problems, 2nd ed. (Interscience,
New York, 1967).22. J.J. MacFarlane, I. E. Golovkin, and P. R. Woodruff, Journal of Quantitative Spectroscopy and Radiative
Transfer 99 381 (2006).23. V.N. Shlyaptsev, J.J. Rocca, and A.L. Osterheld, Proc. SPIE Int. Soc. Opt. Eng. 2520 365 (1995)24. D.E. Kim, D.S. Kim, and A.L. Osterheld, J. Appl. Phys. 84 5862 (1998)

Modeling of fast capillary-discharge for soft x-ray lasers
C P Teh1,2, B R Wong2 and K H Kwek1 1Department of Physics, University of Malaya, 50603 Kuala Lumpur, Malaysia 2Institute Mathematical Sciences, University of Malaya, 50603 Kuala Lumpur, Malaysia
E-mail: [email protected]
Abstract. In this work we present the results of the numerical investigations of the one-dimensional single-fluid magneto-hydrodynamics (MHD) model, with separate electron and ion temperatures, of a capillary-discharge collisional soft x-ray laser. The MHD equations are solved by the Lagrangian cylindrical geometry approach. The effects of the gas filling pressure on the plasma densities and temperatures, and implosion-pinch phase for soft x-ray lasing conditions have been analyzed. The results are compared with experimental measurements of the operating pressure ranges.
1. Introduction Soft x-ray lasers are invaluable tools for studying high-density plasmas and permitting one to see smaller features in microscopy, to write finer patterns in lithography and to generate shorter pulses. These lasers have applications for the materials science community, both inside and outside the laboratory, by supplying detailed information about the atomic structure of new and existing materials. These in turn lead to new scientific understandings, perhaps through surface science, chemistry and physics, providing feedback to the enabling technologies. Development of soft x-ray spectral region is presently in a rapid growth and there is much interplay between the science associated technologies.
In 1984, soft x-ray lasers were first demonstrated in plasmas generated by powerful laser drivers in large laboratories [1, 2]. However, the large pump lasers used for this kind of soft x-ray laser experiments are only available at a few large laser facilities in the world due to their large size, complexity, and extremely high cost. Therefore the demonstration of a capillary discharge soft x-ray laser operating in the transition of Neon (Ne)-like ions by Rocca et al [3] in 1994 opened the possibility to develop compact, efficient and simpler soft x-ray laser. This similar demonstration had then been only repeated by Ben-kish et al [4] in 2001, followed by the work of Niimi et al [5] and Kukhlevsky et al [6] in the following year. The quest for improving these systems still continues by parallel efforts involving theory and computer simulations of the experiments to understand the laboratory observation and to optimize the resulting energy density. Even after more than a decade, systems with improved performance and efficiency are still being reported [7].
In this paper, the capillary discharge soft x-ray laser described by Tan and Kwek [8] is modeled using two-temperature, one dimensional single-fluid magneto-hydrodynamics (MHD) equations. The details of the governing equations and the computational simulation will be applied and shown. The model was then utilized to numerically evaluate the time and radial dependences of capillary plasma characteristics of fast capillary discharges with current rise time of around 50 ns and peak currents 16 kA in a capillary 3 mm in diameter filled with pre-ionized argon (Ar) gas. The results were then
14th Latin American Workshop on Plasma Physics (LAWPP 2011) IOP PublishingJournal of Physics: Conference Series 370 (2012) 012036 doi:10.1088/1742-6596/370/1/012036
Published under licence by IOP Publishing Ltd 1

compared with experimental data [8] from different initial argon filled pressures. The effects of the gas filling pressure on the plasma densities and temperatures, during implosion-pinch phase for soft x-ray lasing conditions were analyzed.
2. Magneto-hydrodynamics model The basic MHD equations used are described below. The continuity equation (mass conservation) is given by
0
tu ,
where ρ is mass density and u is the plasma fluid velocity. Generally, in any steady state process, the rate at which mass enters a system is equal to the rate at which mass leaves the system. In this numerical scheme, the continuity equation is automatically satisfied.
The momentum conservation equation is solved in the one-fluid approximation where the plasma electrons and ions are assumed to flow together as a single fluid. The momentum equations is governed by
e i
duP P q
dt J B
,
where Pe and Pi are the thermal pressure due to electrons and ions, respectively, B denotes the magnetic field induced by the axial current and J is the axial component of the electric current density. Here, q is the von Neumann artificial viscosity. The artificial viscosity, which in included in the equation of motion to handle shocks, effectively smoothes the shock over a small number of zones.
The energy balance for electrons and ions is described by
, ,e ie ev e e e joule e
eq
T TdT dE dVC V T P
dt dV dt t
, .e ii iv i i i i
eq
T TdT dE dVC V T P
dt dV dt t
where Cv,α, Tα, Eα, Pα and κα are, respectively, the specific heat, temperature (in eV), specific internal energy, pressure and thermal conductivity, of the electrons (α = e) and ions (α = i). While V is the specific volume, ψ joule is joule heating term and teq is the electron-ion collisional coupling term.
The difference between the temperature diffusion equations for the electrons and ions is the absence of the Joule heating term in the ion equation. Since the currents are mainly due to the lighter electrons, the energy is transferred to the ions through the collision specified by the term involving teq.
The magnetic field transport and diffusion equation reads
,
4
d
dt
B
B u B
where η is defined as the plasma electrical resistivity. This equation is obtained using Maxwell equations and generalized Ohm’s law neglecting the time variation of the electric field [9].
These MHD equations have been adopted in the Lagrangian reference frame using the specific volume expression. The position of each cell and the velocity on cell boundary are determined by
.
dru
dt
All dynamical values in the equations evolve as a function of position r from the capillary axis at a time t.
14th Latin American Workshop on Plasma Physics (LAWPP 2011) IOP PublishingJournal of Physics: Conference Series 370 (2012) 012036 doi:10.1088/1742-6596/370/1/012036
2

3. The requirement characteristic of populations and gains in neon-like argon As a first estimation of absolute gain of this transition, the fractional abundance of charge states is evaluated using steady-state ionization model.
The atomic physics PrismSPECT code [10] solves the equation of state and provides radiative properties for plasma in local thermodynamic equilibrium (LTE) state. The ionization population fractions in the range Te 1 – 1000 eV for a given electron density Ne ~ 2.0 x 1018 cm-3 are depicted on the figure 1. This value has been chosen because of the value of the pinch electron density of the case study will be studied in next section. The maximum ionization population fraction of neon-like Ar8+ ion, f8+ ≈ 0.95 is accomplished at temperature Te ≈ 40 eV. The temperature range of Ne-like ionization state is approximately between 10 – 200 eV. It should be kept in mind that the steady-state ionization model does not depend on ionization dynamics, namely, ionization plasma history.
Figure 1. Argon ionization fractions dependences on plasma electron temperature for
atom density 3180 cm102 N .
Figure 2 presents a contour plot of gain against Ne and Te computed using steady-ion ionization
model. The effect of reabsorption of the resonance radiations on the distribution of population density of excited-states has been neglected (optically-thin plasma assumption). It has been assumed that Te = Ti. This assumption generally sets the upper limit of gain in capillary-discharge.
Figure 2 indicates that a large gain formed for Ne ≈ 2 x 1018 cm-3. For the regime Ne > 1020 cm-3, collisional depopulation exceeds the radiative decay rates. Hence, the populations become distributed according to the Boltzmann distribution function and the collisional quench of the population inversion occurs (i.e., unsuitable gain regime). Although, the fractional abundance of Ne-like Ar becomes a maximum at Te ≈ 40 eV using the steady-state approximation for ionization model, the optimum regime of gain is approximately at Te ≈ 60 eV, as shown in figure 2. This fact shows a mismatch between electron temperature that maximizes gain and fractional abundance of Ne-like Ar ion, in which is a general problem of Ne-like x-ray lasers [11]. The mismatch arises because the excitation energy into the n = 3 levels is typically three-quarters of the ionization energy and thus a
14th Latin American Workshop on Plasma Physics (LAWPP 2011) IOP PublishingJournal of Physics: Conference Series 370 (2012) 012036 doi:10.1088/1742-6596/370/1/012036
3

temperature which gives large ground-state excitation rates will lead to large ionization rates if the electron density is sufficient (the relaxation time for the ionization balance ~1011 1
en ) [12]. The collisions between particles in the plasma transfer energy from particle to particle in a random
fashion, thereby heating the plasma and ionizing the atoms. Generally, multiple ionization states are formed, each with its own characteristic emission lines, leading to a rich spectrum of lines. By carefully controlling the temperature and density of the plasma, the population of specific ionization species can be preferentially established. Generally, such high temperatures and densities are established at or close to pinch radius.
Figure 2. The contour of gain in 3p 1S0 – 3s 1P1 transition as function of the electron temperature and density.
Under certain plasma conditions (electron density of 0.1 – 4 x 1019 cm-3, and electron temperature ≈
40 – 90 eV, as in results from figure 2), collisional electron impact excitation of the ground state Ne-like ions produces a population inversion between the 3p (J=0) and the 3s (J=1) levels resulting in amplification at the 46.9 nm wavelength.
4. Results and discussion Using the general physical model outlined in section 2, the discharge channel can be simulated with specific values of the controlling parameters. The parameters of a working discharge x-ray laser reported in reference [8] are used. Here the radius of the capillary has been fixed at 0.15 cm, and current rise time is about 50 ns. For this basic situation, the filling pressures and the current profiles are varied to investigate the impact of these variations on the plasma. Initially, the pre-ionized plasma is assumed to be uniformly distributed with Te = Ti = 1 eV. For the simulations, we use the HELIOS-CR code described in reference [13]. It is a modeling platform that can handle LTE and non-LTE plasmas in one dimension. The peak discharge current 16 kA is used in this paper. These are the typical values used in the laser of reference [8].
Figure 3 presents the calculated results for a capillary discharge with a peak current of 16 kA and 0.15 mbar gas filling pressure. The temporal evolution of the trajectories of argon plasma elements
14th Latin American Workshop on Plasma Physics (LAWPP 2011) IOP PublishingJournal of Physics: Conference Series 370 (2012) 012036 doi:10.1088/1742-6596/370/1/012036
4

inside the channel of this configuration is illustrated in figure 3(a). The blue line represents the discharge current. Figure 3(b) shows contour plots of the logarithm of the electron density measured in cm-3 while figure 3(c) shows the electron temperature measured in eV. These figures also provide quantitative information about the distribution of the plasma parameters inside the channel at different times. Some characteristics features are discussed below.
The dynamics of a Z-pinch plasma can be described by the balance between the thermal pressure
and the magnetic pressure. In the early stages (t < 20 ns) the plasma is not compressed immediately but actually tries to expand due to the fact that the plasma pressure exceeds other forces. However, this expansion is constrained by the rigid wall of the capillary. The pressure in the outer zones of the plasma is due to both the initial filling pressure and Joule heating. Generally, the current tends to flow in the outer part of the cylindrical plasma, and Joule heating occurs due to current passing through the plasma. This heating results in an increase in pressure which can be sufficiently high for the outer regions of the plasma to initially expand before being accelerated inward by the magnetic piston.
When the discharge current has reached a value such that the magnetic pressure is larger than the thermal pressure (t > 20 ns), the plasma is compressed inward onto the axis. At the same time, a
Figure 3. Basic parameters of discharge in capillary with diameter of 3 mm filled with argon at a initial gas filling pressure of 0.15 mbar for I0 = 16 kA and rise time 50 ns. (a) The plasma time-space flow diagram; blue line corresponds to the discharge current at outer boundary; (b) contour lines of the decimal logarithm of the electron density (measured cm-3) on the (t, r) plane; (c) contour lines of the electron temperature (measured in eV).
14th Latin American Workshop on Plasma Physics (LAWPP 2011) IOP PublishingJournal of Physics: Conference Series 370 (2012) 012036 doi:10.1088/1742-6596/370/1/012036
5

vacuum region appears near the wall and a converging shock wave is formed which propagates towards the channel axis. The shock waves eventually meet at the axis, and are subsequently reflected. During compression, the plasma becomes hotter due to Joule and shock heating, and the thermal pressure increases. Although, before the time 50 ns, when the total current has been increasing towards the maximum value, the discharge current is high, and the Lorentz force dominates. Thus, the compression stops. When the thermal pressure balances the magnetic pressure, the plasma stagnates (t ≈ 43.5 ns) and then expands (t > 43.5 ns). During the compression, a high density and temperature plasma on the axis is produced, as shown in figure 3(b) and 3(c). The temperature Te reaches the value of 70 eV and continues to heat up to 160 eV during the expansion phase. This is because the inner zones of plasma continue to compress again after the first pinch. The value of electron density Ne at the pinch is about 3 x 1018 cm-3. A hot plasma core with the radial dimension rcore = 0.266 mm and central mass density ρcore = 1.22 x 10⁻⁴ g/cm3
is formed. At the stage of expansion the MHD instabilities may break the uniformity of the plasma column,
leading to turbulent mixing, enhanced heat transport and resistance. However, from the theory of the classical pinch effect, MHD instabilities begin to evolve when the expansion velocity begins to decrease [14]. If the lasing occurs during the few first nanoseconds after the reflection of the shock wave, MHD instabilities have no time to evolve. The validity of this description of the plasma behavior in the capillary discharge ends at the moment when the diverging shock wave reaches the capillary wall.
The time dependence of small signal gain factor G is determined by the time dependences of both laser level populations 1
8
3p 3S
n and 0
8
3s 3P
n . In this case above (a non-ablating alumina capillary with
radius r0 = 1.5 mm filled with initial gas filling pressure of 0.15 mbar, current pulse with T1/4 = 50 ns and current peak value Imax = 16 kA) the gain factor has a shape of very short peak with maximum value G(tG) = 0.8 cm-1 at the time tG = 44.5 ns (see figure 4). The peak value of gain is achieved during the pinch time.
5. Comparison with experiments The simulations of the capillary discharge dynamics for r0 = 1.5 mm, T1/4 = 50 ns, Imax = 16 kA and various initial gas filling pressure p0 of argon have been performed here. For given capillary radius r0 and current waveform, the peak value of gain factor GG t may be expressed as a function of the
Figure 4. The spatial and temporal evolution of gain
14th Latin American Workshop on Plasma Physics (LAWPP 2011) IOP PublishingJournal of Physics: Conference Series 370 (2012) 012036 doi:10.1088/1742-6596/370/1/012036
6

initial gas filling pressure (see figure 5). The gain curve shows that the measurable gain factor for r0 = 1.5 mm, T1/4 = 50 ns, Imax = 16 kA is found in the pressure range 0.11 mbar < p0 < 0.29 mbar.
Figure 5. Dependence of gain factor peak value on the initial gas filling pressures.
Figure 6. Comparison between experimental data and simulation data. The main discharge current is 16 kA.
From the MHD simulation, the electron densities and temperatures that fulfilled the plasma
conditions and high gain factors obtained are in between 0.11 to 0.29 mbar. These results have been further computed which included refraction effect due to electron density gradient. The simulation output of the intensity are compared with the experimental data [8] shown in figure 6. The dotted lines
14th Latin American Workshop on Plasma Physics (LAWPP 2011) IOP PublishingJournal of Physics: Conference Series 370 (2012) 012036 doi:10.1088/1742-6596/370/1/012036
7

are the range of gas filling pressures that are computed by MHD simulation. The soft x-ray lasers (experimental data) have been produced in the range of 0.12 to 0.28 mbar (the solid line) which show good agreement if compare to simulation data.
6. Conclusions The results from an MHD modeling of a fast capillary-discharge for soft x-ray lasers have been compared with experiment results. The effects of the gas filling pressure on the plasma densities and temperatures, and implosion-pinch phase for soft x-ray lasing conditions resulting in high gain factors have been analyzed. Our findings indicate that the simulations performed gave reasonably good agreement with experiment.
Acknowledgements This work has been supported in part by the Postgraduate Research Fund (PPP) Project No. PS330/2009C and in part by University of Malaya Grant RG031/09AFR.
References [1] Matthews D L et al. 1985 Demonstration of a soft x-ray amplifier Phys. Rev. Lett. 54 110 [2] Suckewer S, Skinner C H, Milchberg H, Keane C and Voorhees D 1985 Amplification of
stimulated soft x-ray emission in a confined plasma column Phys. Rev. Lett. 55 1753 [3] Rocca J J, Shlyaptsev V, Tomasel F G, Cortázar O D, Hartshorn D and Chilla J L A 1994
Demonstration of a Discharge Pumped Table-Top Soft-X-Ray Laser Phys. Rev. Lett. 73 2192 [4] Ben-Kish A, Shuker M, Nemirovsky R A, Fisher A, Ron A and Schwob J L 2001 Plasma
Dynamics in Capillary Discharge Soft X-Ray Lasers Phys. Rev. Lett. 87 015002 [5] Niimi G, Sakamoto N, Nakajima M, Hayashi Y, Watanabe M, Okino A, Horioka K and Hotta E
2002 Study of low current capillary discharge for compact Soft x-ray laser. AIP Conf. Proc.: AIP) pp 103-6
[6] Kukhlevsky S V, Ritucci A, Kozma I Z, Kaiser J, Shlyaptseva A, Tomassetti G and Samek O 2002 Atomic Model Calculations of Gain Saturation in the 46.9 nm Line of Ne-like Ar Contrib. Plasm. Phys. 42 109-18
[7] Heinbuch S, Grisham M, Martz D and Rocca J J 2005 Demonstration of a desk-top size high repetition rate soft x-ray laser Opt. Express 13 4050
[8] Tan C A and Kwek K H 2007 Influence of current prepulse on capillary-discharge extreme-ultraviolet laser Phys. Rev. A 75 043808
[9] Burnett N H and Offenberger A A 1974 Magnetohydrodynamic behavior of a laser-heated solenoid J. Appl. Phys. 45 2155-62
[10] MacFarlane J J, Golovkin I E, Woodruff P R, Welch D R, Oliver B V, Mehlhorn T A and Campbell R B 2003 Inertial Fusion Sciences and Applications (American Nuclear Society)
[11] Holden P B and Pert G J 1996 Long-wavelength, prepulsed driving as a means to greatly increase the gain in low-Z Ne-like XUV lasers J. Phys. B: At. Mol.Phys. 29 2151
[12] Whitten B L, London R A and Walling R S 1988 Scaling of neonlike lasers using exploding foil targets J. Opt. Soc. Am. B 5 2537-47
[13] MacFarlane J J, Golovkin I E and Woodruff P R 2006 HELIOS-CR - A 1-D radiation-magnetohydrodynamics code with inline atomic kinetics modeling J. Quant. Spectrosc. Radiat. Trans. 99 381-97
[14] Vrba P, Vrbová M, Bobrova N and Sasorov P 2005 Modelling of a nitrogen x-ray laser pumped by capillary discharge Cent. Eur. J. Phys. 3 564-80
14th Latin American Workshop on Plasma Physics (LAWPP 2011) IOP PublishingJournal of Physics: Conference Series 370 (2012) 012036 doi:10.1088/1742-6596/370/1/012036
8

136
B. Ray- Tracing Code
clear; tic; f = fopen('data/data16kA_019mbar.txt'); fid6 = fopen('z20_111207.txt','w'); data = fscanf(f, '%13e\t%13e\t%13e\t%13e',[4,11]); radius = data(1,:); gain = data(2,:); Nu = data(3,:); Ne = data(4,:); h = 2e-3;%rough one, suppose 1e-5 zc = 20.0;% in cm am = 0.15; %in cm len = zc/h; xstart = -radius(11); xend = radius(11); xih = (xend - xstart)/1000; ystart = -radius(11); yend = radius(11); yih = (yend - ystart)/1000; yi = zeros(1001,1); for i = 251:500 xi = xstart +(i-1)*xih; ii = i for j = 1:1001 yi(j) = ystart +(j-1)*yih; if(yi>0.0) if(xi>0.0) di(j) = tan(yi(j)/xi); end if(xi==0.0) di(j) = pi/2.0; end if (xi<0.0) di(j)=pi+tan(yi(j)/xi); end else if(xi>0.0) di(j) = 2*pi + tan(yi(j)/xi); end if(xi==0.0) di(j) = 3.0*pi/2.0; end if(xi<0.0) di(j) = pi + tan(yi(j)/xi); end end end

137
matlabpool open; [r0, z6,x116,v116,x226,v226,iten16,Gs16] = ... parrk_111207(len,zc,xi,yi,di,h,am,radius,gain,Nu, Ne); matlabpool close; for ijk = 1:1001 fprintf(fid6,'%12.5e\t%12.5e\t%12.5e\t%12.5e\t%12.5e\t%12.5e\t%12.5e\t\r\n',... r0(ijk), x116(ijk),v116(ijk),x226(ijk),v226(ijk),iten16(ijk),Gs16(ijk)); end end fclose(fid6); toc; function [r0,z6,x116,v116,x226,v226,iten16,Gs16] = ... parrk_111207(len,zc,xi,yi,dij,h,am,radius,gain,Nu, Ne) parfor j =1:1001 ri = sqrt(xi*xi+yi(j)*yi(j)); di = dij(j); k= randi([1 101]); ddi = -((am+ri)/zc)+(k-1)*1.5e-4; rip = tan(ddi); [r0(j),z6(j),x116(j),v116(j),x226(j),v226(j),iten16(j),Gs16(j)] = ... rk4ode_111207(@func1,@func2,len,0,zc,ri,rip,di,ddi,h,am,radius,gain,Nu, Ne); end end function [r0,z6,x116,v116,x226,v226,iten16,Gs16]... = rk4ode_111207(f1, f2, l,a, b, x10, xd10, x20, xd20, h, am, r,gain,Nu,Ne) % Solution of 2nd order ODE using Runge-Kutta 4th order % with constant step size. ODE solved is converted to % two 1st order equations. The RHS of the system is % dv1/dt = f1(t, x, v) % dx1/dt = v1 % See for example rhs_smd.m for forced spring-mass-damper % % USAGE: [t, x, v] = rk4ode2(func,a,b,x0,xd0,h) % % input func = name of external function to evaluate the RHS % of the ODE (eg 'rhs_smd') % a, b = limits of integration % x0 = initial condition (position) % xd0 = initial condition (velocity) % h = stepsize % % output [t, x, v] = solution vectors

138
t0 = a; v10 = xd10; v20 = xd20; r0 = x10; i = 1; g = fp(r, gain, abs(x10)); j_const = 1.9766866e-9; I_sat = 6.8e7; %in unit of W/cm^2 Gs=g; Nui = fp(r, Nu, abs(x10)); if (x10==0.0) x10=1e-10; end Jp = j_const * Nui * x10*x10/(h*h); iten0 = (Jp/g)*(exp(g*h)-1); while t0 < b k1x1 = v10; k1v1 = feval(f1, t0 , x10 , v10 , r ,Ne); k2x1 = v10+k1v1*h/2; k2v1 = feval(f1, t0+h/2, x10+k1x1*h/2 , v10+k1v1*h/2,r,Ne ); k3x1 = v10+k2v1*h/2; k3v1 = feval(f1, t0+h/2, x10+k2x1*h/2 , v10+k2v1*h/2,r,Ne ); k4x1 = v10+k3v1*h; k4v1 = feval(f1, t0+h , x10+k3x1*h , v10+k3v1*h,r,Ne ); i = i+1; t1 = t0 + h; x11 = x10 + (k1x1 + 2*k2x1 + 2*k3x1 + k4x1)*h/6; if (x11>=am) x11 = am; end if (x11<=0) x11 = 0.0; end Gi = fp(r, gain, abs(x11)); Gs = Gi/(1+(iten0/I_sat)); if(t0==0.0) t0=h; end iten1 = sqrt(t0/t1)*iten0*exp(Gs*h); v11 = v10 + (k1v1 + 2*k2v1 + 2*k3v1 + k4v1)*h/6; k1x2 = v20; k1v2 = feval(f2, t0 , x20 , v20 , x11, v11); k2x2 = v20+k1v2*h/2; k2v2 = feval(f2, t0+h/2, x20+k1x2*h/2 , v20+k1v2*h/2, x11, v11); k3x2 = v20+k2v2*h/2; k3v2 = feval(f2, t0+h/2, x20+k2x2*h/2 , v20+k2v2*h/2, x11, v11);

139
k4x2 = v20+k3v2*h; k4v2 = feval(f2, t0+h , x20+k3x2*h , v20+k3v2*h , x11, v11); x21 = x20 + (k1x2 + 2*k2x2 + 2*k3x2 + k4x2)*h/6; v21 = v20 + (k1v2 + 2*k2v2 + 2*k3v2 + k4v2)*h/6; t0 = t1; x10 = x11; v10 = v11; x20 = x21; v20 = v21; iten0 = iten1; end z6=t0; x116=x10; v116=v10; x226=x20; v226=v20; iten16=iten0; Gs16=Gs; end function [N] = fp(r_in, N_in, r) nn = length(r_in); if(r<=r_in(1)) m1 = (N_in(2)-N_in(1))/(r_in(2)-r_in(1)); N = (m1*r)-(m1*r_in(1))+N_in(1); end if(r>=r_in(nn)) m = (1e-10-N_in(nn))/(0.15-r_in(nn)); N = (m*r)-(m*r_in(nn))+N_in(nn); end if((r>=r_in(1))&&(r<=r_in(nn))) for i = 1:nn-1 if(r>=r_in(i)) ii = i; end end m = (N_in(ii+1)-N_in(ii))/(r_in(ii+1)-r_in(ii)); N = (m*r)-(m*r_in(ii))+N_in(ii); end end

140
C. The Derivation of The Energy Balance with Thermal Diffusion for Electrons
and Ions
The conservation of electron and ion energy,
( ) ( ) ( ) ,e ie e ee e e Abs Emis
e eq
T Te E eV T V PV R Rt t T t
κ η−∂ ∂ ∂
= ∇ ⋅ ∇ + ⋅ − − ∇ ⋅ − + −∂ ∂ ∂
J J u
(C.1)
( ) ( ) ,e ii i ii i i
i eq
T Te E eV T PVt t T t
κ−∂ ∂ ∂
= ∇ ⋅ ∇ − − ∇ ⋅ +∂ ∂ ∂
u
(C.2)
and equations of state ( ),e iα =
( )
,1
RTe αα γ=
− (C.3)
,p V RTα α= (C.4)
where eα is internal energy and temperature (in eV) of the electrons ( eα = ) and ions
( iα = ) and R is the gas constant. In Eq. (C.1) and Eq. (C.2), the term of V∇⋅u
can be
replaced by Vt
∂∂
from the conversation of mass. Using (C.3) to expand ee t∂ ∂ gives
, .1
e e e e ev e
e
e e T R T TCt T t t tγ
∂ ∂ ∂ ∂ ∂= = =
∂ ∂ ∂ − ∂ ∂ (C.5)
Additional, J has been defined in Eq. (D.2). So the Eq. (C.1) yield
( )( )
( )
( )
2, 2
,
4
.
e ev e e e e
e iv e Abs Emis
eq
T V E VC V T Pt V t
T TC R R
t
ηκπ
∂ ∂ ∂ = ∇ ⋅ ∇ + ∇× − + ∂ ∂ ∂
−− + −
B
(C.6)
A similar equation results for ion temperature Ti,
( ) ( ), , .e ii i
v i i i i v ieq
T TT E V VC V T P C qt V t t t
κ−∂ ∂ ∂ ∂ = ∇ ⋅ ∇ − + + − ∂ ∂ ∂ ∂
(C.7)

141
D. The Derivation of The Magnetic Field Transport and Diffusion Equation
From Ohm’s Law
,η = + ×J E u B (D.1)
Maxwell’s equations,
2
14 ,c t
π ∂∇× = +
∂EB J
(D.2)
;t
∂∇× = −
∂BE
(D.3)
The assumption has been made that the wave velocity u is much less than c, so that the
displacement current in Eq. (D.2) can be neglected. Eq. (D.1) can be expanded to
( ) ( ) ( ) .η ∇× = ∇× + ∇× × J E u B
(D.4)
Substitute Eq. (D.2) and Eq. (D.3) into Eq. (D.4),
( )( ) ( ) .4 tηπ
∂ ∇× ∇× = − + ∇× × ∂BB u B
(D.5)
Using vector calculus identities, Eq. (D.5) can be expanded to
( ) ( ) ( ) ( ) ( ) ( ) ,4 tηπ
∂ ∇ ∇ − ∇ ∇ = − + ∇ + ∇ − ∇ + ∇ ∂BB B B B u u u B
(D.7)
In the cylindrical geometry, B θ=B e , zJ=J e , zE=E e , and ru=u e , and so we obtain
the magnetic field diffusion equation as reads, [76]
( ) ( ) .4dtηπ
∂= ∇ ⋅∇ − ∇⋅
B B u B (D.8)

142
References
1. D. L. Matthews, P. L. Hagelstein, M. D. Rosen, M. J. Eckart, N. M. Ceglio, A. U. Hazi, H. Medecki, B. J. MacGowan, J. E. Trebes, B. L. Whitten, E. M. Campbell, C. W. Hatcher, A. M. Hawryluk, R. L. Kauffman, L. D. Pleasance, G. Rambach, J. H. Scofield, G. Stone, and T. A. Weaver, "Demonstration of a Soft X-Ray Amplifier," Phys. Rev. Lett. 54, 110 (1985).
2. H. I. Smith, and F. Cerrina, "X-ray Lithography for ULSI Manufacturing," Microlithography World Winter 10 (1997).
3. D. Attwood, Soft X-Rays and Extreme Ultraviolet Radiation: Principles and Applications (Cambridge University Press Cambridge, 1999).
4. C. G. Wahlström, J. Larsson, A. Persson, T. Starczewski, S. Svanberg, P. Salières, P. Balcou, and A. L'Huillier, "High-order harmonic generation in rare gases with an intense short-pulse laser," Phys. Rev. A 48, 4709 (1993).
5. J. J. Macklin, J. D. Kmetec, and C. L. Gordon, "High-order harmonic generation using intense femtosecond pulses," Phys. Rev. Lett. 70, 766 (1993).
6. C. G. Durfee, S. Backus, M. M. Murnane, and H. C. Kapteyn, "Ultrabroadband phase-matched optical parametric generation in the ultraviolet by use of guided waves," Opt. Lett. 22, 1565-1567 (1997).
7. R. Dendy, Plasma Physics: An Introductory Course (Cambridge University Press, 1993).
8. J. M. Bridges, C. L. Cromer, and T. J. McLlrath, "Investigation of a laser-produced plasma VUV light source," Appl. Opt. 25, 2208-2214 (1986).
9. N. M. Ceglio, "Revolution in X-ray optics," J. X-ray Sci. Technol. 1, 7-78 (1989).
10. M. A. Klosner, H. A. Bender, W. T. Silfvast, and J. J. Rocca, "Intense plasma discharge source at 13.5 nm for extreme-ultraviolet lithography," Opt. Lett. 22, 34-36 (1997).
11. J. J. Rocca, V. Shlyaptsev, F. G. Tomasel, O. D. Cortázar, D. Hartshorn, and J. L. A. Chilla, "Demonstration of a Discharge Pumped Table-Top Soft-X-Ray Laser," Phys. Rev. Lett. 73, 2192 (1994).
12. J. Goodberlet, S. Basu, M. H. Muendel, S. Kaushik, T. Savas, M. Fleury, and P. L. Hagelstein, "Observation of gain in a recombining H-like boron plasma," J. Opt. Soc. Am. B 12, 980-986 (1995).
13. M. A. Klosner, and W. T. Silfvast, Opt. Lett. 23, 1609 (1998).
14. Martin C Richardson, Andrew F. Vasil'ev, Steve E. Grantham, Kai Gabel, and Masataka Kado, "Development of x-ray microscopy systems based on laser plasma sources," in Applications of Laser Plasma Radiation, M. C. Richardson, ed. (SPIE Proc., 1994), p. 97.
15. R. C. Elton, X-Ray Lasers (Academic, 1990).

143
16. J. J. Rocca, "X-ray Laser: 1996," in IOP Conf. Ser., S. Svanberg, and C.-G. Wahlstrom, eds. (IOP, Bristol, 1996), p. 176.
17. J. J. MacFarlane, I. E. Golovkin, and P. R. Woodruff, "HELIOS-CR - A 1-D radiation-magnetohydrodynamics code with inline atomic kinetics modeling," J. Quant. Spectrosc. Radiat. Trans. 99, 381-397 (2006).
18. C. A. Tan, and K. H. Kwek, "Influence of current prepulse on capillary-discharge extreme-ultraviolet laser," Phys. Rev. A 75, 043808 (2007).
19. W. T. Silfvast, Laser Fundamentals (Cambridge University Press, 1996).
20. R. W. P. McWhirter, and A. G. Hearn, "A Calculation of the Instantaneous Population Densities of the Excited Levels of Hydrogen-like Ions in a Plasma," Proc. Phys. Soc. 82, 641 (1963).
21. S. Suckewer, and P. Jaeglé, "X-Ray laser: past, present, and future," Laser Phys. Lett. 6, 411 (2009).
22. M. J. Seaton, "Radiative recombination of hydrogenic ions," Mon. Not. R. Astron. Soc. 119, 81 (1959).
23. M. J. Seaton, "The Impact Parameter Method for Electron Excitation of Optically Allowed Atomic Transitions," Proc. Phys. Soc. 79, 1105 (1962).
24. N. H. Burnett, and P. B. Corkum, "Cold-plasma production for recombination extremeultraviolet lasers by optical-field-induced ionization," J. Opt. Soc. Am. B 6, 1195-1199 (1989).
25. Y. Nagata, K. Midorikawa, S. Kubodera, M. Obara, H. Tashiro, and K. Toyoda, "Soft-x-ray amplification of the Lyman- alpha transition by optical-field-induced ionization," Phys. Rev. Lett. 71, 3774 (1993).
26. P. Bogen, H. Conrads, G. Gatti, and W. Kohlhaas, "Continuum Radiation Source of High Intensity," J. Opt. Soc. Am. 58, 203-206 (1968).
27. J. J. Rocca, O. D. Cortázar, F. G. Tomasel, and B. T. Szapiro, "Efficient generation of highly ionized calcium and titanium plasma columns for collisionally excited soft-x-ray lasers in a fast capillary discharge," Phys. Rev. E 48, R2378 (1993).
28. J. J. Rocca, O. D. Cortazar, B. Szapiro, K. Floyd, and F. G. Tomasel, "Fast-discharge Excitation of Hot Capillary Plasmas for Soft-x-ray Amplifiers " Phys. Rev. E 47, 1299 (1993).
29. J. von Neumann, and R. D. Richtmyer, "A Method for the Numerical Calculation of Hydrodynamic Shocks," in J. Appl. Phys.(AIP, 1950), pp. 232-237.
30. L. Spitzer, Physics of fully ionized gases (Interscience Publishers, New York, 1962).
31. S. V. Dresvin, and A. V. Donskoĭ, Physics and technology of low-temperature plasmas (Iowa State University Press, Ames, 1977).

144
32. J. J. Macfarlane, "IONMIX - a code for computing the equation of state and radiative properties of LTE and non-LTE plasmas," Comput. Phys. Commun. 56, 259-278 (1989).
33. N. H. Burnett, and A. A. Offenberger, "Magnetohydrodynamic behavior of a laser-heated solenoid," J. Appl. Phys. 45, 2155-2162 (1974).
34. A. C. Kolb, and R. W. P. McWhirter, "Ionization Rates and Power Loss from theta-Pinches by Impurity Radiation," Phys. Fluids 7, 519-531 (1964).
35. D. Colombant, and G. F. Tonon, "X-ray emission in laser-produced plasmas," J. Appl. Phys. 44, 3524-3537 (1973).
36. N. Nakano, and H. Kuroda, "X-ray generation from laser-produced plasmas and its atomic-number dependence," Phys. Rev. A 27, 2168 (1983).
37. D. Mihalas, and B. Weibel-Mihalas, Foundations of radiation hydrodynamics (Oxford University Press, New York, 1984).
38. I. A. B. Zel'dovich, W. D. Hayes, R. F. Probstein, and I. U. P. Raizer, Physics of shock waves and high-temperature hydrodynamic phenomena (Academic Press, New York, 1966).
39. J. D. Jackson, Classical electrodynamics (Wiley, New York, 1975).
40. D. L. Chapin, J. J. Duderstadt, and D. R. Bach, "Numerical studies of exploding-wire plasmas," J. Appl. Phys. 45, 1726 (1974).
41. S. Humphries, and C. Ekdahl, "Finite-element simulation code for high-power magnetohydrodynamics," Laser Part. Beams 16, 405-430 (1998).
42. B. J. Alder, S. Fernbach, and M. Rotenberg, Methods in computational physics : advances in research and applications. Vol.9, Plasma physics (Academic Press, New York ; London, 1970).
43. R. D. Richtmyer, and K. W. Morton, Difference methods for initial-value problems (Interscience Publishers, New York, 1967).
44. "NIST: Atomic Spectra Database Levels Form," (National Institute of Standards and Technology).
45. M. Masnavi, M. Nakajima, and K. Horioka, "Effect of nonequilibrium ionization process on gain of neon-like argon x-ray laser " J. Appl. Phys. 95, 434 (2004).
46. J. J. MacFarlane, I. E. Golovkin, P. R. Woodruff, D. R. Welch, B. V. Oliver, T. A. Mehlhorn, and R. B. Campbell, Inertial Fusion Sciences and Applications (American Nuclear Society, 2003 ).
47. P. B. Holden, and G. J. Pert, "Long-wavelength, prepulsed driving as a means to greatly increase the gain in low-Z Ne-like XUV lasers," J. Phys. B: At. Mol.Phys. 29, 2151 (1996).
48. B. L. Whitten, R. A. London, and R. S. Walling, "Scaling of neonlike lasers using exploding foil targets," J. Opt. Soc. Am. B 5, 2537-2547 (1988).

145
49. N. A. Bobrova, S. V. Bulanov, D. Farina, R. Pozzoli, T. L. Razinkova, J. I. Sakai, P. V. Sasorov, and I. V. Sokolov, "MHD simulations of plasma dynamics in pinch discharges in capillary plasmas," Laser and Particle Beams 18, 623-638 (2000).
50. J. J. Rocca, F. G. Tomasel, M. C. Marconi, V. N. Shlyaptsev, J. L. A. Chilla, B. T. Szapiro, and G. Guidice, "Discharge-pumped soft-x-ray laser in neon-like argon," Phys. Plasmas 2, 2547 (1995).
51. G. Niimi, Y. Hayashi, N. Sakamoto, M. Nakajima, A. Okino, M. Watanabe, K. Horioka, and E. Hotta, "Development and characterization of a low current capillary discharge for X-ray laser studies," IEEE T Plasma Sci 30, 616-621 (2002).
52. S. Heinbuch, M. Grisham, D. Martz, and J. J. Rocca, "Demonstration of a desk-top size high repetition rate soft x-ray laser," Opt. Express 13, 4050 (2005).
53. R. A. Nemirovsky, A. Ben-Kish, M. Shuker, and A. Ron, "Effect of Neutral Atoms on a Capillary-Discharge Z Pinch," Phys. Rev. Lett. 82, 3436 (1999).
54. R. A. Nemirovsky, A. Ben-Kish, M. Shuker, and A. Ron, "Erratum: Effect of Neutral Atoms on a Capillary-Discharge Z Pinch [Phys. Rev. Lett. 82, 3436 (1999)]," Phys. Rev. Lett. 83, 660 (1999).
55. M. Masnavi, M. Nakajima, and K. Horioka, "Numerical Study on Gain Coefficient of a Capillary-Discharged Neon-Like Argon X-Ray Laser," IEEJ Trans. FM 126, 250 (2006).
56. V. N. Shlyaptsev, A. V. Gerusov, A. V. Vinogradov, J. J. Rocca, O. D. Cortazar, F. Tomasel, and B. Szapiro, "Modeling of fast capillary discharge for collisionally excited soft X-ray lasers; comparison with experiments," in Ultrashort Wavelength Lasers II(Proc. SPIE, 1993), p. 99.
57. J. J. Gonzalez, M. Frati, J. J. Rocca, V. N. Shlyaptsev, and A. L. Osterheld, "High-power-density capillary discharge plasma columns for shorter wavelength discharge-pumped soft-x-ray lasers," Phys. Rev. E 65, 026404 (2002).
58. V. N. Shlyaptsev, J. J. G. Rocca, and A. L. Osterheld, "Dynamics of a Capillary Discharge X-ray Laser " in Soft X-Ray Lasers and Applications, J. J. G. Rocca, and P. L. Hagelstein, eds. (Proc. SPIE, San Diego, CA, USA, 1995), p. 365.
59. M. C. Marconi, C. H. Moreno, J. J. Rocca, V. N. Shlyaptsev, and A. L. Osterheld, "Dynamics of a microcapillary discharge plasma using a soft x-ray laser backlighter," Phys. Rev. E 62, 7209 (2000).
60. C. Moreno, and et al., "Two-dimensional near-field and far-field imaging of a Ne-like Ar capillary discharge table-top soft-x-ray laser," Phys. Rev. A 58, 1509 (1998).
61. B. H. P. Broks, W. Dijk, and J. J. A. M. v. d. Mullen, "Parameter study of a pulsed capillary discharge waveguide," J. Phys. D: Appl. Phys. 39, 2377 (2006).

146
62. N. A. Bobrova, S. V. Bulanov, D. Farina, R. Pozzoli, T. L. Razinkova, and P. V. Sasorov, "Magnetohydrodynamic simulation of capillary plasmas," Plasma Phys. Rep. 24, 1 (1998).
63. T. P. Hughes, Plasmas and Laser Light (Wiley, New York, 1975).
64. R. A. London, "Beam optics of exploding foil plasma x-ray lasers," Phys. Fluids 31, 184-192 (1988).
65. E. E. Fill, "Ray trajectories in line-focused laser plasmas," J. Opt. Soc. Am. B 14, 1505-1510 (1997).
66. J. J. Rocca, M. C. Marconi, J. L. A. Chilla, D. P. Clark, F. G. Tomasel, and V. N. Shlyaptsev, "Discharge-driven 46.9-nm amplifier with gain-length approaching saturation," Selected Topics in Quantum Electronics, IEEE Journal of 1, 945-948 (1995).
67. J. L. A. Chilla, and J. J. Rocca, "Beam optics of gain-guided soft-x-ray lasers in cylindrical plasmas," J. Opt. Soc. Am. B 13, 2841-2851 (1996).
68. M. Born, and E. Wolf, Principles of Optics: Electromagnetic Theory of Propagation, Interference and Diffraction of Light (Cambridge University Press, 1997).
69. F. Girard, J. G. Lunney, J. Larour, and R. Dussart, "Interpretation of capillary discharge EUV pinhole images using a ray-tracing code," J. Phys. D: Appl. Phys. 35, 1164 (2002).
70. D. Benredjem, J. Kuba, C. Möller, and O. Z. Zabaydullin, "Modeling of saturation and refraction in x-ray lasers," Phys. Rev. A 67, 043816 (2003).
71. A. Sureau, and P. B. Holden, "From amplification of spontaneous emission to saturation in x-ray lasers: A Maxwell-Bloch treatment," Phys. Rev. A 52, 3110 (1995).
72. G. J. Pert, "Output characteristics of amplified-stimulated-emission lasers," J. Opt. Soc. Am. B 11, 1425-1435 (1994).
73. P. Vrba, M. Vrbová, N. Bobrova, and P. Sasorov, "Modelling of a nitrogen x-ray laser pumped by capillary discharge," Cent. Eur. J. Phys. 3, 564-580 (2005).
74. N. A. Bobrova, S. V. Bulanov, T. L. Razinkova, and P. V. Sasorov, "Dynamics of a pinch discharge in capillarics," Plasma Phys. Rep. 22, 349 (1996).
75. N. S. Kampel, A. Rikanati, I. Be'ery, A. Ben-Kish, A. Fisher, and A. Ron, "Feasibility of a nitrogen-recombination soft-x-ray laser using capillary discharge Z pinch," Phys. Rev. E 78, 056404 (2008).
76. A. Ben-Kish, M. Shuker, R. A. Nemirovsky, A. Fisher, A. Ron, and J. L. Schwob, "Plasma Dynamics in Capillary Discharge Soft X-Ray Lasers," Phys. Rev. Lett. 87, 015002 (2001).


