Modelling environmental and climate ambition in the ...
93
Modelling environmental and climate ambition in the agricultural sector with the CAPRI model Exploring the potential effects of selected Farm to Fork and Biodiversity strategies targets in the framework of the 2030 Climate targets and the post 2020 Common Agricultural Policy Jesus Barreiro-Hurle, Mariia Bogonos, Mihaly Himics, Jordan Hristov, Ignacio Pérez- Domínguez, Amar Sahoo, Guna Salputra, Franz Weiss, Edoardo Baldoni, Christian Elleby 2021 EUR 30317 EN
Transcript of Modelling environmental and climate ambition in the ...
Modelling environmental and climate ambition in the agricultural sector with the CAPRI model
Exploring the potential effects of selected Farm to Fork and
Biodiversity strategies targets in
the framework of the 2030 Climate targets and the post 2020
Common Agricultural Policy
Jesus Barreiro-Hurle, Mariia Bogonos, Mihaly Himics, Jordan Hristov, Ignacio Pérez-Domínguez, Amar Sahoo, Guna Salputra, Franz Weiss, Edoardo Baldoni, Christian Elleby
2021
EUR 30317 EN
This publication is a Technical report by the Joint Research Centre (JRC), the European Commission’s science and knowledge service. It
aims to provide evidence-based scientific support to the European policymaking process. The scientific output expressed does not imply a policy position of the European Commission. Neither the European Commission nor any person acting on behalf of the Commission is responsible for the use that might be made of this publication. For information on the methodology and quality underlying the data used
in this publication for which the source is neither Eurostat nor other Commission services, users should contact the referenced source. The designations employed and the presentation of material on the maps do not imply the expression of any opinion whatsoever on the part of the European Union concerning the legal status of any country, territory, city or area or of its authorities, or concerning the delimitation
of its frontiers or boundaries. Contact information
Name: Jesus Barreiro-Hurle Address: Edificio Expo, c/Inca Garcilaso 3, 41092 Seville (Spain) Email: [email protected]
Tel.: +34 954 488318 EU Science Hub
https://ec.europa.eu/jrc JRC121368
EUR 30317 EN
PDF ISBN 978-92-76-20889-1 ISSN 1831-9424 doi:10.2760/98160
Luxembourg: Publications Office of the European Union, 2021
© European Union 2021
The reuse policy of the European Commission is implemented by the Commission Decision 2011/833/EU of 12 December 2011 on the
reuse of Commission documents (OJ L 330, 14.12.2011, p. 39). Except otherwise noted, the reuse of this document is authorised under the Creative Commons Attribution 4.0 International (CC BY 4.0) licence (https://creativecommons.org/licenses/by/4.0/). This means that reuse is allowed provided appropriate credit is given and any changes are indicated. For any use or reproduction of photos or other
material that is not owned by the EU, permission must be sought directly from the copyright holders. All content © European Union 2021, unless otherwise specified.
How to cite this report: Barreiro-Hurle, J., Bogonos, M., Himics, M., Hristov, J., Pérez-Domiguez, I., Sahoo, A., Salputra, G., Weiss, F., Baldoni, E., Elleby, C. Modelling environmental and climate ambition in the agricultural sector with the CAPRI model. Exploring the potential effects
of selected Farm to Fork and Biodiversity strategies targets in the framework of the 2030 Climate targets and the post 2020 Common Agricultural Policy, EUR 30317 EN, Publications Office of the European Union, Luxembourg, 2021, ISBN 978-92-76-20889-1, doi:10.2760/98160, JRC121368.
i
Contents
Acknowledgements .......................................................................................................................................................................................................................................... 3
Foreword ..................................................................................................................................................................................................................................................................... 4
Abstract ....................................................................................................................................................................................................................................................................... 5
1 Introduction..................................................................................................................................................................................................................................................... 8
2 Reinforcing environmental and climate targets in EU policy for the agricultural sector .................................................. 12
2.1 The CAP post-2020 legal proposals ....................................................................................................................................................................... 12
2.2 Farm to Fork and Biodiversity Strategies .......................................................................................................................................................... 15
2.3 Moving towards a climate neutral Europe: the 2030 Climate law ........................................................................................... 18
3 The CAPRI modelling system ...................................................................................................................................................................................................... 20
3.1 Overview of the model ........................................................................................................................................................................................................ 20
3.2 Setting targets ............................................................................................................................................................................................................................ 22
3.3 Modelling subsidies for technologies .................................................................................................................................................................... 24
4 Scenario construction ......................................................................................................................................................................................................................... 27
4.1 The CAP 2014-2020 baseline ...................................................................................................................................................................................... 27
4.2 A CAP legal proposal with enhanced environmental and climate ambition .................................................................... 28
4.2.1 Budget ............................................................................................................................................................................................................................... 28
4.2.2 New green architecture .................................................................................................................................................................................... 28
4.2.3 Other elements ......................................................................................................................................................................................................... 32
4.3 Farm to Fork and Biodiversity Strategies .......................................................................................................................................................... 32
4.3.1 Reduction of pesticide use ............................................................................................................................................................................ 33
4.3.2 Increase in land under organic farming ........................................................................................................................................... 34
4.3.3 Increase of area under high-diversity landscape features ............................................................................................ 36
4.3.4 Reduction in gross nitrogen surplus ..................................................................................................................................................... 37
4.3.5 Modifications needed to the assumptions when implementing the four targets simultaneously 38
5 Results .............................................................................................................................................................................................................................................................. 40
5.1 The combined effects of the F2F and BDS strategies’ targets without changing the CAP............................... 40
5.1.1 Economic impacts .................................................................................................................................................................................................. 40
5.1.2 Environmental impacts ..................................................................................................................................................................................... 45
5.1.3 Sensitivity analysis for price and trade reactions ................................................................................................................... 50
5.2 The combined effects of the F2F and BDS strategies targets with a CAP reflecting an ambitious implementation of the legal proposal ............................................................................................................................................................................... 52
5.2.1 Economic impacts .................................................................................................................................................................................................. 53
5.2.2 Environmental impacts ..................................................................................................................................................................................... 55
5.2.3 Sensitivity analyses for price reactions ............................................................................................................................................ 60
6 Limitations and proposed improvements ....................................................................................................................................................................... 63
7 Conclusions .................................................................................................................................................................................................................................................. 65
References ............................................................................................................................................................................................................................................................. 71
ii
List of abbreviations and definitions ........................................................................................................................................................................................... 76
List of figures ..................................................................................................................................................................................................................................................... 77
List of tables ........................................................................................................................................................................................................................................................ 78
Annexes .................................................................................................................................................................................................................................................................... 80
3
Acknowledgements
As providers of independent scientific evidence for EU Policies the JRC faces, amongst many others, the challenge of translating policy into parameters. Sometimes we tend to forget that policy aspirations and legal texts use a totally different language than that of agro-economic models. The exercise summarized in this report could not have been possible without this initial translation effort. DG AGRI colleagues including Florence Buchholzer, Nicola di Virgilio, Andrea Furlan, Jean-Marc Trarieux and Ben van Doorslaer were instrumental for this to happen. We would like to acknowledge the willingness to participate in the process, their openness to understand the model limitations and their pro-active approach to find compromises between the policy debate and the model capacities. We would also like to acknowledge Director Tassos Haniotis first for his initiative to use the CAPRI model to inform these strategic policy initiatives and his insights on the preliminary results. Some, if not all, of the sensitivity analysis undertaken to understand the responsiveness of markets to the policy shocks comes from his curiosity and understanding of the market fundamentals. Colleagues from DG SANTE and ENV also provided valuable feedback in particular with regards to highlighting the limitations of the analysis.
. We hope that the limitations are clearly spelled out throughout the document and reiterate here that our results are certainly not a formal impact assessment of the initiatives, rather an illustration of what can be done with our current level of knowledge and modelling tools, highlighting the long way ahead. We have to work together to better understand how the new policy ambitions of the Commission can be included in the models currently used for this. We thank colleagues in DG CLIMA for the opportunity to contribute to the impact assessment supporting the Commission proposal for revised reduction targets of GHG by 2030. Last, but not least, we also thank Giampiero Genovese, Head of the Economics of Agriculture Unit at the JRC (JRC.D.4) for his continuing support to the realization of this report.
Authors
Jesus Barreiro-Hurle, Mariia Bogonos, Mihaly Himics, Jordan Hristov, Ignacio Pérez-Domínguez, Amar Sahoo, Gunsa Salputra, Edoardo Baldoni and Christian Elleby – European Commission, Joint Research Centre (JRC), Seville, Spain;
Franz Weiss - European Commission, Joint Research Centre (JRC), Ispra, Italy;

4
Foreword
The Joint Research Centre, as the scientific arm of the EC has the role of providing scientific support throughout all the policy cycle. In this role, the JRC has been providing support using agro-economic models to the analysis of the Common Agricultural Policy for over two decades. This support has included generating mid-term projections for agricultural markets and analysing impacts of reforms to the Common Agriculture Policy (CAP).
With the introduction of the Green Deal and in particular the Farm to Fork and Biodiversity Strategies, the EC has accelerated the ongoing transition towards sustainable food systems adding complexity to the analysis of the impact and trade-offs of policies, including the CAP. In this context of more complex policy analysis, models remain a powerful tool to assess policy impacts on all three pillars of sustainability, provided that they are integrated and developed in order to capture as much as possible all the aspects related to the environmental, social and economic dimensions.
The research described in this report provides an example of how some of the targets put forward in those strategies can be included in the analysis of the CAP using the existing tools, in particular the CAPRI model. The report focuses on the four most salient targets included in the strategies that affect agricultural production and explores how to translate them into model features by way of scenario analysis. By running these scenarios, it provides some insights on the potential impacts the targets could have on the agricultural sector. In addition, it evaluates the potential of aligning the CAP Legal Proposal (LP) to these targets and shows the improvements in greenhouse gas emissions, ammonia emissions and gross nutrient surplus that could be achieved.
The results provided are contingent and bounded by assumptions and model capacities; as any other ex-ante analysis based on economic modelling they cannot nor should be taken as the precise quantitative impact that would be realized should the targets be reached. Rather, I see this report as providing two important types of messages to both the JRC and policy makers and stakeholders.
To the JRC, it highlights areas where we need to focus our efforts as scientists in order to effectively capture the complexity of the strategies in our modelling. For instance, we need to better incorporate into modelling the impacts related to pesticides use, large-scale transformation to organic farming, together with other farming practices and environmental friendly technologies that can accompany the transition. We also need to incorporate targets put forward in the strategies that are not included in this analysis such as initiatives to improve the position of farmers in the supply chain, the reduction of food waste and changing diets which are integral parts of the transition to a sustainable food system. Last, we need to be able to quantify the benefits the transition will bring to the environment and society at large, as the transition is much broader than the four evaluated targets.
To the policy makers and stakeholders, it identifies topics where the transition will pose challenges in terms of impacts to the agricultural sector. These topics will need special attention when making the transition to sustainable food system happen.
I am convinced that modelling will continue to be a key input in the policy cycle but for this to happen, a smart implementation of the adequate tools and the constructive collaboration of policy makers working to design the future EU Food Systems is needed. This approach and dialogue among the different policy makers has already started. From my side, I can only assure that the JRC, as the support science service, will continue to improve our capacity to analyse alternatives with its state of the art agro-economic modelling capacities, facilitating the dialogue with our partners and finding ways forward to overcome current limitations.
Giovanni De Santi – JRC.D Director “Sustainable resources”

5
Abstract
During the last 30 years, the Common Agricultural Policy has increased the importance given to improving the environmental and climate performance of the European agriculture, as confirmed by the Future CAP proposal. Furthermore, the Green Deal strategy outlined a comprehensive approach to facilitate the transition towards sustainable food systems that links in a holistic approach all actors in the system, a path sketched out in the Farm to Fork (F2F) and Biodiversity (BDS) Strategies. Reflecting this ambition, this report was a contribution to the 2030 Climate Target Plan impact assessment, based on one of the main models used by the European Commission for agricultural policy analysis (the CAPRI model), which can incorporate some of the policies put forward for accelerating the transition towards sustainable food systems.
The report presents a modelled scenario of an ambitious implementation of the CAP reform proposals to measure the effects on EU agriculture including four quantitative targets put forward in the F2F and BDS strategies already reflected in the recommendations of the Commission to the Member States on their CAP Strategic Plans. These targets were selected as the ones with the greatest potential to affect agricultural environment and production. Moreover, those are the targets to which the CAP can provide specific contribution.
The analysis includes a reduction of the risk and use of pesticides, a reduction of nutrient surplus, an increase of area under organic farming, and an increase of area for high-diversity landscape features. The impacts are modelled under three scenarios. One is a status quo scenario assuming no change in the CAP compared to its implementation during 2014-2020. The other two scenarios include a potential implementation of the CAP post 2020 legal proposal targeting these objectives, both with and without the targeted use of Next Generation EU funding.
However, the report does not constitute an impact assessment of the strategies as such; the modelling scope does not include all of the strategies’ measures (e.g. food waste reduction targets, dietary shifts, organic action plan) which would alter the impacts reported. Not all policies that affect the transition are captured by this model. Other analytical approaches and tools are necessary to arrive at a more complete picture of the potential impacts of this transition. As these two strategies propose a comprehensive approach to move towards sustainable food systems, their inclusion requires additional assumptions to capture positive synergies between the different initiatives and additional tools to cover the limitations of the modelling approach used. Therefore, impacts should be considered representing an upper bound of the full impact of the strategies as they are partial in scope (mainly covering the supply side) and incomplete (as the required future changes in consumer behaviour are not captured in the model).
Based on the assumptions made and taking into account the limitations of the analysis, modelling results indicate that reaching these four targets under the current CAP implementation achieves significant
environmental benefits in the form of reductions in greenhouse gases and ammonia emissions as well as in gross nutrient surplus, though the extent in terms of positive environmental and economic benefits is not fully quantified. Results also show a decline in EU production and variations in prices and income for selected agricultural products, albeit in different degrees. This impact can be lowered by approximately one-fifth when a CAP implementation in line with the 2018 Legal Proposal and targeted to accelerate the transition to
a more sustainable agriculture is assumed. The new CAP implementation also increases the positive performance of the agricultural sector in environmental terms. In both scenarios, the impacts on international markets are limited.
In both scenarios, the potential to further reduce these impacts is underestimated by the fact that not all initiatives, measures and resulting synergies covered by the strategies are considered. For example, reductions in production associated with shift to organic agriculture could be mitigated with the implementation of the organic action plan. Lower livestock production could have less impact on prices and trade when accompanied by a shift towards more plant based diets and the reduction of food waste. The positive impact could also be enhanced via accelerated technological development and efficiency improvements likely to occur by 2030.
Moreover, the exercise assumes that the EU acts alone. Because of this assumption, a significant part of the gains in terms of emissions in the EU is leaked to other world regions. However, as part of international climate agreements also non-EU countries have commitments to reduce GHG emissions, incorporating this to the analysis would reduce the leakage and negative impacts for the EU. Last, the report does not provide information on all the benefits derived from those targets for both the agricultural sector and the wider society, as these are not captured in the model. As such, the analysis presented is not intended to be used as the sole basis for decision-making and it would not be in any case appropriate for this purpose.
6
The lessons learned from this report are important from a policy perspective. The agricultural sector
will have to go through a challenging transition and this study – with all its limitations – shows the magnitude of the challenge. The report shows that, when it comes to the supply side, the Future CAP legal proposals provide opportunities for implementing the production-related targets of the Green Deal. By comparing the impact of four F2F and BDS strategies’ targets under an unchanged CAP and a CAP reflecting the ambitious implementation of its reform proposals the report identifies the potential impacts of the Future CAP
proposal with respect to selected environmental indicators, production, income, prices and trade.
However, the report also points towards areas where such a transition faces bigger challenges, for which we need effective instruments to support the sector during the transition. Some of these instruments are alreadt the focus of other complementary policy initiatives. Furthermore, it allows the identification of gaps where additional steps would be needed so that Green Deal targets are met and the transition towards sustainable food systems accelerated. Finally, the results confirm the need for global solutions to the global challenge of climate change.
The report also highlights that the current modelling tools need improvements to help us prepare future impact assessments. Significant gaps exist in capturing in agro-economic models how the demand side of the food chain would respond to the required changes in demand and the supply side.
Even when the analysis reported focuses on the supply side and captures most of its nuances in a satisfactory manner, some improvements are needed. For example, additional developments are needed to capture the positive feedback in yields resulting from the enhanced ecosystem services provided by improved biodiversity. In addition, while some technologies are captured in the model there are additional measures that could be introduced to further reduce the environmental impact of production; thus minimizing the trade-off between meeting targets and production impacts.
In addition, the assumptions about the impacts on farm management and yields of the reduction in pesticide use and the increase in organic farming do not capture potential beneficial side effects beyond the agricultural sector (e.g. health benefits). These limitations are partly driven by the lack of comprehensive farm-level data, which results in the assessment of the relationship between farming activity and the environment in an aggregated regional level. The Commission’s proposal to move from a farm accountancy data network (FADN) to a farm sustainability data network (FSDN) will be instrumental in addressing these limitations as it would allow the better understanding of which practices work best, and within which regional and sector environment.
As far as the demand side is concerned, this analysis does not incorporate the ambition related to food waste reduction, the move towards different diets or the demand side promotion of organic and sustainably produced food. Such changes would require the development of other modelling approaches incorporating assumptions on future consumer behavioural changes that cannot be captured with analyses of past consumer behaviour. In this area, data availability is an issue whose resolution would require the cooperation of the retail and processing industry.
In addition, one also has to consider the magnitude of the scenario shocks (i.e. distance from baseline values to aspirational targets). Models are calibrated to a common vision of the future and their predictive performance may be decreased in extreme cases. When dealing with systemic changes, other research tools such as foresight and propective can be used in a complementary manner to inform some of the parameters that could reflect novel practices and busness models that could be developed by farmers to adapt to the new sustainable food systems paradigm
As part of its commitment to provide better scientific evidence for policy making, the JRC is working to improve knowledge on the effects (including potential co-benefits) of the measures implemented, develop the model to improve the representation of pesticides and organic farming, and explore avenues to incorporate the impact of food waste reductions and changes in diets. As for the latter, improvements on environmental and human health expected from the accelerated shift towards sustainable food systems need to be quantified using other tools. In addition, a comprehensive assessment should also incorporate a full food systems approach incorporating other phases of the food value chain and changes in consumer preferences and behaviour.
The upcoming proposal for a legislative framework for sustainable food systems will require a comprehensive impact assessment. This impact assessment will have to be able to evaluate the ambition laid down for an enhanced environmental, climate and health performance of the EU’s agricultural sector as part of the broader food system. While agro-economic models will be an integral part of the tools for such an evaluation, the present exercise has identified areas where additional efforts are needed, especially in the need to

7
capture the environment not only as a restriction for agricultural production but also as an input. The current modelling approach focuses on the trade-offs between environmental protection and agricultural production based on past experience, failing to capture the positive synergies that a better environment brings associated.
These limitations are not specific to the CAPRI model. Other analyses that have looked into the impacts of some of the initiatives put forward in the strategies using other models (Beckman et al. 2020; Guyomard et al. 2020) also faced them. Ongoing research and analysis can shed light on more positive synergies associated with a better environmental footprint, thus improving the capacity of the model to capture the targets and using additional methods to estimate the benefits.
8
1 Introduction
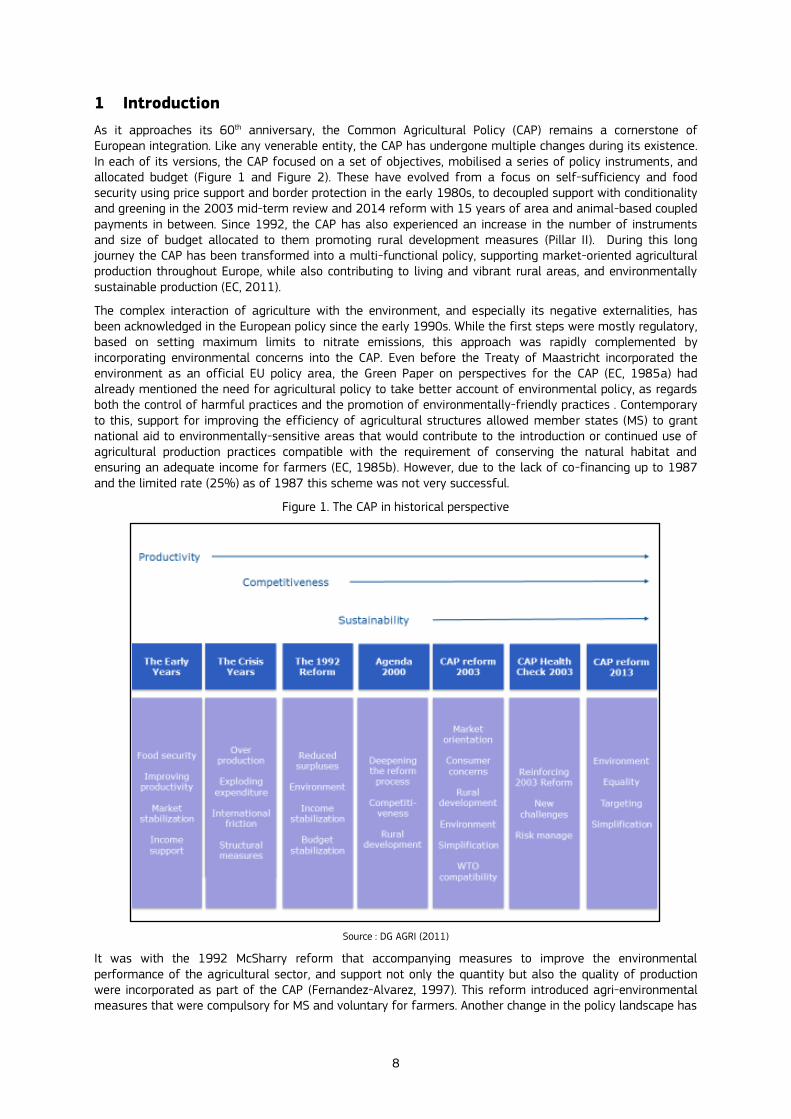
As it approaches its 60th anniversary, the Common Agricultural Policy (CAP) remains a cornerstone of European integration. Like any venerable entity, the CAP has undergone multiple changes during its existence. In each of its versions, the CAP focused on a set of objectives, mobilised a series of policy instruments, and allocated budget (Figure 1 and Figure 2). These have evolved from a focus on self-sufficiency and food security using price support and border protection in the early 1980s, to decoupled support with conditionality and greening in the 2003 mid-term review and 2014 reform with 15 years of area and animal-based coupled payments in between. Since 1992, the CAP has also experienced an increase in the number of instruments and size of budget allocated to them promoting rural development measures (Pillar II). During this long journey the CAP has been transformed into a multi-functional policy, supporting market-oriented agricultural production throughout Europe, while also contributing to living and vibrant rural areas, and environmentally sustainable production (EC, 2011).
The complex interaction of agriculture with the environment, and especially its negative externalities, has been acknowledged in the European policy since the early 1990s. While the first steps were mostly regulatory, based on setting maximum limits to nitrate emissions, this approach was rapidly complemented by incorporating environmental concerns into the CAP. Even before the Treaty of Maastricht incorporated the environment as an official EU policy area, the Green Paper on perspectives for the CAP (EC, 1985a) had already mentioned the need for agricultural policy to take better account of environmental policy, as regards both the control of harmful practices and the promotion of environmentally-friendly practices . Contemporary to this, support for improving the efficiency of agricultural structures allowed member states (MS) to grant national aid to environmentally-sensitive areas that would contribute to the introduction or continued use of agricultural production practices compatible with the requirement of conserving the natural habitat and ensuring an adequate income for farmers (EC, 1985b). However, due to the lack of co-financing up to 1987 and the limited rate (25%) as of 1987 this scheme was not very successful.
Figure 1. The CAP in historical perspective
Source : DG AGRI (2011)
It was with the 1992 McSharry reform that accompanying measures to improve the environmental performance of the agricultural sector, and support not only the quantity but also the quality of production were incorporated as part of the CAP (Fernandez-Alvarez, 1997). This reform introduced agri-environmental measures that were compulsory for MS and voluntary for farmers. Another change in the policy landscape has
9
been the increased attention being shown to the agricultural sector by other initiatives. As part of cross-compliance applied to direct payments, the CAP had already included requirements from other pieces of legislation into its design since the Agenda 2000, and successive reforms of the policy have strengthened its environmental dimension.
Despite efforts made over the years aimed at reducing the environmental footprint of EU agriculture, and the measurable impact on some input use and emissions that accompanied past CAP reforms, progress stagnated in recent years and results were lagging behind EU ambitions, or even legislative requirements. This was recognised in the Impact Assessment accompanying the legal proposals for the CAP post-2020, and the subsequent legal proposal put its emphasis on improving the environmental and climate performance of the CAP. Under the Green Deal, the Commission has put forward additional initiatives which propose specific targets for the agricultural sector through its Farm to Fork and Biodiversity Strategies (see section 2 for details). Understanding the potential impact of these targets on the agricultural sector becomes a pressing issue. As a first step to measure this potential impact and provide evidence to policy makers the adequacy of existing tools to represent the targets has to be assessed, and potential developments to improve their adequacy identified.
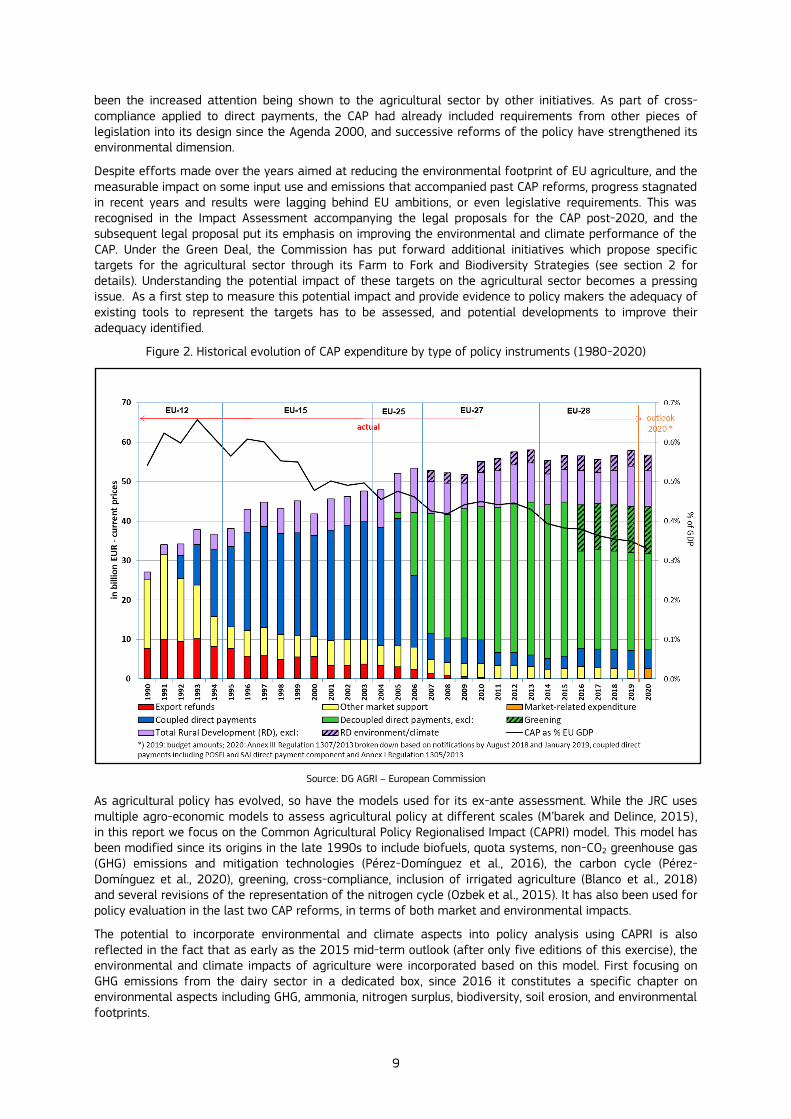
Figure 2. Historical evolution of CAP expenditure by type of policy instruments (1980-2020)
Source: DG AGRI – European Commission
As agricultural policy has evolved, so have the models used for its ex-ante assessment. While the JRC uses multiple agro-economic models to assess agricultural policy at different scales (M’barek and Delince, 2015) , in this report we focus on the Common Agricultural Policy Regionalised Impact (CAPRI) model. This model has been modified since its origins in the late 1990s to include biofuels, quota systems, non-CO2 greenhouse gas (GHG) emissions and mitigation technologies (Pérez-Domínguez et al., 2016), the carbon cycle (Pérez-Domínguez et al., 2020), greening, cross-compliance, inclusion of irrigated agriculture (Blanco et al., 2018) and several revisions of the representation of the nitrogen cycle (Ozbek et al., 2015). It has also been used for policy evaluation in the last two CAP reforms, in terms of both market and environmental impacts.
The potential to incorporate environmental and climate aspects into policy analysis using CAPRI is also reflected in the fact that as early as the 2015 mid-term outlook (after only five editions of this exercise), the environmental and climate impacts of agriculture were incorporated based on this model. First focusing on GHG emissions from the dairy sector in a dedicated box, since 2016 it constitutes a specific chapter on environmental aspects including GHG, ammonia, nitrogen surplus, biodiversity, soil erosion, and environmental footprints.

10
The increased pace at which the CAP is moving towards a multiple-objective policy and towards a broader food systems approach requires that models are further adapted. The recent assessment of model capacities undertaken within the SUPREMA project (Jongeneel and Gonzalez-Martinez, 2020) highlights the challenges ahead. Particularly relevant for the topics in this report, they highlight that for biodiversity ‘the models …. are in general weak with respect to the extent that they include biodiversity and landscape issues’. There is a tension between the complexity of modelling ecological processes, which often have a strong spatial nature and where localised contexts are important, and the EU-wide coverage requirement for EU policy support models. These are not the only limitations identified that prevent CAPRI from fully capturing the shift towards a broader food systems approach put forward by the Commission. For example, the model has a very limited representation of the functioning of the supply chain (limited in most cases to raw products or primary transformation), which fails to capture adaptation to market shock via its restructuring. Moreover, dietary changes, animal welfare and health issues are not included in standard applications of the model and can only be introduced as informed changes in selected parameters.
In this report rather than trying to develop the perfect tool to accurately forecast the impact of these policies, an objective that might be impossible to achieve, we focus on showing what can currently be done and what needs to be improved with CAPRI, which is one of the models that participated in SUPREMA. Thus, the report is focused on what we can quantify with the current status of the CAPRI model, how this can be done and what would be missing to achieve a comprehensive representation of the instruments and targets the Commission is putting forward.
The rest of the report is structured as follows. In section 2 there is a brief description of the main components of the three key Commission initiatives which will have a significant impact on the agricultural sector. These initiatives are the legal proposals for the CAP post-2020 (EC 2018a, b and c), the Farm to Fork Strategy (F2F) (EC 2020b), the Biodiversity Strategy (BDS) (EC 2020c). Section 3 provides an overview of the CAPRI modelling system and the two approaches used to capture the impacts of the new environmental and climate ambition that are put forward in the new initiatives: exogenous targets and endogenous technologies. In section 4, we provide details on how these two approaches are implemented to capture four of the targets set in the F2F and BDS in relation to the agricultural sector, and the measures potentially promoted by the CAP Legal Proposal (LP). Section 5 shows the results, in terms of economic, environmental and climate impacts that can be derived from the simultaneous implementation of these targets, as scenarios in the CAPRI model. Three different scenarios are considered, representing the four selected F2F and BDS targets combined. In one case, potential implementation of the CAP LP1 with increased environmental and climate ambition is added to the targets, and in another the potential impact of the Next Generation EU (NGEU) is added. In section 6, we highlight the limitations faced when using the current CAPRI model to assess policy initiatives that introduce the new objectives, policy instruments and performance indicators and sketch ways to improve the model to overcome these and move towards approaches that better capture the nuances of the policy initiatives and when assessing the expected outcome of their implementation. The technical report closes with some preliminary conclusions that can be derived from this exercise.
A word of caution for the reader. In view of the limitations mentioned above. This technical report is not intended to be in any way a formal impact assessment (in the meaning of Better Regulation) of the F2F and BDS strategies or the CAP LP. The CAP LP already was subject to a formal IA in 2018 and the F2F and BDS strategies are much broader than the four targets modelled. Moreover, some of the targets relate to areas for which the CAPRI model has not been explicitly developed nor those the baseline explicitly incorporate full compliance with existing legislation (e.g. nitrates directive). Quantitative results should be regarded merely as a first rough indicative estimate of potential impacts, while the actual impacts of Farm to Fork Strategy, the Biodiversity Strategy and the Climate targets may differ considerably from the projections made in the framework of this report. In particular, impacts on production can be overestimated as positive co-benefits of reaching some of the targets are not incorporated into the modelling assumptions. Rather it showcases the current capacity of the CAPRI model to address these issues and highlights the improvements needed to be able to better understand the impacts of such initiatives. In view of the current limitations of the CAPRI model, the magnitude of the specific findings on activity levels, trade flows, income and environmental indicators should not be taken as definitive in absolute terms. They are a qualitative indication of the potential direction of the impacts and highlight the need to better understand the relationship between the increased environmental and climate ambition and the other CAP objectives. Under no circumstances should are they
1 The CAP LP leaves ample leeway for MS to design Strategic Plans combining multiple interventions to achieve the common
objectives put forward (see section 2). At the time of writing little is known as regards how these plans will finally conclude so assumptions are an unavoidable step in order to model the CAP LP at this stage.

11
provided or should be understood as a definitive guidance for decision or policy making process.
12
2 Reinforcing environmental and climate targets in EU policy for the
agricultural sector
2.1 The CAP post-2020 legal proposals
The latest step in the development of the CAP has been the legal proposal (CAP LP) tabled by the Commission in June 2018, as part of the proposals for the new Multiannual Financial Framework. These proposals consist of a package of three Regulations addressing the CAP Strategic Plans; the financing, management and monitoring of the CAP; and the common organisation of the markets (EC 2018a, b and c). The proposals are an attempt to provide the right tools to help the sector respond to emerging economic, environmental and social challenges with a new, simplified and modernised CAP. There are several key ideas behind the proposed new CAP which can be summarised as:
simplified management of CAP support for both farmers and implementing authorities;
a move from compliance to results and performance;
increased flexibility in terms of both instruments and implementation, to achieve common objectives;
increased ambition of the CAP, in particular with regard to environment and climate;
a framework of checks and balances to guarantee the ambition is delivered; and
overall modernisation of the CAP.
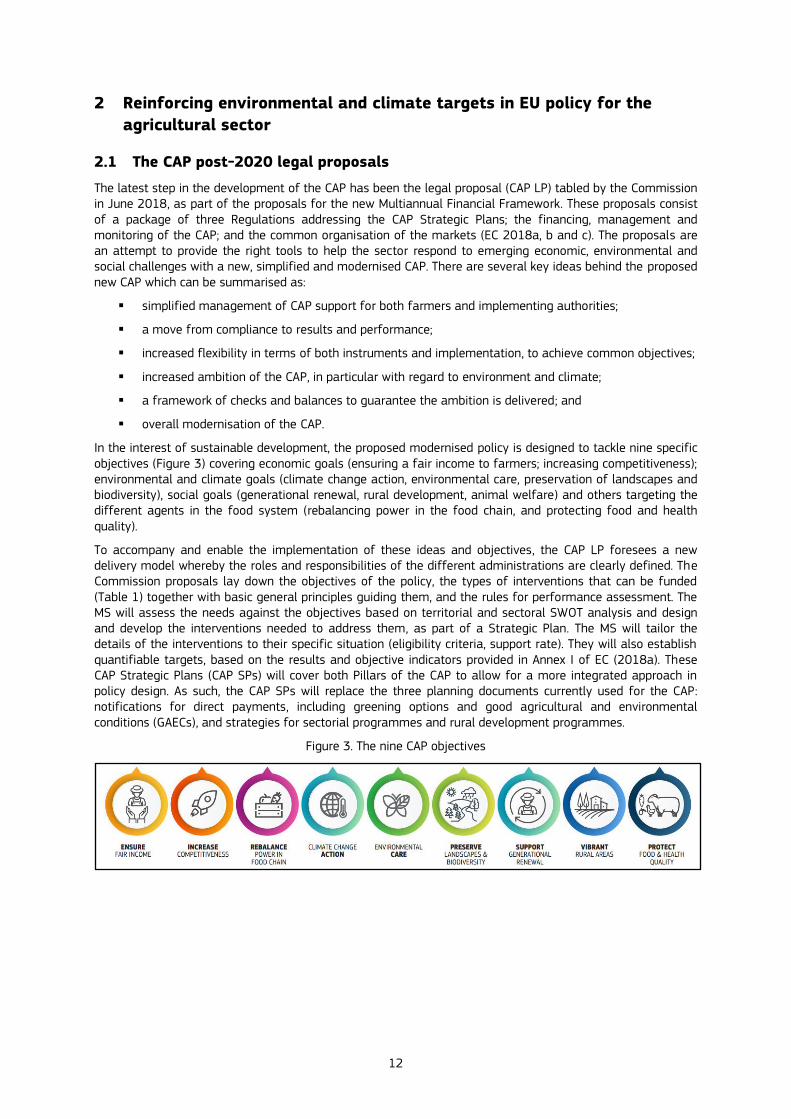
In the interest of sustainable development, the proposed modernised policy is designed to tackle nine specific objectives (Figure 3) covering economic goals (ensuring a fair income to farmers; increasing competitiveness); environmental and climate goals (climate change action, environmental care, preservation of landscapes and biodiversity), social goals (generational renewal, rural development, animal welfare) and others targeting the different agents in the food system (rebalancing power in the food chain, and protecting food and health quality).
To accompany and enable the implementation of these ideas and objectives, the CAP LP foresees a new delivery model whereby the roles and responsibilities of the different administrations are clearly defined. The Commission proposals lay down the objectives of the policy, the types of interventions that can be funded (Table 1) together with basic general principles guiding them, and the rules for performance assessment. The MS will assess the needs against the objectives based on territorial and sectoral SWOT analysis and design and develop the interventions needed to address them, as part of a Strategic Plan. The MS will tailor the details of the interventions to their specific situation (eligibility criteria, support rate). They will also establish quantifiable targets, based on the results and objective indicators provided in Annex I of EC (2018a). These CAP Strategic Plans (CAP SPs) will cover both Pillars of the CAP to allow for a more integrated approach in policy design. As such, the CAP SPs will replace the three planning documents currently used for the CAP: notifications for direct payments, including greening options and good agricultural and environmental conditions (GAECs), and strategies for sectorial programmes and rural development programmes.
Figure 3. The nine CAP objectives
13
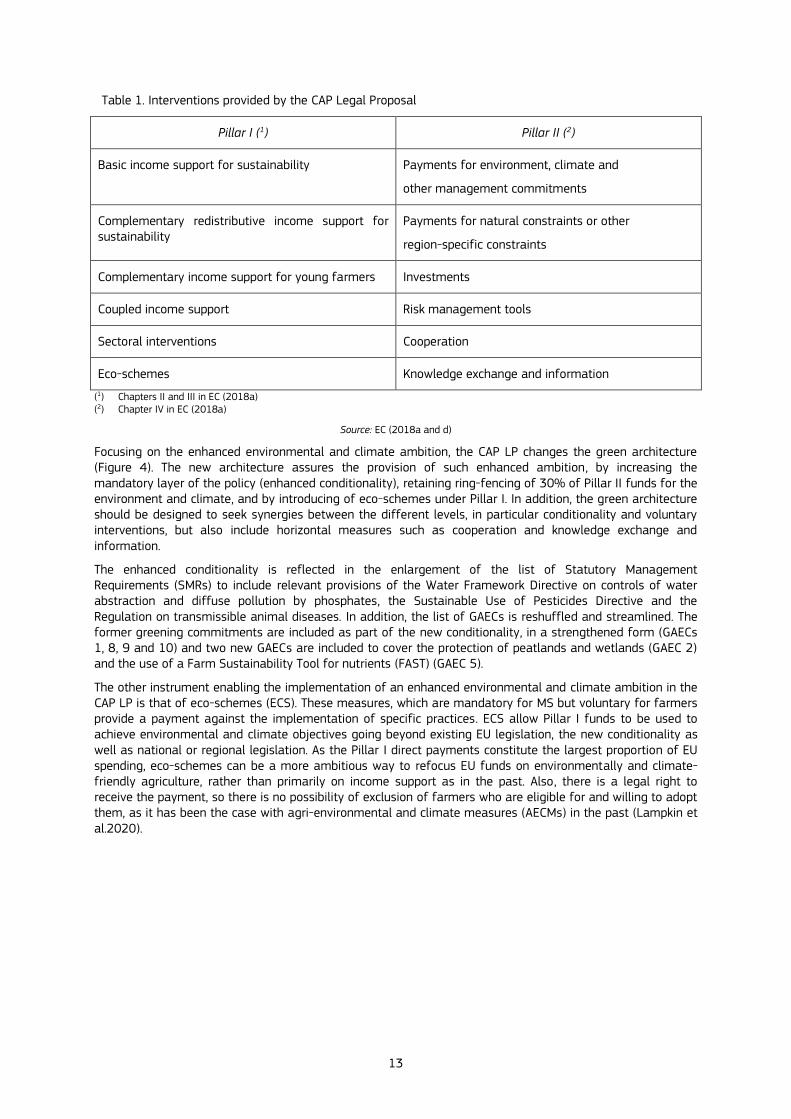
Table 1. Interventions provided by the CAP Legal Proposal
Pillar I (1) Pillar II (2)
Basic income support for sustainability Payments for environment, climate and
other management commitments
Complementary redistributive income support for sustainability
Payments for natural constraints or other
region-specific constraints
Complementary income support for young farmers Investments
Coupled income support Risk management tools
Sectoral interventions Cooperation
Eco-schemes Knowledge exchange and information
(1) Chapters II and III in EC (2018a) (2) Chapter IV in EC (2018a)
Source: EC (2018a and d)
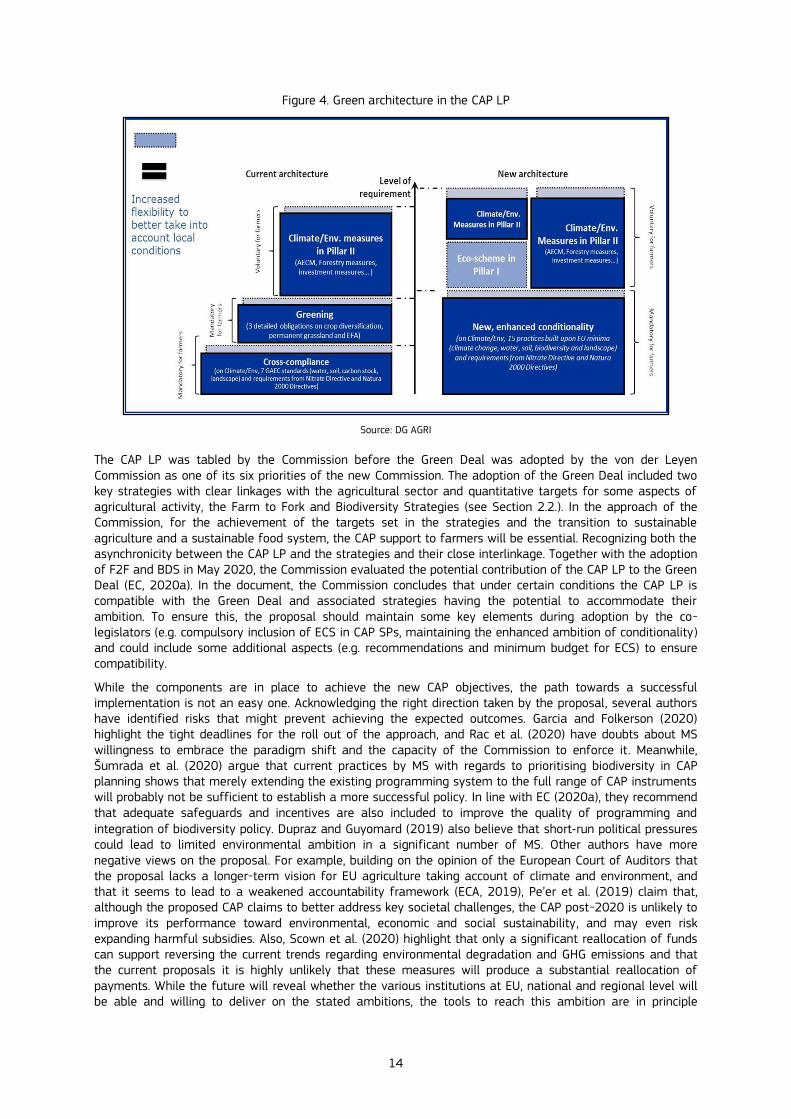
Focusing on the enhanced environmental and climate ambition, the CAP LP changes the green architecture (Figure 4). The new architecture assures the provision of such enhanced ambition, by increasing the mandatory layer of the policy (enhanced conditionality), retaining ring-fencing of 30% of Pillar II funds for the environment and climate, and by introducing of eco-schemes under Pillar I. In addition, the green architecture should be designed to seek synergies between the different levels, in particular conditionality and voluntary interventions, but also include horizontal measures such as cooperation and knowledge exchange and information.
The enhanced conditionality is reflected in the enlargement of the list of Statutory Management Requirements (SMRs) to include relevant provisions of the Water Framework Directive on controls of water abstraction and diffuse pollution by phosphates, the Sustainable Use of Pesticides Directive and the Regulation on transmissible animal diseases. In addition, the list of GAECs is reshuffled and streamlined. The former greening commitments are included as part of the new conditionality, in a strengthened form (GAECs 1, 8, 9 and 10) and two new GAECs are included to cover the protection of peatlands and wetlands (GAEC 2) and the use of a Farm Sustainability Tool for nutrients (FAST) (GAEC 5).
The other instrument enabling the implementation of an enhanced environmental and climate ambition in the CAP LP is that of eco-schemes (ECS). These measures, which are mandatory for MS but voluntary for farmers provide a payment against the implementation of specific practices. ECS allow Pillar I funds to be used to achieve environmental and climate objectives going beyond existing EU legislation, the new conditionality as well as national or regional legislation. As the Pillar I direct payments constitute the largest proportion of EU spending, eco-schemes can be a more ambitious way to refocus EU funds on environmentally and climate-friendly agriculture, rather than primarily on income support as in the past. Also, there is a legal right to receive the payment, so there is no possibility of exclusion of farmers who are eligible for and willing to adopt them, as it has been the case with agri-environmental and climate measures (AECMs) in the past (Lampkin et al.2020).
14
Figure 4. Green architecture in the CAP LP
Source: DG AGRI
The CAP LP was tabled by the Commission before the Green Deal was adopted by the von der Leyen Commission as one of its six priorities of the new Commission. The adoption of the Green Deal included two key strategies with clear linkages with the agricultural sector and quantitative targets for some aspects of agricultural activity, the Farm to Fork and Biodiversity Strategies (see Section 2.2.). In the approach of the Commission, for the achievement of the targets set in the strategies and the transition to sustainable agriculture and a sustainable food system, the CAP support to farmers will be essential. Recognizing both the asynchronicity between the CAP LP and the strategies and their close interlinkage. Together with the adoption of F2F and BDS in May 2020, the Commission evaluated the potential contribution of the CAP LP to the Green Deal (EC, 2020a). In the document, the Commission concludes that under certain conditions the CAP LP is compatible with the Green Deal and associated strategies having the potential to accommodate their ambition. To ensure this, the proposal should maintain some key elements during adoption by the co-legislators (e.g. compulsory inclusion of ECS in CAP SPs, maintaining the enhanced ambition of conditionality) and could include some additional aspects (e.g. recommendations and minimum budget for ECS) to ensure compatibility.
While the components are in place to achieve the new CAP objectives, the path towards a successful implementation is not an easy one. Acknowledging the right direction taken by the proposal, several authors have identified risks that might prevent achieving the expected outcomes. Garcia and Folkerson (2020) highlight the tight deadlines for the roll out of the approach, and Rac et al. (2020) have doubts about MS willingness to embrace the paradigm shift and the capacity of the Commission to enforce it. Meanwhile, Šumrada et al. (2020) argue that current practices by MS with regards to prioritising biodiversity in CAP planning shows that merely extending the existing programming system to the full range of CAP instruments will probably not be sufficient to establish a more successful policy. In line with EC (2020a), they recommend that adequate safeguards and incentives are also included to improve the quality of programming and integration of biodiversity policy. Dupraz and Guyomard (2019) also believe that short‐run political pressures could lead to limited environmental ambition in a significant number of MS. Other authors have more negative views on the proposal. For example, building on the opinion of the European Court of Auditors that the proposal lacks a longer-term vision for EU agriculture taking account of climate and environment, and that it seems to lead to a weakened accountability framework (ECA, 2019), Pe’er et al. (2019) claim that, although the proposed CAP claims to better address key societal challenges, the CAP post-2020 is unlikely to improve its performance toward environmental, economic and social sustainability, and may even risk expanding harmful subsidies. Also, Scown et al. (2020) highlight that only a significant reallocation of funds can support reversing the current trends regarding environmental degradation and GHG emissions and that the current proposals it is highly unlikely that these measures will produce a substantial reallocation of payments. While the future will reveal whether the various institutions at EU, national and regional level will be able and willing to deliver on the stated ambitions, the tools to reach this ambition are in principle
15
available in the CAP LP.
While the details of implementation of the CAP LP to reflect a higher environmental and climate ambition are provided in section 4, the main aspects of this reform that are captured in CAPRI relate to budgetary allocations between measures (i.e. share of direct payments budget for ECS; share of Pillar II budget for AECMs) and to measures or practices that are included in the various steps of the green architecture.
2.2 Farm to Fork and Biodiversity Strategies
The adoption process for the CAP post-2020 proposal was still on-going when the von der Leyen Commission took office and the president-elect announced the proposal of a European Green Deal in her speech to the European Parliament presenting her political guidelines. The proposal took form in December 2019 when the Communication on the Green Deal was adopted (EC, 2019). Considering the Green Deal as the EU roadmap for implementation of the United Nation’s 2030 Agenda and the Sustainable Development Goals, it influences the decisions on the new CAP.
The Green Deal includes two key strategies: Farm to Fork Strategy (F2F) and Biodiversity Strategy for 2030 (BDS) (EC, 2020b and 2020c). Commitments and objectives announced in these strategies require adaptations along the entire food chain starting from the farming, food processing and retail sectors, and ending with food services, procurements and consumption patterns. The F2F strategy aims to make food systems fair, healthy and environmentally-friendly. At its heart addresses the challenges of enhancing the positive and reducing the negative environmental impacts of farming, promoting sustainable and socially responsible production methods, access to sufficient, nutritious and sustainable food and healthy and sustainable food consumption. In particular, to foster positive environmental and climate effects from food production, the Commission proposes to provide farmers with incentives for enhanced carbon sequestration, support market adoption of energy efficiency solutions and facilitate placing on the market of sustainable and innovative feed additives. Furthermore, to improve the environmental sustainability of farming, the Commission will take action to reduce by 50% overall EU sales of antimicrobials for farmed animals, use and risk of chemical pesticides and reduce nutrient losses in the environment by 50%, thus, expecting a decrease of fertilizer application by 20%. The sustainability framework of the F2F also includes the improvement of animal welfare by revising the respective legislation, facilitation of registration and market access for traditional and locally-adapted seed varieties, and the objective of at least 25% of the EU’s agricultural land being under organic farming by 2030, including putting forward an Action Plan on organic farming. The incentives to support sustainable food production may include targeted VAT rates and a fairer tax system. Lower VAT rates should aim to encourage consumers to choose sustainable and healthy diets, and the tax system should ensure that the prices of different foods reflect their real costs in terms of environmental externalities.
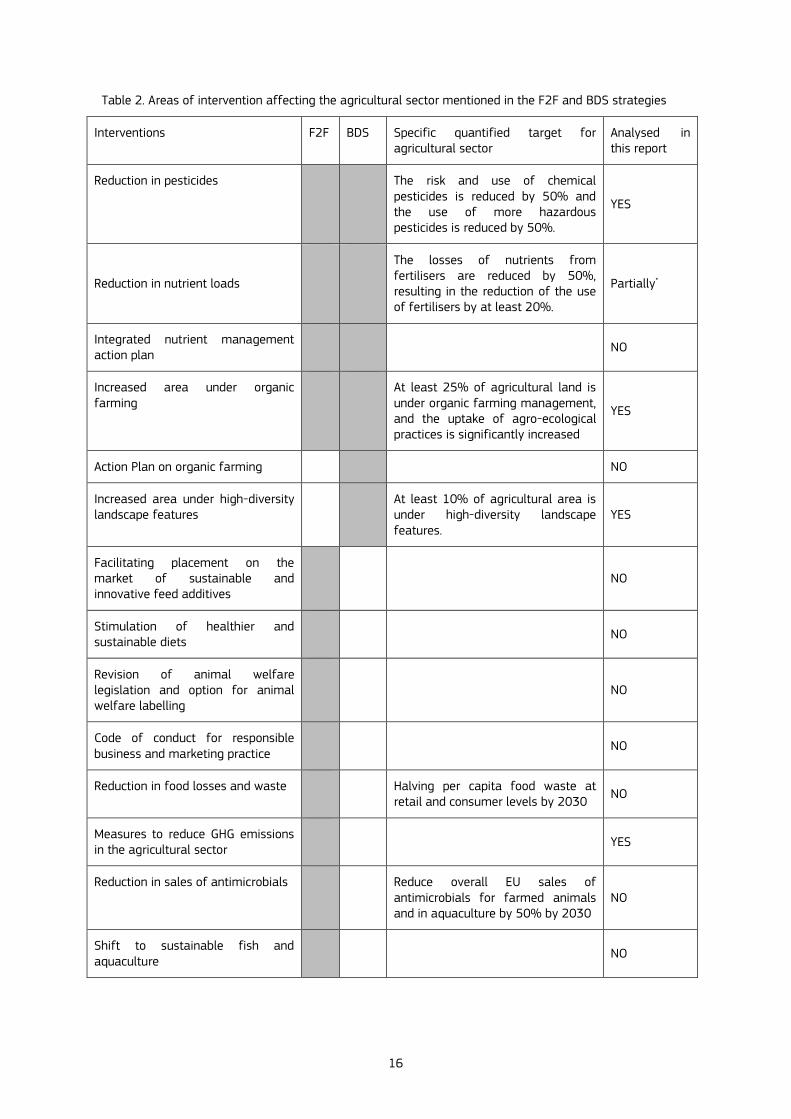
In view of the dramatic biodiversity decline on agricultural land compared to other habitats, the Commission adopted in May 2020 the BDS to halt biodiversity loss. It also has components which shall have an impact on farming practices, especially on those that are particularly harmful for the environment. In particular, the key commitments that directly affect the EU farming sector include reducing the use and risk of chemical pesticides by 50% and of fertilisers by 20%, setting of at least 10% of agricultural area under high-diversity landscape features and of at least 25% under organic farming. The objectives with somewhat less direct impacts on agriculture are full implementation of the EU Pollinators initiative, remediation of contaminated soil sites, reversal of the decline in genetic diversity and facilitation of sustainable biomass production and use. Those targets that are reflected in both strategies are perfectly aligned. Table 2 summarises the main areas of intervention proposed by the strategies that have a potentially significant impact on the agricultural sector highlighting those that are subject to analysis in this report.
Although the new CAP proposed by the Commission has the potential to drive forward the Green Deal, due attention needs to be paid to safeguards in the final co-decision and to how implementation of legislation is undertaken both by the Commission and the Member States. Accordingly, the Commission will present recommendations to MS to mobilize the full potential of the CAP to achieve its strategic objectives. Under the new CAP ECS and enhanced conditionality linked to direct payments are expected to be a major source of financial incentive targeting income support to farmers who deliver on the green ambition. Therefore, efficiency of the payments and appropriately developed Strategic Plans for the Member States will become decisive factors in the success rates of the strategies (EC, 2020a).
16
Table 2. Areas of intervention affecting the agricultural sector mentioned in the F2F and BDS strategies
Interventions F2F BDS Specific quantified target for agricultural sector
Analysed in this report
Reduction in pesticides The risk and use of chemical pesticides is reduced by 50% and the use of more hazardous pesticides is reduced by 50%.
YES
Reduction in nutrient loads
The losses of nutrients from fertilisers are reduced by 50%, resulting in the reduction of the use of fertilisers by at least 20%.
Partially*
Integrated nutrient management action plan
NO
Increased area under organic farming
At least 25% of agricultural land is under organic farming management, and the uptake of agro-ecological practices is significantly increased
YES
Action Plan on organic farming NO
Increased area under high-diversity landscape features
At least 10% of agricultural area is under high-diversity landscape features.
YES
Facilitating placement on the market of sustainable and innovative feed additives
NO
Stimulation of healthier and sustainable diets
NO
Revision of animal welfare legislation and option for animal welfare labelling
NO
Code of conduct for responsible business and marketing practice
NO
Reduction in food losses and waste Halving per capita food waste at retail and consumer levels by 2030
NO
Measures to reduce GHG emissions in the agricultural sector
YES
Reduction in sales of antimicrobials Reduce overall EU sales of antimicrobials for farmed animals and in aquaculture by 50% by 2030
NO
Shift to sustainable fish and aquaculture
NO

17
Interventions F2F BDS Specific quantified target for agricultural sector
Analysed in this report
Revision of competition rules for collective initiatives promoting sustainability
NO
Contingency plan for ensuring food supply and food security to be put in place in times of crisis
NO
Revision of marketing standards NO
Harmonised mandatory front-of-pack nutrition labelling
NO
Changes in taxation of food products
NO
Target on broad-band in rural areas Accelerate the roll-out of fast broadband internet in rural areas to achieve the objective of 100% access by 2025.
NO
Planting of 3 billion trees respecting ecological principles
NO
No deterioration by 2030 in conservation trends and status for all protected habitats and species linked to agriculture
By 2030, significant areas of degraded and carbon-rich ecosystems are restored; habitats and species show no deterioration in conservation trends and status; and at least 30% reach favourable conservation status or at least show a positive trend
NO
Effective management of all protected areas that include agricultural land
NO
EU nature restoration targets in 2021 to restore degraded ecosystems
NO
* Only nitrogen considered. Baseline considers actual implementation of Nitrates Directive and not full compliance.
Source: EC (2020b and c) and own elaboration.
The transition set out in F2F will be supported by the CAP, but this will not be the only enabling framework. Better implementation of existing obligations under EU legislation for example the Sustainable Use Directive (EC 2009/128), animal welfare legislation and the Nitrates Directive (EEC 1991/676)) can significantly contribute to achieving the targets of the European Green Deal. In addition, the revision of legislation on pesticides, veterinary medicinal products and medicated feed, animal welfare, environment and climate, as well as initiatives on clean energy and action plans such as on organic farming will consolidate a multilevel agricultural policy post-2020. Moreover, the BDS brings more requirements to the Strategic Plans of the Member States. In particular, support of sustainable agro-forestry, agro-ecology and low-intensive permanent grassland should be clearly indicated. The tight links between the CAP post-2020 and the other EU policies, demonstrated by the additional initiatives required for implementation of the F2F and BDS strategies - such
18
as the EU Nature Restoration Plan, the Renewable Energy Directive and the Emissions Trading Scheme - transfer the agricultural policy to a new level of the consolidated EU policy decision-making process.
The implications of the F2F and BDS strategies for EU agriculture will depend to a great extent on how they are implemented. Generally speaking, the effects of stricter implementation of existing environmental regulation and increased ambition on farmers’ income will be driven by changes in costs and revenues. On the one hand reductions in pesticide and fertilizer use can reduce yields in the short and medium terms leading to lower production. The same can be expected from increasing non-productive land2. On the other hand, CAP payments could offset that reduction in income due to lower production and higher prices for outputs increase revenues. Also, efficient manure management could contribute to mitigate potentially negative production effects, and lower yields resulting from the decrease in fertiliser and pesticide use could be at least partially avoided by application of sustainable pest management and cropping patterns as well as technological development. Promotion of healthy diets and appreciation for sustainably produced food could lead to reduction in consumer demand for environmentally challenging agricultural production, such as some livestock rearing systems, and its partial substitution by plant-based food items. This would naturally be reflected in production substitution and mitigate some of the price effects resulting from reduced production capacities. The reduction in food losses and waste as well as a shift towards healthier diets could not be taken into account in this analysis, as it would require complementary modelling. As such, the impact of the full set of measures included in the strategies is still to be estimated and this report is just a, modest, contribution to understand the implications of the green deal on the agricultural sector and the overall welfare of the EU.
2.3 Moving towards a climate neutral Europe: the 2030 Climate law
The agricultural sector is an important contributor to global GHG emissions and the sector faces high societal pressure to reduce its climate impact (IPCC, 2019; Schiermeier, 2019; Wollenberg et al., 2016). It is therefore crucial to incorporate the climate change mitigation dimension (i.e. climate ambition) into analysis of the F2F and BDS strategies, and consider how the CAP can contribute to mitigation. Therefore, we also need to take into account the legislative framework in the EU with regard to climate change and how it interacts with agricultural policy. The EU has been a leading party in mitigation efforts and in building international coalitions around the United Nations Framework Convention on Climate Change (UNFCCC). As part of the Paris Agreement the EU committed itself to reduce emissions in line with the need to keep global temperature increase below 2.0oC and pursue efforts to limit it to 1.5°C.
The first steps towards reaching these commitments, by implementing the agreement made by EU leaders in October 2014, were laid down in the 2030 EU Climate and Energy Framework, which includes EU-wide targets and policy objectives for the period 2021-2030. One of the key targets is the reduction of GHG emissions by at least 40% below 1990 levels by 2030. To achieve this target, several legislative actions were approved at EU level, affecting both sectors under the EU Emissions Trading System (ETS) and the remaining non-ETS sectors, which will need to cut emissions by 43% and 30%, respectively, compared to 2005. For non-ETS sectors, such as agriculture, transport, buildings and waste, the EU Effort Sharing Regulation 2018/842 (CEU, 2018a) establishes binding annual GHG emission targets for individual MS. This Regulation provides new flexibility as it allows access to credits from the land use sector. The aim of the new flexibility is to stimulate additional action in the land use sector by allowing MS to use up to 280 million credits over the entire period 2021-2030 to comply with their national targets. If needed, all MS are eligible to make use of this flexibility, but access is higher for those MS with a larger share of emissions from agriculture.
According to the Regulation, this flexibility acknowledges both the lower mitigation potential of the agriculture and land use sectors, and an appropriate contribution by the sectors to GHG mitigation and sequestration (CEU, 2018a). Specific accounting rules on GHG emissions and removals related to land use, land-use change and forestry (LULUCF) are set out in Regulation (EU) 2018/841 (CEU, 2018b). Considering the aforementioned flexibility, MS have to ensure that net emissions from LULUCF are compensated by an equivalent removal of CO₂ from the atmosphere through action in the sector, which is known as the ‘no debit’ rule. Thus, the framework envisages that all sectors contribute to the EU 2030 GHG emission reduction target, even where no specific target is set for the specific non-ETS sectors.
As part of the commitment of the von der Leyen Commission to increase the level of ambition in addressing
2 The two impacts might not be additive as some of the non-productive areas such as buffer strips could reduce nutrient losses and
pesticide use.
19
climate change, the EU will create legally binding tools to ensure that the long-term vision of making the EU the first carbon-neutral region in the world put forward in the communication A Clean Planet for all (EC, 2018f) will become reality. As part of its European Green Deal initiative, on 4 March 20202 the Commission proposed the first European Climate Law to enshrine the 2050 climate-neutrality target into legislation [EC, 2020d]. This implies achieving net zero GHG emissions for EU countries as a whole, mainly by cutting emissions, investing in green technologies and protecting the natural environment. The law aims to ensure that all EU policies contribute to this goal and that all sectors of the economy and society play their part. At the time of writing this report (September 2020) the exact revised targets are unknown but they will be higher than the ones currently in place.
This report is a contribution to the analysis of how the EU agricultural sector will have to deliver an enhanced climate ambition within the overall mitigation effort taking into account any new CAP implementation measures stemming from the CAP LP, the F2F and BDS strategies described in sections 2.1 and 2.2.

20
3 The CAPRI modelling system
3.1 Overview of the model
The CAPRI (Common Agricultural Policy Regionalised Impact analysis) modelling system (Britz and Witzke 2014) is the main quantitative tool used in this study. CAPRI is a global, comparative static, partial equilibrium model for the agricultural and primary processing sectors. In CAPRI, regional supply modules depict the EU agricultural sector, while a global market module describes global agri-food commodity markets. These two main components are interlinked via an iterative process. Commodity prices from the global markets enter the profit maximisation system of the EU regions, while EU agricultural supply from the regions enters the trade balances. This model structure allows capture of the price feedback for simulated policy changes along the primary supply chain, from commodity markets down to EU farms (and vice-versa).
The EU regional supply models in CAPRI follow profit maximising behaviour under constraints, such as land availability, nutrient balances and policy obligations. The basic idea is to interpret the ‘observed’ situation as a profit maximising choice by the agent, assuming that all constraints and coefficients are correctly specified with the exemption of costs or revenues not included in the model (Britz and Witzke, 2014). Profit maximisation is ensured by methods based on positive mathematical programming (PMP), which offer a high degree of flexibility in capturing important interactions between production activities and the environment, while enabling us to calibrate the modelling system to observed production statistics (Heckelei et al. , 2012). The market model is a spatial multi-commodity model with global coverage (80 country groups worldwide), depicting about 60 primary and secondary agricultural products. International trade is modelled following the Armington assumption. Goods are differentiated by place of origin, allowing for modelling of each bilateral trade flow between countries. The market model is calibrated to historical trade patterns, incorporating projections for the future development of prices and market balances. Trade policy measures at the border are also included, such as tariffs, tariff-rate quotas (TRQs), variable levies and the EU entry-price system for fruits and vegetables.
CAPRI is frequently used for ex-ante impact assessment of agricultural, environmental and trade policy options; for example: removal of EU milk quota (Witzke et al., 2009), expiry of the sugar quota system (Burrell et al., 2014); potential EU trade deals (Burrell et al., 2011); climate change mitigation in the agricultural sector in the EU (Pérez Dominguez et al., 2016 and 2020; Fellmann et al., 2018) and at global level (Hasegawa et al., 2018; Meijl et al., 2018; Frank et al., 2018); CAP greening measures (Gocht et al., 2017): possible future pathways for the CAP (M'barek et al., 2017) and the impact assessment of the CAP legislative proposal of 2018 (EC, 2018d).
Nitrogen surplus is defined in the CAPRI model as the difference between N input and output. Differences between the calculation made using CAPRI and the Eurostat (2013) ‘ideal approach’ for nutrient budgets are explained by missing data in CAPRI on organic fertilizers other than manure; seed and planting material not considered in the input term; no estimation of biological N fixation by free-living organisms; and lack of data on manure imports and exports. These missing data may have an impact on the accuracy of the reaction of the model due to restrictions on nutrient balances. Further details on the specific nitrogen flows and budget can be found in Leip et al. (2011) while details on how the different inputs and outputs are quantified can be found in Özbek et al. (2015).
CAPRI calculates indicators for EU agricultural (non-CO2) GHG emissions in the form of nitrous oxide and methane, and of CO2 emissions. Indicators for non-CO2 emissions are based both on input use and on outputs from production activities. The Tier 2 approach from IPCC guidelines (IPCC, 2006) is generally used for the calculation of activity-based emission factors. In case of limited data availability, the calculation is simplified to a Tier 1 approach (e.g. for rice cultivation). Leip et al. (2010) and Pérez Domínguez et al. (2012) provide detailed descriptions of the emission inventories in CAPRI. EU agricultural CO2 emissions are calculated considering the carbon cycle for EU agriculture and CO2 emissions related to land use and land use change (Pérez Domínguez et al., 2020). The model includes a set of technological (i.e. technical and management-based) GHG mitigation options for EU farmers, focusing on technological options that are already available or will likely be available in the simulation year 2030. Implementation costs, cost savings, and mitigation potential for the modelled technological mitigation options are mainly based on data from the Greenhouse gas and Air pollution Interactions and Synergies (GAINS) database. The level of production activities and the use of mitigation technologies are constrained by various factors, including land availability, fertilisation requirements of the cropping systems versus organic nutrient availability; and feed requirements in terms of dry matter, net energy, protein, and fibre for each animal.
21
A detailed description of each technological GHG mitigation option is provided in Pérez-Domínguez et al. (2012). The data provided by the GAINS database and the Animal Change project are based on farm types (where applicable, e.g. with anaerobic digestion) and specific to production activity and level, i.e. indicating the costs for the application of the mitigation measure to one unit of the production activity (per hectare or head). For the estimation of the average cost function, CAPRI builds upon the costs provided for in specific farm types, which are then aggregated at regional level according to shares of these farm sizes in the region.
The scope and degree of adaptation of a mitigation technology in each region is an endogenous variable. As such, it is treated as a function of its mitigation costs (sum of annualised investment cost and operation costs); the revenue generated by it (if any, as in the case of anaerobic digestion); cost-savings (for example costs saved by using less mineral fertiliser through implementation of precision farming), and other incentives such as subsidies (or taxes) to which it is subject. Accordingly, as the agents in the CAPRI regional programming models are assumed to be profit maximisers, farmers will apply a mitigation option only if marginal profit (according to a gross value added concept) increases. Detailed information on the modelling approach is provided in Perez Dominguez et al. (2016) and Fellmann et al. (2018).
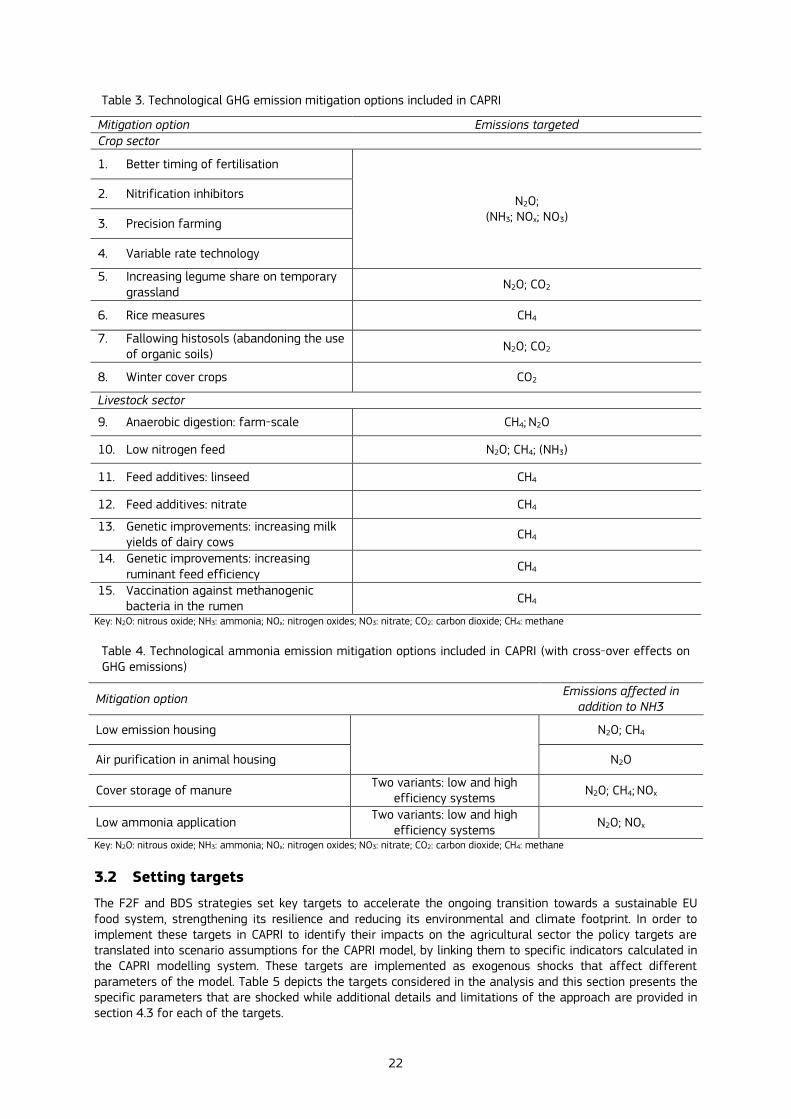
Table 3 and Table 4 show the GHG and ammonia mitigation technologies implemented. Further details can be found in Pérez-Domínguez et al. (2020). While emissions from EU agriculture are calculated on a per activity basis in the CAPRI supply model, GHG emissions for the rest of the world are estimated on a commodity basis (i.e. per kg of product) in the CAPRI market model. Mitigation technologies in non-EU countries are not specifically considered, but trends in technological developments are integrated (Pérez-Domínguez et al., 2012; Pérez-Domínguez et al., 2016). The worldwide emissions accounting allows CAPRI to quantify emission leakage. For example, the share of emission savings in the EU that is replaced with increased emissions in other countries can be calculated. As far as the baseline is concerned, it is calibrated to the OECD-FAO Agricultural Outlook 2017-2026 (OECD-FAO, 2017) with a CAP representation depicting implementation for the 2014-2020 period (see section 4.1).
22
Table 3. Technological GHG emission mitigation options included in CAPRI
Mitigation option Emissions targeted Crop sector
1. Better timing of fertilisation
N2O; (NH3; NOx; NO3)
2. Nitrification inhibitors
3. Precision farming
4. Variable rate technology
5. Increasing legume share on temporary grassland
N2O; CO2
6. Rice measures CH4
7. Fallowing histosols (abandoning the use of organic soils)
N2O; CO2
8. Winter cover crops CO2
Livestock sector
9. Anaerobic digestion: farm-scale CH4; N2O
10. Low nitrogen feed N2O; CH4; (NH3)
11. Feed additives: linseed CH4
12. Feed additives: nitrate CH4
13. Genetic improvements: increasing milk yields of dairy cows
CH4
14. Genetic improvements: increasing ruminant feed efficiency
CH4
15. Vaccination against methanogenic bacteria in the rumen
CH4
Key: N2O: nitrous oxide; NH3: ammonia; NOx: nitrogen oxides; NO3: nitrate; CO2: carbon dioxide; CH4: methane
Table 4. Technological ammonia emission mitigation options included in CAPRI (with cross-over effects on GHG emissions)
Mitigation option Emissions affected in
addition to NH3
Low emission housing
N2O; CH4
Air purification in animal housing N2O
Cover storage of manure Two variants: low and high
efficiency systems N2O; CH4; NOx
Low ammonia application Two variants: low and high
efficiency systems N2O; NOx
Key: N2O: nitrous oxide; NH3: ammonia; NOx: nitrogen oxides; NO3: nitrate; CO2: carbon dioxide; CH4: methane
3.2 Setting targets
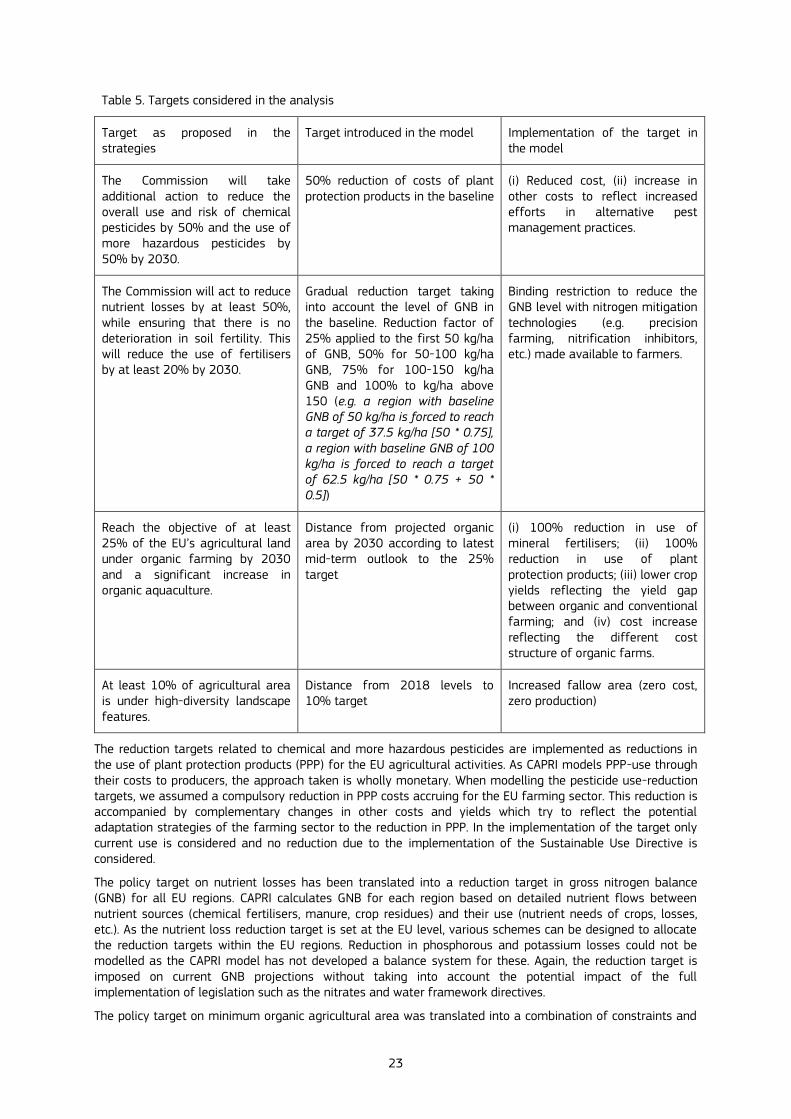
The F2F and BDS strategies set key targets to accelerate the ongoing transition towards a sustainable EU food system, strengthening its resilience and reducing its environmental and climate footprint. In order to implement these targets in CAPRI to identify their impacts on the agricultural sector the policy targets are translated into scenario assumptions for the CAPRI model, by linking them to specific indicators calculated in the CAPRI modelling system. These targets are implemented as exogenous shocks that affect different parameters of the model. Table 5 depicts the targets considered in the analysis and this section presents the specific parameters that are shocked while additional details and limitations of the approach are provided in section 4.3 for each of the targets.
23
Table 5. Targets considered in the analysis
Target as proposed in the strategies
Target introduced in the model Implementation of the target in the model
The Commission will take additional action to reduce the overall use and risk of chemical pesticides by 50% and the use of more hazardous pesticides by 50% by 2030.
50% reduction of costs of plant protection products in the baseline
(i) Reduced cost, (ii) increase in other costs to reflect increased efforts in alternative pest management practices.
The Commission will act to reduce nutrient losses by at least 50%, while ensuring that there is no deterioration in soil fertility. This will reduce the use of fertilisers by at least 20% by 2030.
Gradual reduction target taking into account the level of GNB in the baseline. Reduction factor of 25% applied to the first 50 kg/ha of GNB, 50% for 50-100 kg/ha GNB, 75% for 100-150 kg/ha GNB and 100% to kg/ha above 150 (e.g. a region with baseline GNB of 50 kg/ha is forced to reach a target of 37.5 kg/ha [50 * 0.75], a region with baseline GNB of 100 kg/ha is forced to reach a target of 62.5 kg/ha [50 * 0.75 + 50 * 0.5])
Binding restriction to reduce the GNB level with nitrogen mitigation technologies (e.g. precision farming, nitrification inhibitors, etc.) made available to farmers.
Reach the objective of at least 25% of the EU’s agricultural land under organic farming by 2030 and a significant increase in organic aquaculture.
Distance from projected organic area by 2030 according to latest mid-term outlook to the 25% target
(i) 100% reduction in use of mineral fertilisers; (ii) 100% reduction in use of plant protection products; (iii) lower crop yields reflecting the yield gap between organic and conventional farming; and (iv) cost increase reflecting the different cost structure of organic farms.
At least 10% of agricultural area is under high-diversity landscape features.
Distance from 2018 levels to 10% target
Increased fallow area (zero cost, zero production)
The reduction targets related to chemical and more hazardous pesticides are implemented as reductions in the use of plant protection products (PPP) for the EU agricultural activities. As CAPRI models PPP-use through their costs to producers, the approach taken is wholly monetary. When modelling the pesticide use-reduction targets, we assumed a compulsory reduction in PPP costs accruing for the EU farming sector. This reduction is accompanied by complementary changes in other costs and yields which try to reflect the potential adaptation strategies of the farming sector to the reduction in PPP. In the implementation of the target only current use is considered and no reduction due to the implementation of the Sustainable Use Directive is considered.
The policy target on nutrient losses has been translated into a reduction target in gross nitrogen balance (GNB) for all EU regions. CAPRI calculates GNB for each region based on detailed nutrient flows between nutrient sources (chemical fertilisers, manure, crop residues) and their use (nutrient needs of crops, losses, etc.). As the nutrient loss reduction target is set at the EU level, various schemes can be designed to allocate the reduction targets within the EU regions. Reduction in phosphorous and potassium losses could not be modelled as the CAPRI model has not developed a balance system for these. Again, the reduction target is imposed on current GNB projections without taking into account the potential impact of the full implementation of legislation such as the nitrates and water framework directives.
The policy target on minimum organic agricultural area was translated into a combination of constraints and
24
parameter adjustments for the average (representative) regional farm models. First, specific organic area targets were calculated for each region, under the assumption that the sum of these regional targets should add up to the overall EU target As the organic farming practices allowed are somewhat restricted compared to conventional farming, we constructed production-restricting targets and parameter adjustments for CAPRI: (i) lower use of mineral fertilisers; (ii) lower use of plant protection products; (iii) lower crop yields reflecting the yield gap between organic and conventional farming; and (iv) cost increase reflecting the different cost structure of organic farms. Lower mineral fertiliser use was triggered in CAPRI by a maximum threshold for synthetic fertiliser use, operating on broad crop groups: vegetables, permanent crops and other (mostly arable) crops. Parameterisation of these restrictions and adjustments was based on the regional organic area targets and also on econometric estimations. Due to model limitations, no changes were made to reflect the higher market value of organic product.
A policy target on increasing non-productive landscape elements and set aside by 2030 was translated into a set aside requirement, as landscape elements are not included in the model. The regional farm models in CAPRI faced a constraint on a minimum set aside area. That constraint, in principle, triggers a change in land use patterns, increasing the share of land-use activities without intermediate or marketable outputs within the Utilised Agricultural Area (UAA). Set aside requirements were calculated for each EU region, taking into account current land-use statistics.
3.3 Modelling subsidies for technologies
The CAPRI model has developed an approach to incorporate technologies for which endogenous adoption may occur in response to incentives (carbon prices or quantitative restrictions). The details of the modelling of endogenous technologies can be found in Pérez-Domínguez (2016, 2020). Here, we describe how this general framework has been used to mimic a situation where endogenous adoption is driven by subsidies. This is the most adequate way to describe a CAP LP with an enhanced environmental and climate ambition, where budget would be allocated to promote environmentally and climate friendly practices or technologies.
Besides the positive environmental impacts of GAECs and greening, environmentally friendly farming practices in the current CAP are mainly subsidised under Pillar II, in particular through the agri-environmental and climate measures (AECMs, M10) and organic farming (M11) within the rural development programmes (RDPs). Some of these farming practices are modelled as endogenous mitigation technologies in CAPRI, but by default there is no link between the CAP subsidies on the one hand, and implementation of the mitigation technologies and their environmental impacts on the other. By contrast, subsidies under Pillar II are treated as lump-sum transfers, independent of the obligations related to the subsidies. In the CAP LP, subsidies for farming practices increasing environmental and climate performance, known as eco-schemes (ECS), are also envisaged to replace part of the area payments under Pillar I. In order to assess the efficiency of those subsidies in improving environmental performance, the link to the mitigation technologies and their environmental impacts is becoming increasingly important. In theory, the higher the budget for a specific AECM or ECS, the higher the adoption by farmers. In CAPRI terms, this refers to the overall budget for the technology and not the per unit payment.
Simultaneous calculation of adoption rates and compliance with national envelopes is currently not possible technically. In the scenarios for the CAP LP analysis, we opted for a two-step approach to circumvent this limitation. In a first model, run we implemented a set of assumed subsidy rates for a selected group of mitigation technologies, and received the endogenous regional adoption shares for the technologies as model output. In this first run, adoption of the technologies and subsidies was not limited by the national envelopes. In a second step, the adoption shares were fixed and the lump-sum transfers corrected by the subsidies for the mitigation technologies (in order to respect the national envelopes).
For the calculation of subsidy rates drew on in the first step we used different sources. Firstly, we received an extraction of the Rural Development Annual Implementation Report (AIR) database for the years 2015-2018, covering public expenditures and areas under measure M10 (AECMs). Numbers were provided at MS level and further differentiated by nine aggregated categories, indicating the type of farm practices. These aggregated categories were mapped against the set of practices and technologies that could be included in the CAPRI model version used, and the total budget split among the individual practices based on national data on area and public expenditure3. Where MS specific data were not available, the EU average was used. For farm practices which were not subsidized in the past in any member state, the average subsidy rate over all farm
3 Austria, Germany, Romania, Ireland, Belgium, Portugal, France, Finland, Latvia and Italy.

25
practices was applied. The average per hectare subsidies used for each of the technologies can be found in Annex 1.
In addition to the above-mentioned farm practices, organic farming was also modelled with an explicit link to the respective environmental impacts. Since organic farming is not yet available as an endogenous mitigation technology in CAPRI, assumptions on adoption had to be imposed exogenously. Therefore, subsidy rates did not directly impact on adoption rates, but total public expenditures for organic farming were considered within the envelopes. The budget requirement for organic farming was calculated exogenously and restricted the budget available for other farm practices. Assumed adoption is based on the target for organic farming as a share of in total agricultural area defined in the F2F strategy (for details see section 4.3.2). Assumed subsidy rates were provided by DG AGRI and are presented for the EU-27 in Annex 1. They are differentiated by permanent grassland, permanent crops, and arable land, and by maintenance of and conversion to organic farming. The budget for maintenance is supposed to be covered within the ECS envelope, while the budget for conversion (25% of additional area supposed to be in conversion in 2030) is considered within the RDPs, with 35% national co-financing. The assumed subsidy rates are not generally higher than the rates currently paid for organic farming under the RDPs. This would be in line with the premium calculation rate principle of AECMs (compensating for additional cost and income forgone) which allows these payments to be considered in the green box under WTO rules. Therefore, an increase in premiums would be challenging. The question of how farmers should be incentivised to increase the adoption share was thus ignored, although some of the additional area under organic farming still is assumed to happen without direct financial incentives from the EU budget. This imposes a behaviour on farmers that is not the result of financial incentives as the adoption targets for most MS are far beyond the national trends observed in the past decades. As the model only incorporates supply driven interventions to foster the shift from conventional to organic farming, this additional adoption could be assumed to happen as the result of the Organic Farming Action Plan that will be adopted by the Commission to support the achievement of the F2F and BDS strategies including a number of actions and support measures both on the supply and demand side, and on the market conditions for organic farming. However, as the details of this Action Plan are not yet known we cannot assess the actual adoption of organic agriculture.
In the NGEU scenario (see section 4.2.1) it was assumed that additional budget would be provided before the scenario year of 2030 to make mitigation technologies more accessible. Technically, we restricted those subsidies to long term investments so that costs of such technologies are assumed to be reduced by 30% in the scenario year 2030.
It must be highlighted that the impacts of the existing implementation of farming practices subsidised under the AECMs is not yet explicitly considered in CAPRI. Environmental impacts of those farming practices are implicitly considered in the CAPRI baseline based on long-term trends expressed as application rates of mineral fertilisers and yield growth. The explicit data on regional implementation of farming practices within the AECMs are collected through output indicators at aggregated level in the AIR database, and from an ad hoc data base collected by the JRC (official data are available only for highly aggregated groups of farming practices and at MS level). It is therefore difficult to estimate the impact of the new CAP proposal on their adoption and on the environment without knowledge of baseline implementation and the level of subsidies for the farming practices4.
To address this, the scenario construction includes only measures targeting specific farming practices for which CAP payments were already paid in the CAP 2014-2020, and which could be expected to trigger additional adoption5. Where the current subsidy is not considered in CAPRI, an option would have been to take only the supposed subsidy increase into account. From detailed analysis of the current AECMs, we found that most of the selected mitigation technologies included in the CAP LP scenario (see section 4.2.2) are not subsidised under the current CAP. The exceptions are winter cover crops and fallowing of histosols (precision farming was subsidised only in one German region). However, winter cover crops will be obligatory on 90% of arable land, according to assumptions for the CAP LP, so the current adoption and subsidy rates do not correspond to the baseline. For the fallowing of histosols, it was not possible to quantify current subsidy rates and adoption shares, since they are usually embedded in complex landscape protection schemes. We therefore decided to assume that baseline subsidy was zero for this specific technology, and acknowledge
4 Admittedly, this is a common challenge for all models when policy decisions from an array of options have to be assumed ex-ante
while their verification can only be assessed ex post. 5 This is because we assume that marginal mitigation costs increase with the share of adoption of a mitigation technology. The
equilibrium condition of marginal costs being equal to marginal benefits (subsidy rate), therefore requires increasing subsidy rates for increasing adoption shares.

26
that this may lead to a slight potential overestimation of impacts related to fallowed histosols.
Moreover, shifting budget to certain measures implies that other farm practices will see a reduction in the budget allocated to them, as no significant net increase in the CAP budget is foreseen. Where these practices receive less subsidies, and therefore are potentially less adopted than before due to the focus on farm practices targeting climate, the respective impacts are ignored. This is also a drawback of the scenario design. But while those farm practices are not explicitly covered by the model, and detailed information is not available, this is difficult to avoid. We do not consider a shift from current AECM payments to other (new) farm practices, so only additional budget can be used for new targets.
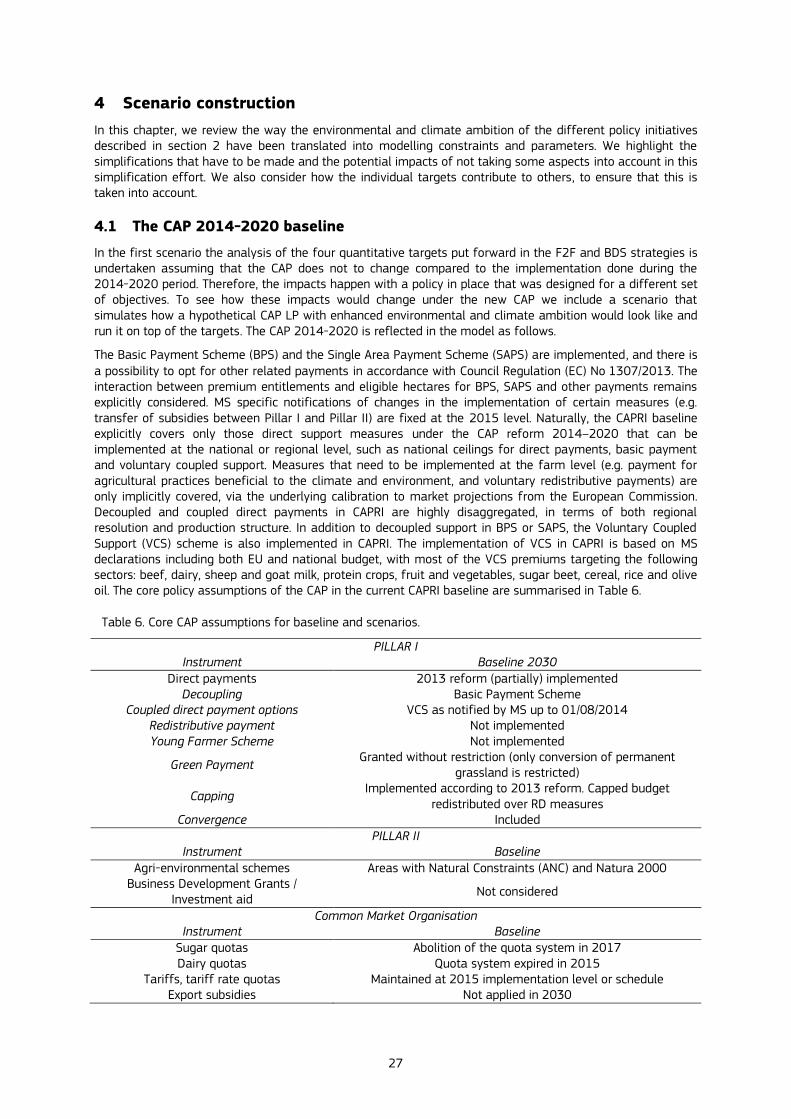
27
4 Scenario construction
In this chapter, we review the way the environmental and climate ambition of the different policy initiatives described in section 2 have been translated into modelling constraints and parameters. We highlight the simplifications that have to be made and the potential impacts of not taking some aspects into account in this simplification effort. We also consider how the individual targets contribute to others, to ensure that this is taken into account.
4.1 The CAP 2014-2020 baseline
In the first scenario the analysis of the four quantitative targets put forward in the F2F and BDS strategies is undertaken assuming that the CAP does not to change compared to the implementation done during the 2014-2020 period. Therefore, the impacts happen with a policy in place that was designed for a different set of objectives. To see how these impacts would change under the new CAP we include a scenario that simulates how a hypothetical CAP LP with enhanced environmental and climate ambition would look like and run it on top of the targets. The CAP 2014-2020 is reflected in the model as follows.
The Basic Payment Scheme (BPS) and the Single Area Payment Scheme (SAPS) are implemented, and there is a possibility to opt for other related payments in accordance with Council Regulation (EC) No 1307/2013. The interaction between premium entitlements and eligible hectares for BPS, SAPS and other payments remains explicitly considered. MS specific notifications of changes in the implementation of certain measures (e.g. transfer of subsidies between Pillar I and Pillar II) are fixed at the 2015 level. Naturally, the CAPRI baseline explicitly covers only those direct support measures under the CAP reform 2014–2020 that can be implemented at the national or regional level, such as national ceilings for direct payments, basic payment and voluntary coupled support. Measures that need to be implemented at the farm level (e.g. payment for agricultural practices beneficial to the climate and environment, and voluntary redistributive payments) are only implicitly covered, via the underlying calibration to market projections from the European Commission. Decoupled and coupled direct payments in CAPRI are highly disaggregated, in terms of both regional resolution and production structure. In addition to decoupled support in BPS or SAPS, the Voluntary Coupled Support (VCS) scheme is also implemented in CAPRI. The implementation of VCS in CAPRI is based on MS declarations including both EU and national budget, with most of the VCS premiums targeting the following sectors: beef, dairy, sheep and goat milk, protein crops, fruit and vegetables, sugar beet, cereal, rice and olive oil. The core policy assumptions of the CAP in the current CAPRI baseline are summarised in Table 6.
Table 6. Core CAP assumptions for baseline and scenarios.
PILLAR I Instrument Baseline 2030
Direct payments 2013 reform (partially) implemented Decoupling Basic Payment Scheme
Coupled direct payment options VCS as notified by MS up to 01/08/2014 Redistributive payment Not implemented Young Farmer Scheme Not implemented
Green Payment Granted without restriction (only conversion of permanent
grassland is restricted)
Capping Implemented according to 2013 reform. Capped budget
redistributed over RD measures Convergence Included
PILLAR II Instrument Baseline
Agri-environmental schemes Areas with Natural Constraints (ANC) and Natura 2000 Business Development Grants /
Investment aid Not considered
Common Market Organisation Instrument Baseline
Sugar quotas Abolition of the quota system in 2017 Dairy quotas Quota system expired in 2015
Tariffs, tariff rate quotas Maintained at 2015 implementation level or schedule Export subsidies Not applied in 2030

28
4.2 A CAP legal proposal with enhanced environmental and climate ambition
The CAP legal proposals are currently under discussion between the co-legislators. Moreover, the new delivery model leaves ample responsibilities to MS to choose specific interventions in response to their needs assessment. Therefore, the final details of the final CAP post 2020 are not yet known. Based on discussions between DG AGRI and the JRC, the JRC has constructed a scenario that would reflect an implementation of the CAP LP to capture enhanced environmental and climate ambition. This CAP LP incorporates the aspirational targets of the F2F and BDS strategies as published, and therefore these targets are implemented following the same logic as described in section 4.3.
The description of the F2F and BDS targets & CAP LP scenario focuses on three main areas: assumptions regarding the budget; assumptions regarding the new green architecture and other elements. We also highlight the measures included in the CAP LP that cannot be captured in the scenario due to specific characteristics of the CAPRI model.
4.2.1 Budget
Negotiations regarding the final Multi-annual Financial Framework (MFF) were still ongoing while this report was finalized. In order to model the CAP post 2020 assumptions had to be made regarding how the final agreement between the co-legislators would end. The CAP budget assumed in the scenarios reflects the figures in the 2018 proposals for the Multi-Annual Financial Framework (MFF) and incorporates the additional budget proposed for CAP on 27 May 2020 for the CAP LP + NGEU scenario using assumptions about technology adoption costs (see section 4.2.2). For the EU-27, they amount to EUR 36.8 million in direct payments and EUR 12.4 million in rural development, after assumed transfers between pillars. Based on these figures the following allocations of payments are assumed:
25% of the direct payment budget is allocated to eco-schemes (ECS)
30% of the rural development budget is allocated to Agro-environmental and climate measures6.
voluntary coupled support is limited to extensive livestock, some fruits and vegetables (as a proxy for supporting improved pesticide management) as well as protein crops (for which the additional 2% of direct payments is maximised).
The final decisions on the budget can lead to different CAP budgets and requirements that would affect significantly the reported results.
4.2.2 New green architecture
The new green architecture involves mandatory elements (enhanced conditionality) and voluntary measures (incentivised via ECS and AECMs). With regards to mandatory measures, one of the main changes in the green architecture under the CAP LP is that there will be no exemptions to conditionality. In addition, unlike the CAP 2014-2020, the 30% of rural development funds allocated to AECMs does not include payments for Areas with Natural Constraints (ANCs) trying to account only for measures that are designed to contribute to environmental targets. An overview of the relationship between the new architecture and the budget allocated is presented in Table 7. It should be mentioned that from a modelling perspective, when quantifying the impact of the introduction of voluntary measures CAPRI cannot distinguish the source of funds for most measures (ECS or AECMs) as they could be funded by both instruments. Therefore we consider both groups of measures under a common heading of voluntary measures.
6 Article 86(2) in EC (2018a) states that this percentage of RDP budget can be used for interventions addressing the specific
environmental and climate objectives. This can be wider than AECMs, however in CAPRI only AECMs are captured. If new interventions are proposed by MS, then additional work is needed to assess how these can (if at all) be captured.
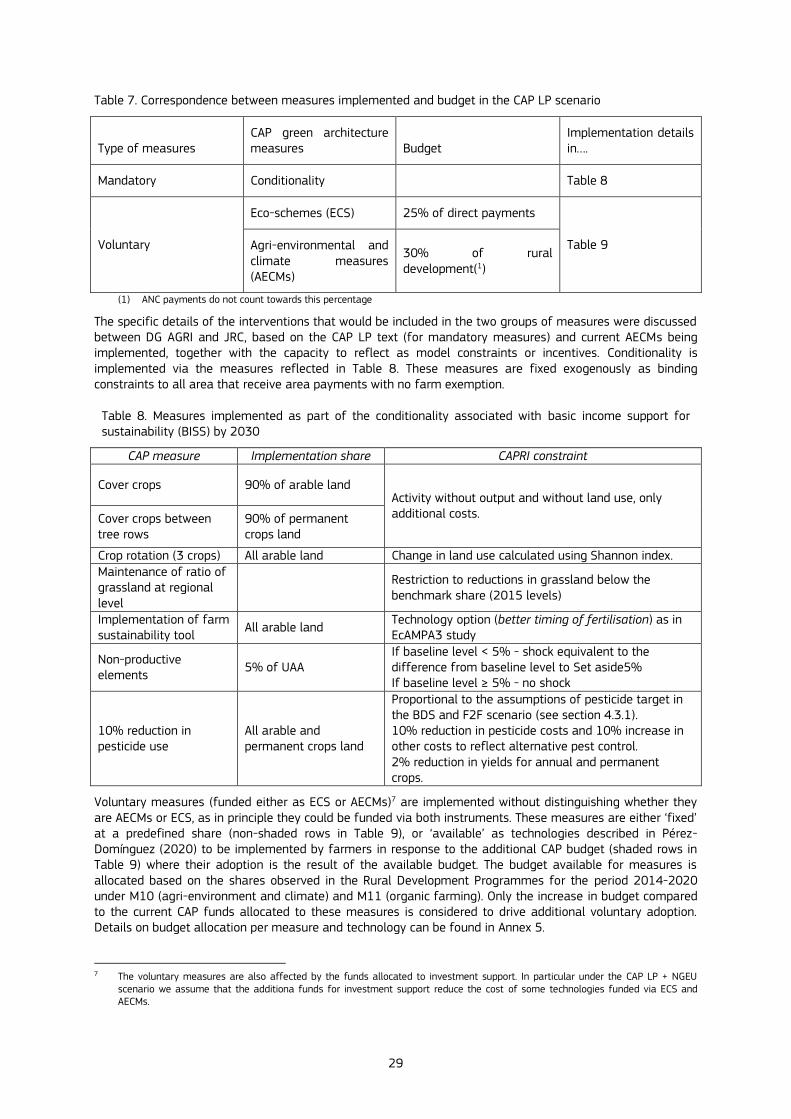
29
Table 7. Correspondence between measures implemented and budget in the CAP LP scenario
Type of measures CAP green architecture measures Budget
Implementation details in….
Mandatory Conditionality Table 8
Voluntary
Eco-schemes (ECS) 25% of direct payments
Table 9 Agri-environmental and climate measures (AECMs)
30% of rural development(1)
(1) ANC payments do not count towards this percentage
The specific details of the interventions that would be included in the two groups of measures were discussed between DG AGRI and JRC, based on the CAP LP text (for mandatory measures) and current AECMs being implemented, together with the capacity to reflect as model constraints or incentives. Conditionality is implemented via the measures reflected in Table 8. These measures are fixed exogenously as binding constraints to all area that receive area payments with no farm exemption.
Table 8. Measures implemented as part of the conditionality associated with basic income support for sustainability (BISS) by 2030
CAP measure Implementation share CAPRI constraint
Cover crops 90% of arable land Activity without output and without land use, only additional costs. Cover crops between
tree rows 90% of permanent crops land
Crop rotation (3 crops) All arable land Change in land use calculated using Shannon index. Maintenance of ratio of grassland at regional level
Restriction to reductions in grassland below the benchmark share (2015 levels)
Implementation of farm sustainability tool
All arable land Technology option (better timing of fertilisation) as in EcAMPA3 study
Non-productive elements
5% of UAA If baseline level < 5% - shock equivalent to the difference from baseline level to Set aside5% If baseline level ≥ 5% - no shock
10% reduction in pesticide use
All arable and permanent crops land
Proportional to the assumptions of pesticide target in the BDS and F2F scenario (see section 4.3.1). 10% reduction in pesticide costs and 10% increase in other costs to reflect alternative pest control. 2% reduction in yields for annual and permanent crops.
Voluntary measures (funded either as ECS or AECMs)7 are implemented without distinguishing whether they are AECMs or ECS, as in principle they could be funded via both instruments. These measures are either ‘fixed’ at a predefined share (non-shaded rows in Table 9), or ‘available’ as technologies described in Pérez-Domínguez (2020) to be implemented by farmers in response to the additional CAP budget (shaded rows in Table 9) where their adoption is the result of the available budget. The budget available for measures is allocated based on the shares observed in the Rural Development Programmes for the period 2014-2020 under M10 (agri-environment and climate) and M11 (organic farming). Only the increase in budget compared to the current CAP funds allocated to these measures is considered to drive additional voluntary adoption. Details on budget allocation per measure and technology can be found in Annex 5.
7 The voluntary measures are also affected by the funds allocated to investment support. In particular under the CAP LP + NGEU
scenario we assume that the additiona funds for investment support reduce the cost of some technologies funded via ECS and AECMs.
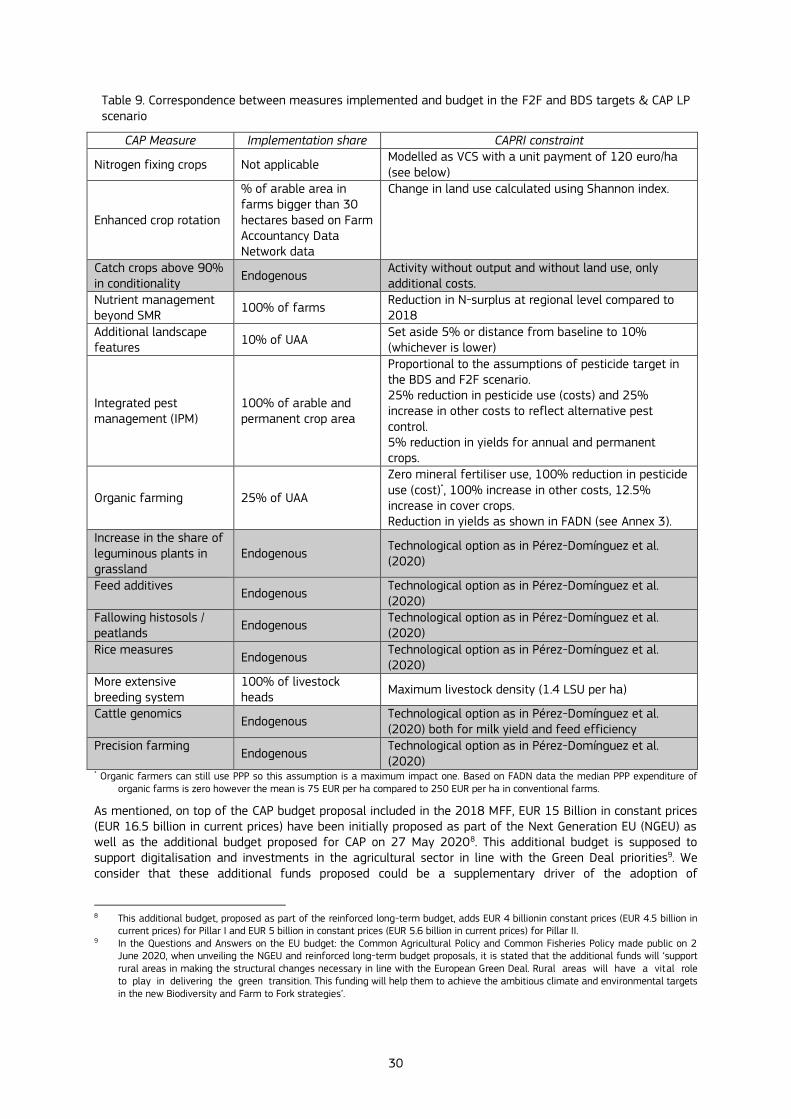
30
Table 9. Correspondence between measures implemented and budget in the F2F and BDS targets & CAP LP scenario
CAP Measure Implementation share CAPRI constraint
Nitrogen fixing crops Not applicable Modelled as VCS with a unit payment of 120 euro/ha (see below)
Enhanced crop rotation
% of arable area in farms bigger than 30 hectares based on Farm Accountancy Data Network data
Change in land use calculated using Shannon index.
Catch crops above 90% in conditionality
Endogenous Activity without output and without land use, only additional costs.
Nutrient management beyond SMR
100% of farms Reduction in N-surplus at regional level compared to 2018
Additional landscape features
10% of UAA Set aside 5% or distance from baseline to 10% (whichever is lower)
Integrated pest management (IPM)
100% of arable and permanent crop area
Proportional to the assumptions of pesticide target in the BDS and F2F scenario. 25% reduction in pesticide use (costs) and 25% increase in other costs to reflect alternative pest control. 5% reduction in yields for annual and permanent crops.
Organic farming 25% of UAA
Zero mineral fertiliser use, 100% reduction in pesticide use (cost)*, 100% increase in other costs, 12.5% increase in cover crops. Reduction in yields as shown in FADN (see Annex 3).
Increase in the share of leguminous plants in grassland
Endogenous Technological option as in Pérez-Domínguez et al. (2020)
Feed additives Endogenous
Technological option as in Pérez-Domínguez et al. (2020)
Fallowing histosols / peatlands
Endogenous Technological option as in Pérez-Domínguez et al. (2020)
Rice measures Endogenous
Technological option as in Pérez-Domínguez et al. (2020)
More extensive breeding system
100% of livestock heads
Maximum livestock density (1.4 LSU per ha)
Cattle genomics Endogenous
Technological option as in Pérez-Domínguez et al. (2020) both for milk yield and feed efficiency
Precision farming Endogenous
Technological option as in Pérez-Domínguez et al. (2020)
* Organic farmers can still use PPP so this assumption is a maximum impact one. Based on FADN data the median PPP expenditure of organic farms is zero however the mean is 75 EUR per ha compared to 250 EUR per ha in conventional farms.
As mentioned, on top of the CAP budget proposal included in the 2018 MFF, EUR 15 Billion in constant prices (EUR 16.5 billion in current prices) have been initially proposed as part of the Next Generation EU (NGEU) as well as the additional budget proposed for CAP on 27 May 20208. This additional budget is supposed to support digitalisation and investments in the agricultural sector in line with the Green Deal priorities9. We consider that these additional funds proposed could be a supplementary driver of the adoption of
8 This additional budget, proposed as part of the reinforced long-term budget, adds EUR 4 billionin constant prices (EUR 4.5 billion in
current prices) for Pillar I and EUR 5 billion in constant prices (EUR 5.6 billion in current prices) for Pillar II. 9 In the Questions and Answers on the EU budget: the Common Agricultural Policy and Common Fisheries Policy made public on 2
June 2020, when unveiling the NGEU and reinforced long-term budget proposals, it is stated that the additional funds will ‘support rural areas in making the structural changes necessary in line with the European Green Deal. Rural areas will have a vital role to play in delivering the green transition. This funding will help them to achieve the ambitious climate and environmental targets in the new Biodiversity and Farm to Fork strategies’.

31
technologies and practices that lead to higher environmental and climate ambition. These additional funds are assumed to support investments. It is estimated that the additional investment could lead to a 30% cost reduction for technologies whose adoption requires upfront investment in capital goods (precision farming, anaerobic digestion, breeding measures and ammonia measures for housing and storage). In addition, the reduction in the adoption cost of the technologies is also justified by increased technological development fostered by the increase in Horizon Europe budget allocation. The impact of these additional budget proposals is analysed with a second CAP LP scenario named F2F and BDS targets & CAP LP + NGEU, which only differs in the cost reduction mentioned.
The translation of additional budget into additional voluntary adoption is the result of an auxiliary scenario. In this auxiliary scenario, the additional budget described above is made available as a subsidy to reduce the cost of the specific technologies. The auxiliary scenario provides as output the endogenous level of adoption that results from the additional budget (Table 10). These levels of adoption are incorporated into the F2F and BDS targets & CAP LP scenario that also includes all other non-technology based measures.
Table 10. Adoption of mitigation technologies and farm practice in the F2F and BDS targets & CAP LP and F2F and BDS targets & CAP LP + NGEU scenarios
Technology
Adoption rate (% of eligible area or heads) Eligible area or heads as % of total
Baseline F2F and BDS
targets & CAP LP
F2F and BDS targets & CAP LP +
NGEU
Catch crops / winter cover 23 31 31 33
Increase in the share of leguminous plants in grassland
0 71 69 100
Feed additives
Low nitrogen feed 0 0 0 56
Lineseed 0 10 10 27
Nitrate 0 4 3 44
Fallowing histosols / peatlands 2 55 49 80
Nitrification inhibitors 0 8 0 61
Rice measures 0 65 65 100
Cattle genomics (1)
Higher milk yield 0 22 31 100
Higher ruminant efficiency
5 10 15 100
Precision farming (1) 0 45 56 61
Anaerobic digestion (1) 2 4 28 36
Low emission housing (1) (2) 12 12 26 40
Cover storage of manure (1) (2) 14 24 31 38
Air purification in animal housing (1) (2)
0 10 14 29
(1) Measures assumed to become less expensive due to investments promoted by NGEU (2) Measures directed at ammonia reduction but with indirect impact on non-C02 GHG
Source: CAPRI auxiliary scenarios
ANC and Natura 2000 payments are only captured in the model as land based payments affecting the income of the sector but not land allocation or any environmental or climate indicator

32
4.2.3 Other elements
Voluntary coupled support
The estimated budget (EUR 2.8 Billion) is allocated to extensive sheep and dairy (suckler cows at 90 euro per animal; ewes and goats at 15 euro per animal; and dairy cows at 90 euro per animal); protein crops (including nitrogen fixing crops as defined for voluntary measures) at 120 euro per ha; and some fruits and vegetables. The split of the total budget reflects the historical decisions of MS during the current CAP. Voluntary coupled support for crops with the potential for bioeconomy is not modelled.
Sectoral interventions
The budget for these interventions is allocated to the specific activities and partly compensates the impact of reducing pesticides by 25% when fully applying IPM or increasing organic production area. No specific impact is assumed on top of these two measures.
Measures from the CAP legal proposal which cannot be captured in the model
Risk management– while the impact of risk management measures is not assessed, it is assumed that the share of rural development support allocated to risk management will be higher than today.
Young farmers – in line with the CAP reform proposals, it is assumed that an amount equivalent to 2% of direct payments is allocated for young farmers
Afforestation –links to the forestry sector and accounting for carbon sequestration from land use change activities are not yet included in the model
Capping - the estimated product of capping is transferred to rural development
Complementary redistributive income support for sustainability (CRISS) – the impact of redistribution at farm level is not modelled; however, assumptions on respective shares of CRISS and eco-schemes are linked, both corresponding to important objectives of CAP reform.
4.3 Farm to Fork and Biodiversity Strategies
As mentioned in section 2.2 the F2F and BDS strategies include a series of targets that have direct impacts on the way agricultural activities are undertaken. In this first exercise we have focused on four of these targets: those related to pesticides, nitrates, landscape elements and organic farming. As the strategies set aspirational targets and leave details of how these will be met to different legislative and non-legislative initiatives to be taken in the upcoming years, the exact wording of the targets leaves some leeway for interpretation on how they will be met. In order to implement these targets into model constraints the first decision to be made is the geographical level at which the target will be met. Based on the model characteristics, the nitrogen target can be modelled as being achieved at regional level, while the pesticide and landscape element targets would be achieved at MS level, and the organic target at EU level. For these three targets, MS-specific levels are calculated based on current levels of implementation, which are then applied homogenously to all regions in the MS (Table 11). In this section, we present the specific details and parameters that have been modified in the CAPRI model to take into account the individual targets, as well as the modifications made to implement the four targets simultaneously. Other targets and initiatives covered in these strategies (see section 2.2) are not part of the analysis but should also be taken into account to gain a more comprehensive vision of the impacts of the strategies.
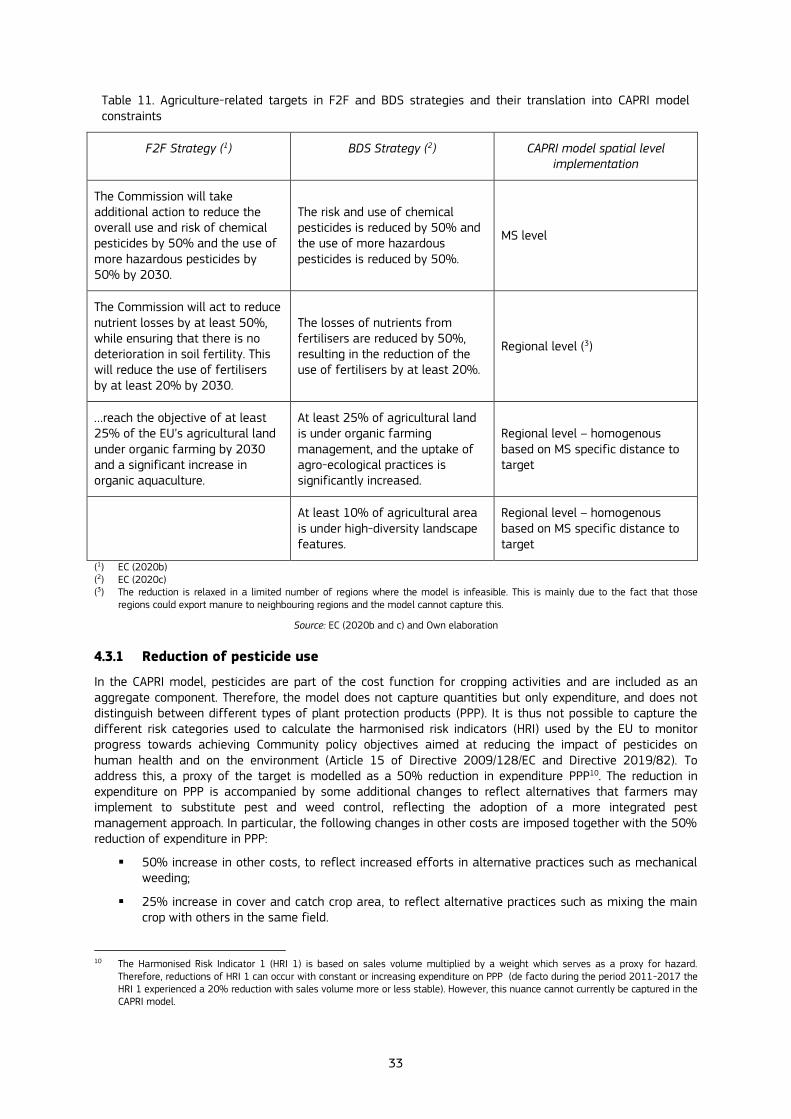
33
Table 11. Agriculture-related targets in F2F and BDS strategies and their translation into CAPRI model constraints
F2F Strategy (1) BDS Strategy (2) CAPRI model spatial level implementation
The Commission will take additional action to reduce the overall use and risk of chemical pesticides by 50% and the use of more hazardous pesticides by 50% by 2030.
The risk and use of chemical pesticides is reduced by 50% and the use of more hazardous pesticides is reduced by 50%.
MS level
The Commission will act to reduce nutrient losses by at least 50%, while ensuring that there is no deterioration in soil fertility. This will reduce the use of fertilisers by at least 20% by 2030.
The losses of nutrients from fertilisers are reduced by 50%, resulting in the reduction of the use of fertilisers by at least 20%.
Regional level (3)
…reach the objective of at least 25% of the EU’s agricultural land under organic farming by 2030 and a significant increase in organic aquaculture.
At least 25% of agricultural land is under organic farming management, and the uptake of agro-ecological practices is significantly increased.
Regional level – homogenous based on MS specific distance to target
At least 10% of agricultural area is under high-diversity landscape features.
Regional level – homogenous based on MS specific distance to target
(1) EC (2020b) (2) EC (2020c) (3) The reduction is relaxed in a limited number of regions where the model is infeasible. This is mainly due to the fact that those
regions could export manure to neighbouring regions and the model cannot capture this.
Source: EC (2020b and c) and Own elaboration
4.3.1 Reduction of pesticide use
In the CAPRI model, pesticides are part of the cost function for cropping activities and are included as an aggregate component. Therefore, the model does not capture quantities but only expenditure, and does not distinguish between different types of plant protection products (PPP). It is thus not possible to capture the different risk categories used to calculate the harmonised risk indicators (HRI) used by the EU to monitor progress towards achieving Community policy objectives aimed at reducing the impact of pesticides on human health and on the environment (Article 15 of Directive 2009/128/EC and Directive 2019/82). To address this, a proxy of the target is modelled as a 50% reduction in expenditure PPP10. The reduction in expenditure on PPP is accompanied by some additional changes to reflect alternatives that farmers may implement to substitute pest and weed control, reflecting the adoption of a more integrated pest management approach. In particular, the following changes in other costs are imposed together with the 50% reduction of expenditure in PPP:
50% increase in other costs, to reflect increased efforts in alternative practices such as mechanical weeding;
25% increase in cover and catch crop area, to reflect alternative practices such as mixing the main crop with others in the same field.
10 The Harmonised Risk Indicator 1 (HRI 1) is based on sales volume multiplied by a weight which serves as a proxy for hazard.
Therefore, reductions of HRI 1 can occur with constant or increasing expenditure on PPP (de facto during the period 2011-2017 the HRI 1 experienced a 20% reduction with sales volume more or less stable). However, this nuance cannot currently be captured in the CAPRI model.
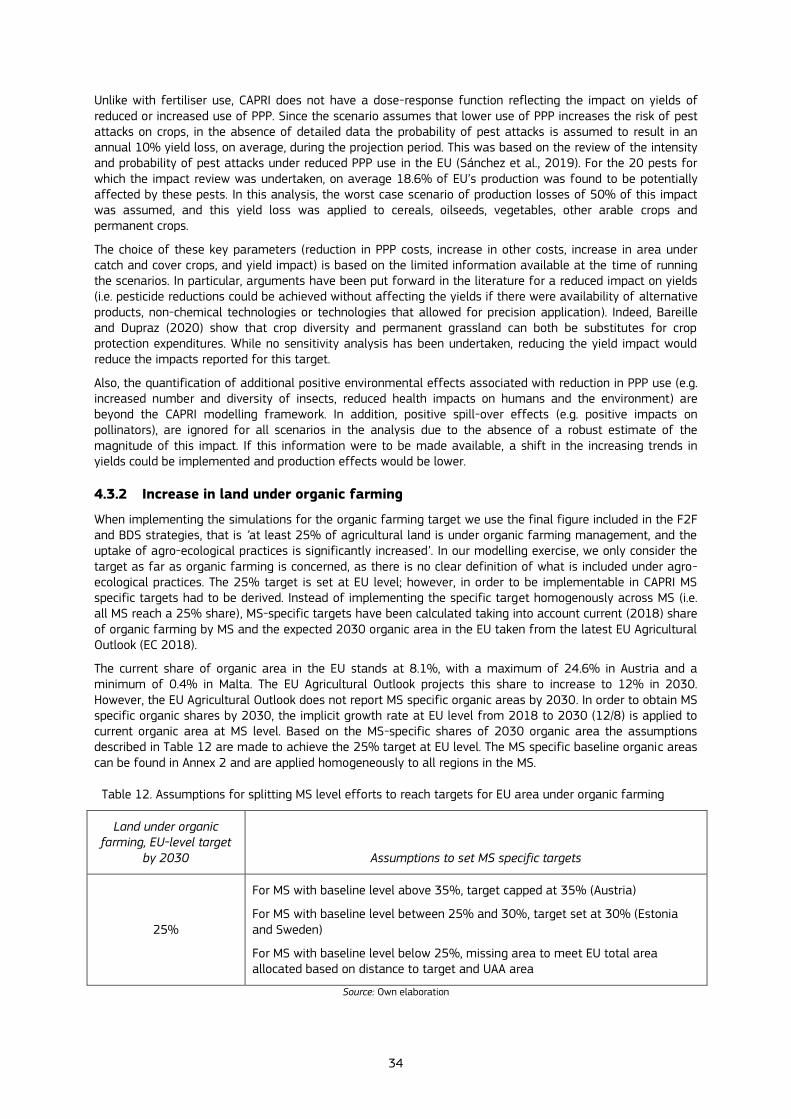
34
Unlike with fertiliser use, CAPRI does not have a dose-response function reflecting the impact on yields of reduced or increased use of PPP. Since the scenario assumes that lower use of PPP increases the risk of pest attacks on crops, in the absence of detailed data the probability of pest attacks is assumed to result in an annual 10% yield loss, on average, during the projection period. This was based on the review of the intensity and probability of pest attacks under reduced PPP use in the EU (Sánchez et al., 2019). For the 20 pests for which the impact review was undertaken, on average 18.6% of EU’s production was found to be potentially affected by these pests. In this analysis, the worst case scenario of production losses of 50% of this impact was assumed, and this yield loss was applied to cereals, oilseeds, vegetables, other arable crops and permanent crops.
The choice of these key parameters (reduction in PPP costs, increase in other costs, increase in area under catch and cover crops, and yield impact) is based on the limited information available at the time of running the scenarios. In particular, arguments have been put forward in the literature for a reduced impact on yields (i.e. pesticide reductions could be achieved without affecting the yields if there were availability of alternative products, non-chemical technologies or technologies that allowed for precision application). Indeed, Bareille and Dupraz (2020) show that crop diversity and permanent grassland can both be substitutes for crop protection expenditures. While no sensitivity analysis has been undertaken, reducing the yield impact would reduce the impacts reported for this target.
Also, the quantification of additional positive environmental effects associated with reduction in PPP use (e.g. increased number and diversity of insects, reduced health impacts on humans and the environment) are beyond the CAPRI modelling framework. In addition, positive spill-over effects (e.g. positive impacts on pollinators), are ignored for all scenarios in the analysis due to the absence of a robust estimate of the magnitude of this impact. If this information were to be made available, a shift in the increasing trends in yields could be implemented and production effects would be lower.
4.3.2 Increase in land under organic farming
When implementing the simulations for the organic farming target we use the final figure included in the F2F and BDS strategies, that is ’at least 25% of agricultural land is under organic farming management, and the uptake of agro-ecological practices is significantly increased’. In our modelling exercise, we only consider the target as far as organic farming is concerned, as there is no clear definition of what is included under agro-ecological practices. The 25% target is set at EU level; however, in order to be implementable in CAPRI MS specific targets had to be derived. Instead of implementing the specific target homogenously across MS (i.e. all MS reach a 25% share), MS-specific targets have been calculated taking into account current (2018) share of organic farming by MS and the expected 2030 organic area in the EU taken from the latest EU Agricultural Outlook (EC 2018).
The current share of organic area in the EU stands at 8.1%, with a maximum of 24.6% in Austria and a minimum of 0.4% in Malta. The EU Agricultural Outlook projects this share to increase to 12% in 2030. However, the EU Agricultural Outlook does not report MS specific organic areas by 2030. In order to obtain MS specific organic shares by 2030, the implicit growth rate at EU level from 2018 to 2030 (12/8) is applied to current organic area at MS level. Based on the MS-specific shares of 2030 organic area the assumptions described in Table 12 are made to achieve the 25% target at EU level. The MS specific baseline organic areas can be found in Annex 2 and are applied homogeneously to all regions in the MS.
Table 12. Assumptions for splitting MS level efforts to reach targets for EU area under organic farming
Land under organic farming, EU-level target
by 2030 Assumptions to set MS specific targets
25%
For MS with baseline level above 35%, target capped at 35% (Austria)
For MS with baseline level between 25% and 30%, target set at 30% (Estonia and Sweden)
For MS with baseline level below 25%, missing area to meet EU total area allocated based on distance to target and UAA area
Source: Own elaboration
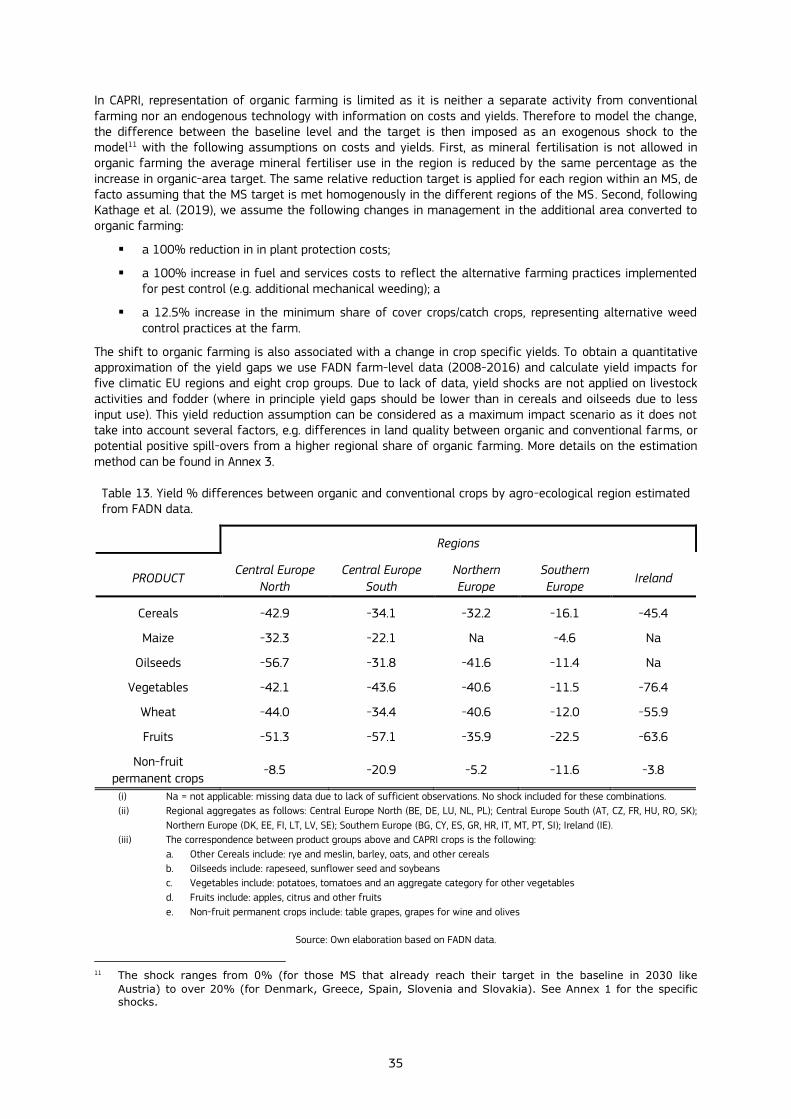
35
In CAPRI, representation of organic farming is limited as it is neither a separate activity from conventional farming nor an endogenous technology with information on costs and yields. Therefore to model the change, the difference between the baseline level and the target is then imposed as an exogenous shock to the model11 with the following assumptions on costs and yields. First, as mineral fertilisation is not allowed in organic farming the average mineral fertiliser use in the region is reduced by the same percentage as the increase in organic-area target. The same relative reduction target is applied for each region within an MS, de facto assuming that the MS target is met homogenously in the different regions of the MS. Second, following Kathage et al. (2019), we assume the following changes in management in the additional area converted to organic farming:
a 100% reduction in in plant protection costs;
a 100% increase in fuel and services costs to reflect the alternative farming practices implemented for pest control (e.g. additional mechanical weeding); a
a 12.5% increase in the minimum share of cover crops/catch crops, representing alternative weed control practices at the farm.
The shift to organic farming is also associated with a change in crop specific yields. To obtain a quantitative approximation of the yield gaps we use FADN farm-level data (2008-2016) and calculate yield impacts for five climatic EU regions and eight crop groups. Due to lack of data, yield shocks are not applied on livestock activities and fodder (where in principle yield gaps should be lower than in cereals and oilseeds due to less input use). This yield reduction assumption can be considered as a maximum impact scenario as it does not take into account several factors, e.g. differences in land quality between organic and conventional farms, or potential positive spill-overs from a higher regional share of organic farming. More details on the estimation method can be found in Annex 3.
Table 13. Yield % differences between organic and conventional crops by agro-ecological region estimated from FADN data.
Regions
PRODUCT Central Europe
North
Central Europe
South
Northern
Europe
Southern
Europe Ireland
Cereals -42.9 -34.1 -32.2 -16.1 -45.4
Maize -32.3 -22.1 Na -4.6 Na
Oilseeds -56.7 -31.8 -41.6 -11.4 Na
Vegetables -42.1 -43.6 -40.6 -11.5 -76.4
Wheat -44.0 -34.4 -40.6 -12.0 -55.9
Fruits -51.3 -57.1 -35.9 -22.5 -63.6
Non-fruit
permanent crops -8.5 -20.9 -5.2 -11.6 -3.8
(i) Na = not applicable: missing data due to lack of sufficient observations. No shock included for these combinations.
(ii) Regional aggregates as follows: Central Europe North (BE, DE, LU, NL, PL); Central Europe South (AT, CZ, FR, HU, RO, SK);
Northern Europe (DK, EE, FI, LT, LV, SE); Southern Europe (BG, CY, ES, GR, HR, IT, MT, PT, SI); Ireland (IE).
(iii) The correspondence between product groups above and CAPRI crops is the following:
a. Other Cereals include: rye and meslin, barley, oats, and other cereals
b. Oilseeds include: rapeseed, sunflower seed and soybeans
c. Vegetables include: potatoes, tomatoes and an aggregate category for other vegetables
d. Fruits include: apples, citrus and other fruits
e. Non-fruit permanent crops include: table grapes, grapes for wine and olives
Source: Own elaboration based on FADN data.
11 The shock ranges from 0% (for those MS that already reach their target in the baseline in 2030 like
Austria) to over 20% (for Denmark, Greece, Spain, Slovenia and Slovakia). See Annex 1 for the specific shocks.
36
It should be noted that the assumptions on yield gaps used in the scenario construction have some limitations. While these shocks are similar to those reported for a fully-fledged conversion to organic farming in the UK and Wales by Smith et al (2018), recent large scale meta-analyses report yield gaps between organic and conventional farming is estimated lower the ones derived from FADN analysis, being overall around 20% (de Ponti et al., 2012; Seufert et al., 2012; Ponisio et al., 2014; Smith et al., 2020). There is also evidence that current application of more environmentally friendly farming practices in Europe, including organic farming, are occurring to a greater extent in more marginal, extensive areas where the intrinsic yield potential is lower compared to highly producing areas (Spaziante et al., 2012; Uthes and Mazdorf, 2013). The obtained results from FADN are likely to reflect these aspects. Therefore, results have to be interpreted as exploratory and have to be taken with care. The production of robust evidence on the relation between performance indicators in agriculture and organic farming would require a more careful, dedicated study.
Moreover, there are spill-overs from this conversion at a considerable scale that have not been captured due to lack of data. First, organic farming is associated with higher species richness that could have a positive impact on ecosystem services such as pollinators (Tuck et al., 2014). This increase could lead to higher yields in the rest of the agricultural area similar to the case of reduced pesticide use. Second, a change at this scale could lead to improved performance of organic farming due to improved technology development, technology diffusion and improved skills12.
Again, due to lack of robust data, we could not incorporate these aspects. In both cases, the magnitude of the yield gap would be lower; however, we cannot assess by how much it would be reduced.
In addition, as a response to the limitation in mineral fertiliser use, farmers may change their farming practices by adopting technological options that increase nitrogen efficiency. Considering that organic farmers need to deal more carefully with nutrients in order to avoid the additional import of nitrogen via mineral fertilisers or feed, technologies such as “better timing of fertilizers” or “precision farming” may approximately reflect the costs farmers are facing to avoid the loss of nutrients.
The fact that organic farming is not a separate activity also means that organic production does not face market incentives due to higher prices. However, the price differential currently observed in the market for organic products would probably be reduced when achieving such a high share of total production as those envisaged in the modelled target. In any case, the introduction of higher prices for organic produce both in the EU and world markets would mean that the production of the EU would not need to compete with conventional production and therefore the impact on the competitiveness of the EU production would be lower.
4.3.3 Increase of area under high-diversity landscape features
The increase of area under high-diversity landscape features is modelled as a requirement for increase in non-productive land (fallow land) in each MS as landscape features are not a land-use category in the model. The area under fallow has a zero gross nitrogen balance because there are no inputs or outputs defined for the fallow land activity. The 10% target is translated into an exogenous shock, taking into account the current levels of fallow land taken from Eurostat and the area equivalents of linear landscape elements derived from the Land Use Cover Area frame Survey (LUCAS) as estimated by the JRC (for details see EC 2018d). At EU level, this means there is already 4.1% of total UAA as fallow and 0.6% of UAA covered by linear landscape elements13. Therefore, the additional area needed to meet the target is 5.3% of total area. The distance to target is calculated at MS level taking into account their 2018 levels and implemented homogenously in all regions (see Annex 4).
Two aspects of the capacity to mimic this target in CAPRI may have an impact on the results obtained. First, the scenario does not capture spill-over effects to the rest of the UAA related to increasing yields due to the
12 A preliminary analysis of FADN data shows a small negative correlation between the size of the organic area in a region and the
yield gap between organic and conventional farms. However, this correlation is not significant. Further analysis is needed to obtain a robust estimate of this potential effect.
13 The methodology used for converting linear landcape elements into area is based on the LUCAS transect survey of 2015. This approach is not exempt of bias. The main potential source of bias is the difficulty in attributing LUCAS-reported linear landscape elemnts as part of UAA or not. An initial set of rules to attribute observations, roughly classifies 40% as withiin the UAA and 45% outside, with around 15% of dubious cases. This 15% clearly represents a major source of uncertainty. In addition, it only considers linear features at least 20 metres long, and standard conversion factors from length to width used are based on EFA standard conversion factors. Currently, the JRC is contributing to the development of a European monitoring system on landscape features within the LUCAS framework, which would overcome these limitations. As no better estimate is available, this source was used as not to underestimate the baseline level and therefore overestimate the impact of reaching the target.
37
potential for regulating ecosystem services such as pollination and natural pest control being enhanced by the presence of semi-natural vegetation and set aside areas14. Also, by implementing the increase in high-diversity landscape features homogenously at regional level, we miss the flexibility in allocating the impacts within the regions of a specific country. This could allow more fallow land in less productive regions, reducing the impacts on overall production. As a result, the results obtained will tend to overestimate the yield decrease due to this policy target. However, if impacts were concentrated on one or a few regions of a country, regions with already lower productivity/profitability might be affected more in terms of economic effects, and the environmental benefits would not be reached in high productive areas. Last, by considering only fallow as the option to provide landscape features we miss the potential benefits of alternative non-productive landscape features (such as woody features and wetland rehabilitation) related to increased carbon sequestration.
4.3.4 Reduction in gross nitrogen surplus
The reduction in nutrient losses is implemented as a reduction in the gross nitrogen balance (GNB) in CAPRI. Flows for phosphorus and potassium are not available. The reduction is implemented at regional (NUTS2) level and forces the model to deliver a reduction from the baseline projected GNB for 2030 that reflects the ambition of the target set in the F2F and BDS strategies. The wording of the target in the strategies presented in Table 11 is not the same in the two strategies. We base our assumptions on the description in the F2F strategy ‘the Commission will act to reduce nutrient losses by at least 50%, while ensuring that there is no deterioration in soil fertility. This will reduce the use of fertilisers by at least 20% by 2030’. Rather than imposing a reduction in fertiliser input, we choose to represent the output (reduction in nutrient losses) as the CAPRI model calculates GNB, which represents the excess nutrient that can be associated with losses (see section 3.1).
Implementing a homogenous 50% reduction would fail to capture the safeguard of not reducing soil fertility, so the region-specific targets were calculated using two approaches. First, the contribution of each region to the EU target was calculated as the difference between the actual surplus and the projected surplus if efficiency in the use of N increases from the current value to a threshold value of efficiency equal to 75%. This threshold value for nitrogen use efficiency is within the range of the maximum level recorded worldwide (Reddy and Reddy, 1993: Ciampitti and Vyn, 2012; Mirloy et al, 2019) and also within the desirable range assessed by experts in the field with the technologies currently available (EUNEP, 2017). This led to an EU-wide reduction of 42%, with a maximum region-specific reduction of 91% and several regions (those with low baseline GNB) being allowed to increase their GNB. Second, a gradual reduction target was applied15. This led to an EU-wide reduction of 36%, with a maximum region-specific reduction of 87% and a low of 25% for regions with baseline GNB below 50 kg/ha. The latter approach was chosen for implementation in the scenario. When implementing this approach, the target for nine regions with high GNB values in the baseline associated with high animal numbers, generated infeasibilities in the model. Due to the limitations mentioned below, the reduction target for these regions were set at the EU average (36%).
Imposing the reduction also drives the activation of technologies that can increase nitrogen use efficiency. The CAPRI model version used for this simulation is able to model the adoption of mitigation technologies that also have an impact on nitrogen use (precision farming; variable rate technology; better timing of fertilization; nitrification inhibitors; and low nitrogen feed). The baseline adoption rates for these technologies are assumed to be zero. Specific details on the costs and impacts of these technologies can be found in Pérez-Domínguez et al. (2016).
Again, the assumptions are based on the best available knowledge and constrained by the model’s capacities. In particular, three main issues that cannot currently be implemented in the model have an impact on the results. First, baseline adoption of the technologies is assumed to be zero, when this may not be the case. There are no data available on current adoption of the technologies, so the only option available is to set them at zero. If data were available, and an adoption rate higher than zero at the baseline could be implemented, the nutrient surplus reductions in the model results due to technological adoption would be overestimated, and part of the mitigation only possible through changing areas or numbers of heads. Thus,
14 See Bareille and Dupraz (2020) for an analysis of the productivity impacts of crop diversity and permanent grassland on cereal and
milk yields, using FADN data for mixed crop-livestock farming in north-western France. In particular, they conclude that ‘permanent grassland proportion increased cereal yields when crop diversity was low, highlighting some productive spill over effects of semi-natural areas on arable lands’.
15 A reduction factor of 25% was applied to the first 50 kg/ha of GNB, 50% for 50-100 kg/ha GNB, 75% for 100-150 kg/ha GNB and 100% to kg/ha above 150.

38
impacts on production would be higher. Second, the baseline does not guarantee that current EU-level legal obligations are met (i.e. the Nitrates Directive - in particular the gross nutrient surplus that does not cause water pollution in Nitrate Vulnerable Zones; the Habitats Directive; and the Water Framework Directive) nor other more restrictive national legislation (i.e. NL and DE). Therefore, we cannot separate the total impact into these two components (meeting existing legislation and reaching the nitrogen reduction target set in the F2F and BDS strategies). Therefore, the impact reflects both of these; not only the target from the F2F and BDS strategies. Last, the model assumes that all manure generated in a region has to be used within that region. There is evidence that livestock-intensive regions process and/or export their manure to neighbouring regions with lower nitrogen loads. Therefore, the GNB for these regions is overestimated and impacts on animal numbers would be lower for them were we able to capture the trade in manure. Overall, we are not in a position to evaluate whether the aggregated impact of these three limitations would increase or decrease the impact on production obtained.
4.3.5 Modifications needed to the assumptions when implementing the four targets
simultaneously
In order to implement the four individual targets simultaneously we need to take into account the interaction between the assumptions made for each target. These are summarised in Table 14. For example, achievement of the landscape elements target contributes to the reduction in pesticide use, and to the reduction in N-surplus (GNB), as it reduces crop production. However, some stand-alone scenario assumptions overlap, and their interaction is not straightforward to interpret. This holds, in particular, for the overlapping assumptions in the organic and pesticide scenarios.
The representation of both targets affects some parameters simultaneously. In particular for both scenarios we impose:
reductions in pesticide use;
changes in other production costs;
changes in yields;
setting a minimum requirement for catch and cover crop areas.
The synergies between the pesticide and organic scenario assumptions is modelled as follows. We first compare what the assumed expansion of the organic area achieves in terms of pesticide reduction to the pesticide reduction target. Note that the reduction target in the pesticide scenario is set to the whole agricultural sector (both organic and conventional farms). Therefore, we calculate a pesticide reduction target for the conventional agriculture, by subtracting the pesticide reduction already achieved by the organic farms from the original target. Then, the reduction target for the pesticide scenario (for the whole agriculture) is scaled (decreased) to avoid double-counting (i.e. we avoid erroneously forcing conventional farms to meet the reduction that was already achieved by organic farms). The scaling of the original target reflects the assumption that conventional agriculture will only decrease its pesticide use to the extent to meet the target for the whole agriculture. For consistency reasons, the adjustments to costs, yields and cover crop areas are also re-scaled in line with the relative decrease in the pesticide reduction target.
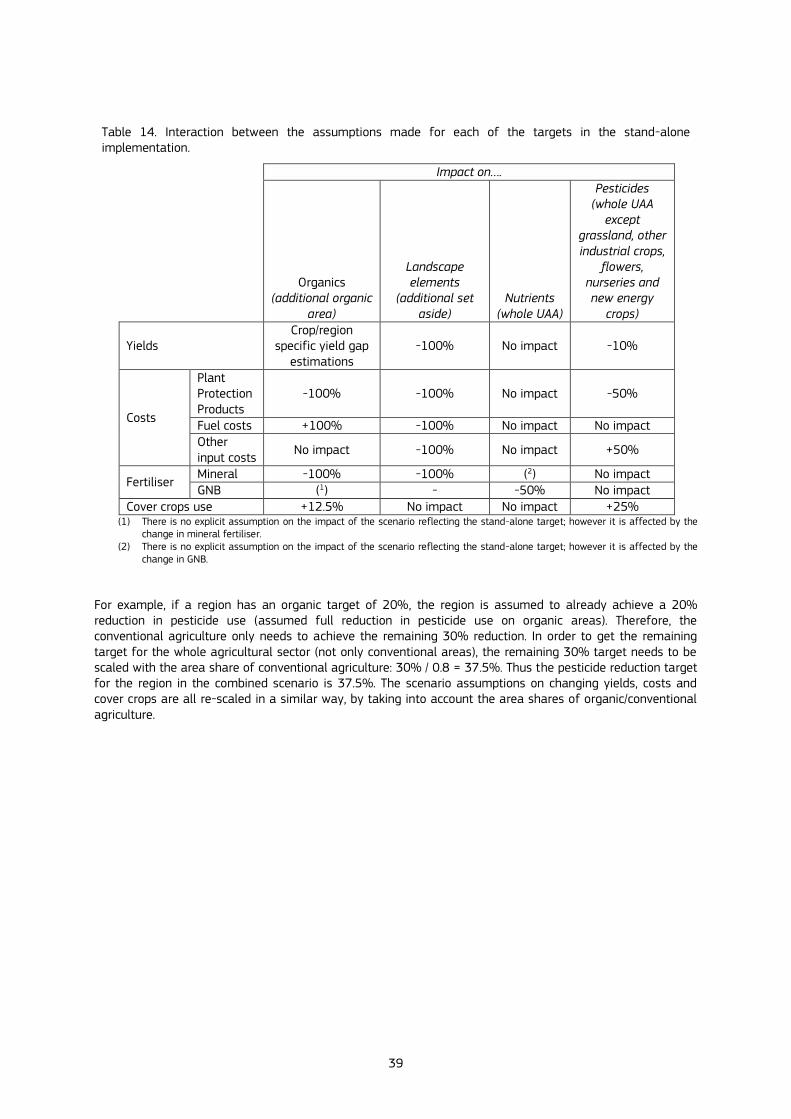
39
Table 14. Interaction between the assumptions made for each of the targets in the stand-alone implementation.
Impact on….
Organics (additional organic
area)
Landscape elements
(additional set aside)
Nutrients (whole UAA)
Pesticides (whole UAA
except grassland, other industrial crops,
flowers, nurseries and new energy
crops)
Yields Crop/region
specific yield gap estimations
-100% No impact -10%
Costs
Plant Protection Products
-100% -100% No impact -50%
Fuel costs +100% -100% No impact No impact Other input costs
No impact -100% No impact +50%
Fertiliser Mineral -100% -100% (2) No impact GNB (1) - -50% No impact
Cover crops use +12.5% No impact No impact +25% (1) There is no explicit assumption on the impact of the scenario reflecting the stand-alone target; however it is affected by the
change in mineral fertiliser. (2) There is no explicit assumption on the impact of the scenario reflecting the stand-alone target; however it is affected by the
change in GNB.
For example, if a region has an organic target of 20%, the region is assumed to already achieve a 20% reduction in pesticide use (assumed full reduction in pesticide use on organic areas). Therefore, the conventional agriculture only needs to achieve the remaining 30% reduction. In order to get the remaining target for the whole agricultural sector (not only conventional areas), the remaining 30% target needs to be scaled with the area share of conventional agriculture: 30% / 0.8 = 37.5%. Thus the pesticide reduction target for the region in the combined scenario is 37.5%. The scenario assumptions on changing yields, costs and cover crops are all re-scaled in a similar way, by taking into account the area shares of organic/conventional agriculture.
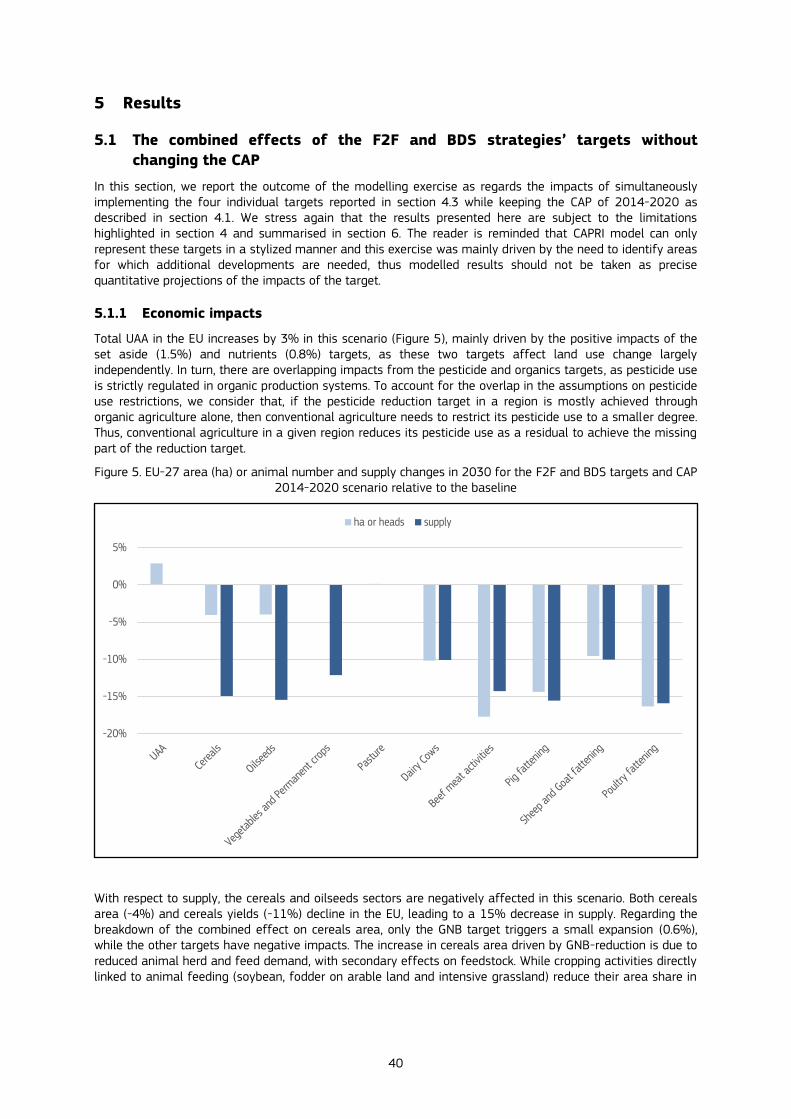
40
5 Results
5.1 The combined effects of the F2F and BDS strategies’ targets without
changing the CAP
In this section, we report the outcome of the modelling exercise as regards the impacts of simultaneously implementing the four individual targets reported in section 4.3 while keeping the CAP of 2014-2020 as described in section 4.1. We stress again that the results presented here are subject to the limitations highlighted in section 4 and summarised in section 6. The reader is reminded that CAPRI model can only represent these targets in a stylized manner and this exercise was mainly driven by the need to identify areas for which additional developments are needed, thus modelled results should not be taken as precise quantitative projections of the impacts of the target.
5.1.1 Economic impacts
Total UAA in the EU increases by 3% in this scenario (Figure 5), mainly driven by the positive impacts of the set aside (1.5%) and nutrients (0.8%) targets, as these two targets affect land use change largely independently. In turn, there are overlapping impacts from the pesticide and organics targets, as pesticide use is strictly regulated in organic production systems. To account for the overlap in the assumptions on pesticide use restrictions, we consider that, if the pesticide reduction target in a region is mostly achieved through organic agriculture alone, then conventional agriculture needs to restrict its pesticide use to a smaller degree. Thus, conventional agriculture in a given region reduces its pesticide use as a residual to achieve the missing part of the reduction target.
Figure 5. EU-27 area (ha) or animal number and supply changes in 2030 for the F2F and BDS targets and CAP 2014-2020 scenario relative to the baseline
With respect to supply, the cereals and oilseeds sectors are negatively affected in this scenario. Both cereals area (-4%) and cereals yields (-11%) decline in the EU, leading to a 15% decrease in supply. Regarding the breakdown of the combined effect on cereals area, only the GNB target triggers a small expansion (0.6%), while the other targets have negative impacts. The increase in cereals area driven by GNB-reduction is due to reduced animal herd and feed demand, with secondary effects on feedstock. While cropping activities directly linked to animal feeding (soybean, fodder on arable land and intensive grassland) reduce their area share in
-20%
-15%
-10%
-5%
0%
5%
ha or heads supply

41
arable land, most cereal activities slightly increase their land use shares16. Nevertheless, the dominant impact from the different targets in area for cereals stems from landscape elements (causing a -9% decrease in area), with a significant part of the arable land switching to set aside (or other non-productive use), thus leading to a decline in total cereal area. However, the overall effect is compensated by increase in cereal areas to compensate lower yields from shifts to organic and lower pesticide use production methods.
Although the areas for vegetables and permanent crops remain stable in the scenario (+0.1%), their supply decreases by 12%. This is explained by the drop in yields, mostly due to the organic yield gap, while land use (cross) effects from the arable sector positively affect the impact of GNB target on fruit and vegetable areas.
Finally, in the livestock sector, the GNB-reduction target dominates the simulated impacts on animal herds. Animal herds are reduced to decrease the manure output and to trigger an improvement in the nitrogen balance. Consequently, meat supply decreases by about 14% and raw milk supply by 10%.
The estimated changes in domestic supply reported above would lead to adjustments in commodity trade flows (Figure 6). The EU net trade position for cereals is worsening, due to the combination of larger imports (+39%, substituting EU domestic production) and smaller exports (-38%, as domestic supply drops of -22% and higher EU prices become less competitive). Notwithstanding, the EU remains a net exporter for cereals. According to these results, EU oilseed imports would increase significantly, driven by a substitution of domestically produced oilseeds with imported ones. As EU oilseed production decreases more rapidly than demand due to the direct impact of targets, imported oilseed get a higher share in the market balance. A large share of the increasing oilseeds imports is rapeseed from Canada and Ukraine. The large decrease in feed demand reduces the import of oil cakes significantly (mainly soybean cakes for feeding). EU imports from the biggest trade partners all decrease (Mercosur countries by 18%, USA by 35% and Russia by 24%).
16 Such cross-effects between the individual targets (in this case a substitution effect between arable crops) often complicate the
break-down of the combined effects. Therefore, the relative change in the combined scenario could differ from a simple linear aggregate of the effects simulated in the stand-alone scenarios.
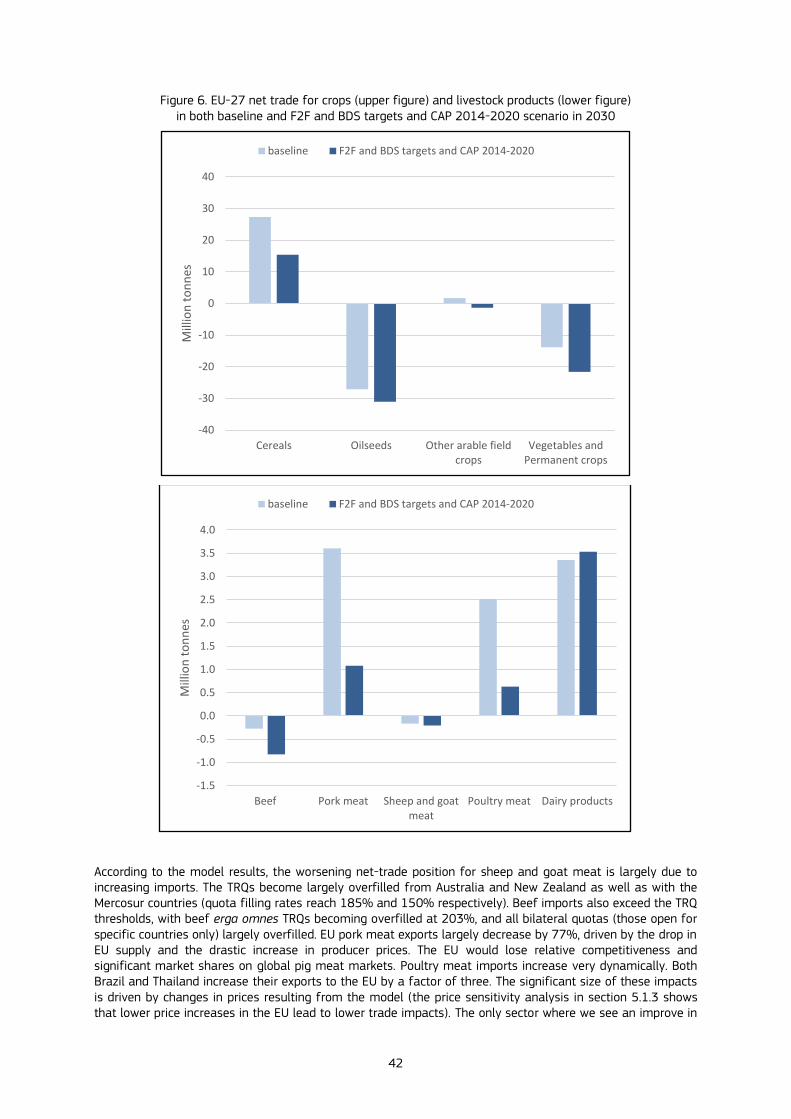
42
Figure 6. EU-27 net trade for crops (upper figure) and livestock products (lower figure) in both baseline and F2F and BDS targets and CAP 2014-2020 scenario in 2030
According to the model results, the worsening net-trade position for sheep and goat meat is largely due to increasing imports. The TRQs become largely overfilled from Australia and New Zealand as well as with the Mercosur countries (quota filling rates reach 185% and 150% respectively). Beef imports also exceed the TRQ thresholds, with beef erga omnes TRQs becoming overfilled at 203%, and all bilateral quotas (those open for specific countries only) largely overfilled. EU pork meat exports largely decrease by 77%, driven by the drop in EU supply and the drastic increase in producer prices. The EU would lose relative competitiveness and significant market shares on global pig meat markets. Poultry meat imports increase very dynamically. Both Brazil and Thailand increase their exports to the EU by a factor of three. The significant size of these impacts is driven by changes in prices resulting from the model (the price sensitivity analysis in section 5.1.3 shows that lower price increases in the EU lead to lower trade impacts). The only sector where we see an improve in
-40
-30
-20
-10
0
10
20
30
40
Cereals Oilseeds Other arable fieldcrops
Vegetables andPermanent crops
Mill
ion
to
nn
es
baseline F2F and BDS targets and CAP 2014-2020
-1.5
-1.0
-0.5
0.0
0.5
1.0
1.5
2.0
2.5
3.0
3.5
4.0
Beef Pork meat Sheep and goatmeat
Poultry meat Dairy products
Mill
ion
to
nn
es
baseline F2F and BDS targets and CAP 2014-2020
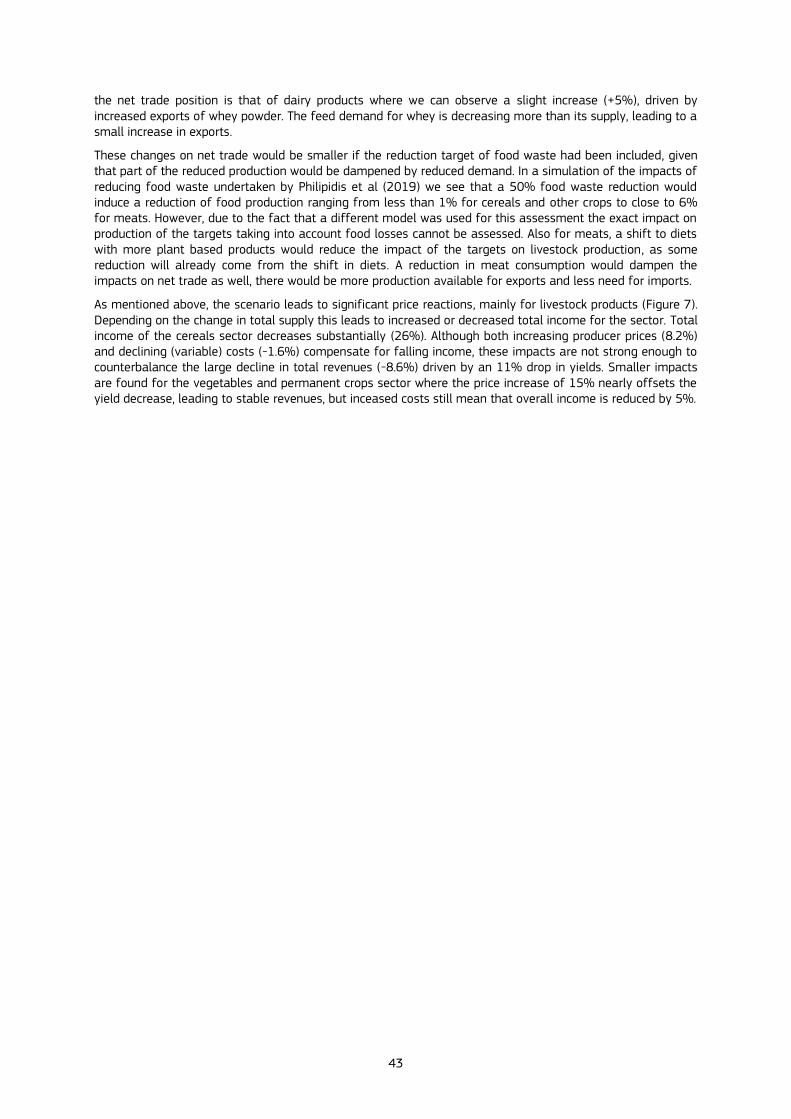
43
the net trade position is that of dairy products where we can observe a slight increase (+5%), driven by increased exports of whey powder. The feed demand for whey is decreasing more than its supply, leading to a small increase in exports.
These changes on net trade would be smaller if the reduction target of food waste had been included, given that part of the reduced production would be dampened by reduced demand. In a simulation of the impacts of reducing food waste undertaken by Philipidis et al (2019) we see that a 50% food waste reduction would induce a reduction of food production ranging from less than 1% for cereals and other crops to close to 6% for meats. However, due to the fact that a different model was used for this assessment the exact impact on production of the targets taking into account food losses cannot be assessed. Also for meats, a shift to diets with more plant based products would reduce the impact of the targets on livestock production, as some reduction will already come from the shift in diets. A reduction in meat consumption would dampen the impacts on net trade as well, there would be more production available for exports and less need for imports.
As mentioned above, the scenario leads to significant price reactions, mainly for livestock products (Figure 7). Depending on the change in total supply this leads to increased or decreased total income for the sector. Total income of the cereals sector decreases substantially (26%). Although both increasing producer prices (8.2%) and declining (variable) costs (-1.6%) compensate for falling income, these impacts are not strong enough to counterbalance the large decline in total revenues (-8.6%) driven by an 11% drop in yields. Smaller impacts are found for the vegetables and permanent crops sector where the price increase of 15% nearly offsets the yield decrease, leading to stable revenues, but inceased costs still mean that overall income is reduced by 5%.
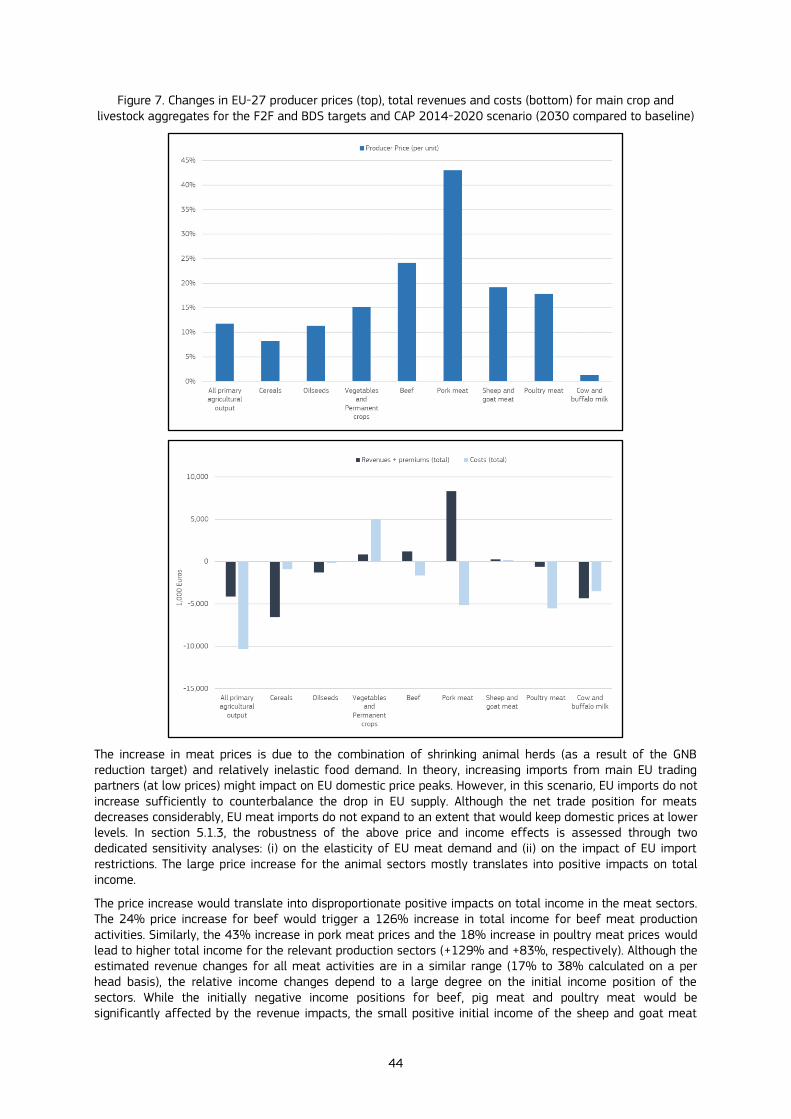
44
Figure 7. Changes in EU-27 producer prices (top), total revenues and costs (bottom) for main crop and livestock aggregates for the F2F and BDS targets and CAP 2014-2020 scenario (2030 compared to baseline)
The increase in meat prices is due to the combination of shrinking animal herds (as a result of the GNB reduction target) and relatively inelastic food demand. In theory, increasing imports from main EU trading partners (at low prices) might impact on EU domestic price peaks. However, in this scenario, EU imports do not increase sufficiently to counterbalance the drop in EU supply. Although the net trade position for meats decreases considerably, EU meat imports do not expand to an extent that would keep domestic prices at lower levels. In section 5.1.3, the robustness of the above price and income effects is assessed through two dedicated sensitivity analyses: (i) on the elasticity of EU meat demand and (ii) on the impact of EU import restrictions. The large price increase for the animal sectors mostly translates into positive impacts on total income.
The price increase would translate into disproportionate positive impacts on total income in the meat sectors. The 24% price increase for beef would trigger a 126% increase in total income for beef meat production activities. Similarly, the 43% increase in pork meat prices and the 18% increase in poultry meat prices would lead to higher total income for the relevant production sectors (+129% and +83%, respectively). Although the estimated revenue changes for all meat activities are in a similar range (17% to 38% calculated on a per head basis), the relative income changes depend to a large degree on the initial income position of the sectors. While the initially negative income positions for beef, pig meat and poultry meat would be significantly affected by the revenue impacts, the small positive initial income of the sheep and goat meat

45
fattening sector increases only to a smaller degree (+6% in total income).
For some commodity markets, EU domestic producer prices are not the key drivers. For example, EU domestic production of soybeans is small relative to imports. Consequently, the price of imported soybeans mostly defines EU internal prices for feed processing of soybeans. The average price index for domestically produced and imported soybeans is more relevant for assessing the impact on feed prices. The change in the feed price index is below +3%, although the price of domestically produced soybeans increases by around 22%.
5.1.2 Environmental impacts
The environmental effects of the scenarios are reported in (Table 15). These effects are mainly driven by the reduction of nitrogen loads. For example, the reduction in nitrogen surplus at farm-level (per hectare) reported (-33.5% for EU average) is mainly achieved by when reducing the nutrient loads only (-32.5%). The reduction in nitrates leaching is even slightly lower in the combined scenario (36.2%) than in the contribution by the nutrients load target (-41.3%), due to a stronger impact on mineral fertilizer use versus manure application on the fields (manure has lower nitrogen use efficiency17).
The reductions in this scenario, for the four indicators considered follow a similar geographical pattern (Figure 8). For example, reductions in nitrogen surplus, nitrogen leaching and ammonia emissions are observed across all of the EU countries. The exception is in a few regions characterised by increased pig and cattle herds, as well as some with cereal and oilseed production. The non-CO2 GHG emissions also decrease in the EU, except for several regions of Spain, Portugal, Germany, the Netherlands and Austria. Since the increase in the emissions in each of these regions is around 5%, the overall emissions balance in the respective countries is negative.
17 Nitrogen leaching is calculated as a fixed share of the soil N-surplus, which is the difference between nitrogen imports and exports
from soils. If both nitrogen imports and exports decrease, but exports (gaseous emissions, runoff, crop products) decrease stronger than imports, then the soil surplus, and thus N-leaching, increases.
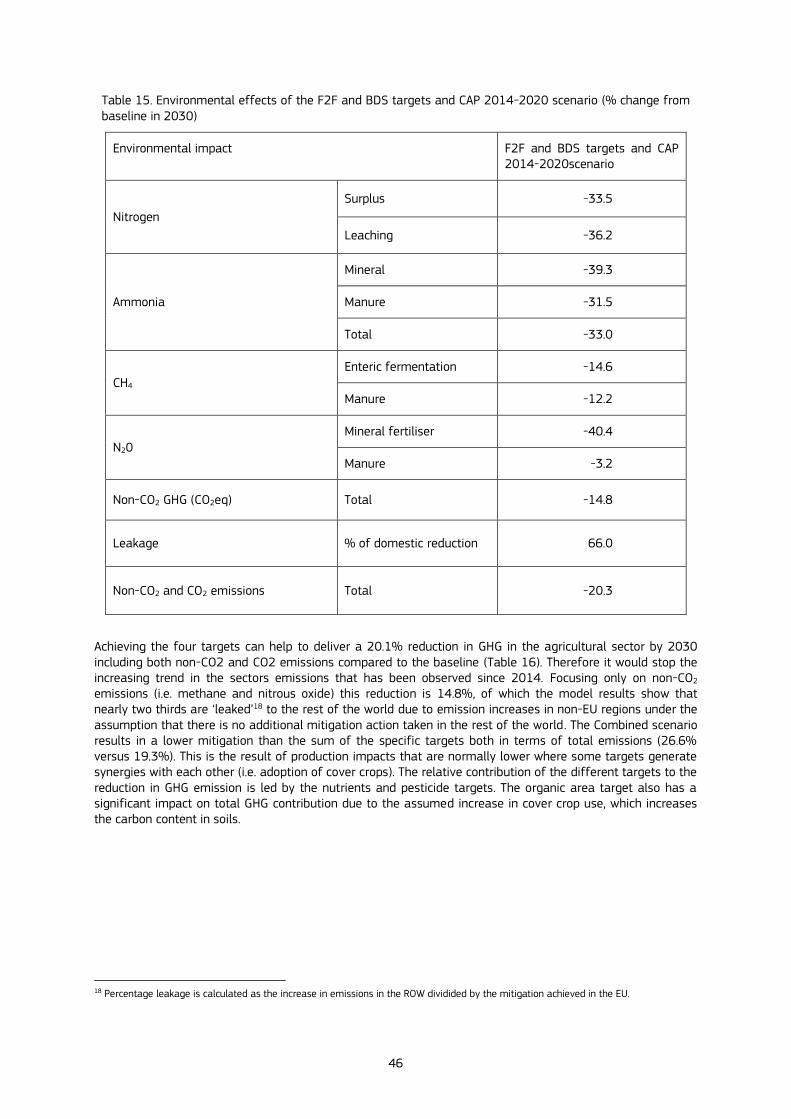
46
Table 15. Environmental effects of the F2F and BDS targets and CAP 2014-2020 scenario (% change from baseline in 2030)
Environmental impact F2F and BDS targets and CAP 2014-2020scenario
Nitrogen
Surplus -33.5
Leaching -36.2
Ammonia
Mineral -39.3
Manure -31.5
Total -33.0
CH4 Enteric fermentation -14.6
Manure -12.2
N20 Mineral fertiliser -40.4
Manure -3.2
Non-CO2 GHG (CO2eq) Total -14.8
Leakage % of domestic reduction 66.0
Non-CO2 and CO2 emissions Total -20.3
Achieving the four targets can help to deliver a 20.1% reduction in GHG in the agricultural sector by 2030 including both non-CO2 and CO2 emissions compared to the baseline (Table 16). Therefore it would stop the increasing trend in the sectors emissions that has been observed since 2014. Focusing only on non-CO2 emissions (i.e. methane and nitrous oxide) this reduction is 14.8%, of which the model results show that nearly two thirds are ‘leaked’18 to the rest of the world due to emission increases in non-EU regions under the assumption that there is no additional mitigation action taken in the rest of the world. The Combined scenario results in a lower mitigation than the sum of the specific targets both in terms of total emissions (26.6% versus 19.3%). This is the result of production impacts that are normally lower where some targets generate synergies with each other (i.e. adoption of cover crops). The relative contribution of the different targets to the reduction in GHG emission is led by the nutrients and pesticide targets. The organic area target also has a significant impact on total GHG contribution due to the assumed increase in cover crop use, which increases the carbon content in soils.
18 Percentage leakage is calculated as the increase in emissions in the ROW dividided by the mitigation achieved in the EU.
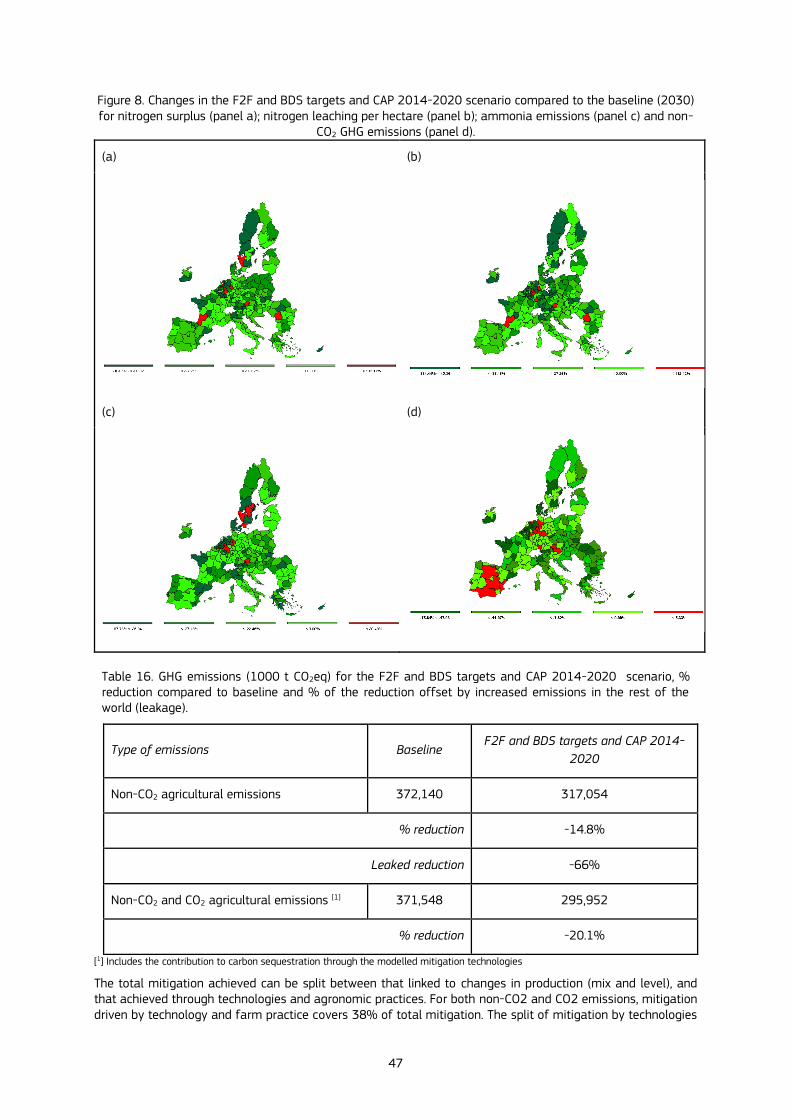
47
Figure 8. Changes in the F2F and BDS targets and CAP 2014-2020 scenario compared to the baseline (2030) for nitrogen surplus (panel a); nitrogen leaching per hectare (panel b); ammonia emissions (panel c) and non-
CO2 GHG emissions (panel d).
(a) (b)
(c) (d)
Table 16. GHG emissions (1000 t CO2eq) for the F2F and BDS targets and CAP 2014-2020 scenario, % reduction compared to baseline and % of the reduction offset by increased emissions in the rest of the world (leakage).
Type of emissions Baseline F2F and BDS targets and CAP 2014-
2020
Non-CO2 agricultural emissions 372,140 317,054
% reduction -14.8%
Leaked reduction -66%
Non-CO2 and CO2 agricultural emissions [1] 371,548 295,952
% reduction -20.1%
[1] Includes the contribution to carbon sequestration through the modelled mitigation technologies
The total mitigation achieved can be split between that linked to changes in production (mix and level), and that achieved through technologies and agronomic practices. For both non-CO2 and CO2 emissions, mitigation driven by technology and farm practice covers 38% of total mitigation. The split of mitigation by technologies
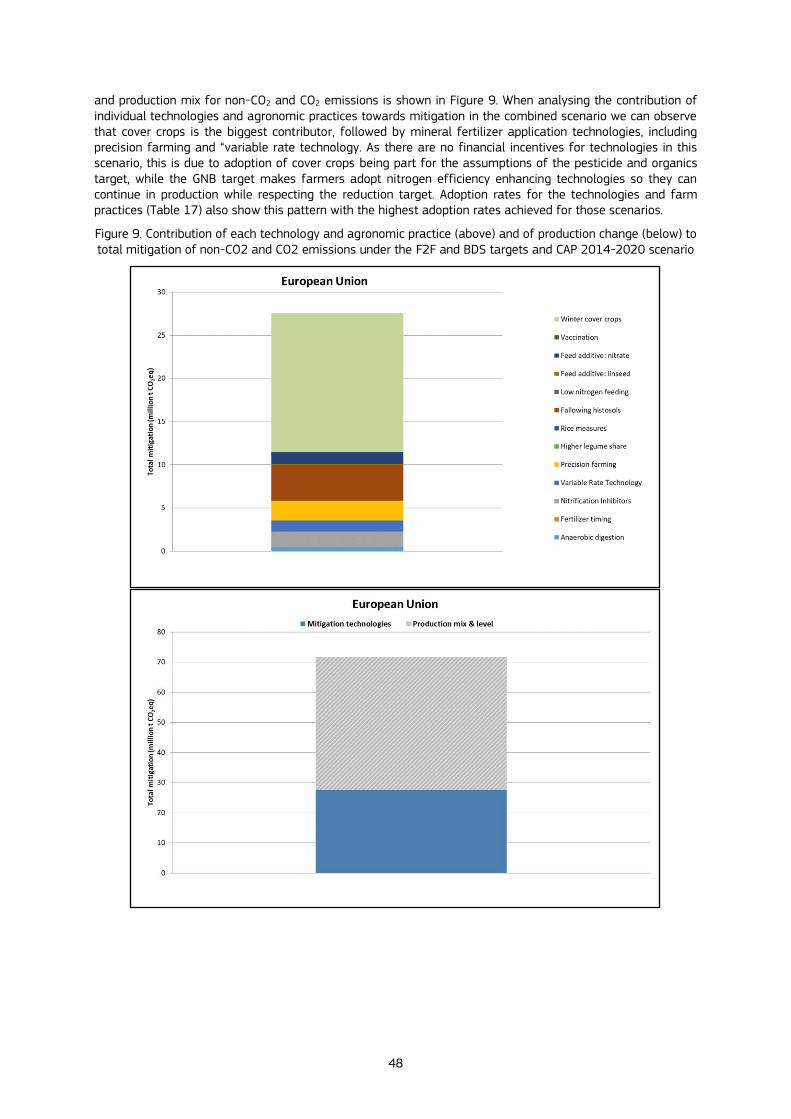
48
and production mix for non-CO2 and CO2 emissions is shown in Figure 9. When analysing the contribution of individual technologies and agronomic practices towards mitigation in the combined scenario we can observe that cover crops is the biggest contributor, followed by mineral fertilizer application technologies, including precision farming and “variable rate technology. As there are no financial incentives for technologies in this scenario, this is due to adoption of cover crops being part for the assumptions of the pesticide and organics target, while the GNB target makes farmers adopt nitrogen efficiency enhancing technologies so they can continue in production while respecting the reduction target. Adoption rates for the technologies and farm practices (Table 17) also show this pattern with the highest adoption rates achieved for those scenarios.
Figure 9. Contribution of each technology and agronomic practice (above) and of production change (below) to total mitigation of non-CO2 and CO2 emissions under the F2F and BDS targets and CAP 2014-2020 scenario

49
Table 17. Adoption of mitigation technologies and farm practices in the F2F and BDS targets and CAP 2014-2020 scenario
Technology
Adoption rate (% of eligible area or heads)
Eligible area or heads as % of total Baseline Combined
Catch crops / winter cover 23 32 33
Increase in the share of leguminous plants in grassland
0 0 100
Feed additives
Low nitrogen feed 0 0 56
Lineseed 0 0 27
Nitrate 0 7 44
Fallowing histosols / peatlands 2 9 80
Nitrification inhibitors 0 18 61
Rice measures 0 0 100
Cattle genomics Higher milk yield 0 15 100
Higher ruminant efficiency 5 9 100
Precision farming 0 35 60
Anaerobic digestion 2 4 36
Low emission housing (1) 12 12 40
Cover storage of manure (1) 14 34 38
Air purification in animal housing (1) 0 10 29 (1) Measures directed at ammonia reduction but with indirect impact on non-C02 GHG emissions

50
Table 18. Contribution of mitigation technologies to reduction of CO2 and non-CO2 GHG emissions in EU27 (in 1,000 t of CO2eq) in the F2F and BDS targets and CAP 2014-2020 scenario- Values are absolute changes to baseline scenario (negative values mean reduction in emissions, positive values increases).
Technology F2F and BDS targets and CAP 2014-2020
Housing and manure storage technologies (1) 922
Manure application technologies (1) 5,240
Rice measures 0
Mineral fertilizer application - 3,568
Nitrification inhibitors - 1,771
Fallowing of histosols - 4,138
Low nitrogen feed - 2
Anaerobic digestion - 495
Higher legume share in temporary grassland -31
Feed additives - 1,462
Winter cover crops - 16,097
(1) Measures targeting ammonia emissions
5.1.3 Sensitivity analysis for price and trade reactions
The F2F and BDS targets and CAP 2014-2020 scenario presented above would result in significant adjustments in producer prices, especially for meat activities (see Figure 7). The GNB-reduction target in the combined scenario would have a significant negative impact on the size of animal herds, as a result of using it in the CAPRI model as a means to reduce the N input from manure in many EU regions. The consequent decrease in the supply of animal products (in particular those linked to the cattle herd) is combined with the inelastic representation of demand for meats in CAPRI, leading to a significant increase in producer prices for the livestock sector. On average, the price effect outweighs the quantity effect and leads to increasing total income for cattle activities. The inelastic demand for meats also does not include the potential impact of measures to promote dietary shifts towards more plant-based diets in reducing demand and therefore the price response.
Therefore there is uncertainty as regards to these projections. Although this effect stems directly from the model specifications, one should not ignore that such specifications are meant to address marginal changes in model parameters. In the real world, if such dramatic domestic price shocks were to happen, this would lead to large price differentials with the rest of the world, rendering such large price differentials in the livestock-related commodity markets implausible in the current trade and market environment. If such were the response of EU producer prices, imports would most likely increase more than simulated by CAPRI, as other countries would take advantage of the very attractive EU prices.
However, it is difficult to project this behaviour in the model. Therefore, in order to test the robustness of the simulated price effects in the combined scenario, three different sensitivity analyses where carried out. First, reductions in heads and in supply for meat activities were used to exogenously shock the Aglink-Cosimo model, which is used to generate the mid-term outlook projections in the EU agricultural sector and is also regularly applied for the analysis of international agri-food trade (Araujo et al., 2015). In addition, two other sensitivity analyses were carried out to modify parameters in the CAPRI model. First, we modified parameters

51
related to price elasticities in CAPRI, and second, trade policy instruments directly limiting imports (e.g. TRQs) were represented as ad valorem custom duties in CAPRI19.
In the first sensitivity analysis, the changes in production obtained in CAPRI were applied exogenously to the Aglink-Cosimo model and the shocks thus implemented were disaggregated between the EU-14 and the EU-13 (these are the only two EU regions in Aglink-Cosimo). The results of this scenario show a similar price reaction for beef, and higher for pork in the EU compared to the ones obtained with CAPRI (26.7% for beef and 75.0% for pork). These results confirm the non-negligible magnitude of the impacts on farm incomes. However, further analysis of price transmission between EU and world prices would be needed for a more comprehensive assessment of these impacts (see section 6 on limitations).
Still, the extent to which these reductions in animal herds translate into higher prices in CAPRI hinges on the key assumption of inelastic demand for animal products. To see the effect of this assumption, EU demand for meats and dairy products was rendered more elastic in CAPRI (i.e. higher price demand elasticities) and applied to the combined scenario. This approach ensures that, while policy assumptions remain unchanged, the parameterisation of the EU demand system can change. Increasing demand elasticities for meats and dairy products in EU countries by a factor of three, and re-calibrating CAPRI, led to re-evaluation of the combined scenario. For beef, the resulting gross value added increase dropped from 126% increase in the combined scenario for beef meat activities to 75%. More importantly, the revenue impact (total revenue) for beef meat activities became negative (-6%) in the sensitivity analysis, compared to a +5% increase in the (standard) combined scenario.
Revenue impacts are driven by the price effects, which are significantly smaller when increasing the elasticity of demand for meats. For example, beef prices increase by only 14% if elasticities are increased, compared to the 24% increase in the combined scenario (Table 19). Market balances for meats and dairy products also adjust to the more elastic demand. Human consumption decreases more (e.g. -6% versus -4%), as the more price elastic demand reacts to a greater degree to the food price increase. Lower human demand has direct implications for trade. Imports increase to a lesser degree and/or the decrease in exports is less pronounced. However, the decline in demand for meat does not prevent meat supply from decreasing further: as revenues are also smaller; net beef production decreases by 16% compared to the 14% decrease with standard elasticities.
It is also worth noticing that more elastic human demand for products from the ruminant sectors leads to larger environmental benefits. This is due to the larger drop in herd size, driven by the decreasing supply of ruminant meat and dairy products. Accordingly, EU agriculture saves more GHG emissions (-16% versus -14%). This result is in line with the literature (e.g. Springmann et al., 2018), which suggests that dietary change could be an effective mechanism to reduce agricultural GHG emissions.
An additional assumption that could drive the significant domestic price reaction is the reaction of trade. In this third sensitivity analysis, we assess the impact of how TRQs are modelled in CAPRI on the simulated increase in EU imports, and indirectly their impact on the magnitude of EU domestic price increases. We take the standard approach in CGE modelling of representing TRQs as ad valorem equivalent (AVE) tariffs. AVE tariffs generate the same tariff revenues in the initial (baseline) point, but do not induce quantitative restrictions on the expansion of imports20. Changing the representation of TRQs from explicit TRQ functions to an AVE-representation is a relevant sensitivity analysis in the context of our study. It does not imply any change in trade policies of the EU, but rather inspects the possible bias that the explicit TRQ functions may introduce in the results. More precisely, the sensitivity analysis focuses on the large price impacts, which on average outweighs the quantity effect in our scenarios.
In the standard application of the scenario, the applied tariff rates for EU beef imports increased by 136%. This increase is due to a regime shift in the TRQ system: increasing beef imports shift the tariff rate from the
19 Converting TRQs to their ad valorem tariff equivalents is the standard technique in the state-of-the-art of trade modelling with
Computable General Equilibrium models. For example, TRQs are converted to their ad valorem tariff equivalents in the ITC-Market Access Map database, which is the main source for trade policies in the GTAP database, and therefore in most trade-related studies done with the GTAP-family of CGE models (Bouet et al. 2008).
20 Converting TRQs to their AVE does not mean that we change trade policies, only the representation of TRQs change in the modelling framework. Modelling trade policies differently may have a significant impact on simulated results of applied equilibrium models. A large body of literature deals with the aggregation bias in simulated results due to simplified representations of trade policies. This aggregation bias has several sources. Aggregating tariffs from the detailed tariff line level to the more aggregated product list of the models is one of the main sources. But the simplified representation of TRQs is another, significant, source of bias in applied modelling, which can lead to both over and underestimation of price and welfare effects of trade liberalization. For a recent comparison of tariff aggregation methods and the associated aggregation bias see Himics et al. (2020).
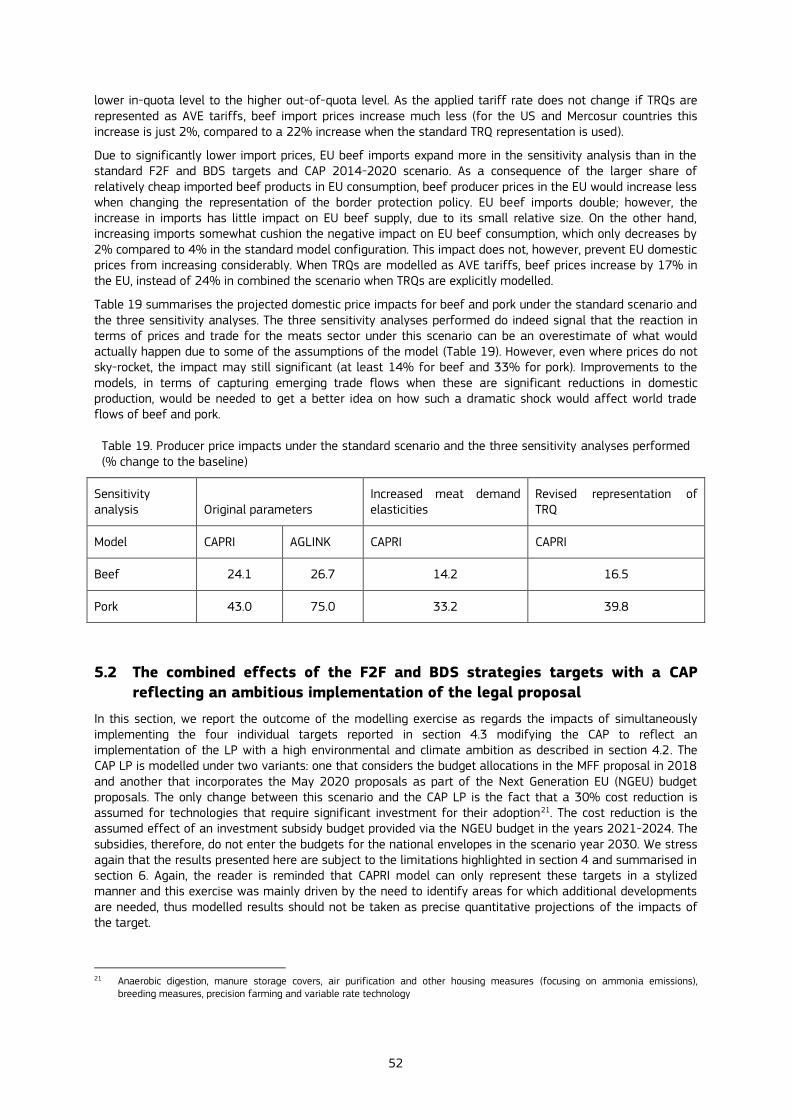
52
lower in-quota level to the higher out-of-quota level. As the applied tariff rate does not change if TRQs are represented as AVE tariffs, beef import prices increase much less (for the US and Mercosur countries this increase is just 2%, compared to a 22% increase when the standard TRQ representation is used).
Due to significantly lower import prices, EU beef imports expand more in the sensitivity analysis than in the standard F2F and BDS targets and CAP 2014-2020 scenario. As a consequence of the larger share of relatively cheap imported beef products in EU consumption, beef producer prices in the EU would increase less when changing the representation of the border protection policy. EU beef imports double; however, the increase in imports has little impact on EU beef supply, due to its small relative size. On the other hand, increasing imports somewhat cushion the negative impact on EU beef consumption, which only decreases by 2% compared to 4% in the standard model configuration. This impact does not, however, prevent EU domestic prices from increasing considerably. When TRQs are modelled as AVE tariffs, beef prices increase by 17% in the EU, instead of 24% in combined the scenario when TRQs are explicitly modelled.
Table 19 summarises the projected domestic price impacts for beef and pork under the standard scenario and the three sensitivity analyses. The three sensitivity analyses performed do indeed signal that the reaction in terms of prices and trade for the meats sector under this scenario can be an overestimate of what would actually happen due to some of the assumptions of the model (Table 19). However, even where prices do not sky-rocket, the impact may still significant (at least 14% for beef and 33% for pork). Improvements to the models, in terms of capturing emerging trade flows when these are significant reductions in domestic production, would be needed to get a better idea on how such a dramatic shock would affect world trade flows of beef and pork.
Table 19. Producer price impacts under the standard scenario and the three sensitivity analyses performed (% change to the baseline)
Sensitivity analysis Original parameters
Increased meat demand elasticities
Revised representation of TRQ
Model CAPRI AGLINK CAPRI CAPRI
Beef 24.1 26.7 14.2 16.5
Pork 43.0 75.0 33.2 39.8
5.2 The combined effects of the F2F and BDS strategies targets with a CAP
reflecting an ambitious implementation of the legal proposal
In this section, we report the outcome of the modelling exercise as regards the impacts of simultaneously implementing the four individual targets reported in section 4.3 modifying the CAP to reflect an implementation of the LP with a high environmental and climate ambition as described in section 4.2. The CAP LP is modelled under two variants: one that considers the budget allocations in the MFF proposal in 2018 and another that incorporates the May 2020 proposals as part of the Next Generation EU (NGEU) budget proposals. The only change between this scenario and the CAP LP is the fact that a 30% cost reduction is assumed for technologies that require significant investment for their adoption21. The cost reduction is the assumed effect of an investment subsidy budget provided via the NGEU budget in the years 2021-2024. The subsidies, therefore, do not enter the budgets for the national envelopes in the scenario year 2030. We stress again that the results presented here are subject to the limitations highlighted in section 4 and summarised in section 6. Again, the reader is reminded that CAPRI model can only represent these targets in a stylized manner and this exercise was mainly driven by the need to identify areas for which additional developments are needed, thus modelled results should not be taken as precise quantitative projections of the impacts of the target.
21 Anaerobic digestion, manure storage covers, air purification and other housing measures (focusing on ammonia emissions),
breeding measures, precision farming and variable rate technology
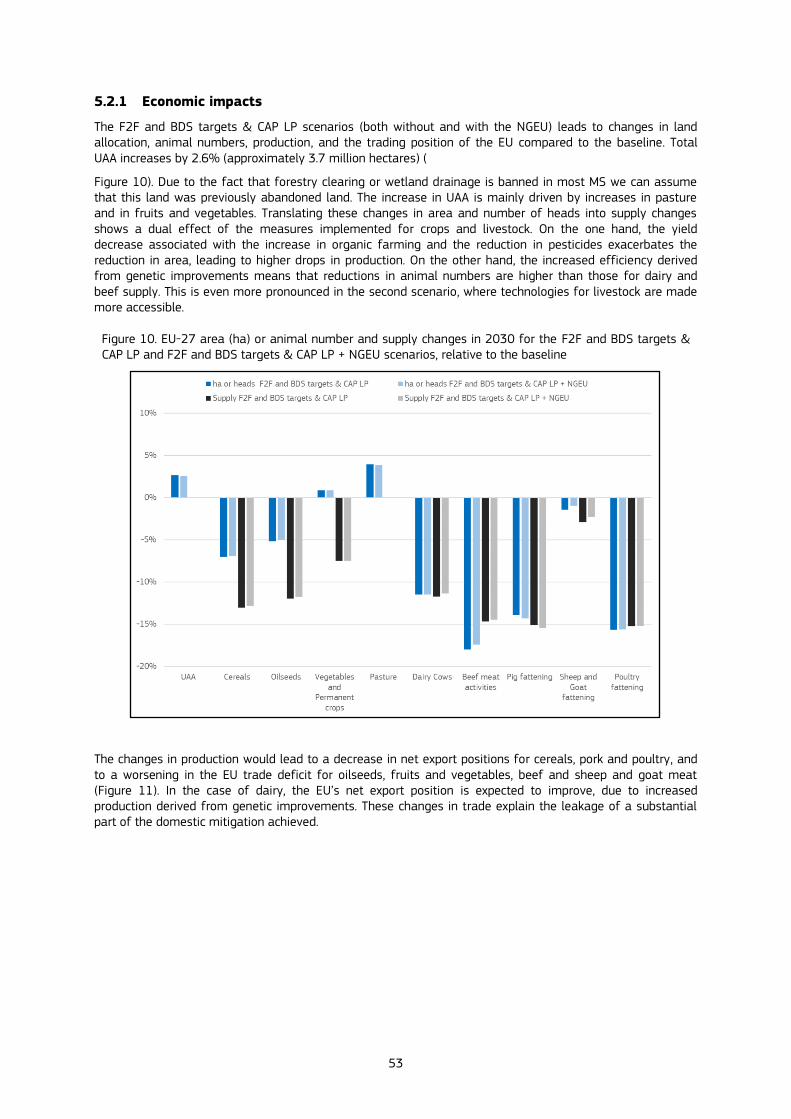
53
5.2.1 Economic impacts
The F2F and BDS targets & CAP LP scenarios (both without and with the NGEU) leads to changes in land allocation, animal numbers, production, and the trading position of the EU compared to the baseline. Total UAA increases by 2.6% (approximately 3.7 million hectares) (
Figure 10). Due to the fact that forestry clearing or wetland drainage is banned in most MS we can assume that this land was previously abandoned land. The increase in UAA is mainly driven by increases in pasture and in fruits and vegetables. Translating these changes in area and number of heads into supply changes shows a dual effect of the measures implemented for crops and livestock. On the one hand, the yield decrease associated with the increase in organic farming and the reduction in pesticides exacerbates the reduction in area, leading to higher drops in production. On the other hand, the increased efficiency derived from genetic improvements means that reductions in animal numbers are higher than those for dairy and beef supply. This is even more pronounced in the second scenario, where technologies for livestock are made more accessible.
Figure 10. EU-27 area (ha) or animal number and supply changes in 2030 for the F2F and BDS targets & CAP LP and F2F and BDS targets & CAP LP + NGEU scenarios, relative to the baseline
The changes in production would lead to a decrease in net export positions for cereals, pork and poultry, and to a worsening in the EU trade deficit for oilseeds, fruits and vegetables, beef and sheep and goat meat (Figure 11). In the case of dairy, the EU’s net export position is expected to improve, due to increased production derived from genetic improvements. These changes in trade explain the leakage of a substantial part of the domestic mitigation achieved.
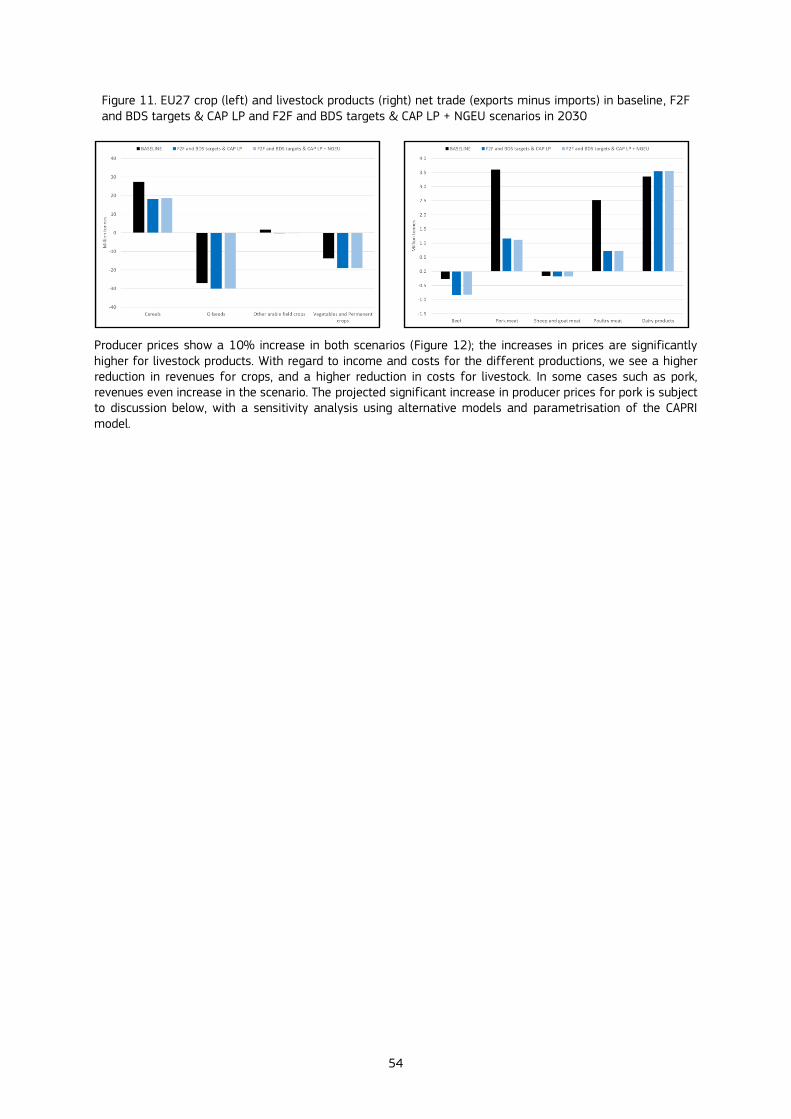
54
Figure 11. EU27 crop (left) and livestock products (right) net trade (exports minus imports) in baseline, F2F and BDS targets & CAP LP and F2F and BDS targets & CAP LP + NGEU scenarios in 2030
Producer prices show a 10% increase in both scenarios (Figure 12); the increases in prices are significantly higher for livestock products. With regard to income and costs for the different productions, we see a higher reduction in revenues for crops, and a higher reduction in costs for livestock. In some cases such as pork, revenues even increase in the scenario. The projected significant increase in producer prices for pork is subject to discussion below, with a sensitivity analysis using alternative models and parametrisation of the CAPRI model.

55
Figure 12. Changes in producer prices (top), and total revenues and costs (bottom) for main crop and livestock
aggregates for the F2F and BDS targets & CAP LP and F2F and BDS targets & CAP LP + NGEU (2030 compared to baseline)
5.2.2 Environmental impacts
The F2F and BDS targets & CAP LP scenario shows that the CAP reform can help to deliver a 28.4% reduction in GHG emissions (including both non-CO2 and CO2) from the agricultural sector by 2030 compared to the baseline (Table 20)22. Focusing only on non-CO2 emissions (i.e. methane and nitrous oxide) this reduction is
22 In addition, the change in production patterns leads to a reduction in fertiliser use, which is translated into a
reduction in fertiliser production emissions of 35.9%
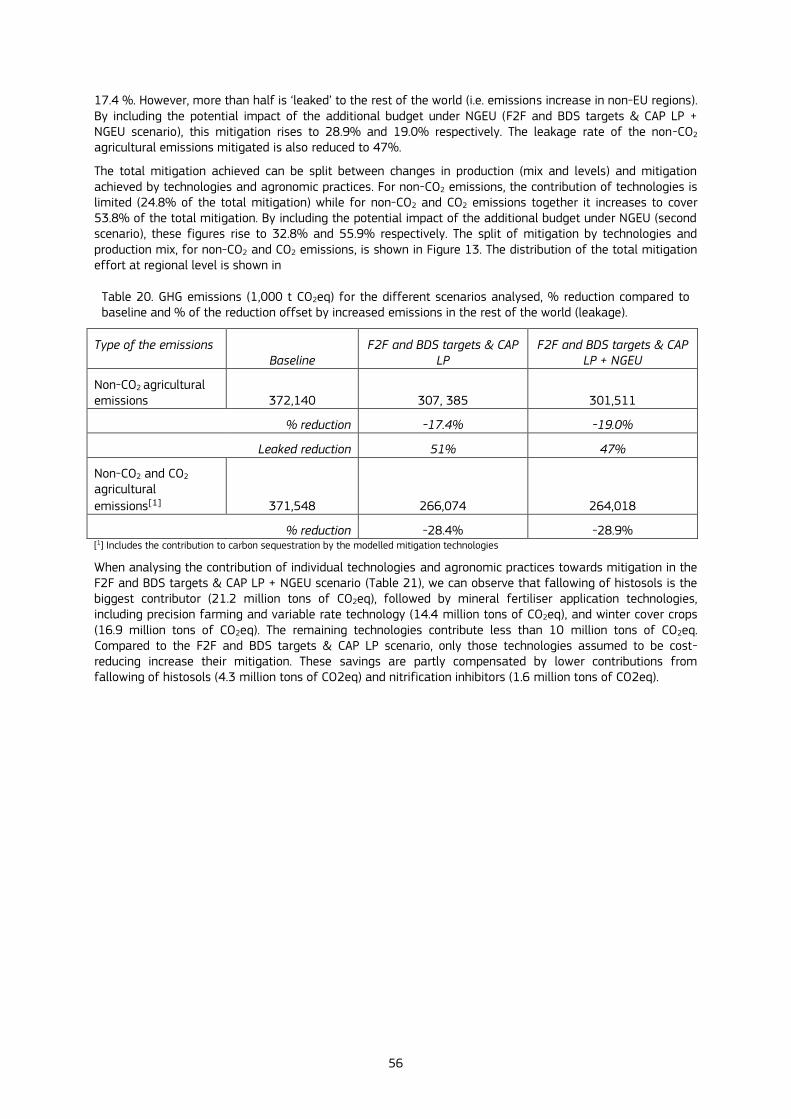
56
17.4 %. However, more than half is ‘leaked’ to the rest of the world (i.e. emissions increase in non-EU regions). By including the potential impact of the additional budget under NGEU (F2F and BDS targets & CAP LP + NGEU scenario), this mitigation rises to 28.9% and 19.0% respectively. The leakage rate of the non-CO2 agricultural emissions mitigated is also reduced to 47%.
The total mitigation achieved can be split between changes in production (mix and levels) and mitigation achieved by technologies and agronomic practices. For non-CO2 emissions, the contribution of technologies is limited (24.8% of the total mitigation) while for non-CO2 and CO2 emissions together it increases to cover 53.8% of the total mitigation. By including the potential impact of the additional budget under NGEU (second scenario), these figures rise to 32.8% and 55.9% respectively. The split of mitigation by technologies and production mix, for non-CO2 and CO2 emissions, is shown in Figure 13. The distribution of the total mitigation effort at regional level is shown in
Table 20. GHG emissions (1,000 t CO2eq) for the different scenarios analysed, % reduction compared to baseline and % of the reduction offset by increased emissions in the rest of the world (leakage).
Type of the emissions Baseline
F2F and BDS targets & CAP LP
F2F and BDS targets & CAP LP + NGEU
Non-CO2 agricultural emissions 372,140 307, 385 301,511
% reduction -17.4% -19.0%
Leaked reduction 51% 47%
Non-CO2 and CO2 agricultural
emissions[1] 371,548 266,074 264,018
% reduction -28.4% -28.9% [1] Includes the contribution to carbon sequestration by the modelled mitigation technologies
When analysing the contribution of individual technologies and agronomic practices towards mitigation in the F2F and BDS targets & CAP LP + NGEU scenario (Table 21), we can observe that fallowing of histosols is the biggest contributor (21.2 million tons of CO2eq), followed by mineral fertiliser application technologies, including precision farming and variable rate technology (14.4 million tons of CO2eq), and winter cover crops (16.9 million tons of CO2eq). The remaining technologies contribute less than 10 million tons of CO2eq. Compared to the F2F and BDS targets & CAP LP scenario, only those technologies assumed to be cost-reducing increase their mitigation. These savings are partly compensated by lower contributions from fallowing of histosols (4.3 million tons of CO2eq) and nitrification inhibitors (1.6 million tons of CO2eq).

57
Figure 13. Contribution of each technology and agronomic practice (above) and of production change (below) to total mitigation of non-CO2 and CO2 emissions under the F2F and BDS targets & CAP LP and F2F and BDS
targets & CAP LP scenarios
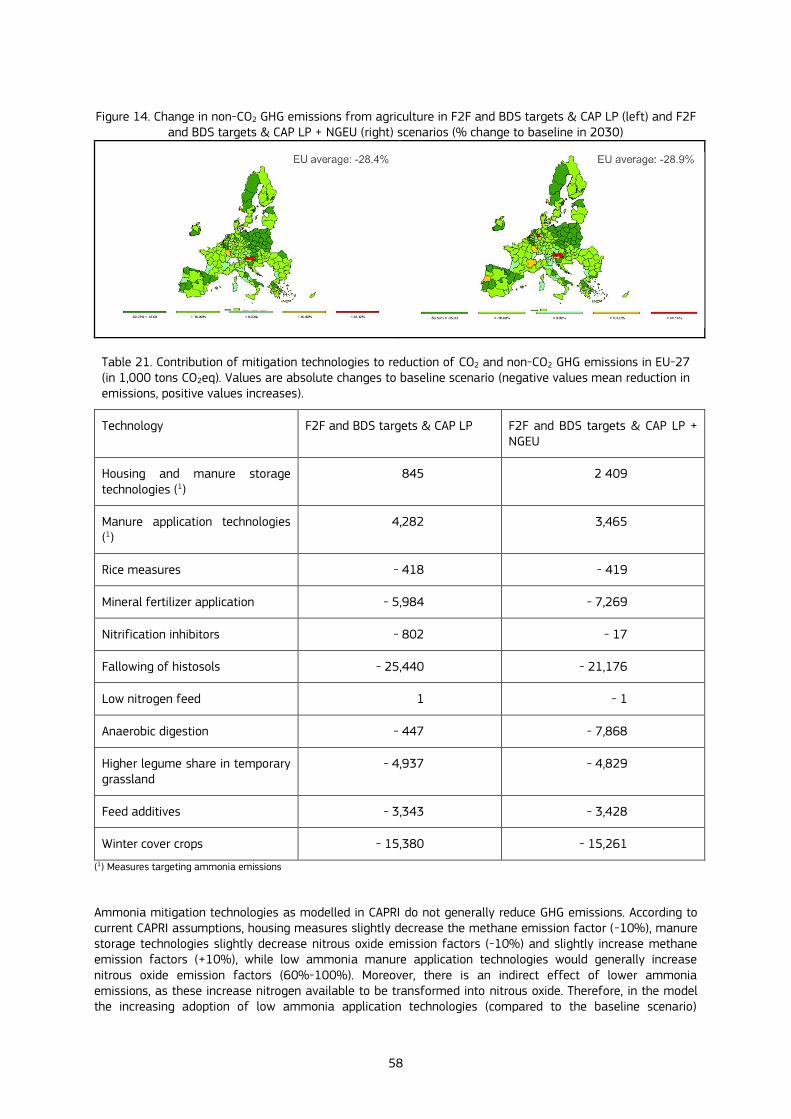
58
Figure 14. Change in non-CO2 GHG emissions from agriculture in F2F and BDS targets & CAP LP (left) and F2F
and BDS targets & CAP LP + NGEU (right) scenarios (% change to baseline in 2030)
Table 21. Contribution of mitigation technologies to reduction of CO2 and non-CO2 GHG emissions in EU-27 (in 1,000 tons CO2eq). Values are absolute changes to baseline scenario (negative values mean reduction in emissions, positive values increases).
Technology F2F and BDS targets & CAP LP F2F and BDS targets & CAP LP + NGEU
Housing and manure storage technologies (1)
845 2 409
Manure application technologies (1)
4,282 3,465
Rice measures - 418 - 419
Mineral fertilizer application - 5,984 - 7,269
Nitrification inhibitors - 802 - 17
Fallowing of histosols - 25,440 - 21,176
Low nitrogen feed 1 - 1
Anaerobic digestion - 447 - 7,868
Higher legume share in temporary grassland
- 4,937 - 4,829
Feed additives - 3,343 - 3,428
Winter cover crops - 15,380 - 15,261
(1) Measures targeting ammonia emissions
Ammonia mitigation technologies as modelled in CAPRI do not generally reduce GHG emissions. According to current CAPRI assumptions, housing measures slightly decrease the methane emission factor (-10%), manure storage technologies slightly decrease nitrous oxide emission factors (-10%) and slightly increase methane emission factors (+10%), while low ammonia manure application technologies would generally increase nitrous oxide emission factors (60%-100%). Moreover, there is an indirect effect of lower ammonia emissions, as these increase nitrogen available to be transformed into nitrous oxide. Therefore, in the model the increasing adoption of low ammonia application technologies (compared to the baseline scenario)
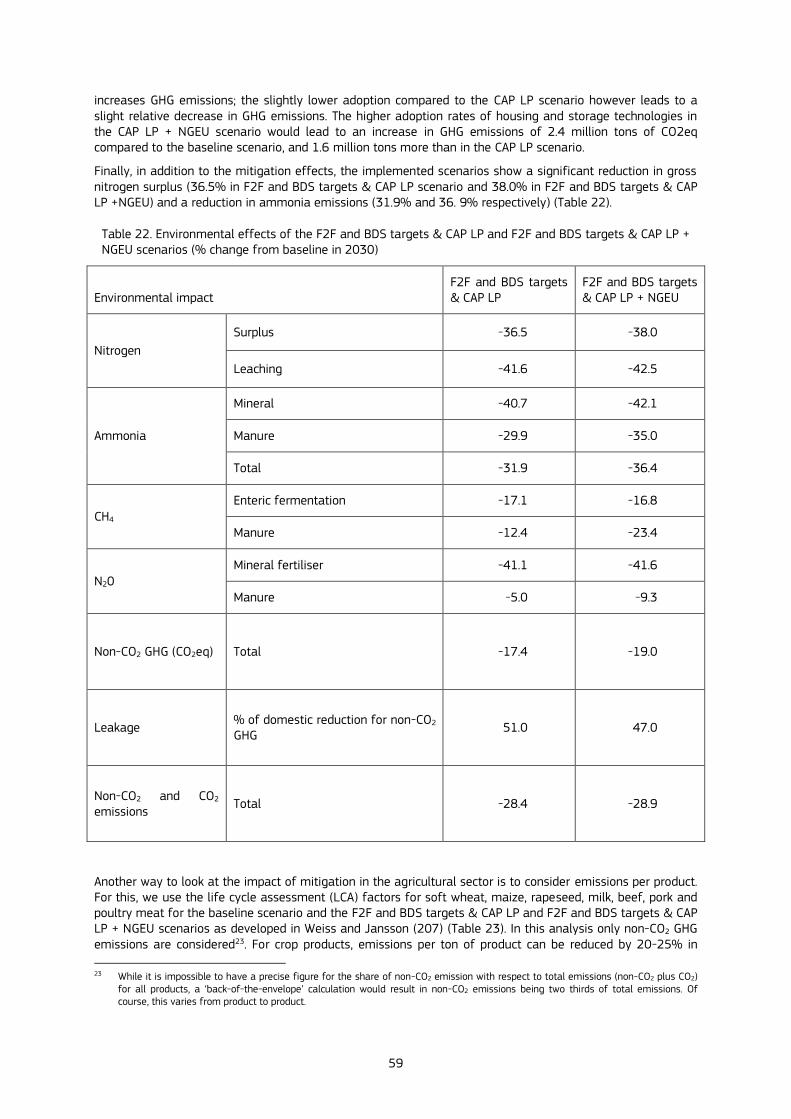
59
increases GHG emissions; the slightly lower adoption compared to the CAP LP scenario however leads to a slight relative decrease in GHG emissions. The higher adoption rates of housing and storage technologies in the CAP LP + NGEU scenario would lead to an increase in GHG emissions of 2.4 million tons of CO2eq compared to the baseline scenario, and 1.6 million tons more than in the CAP LP scenario.
Finally, in addition to the mitigation effects, the implemented scenarios show a significant reduction in gross nitrogen surplus (36.5% in F2F and BDS targets & CAP LP scenario and 38.0% in F2F and BDS targets & CAP LP +NGEU) and a reduction in ammonia emissions (31.9% and 36. 9% respectively) (Table 22).
Table 22. Environmental effects of the F2F and BDS targets & CAP LP and F2F and BDS targets & CAP LP + NGEU scenarios (% change from baseline in 2030)
Environmental impact F2F and BDS targets & CAP LP
F2F and BDS targets & CAP LP + NGEU
Nitrogen
Surplus -36.5 -38.0
Leaching -41.6 -42.5
Ammonia
Mineral -40.7 -42.1
Manure -29.9 -35.0
Total -31.9 -36.4
CH4 Enteric fermentation -17.1 -16.8
Manure -12.4 -23.4
N20 Mineral fertiliser -41.1 -41.6
Manure -5.0 -9.3
Non-CO2 GHG (CO2eq) Total -17.4 -19.0
Leakage % of domestic reduction for non-CO2 GHG
51.0 47.0
Non-CO2 and CO2 emissions
Total -28.4 -28.9
Another way to look at the impact of mitigation in the agricultural sector is to consider emissions per product. For this, we use the life cycle assessment (LCA) factors for soft wheat, maize, rapeseed, milk, beef, pork and poultry meat for the baseline scenario and the F2F and BDS targets & CAP LP and F2F and BDS targets & CAP LP + NGEU scenarios as developed in Weiss and Jansson (207) (Table 23). In this analysis only non-CO2 GHG emissions are considered23. For crop products, emissions per ton of product can be reduced by 20-25% in
23 While it is impossible to have a precise figure for the share of non-CO2 emission with respect to total emissions (non-CO2 plus CO2)
for all products, a ‘back-of-the-envelope’ calculation would result in non-CO2 emissions being two thirds of total emissions. Of course, this varies from product to product.
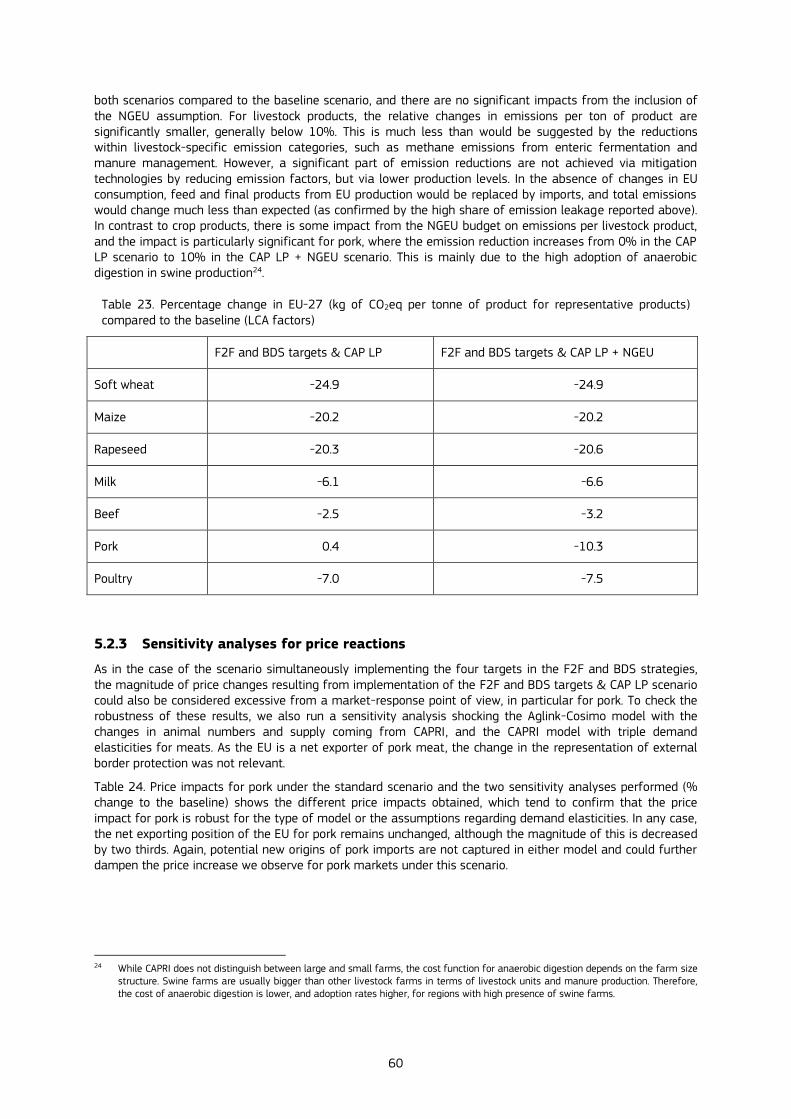
60
both scenarios compared to the baseline scenario, and there are no significant impacts from the inclusion of the NGEU assumption. For livestock products, the relative changes in emissions per ton of product are significantly smaller, generally below 10%. This is much less than would be suggested by the reductions within livestock-specific emission categories, such as methane emissions from enteric fermentation and manure management. However, a significant part of emission reductions are not achieved via mitigation technologies by reducing emission factors, but via lower production levels. In the absence of changes in EU consumption, feed and final products from EU production would be replaced by imports, and total emissions would change much less than expected (as confirmed by the high share of emission leakage reported above). In contrast to crop products, there is some impact from the NGEU budget on emissions per livestock product, and the impact is particularly significant for pork, where the emission reduction increases from 0% in the CAP LP scenario to 10% in the CAP LP + NGEU scenario. This is mainly due to the high adoption of anaerobic digestion in swine production24.
Table 23. Percentage change in EU-27 (kg of CO2eq per tonne of product for representative products) compared to the baseline (LCA factors)
F2F and BDS targets & CAP LP F2F and BDS targets & CAP LP + NGEU
Soft wheat -24.9 -24.9
Maize -20.2 -20.2
Rapeseed -20.3 -20.6
Milk -6.1 -6.6
Beef -2.5 -3.2
Pork 0.4 -10.3
Poultry -7.0 -7.5
5.2.3 Sensitivity analyses for price reactions
As in the case of the scenario simultaneously implementing the four targets in the F2F and BDS strategies, the magnitude of price changes resulting from implementation of the F2F and BDS targets & CAP LP scenario could also be considered excessive from a market-response point of view, in particular for pork. To check the robustness of these results, we also run a sensitivity analysis shocking the Aglink-Cosimo model with the changes in animal numbers and supply coming from CAPRI, and the CAPRI model with triple demand elasticities for meats. As the EU is a net exporter of pork meat, the change in the representation of external border protection was not relevant.
Table 24. Price impacts for pork under the standard scenario and the two sensitivity analyses performed (% change to the baseline) shows the different price impacts obtained, which tend to confirm that the price impact for pork is robust for the type of model or the assumptions regarding demand elasticities. In any case, the net exporting position of the EU for pork remains unchanged, although the magnitude of this is decreased by two thirds. Again, potential new origins of pork imports are not captured in either model and could further dampen the price increase we observe for pork markets under this scenario.
24 While CAPRI does not distinguish between large and small farms, the cost function for anaerobic digestion depends on the farm size
structure. Swine farms are usually bigger than other livestock farms in terms of livestock units and manure production. Therefore, the cost of anaerobic digestion is lower, and adoption rates higher, for regions with high presence of swine farms.
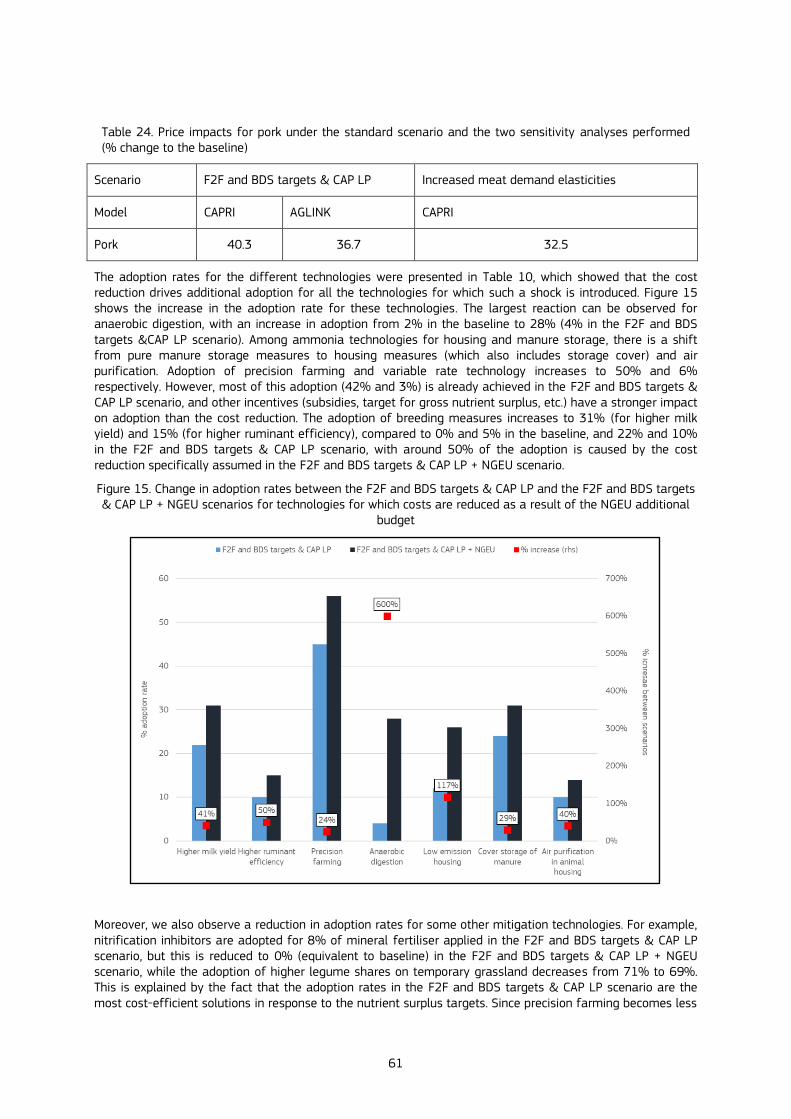
61
Table 24. Price impacts for pork under the standard scenario and the two sensitivity analyses performed (% change to the baseline)
Scenario F2F and BDS targets & CAP LP Increased meat demand elasticities
Model CAPRI AGLINK CAPRI
Pork 40.3 36.7 32.5
The adoption rates for the different technologies were presented in Table 10, which showed that the cost reduction drives additional adoption for all the technologies for which such a shock is introduced. Figure 15 shows the increase in the adoption rate for these technologies. The largest reaction can be observed for anaerobic digestion, with an increase in adoption from 2% in the baseline to 28% (4% in the F2F and BDS targets &CAP LP scenario). Among ammonia technologies for housing and manure storage, there is a shift from pure manure storage measures to housing measures (which also includes storage cover) and air purification. Adoption of precision farming and variable rate technology increases to 50% and 6% respectively. However, most of this adoption (42% and 3%) is already achieved in the F2F and BDS targets & CAP LP scenario, and other incentives (subsidies, target for gross nutrient surplus, etc.) have a stronger impact on adoption than the cost reduction. The adoption of breeding measures increases to 31% (for higher milk yield) and 15% (for higher ruminant efficiency), compared to 0% and 5% in the baseline, and 22% and 10% in the F2F and BDS targets & CAP LP scenario, with around 50% of the adoption is caused by the cost reduction specifically assumed in the F2F and BDS targets & CAP LP + NGEU scenario.
Figure 15. Change in adoption rates between the F2F and BDS targets & CAP LP and the F2F and BDS targets & CAP LP + NGEU scenarios for technologies for which costs are reduced as a result of the NGEU additional
budget
Moreover, we also observe a reduction in adoption rates for some other mitigation technologies. For example, nitrification inhibitors are adopted for 8% of mineral fertiliser applied in the F2F and BDS targets & CAP LP scenario, but this is reduced to 0% (equivalent to baseline) in the F2F and BDS targets & CAP LP + NGEU scenario, while the adoption of higher legume shares on temporary grassland decreases from 71% to 69%. This is explained by the fact that the adoption rates in the F2F and BDS targets & CAP LP scenario are the most cost-efficient solutions in response to the nutrient surplus targets. Since precision farming becomes less
62
costly in the F2F and BDS targets & CAP LP + NGEU scenario, nitrification inhibitors are replaced by precision farming. Similarly, the adoption of fallowing histosols slightly decreases from 55% in the F2F and BDS targets & CAP LP scenario to 49% in the F2F and BDS targets & CAP LP + NGEU scenario, due to increasing opportunity costs of land related to lower production costs.

63
6 Limitations and proposed improvements
This report employed one of the agro-economic models used by the Commission (CAPRI) to quantify the economic and environmental impacts of different agricultural policy proposals reflecting the new environmental and climate ambitions of the Commission. Quantitative analysis of agricultural and rural development policies, as well as those concerning related topics such as trade, energy, environment and climate change, make an important contribution to the policy-making process in these areas (M’barek et al., 2012). Economic simulation models depict the interrelationships between selected economic variables and, as such, provide a simplified but clearly structured and quantified representation of economic reality that can be used ex ante to analyse the impacts of policy changes. Partial equilibrium models such as CAPRI incorporate technical relationships and classic policy instruments like production quotas, premium schemes or specific tariffs in a way that is close to the corresponding legal text. This facilitates both the interaction with market experts and linkages to bio-physical tools, as well as the calculation of environmental indicators. These strengths are still valid reasons to pursue their use under the new policy environment where more importance is given to environmental and climate performance of agriculture and enhanced links between these a policy instruments pursued. However, the current state of the CAPRI model does not allow fully capturing the potential impacts of the F2F and BDS strategies. The CAPRI model is not perfectly capable of representing the new environmental and climate targets which the agricultural sector is expected to meet.
No economic model can be a perfect description of reality. But the very process of constructing, testing, and revising models forces economists and policymakers to tighten their views about how an economy works (Ouliaris, 2011). This has been the spirit of this report. Throughout it we highlighted important limitations the model faces in this analysis, mostly related to lack of data (e.g. regional pesticide use by pesticide category) and lack of model specificities (e.g. no distinction between organic and conventional farming). The latter are driven in many cases also driven by of lack of data. Additional limitations due to not capturing the full scope of the transition to sustainable food systems promoted by the strategies (e.g. change in the functioning of the value chain, impacts of soil degradation, etc.) also prevent providing a comprehensive assessment of their impacts.
Besides these general limitations the analysis put forward does not fully capture the underlying drivers of the policy initiatives assessed. For example, the F2F and BDS strategies include many more targets than those we have selected for analysis (see Table 2). Of particular relevance are the reduction of food waste, the move towards different diets or the demand side promotion of organic and sustainably produced food. In addition, the assumptions about the impacts on farm management and yields of the reduction in pesticide use and the increase in organic farming do not capture potential beneficial side-effects on agricultural production and beyond (e.g. health benefits). While the latter will need to be assessed with other modelling tools, the former can be improved with further research and constructive dialogue with the different stakeholders both inside and outside the Commission. This will also be needed when improving the model to capture endogenous shifts in pesticide use and changes from conventional to organic farming practices, as well as a differentiated market for organic products. This will allow the target to be reached in areas where the impact is smaller, rather than imposing an homogenous increase of land under organic farming for all regions in a particular member state. Part of this work has already been started at the JRC and will hopefully be operational before the end of 2021.
In addition, the model is not comprehensive in the representation of emission mitigation technologies and farm practices. The technologies implemented during the last five years focused on GHG mitigation driven by the importance given by the Commission to climate action. Some of these technologies also contribute to the new target tabled by the F2F and BDS strategies (e.g. mineral fertilisation application technologies). However, there are many more technologies and farm practices that could be included, which could contribute to achieving the objectives while minimising the impacts on production. The development of new feed additives which reduce GHG emissions from livestock, reduced tillage, afforestation and the inclusion of buffer strips are some of the technologies and farm practices the JRC is already working on, but more could be considered in the mid-term. In any case, there are certain methodological limitations that need to be considered when introducing explicit technologies and management practices within an economic model. As mentioned, without data on the current adoption of these technologies and practices, the calibration of the model becomes challenging (and zero adoption has to be assumed in the baseline).
The representation of the livestock sector should also be improved if we want to capture the impacts of enhanced animal welfare levels and different production systems. Currently, the model only captures an aggregated livestock activity failing to capture potential changes towards organic or more extensive livestock production methods. These production methods could have differentiated impacts on feed conversion and

64
nitrogen emissions that could also accelerate the transition towards sustainable food systems.
With respect to the nitrogen cycle, future improvements should consider the possibility of implementing nutrient management practices based on expert advice that match actual crop requirements (right fertilizer source at the right rate, at the right time and in the right place) and therefore avoid over fertilization and nutrient losses, as promoted in the Nitrates Directive. Additional measures should include capturing regional exports of manure and the impact of the nutrient management legislation, both in the baseline and the projections. This is particularly relevant as we have seen how nutrient surplus reduction targets have a significant impact on our results.
One also has to consider that the actual representation of the adoption of technologies and farm practices could be improved. In the analysis presented, additional adoption based on subsidies is driven by the increase in budget availability and not by specific recommendations on maximising environmental benefits. Also, the model is based on profit maximisation and it is well known that many other factors also affect adoption, including but not only behavioural ones (Dessart et al., 2019). Currently this can only be captured via assumptions about cost reductions (similar to what has been done to capture the impact of the NGEU budget). However, the representation of measures aimed at reducing these barriers (i.e. cooperation measures) would also improve the way we capture the impact of policy on adoption of technologies and farming practices beneficial to the environment.
One also has to consider the magnitude of the scenario shocks (i.e. distance from baseline values to aspirational targets). Models are calibrated to a common vision of the future and their predictive performance may be decreased in extreme cases. In the case of CAPRI the calibration is done using the EU mid-term outlook and the model responds reasonably well to marginal changes in parameters. However, it becomes problematic when these changes are unprecedented. In particular, when the changes have not been observed in the past, the shocks can potentially lead to an over- or under-reaction of the system and frequently require additional judgement. This was seen with the magnitude of price reactions when production falls significantly (i.e. meat activities), leading to the use of an additional model and change to some modelling assumptions for comparability. Even when undertaking sensitivity analysis, the price responses are large and the reaction of world markets is potentially too rigid to capture their adaptation capacity, especially in the long run. The high food prices crisis of 2008 did indeed see price increases even higher than the ones we report here, but the increase was only temporary (FAO, 2011). International trade has also been shown to be a strong mitigation tool for climate shocks (van Meijl et al., 2018) so that we could expect that production shocks in affluent regions of the world would attract more trade to capture the market opportunity, dampening the price increases we obtain. For instance, this could worsen the income effects reported and exacerbate the negative impact on the EU meat sector. When dealing with systemic changes, other research tools such as foresight and propective can be used in a complementary manner to inform some of the parameters that could reflect novel practices and busness models that could be developed by farmers to adapt to the new sustainable food systems paradigm. The JRC has undertalen such a study for the farmers of the future (Krzysztofowicz et al. 2020) and is currently undertaken other for the future of rural areas and a sustainability framework for
Finally, it is to be noted that the baseline used in this report does not guarantee that existing EU and national legislation are fully implemented. These are met only insofar they are met by the projections of the Commission’s Mid-term outlook to which it is calibrated. This is particularly important with regard to PPP (SUD Directive) and fertilizers (Nitrates Directive, Water Framework Directive) and has a strong impact on the results. If some of the reductions inserted as shocks should already be achieved by other pieces of legislation, the reported results overestimate the impacts of the targets. For example, if full implementation of the legislation on nutrients already reduced GNB by 25%, the reported results should be scaled to take into account this and correctly attribute impacts to the F2F and BDS targets.
In view of the above, it is important to note that the present study is to be regarded as an exploration of the potential to use CAPRI model to assess potential impacts of environmental and climate legislation. Whereas the study may provide some first insights into potential interactions between targets and a rough idea of possible impacts on production and markets, it is important to bear in mind that these estimates should be only taken as indicative. Therefore, further research would be needed to further develop the model to allow providing results that can better capture the impacts of environmental and climate policies.

65
7 Conclusions
Quoting Nobel Prize winner Bob Dylan, ‘the times they are a-changing’ (Dylan, 1964). They are changing in terms of objectives and in terms of how policies are designed to help meeting them. The CAP is not an exception to this, and is now conceived to deliver multiple objectives while keeping a clear focus on farmers. Given that agricultural land accounts for almost half of the European territory, accelerating the transition towards sustainable agricultural practices is essential to achieve sustainability. Therefore, several other policy initiatives need a strong contribution from the agricultural sector to reach their objectives. With changing policies, objectives and instruments, the tools used to assess them also need to evolve. Agro-economic models provide a conceptual framework that allows representing the economy in a structured but schematic and simplified manner. By definition, they cannot reproduce the reality in its full complexity and thus have shortcomings and limitations, which should be appreciated and which affect the results of the studies based on such models.
In this report, we have tried to see how far one of the tools used to evaluate the CAP (i.e. the CAPRI model) is fit-for-purpose to incorporate the new environmental and climate ambition in the analysis of the agricultural sector. For that we focus on four agriculture-specific targets put forward in the F2F and BDS strategies and an illustrative implementation of the CAP Legal Proposal to deliver higher environmental and climate ambition as an example. These targets were selected as the ones with the greatest potential to affect agricultural production and for which CAP can provide a targeted contribution. The conclusion is that on one hand the model would need significant improvements to better account for the representation of some of the targets (e.g. organic farming and pesticide) and there are many instruments and targets that are not captured by it (e.g. food waste reductions, dietary shifts). On the other hand, the results show that using a number of assumptions the model can be used to anticipate how these targets could potentially affect the agricultural sector.
However, the report does not constitute an impact assessment of the strategies as such nor an estimate of the cost of non-action. The modelling scope does not include all of the strategies’ measures (e.g. food waste reduction targets, dietary shifts, organic action plan) which would alter the impacts reported. Other analytical approaches and tools are necessary to arrive at a more complete picture of the potential impacts of this transition. As these two strategies propose a comprehensive approach to move towards sustainable food systems, their inclusion requires additional assumptions to capture positive synergies between the different initiatives and additional tools to cover the limitations of the modelling approach used. Therefore, impacts should be considered representing an upper bound of the full impact of the strategies as they are partial in scope (mainly covering the supply side) and incomplete (as the required future changes in consumer behaviour and the functioning of the food value chain are not captured in the model). Last, the analysis does not include the potential benefits the implementation of the measures could provide to society and only captures the impact on a limited set of environmental domains, missing most prominently the positive impact on biodiversity and the co-benefits enhanced biodiversity could provide to agricultural yields.
Focusing on the capacity of the CAPRI model to capture the measures addressed directly to the agricultural sector, some will never be incorporated due to basic features of the model (e.g. risk management as the model is deterministic). Others might be better addressed by other models, linked to a stronger or weaker degree with CAPRI (e.g. land use changes linking with GLOBIOM, farm level responses to incentives with IFM-CAP, structural change from Agent Based Models). Specific CAPRI results are already being used as inputs in other models to assess environmental impacts by using land use data from the model and applying disaggregation algorithms. This is the case for water pollution and farmland birds and could better inform the environmental impacts derived from the different scenarios. Also, the challenge remains as how to improve the representation of some activities (e.g. organic farming, pesticide use) or reach consensus on assumptions (e.g. spill-overs of some measures).
The limitations that we have identified and described throughout the report highlight the lack of coverage of all measures in the strategies and lack of data for some assumptions affect the results reported. Therefore any conclusions as regards impacts have to be taken with caution and represent a preliminary evaluation of their magnitude. When representing the changes due to increased area under organic farming and increased area for high-diversity landscape features we take a scenario reflecting a worst-case approach; the assumptions do not incorporate the potential reduction of the yield gap between organic and conventional agriculture that could be delivered by the implementation of an organic action plan. Nor do they take account of the potential co-benefits in yields due to the provision of ecosystem services associated with higher biodiversity. The overall impacts already include the contribution of an ambitious application of the CAP LP but fail to account for the contribution of many other initiatives put forward in the F2F and BDS strategies or

66
the role of technological development. As such, they still represent an upper bound of the real impacts that can be expected.
Based on the assumptions made and taking into account the limitations of the analysis, modelling results indicate that reaching these four targets under the current CAP implementation achieves significant environmental benefits. This are quantified as reductions in greenhouse gases and ammonia emissions as well as in gross nutrient surplus (Figure 16), though the extent in terms of positive environmental and economic benefits is not fully quantified. Meeting the targets in the context of the CAP 2014-2020 provides just over a 20% reduction in GHG emissions; this is further increased by 50% (to nearly 30% reduction) when the CAP LP is implemented. The pattern of improved environmental performance when the CAP LP is considered, although less significant, can be seen for ammonia emissions and gross nutrient surplus. This smaller effect on ammonia and gross nutrient balance is due to the fact that the mitigation technologies and farm practices represented in CAPRI focus mainly on GHG mitigation. Expanding the representation of technologies and farm practices to other domains would allow better reflection on the potential for CAP LP also to address these issues.
Figure 16. Impacts on environmental indicators under the F2F and BDS targets, CAP LP and CAP LP + NGEU scenarios (% change compared to baseline in 2030)
The positive impact of the new CAP LP is also reflected in how mitigation is achieved and to what extent domestic efforts are leaked (Figure 17Figure 17). Without implementation of the CAP LP, less than 40% of total GHG mitigation is due to technology adoption, meaning that more than 60% is due to production changes in both composition and levels. This is reflected in the higher production impacts described above. However, when resources are allocated to support the adoption of technologies and farming practices with positive impacts on climate, the share of mitigation due to reductions in production drops below 50%.
With regards to the integrity of the GHG emission reductions achieved in the EU, no change in the CAP means that close to 70% of all emissions reduced in the EU are substituted by emission increases in the rest of the world. The leakage rate is reduced by 23% (falling to around 50%) when the assumed CAP LP is implemented. However, even in the F2F and BDS targets & CAP LP + NGEU scenario, incorporating a 30% reduction in technology costs due to investments fostered by the NGEU, close to 50% of the reduction is achieved via changes in production mix and levels (mainly reductions), and leakage is also close to that figure. This is partly due to the fact that the exercise assumes that the EU acts alone. However, as part of international climate agreements also non-EU countries have commitments to reduce GHG emissions, incorporating this to the analysis would reduce the leakage and negative impacts for the EU. In addition, leakage could be further
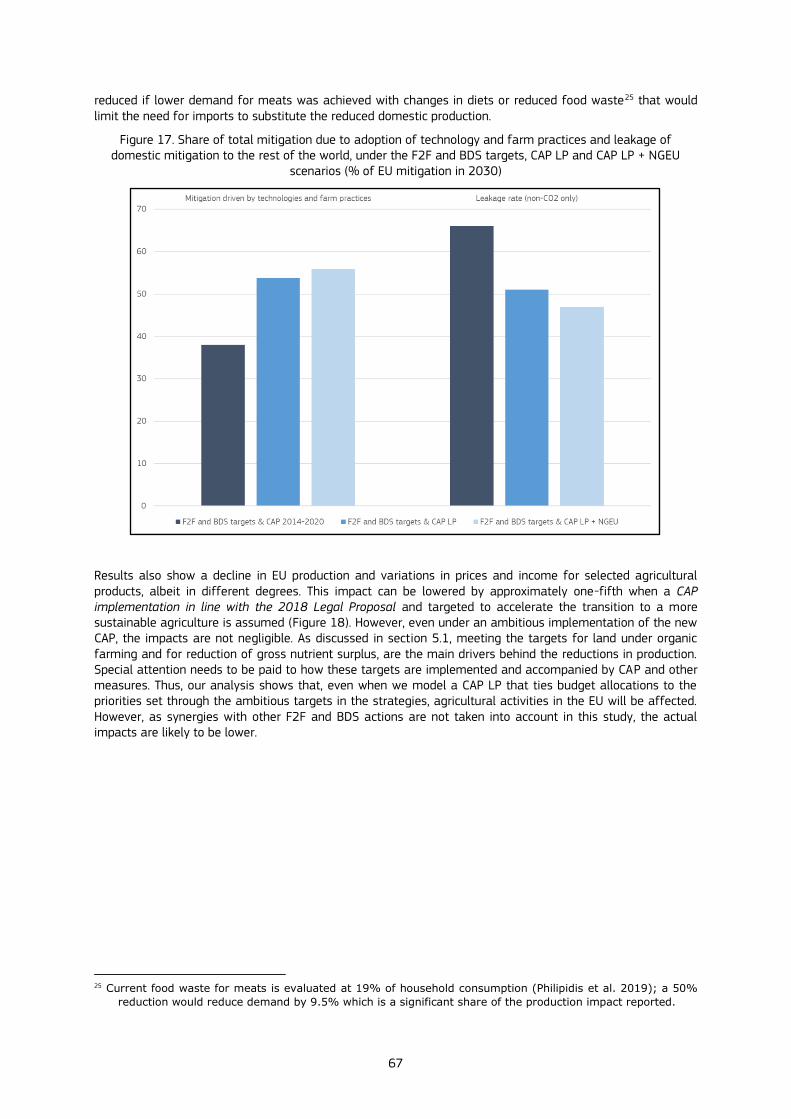
67
reduced if lower demand for meats was achieved with changes in diets or reduced food waste25 that would limit the need for imports to substitute the reduced domestic production.
Figure 17. Share of total mitigation due to adoption of technology and farm practices and leakage of domestic mitigation to the rest of the world, under the F2F and BDS targets, CAP LP and CAP LP + NGEU
scenarios (% of EU mitigation in 2030)
Results also show a decline in EU production and variations in prices and income for selected agricultural products, albeit in different degrees. This impact can be lowered by approximately one-fifth when a CAP implementation in line with the 2018 Legal Proposal and targeted to accelerate the transition to a more sustainable agriculture is assumed (Figure 18). However, even under an ambitious implementation of the new CAP, the impacts are not negligible. As discussed in section 5.1, meeting the targets for land under organic farming and for reduction of gross nutrient surplus, are the main drivers behind the reductions in production. Special attention needs to be paid to how these targets are implemented and accompanied by CAP and other measures. Thus, our analysis shows that, even when we model a CAP LP that ties budget allocations to the priorities set through the ambitious targets in the strategies, agricultural activities in the EU will be affected. However, as synergies with other F2F and BDS actions are not taken into account in this study, the actual impacts are likely to be lower.
25 Current food waste for meats is evaluated at 19% of household consumption (Philipidis et al. 2019); a 50%
reduction would reduce demand by 9.5% which is a significant share of the production impact reported.
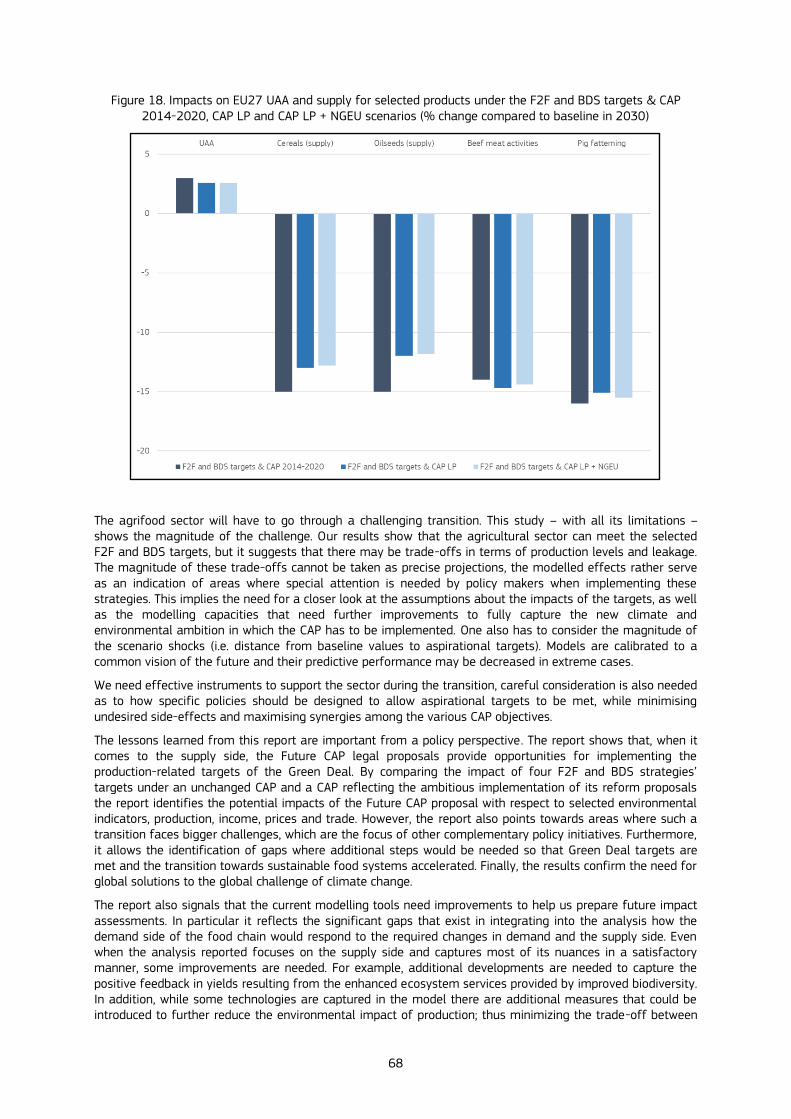
68
Figure 18. Impacts on EU27 UAA and supply for selected products under the F2F and BDS targets & CAP 2014-2020, CAP LP and CAP LP + NGEU scenarios (% change compared to baseline in 2030)
The agrifood sector will have to go through a challenging transition. This study – with all its limitations – shows the magnitude of the challenge. Our results show that the agricultural sector can meet the selected F2F and BDS targets, but it suggests that there may be trade-offs in terms of production levels and leakage. The magnitude of these trade-offs cannot be taken as precise projections, the modelled effects rather serve as an indication of areas where special attention is needed by policy makers when implementing these strategies. This implies the need for a closer look at the assumptions about the impacts of the targets, as well as the modelling capacities that need further improvements to fully capture the new climate and environmental ambition in which the CAP has to be implemented. One also has to consider the magnitude of the scenario shocks (i.e. distance from baseline values to aspirational targets). Models are calibrated to a common vision of the future and their predictive performance may be decreased in extreme cases.
We need effective instruments to support the sector during the transition, careful consideration is also needed as to how specific policies should be designed to allow aspirational targets to be met, while minimising undesired side-effects and maximising synergies among the various CAP objectives.
The lessons learned from this report are important from a policy perspective. The report shows that, when it comes to the supply side, the Future CAP legal proposals provide opportunities for implementing the production-related targets of the Green Deal. By comparing the impact of four F2F and BDS strategies’ targets under an unchanged CAP and a CAP reflecting the ambitious implementation of its reform proposals the report identifies the potential impacts of the Future CAP proposal with respect to selected environmental indicators, production, income, prices and trade. However, the report also points towards areas where such a transition faces bigger challenges, which are the focus of other complementary policy initiatives. Furthermore, it allows the identification of gaps where additional steps would be needed so that Green Deal targets are met and the transition towards sustainable food systems accelerated. Finally, the results confirm the need for global solutions to the global challenge of climate change.
The report also signals that the current modelling tools need improvements to help us prepare future impact assessments. In particular it reflects the significant gaps that exist in integrating into the analysis how the demand side of the food chain would respond to the required changes in demand and the supply side. Even when the analysis reported focuses on the supply side and captures most of its nuances in a satisfactory manner, some improvements are needed. For example, additional developments are needed to capture the positive feedback in yields resulting from the enhanced ecosystem services provided by improved biodiversity. In addition, while some technologies are captured in the model there are additional measures that could be introduced to further reduce the environmental impact of production; thus minimizing the trade-off between
69
meeting targets and production impacts. Indeed, the development of technology with a clear focus to enhancing productivity while reducing environmental impacts or the widespread adoption of best practices already present in some farms shall further reduce these impacts. As Baldoni et al. (2017) show in the case of GHG emissions, reduced environmental impacts can be based on the diffusion of the best practices adopted by high-productivity farms of different size and specialization.
In addition, the assumptions about the impacts on farm management and yields of the reduction in pesticide use and the increase in organic farming do not capture potential beneficial side effects beyond the agricultural sector (e.g. health benefits). These limitations are partly driven by the lack of comprehensive farm-level data, which results in the assessment of the relationship between farming activity and the environment in an aggregated regional level. The Commission’s proposal to move from a farm accountancy data network (FADN) to a farm sustainability data network (FSDN) will be instrumental in addressing these limitations as it would allow the better understanding of which practices work best, and within which regional and sector environment.
As far as the demand side is concerned, this analysis does not incorporate the ambition related to food waste reduction, the move towards different diets or the demand side promotion of organic and sustainably produced food. Such changes would require the development of other modelling approaches incorporating assumptions on future consumer behavioural changes that cannot be captured with analyses of past consumer behaviour. In this area, data availability is an issue whose resolution would require the cooperation of the retail and processing industry.
In a nutshell, our results identify the potential of an ambitious implementation of the CAP LP to achieve the Green Deal targets that are rooted in sustainable agricultural practices. However, results also point out that the CAP alone cannot achieve them and point to the need for further action exactly in the areas where it is challenging. In particular, there is a need for global action to avoid leakage of pollution to other world areas as shown by the high levels of leakage for GHG emissions. There is also a need for productivity gains with respect to organic farming and nutrient management which can be achieved with precision farming, new digital technologies and other innovative techniques, all part of the growth dimension of the Green Deal. Last, the significant price impacts indicates the crucial role of changes in consumer behaviour in order to reduce the environmental footprint of food consumption. All in all, the identified challenges when achieving environmental targets reveal the need to keep the core elements of the CAP legislative proposal on the green architecture, including conditionality. The Green Deal mentions the concept of a just transition, our results while not covering the full scope of the strategies, if only, at least indicate where special care has to be given to ensure this for the accelerated transition towards a sustainable and climate friendly agriculture.
Finally, we reiterate a word of caution when using the findings reported. Whereas the study may provide some first insights into potential interactions between targets and a rough idea of possible impacts on production and markets, it is important to bear in mind that these are contingent on the assumptions made and do not cover the full scope of the F2F and BDS strategies. Additional research would be needed to further develop the model to allow better capturing the impacts of the four targets and those of additional initiatives not considered here, and combine these results with other analysis to allow for a comprehensive evaluation. As part of its commitment to provide better scientific evidence for policy making, the JRC is working to improve knowledge on the effects (including potential co-benefits) of the measures implemented, develop the model to improve the representation of pesticides and organic farming, and explore avenues to incorporate the impact of food waste reductions and changes in diets. As for the latter, improvements on environmental and human health expected from the accelerated shift towards sustainable food systems need to be quantified using other tools. In addition, a comprehensive assessment should also incorporate a full food systems approach incorporating other phases of the food value chain and changes in consumer preferences and behaviour.
The upcoming proposal for a legislative framework for sustainable food systems will require a comprehensive impact assessment. This impact assessment will have to be able to evaluate the ambition laid down for an enhanced environmental, climate and health performance of the EU’s agricultural sector as part of the broader food system. While agro-economic models will be an integral part of the tools for such an evaluation, the present exercise has identified areas where additional efforts are needed, especially in the need to capture the environment not only as a restriction for agricultural production but also as an input. The current modelling approach focuses on the trade-offs between environmental protection and agricultural production based on experience, failing to capture the positive synergies that a better environment brings associated. These limitations are not specific to the CAPRI model. Other analyses that have looked into the impacts of some of the initiatives put forward in the strategies using other models (Beckman et al. 2020; Guyomard et
70
al. 2020) also face them. Ongoing research and analysis can shed light on more positive synergies associated with a better environmental footprint, thus improving the capacity of the model to capture the targets and using additional methods to estimate the benefits.
71
References
Araujo, S.R., Pérez-Domínguez, I., Santini, F., Helaine, S. 2015. Documentation of the European Commission’s EU module of the Aglink-Cosimo modelling system. JRC Science and Policy Report, Publicaitons Office of the European Union, Luxembourg.
Baldoni, E.., Coderoni, S., Esposti, R. 2017. The productivity and environment nexus with farm-level data. The Case of Carbon Footprint in Lombardy FADN farms. Bio-based and Applied Economics 6(2): 119-137
Bareille, F., Dupraz, P. 2020. Productive capacity of biodiversity: crop diversity and permanent grasslands in north-western France. Environmental and Resource Economics 77:365-399.
Beckman, J., Ivanic, M., Jelliffe, J.L., Baquedano, F.G., Scott, S.G. 2020. Economic and food security impacts of agricultural input reduction under the European Union Green Deal’s Farm to Fork and Biodiversity Strategies. Economic Brief 30, U.S. Department of Agriculture, Economic Research Service.
Blanco, M., Witzke, H.P., Barreiro-Hurle, J., Martinez, P., Salputra, G., Hristov, J. 2018. CAPRI Water 2.0: an upgraded and updated CAPRI water module. JRC Technical Report, Publications Office of the European Union, Luxembourg.
Bouet, A., Decreux, Y., Fontagne, L., Jean, S., Laborde, D. 2008. Assessing Applied Protection across the World. Review of International Economics 16(5): 850–63.
Britz, W., Witzke, P. 2014. CAPRI Model Documentation 2014. Available at www.capri-model.org/docs/capri_documentation.pdf.
Burrell, A., Ferrari, E., Mellado, A.G., Himics, M., Michalek, J., Shrestha, S. and Van Doorslaer, B. 2011 . Potential EU-Mercosur Free Trade Agreement: Impact Assessment – Volume 1: Main Results. JRC Reference Reports, Publications Office of the European Union, Luxembourg.
Burrell, A., Himics, M., Van Doorslaer, B., Ciaian, P., Shrestha, S. 2015. EU Sugar Policy: A Sweet Transition After 2015? JRC Scientific and Policy Reports, Publications Office of the European Union, Luxembourg.
Ciampitti, I.A., Vyn, T.J. 2012. Physiological perspectives of changes over time in maize yield dependency on nitrogen uptake and associated nitrogen efficiencies: A review. Field Crops Research 133:48-67.
Council of the European Union (CEU), 2018a. Regulation (EU) 2018/842 of the European Parliament and of the Council of 30 May 2018 on binding annual greenhouse gas emission reductions by Member States from 2021 to 2030 contributing to climate action to meet commitments under the Paris Agreement and amending Regulation (EU) No 525/2013.
Council of the European Union (CEU), 2018b. Regulation (EU) 2018/841 of the European Parliament and of the Council of 30 May 2018 on the inclusion of greenhouse gas emissions and removals from land use, land use change and forestry in the 2030 climate and energy framework, and amending Regulation (EU) No 525/2013 and Decision No 529/2013/EU.
De Ponti, T., Rijk, B., van Ittersum, M.K. 2012. The crop yield gap between organic and conventional agriculture. Agricultural Systems 108:1-9.
Dessart, F., Barreiro-Hurle, J., van Bavel, R. 2019. Behavioural factors affecting the adoption of sustainable farming practices: a policy-oriented review. European Review of Agricultural Economics 46(3): 417-471.
Dupraz, P., Guyomard H. 2019. Environment and Climate in the Common Agricultural Policy. EuroChoices 18(1),:18–25.
Dylan, B. 1964. The times they are a-changin’. Track #1 of the album The Times they are A-changin’.
European Commission (EC), 1985a. Perspectives for the Common Agricultural Policy. Communication of the Commission to the Council and the Parliament,. COM(85)333.
European Commission (EC), 1985b. Council Regulation (EEC) No 797/85 of 12 of March 195 on improving the efficiency of agricultural structures. Official Journal of the European Communities L93.
European Commission (EC), 2011. The CAP in perspective: from market intervention to policy innovation. Agricultural Policy Perspectives Brief No1. Directorate Gdneral for Agriculture and Rural Development. https://ec.europa.eu/info/sites/info/files/food-farming-fisheries/farming/documents/agri-policy-perspectives-brief-01_en.pdf [accessed 04/08/2020].

72
European Commission (EC), 2017. EU Agricultural Outlook for markets and income 2017-2030. European Commission, DG Agriculture and Rural Development, Brussels.
European Commission (EC), 2018a. Proposal for a Regulation of the European Parliament and of the Council establishing rules on support for strategic plans to be drawn up by Member States under the Common agricultural policy (CAP Strategic Plans) and financed by the European Agricultural Guarantee Fund (EAGF) and by the European Agricultural Fund for Rural Development (EAFRD) and repealing Regulation (EU) No 1305/2013 of the European Parliament and of the Council and Regulation (EU) No 1307/2013 of the European Parliament and of the Council. COM(2018)392 final.
European Commission (EC), 2018b. Proposal for a Regulation of the European Parliament and of the Council on the financing, management and monitoring of the common agricultural policy and repealing Regulation (EU) No 1306/2013 COM(2018)393 final.
European Commission (EC), 2018c. Proposal for a Regulation of the European Parliament and of the Council amending Regulations (EU) No 1308/2013 establishing a common organisation of the markets in agricultural products, (EU) No 1151/2012 on quality schemes for agricultural products and foodstuffs, (EU) No 251/2014 on the definition, description, presentation, labelling and the protection of geographical indications of aromatised wine products, (EU) No 228/2013 laying down specific measures for agriculture in the outermost regions of the Union and (EU) No 229/2013 laying down specific measures for agriculture in favour of the smaller Aegean islands. COM(2018)394 final.
European Commisison (EC), 2018d. Impact assessment accompanying the proposal for Regulations under COM(2018)392, COM(2018)393 and COM(2018)394. SWD(2018)301.
European Commission (EC), 2018e. EU Agricultural Outlook for markets and income 2018-2030. European Commission, DG Agriculture and Rural Development, Brussels.
European Commission (EC), 2018f. A Clean Planet for all. A European strategic long-term vision for a prosperous, modern, competitive and climate neutral economy. Communication from the Commission to the European Parliament, the Council, the European Economic and Social Committee and the Committee of the Regions, COM(2018)773.
European Commission (EC), 2019. The European Green Deal. Communication from the Commission to the European Parliament, the Council, the European Economi and Social Committee and the Committee of the Regions, COM(2019)640.
European Commission (EC), 2020a. Analysis of links between CAP reform and Green Deal. Commission Staff Working Document SWD(2020)93.
European Commission (EC), 2020b. A Farm to Fork Strategy for a fair, healthy and environmentally-friendly food system Communication from the Commission to the European Parliament, the Council, the European Economic and Social Committee and the Committee of the Regions,. COM(2020)381.
European Commission (EC), 2020c. EU Biodiversity Strategy for 2030. Bringing nature back into our lives. Communication from the Commission to the European Parliament, the Council, the European Economic and Social Committee and the Committee of the Regions, COM(2020)380.
European Commission (EC), 2020d. Proposal for a regulation of the European Parliament and of the Council establishing the framework for achieving climate neutrality and amending Regulation (EU) 2018/1999 (European Climate Law). COM(2020)/80 final.
European Commissin (EC), 2020e. Commission staff working document impact assessment accompanying the document communication from the Commission to the European Parliament, the Council, tthe European Economic and Social Committee and the Committee of the Regions Stepping up Europe’s 2030 climate ambition Investing in a climate-neutral future for the benefit of our people. SWD(2020)176.
European Court of Auditors (ECA), 2019. Opinion No 7/2018 (pursuant to Article 322(1)(a) TFEU) concerning Commission proposals for regulations relating to the common agricultural policy for the post-2020 period (COM(2018) 392, 393 and 394 final). 2019/C 41/01
European Union Nitrogen Expert Panel (EUNEP) 2017. Nitrogen Use Efficiency (NUE) an indicator for the utilization of nitrogen in food systems Available on-line at www.eunep.com/wp-content/uploads/2017/03/N-ExpertPanel-NUE-Session-1.pdf
Eurostat (2013). Nutrient Budgets – Methodology and Handbook. Version 1.02. Eurostat and OECD,
73
Luxembourg.Fellmann, T., Witzke, P., Weiss, F., Van Doorslaer, B., Drabik, D., Huck, I., Salputra, G., Jansson, T., Leip, A. 2018. Major challenges of integrating agriculture into climate change mitigation policy frameworks. Mitigation and Adaptation Strategies for Global Change, Vol. 23: 451–468.
Fernandez-Alvarez, A. 1997. Manual de economía y política de la Unión Europea. Editorial Trotta, Madrid, 387 pp.
Food and Agricultural Organization of the United Nations (FAO) 2011. Lessons from the world food crisis of 2006–08 in The State of Food Insecurity in the World (SOFI).
Frank, S., Havl ık, P., Stehfest, E., van, Meijl, H., Witzke, P., Perez-Dominguez, I., van, Dijk, M., Doelman, J., Fellmann, T., Koopman, J. F. L., Tabeau, A., Valin, H. 2018. Agricultural non-CO2 emission reduction potential in the context of the 1.5°C target. Nature Climate Change, Vol. 9: 66-72
García, T., Folkeson, C. 2020. The New Delivery Model of the CAP : Some Relevant Issues. Economia Agraria y Recursos Naturales 20, no. 1: 149–67.
Gocht, A., Ciaian, P., Bielza, M., Terres, J.-M., Roder, N., Himics, M., Salputra, G. 2017. EU wide economic and environmental impacts of CAP greening with high spatial and farm-type detail. Journal of Agricultural Economics, Vol. 68: 651–681.
Guyomard, H., Bureau, J.C., Chatellier, V., Detang-Dessendre, C., Dupraz, P., Jacquet, F., Reboud, X., Requillart, V., Soler, L.G., Tysebaert, M. 2020. Research for AGRI Committee – The Green Deal and the CAP: policy implications to adapt farming practices and to preserve the EU’s natural resources. European Parliament, Policy Department for Structural and Cohesion Policies, Brussels.
Hasegawa, T., Fujimori, S., Havlik, P., Valin, H., Bodirsky, B. L., Doelman, J. C., Fellmann, T., Kyle, P., Koopman, J. F., Lotze-Campen, H. 2018. Risk of increased food insecurity under stringent global climate change mitigation policy. Nature Climate Change, Vol. 8: 699–703.
Heckelei, T., Britz, W. and Zhang, Y. 2012. Positive mathematical programming approaches – recent developments in literature and applied modelling. Bio-based and Applied Economics, Vol. 1: 109–124.
Himics, M., Listorti, G., Tonini, A. 2020. Simulated economic impacts in applied trade modelling: A comparison of tariff aggregation approaches. Economic Modelling 87(1): 344–57.
IPCC, 2006. IPCC Guidelines for National Greenhouse Gas Inventories, Prepared by the National Greenhouse Gas Inventories Programme, IGES, Japan.
IPCC, 2019. Climate Change and Land: an IPCC special report on climate change, desertification, land degradation, sustainable land management, food security, and greenhouse gas fluxes in terrestrial ecosystems. IPCC, Bonn.
Jongeneel, R., Gonzalez-Maritnez, A. 20202. The SUPREMA roadmap exploring future directions for agricultural modelling in the EU. Deliverable 1.10 Suprema H2020 Project.
Kathage, J., Himics, M., Fellmann, T. 2019. Going organic with the CAP? Regional and global economic impacts of reduced fertilizer and pesticide use in EU agriculture? Paper prepared for presentation at the 172nd EAAE Seminar ‘Agricultural policy for the environment or environmental policy for agriculture?’, 28-29 May, Brussels, Belgium
Krzysztofowicz, M., Rudkin, J., Winthagen, V. and Bock, A. 2020. Farmers of the future. JRC Science for Policy Report, Publications Office of the European Union, Luxembourg.
Lampkin, N., Stolze, M., Meredith, S., de Porras, M., Haller, L., Mészáros, D. 2020. Using Eco-schemes in the new CAP: a guide for managing authorities. IFOAM EU, FIBL and IEEP, Brussels.
Leip, A., Weiss, F., Wassenaar, T., Perez, I., Fellmann, T., Loudjani, P., Tubiello, F., Grandgirard, D., Monni, S., Biala, K. 2010. Evaluation of the Livestock Sector’s Contribution to the EU Greenhouse Gas Emissions (GGELS) – Final Report. European Commission, Joint Research Centre.
Leip, A., Busto, M., Winiwarter, W. (2011) Developing spatially stratified N2O emission factors for Europe. Environmental Pollution 159 3223–32
M’barek, R., Britz, W., Burrell, A., Delince, J. 2012. An intergated Modelling Platform for agro-economic commodity and policy analysis (iMAP) – a look back and the way forward. JRC Scientific and Policy Report, Publications Office of the European Union, Luxembourg.

74
M’barek, R., Barreiro-Hurle, J., Boulanger, P., Caivano, A., Ciaian, P., Dudu, H., Goded, M.E., Fellmann, T., Ferrari, E., Paloma, S.G.Y., Gonzalez, C.G. 2017. Scenar 2030 – Pathways for the European Agriculture and Food Sector Beyond 2020. JRC Science for Policy Report, Publications Office of the European Union, Luxembourg.
Meijl, H.v., Havlik, P., Lotze-Campen, H., Stehfest, E., Witzke, P., Dom ınguez, I. P., Bodirsky, B. L., van Dijk , M., Doelman, J., Fellmann, T., Humpenoder, F. 2018. Comparing impacts of climate change and mitigation on global agriculture by 2050. Environmental Research Letters, Vol. 13: 064021
Milroy, S.P., Wang, P., Sadras, V.O. 2019. Defining upper limits of nitrogen uptake and nitrogen use efficiency of potato in response to crop N supply. Field Crops Research 239:38-46.
OECD/FAO 2017. OECD-FAO Agricultural Outlook 2017-2026. OECD Publishing, Paris.
Ouliaris, S. 2011. What are economic models? How economists try to simulate reality. Finance and Development 48(2): 46-47.
Özkbek, F.S., Leip, A., Weiss, F., Carmona-Garcia, G. 2015. Regionalisation of Nitrogen Balances with the CAPRI Model (RegNiBal). JRC Technical Report, Publications Office of the European Union, Luxembourg.
Pe’er, G., Zinngrebe, Y., Moreira, F., Sirami, C, Schindler, S., Müller, R., Bontzorlos, V., et al. 2019. A Greener Path for the EU Common Agricultural Policy. Science 365:449-451. https://doi.org/10.1126/science.aax3146.
Pérez Domínguez, I., Fellmann, T., Witzke, H.P., Jansson, T., Oudendag, D., Gocht, A., Verhoog, D. 2012. Agricultural GHG Emissions in the EU: An Exploratory Economic Assessment of Mitigation Policy Options, JRC Scientific and Policy Reports, Publications Office of the European Union, Luxembourg.
Pérez-Dominguez, I.; Fellmann, T.; Weiss, F.; Witzke, P.; Barreiro-Hurlé, J.; Himics, M.; Jansson, T.; Leip A. 2016. An economic assessment of GHG mitigation policy options for EU agriculture. JRC Science and Policy Report, Publications Office of the European Union, Luxembourg.
Pérez-Dominguez, I.; Fellmann, T.; Witzke, H.P.; Weiss, F.; Hristov, J.; Himics, M.; Barreiro-Hurle, J.; Gómez-Barbero, M.; Leip, A. 2020. Economic assessment of GHG mitigation policy options for EU agriculture: A closer look at mitigation options and regional mitigation costs - EcAMPA 3. JRC Technical Report, Publications Office of the European Union, Luxembourg.
Philippidis, G., Sartorin, M., Ferrari, E., M’barek, R. 2019. Waste not, want not: A bio-economic impact assessment of household food waste reductions in the EU. Resources, conservation and recycling 146:514-522.
Ponisio, L.C., M'Gonigle, L.K., Mace, K.C., Palomino, J., de Valpine, P., and Kremen, C., 2014. Diversification practices reduce organic to conventional yield gap’, Proceedings of the Royal Society B: Biological Sciences 282:1-7.
Rac, I., Erjavec, K., Erjavec, E. 2020. Does the proposed CAP reform allow for a paradigm shift towards a greener policy? Spanish Journal of Agricultural Research 18(3):e0111
Reddy, G.B., Reddy, K.R. 1993. Fate of nitrogen-15 ammonium enriched nitrate applied to corn. Soil Science Society of America Journal 57:111-115.
Sánchez, B.; Barriero-Hurle, J.; Soto-Embodas, I.; Rodriguez-Cerezo, E. (2019). The Impact Indicator for Priority Pests (I2P2): a tool for ranking pests according to Regulation (EU) No 2016/2031 . JRC Technical Report, Publications Office of the European Union, Luxembourg.
Schiermeier, Q. (2019). Eat less meat: UN climate-change report calls for change to human diet. Nature 572: 291-293.
Scown, M.W., Brady, M.V., Nicholas, K.A. 2020. Billions in misspent EU agricultural subsidies could support the sustaiable development goals. One Earth 3: 237-250.
Seufert, V., Ramankutty, N., & Foley, J. A., 2012. Comparing the yields of organic and conventional agriculture. Nature, 485(7397): 229-232.
Smith, L.C., Jones, P.J., Kirk, G.J.D., Pearce, B.D., Williams, A.G. 2018. Modelling the production impats of a widespread conversion to organic agriculture in England and Wales. Land Use Policy 76:391-404.
Smith, O. M., Cohen, A. L., Reganold, J. P., Jones, M. S., Orpet, R. J., Taylor, J. M., ... Kennedy, C. M., 2020. Landscape context affects the sustainability of organic farming systems. Proceedings of the National

75
Academy of Sciences 17(6):2870-2878.
Spaziante, A., Rega, C., Carbone, M., Murano, C., 2012. Strategic Environmental Assessment (SEA) of rural development programs in the European Union–Towards a more efficient monitoring of the environmental effects of agricultural policies. In Rural Development-Contemporary Issues and Practices, IntechOpen.
Springmann, M., Clark, M., Mason-D’Croz, D. et al. 2018. Options for keeping the food system within environmental limits. Nature 562: 519–525. https://doi.org/10.1038/s41586-018-0594-0
Šumrada, T., Lovec, M., Juvančič, L., Rac, I., Erjavec, E. 2020. Fit for the Task? Integration of Biodiversity Policy into the Post-2020 Common Agricultural Policy: Illustration on the Case of Slovenia. Journal for Nature Conservation 54: 125804. https://doi.org/10.1016/J.JNC.2020.125804.
Tuck, S.L., Wingvist, C., Mota, F., Ahnstrom, J., Turnbull, L.A. Bengtsson, J. 2014. Journal of Applied Ecology 51(3): 746-755.
Uthes, S., Matzdorf, B. 2013. Studies on agri-environmental measures: a survey of the literature (eng). Environmental Management 51(1):251–266.
Van Meijl, H., Havlik, P., Lotze-Campen, H., Stehfest, E., Witzke, P., Pérez Domínguez, I., Leon Bodirsky, B. et al. 2018. Comparing Impacts of Climate Change and Mitigation on Global Agriculture by 2050. Environmental Research Letters 13(6): 064021
Weiss, F., Jansson, T. 2017. Establishing a common accounting system for the LCA and emission leakage in the CAPRI model. SUSFANS deliverable 4.3. Available at susfans.eu/portfolio-category/deliverables
Witzke, P., Kempen, M., Perez Domınguez, I., Jannson, T., Sckokai, P., Helming, J., Heckelei, T., Moro, D., Tonini, A., Fellmann, T. 2009. Regional Economic Analysis of Milk Quota Reform in the EU. JRC Scientific and Technical Reports, Publications Office of the European Union, Luxembourg.
Wollenberg, E., Richards, M., Smith, P., Havlik, P., Obersteiner, M., Tubiello, F. N., et al. 2016. Reducing emissions from agriculture to meet the 2 C target. Global change biology 22:3859-3864.

76
List of abbreviations and definitions
AECM Agri-Environmental and Climate Measure
AFOLU Agriculture, forest and other land use
AIR Rural Development Annual Implementation Report
ANC Areas with Natural Constraints
BDS Biodiversity Strategy (COM(2020)380)
BISS Basic income support for sustainability
BPS Basic Payment Scheme
CAP Common Agricultural Policy
CAP LP Common Agricultural Policy Legal Proposal
CAP SP Common Agricultural Policy Strategic Plan
CAPRI Common Agricultural Policy Regionalised Impact Model
CRISS Complementary redistributive income support for sustainability
DP Direct Payments
ECS Eco-Scheme
EGD European Green Deal
ETS Emission Trading Scheme
F2F Farm to Fork Strategy (COM(2020)381)
FAST Farm Sustainability Tool for nutrients
GAEC Good agricultural and environmental conditions
GHG Greenhouse gases
GNB Gross Nitrogen Balance
HRI Harmonized Risk Indicator
IPM Integrated Pest Management
LCA Life cycle analysis
LUCAS Land Use Cover Area frame Survey
LULUCF Land use, land-use change and forestry
NGEU Next Generation EU
PPP Plant protection products
RD Rural Development
SAPS Single Area Payment Scheme
SMR Statutory Management Requirements
SUPREMA Support for Policy Relevant Modelling of Agriculture
SWOT Strength Weakness Opportunity Threat
TRQ Tariff rate quota
UNFCCC United Nations Framework Convention on Climate Change
VCS Voluntary Coupled Support
WTO World Trade Organization

77
List of figures
Figure 1. The CAP in historical perspective .........................................................................................................................................................8
Figure 2. Historical evolution of CAP expenditure by type of policy instruments (1980-2020) .......................................9
Figure 3. The nine CAP objectives ......................................................................................................................................................................... 12
Figure 4. Green architecture in the CAP LP ..................................................................................................................................................... 14
Figure 5. EU-27 area (ha) or animal number and supply changes in 2030 for the F2F and BDS targets and CAP 2014-2020 scenario relative to the baseline ............................................................................................................................................... 40
Figure 6. EU-27 net trade for crops (upper figure) and livestock products (lower figure) in both baseline and F2F and BDS targets and CAP 2014-2020 scenario in 2030............................................................................................................. 42
Figure 7. Changes in EU-27 producer prices (top), total revenues and costs (bottom) for main crop and livestock aggregates for the F2F and BDS targets and CAP 2014-2020 scenario (2030 compared to baseline) .................................................................................................................................................................................................................................................... 44
Figure 8. Changes in the F2F and BDS targets and CAP 2014-2020 scenario compared to the baseline (2030) for nitrogen surplus (panel a); nitrogen leaching per hectare (panel b); ammonia emissions (panel c) and non-CO2 GHG emissions (panel d). .................................................................................................................................................................................. 47
Figure 9. Contribution of each technology and agronomic practice (above) and of production change (below) to total mitigation of non-CO2 and CO2 emissions under the F2F and BDS targets and CAP 2014-2020 scenario .................................................................................................................................................................................................................................................... 48
Figure 12. Changes in producer prices (top), and total revenues and costs (bottom) for main crop and livestock aggregates for the F2F and BDS targets & CAP LP and F2F and BDS targets & CAP LP + NGEU (2030 compared to baseline) ................................................................................................................................................................................................. 55
The total mitigation achieved can be split between changes in production (mix and levels) and mitigation achieved by technologies and agronomic practices. For non-CO2 emissions, the contribution of technologies is limited (24.8% of the total mitigation) while for non-CO2 and CO2 emissions together it increases to cover 53.8% of the total mitigation. By including the potential impact of the additional budget under NGEU (second scenario), these figures rise to 32.8% and 55.9% respectively. The split of mitigation by technologies and production mix, for non-CO2 and CO2 emissions, is shown in Figure 13. The distribution of the total mitigation effort at regional level is shown in ...................................................................................................................................................................... 56
Figure 13. Contribution of each technology and agronomic practice (above) and of production change (below) to total mitigation of non-CO2 and CO2 emissions under the F2F and BDS targets & CAP LP and F2F and BDS targets & CAP LP scenarios ...................................................................................................................................................................................... 57
Figure 15. Change in adoption rates between the F2F and BDS targets & CAP LP and the F2F and BDS targets & CAP LP + NGEU scenarios for technologies for which costs are reduced as a result of the NGEU additional budget .................................................................................................................................................................................................................................... 61
Figure 16. Impacts on environmental indicators under the F2F and BDS targets, CAP LP and CAP LP + NGEU scenarios (% change compared to baseline in 2030).............................................................................................................................. 66
Figure 17. Share of total mitigation due to adoption of technology and farm practices and leakage of domestic mitigation to the rest of the world, under the F2F and BDS targets, CAP LP and CAP LP + NGEU scenarios (% of EU mitigation in 2030)............................................................................................................................................................ 67
Figure 18. Impacts on EU27 UAA and supply for selected products under the F2F and BDS targets & CAP 2014-2020, CAP LP and CAP LP + NGEU scenarios (% change compared to baseline in 2030) ................................ 68
78
List of tables
Table 1. Interventions provided by the CAP Legal Proposal ................................................................................................................. 13
Table 2. Areas of intervention affecting the agricultural sector mentioned in the F2F and BDS strategies ........ 16
Table 3. Technological GHG emission mitigation options included in CAPRI ............................................................................. 22
Table 4. Technological ammonia emission mitigation options included in CAPRI (with cross-over effects on GHG emissions)................................................................................................................................................................................................................. 22
Table 5. Targets considered in the analysis ................................................................................................................................................... 23
Table 6. Core CAP assumptions for baseline and scenarios. ............................................................................................................... 27
Table 8. Measures implemented as part of the conditionality associated with basic income support for sustainability (BISS) by 2030 .................................................................................................................................................................................. 29
Table 9. Correspondence between measures implemented and budget in the F2F and BDS targets & CAP LP scenario ................................................................................................................................................................................................................................. 30
Table 10. Adoption of mitigation technologies and farm practice in the F2F and BDS targets & CAP LP and F2F and BDS targets & CAP LP + NGEU scenarios .............................................................................................................................................. 31
Table 11. Agriculture-related targets in F2F and BDS strategies and their translation into CAPRI model constraints ........................................................................................................................................................................................................................... 33
Table 12. Assumptions for splitting MS level efforts to reach targets for EU area under organic farming ......... 34
Table 13. Yield % differences between organic and conventional crops by agro-ecological region estimated from FADN data. .............................................................................................................................................................................................................. 35
Table 14. Interaction between the assumptions made for each of the targets in the stand-alone implementation. ............................................................................................................................................................................................................... 39
Table 15. Environmental effects of the F2F and BDS targets and CAP 2014-2020 scenario (% change from baseline in 2030) ............................................................................................................................................................................................................ 46
Table 16. GHG emissions (1000 t CO2eq) for the F2F and BDS targets and CAP 2014-2020 scenario, % reduction compared to baseline and % of the reduction offset by increased emissions in the rest of the world (leakage). .............................................................................................................................................................................................................................. 47
Table 17. Adoption of mitigation technologies and farm practices in the F2F and BDS targets and CAP 2014-2020 scenario ................................................................................................................................................................................................................... 49
Table 18. Contribution of mitigation technologies to reduction of CO2 and non-CO2 GHG emissions in EU27 (in 1,000 t of CO2eq) in the F2F and BDS targets and CAP 2014-2020 scenario- Values are absolute changes to baseline scenario (negative values mean reduction in emissions, positive values increases). ..................................... 50
Table 19. Producer price impacts under the standard scenario and the three sensitivity analyses performed (% change to the baseline) ............................................................................................................................................................................................... 52
Figure 10. EU-27 area (ha) or animal number and supply changes in 2030 for the F2F and BDS targets & CAP LP and F2F and BDS targets & CAP LP + NGEU scenarios, relative to the baseline ............................................................ 53
Figure 11. EU27 crop (left) and livestock products (right) net trade (exports minus imports) in baseline, F2F and BDS targets & CAP LP and F2F and BDS targets & CAP LP + NGEU scenarios in 2030 ......................................... 54
Table 20. GHG emissions (1,000 t CO2eq) for the different scenarios analysed, % reduction compared to baseline and % of the reduction offset by increased emissions in the rest of the world (leakage). ........................ 56
Table 21. Contribution of mitigation technologies to reduction of CO2 and non-CO2 GHG emissions in EU-27 (in 1,000 tons CO2eq). Values are absolute changes to baseline scenario (negative values mean reduction in emissions, positive values increases). ................................................................................................................................................................ 58
Table 22. Environmental effects of the F2F and BDS targets & CAP LP and F2F and BDS targets & CAP LP + NGEU scenarios (% change from baseline in 2030) ................................................................................................................................. 59
Table 23. Percentage change in EU-27 (kg of CO2eq per tonne of product for representative products) compared to the baseline (LCA factors) ........................................................................................................................................................... 60

79
Table 24. Price impacts for pork under the standard scenario and the two sensitivity analyses performed (% change to the baseline) ............................................................................................................................................................................................... 61
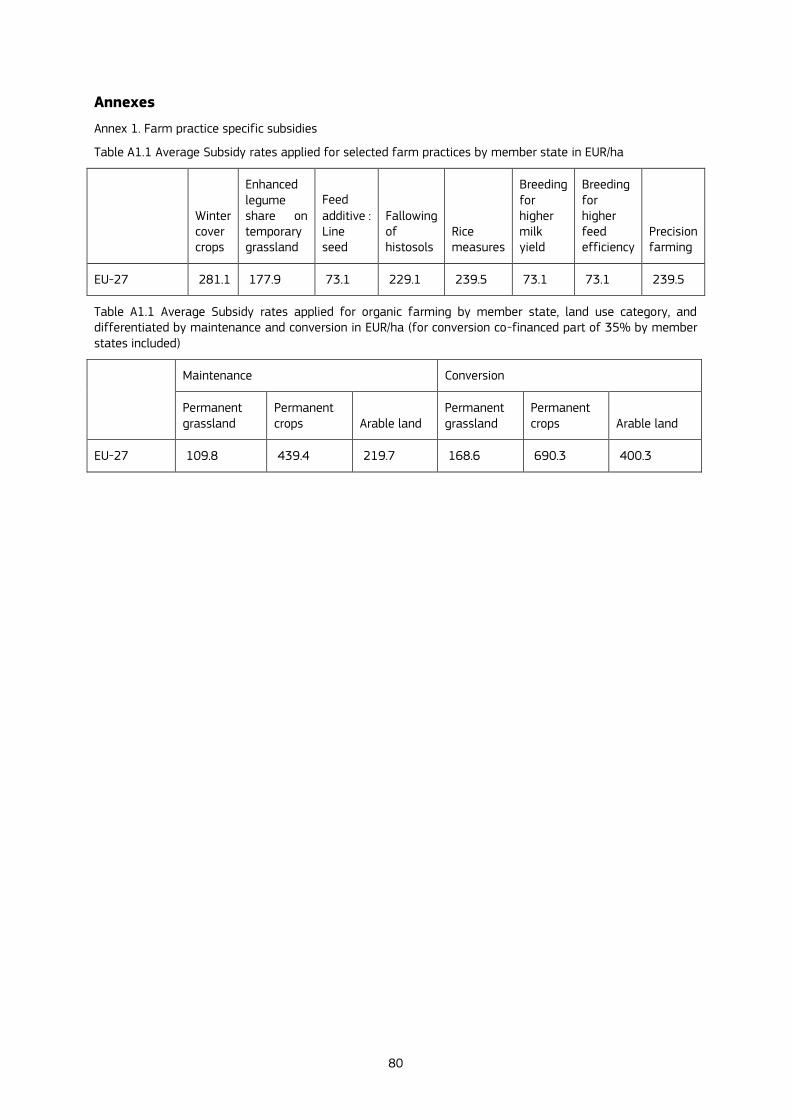
80
Annexes
Annex 1. Farm practice specific subsidies
Table A1.1 Average Subsidy rates applied for selected farm practices by member state in EUR/ha
Winter cover crops
Enhanced legume share on temporary grassland
Feed additive : Line seed
Fallowing of histosols
Rice measures
Breeding for higher milk yield
Breeding for higher feed efficiency
Precision farming
EU-27 281.1 177.9 73.1 229.1 239.5 73.1 73.1 239.5
Table A1.1 Average Subsidy rates applied for organic farming by member state, land use category, and differentiated by maintenance and conversion in EUR/ha (for conversion co-financed part of 35% by member states included)
Maintenance Conversion
Permanent grassland
Permanent crops Arable land
Permanent grassland
Permanent crops Arable land
EU-27 109.8 439.4 219.7 168.6 690.3 400.3
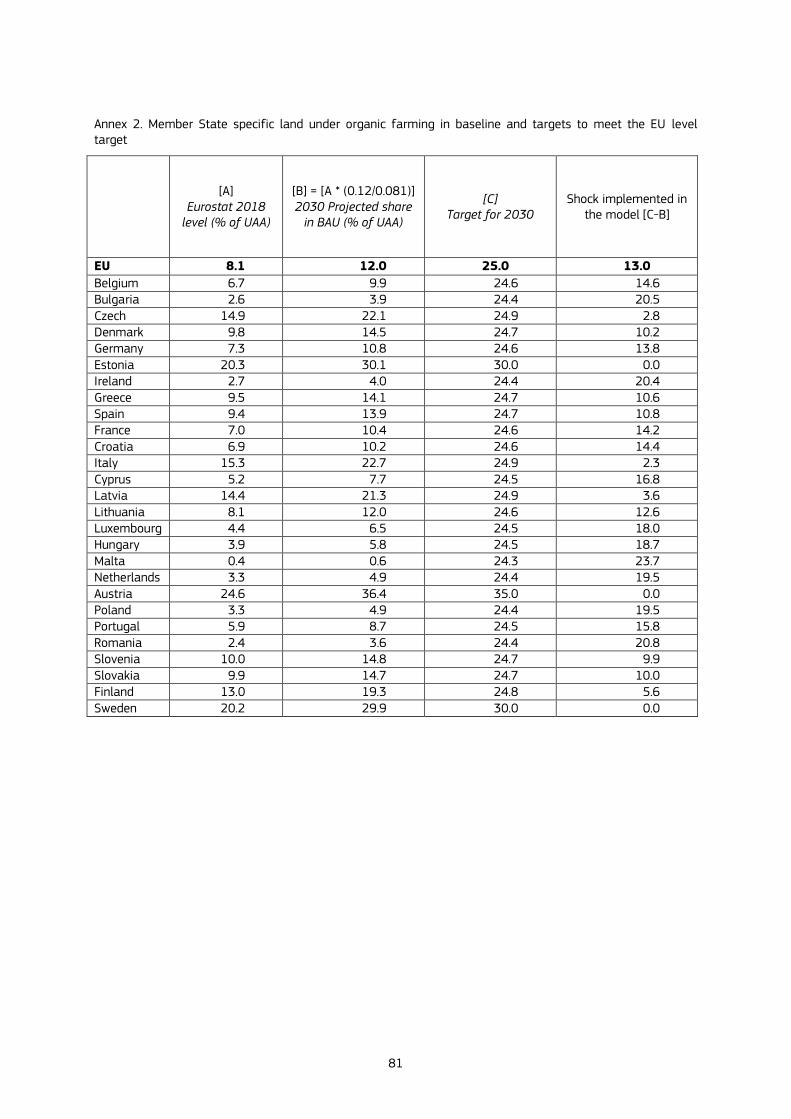
81
Annex 2. Member State specific land under organic farming in baseline and targets to meet the EU level target
[A] Eurostat 2018
level (% of UAA)
[B] = [A * (0.12/0.081)] 2030 Projected share
in BAU (% of UAA)
[C] Target for 2030
Shock implemented in the model [C-B]
EU 8.1 12.0 25.0 13.0
Belgium 6.7 9.9 24.6 14.6 Bulgaria 2.6 3.9 24.4 20.5 Czech 14.9 22.1 24.9 2.8 Denmark 9.8 14.5 24.7 10.2 Germany 7.3 10.8 24.6 13.8 Estonia 20.3 30.1 30.0 0.0 Ireland 2.7 4.0 24.4 20.4 Greece 9.5 14.1 24.7 10.6 Spain 9.4 13.9 24.7 10.8 France 7.0 10.4 24.6 14.2 Croatia 6.9 10.2 24.6 14.4 Italy 15.3 22.7 24.9 2.3 Cyprus 5.2 7.7 24.5 16.8 Latvia 14.4 21.3 24.9 3.6 Lithuania 8.1 12.0 24.6 12.6 Luxembourg 4.4 6.5 24.5 18.0 Hungary 3.9 5.8 24.5 18.7 Malta 0.4 0.6 24.3 23.7 Netherlands 3.3 4.9 24.4 19.5 Austria 24.6 36.4 35.0 0.0 Poland 3.3 4.9 24.4 19.5 Portugal 5.9 8.7 24.5 15.8 Romania 2.4 3.6 24.4 20.8 Slovenia 10.0 14.8 24.7 9.9 Slovakia 9.9 14.7 24.7 10.0 Finland 13.0 19.3 24.8 5.6 Sweden 20.2 29.9 30.0 0.0
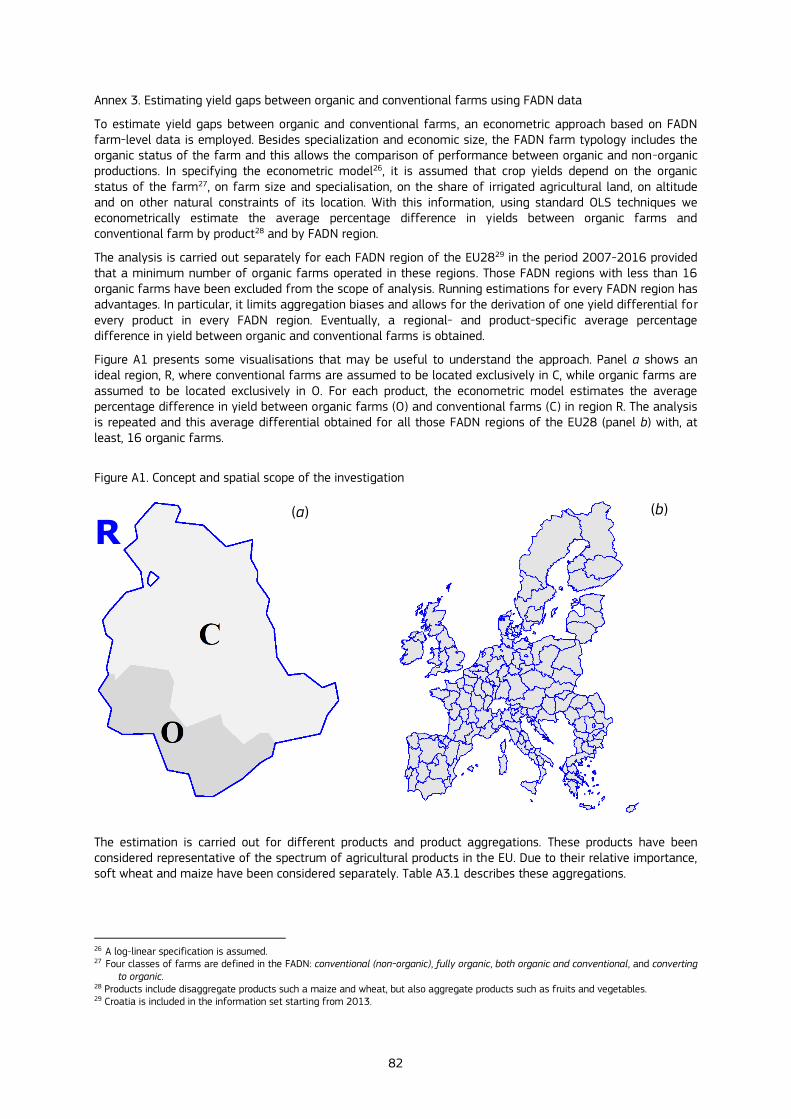
82
Annex 3. Estimating yield gaps between organic and conventional farms using FADN data
To estimate yield gaps between organic and conventional farms, an econometric approach based on FADN farm-level data is employed. Besides specialization and economic size, the FADN farm typology includes the organic status of the farm and this allows the comparison of performance between organic and non-organic productions. In specifying the econometric model26, it is assumed that crop yields depend on the organic status of the farm27, on farm size and specialisation, on the share of irrigated agricultural land, on altitude and on other natural constraints of its location. With this information, using standard OLS techniques we econometrically estimate the average percentage difference in yields between organic farms and conventional farm by product28 and by FADN region.
The analysis is carried out separately for each FADN region of the EU2829 in the period 2007-2016 provided that a minimum number of organic farms operated in these regions. Those FADN regions with less than 16 organic farms have been excluded from the scope of analysis. Running estimations for every FADN region has advantages. In particular, it limits aggregation biases and allows for the derivation of one yield differential for every product in every FADN region. Eventually, a regional- and product-specific average percentage difference in yield between organic and conventional farms is obtained.
Figure A1 presents some visualisations that may be useful to understand the approach. Panel a shows an ideal region, R, where conventional farms are assumed to be located exclusively in C, while organic farms are assumed to be located exclusively in O. For each product, the econometric model estimates the average percentage difference in yield between organic farms (O) and conventional farms (C) in region R. The analysis is repeated and this average differential obtained for all those FADN regions of the EU28 (panel b) with, at least, 16 organic farms.
Figure A1. Concept and spatial scope of the investigation
The estimation is carried out for different products and product aggregations. These products have been considered representative of the spectrum of agricultural products in the EU. Due to their relative importance, soft wheat and maize have been considered separately. Table A3.1 describes these aggregations.
26 A log-linear specification is assumed. 27 Four classes of farms are defined in the FADN: conventional (non-organic), fully organic, both organic and conventional, and converting
to organic. 28 Products include disaggregate products such a maize and wheat, but also aggregate products such as fruits and vegetables. 29 Croatia is included in the information set starting from 2013.
R (a) (b)
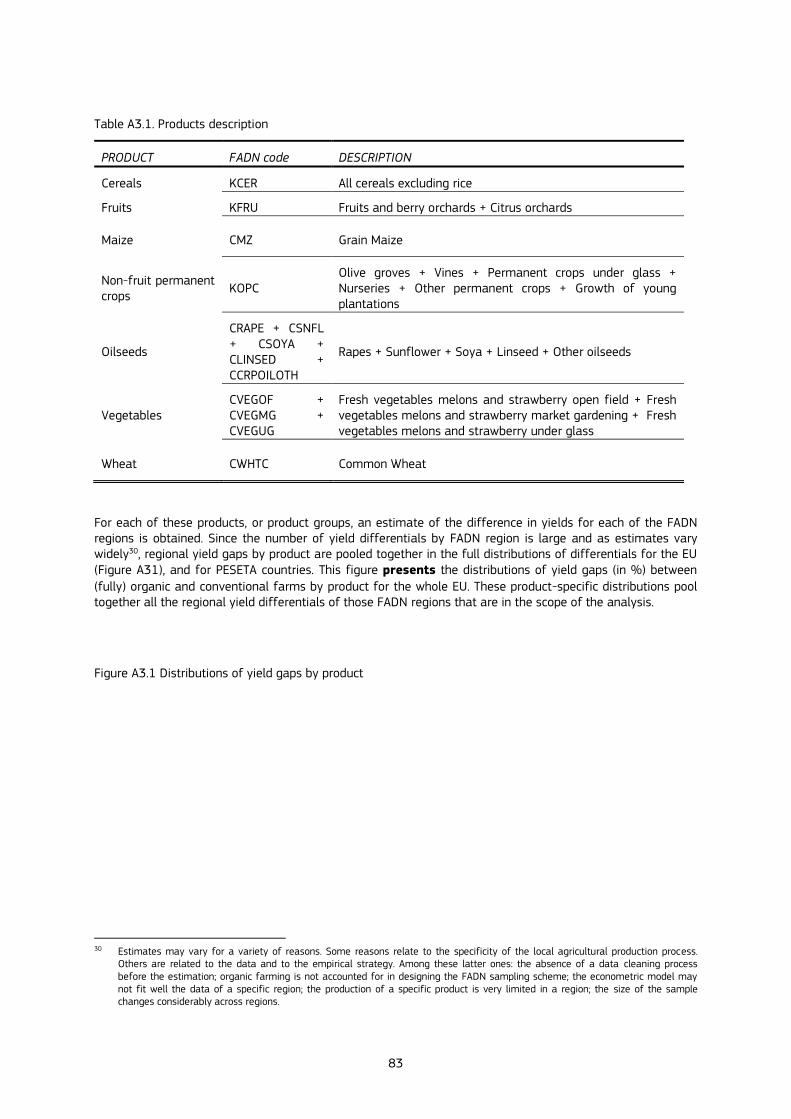
83
Table A3.1. Products description
PRODUCT FADN code DESCRIPTION
Cereals KCER All cereals excluding rice
Fruits KFRU Fruits and berry orchards + Citrus orchards
Maize CMZ Grain Maize
Non-fruit permanent crops
KOPC Olive groves + Vines + Permanent crops under glass + Nurseries + Other permanent crops + Growth of young plantations
Oilseeds
CRAPE + CSNFL + CSOYA + CLINSED + CCRPOILOTH
Rapes + Sunflower + Soya + Linseed + Other oilseeds
Vegetables CVEGOF + CVEGMG + CVEGUG
Fresh vegetables melons and strawberry open field + Fresh vegetables melons and strawberry market gardening + Fresh vegetables melons and strawberry under glass
Wheat CWHTC Common Wheat
For each of these products, or product groups, an estimate of the difference in yields for each of the FADN regions is obtained. Since the number of yield differentials by FADN region is large and as estimates vary widely30, regional yield gaps by product are pooled together in the full distributions of differentials for the EU (Figure A31), and for PESETA countries. This figure presents the distributions of yield gaps (in %) between
(fully) organic and conventional farms by product for the whole EU. These product-specific distributions pool together all the regional yield differentials of those FADN regions that are in the scope of the analysis.
Figure A3.1 Distributions of yield gaps by product
30 Estimates may vary for a variety of reasons. Some reasons relate to the specificity of the local agricultural production process.
Others are related to the data and to the empirical strategy. Among these latter ones: the absence of a data cleaning process before the estimation; organic farming is not accounted for in designing the FADN sampling scheme; the econometric model may not fit well the data of a specific region; the production of a specific product is very limited in a region; the size of the sample changes considerably across regions.

84
Table A3.2 presents the median yield gap (in %) between (fully) organic farms and conventional farms, by product, for the whole EU. These gaps are obtained by taking the median of the distributions in Figure A3.1 The median yield gap has been preferred over the average yield gap because more robust to outliers. Table A3.2 shows that the production of organic cereals is generally associated with a 30.5% reduction in yields with respect to conventional productions. Wheat is associated with a yield gap of 36.2%, while maize is associated with a yield gap of 15.3%. Organic oilseeds are associated with the largest gap of 39% while organic vegetables are associated with a gap of 14.9%.
Table A3.2. Median yield gap by product
PRODUCT Median
Yield Gap (%)
Cereals -30.5
Fruits -35.6
Maize -15.3
Non-fruit permanent crops -15.8
Oilseeds -39.0
Vegetables -14.9
Wheat -36.2
Table A3.3 presents the median yield gap (in %) between (fully) organic farms and conventional farms by product and by PESETA countries. These numbers have been obtained by taking the median of the distributions of yield gaps by product and by Peseta region. These results confirm that yields of organic farms are considerably lower than those of conventional farms. Moreover, significant spatial variation in gaps can be observed across the EU. In general, it seems as organic production in Central Europe South and in Southern Europe are associated with lower yield gaps. In these regions, gaps vary between -4.6% and -57.1%. Particularly low seem to be the gaps in Southern Europe (between -4.6% and -22.5%). Yield gaps in Central Europe North and in Northern Europe are somewhat higher instead. They vary between -5.2% (for non-fruits permanent crops in Northern Europe) to -56.7% (for oilseeds in Central Europe North). The largest gaps have been observed in the UK & Ireland where yields of organic productions have been estimated lower than conventional by 45.4% (for cereals), 55.9% (for wheat), 63.6% (for fruits), and 76.4% (for vegetables). In the UK yield gaps are lower than other regions only for production of non-fruit permanent crops (-3.8%). In
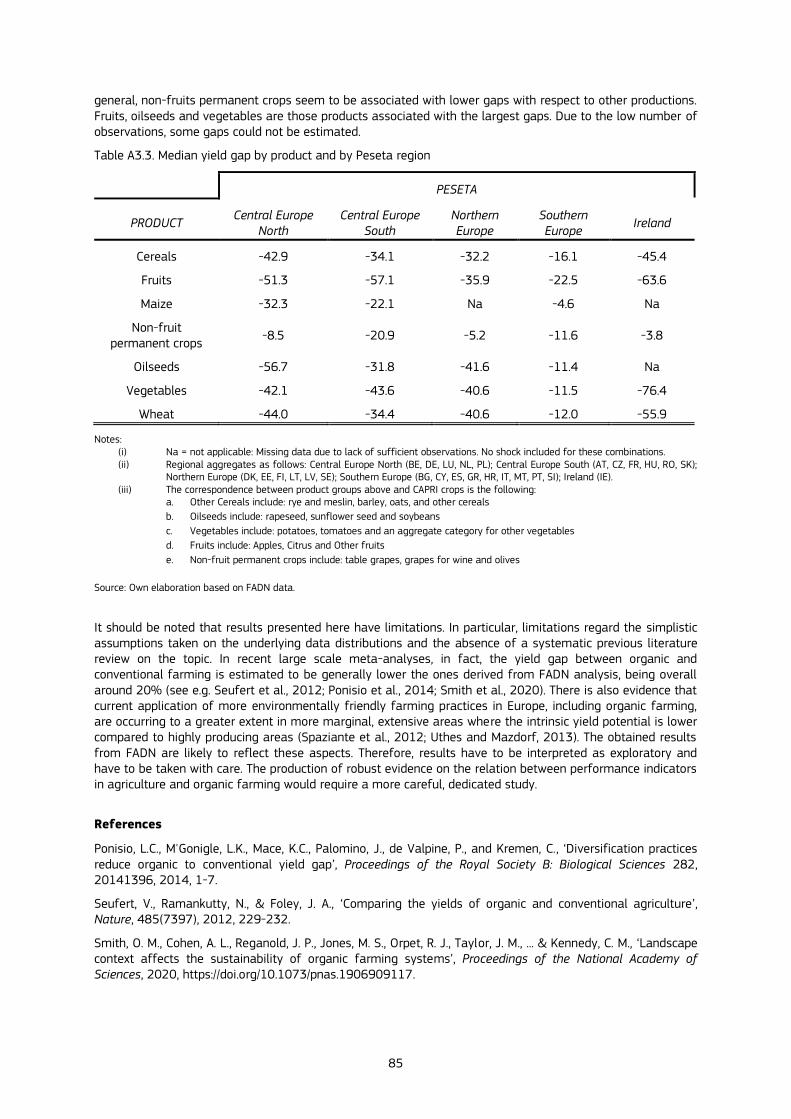
85
general, non-fruits permanent crops seem to be associated with lower gaps with respect to other productions. Fruits, oilseeds and vegetables are those products associated with the largest gaps. Due to the low number of observations, some gaps could not be estimated.
Table A3.3. Median yield gap by product and by Peseta region
PESETA
PRODUCT Central Europe
North Central Europe
South Northern Europe
Southern Europe
Ireland
Cereals -42.9 -34.1 -32.2 -16.1 -45.4
Fruits -51.3 -57.1 -35.9 -22.5 -63.6
Maize -32.3 -22.1 Na -4.6 Na
Non-fruit permanent crops
-8.5 -20.9 -5.2 -11.6 -3.8
Oilseeds -56.7 -31.8 -41.6 -11.4 Na
Vegetables -42.1 -43.6 -40.6 -11.5 -76.4
Wheat -44.0 -34.4 -40.6 -12.0 -55.9
Notes: (i) Na = not applicable: Missing data due to lack of sufficient observations. No shock included for these combinations. (ii) Regional aggregates as follows: Central Europe North (BE, DE, LU, NL, PL); Central Europe South (AT, CZ, FR, HU, RO, SK);
Northern Europe (DK, EE, FI, LT, LV, SE); Southern Europe (BG, CY, ES, GR, HR, IT, MT, PT, SI); Ireland (IE). (iii) The correspondence between product groups above and CAPRI crops is the following:
a. Other Cereals include: rye and meslin, barley, oats, and other cereals
b. Oilseeds include: rapeseed, sunflower seed and soybeans
c. Vegetables include: potatoes, tomatoes and an aggregate category for other vegetables
d. Fruits include: Apples, Citrus and Other fruits
e. Non-fruit permanent crops include: table grapes, grapes for wine and olives
Source: Own elaboration based on FADN data.
It should be noted that results presented here have limitations. In particular, limitations regard the simplistic assumptions taken on the underlying data distributions and the absence of a systematic previous literature review on the topic. In recent large scale meta-analyses, in fact, the yield gap between organic and conventional farming is estimated to be generally lower the ones derived from FADN analysis, being overall around 20% (see e.g. Seufert et al., 2012; Ponisio et al., 2014; Smith et al., 2020). There is also evidence that current application of more environmentally friendly farming practices in Europe, including organic farming, are occurring to a greater extent in more marginal, extensive areas where the intrinsic yield potential is lower compared to highly producing areas (Spaziante et al., 2012; Uthes and Mazdorf, 2013). The obtained results from FADN are likely to reflect these aspects. Therefore, results have to be interpreted as exploratory and have to be taken with care. The production of robust evidence on the relation between performance indicators in agriculture and organic farming would require a more careful, dedicated study.
References
Ponisio, L.C., M'Gonigle, L.K., Mace, K.C., Palomino, J., de Valpine, P., and Kremen, C., ‘Diversification practices reduce organic to conventional yield gap’, Proceedings of the Royal Society B: Biological Sciences 282, 20141396, 2014, 1-7.
Seufert, V., Ramankutty, N., & Foley, J. A., ‘Comparing the yields of organic and conventional agriculture’, Nature, 485(7397), 2012, 229-232.
Smith, O. M., Cohen, A. L., Reganold, J. P., Jones, M. S., Orpet, R. J., Taylor, J. M., ... & Kennedy, C. M., ‘Landscape context affects the sustainability of organic farming systems’, Proceedings of the National Academy of Sciences, 2020, https://doi.org/10.1073/pnas.1906909117.
86
Spaziante, A., Rega, C., Carbone, M., & Murano, C. ‘Strategic Environmental Assessment (SEA) of rural development programs in the European Union–Towards a more efficient monitoring of the environmental effects of agricultural policies’, In Rural Development-Contemporary Issues and Practices, 2012, IntechOpen.
Uthes, S., Matzdorf, B., ‘Studies on agri-environmental measures: a survey of the literature (eng)’, Environ. Manage. 51 (1), 2013, 251–266. https://doi.org/10.1007/s00267-012-9959-6.
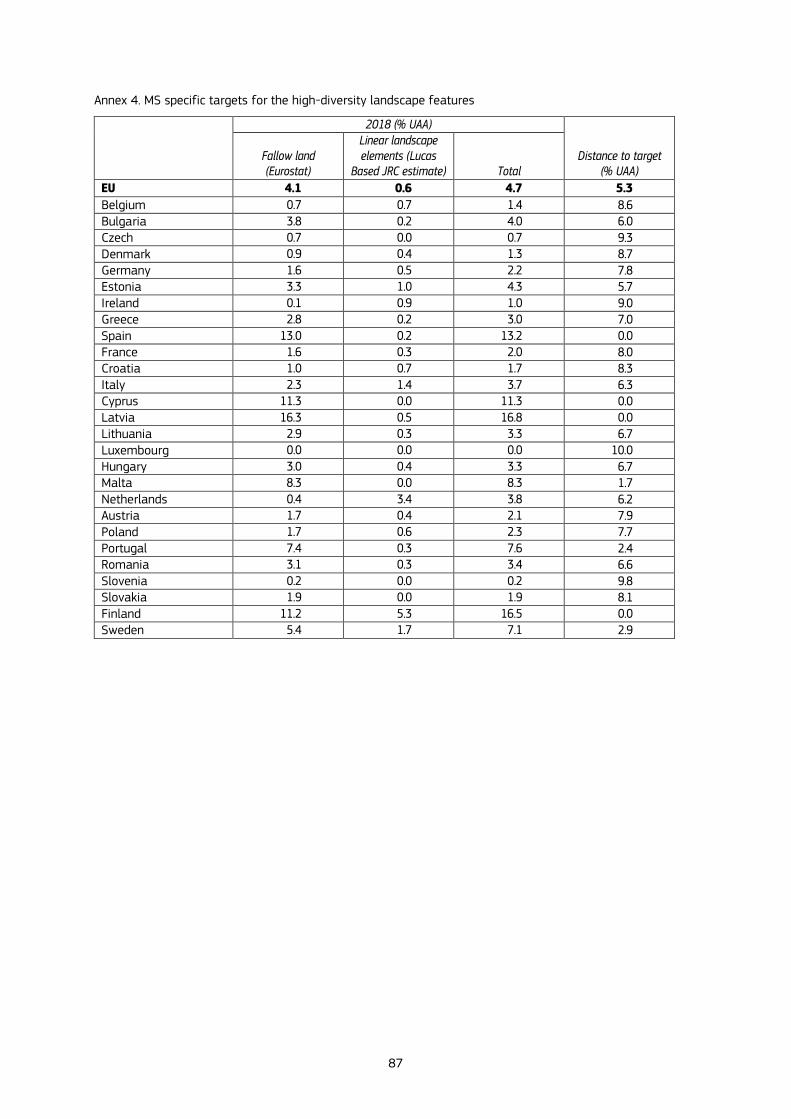
87
Annex 4. MS specific targets for the high-diversity landscape features
2018 (% UAA)
Distance to target (% UAA)
Fallow land (Eurostat)
Linear landscape elements (Lucas
Based JRC estimate) Total
EU 4.1 0.6 4.7 5.3
Belgium 0.7 0.7 1.4 8.6 Bulgaria 3.8 0.2 4.0 6.0 Czech 0.7 0.0 0.7 9.3 Denmark 0.9 0.4 1.3 8.7 Germany 1.6 0.5 2.2 7.8 Estonia 3.3 1.0 4.3 5.7 Ireland 0.1 0.9 1.0 9.0 Greece 2.8 0.2 3.0 7.0 Spain 13.0 0.2 13.2 0.0 France 1.6 0.3 2.0 8.0 Croatia 1.0 0.7 1.7 8.3 Italy 2.3 1.4 3.7 6.3 Cyprus 11.3 0.0 11.3 0.0 Latvia 16.3 0.5 16.8 0.0 Lithuania 2.9 0.3 3.3 6.7 Luxembourg 0.0 0.0 0.0 10.0 Hungary 3.0 0.4 3.3 6.7 Malta 8.3 0.0 8.3 1.7 Netherlands 0.4 3.4 3.8 6.2 Austria 1.7 0.4 2.1 7.9 Poland 1.7 0.6 2.3 7.7 Portugal 7.4 0.3 7.6 2.4 Romania 3.1 0.3 3.4 6.6 Slovenia 0.2 0.0 0.2 9.8 Slovakia 1.9 0.0 1.9 8.1 Finland 11.2 5.3 16.5 0.0 Sweden 5.4 1.7 7.1 2.9

88
Annex 5. Mitigation technology budgets per member state (in 1000 Euro) in 2030
Nitrogen fixing crops No tillage
Enhanced crop
rotation Catch crops
Nutrient mgmt.
Landscape features IPM
Organic farming
Legume share in
grassland Feed
additives Fallowing histosols
Rice measures
More extensive breeding system
Cattle genomics
Precision farming Others Total
BE
13,288
423
1,808
1,077
19,905
39,923
9,161
67,725
2,403
2,643
1
-
3,275
477
402
4,298
166,808
BG
4,028 -
20,141
-
9,267
-
-
238,581
9,394
1,595
-
1,484
35,666
357
1,671
28,533
350,717
CZ
1,438
4,953
7,192
3,339
96,804
8,409
64,536
95,629
49,286
-
868
-
3
-
3,367
60,659
396,483
DK
-
147
-
184
1,104
138
736
154,878
82,093
-
27
-
25,033
-
1,211
20,315
285,867
DE
73,775
78,672
154,919
23,414
209,437
137,979
108,764
805,013
47,653
10,935
83
-
39,805
1,839
4,531
32,667
1,729,485
EE
1,646
130
8,232
137
108
-
72
39,361
4,959
-
1,068
-
25,279
-
1,190
23,658
105,839
IE
12,431
25,932
62,153
20,870
40,270
70,632
26,846
126,461
22,279
-
-
-
2,132
-
1,017
1,777
412,801
EL
179
4,681
894
4,082
98,864
8,259
44,823
427,847
5,399
4,894
551
3,207
29,076
1,906
2,822
82,420
719,903
ES
3,419
102,177
17,094
99,555
346,866
6,311
60,909
1,088,896
16,392
9,371
6,267
3,449
11,578
914
5,771
14,242
1,793,211
FR
3,788
182
25,026
40,714
436,748
23,932
201,641
1,400,646
62,943
56,260
-
959
109,643
4,781
5,595
91,950
2,464,809
HR
-
2,284
-
1,761
9,929
8,467
6,620
119,438
468
-
-
-
-
-
1,898
65,897
216,762
IT
-
42,067 -
70
34,472 -
2,032 -
557 -
2,715
961,014
38,506
85
45
17,928
218,388
-
7,694
174,711
1,489,536
CY
51
76
256
65
4,526
0
3,017
12,358
115
-
3
-
594
-
140
1,079
22,282
LV
99
20,963
495
14,251
10,858
3,442
7,239
59,400
1,900
-
-
-
4,499
-
790
17,751
141,686
LT
12
7,438
717
1,929
44,091
1,454
30,273
119,316
5,214
2,762
68
-
7,659
54
926
13,726
235,639
LU
42
305
220
261
1,195
2,613
234
5,922
294
148
-
-
1,152
49
96
2,496
15,027
HU
1,821
16,788
9,106
13,444
126,227
120,592
61,145
234,872
4,533
5,325
84
210
6,562
2,552
4,229
5,253
612,742
MT
-
2,516
-
2,119
84 - 3
56
2,271
161
-
-
-
874
-
231
699
9,009
NL
98
7,375
490
6,371
10,823
72,014
7,215
103,353
15,636
-
-
-
-
-
982
31,292
255,649
AT
108
3,187
542
11,208
8,658
39,683
6,311
144,727
23,733
72
-
-
112,369
-
6,584
89,895
447,078
PL
46,772
55,123
233,862
44,635
-
1,313
-
715,304
808
-
143,502
-
1,119
-
3,712
78,289
1,324,439
PT
-
6,350
-
3,810
115,771
614
92,023
154,587
10,631
-
-
2,152
45,346
-
7,917
51,255
490,457
RO
-
79,563
-
5,946
-
-
-
627,904
58,460
-
-
1,127
112,194
-
5,931
89,756
980,882
SI
522
9,189
2,609
7,849
4,049
255
2,700
19,051
2,219
-
104
-
10,984
-
1,072
20,390
80,992
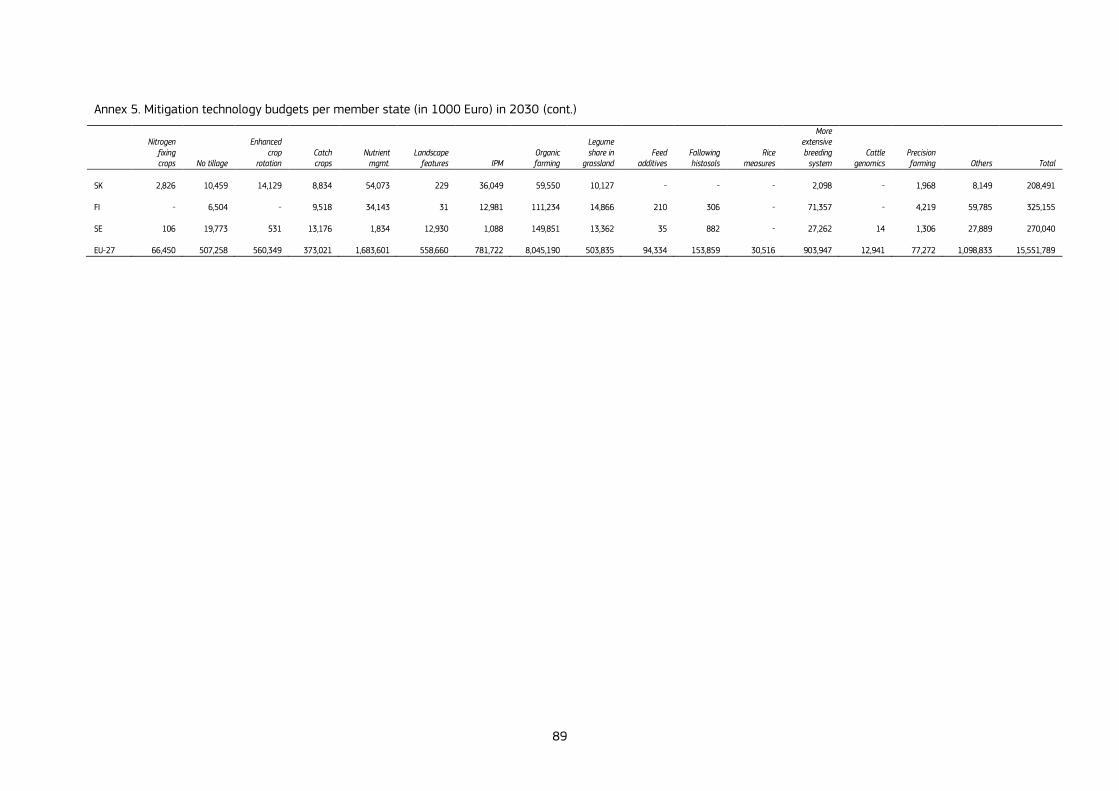
89
Annex 5. Mitigation technology budgets per member state (in 1000 Euro) in 2030 (cont.)
Nitrogen fixing crops No tillage
Enhanced crop
rotation Catch crops
Nutrient mgmt.
Landscape features IPM
Organic farming
Legume share in
grassland Feed
additives Fallowing histosols
Rice measures
More extensive breeding
system Cattle
genomics Precision farming Others Total
SK
2,826
10,459
14,129
8,834
54,073
229
36,049
59,550
10,127
-
-
-
2,098
-
1,968
8,149
208,491
FI
-
6,504
-
9,518
34,143
31
12,981
111,234
14,866
210
306
-
71,357
-
4,219
59,785
325,155
SE
106
19,773
531
13,176
1,834
12,930
1,088
149,851
13,362
35
882
-
27,262
14
1,306
27,889
270,040
EU-27
66,450
507,258
560,349
373,021
1,683,601
558,660
781,722
8,045,190
503,835
94,334
153,859
30,516
903,947
12,941
77,272
1,098,833
15,551,789
GETTING IN TOUCH WITH THE EU
In person
All over the European Union there are hundreds of Europe Direct information centres. You can find the address of the centre nearest you at: https://europa.eu/european-union/contact_en
On the phone or by email
Europe Direct is a service that answers your questions about the European Union. You can contact this service:
- by freephone: 00 800 6 7 8 9 10 11 (certain operators may charge for these calls),
- at the following standard number: +32 22999696, or
- by electronic mail via: https://europa.eu/european-union/contact_en
FINDING INFORMATION ABOUT THE EU
Online
Information about the European Union in all the official languages of the EU is available on the Europa website at: https://europa.eu/european-union/index_en
EU publications
You can download or order free and priced EU publications from EU Bookshop at: https://publications.europa.eu/en/publications. Multiple copies of free publications may be obtained by contacting Europe Direct or your local information centre (see https://europa.eu/european-union/contact_en).
KJ-N
A-3
03
17
-EN-N
doi:10.2760/98160
ISBN 978-92-76-20889-1