Modelling Ecosystem Processes Acting On Upper Trophic ...
17
Western Washington University Western Washington University Western CEDAR Western CEDAR Salish Sea Ecosystem Conference 2014 Salish Sea Ecosystem Conference (Seattle, Wash.) May 1st, 3:30 PM - 5:00 PM Modelling Ecosystem Processes Acting On Upper Trophic Level Modelling Ecosystem Processes Acting On Upper Trophic Level Managed Species in the Salish Sea – Lessons Learned and Future Managed Species in the Salish Sea – Lessons Learned and Future Goals Goals David Preikshot Madrone Environmental, [email protected] Christopher James Harvey Northwest Fisheries Science Center (U.S.) Richard Ian Perry Canada. Department of Fisheries and Oceans Follow this and additional works at: https://cedar.wwu.edu/ssec Part of the Terrestrial and Aquatic Ecology Commons Preikshot, David; Harvey, Christopher James; and Perry, Richard Ian, "Modelling Ecosystem Processes Acting On Upper Trophic Level Managed Species in the Salish Sea – Lessons Learned and Future Goals" (2014). Salish Sea Ecosystem Conference. 241. https://cedar.wwu.edu/ssec/2014ssec/Day2/241 This Event is brought to you for free and open access by the Conferences and Events at Western CEDAR. It has been accepted for inclusion in Salish Sea Ecosystem Conference by an authorized administrator of Western CEDAR. For more information, please contact [email protected].
Transcript of Modelling Ecosystem Processes Acting On Upper Trophic ...

Western Washington University Western Washington University
Western CEDAR Western CEDAR
Salish Sea Ecosystem Conference 2014 Salish Sea Ecosystem Conference (Seattle, Wash.)
May 1st, 3:30 PM - 5:00 PM
Modelling Ecosystem Processes Acting On Upper Trophic Level Modelling Ecosystem Processes Acting On Upper Trophic Level
Managed Species in the Salish Sea – Lessons Learned and Future Managed Species in the Salish Sea – Lessons Learned and Future
Goals Goals
David Preikshot Madrone Environmental, [email protected]
Christopher James Harvey Northwest Fisheries Science Center (U.S.)
Richard Ian Perry Canada. Department of Fisheries and Oceans
Follow this and additional works at: https://cedar.wwu.edu/ssec
Part of the Terrestrial and Aquatic Ecology Commons
Preikshot, David; Harvey, Christopher James; and Perry, Richard Ian, "Modelling Ecosystem Processes Acting On Upper Trophic Level Managed Species in the Salish Sea – Lessons Learned and Future Goals" (2014). Salish Sea Ecosystem Conference. 241. https://cedar.wwu.edu/ssec/2014ssec/Day2/241
This Event is brought to you for free and open access by the Conferences and Events at Western CEDAR. It has been accepted for inclusion in Salish Sea Ecosystem Conference by an authorized administrator of Western CEDAR. For more information, please contact [email protected].
Modelling Ecosystem Processes in the Salish Sea Lessons Learned and Future Goals for Salmon
Research and Management
Dave Preikshot, Madrone Environmental [email protected] Harvey,National Marine Fisheries Service / [email protected] Perry,Fisheries and Oceans [email protected]
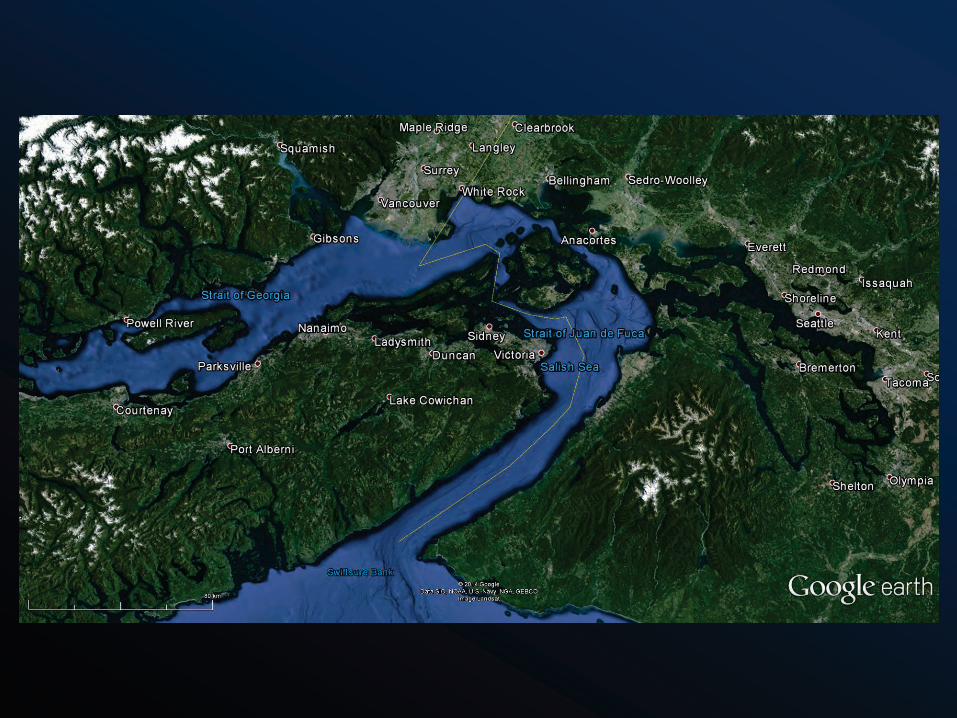
General Characteristics
Area (km2)Max Depth (m)Mean Depth (m)
Ecopath Model# of speciesFocus SpeciesYear(s)
Cent. Puget Sd.75728062
65Demersal fishes~2005
S. Puget Sd.44518742
44Bivalves1970, 2012
St. of Georgia8600450155
38Coho, Chinook1960, 2012
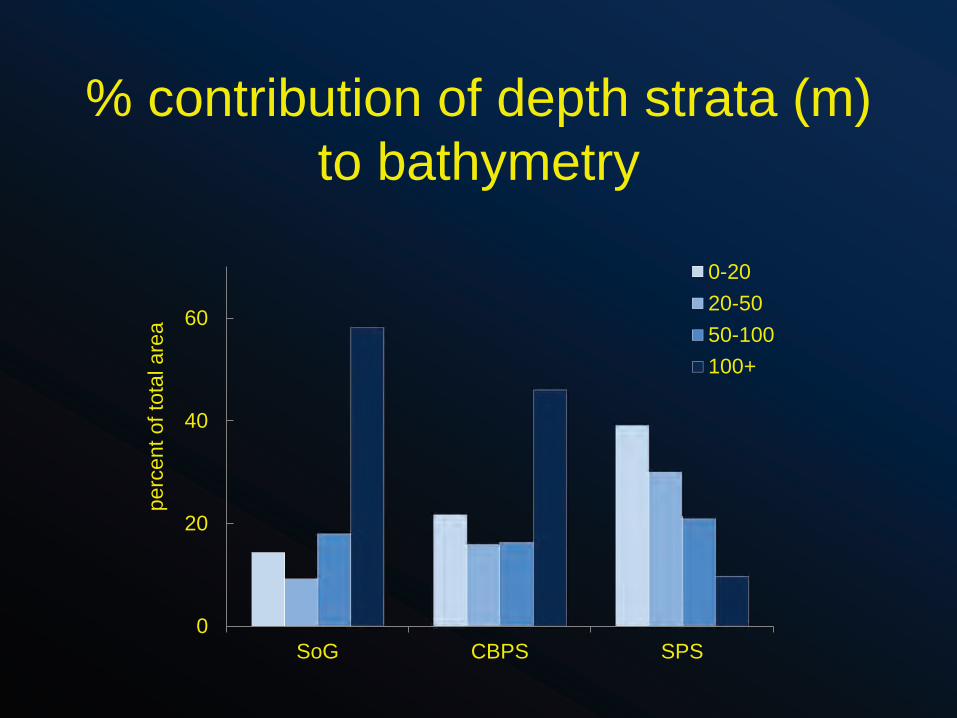
% contribution of depth strata (m) to bathymetry
0
20
40
60
SoG CBPS SPS
perc
ent o
f tot
al a
rea
0-2020-5050-100100+
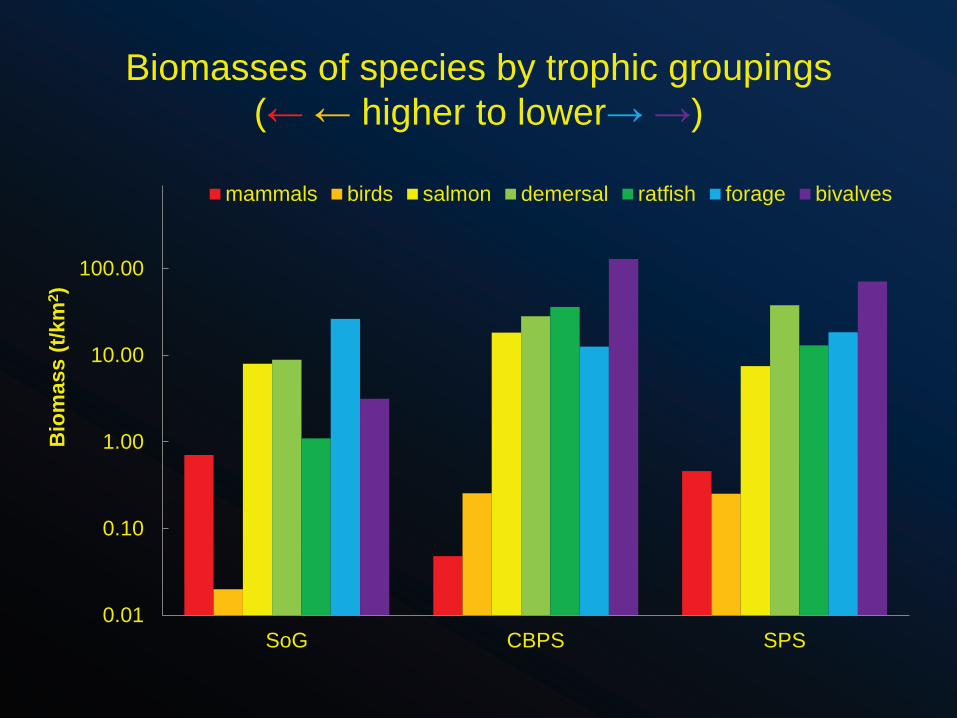
Biomasses of species by trophic groupings(←← higher to lower→→)
0.01
0.10
1.00
10.00
100.00
SoG CBPS SPS
Bio
mas
s (t/
km2 )
mammals birds salmon demersal ratfish forage bivalves

Harvests of major fisheries(←← higher to lower→→)
0.01
0.10
1.00
10.00
SoG CBPS SPS
Har
vest
(t/k
m2 )
salmon herring rockfish flatfish demersal crabs bivalves
Purpose and use of SoG model
• Examine historic ecosystem mechanisms influencing changes in Coho and Chinook Salmon populations
• Emphasis on interactions with predators, prey and competitors
• Examine potential future effects of climate change on ecosystem – level processes
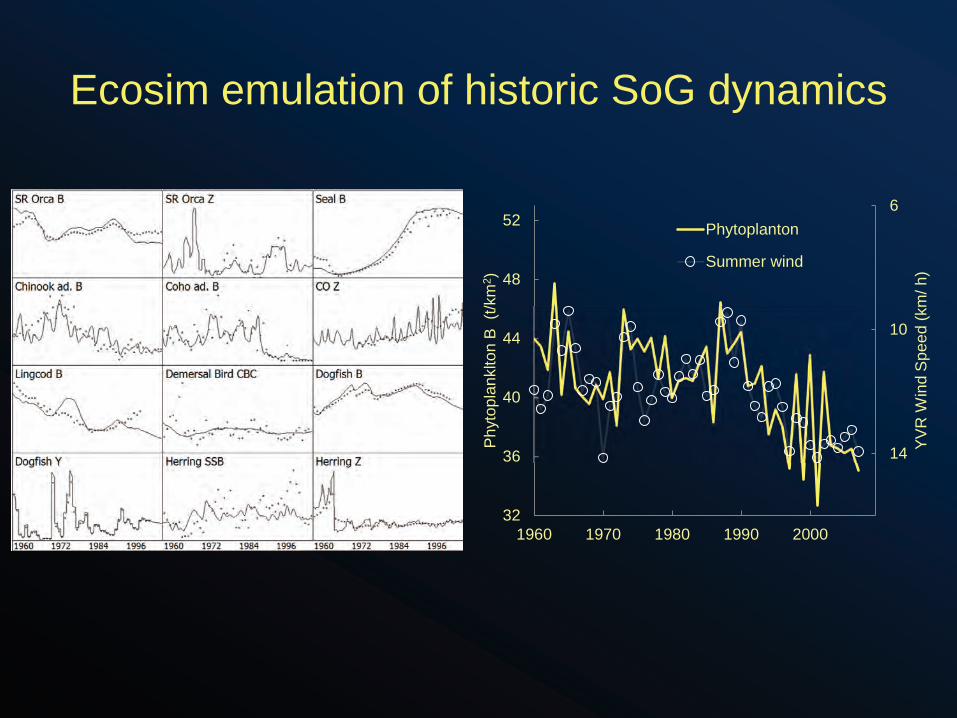
Ecosim emulation of historic SoG dynamics
6
10
14
32
36
40
44
48
52
1960 1970 1980 1990 2000
YVR
Win
d S
peed
(km
/ h)
Phy
topl
ankl
ton
B (
t/km
2 )
Phytoplanton
Summer wind
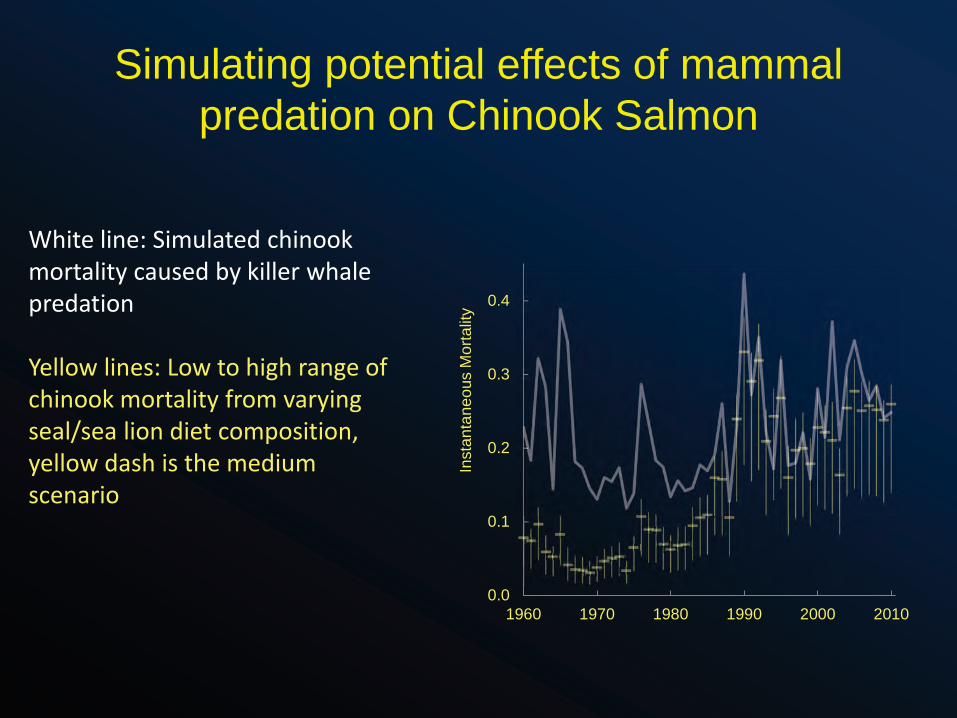
Simulating potential effects of mammal predation on Chinook Salmon
0.0
0.1
0.2
0.3
0.4
1960 1970 1980 1990 2000 2010
Inst
anta
neou
s M
orta
lity
White line: Simulated chinook mortality caused by killer whale predation
Yellow lines: Low to high range of chinook mortality from varying seal/sea lion diet composition, yellow dash is the medium scenario
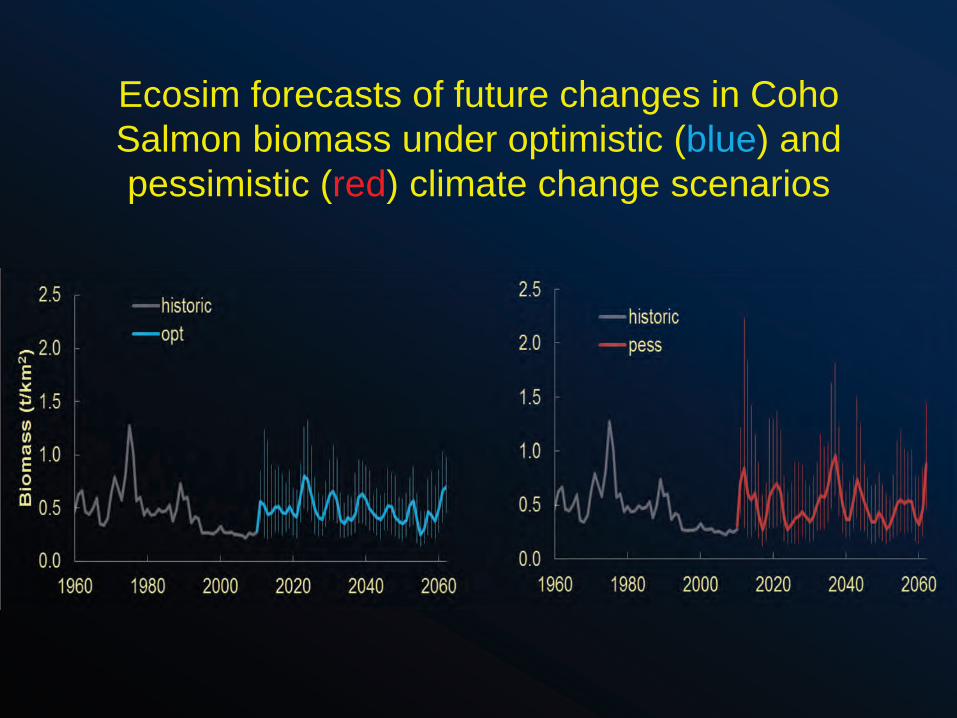
Ecosim forecasts of future changes in Coho Salmon biomass under optimistic (blue) and pessimistic (red) climate change scenarios
Purpose and use of CBPS model
• Support PSP goals by – identifying meaningful indicators that can be used to monitor the efficacy
of management actions,– quantify risk, – simulate alternate ecosystem management scenarios.
• Uses include– partitioning of mortality in modelled species,– examining ecosystem effects of bottom up forcing,– Examine cascades from changes in key predators,– Examine potential effects of ocean acidification on the food web,– Estimating ecosystem services provided by eelgrass
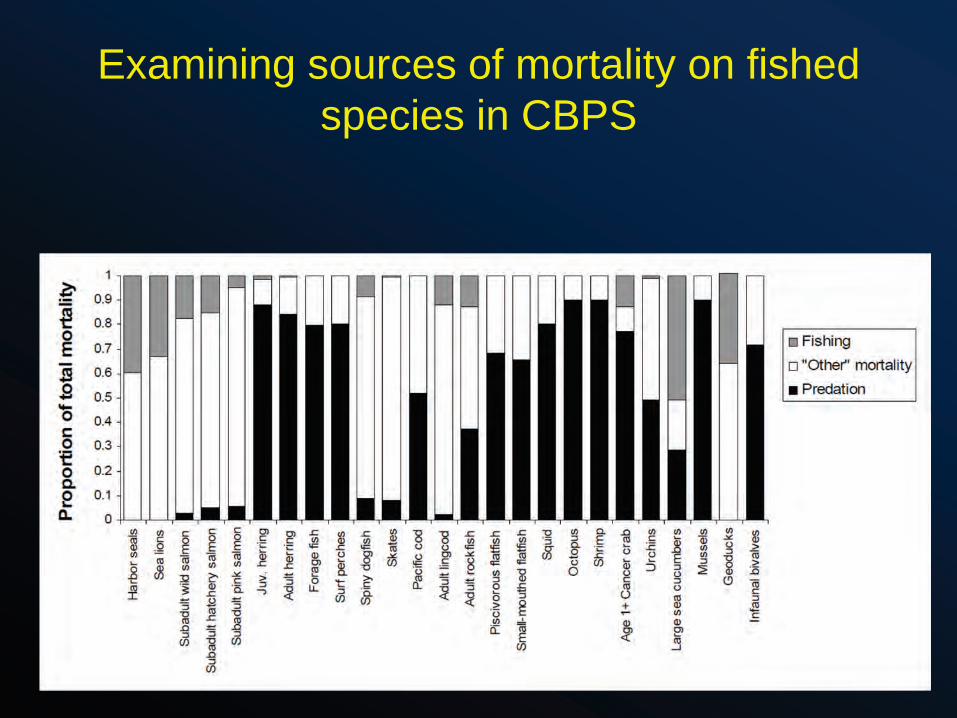
Examining sources of mortality on fished species in CBPS
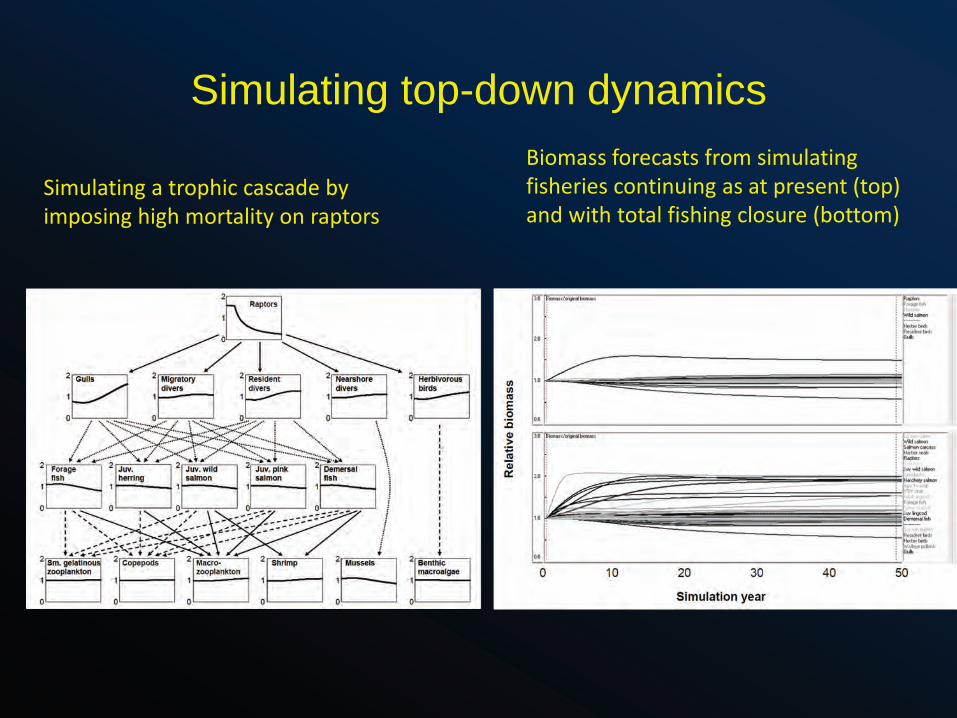
Simulating top-down dynamics
Simulating a trophic cascade by imposing high mortality on raptors
Biomass forecasts from simulating fisheries continuing as at present (top) and with total fishing closure (bottom)
Purpose and use of SPS model
• Previous SPS ecosystem model built for NWIFC to examine changes in salmon populations
• Present SPS model will examine historic effects of shellfish harvest and aquaculture
• Examine potential ecosystem feedbacks from different shellfish management strategies
• Forecast likely ecosystem effects arising from bottom up forcing changes due to climate and regime shifts
• Significant detail in Pacific Salmon Groups
Benefits from synthesising results from Salish Sea models to salmon research and management
• In cases where the models suggest differing basin-level ecosystem mechanisms, we can improve management of migratory species, like salmon, by determining where basin-scale research and management is appropriate
• In cases where models suggest ecosystem mechanisms are the same we can determine when and where Salish Sea scale research and management will be optimal.
• Identification of common knowledge gaps in determining research priorities
• Identification of ecosystem indices useful at the scale of each basin and at the scale of the whole Salish Sea
Steps to synthesising model results
• Model all basins of Salish Sea: Hood Canal and Strait of Juan de Fuca need to be examined
• Develop a list of key species and associated species groups significant to all basins of the Salish Sea. Coho and Chinook may be most appropriate salmon species, due to residency in the Salish Sea
• Develop a common historic reference period to examine potential historic bottom-up and top-down influences on Salmon and other key species
• Use historic dynamics to develop simulations of future changes under different production regimes and how management policies can mitigate these changes
• Examine how future choices in management (or lack of management) may influence trade offs in abundances of different species