Modelling Ebola using an SIR model - NLCS Maths ... · Web viewThe Ebola virus disease was first...
26
MODELLING EBOLA USING AN SIR MODEL HL Maths Exploration NOVEMBER 25, 2014 CANDIATE: METHUSHAA SUTHANTHIRAKUMARAN School: North London Collegiate School Teacher: Ms Copin
-
Upload
trinhthien -
Category
Documents
-
view
217 -
download
0
Transcript of Modelling Ebola using an SIR model - NLCS Maths ... · Web viewThe Ebola virus disease was first...
Modelling Ebola using an SIR model
HL Maths Exploration
NOVEMBER 25, 2014Candiate: Methushaa Suthanthirakumaran
School: North London Collegiate SchoolTeacher: Ms Copin
Modelling Ebola using an SIR model 2014
Contents1. Introduction and aim..........................................................................................................2
2. Common sense description of the SIR model....................................................................3
Parameterisation of the model..........................................................................................4
3. Running the SIR model on the initial figures of the Ebola Outbreak in Liberia in 2014. .6
Graphical interpretation....................................................................................................8
Validity of the model......................................................................................................10
Advantages.....................................................................................................................10
Disadvantages.................................................................................................................11
4. Comparing the model to actual figures and trying to improve it.....................................12
5. Conclusion........................................................................................................................15
6. Bibliography.....................................................................................................................16
1
Modelling Ebola using an SIR model 2014
Using the SIR model for Ebola outbreaks
1.Introduction and aimThe Ebola virus disease was first discovered in 1976 in the present Democratic Republic of Congo1.
Since then, there have been many outbreaks, with the greatest being the current 2014 outbreak2 which
has spread through many countries. Hoping to study medicine in the future and eventually becoming a
doctor, I became fascinated with the repetition of the outbreak of Ebola and the fact that despite the
advancements in technology, little was done in preparation for it. Therefore, by combining my interest
in mathematics which lies in modelling functions along with curiosity for the repetition of the disease,
I decided to model the Ebola Epidemics in Liberia in 2014 and Democratic Republic of Congo 1976
and compare their spread using an SIR3 model. An SIR model is an epidemiological model which
measures the number of people infected with a particular disease over a period of time using three
fundamental equations4.
Therefore in doing so, I aim to develop my understanding on the mathematics of the SIR model and
about its possible limitations for discussing the spread of the disease, in turn, this should shed light on
the spread of Ebola.
In order to do this, I will:
Describe the SIR model
Use the model on the initial data from the outbreak in Liberia 2014
Compare the model with real data Liberia 2014
1 "Ebola Virus Disease." WHO. N.p., n.d. Web. 17 Nov. 2014.2 "2014 Ebola Outbreak in West Africa." Centers for Disease Control and Prevention. Centers for Disease Control and Prevention, 06 Mar. 2015. Web. 07 Nov. 2014.3 "Kermack-McKendrick Model." -- from Wolfram MathWorld. N.p., n.d. Web. 17 Nov. 2014.4 "The Mathematics of Diseases." The Mathematics of Diseases. N.p., n.d. Web. 17 Nov. 2014.
2
Modelling Ebola using an SIR model 2014
2.Common sense description of the SIR modelThe SIR model is used to illustrate the transfer of the epidemic through the interaction of the
following three different variables:
S=number of people that are susceptible to Ebola
I=number of people infected with Ebola
R=number of people recovered from Ebola with total immunity
It makes sense to assume that a fixed population of N people, whereby there are no births and deaths
by natural cause, consists of the number of people susceptible plus the number of people infected plus
number of people resistant:
N=S+ I +R
This is because the population is fixed and therefore, there are only three compartments in which the
population may fit into. Thus, the total of the number of people susceptible infected and recovered in
equivalent to the total population. The assumption that N is fixed, with no births or deaths, makes
sense given 60 days, although it is a simplification.
These variables change over time, so I will define the variable t=timein days. I will set t = 0 at the
start of August 2014.
The model uses two parameters which can be used calibrate it, β andγ withβ , γ>0. Given these
parameters, the model uses 3 differential equations. These will be different numbers for any given
disease and situation, and will depend on things like method of transmission, and the contact rate. I
will calculate those later using actual data for the current Ebola epidemic mathematically, thought of
as contrast of population, but I want to first give an idea of why these equations are true and what
these might mean.
Equation 1: dSdt
=−βIS
In Equation 1, dSdt means the rate of change of the number of people susceptible to the disease over
time. dSdt decreases proportionally to I because in order to become infected, you are no longer
susceptible to the diseases any more. Since the only way to leave the set of susceptible people is
through becoming infected with the disease itself, therefore the number of people who are susceptible
3
Modelling Ebola using an SIR model 2014
to the disease is determined by the number of people who are already susceptible, the number of
individuals who are already infected and the amount of contact between the susceptible and infected.
An assumption is made that every individual has the same probability of becoming infected with the
disease. In real life, this is highly improbable and it is a limitation that I discuss later. The equation
also decreases proportionally to S because individuals are repeatedly being removed from the
susceptible section and being transferred into the infectious section.
Equation 2: dRdt
=γI
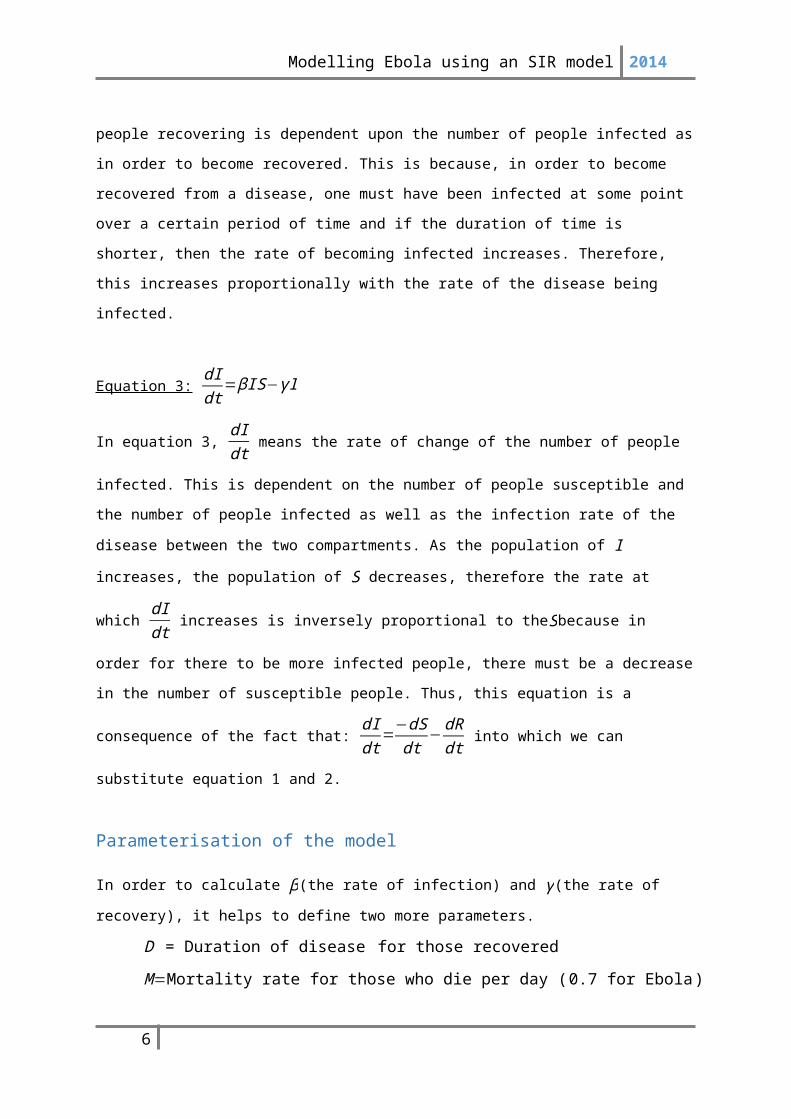
In equation 2, dRdt means the rate of change of the number of people recovered over time. This
illustrates that the rate of the number of people recovering is dependent upon the number of people
infected as in order to become recovered. This is because, in order to become recovered from a
disease, one must have been infected at some point over a certain period of time and if the duration of
time is shorter, then the rate of becoming infected increases. Therefore, this increases proportionally
with the rate of the disease being infected.
Equation 3: dIdt
=βIS−γI
In equation 3, dIdt means the rate of change of the number of people infected. This is dependent on the
number of people susceptible and the number of people infected as well as the infection rate of the
disease between the two compartments. As the population of I increases, the population of S
decreases, therefore the rate at which dIdt increases is inversely proportional to theSbecause in order
for there to be more infected people, there must be a decrease in the number of susceptible people.
Thus, this equation is a consequence of the fact that: dIdt
=−dSdt
−dRdt into which we can substitute
equation 1 and 2.
Parameterisation of the modelIn order to calculate β(the rate of infection) and γ(the rate of recovery), it helps to define two more
parameters.
D = Duration of disease for those recovered
M=Mortality rate for those who die per day ( 0.7 for Ebola )
4
Modelling Ebola using an SIR model 2014
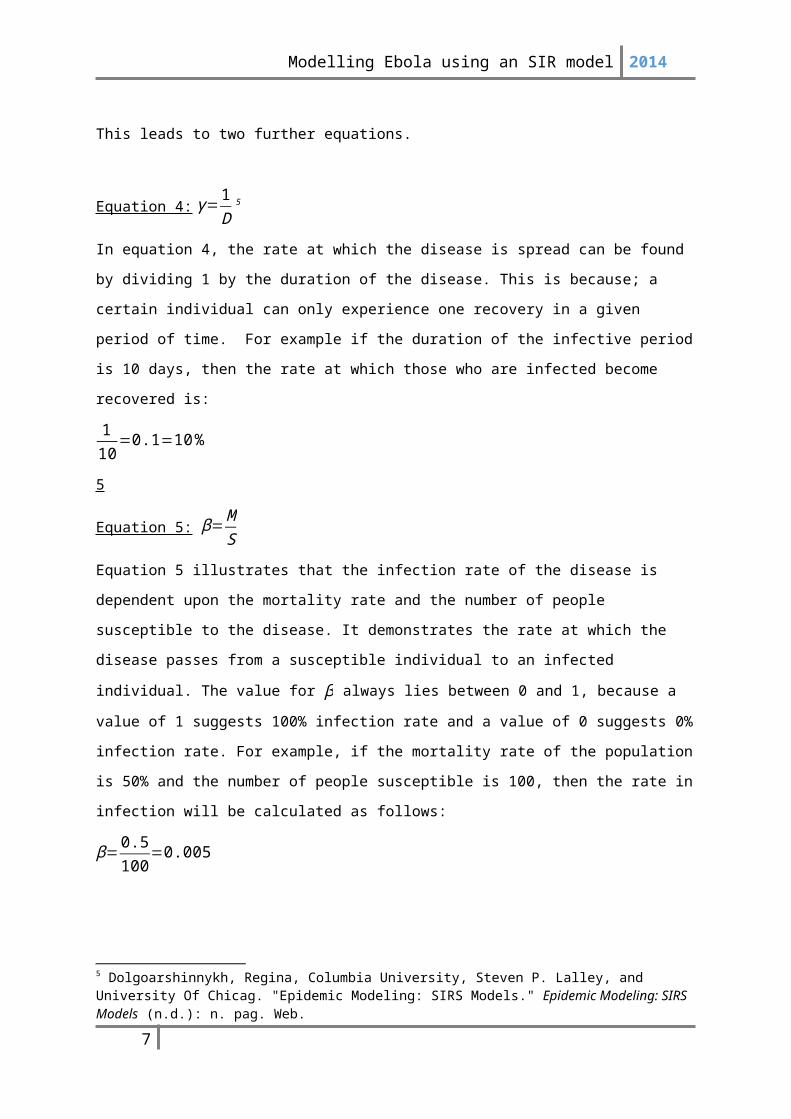
This leads to two further equations.
Equation 4: γ= 1D 5
In equation 4, the rate at which the disease is spread can be found by dividing 1 by the duration of the
disease. This is because; a certain individual can only experience one recovery in a given period of
time. For example if the duration of the infective period is 10 days, then the rate at which those who
are infected become recovered is:
110
=0.1=10 %
5
Equation 5: β= MS
Equation 5 illustrates that the infection rate of the disease is dependent upon the mortality rate and the
number of people susceptible to the disease. It demonstrates the rate at which the disease passes from
a susceptible individual to an infected individual. The value for β always lies between 0 and 1,
because a value of 1 suggests 100% infection rate and a value of 0 suggests 0% infection rate. For
example, if the mortality rate of the population is 50% and the number of people susceptible is 100,
then the rate in infection will be calculated as follows:
β= 0.5100
=0.005
5 Dolgoarshinnykh, Regina, Columbia University, Steven P. Lalley, and University Of Chicag. "Epidemic Modeling: SIRS Models." Epidemic Modeling: SIRS Models (n.d.): n. pag. Web.
5
Modelling Ebola using an SIR model 2014
3.Running the SIR model on the initial figures of the Ebola Outbreak in Liberia in 2014
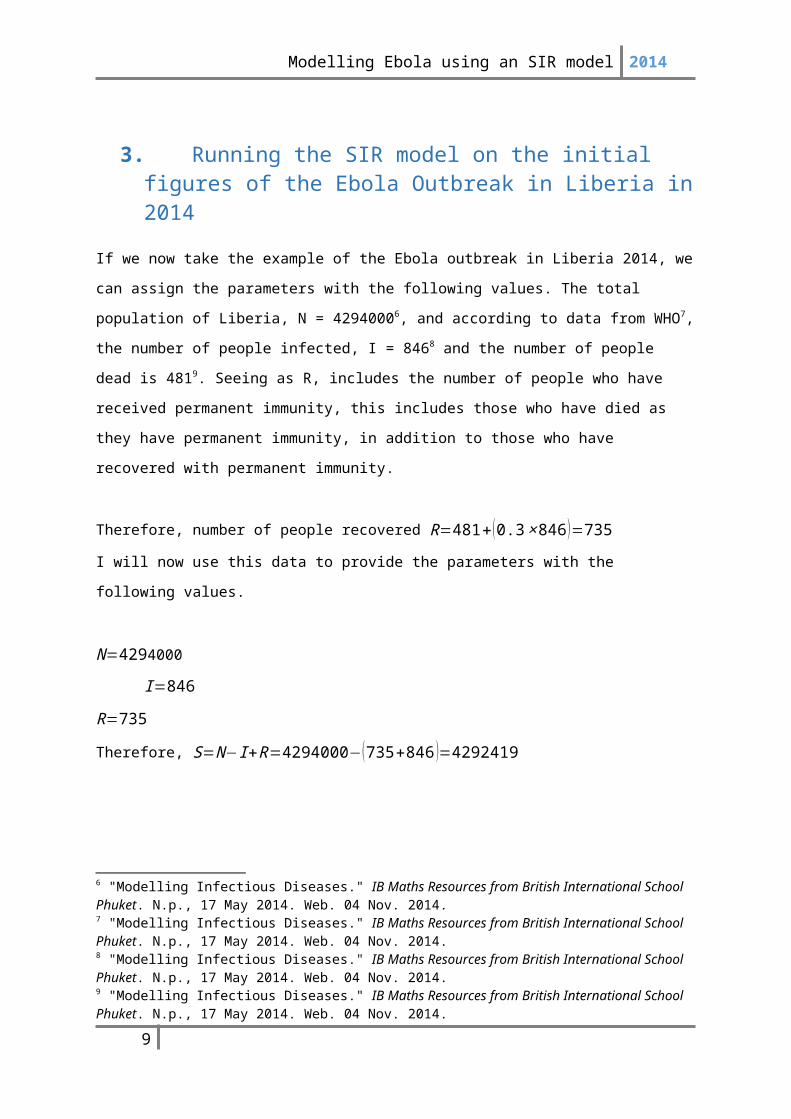
If we now take the example of the Ebola outbreak in Liberia 2014, we can assign the parameters with
the following values. The total population of Liberia, N = 42940006, and according to data from
WHO7, the number of people infected, I = 8468 and the number of people dead is 4819. Seeing as R,
includes the number of people who have received permanent immunity, this includes those who have
died as they have permanent immunity, in addition to those who have recovered with permanent
immunity.
Therefore, number of people recovered R=481+(0.3 ×846 )=735
I will now use this data to provide the parameters with the following values.
N=4294000
I=846
R=735
Therefore, S=N−I+R=4294000−(735+846 )=4292419
The duration of the disease ranges from 2 to 18 days, therefore we could roughly estimate the duration
of the disease at the midpoint, i.e. 10 days.
D=10
γ= 110
=0.1
According to WHO, the mortality rate of Ebola is 0.710 and the number of people susceptible is
4292419.
Therefore from equation 5, β ( the rate of infection)= 0.74292419
=1.63× 10⁻⁷
6 "Modelling Infectious Diseases." IB Maths Resources from British International School Phuket. N.p., 17 May 2014. Web. 04 Nov. 2014.7 "Modelling Infectious Diseases." IB Maths Resources from British International School Phuket. N.p., 17 May 2014. Web. 04 Nov. 2014.8 "Modelling Infectious Diseases." IB Maths Resources from British International School Phuket. N.p., 17 May 2014. Web. 04 Nov. 2014.9 "Modelling Infectious Diseases." IB Maths Resources from British International School Phuket. N.p., 17 May 2014. Web. 04 Nov. 2014.10 "The Spread Of Infectious Diseases." The British Medical Journal 2.1281 (1885): 108. Web.
6
Modelling Ebola using an SIR model 2014
In order to use the SIR model to predict the evolution of the disease, it would be helpful if we could
solve the system of differential equations. Unfortunately, we cannot completely solve these equations
with an explicit formula solution11.
Therefore, I will use a numerical approach, as follows. For each day, I will calculate the values of
dSdt
,
dIdt
∧dR
dt using equations 1, 2 and 3. Then assume that the Svalue for the following day is the
previous S value+ dSdt
for that point in time .
I will do this explicitly for the transition from t = 0 to t = 1. Using equations 1, 2 and 3 from earlier,
the following values for the three rates of change of S, I and R can be calculated.
dSdt |t=0
=(−1.63× 10−7)× 846 ×4292419= -581
dIdt |t=0
=(1.6× 10⁻⁷)−(0.1 ×846 )= 496
dRdt |t=0
=0.1× 846 = 85
Therefore, at t=1,
S = 4292419−581=4291838
I will now use excel to do this over a two month period, by putting in the formulae in the
following way. I defined γ in as g in cell I1 and β as b in cell J3:
A B C D E F G H I J1 T S I R dS/dt dI/dt dR/dt S+I+R gamma beta
2 T B2 C2 D2 E2 F2 G2 B2 + C2 + D2 g b
3 t+1 B3+E3 C2+F2 D2+G2 -g*I3*B3 B*I3*B3 – g*I3 g*I3 B3+E3+C2+
F2+D2+G2 gb
This generates the following table: Susceptible Infected Recovered
t S I R ds/dt dI/dt dr/dt S+I+R0 4292419 846 735 -581 496 85 42940001 4291838 1342 820 -922 788 134 42940002 4290916 2130 954 -1462 1249 213 42940003 4289454 3379 1167 -2319 1981 338 42940004 4287134 5361 1505 -3677 3141 536 42940005 4283457 8502 2041 -5827 4977 850 42940006 4277631 13478 2891 -9225 7877 1348 42940007 4268406 21355 4239 -14585 12449 2136 42940008 4253821 33804 6374 -23008 19627 3380 4294000
11 "Appendix: Additional Results and Technical Notes for the EbolaResponse Modeling Tool." Centers for Disease Control and Prevention. Centers for Disease Control and Prevention, 23 Sept. 2014. Web. 08 Nov. 2014.
7
Modelling Ebola using an SIR model 2014
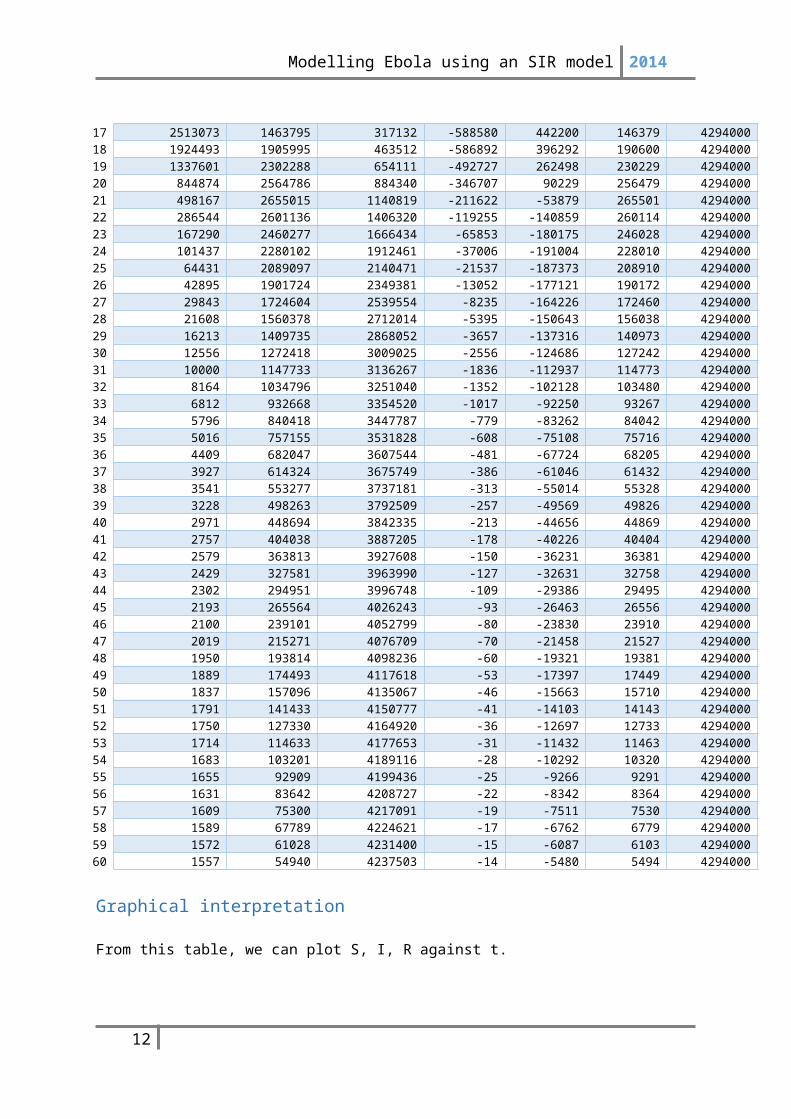
9 4230814 53432 9755 -36169 30826 5343 429400010 4194644 84258 15098 -56549 48123 8426 429400011 4138095 132381 23524 -87649 74411 13238 429400012 4050446 206792 36762 -134016 113337 20679 429400013 3916430 320129 57441 -200602 168589 32013 429400014 3715828 488718 89454 -290559 241687 48872 429400015 3425269 730405 138326 -400294 327253 73041 429400016 3024975 1057658 211366 -511902 406137 105766 429400017 2513073 1463795 317132 -588580 442200 146379 429400018 1924493 1905995 463512 -586892 396292 190600 429400019 1337601 2302288 654111 -492727 262498 230229 429400020 844874 2564786 884340 -346707 90229 256479 429400021 498167 2655015 1140819 -211622 -53879 265501 429400022 286544 2601136 1406320 -119255 -140859 260114 429400023 167290 2460277 1666434 -65853 -180175 246028 429400024 101437 2280102 1912461 -37006 -191004 228010 429400025 64431 2089097 2140471 -21537 -187373 208910 429400026 42895 1901724 2349381 -13052 -177121 190172 429400027 29843 1724604 2539554 -8235 -164226 172460 429400028 21608 1560378 2712014 -5395 -150643 156038 429400029 16213 1409735 2868052 -3657 -137316 140973 429400030 12556 1272418 3009025 -2556 -124686 127242 429400031 10000 1147733 3136267 -1836 -112937 114773 429400032 8164 1034796 3251040 -1352 -102128 103480 429400033 6812 932668 3354520 -1017 -92250 93267 429400034 5796 840418 3447787 -779 -83262 84042 429400035 5016 757155 3531828 -608 -75108 75716 429400036 4409 682047 3607544 -481 -67724 68205 429400037 3927 614324 3675749 -386 -61046 61432 429400038 3541 553277 3737181 -313 -55014 55328 429400039 3228 498263 3792509 -257 -49569 49826 429400040 2971 448694 3842335 -213 -44656 44869 429400041 2757 404038 3887205 -178 -40226 40404 429400042 2579 363813 3927608 -150 -36231 36381 429400043 2429 327581 3963990 -127 -32631 32758 429400044 2302 294951 3996748 -109 -29386 29495 429400045 2193 265564 4026243 -93 -26463 26556 429400046 2100 239101 4052799 -80 -23830 23910 429400047 2019 215271 4076709 -70 -21458 21527 429400048 1950 193814 4098236 -60 -19321 19381 429400049 1889 174493 4117618 -53 -17397 17449 429400050 1837 157096 4135067 -46 -15663 15710 429400051 1791 141433 4150777 -41 -14103 14143 429400052 1750 127330 4164920 -36 -12697 12733 429400053 1714 114633 4177653 -31 -11432 11463 429400054 1683 103201 4189116 -28 -10292 10320 429400055 1655 92909 4199436 -25 -9266 9291 429400056 1631 83642 4208727 -22 -8342 8364 429400057 1609 75300 4217091 -19 -7511 7530 429400058 1589 67789 4224621 -17 -6762 6779 429400059 1572 61028 4231400 -15 -6087 6103 429400060 1557 54940 4237503 -14 -5480 5494 4294000
Graphical interpretationFrom this table, we can plot S, I, R against t.
8
Modelling Ebola using an SIR model 2014
0 10 20 30 40 50 600
50000010000001500000200000025000003000000350000040000004500000
SIR Model for the Ebola outbreak in Liberia, August 2014
SIRN
Time (days) from August 2014 over a two month period
Num
ber o
f peo
ple
0
500000
1000000
1500000
2000000
2500000
3000000
3500000
4000000
4500000
0 10 20 30 40 50 60
Num
ber o
f peo
ple
Time (days) from August 2014 over a two month period
SIR Model for the Ebola outbreak in Liberia, August 2014
S
I
R
N
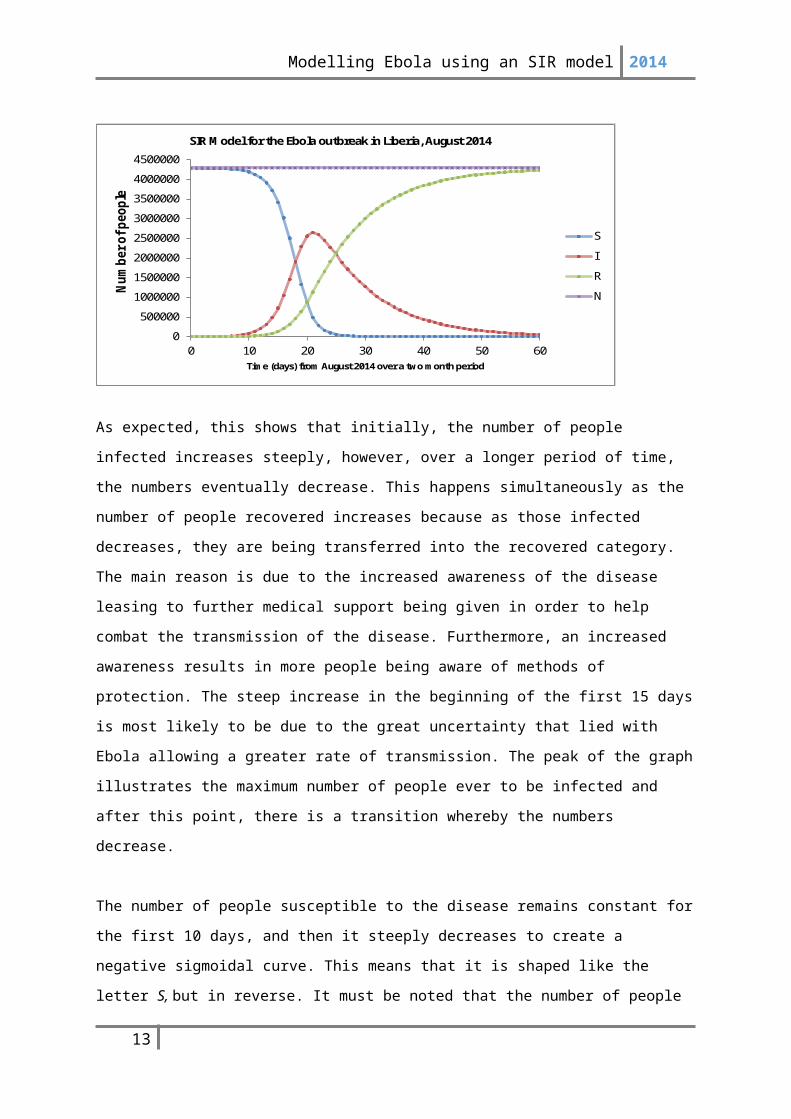
As expected, this shows that initially, the number of people infected increases steeply, however, over
a longer period of time, the numbers eventually decrease. This happens simultaneously as the number
of people recovered increases because as those infected decreases, they are being transferred into the
recovered category. The main reason is due to the increased awareness of the disease leasing to
further medical support being given in order to help combat the transmission of the disease.
Furthermore, an increased awareness results in more people being aware of methods of protection.
The steep increase in the beginning of the first 15 days is most likely to be due to the great uncertainty
that lied with Ebola allowing a greater rate of transmission. The peak of the graph illustrates the
maximum number of people ever to be infected and after this point, there is a transition whereby the
numbers decrease.
The number of people susceptible to the disease remains constant for the first 10 days, and then it
steeply decreases to create a negative sigmoidal curve. This means that it is shaped like the letter S,
but in reverse. It must be noted that the number of people never reaches 0, and only tends towards it
allowing the epidemic to reoccur in the future. The only way for the number of susceptible to reach 0
is through the vaccination as this acts as a vehicle to remove the disease from the population. The
number of people susceptible remains constant at the beginning, which is similar to the small increase
in the number of people infected. However, as there are more people infected, there is a steep decline
in the number of people susceptible to the disease. This is because being the number of people
infected comes from the number of people susceptible and they are connected. Therefore, as the
number of people infected begins to decline, the number of people susceptible begins to level off.
This is due to the fact that everyone infected is eventually becoming recovered, thus reducing the
numbers of those who are infected. Therefore, there is very little change in the number of people
susceptible to the disease towards the end of the two month period.
9
Modelling Ebola using an SIR model 2014
The number of people recovered from the disease, slowly increase at the beginning with the slow rate
of infection. However, as the number of people infected increases dramatically, this leads to a
consequent steep increase with the number of people recovered, until eventually levelling off
simultaneously to the number of people susceptible. The line illustrating the number of people
recovering increases concurrently as the number of people susceptible decreases. This is because
susceptibility and recovery are inversely proportional to one another. However, the number of people
recovered from the disease, never reaches the total population, and only tends towards it.
Furthermore, this graph illustrates cumulative distributions through the positive sigmoidal curve on
the graph.
The graph also shows that the total population remains constant throughout the two month period via
a linear correlation. This is because, as established earlier, N=S+ I +R and in order to detect a
change in something we need to differentiate it. In this case, the graph suggests no change, so the
differentiation must be equivalent to 0.
Therefore, (S+ I +R)'=S '+ I '+ R' and by substituting the differential equations 1, 2 and 3, we get the
following:
(S+ I +R)'=−βIS+γI+βIS−γI=0
Thus, there is no change in the population and it will remain constant in a given period of time.
The graph is useful because it allows me to see the interaction between the different variables and it is
interesting to relate it to differentiation to determine the changes over time.
Validity of the model
However, in order for the model to be valid and allow to inform government policy, it obviously
needs to correspond fairly close to reality. Before checking against the graph, there are already clear
advantages and disadvantages to this model:
Advantages
The advantages to the model include:
10

Modelling Ebola using an SIR model 2014
1. It is very quick to model the data having found the values for the respective parameters and transition
probabilities to allow immediate assessment of the condition that is present. This results in instant
evaluation of the situation as well as valid prediction of the spread of disease in the future.
2. The model is widely used and also widely understood by the medical community making it easier to
explain the effects of the epidemic
3. This model is clear and easy to understand in order to distinguish between the number of people
susceptible, infected and recovered
4. The mechanism to create the data is flexible, allowing it to be easily altered if certain values are
incorrect or have changed
5. It is computationally cheap and there are other software available with very small time intervals
allowing it to be more accurate which I could not complete in excel.
Disadvantages
The disadvantages to the model include:
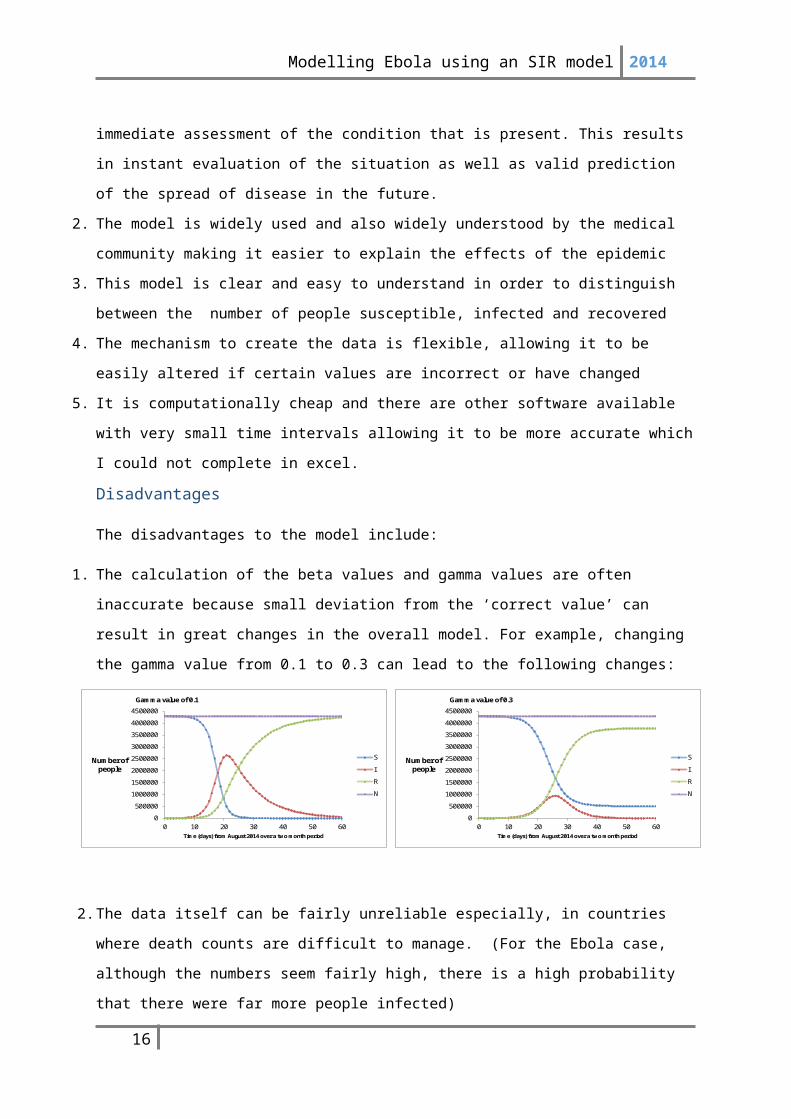
1. The calculation of the beta values and gamma values are often inaccurate because small deviation
from the ‘correct value’ can result in great changes in the overall model. For example, changing the
gamma value from 0.1 to 0.3 can lead to the following changes:
2. The data itself can be fairly unreliable especially, in countries where death counts are difficult to
manage. (For the Ebola case, although the numbers seem fairly high, there is a high probability that
there were far more people infected)
3. In order for the model to be calculated correctly, you need the right form of data including the number
of people infected, recovered and susceptible. This data can be very particular and calculating the
number of people susceptible as the number of people left over from taking away the number of
people infected and recovered from the total population, is not always the most reliable method.
4. This model is only effective for small environments with heterogeneous population density
distribution
11
0
500000
1000000
1500000
2000000
2500000
3000000
3500000
4000000
4500000
0 10 20 30 40 50 60
Number of people
Time (days) from August 2014 over a two month period
Gamma value of 0.3
S
I
R
N
0
500000
1000000
1500000
2000000
2500000
3000000
3500000
4000000
4500000
0 10 20 30 40 50 60
Number of people
Time (days) from August 2014 over a two month period
Gamma value of 0.1
S
I
R
N
Modelling Ebola using an SIR model 2014
4.Comparing the model to actual figures and trying to improve it
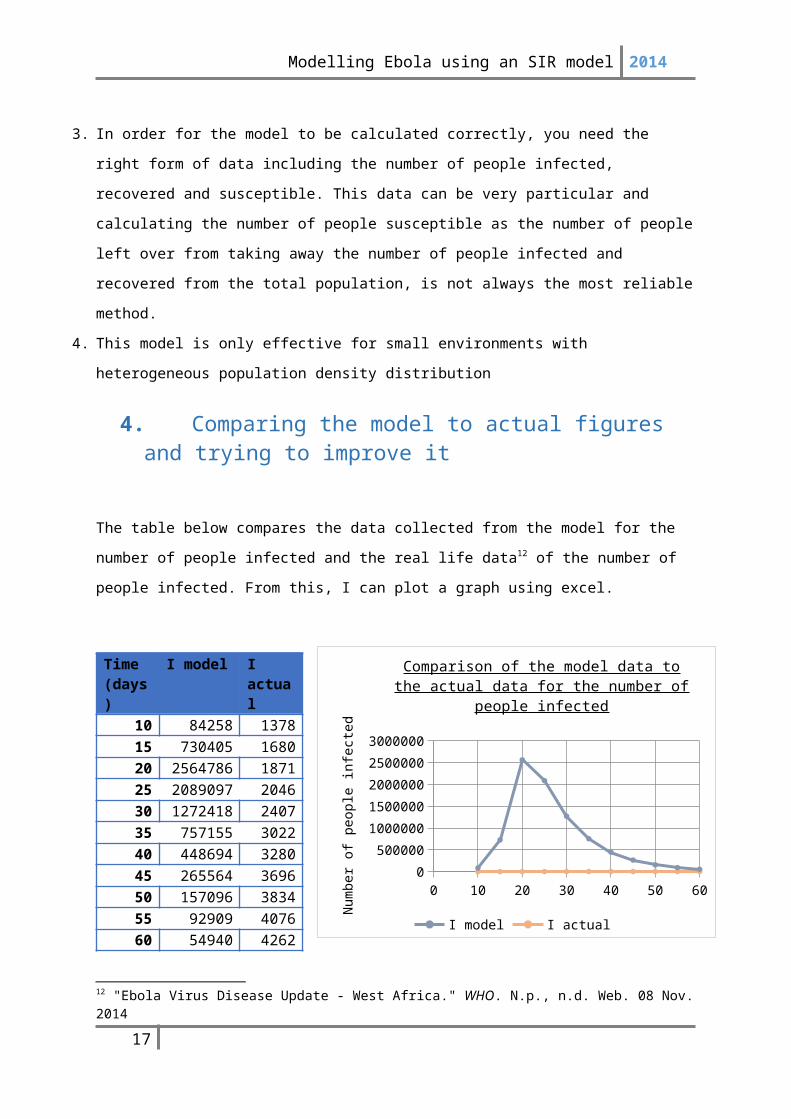
The table below compares the data collected from the model for the number of people infected and the
real life data12 of the number of people infected. From this, I can plot a graph using excel.
Time (days)
I model I actual
10 84258 137815 730405 168020 2564786 187125 2089097 204630 1272418 240735 757155 302240 448694 328045 265564 369650 157096 383455 92909 407660 54940 4262
As the graph demonstrates, the real data does not correspond very well to the data received from the
model. Although the actual data may seem to follow a straight like graph, this is untrue as it is only
depicted in this manner due to the limitations on the axis of the graph. The difference between the real
life data and the data from the model is so vast that the straight line looks like a graph of y=0.
Therefore, I decided to plot is separately:
12 "Ebola Virus Disease Update - West Africa." WHO. N.p., n.d. Web. 08 Nov. 2014
12
0 10 20 30 40 50 600
500000
1000000
1500000
2000000
2500000
3000000
Comparison of the model data to the actual data for the number of people infected
I model I actual
Num
ber o
f peo
ple
infe
cted
0 10 20 30 40 50 60 700
200400600800
10001200
Real data for the number of people infected
I Actual
Time (days)
Num
ber o
f peo
ple
infe
cted
Modelling Ebola using an SIR model 2014
Therefore, this shows that the model has significantly overestimated the number of people who will
become infected with Ebola. This is because of the several limitations which the model presents. One
of the main limitations includes the inaccurate beta and gamma values which were calculated. After
altering the beta and gamma values, I was able to find another gamma value which resulted in similar
values to the real data. Here is the graph to show this, with the appropriate gamma value of
0.679995559.
Although, this does not fit the graph exactly, it shows a better positive correlation of the number of
people infected. Therefore, in order to improve the model, several changes must be done, including
altering the gamma value. The value which I eventually used to alter the model, led to being in several
decimal places. This goes to illustrate the necessary precision needed as little deviance can lead to
large changes. This is because; the gamma is calculated through extreme simplification, leaving great
possibilities for further room for errors.
Furthermore, there are many assumptions that are made with creating an SIR model:
Any individual in the population has an equal probability of receiving this disease
The number of people leaving a certain category is equivalent to the number of people joining
a new category. (i.e. the number of people leaving the susceptibility category, is equivalent to
the number of people joining the infected category)
Rate of recovery is faster that the time scale of birth and death
There is a homogenous mixing of the population whereby each individual encounters contact
with similar people in ratio to each category.
13
0 10 20 30 40 50 60 700
200400600800
100012001400160018002000
Fitting the model with the real data
Time (days)
Num
ber o
f peo
ple
infe
cted
Modelling Ebola using an SIR model 2014
Individuals that recovery, automatically recover with permanent immunity
The number of people recovered includes those who have died as well as those alive with
permanent immunity, making it difficult to differentiate one from the other
These assumptions do not always comply with reality as often there is no homogenous mixing within
the population and each individual does not have the same probability of being a victim of the disease
as others. These limitations borne out of the assumption increase the subjectivity of the results,
creating results which often may not correlate to real life data. Furthermore, it is difficult to
differentiate between the number of people who have died and the numbers of people who have
survived with permanent immunity as they both fall under the same category of being ‘recovered’.
The model is used to estimate future predictions of the disease and consequently, it will help to
determine practical elements such as the number of beds needed in the hospitable, leaving these
limitations of little importance.
14
Modelling Ebola using an SIR model 2014
5.ConclusionBy using an SIR model, I was able to see the importance of modelling data, especially in the field of
medicine. This is because, in order to cope with the rapid changes in the medical sector, many
governments must find methods to sustain and maximise the efficiency of the available health care
systems. One of these methods includes mathematical modelling which is becoming increasingly
important in helping identify the future of certain diseases. The application of mathematical models
on diseases can be extended to include the effects of vaccination and impacts of herd immunity on an
outbreak as well. This can help to determine different factors which can help reduce the mortality
rate.
From doing my exploration, I gained further insight in the ways in which modelling can be used to
predict the apparent spread of diseases in order to inform health care superficial of the necessary
precautions that must be in place. Nonetheless, similar to most models, the SIR is also subject to
limitations as often a model is a simplified representation of the real situation and often this can lead
to over simplification, creating conflicts between simplicity and complexity. Ultimately, the aim of
modelling is to clarify certain concepts, but models often attempt to mimic a real life situation through
introducing many variables and can lead to further confusion.
However, the results obtained from modelling data can lead to differing perspectives and
interpretations. This is due to the unequal distribution of data across the world whereby in countries
such as Liberia, there is very little access to the statistics which makes it difficult to make constructive
predictions concerning the outbreak. However, in countries such as UK, the data is more widely
available making developing countries and their governments dependent on them. This caused an
exaggerated media coverage leading to the development of irrational fears which promoted the
prevalence of more resilient and contagious diseases such as tuberculosis. The deaths that arose from
Ebola only account for a tiny fraction in comparison to other causes of deaths such as malaria and
HIV/AIDS. Nonetheless, due to the inflation of the situation, much research has been conducted in
order to create a potential vaccine against it.
Through completing this exploration, I am able to see the impact of mathematical modelling and the
influences it has in helping scientists to analyse epidemics and help prevent further disruption. The
SIR model which I used showed the general trend of the epidemic, however due to its limitations
which eventually outweighed the advantages, the model did not precisely correspond to the real life
data, although they mostly illustrated similar correlation.
15
Modelling Ebola using an SIR model 2014
Therefore, through my exploration, I have gained further insight into the uses of mathematical
modelling in order to determine the spread of diseases as well as evaluating its flaws. Having chosen
Ebola as the disease of concentration, as it is very relevant to the current situation in Africa, it has
enabled a realistic understanding of its rate of transmission. Moreover, this task had allowed me to
combine my interests in maths alongside a disease with which I have great interest in, in order to
simulate an analytical study and gain further understanding of the ways in which health care
professions rely on mathematical studies to help them make important decisions in improving the
healthcare of the population.
16
Modelling Ebola using an SIR model 2014
6.Bibliography"2014 Ebola Outbreak in West Africa." Centers for Disease Control and Prevention. Centers
for Disease Control and Prevention, 06 Mar. 2015. Web. 07 Nov. 2014.
Dolgoarshinnykh, Regina, Columbia University, Steven P. Lalley, and University Of Chicag.
"Epidemic Modeling: SIRS Models." Epidemic Modeling: SIRS Models (n.d.): n.
pag. Web.
"Ebola Virus Disease." WHO. N.p., n.d. Web. 17 Nov. 2014.
"Ebola Virus Disease." WHO. N.p., n.d. Web. 18 Nov. 2014.
"Estimating the Future Number of Cases in the Ebola Epidemic — Liberia and Sierra Leone,
2014–2015." Centers for Disease Control and Prevention. Centers for Disease
Control and Prevention, 07 Oct. 2014. Web. 18 Nov. 2014.
"Kermack-McKendrick Model." -- from Wolfram MathWorld. N.p., n.d. Web. 05 Nov. 2014.
Matemàtic, Materials. "MAT 2." (n.d.): n. pag. Www.mat.uab.cat/matmat. Publicació
Electrònica De Divulgació Del Departament De Matemàtiques De La Universitat
Autònoma De Barcelona. Web. 18 Nov. 2014.
"Modeling Ebola in West Africa: Cumulative Cases by Date of Reporting." Contagious
Disease Surveillance. N.p., n.d. Web. 24 Nov. 2014.
"Modelling Infectious Diseases." IB Maths Resources from British International School
Phuket. N.p., 17 May 2014. Web. 17 Nov . 2014.
"The Mathematics of Diseases." The Mathematics of Diseases. N.p., n.d. Web. 14 Nov. 2014.
"The Spread Of Infectious Diseases." The British Medical Journal 2.1281 (1885): 108. Web.
"WHO Finds 70 Percent Ebola Mortality Rate." - Africa. N.p., n.d. Web. 18 Nov. 2014.
17