Modelling Archaeological and Geospatial Information for...
26
585 Modelling Archaeological and Geospatial Information for Burial Site Prediction, Identification and Management Aikaterini Balla (*), Gerasimos Pavlogeorgatos, Despoina Tsiafakis and George Pavlidis [email protected], 31st Ephorate of Prehistoric and Classical Antiquities, Archaeological Museum of Avdera, 67061, Avdera, Greece. [email protected], Department of Cultural Technology and Communication, University of the Aegean, Greece, University Hill, building of Geography, Off.2.14, 81-100, Mytilene, Lesvos, Greece. [email protected], ATHENA Research Centre, University Campus at Kimeria, 67100, Xanthi, Greece, tel:+30-2541078787, fax: +30-2541063656 [email protected], ATHENA Research Centre, University Campus at Kimeria, 67100, Xanthi, Greece, tel:+30-2541078787, fax: +30-2541063656 [Received date; Accepted date] – to be inserted later volume 2 number 4 2013 International Journal of Heritage in the Digital Era
Transcript of Modelling Archaeological and Geospatial Information for...

585
Modelling Archaeologicaland GeospatialInformation for Burial SitePrediction, Identificationand ManagementAikaterini Balla (*), Gerasimos Pavlogeorgatos,Despoina Tsiafakis and George [email protected], 31st Ephorate of Prehistoric and ClassicalAntiquities, Archaeological Museum of Avdera, 67061, Avdera,Greece.
[email protected], Department of Cultural Technology andCommunication, University of the Aegean, Greece, University Hill,building of Geography, Off.2.14, 81-100, Mytilene, Lesvos, Greece.
[email protected], ATHENA Research Centre, University Campusat Kimeria, 67100, Xanthi, Greece, tel:+30-2541078787,fax: +30-2541063656
[email protected], ATHENA Research Centre, University Campusat Kimeria, 67100, Xanthi, Greece, tel:+30-2541078787,fax: +30-2541063656
[Received date; Accepted date] – to be inserted later
volume 2 number 4 2013International Journal of Heritage in the Digital Era

586
Modelling Archaeological andGeospatial Information for Burial SitePrediction, Identification andManagementAikaterini Balla (*), Gerasimos Pavlogeorgatos, Despoina Tsiafakis andGeorge Pavlidis
Abstract:
The application of technologies in humanities and specifically in
Archaeology over the past recent years has yielded important
expertise that can be successfully exploited by both Archaeological
Research and Cultural Heritage Management. This study presents a
general methodology for designing, developing and implementing
predictive modelling for identifying sites of archaeological interest.
The methodology is based on documented archaeological data and
geographical factors, geospatial analysis and predictive modelling
into one consistent workflow. The model was tested extensively and
was validated using a commonly used predictive gain. The results and
the evaluation of the model proved the efficiency of its predictive
ability in providing answers to a series of questions related to
Archaeological Research issues and Cultural Heritage Management.
1. Introduction
Cultural Heritage Management (CHM) was significantly empowered over the past decadesby the application of scientific approaches and digital technologies that provide fast andreasonably accurate prediction of the existence of cultural sites prior to developmentprojects. Predictive Modelling (PM), in particular, has already been proven as a valuable toolfor the rescue of archaeological remains and the saving of archaeological data that wouldotherwise have been lost due to modern development. On the other hand, in terms ofarchaeological-academic research, PM has already been successfully exploited by

archaeologists, and is further expected to be an integral part ofarchaeological practice, in interpreting and understanding the socio-economic structure of the past.
A basic definition of PM in archaeology was introduced by Kohlerand Parker [1], where it was described as “a technique that, at aminimum, tries to predict the locations of archaeological sites ormaterials in a region, based either on a sample of that region or onfundamental notions concerning human behaviour”. The term“predictive models” was eventually adopted internationally todescribe tools for projecting patterns or known relationships intorelated areas of unknown patterns or relationships [2]. Namely, PM canbe conceptualised as a specialised form of location-allocationanalysis, where the aim is to allocate suitable locations to specifictypes of human activity and their archaeological remains [3]. In thisanalysis, the criteria for suitability derive from location analysis, namelyby the generation of the behavioural norms from the observations ofthe way people behave or have behaved in the past.
The basic principle upon which this scientific field was based on isthat the locational selection of human activity in the ancient times wasnot random, but it was associated to current specific characteristics ofthe natural environment and factors related to human activity andhuman behavioural norms in the past. By identifying this causalrelationship between certain environmental and geographicalcharacteristics and known archaeological site locations, repeatingpatterns can be identified, creating a statistical model that can beapplied to unsurveyed areas in order to identify new locations thatmay also have been occupied by similar human activities [4].
The literature research regarding the understanding of thetheoretical basis of PM is quite extensive and has created severaldebates among scholars, which have generally been cast in the formof a series of dichotomies [3]. One of the main distinctions made inpredictive modelling, deriving from its conceptual context itself andthe appropriate logic of prediction being used, is based on the use ofinductive versus deductive logic.
Inductive (data driven) models, which have long been thedominant form of predictive modelling [5-6] exploit existing knowledgeto forecast spatial patterns [7]. In this type of modelling the criteriaused come from observations rather than from theory, namely throughstatistical comparison between known archaeological sites’ locationsand other variables, usually representing natural landscape features(environmental parameters) [3, 6, 8]. Nevertheless, by the early 1990’sand onwards, numerous studies questioned inductive models, despitetheir popularity especially for CHM applications [9–16]. According to
587Modelling Archaeological and Geospatial Information for Burial Site Prediction,Identification and Management

these critiques, inductive models follow “loose” approaches that lackof any non-environmental predictor variables. Thus, the role of social,ideological and political factors that produced, along with theenvironmental variables, the statistical correlations that were found,receive little attention in the analysis, and, therefore, the model isbased on insufficient theoretical documentation [3, 6, 8–16].
The deductive (theory driven) approach, on the other hand, isbased on a priori archaeological or anthropological knowledge,“produced” by the theory and the understanding of general humanbehaviour [17-18]. In other words, deductive models are based onassumptions deriving from the understanding of the human decisionmaking process in the past and combine variables related to spatial,environmental etc. properties that may have affected thoselocational decisions. In this case, where the criteria for site locationsare mainly hypothetical, the known archaeological sites are onlyused to evaluate the prediction success. Figure 1 depicts thebuilding and testing procedure followed by inductive and deductivemodels. Theory driven models involve the perspective of humandecision making in modelling and thus are clearly moreadvantageous and therefore preferable especially for academicresearchers who are more interested in finding explanations in thereasons of archaeological remains’ concentrations in particularparts of the landscape [19]. Nevertheless, the problem is alwaysmore complex in practice, as this type of modelling needs a well-defined theoretical framework for settlement location choice, whichis not always available [6]. On one hand, the discovery ofarchaeological remains is coincidental and mainly a result of
Figure 1. The building and testing
procedure of inductive and
deductive models.
588 Aikaterini Balla, Gerasimos Pavlogeorgatos, Despoina Tsiafakisand George Pavlidis
Assumptionsabout location
Knownarchaeological
sites
Knownarchaeological
sites
Correlationwith the
environment
Building process
Deductive model
Inductive model
Predictivemodel
Predictivemodel
Existingdata New dataJudgement
of expert
Testing
TestingBuildingprocess

modern development interventions, which, however, lead to partialor total destruction of archaeological sites. On the other hand, anumber of reasons, such as the lack of financial resources ensuelack of systematic archaeological excavations and therefore,incomplete knowledge of the archaeological remains in manyareas. Even in the cases of more systematic excavations, the understudy areas are usually necessarily small, and consequently thearchaeological information collected and studied cannot be easilycompared or opposed to data from other areas related to the samehuman activity, from which these archaeological remains weregenerated.
Moreover, in practice, these modelling approaches overlap[17, 20], as neither is purely inductive or deductive in nature [8].Inductive modelling does in fact include obscured knowledge ofhuman behaviour in the analysis, as otherwise, no one would try torelate, for example, the location of an archaeological site with theterrain slope [3]. On the other hand, the theory of general humanbehaviour is often based on informal induction. Such an example is totake for granted that people of a specific past period preferred to livein a particular soil cover type, because most of their settlements werediscovered in such geological type environments. Thisacknowledgment, however, would be erroneous, as the geographiccriteria, related to the human activity of a past period, are based ondata derived from the known archaeological sites.
As a result, many predictive models continue to use the inductiveapproach exploiting the most of the archaeological andenvironmental available data, and just in a few cases include socio-cultural factors [21]. In other cases, in an attempt to meet halfway,many predictive models follow a hybrid approach, in whichinductive statistical methods are applied to obtain a first impressionof the site location characteristics and then the general knowledgeof the locational behaviour of human societies is added to themodel [3].
2. The Proposed Methodology
At the core of the proposed methodology, a multi-criteria analysis onGIS data is being employed. A hybrid inductive-deductive approachof the criteria is proposed, whereas fuzzy logic is applied for the criterianormalization and quantification. The basic workflow of themethodology consists of the following steps (Figure 2):
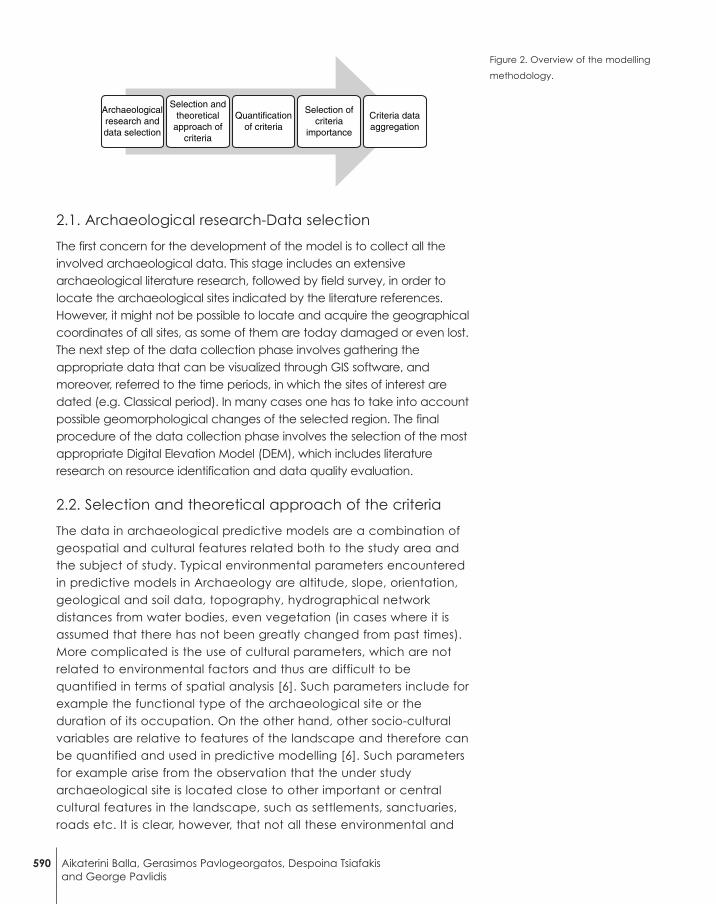
1. Archaeological research-Data selection2. Selection and theoretical approach of the criteria3. Quantification of the criteria4. Selection of importance and calculation of criteria weights5. Criteria data aggregation
589Modelling Archaeological and Geospatial Information for Burial Site Prediction,Identification and Management
2.1. Archaeological research-Data selection
The first concern for the development of the model is to collect all theinvolved archaeological data. This stage includes an extensivearchaeological literature research, followed by field survey, in order tolocate the archaeological sites indicated by the literature references.However, it might not be possible to locate and acquire the geographicalcoordinates of all sites, as some of them are today damaged or even lost.The next step of the data collection phase involves gathering theappropriate data that can be visualized through GIS software, andmoreover, referred to the time periods, in which the sites of interest aredated (e.g. Classical period). In many cases one has to take into accountpossible geomorphological changes of the selected region. The finalprocedure of the data collection phase involves the selection of the mostappropriate Digital Elevation Model (DEM), which includes literatureresearch on resource identification and data quality evaluation.
2.2. Selection and theoretical approach of the criteria
The data in archaeological predictive models are a combination ofgeospatial and cultural features related both to the study area andthe subject of study. Typical environmental parameters encounteredin predictive models in Archaeology are altitude, slope, orientation,geological and soil data, topography, hydrographical networkdistances from water bodies, even vegetation (in cases where it isassumed that there has not been greatly changed from past times).More complicated is the use of cultural parameters, which are notrelated to environmental factors and thus are difficult to bequantified in terms of spatial analysis [6]. Such parameters include forexample the functional type of the archaeological site or theduration of its occupation. On the other hand, other socio-culturalvariables are relative to features of the landscape and therefore canbe quantified and used in predictive modelling [6]. Such parametersfor example arise from the observation that the under studyarchaeological site is located close to other important or centralcultural features in the landscape, such as settlements, sanctuaries,roads etc. It is clear, however, that not all these environmental and
Figure 2. Overview of the modelling
methodology.
590 Aikaterini Balla, Gerasimos Pavlogeorgatos, Despoina Tsiafakisand George Pavlidis
Archaeologicalresearch anddata selection
Selection andtheoretical
approach ofcriteria
Quantificationof criteria
Selection ofcriteria
importance
Criteria dataaggregation

cultural parameters can be used as input data in all types ofarchaeological sites. For example, according to Jarosl/ aw andHildebrandt-Radke [22] the socio-economic factors and featuressuch as topographic relief, distance from water bodies or soil covertype that also had an important role in the locational processes ofancient settlements [23-32] cannot be the same with the factors thatled to the locational decision making for burial mounds orsanctuaries. Furthermore, it is clear that those factors-criteria canvary even for the same type of archaeological site, as they may berelated to a specific time period, region or specific cultures.Therefore, in any case, it is necessary to study thoroughly theparticular type of archaeological site and extract the environmentaland cultural criteria that led to the specific human decision rules.
2.3. Quantification of the criteria
After the theoretical selection of the criteria one has to quantify themin order to initialize the implementation process. Dimensionless data,such as vector map data (points and lines) should be quantified asareas, appropriately sized around the linear and point data anddefined as “zones”. Furthermore, all criteria are normalized so that theycan be referenced in a common scale, and therefore the criteriaaggregation can be performed on a common basis. Normalizationcan be efficiently performed by applying fuzzy logic.
2.4. Selection of importance and calculation of criteriaweights
The next stage of the model-building process includes thecalculation of the criteria weights, namely the importance of eachcriterion. One of the most popular methods used in a multi-criteriaanalysis is the Analytical Hierarchy Process (AHP) [28], a structuredtechnique for organizing and analysing complex decisions. In AHP onecan attribute different weights to the criteria or sets of activities,depending on the degree of their significance, by making pairwisecomparisons of the criteria, based on the decision makers’ judgmentsabout their relative meaning and importance.
2.5. Criteria data aggregation
The process of criteria data aggregation can be achieved by usingthe method of Weighted Linear Combination [29], whereby eachcriterion’s value is multiplied with the value of its weight and the resultsare summed. Provided that the sum of all weights equals to 1, theresult of the aggregation will have the same range as the onespecified for the criteria. The aggregation process can bemathematically expressed by the following equation:
591Modelling Archaeological and Geospatial Information for Burial Site Prediction,Identification and Management

(1)
where S is the probability of archaeological site occurrence, wi theweight of the criterion i and xi the value of the criterion i.
2.6. Prediction results
The results of the model are maps of the region of interest with colourcoding corresponding to different probabilities of site occurrence.Figure 3 shows an example of model results.
3. Application of The Proposed Methodology to BurialSites
Numerous archaeological predictive models have been developed todate to detect remains of human activity in the past [4, 30–38].However, an extensive review of the related literature indicates thelack of applications related to cemeteries and burial sites.Undoubtedly, burial mounds, tombs and cemeteries have been thesubject in many studies, which, however, examine the correlationbetween topography and their location on the landscape [39-40],chronological estimations [41], viewshed and visibility [42–45] or simplyincluded among other archaeological data, the locations of funerarymonuments and cemeteries to map archaeological sites. The studiesfound in literature regarding exclusively the prediction of burialmonuments or mounds are rare [46–49].
The noticeable lack of that kind of predictive models attracted ourattention in the particular scientific field and triggered the effort ofcreating a predictive model for the detection of Macedonian tombs.Through the archaeological research on Macedonian tombs and thedata aggregation, assumptions related to their location wereformulated, resulting in the selection of criteria considered to haveinfluenced the siting of the Macedonian tombs. The model was
S w xi i= ∑
Figure 3. Example map results.
592 Aikaterini Balla, Gerasimos Pavlogeorgatos, Despoina Tsiafakisand George Pavlidis
N
9045
Kilometers
LegendKnown tombsLakesVery low probabilityLow probabilityMedium probabilityHigh probabilityVery high probability
0

created and tested under various combinations of parameters relatedto the criteria. The results were evaluated by using a commonly usedpredictive gain, which tested the predictive ability of the model for thedifferent cases. In the following paragraphs the basic steps of themodelling process are being discussed.
3.1. Archaeological research-Data selection
The first stage of the development of the model involved thecollection of the data regarding the burial monuments that have beendiscovered to date in Northern Greece, which the archaeologicalresearch entails and accepts as “Macedonian tombs”. This stageincluded an extensive archaeological literature research, followed byfield survey, in order to locate the tombs in the areas indicated by theliterature references. The total list resulted from the literature researchfor the area of interest (Macedonia-Thrace, Greece) included 95Macedonian tombs. However, it was not possible to locate andacquire the geographical coordinates of all tombs, as some of thesemonuments are today damaged or even lost. Therefore, the tombseventually gathered from field survey and used in this study are 83.
The next step of the data collection phase involved the gatheringof the appropriate data that could be visualized through GIS software,and moreover, referred to the time periods, in which the Macedoniantombs are dated (Late Classical-Hellenistic period). After extensiveresearch, we concluded that the most comprehensive and reliablesource of these primary data is the Atlas of Barrington [50], which wasthe main archaeological cartographic background for the dataregarding roads, settlements, rivers, lakes and geomorphologicalchanges of the selected region.
The last procedure of the data collection phase was the selectionof the most appropriate Digital Elevation Model (DEM). Again thisprocedure included a literature research regarding resourceidentification and data quality evaluation. Based on the resultspresented in [37, 51–53] we decided to use NASA’s SRTM DEM, version4.1, with a resolution of 90 meters per pixel.
3.2. Selection and theoretical approach of the criteria
In the case of Macedonian tombs the selection of the criteria wasdetermined by the environmental and cultural factors that wereconsidered to have influenced the choice of their location. Theorientation, for example, of those funerary monuments could not beused as a criterion, because the archaeological research does notidentify a certain pattern or certain principles [54-55]. Similarly, thedistance from sanctuaries or temples could neither be used, becausethe archaeological research to date does not substantiate any
593Modelling Archaeological and Geospatial Information for Burial Site Prediction,Identification and Management
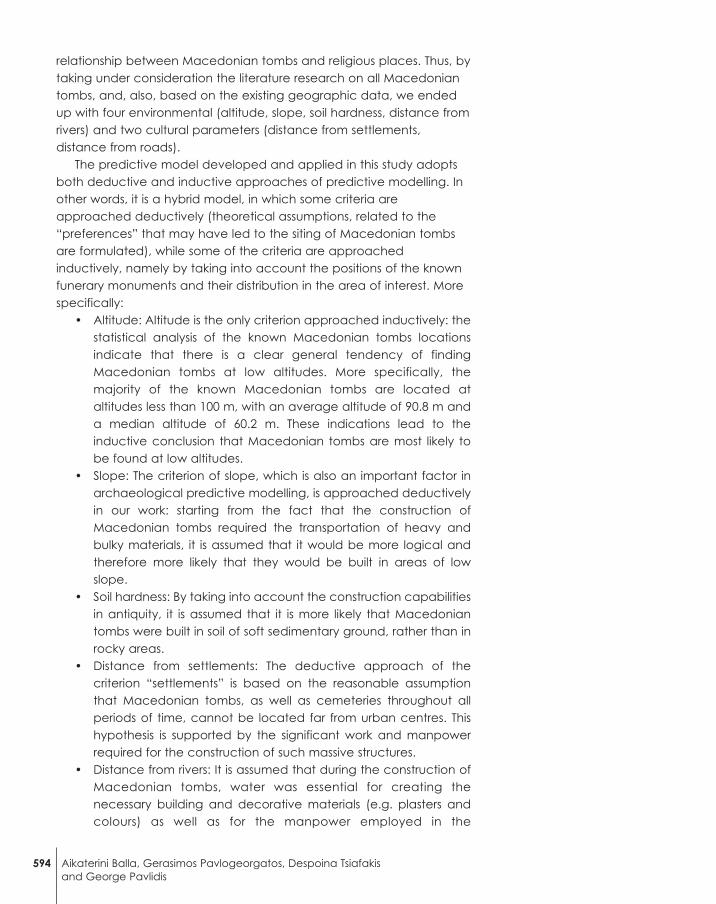
relationship between Macedonian tombs and religious places. Thus, bytaking under consideration the literature research on all Macedoniantombs, and, also, based on the existing geographic data, we endedup with four environmental (altitude, slope, soil hardness, distance fromrivers) and two cultural parameters (distance from settlements,distance from roads).
The predictive model developed and applied in this study adoptsboth deductive and inductive approaches of predictive modelling. Inother words, it is a hybrid model, in which some criteria areapproached deductively (theoretical assumptions, related to the“preferences” that may have led to the siting of Macedonian tombsare formulated), while some of the criteria are approachedinductively, namely by taking into account the positions of the knownfunerary monuments and their distribution in the area of interest. Morespecifically:
• Altitude: Altitude is the only criterion approached inductively: thestatistical analysis of the known Macedonian tombs locationsindicate that there is a clear general tendency of findingMacedonian tombs at low altitudes. More specifically, themajority of the known Macedonian tombs are located ataltitudes less than 100 m, with an average altitude of 90.8 m anda median altitude of 60.2 m. These indications lead to theinductive conclusion that Macedonian tombs are most likely tobe found at low altitudes.
• Slope: The criterion of slope, which is also an important factor inarchaeological predictive modelling, is approached deductivelyin our work: starting from the fact that the construction ofMacedonian tombs required the transportation of heavy andbulky materials, it is assumed that it would be more logical andtherefore more likely that they would be built in areas of lowslope.
• Soil hardness: By taking into account the construction capabilitiesin antiquity, it is assumed that it is more likely that Macedoniantombs were built in soil of soft sedimentary ground, rather than inrocky areas.
• Distance from settlements: The deductive approach of thecriterion “settlements” is based on the reasonable assumptionthat Macedonian tombs, as well as cemeteries throughout allperiods of time, cannot be located far from urban centres. Thishypothesis is supported by the significant work and manpowerrequired for the construction of such massive structures.
• Distance from rivers: It is assumed that during the construction ofMacedonian tombs, water was essential for creating thenecessary building and decorative materials (e.g. plasters andcolours) as well as for the manpower employed in the
594 Aikaterini Balla, Gerasimos Pavlogeorgatos, Despoina Tsiafakisand George Pavlidis

construction process that was in need for drinking water.Therefore, it is considered more likely for Macedonian tombs tobe located near water sources (rivers).
• Distance from roads: The current criterion is also approacheddeductively. As the burial customs of the Macedoniansnecessitated frequent burial ceremonies and rituals for a longtime after one’s death, hence, it is assumed that Macedoniantombs should be accessible from roads that connected themwith the nearest settlement, in order to provide easy access forrelatives and friends at the burial location. Moreover, theconstruction of these monumental buildings itself imposedthe transfer of large quantities of heavy materials, which supportsthe hypothesis that they were built close to a road network, inorder to solve the practical problems of the transportation of thenecessary construction materials.
To sum up, five of the selected criteria are deductivelyapproached, whereas the criterion of altitude alone is approachedinductively, due to the fact that, otherwise, there is no “reasonable”basis on locating Macedonian tombs in high or low altitudes. This stepis followed by the typical prediction modelling procedures describedin paragraphs 2.3–2.5. Experimental results and model validation arepresented in the following section.
3.3. Experimental results and model validation
The proposed predictive model has initially been tested for caseswhere all six criteria were considered equally important and thereforeshared the same weight. Additionally, by taking into account thearchaeological research that documents the existence ofMacedonian tombs near settlements and roads, the criteria “distancefrom settlements” and “distance from roads” were considered to be ofhigher importance than other criteria, and so they could be assignedweights of higher value. This could be quantified by varying thesignificance of these criteria using a multiplier (2x up to 6x).
Thus, in order to examine the predictive capability of the model,the uncertainty regarding the selection of the zones’ range and thesensitivity of the model, we have tested the model using a total of fortytwo (42) combinations of the criteria weights (w) and the zones’ range(m). The different zones’ sizes are defined as multiples of the mediandistance from the exact location of the dimensionless data. Table 1shows the selected combinations.
The 42 different scenarios of the model resulted in the production of42 maps of the region of interest with colour coding corresponding todifferent probabilities of archaeological sites’ occurrence. In Figure1,Figure 2, Figure 3 we present results of three scenarios of the model. On
595Modelling Archaeological and Geospatial Information for Burial Site Prediction,Identification and Management

Table 1. Combinations of the criteria
weights (w) and the buffer zones’
range (m).
Figure 1. Map results showing
probability zones and distribution of
known Macedonian tombs for the
combination w1/m1.
Figure 2. Map results showing
probability zones and distribution of
known Macedonian tombs for the
combination w3/m1.
Figure 3. Map results showing
probability zones and distribution of
known Macedonian tombs for the
combination w5/m1.
596 Aikaterini Balla, Gerasimos Pavlogeorgatos, Despoina Tsiafakisand George Pavlidis
Median multipliers (m)0,15 0,5 1 1,25 1,5 2 3
1 w1/m0.15 w1/m0.5 w1/m1 w1/m1.25 w1/m1.5 w1/m2 w1/m3
2 w2/m0.15 w2/m0.5 w2/m1 w2/m1.25 w2/m1.5 w2/m2 w2/ m3
3 w3/m0.15 w3/m0.5 w3/m1 w3/m1.25 w3/m1.5 w3/m2 w3/ m3
4 w4/m0.15 w4/m0.5 w4/m1 w4/m1.25 w4/m1.5 w4/m2 w4/ m3
5 w5/m0.15 w5/m0.5 w5/m1 w5/m1.25 w5/m1.5 w5/m2 w5/ m3
6 w6/m0.15 w6/m0.5 w6/m1 w6/m1.25 w6/m1.5 w6/m2 w6/ m3Crit
eria
we
ight
s (w
)
N
9045
Kilometers
LegendKnown tombsLakesVery low probabilityLow probabilityMedium probabilityHigh probabilityVery high probability
0
N
9045
Kilometers
LegendKnown tombsLakesVery low probabilityLow probabilityMedium probabilityHigh probabilityVery high probability
0
N
9045
Kilometers
Legend
Known tombsLakesVery low probabilityLow probabilityMedium probabilityHigh probabilityVery high probability
0

these maps we overlap the known Macedonian tombs’ locations asblack dots, in order to provide a first impression about the predictiveefficiency of the model.
The simple, visual evaluation of the results indicates that a largenumber of Macedonian tombs are located in areas of high and veryhigh probability for scenario w1/m1 (Figure 1), where the zones equalto the median of the distances of the known Macedonian tombs fromsettlements, rivers and roads. The results of scenarios w3/m1 andw5/m1 (Figure 2, Figure 3) suggest that higher weight values of thecriteria “distance from settlements” and “distance from roads”significantly reduce the area of high and very high probability andthus affect the identification of the known Macedonian tombs in allareas. Another important conclusion that emerges from the initialprocessing of all the test results is that increasing the zones’ sizes (m)leads to an increasing number of identified known tombs in the highand very high probability areas.
In the following paragraphs the evaluation of the results ispresented for the two distinct cases involving archaeological researchand CHM.
3.3.1. Results for archaeological research
The fact that it has been possible to construct a predictive model doesnot in itself guarantee the accuracy of its predictions [56]. Thevalidation of the model must be examined with reference to theareas, which the model indicates as most likely to find Macedoniantombs. Kvamme [57] proposed the validation of a predictive model,defining a predictive gain as follows:
G = 1 – E1/E2 (2)
where, in the case of our model, E1 is the percentage of the total areawhere tombs are predicted, and E2 is the percentage of known tombsidentified within the area where they are predicted, for a givenprobability of site occurrence. It is noted that the gain G is calculatedfor a specified probability of archaeological sites occurrence. The gainranges between –1 and 1, where a zero (0) value indicates nopredictability, value one (1) indicates the highest predictive utility andminus one (–1) the highest predictive utility for the reverse of what isinitially supposed.
In order to validate our model using the gain G, we used the spatialcoordinates of all known Macedonian tombs that have beencollected. In an attempt to identify the areas of high and very highprobability with a high allocation of known Macedonian tombs wehave isolated the results of those tests that detect more than 75% of
597Modelling Archaeological and Geospatial Information for Burial Site Prediction,Identification and Management
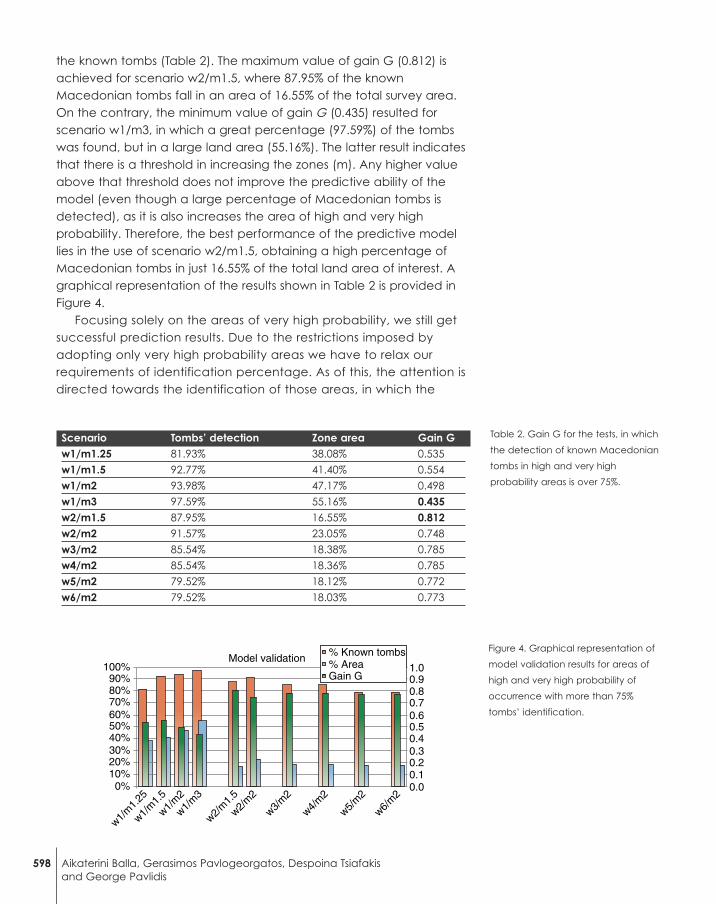
the known tombs (Table 2). The maximum value of gain G (0.812) isachieved for scenario w2/m1.5, where 87.95% of the knownMacedonian tombs fall in an area of 16.55% of the total survey area.On the contrary, the minimum value of gain G (0.435) resulted forscenario w1/m3, in which a great percentage (97.59%) of the tombswas found, but in a large land area (55.16%). The latter result indicatesthat there is a threshold in increasing the zones (m). Any higher valueabove that threshold does not improve the predictive ability of themodel (even though a large percentage of Macedonian tombs isdetected), as it is also increases the area of high and very highprobability. Therefore, the best performance of the predictive modellies in the use of scenario w2/m1.5, obtaining a high percentage ofMacedonian tombs in just 16.55% of the total land area of interest. Agraphical representation of the results shown in Table 2 is provided inFigure 4.
Focusing solely on the areas of very high probability, we still getsuccessful prediction results. Due to the restrictions imposed byadopting only very high probability areas we have to relax ourrequirements of identification percentage. As of this, the attention isdirected towards the identification of those areas, in which the
Table 2. Gain G for the tests, in which
the detection of known Macedonian
tombs in high and very high
probability areas is over 75%.
Figure 4. Graphical representation of
model validation results for areas of
high and very high probability of
occurrence with more than 75%
tombs’ identification.
598 Aikaterini Balla, Gerasimos Pavlogeorgatos, Despoina Tsiafakisand George Pavlidis
Scenario Tombs’ detection Zone area Gain Gw1/m1.25 81.93% 38.08% 0.535
w1/m1.5 92.77% 41.40% 0.554
w1/m2 93.98% 47.17% 0.498
w1/m3 97.59% 55.16% 0.435w2/m1.5 87.95% 16.55% 0.812w2/m2 91.57% 23.05% 0.748
w3/m2 85.54% 18.38% 0.785
w4/m2 85.54% 18.36% 0.785
w5/m2 79.52% 18.12% 0.772
w6/m2 79.52% 18.03% 0.773
60%70%80%90%
100%
50%40%30%
w1/m
1.25
w1/m
1.5
w1/m
3
w1/m
2
w2/m
1.5
w2/m
2
w3/m
2
w4/m
2
w5/m
2
w6/m
2
Model validation
20%10%0%
0.60.70.80.91.0
% Known tombs% AreaGain G
0.50.40.30.20.10.0

detection of known Macedonian tombs (in very high probabilityareas) is over 50%. Table 3 summarizes the test results for this case. Agraphical representation of the results shown in Table 3 is provided inFigure 5.
The maximum value of gain G (0. 905) is achieved for w2/m0.5,where 55.42% of the known Macedonian tombs fall in an area ofonly 5.26% of the total survey area. On the contrary, the minimumvalue of gain G (0.720) resulted for w1/m3, which detected 93.98%of the known tombs within an area of 26.30% of the total surveyarea.
Further processing of the test results led to another significantacknowledgement: In both cases (high and very high probabilityareas, solely very high probability areas) different weight values for“distance from settlements” and “distance from roads” can onlyinfluence the predictive ability of the model up to a certain degree.Therefore, there is no point in increasing the weights for those twocriteria, above a certain value, as it is shown, in many combinations,that the increased weight values affect very little both the spatialidentification of Macedonian tombs and the area of thecorresponding probability zones (Figure 6, Figure 7).
Table 3. Gain G for the tests, in which
the detection of known Macedonian
tombs in very high probability zones
is over 50%.
Figure 5. Graphical representation of
model validation results for areas of
very high probability of occurrence
with more than 50% tombs’
identification.
599Modelling Archaeological and Geospatial Information for Burial Site Prediction,Identification and Management
Scenarios Tombs’ detection Zone area Gain Gw1/m1.25 51.81% 9.03% 0.826
w1/m1.5 62.65% 11.36% 0.819
w1/m2 78.31% 17.03% 0.783
w1/m3 93.98% 26.30% 0.720w2/m2 55.42% 5.26% 0.905w3/m2 55.42% 5.28% 0.905
w4/m2 56.63% 5.46% 0.903
w5/m2 56.63% 5.47% 0.903
w6/m2 56.63% 5.47% 0.903
60%70%80%90%
100%
50%40%30%
w1/m
1.25
w1/m
1.5
w1/m
3
w1/m
2
w2/m
2
w3/m
2
w4/m
2
w5/m
2
w6/m
2
Model validation
20%10%
0%
0.60.70.80.91.0
% Known tombs% AreaGain G
0.50.40.30.20.10.0

3.3.2 Results for CHM
To evaluate the results of the model it would be sufficient just toacknowledge the largest possible area, in which none of the knowntombs can be found. Table 4 presents the test results regarding the“very low probability” areas of Macedonian tombs’ occurrence. Thebest results are attained for the combination w6/m0.5 (77.61% of the
Figure 6. (a) High and very high
probability zone area as a function
of the criteria weight for different
zone ranges (b) Detected known
tombs in high and very high
probability zones as a function of the
criteria weight for different zone
ranges.
Figure 7. (a) Very high probability
zone area as a function of the
criteria weight for different zone
ranges (b) Detected known tombs in
high and very high probability zones
as a function of the criteria weight
for different zone ranges.
600 Aikaterini Balla, Gerasimos Pavlogeorgatos, Despoina Tsiafakisand George Pavlidis
50%Zone area
45%40%35%30%25%20%15%10%5%0%
w1 w2 w3 w4 w5 w6
(a)
m1m0.5m1.5m2
100%Detected known tombs
90%80%70%60%50%40%30%20%10%0%
w1 w2 w3 w4 w5 w6
(b)
m1m0.5m1.5m2
18%Zone area
16%14%12%10%8%6%4%2%0%
w1 w2 w3 w4 w5 w6
(a)
80%Detected known tombs
70%60%50%40%30%20%10%0%
w1 w2 w3 w4 w5 w6
(b)
m1m0.5m1.5m2
m1m0.5m1.5m2

total survey area), which, however, contains 34.94% of knownMacedonian tombs (Figure 1).
Therefore, it is obvious that the model predicts large areas of verylow probability of Macedonian tombs’ occurrence, but with a highlevel of risk.
In cases where the aim is to acknowledge the zone areas with no“loss” of archaeological sites, it is necessary to detect thecombinations, which indicate total Macedonian tombs’ absence.Table 5 shows the results of the tests, where no known tomb was foundin very low probability areas.
Table 4. Test results regarding the
“very low probability” zones.
Table 5. Test results where no known
tomb was found in very low
probability areas.
601Modelling Archaeological and Geospatial Information for Burial Site Prediction,Identification and Management
w1 m0.5 m1 m1.5 m2Zone area 4.44% 3.34% 2.32% 1.58%
Tombs’ detection 0.00% 0.00% 0.00% 0.00%
w2 m0.5 m1 m1.5 m2Zone area 20.08% 13.64% 8.50% 5.42%
Tombs’ detection 0.00% 0.00% 0.00% 0.00%
w3 m0.5 m1 m1.5 m2Zone area 38.11% 25.00% 15.34% 9.54%
Tombs’ detection 2.41% 0.00% 0.00% 0.00%
w4 m0.5 m1 m1.5 m2Zone area 42.99% 31.73% 23.19% 18.14%
Tombs’ detection 2.41% 0.00% 0.00% 0.00%
w5 m0.5 m1 m1.5 m2Zone area 77.15% 62.27% 53.07% 46.45%
Tombs’ detection 34.94% 16.87% 7.23% 6.02%
w6 m0.5 m1 m1.5 m2Zone area 77.61% 63.37% 54.19% 47.65%
Tombs’ detection 34.94% 13.25% 7.23% 6.02%
w/m combination Tombs’ detection Zone areaw1/m0.5 0.00% 4.44%
w1/m1 0.00% 3.34%
w1/m1.5 0.00% 2.32%
w1/m2 0.00% 1.58%
w2/m0.5 0.00% 20.08%
w2/m1 0.00% 13.64%
w2/m1.5 0.00% 8.50%
w2/m2 0.00% 5.42%
w3/m1 0.00% 25.00%
w3/m1.5 0.00% 15.34%
w3/m2 0.00% 9.54%
w4/m1 0.00% 31.73%
w4/m1.5 0.00% 23.19%
w4/m2 0.00% 18.14%
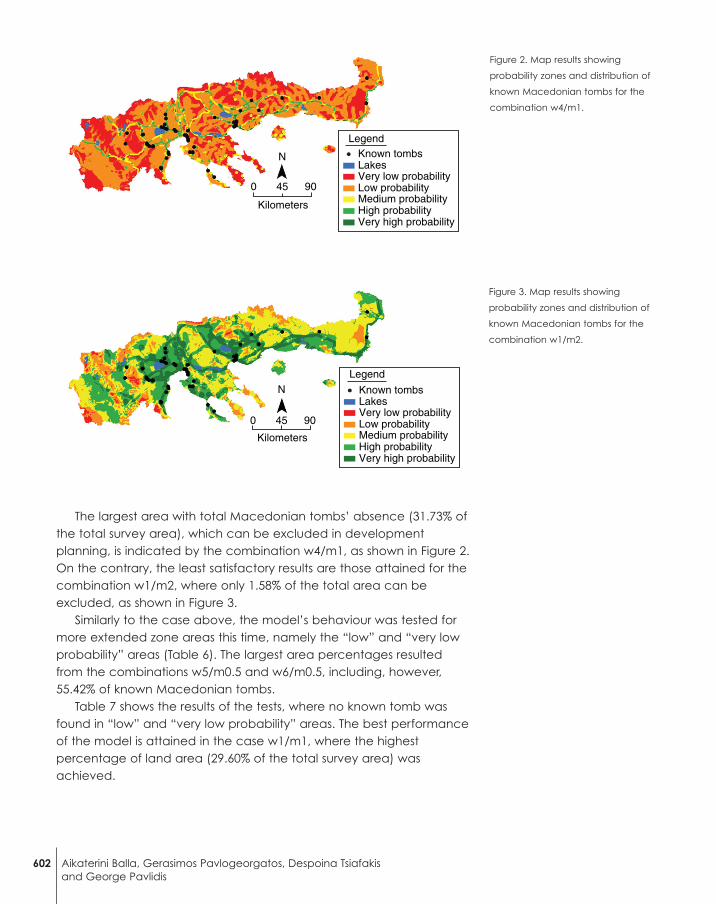
The largest area with total Macedonian tombs’ absence (31.73% ofthe total survey area), which can be excluded in developmentplanning, is indicated by the combination w4/m1, as shown in Figure 2.On the contrary, the least satisfactory results are those attained for thecombination w1/m2, where only 1.58% of the total area can beexcluded, as shown in Figure 3.
Similarly to the case above, the model’s behaviour was tested formore extended zone areas this time, namely the “low” and “very lowprobability” areas (Table 6). The largest area percentages resultedfrom the combinations w5/m0.5 and w6/m0.5, including, however,55.42% of known Macedonian tombs.
Table 7 shows the results of the tests, where no known tomb wasfound in “low” and “very low probability” areas. The best performanceof the model is attained in the case w1/m1, where the highestpercentage of land area (29.60% of the total survey area) wasachieved.
Figure 2. Map results showing
probability zones and distribution of
known Macedonian tombs for the
combination w4/m1.
Figure 3. Map results showing
probability zones and distribution of
known Macedonian tombs for the
combination w1/m2.
602 Aikaterini Balla, Gerasimos Pavlogeorgatos, Despoina Tsiafakisand George Pavlidis
N
9045
Kilometers
LegendKnown tombsLakesVery low probabilityLow probabilityMedium probabilityHigh probabilityVery high probability
0
N
9045
Kilometers
Legend
Known tombsLakesVery low probabilityLow probabilityMedium probabilityHigh probabilityVery high probability
0

4. Conclusions
This paper describes a general methodology used to create apredictive model that can be applied to indicate areas ofarchaeological sites’ occurrence. The methodology involves extensivearchaeological research, geospatial data processing technologies(GIS) and predictive modelling techniques. The theoretical approachof the predictive model combined both the inductive and deductivetheory, in order to achieve the optimal configuration of the usedvariables. The gain of using such an approach is twofold. On one handone may use it as a tool for archaeological research and on anotherfor CHM.
The methodology has been successfully applied in MacedonianTombs location identification. All known and identifiable Macedoniantombs were studied and their actual locations were recorded in orderto serve as ground truth data. The evaluation of the modeldemonstrated the validity of the proposed methodology andnumerous tests proved the efficiency of the model’s predictive ability
Table 6. Test results regarding the low
and very low probability zones.
Table 7. Test results with no known
tomb found in the low and very low
probability zones.
603Modelling Archaeological and Geospatial Information for Burial Site Prediction,Identification and Management
w1 m0.5 m1 m1.5 m2Zone area 41.47% 29.60% 20.60% 15.36%
Tombs’ detection 3.61% 0.00% 0.00% 0.00%
w2 m0.5 m1 m1.5 m2Zone area 77.46% 63.07% 53.83% 47.30%
Tombs’ detection 34.94% 13.25% 7.23% 6.02%
w3 m0.5 m1 m1.5 m2Zone area 94.00% 86.33% 79.59% 71.66%
Tombs’ detection 55.42% 27.71% 12.05% 8.43%
w4 m0.5 m1 m1.5 m2Zone area 94.00% 86.55% 79.58% 71.65%
Tombs’ detection 55.42% 24.10% 12.05% 8.43%
w5 m0.5 m1 m1.5 m2Zone area 94.01% 86.33% 79.58% 71.65%
Tombs’ detection 55.42% 27.71% 12.05% 8.43%
w6 m0.5 m1 m1.5 m2Zone area 94.01% 86.55% 79.58% 71.65%
Tombs’ detection 55.42% 24.10% 12.05% 8.43%
w/m combination Tombs’ detection Zone areaw1/m1 0.00% 29.60%
w1/m1.5 0.00% 20.60%
w1/m2 0.00% 15.36%

in providing several alternatives for its use in both archaeological-academic research and CHM.
The prediction results, in the form of quantized prediction maps, areconsidered satisfactory, when used for the contribution toarchaeological-academic research. In that case, the aim is to identifysmall areas that are of high probability to find archaeological sites andtherefore need further investigation. Models based on the proposedmethodology would enrich archaeological knowledge about ancientculture and would contribute to the study of ancient topography, asthe discovery of new sites can result in finding yet undiscoveredsettlements, roads, burial monuments etc. Furthermore, the proposedmodel can be used as an efficient solution to the lack of funding byminimizing the number of trial excavations and by indicating specificareas that are of high probability to result in finding undiscoveredarchaeological remains.
For the case of CHM and site protection, the aim is to identifygeographic areas with minimal or no probability of occurrence ofarchaeological remains. The identification and knowledge of largeareas that contain no, or the least possible, archaeological sites, canbe used for spatial guidance and support for projects that involvedecision making about land usage and modern developmentactivities. Thus, the damages to archaeological sites caused bymodern environmental and urban planning projects could beimpeded.
The methodology adopted in this work could be generalized as aworkflow applicable to archaeological predictive modelling for othertypes of archaeological sites, as long as there is a strong geospatial“character” in the involved data. By conducting archaeologicalresearch on a specific type of archaeological site and by customisingthe input data of the model (criteria, geospatial features related to thesite), the adopted methodology could also result in successfulpredictive modelling for other types of archaeological remains.
However, it is clear that in all archaeological analyses, bothtraditional or those that use geospatial technologies, thearchaeological datasets usually cannot be complete or consideredrepresentative for all archaeological sites. Undoubtedly, there arelimitations to both environmental and certain socio-cultural variables,as they may not be relevant for other archaeological settings, orcannot even be modeled in all situations because of poor availablearchaeological data. These limitations should be taken seriously underconsideration in the spatial analysis of archaeological data and thedevelopment of predictive models which, in any case, should be usedwith caution in order to ensure their significance to both academicresearch and CHM.
604 Aikaterini Balla, Gerasimos Pavlogeorgatos, Despoina Tsiafakisand George Pavlidis

REFERENCES[1] T.A. Kohler, S.C. Parker, Predictive models for archaeological resource
location, in: M.B. Schiffer (Ed.), Advances in Archaeological Method andTheory 9, Academic Press, New York, 1986, pp. 397–452.
[2] R.E. Warren, D.L. Asch, A Predictive Model of Archaeological Site Locationin the Eastern Prairie Peninsula, in K.L. Wescott, R.J. Brandon (Eds.),Practical applications of GIS for archaeologists. A predictive modelling kit,Taylor & Francis, London, 2000, pp. 5–32.
[3] P.M. Van Leusen, Pattern to process: methodological investigations into theformation and interpretation of spatial patterns in archaeologicallandscapes, Ph.D. thesis, University Groningen, Groningen, 2002.
[4] E. Hatzinikolaou, T. Hatzichristos, Approaching the paradigm of choosingsettlements locations in Prehistoric period using GIS and quantitativemethods, 3rd HellasGIs “Geo-information Society”, Athens, May 4–5,Greece, 2004.
[5] L. Dalla Bona, Cultural Heritage Resource Predictive Modeling Project,Vol. 3-Methodological Considerations, Report to Ontario Ministry of NaturalResources, Centre for Archaeological Resource Prediction, LakeheadUniversity, Thunder Bay, 1994.
[6] P. Verhagen, L. Nuninger, F.-P. Tourneux, F.Bertoncello, K. Jeneson,Introducing the human factor in predictive modelling: a work in progress,in: G. Earl, T. Sly, A. Chrysanthi, P. Murrieta-Flores, C. Papadopoulos, I.Romanowska, D. Wheatley (Eds). Archaeology in the Digital Era,Proceedings of CAA Conference, 40th Annual Meeting, Southampton,U.K., 2012, Pallas Publications, 2013, pp. 379–388.
[7] R. E. Warren, Predictive modeling of Archaeological Site location: a CaseStudy in the Midwest, in: K. M. S. Allen, S. W. Green, E. B. W. Zubrow (Eds.),Interpreting Space: GIS and Archaeology, Taylor and Francis, London,1990, pp. 201–215.
[8] D. Ebert, Applications of Archaeological GIS, Canadian Journal ofArchaeology 28 (2004) 319–341.
[9] M. Wansleeben, L.B.M. Verhart, The Meuse Valley Project: GIS and sitelocation statistics, Analecta Praehistorica Leidensia 25, (1992) 99–108.
[10] M. Wansleeben, L.B.M. Verhart, Geographical Information Systems.Methodical progress and theoretical decline?, Archaeological Dialogues4:1 (1997) 53–70.
[11] P.M. Van Leusen, Cartographic Modelling in a cell-based GIS, in: J.Andresen, T. Madsen, I. Scollar (Eds.), Computing the Past, Proceedings ofCAA Conference, 20th Annual Meeting, Aarhus, Denmark, 1992, AarhusUniversity Press, Aarhus, 1993, pp. 105–124.
[12] P.M. Van Leusen, GIS and Archaeological Resource Management: AEuropean Agenda, in: G. Lock, Z. Stancic (Eds.), GIS and archaeology: aEuropean perspective, Taylor & Francis, London, 1995, pp. 27–41.
[13] P.M. Van Leusen, GIS and Locational Modelling in Dutch Archaeology:a review of current approaches, in: H.D.G. Maschner (Ed.), NewMethods, Old Problems: Geographic Information Systems in ModernArchaeological Research, Occasional Paper 23, Centre forArchaeological Investigations, Southern Illinois University, 1996,pp. 177–197.
[14] D. Wheatley, Making Space for an Archaeology of Place, InternetArchaeology 15 (2004), intarch.ac.uk/journal/issue15/wheatley_index.html.
605Modelling Archaeological and Geospatial Information for Burial Site Prediction,Identification and Management

[15] P.M. Van Leusen, H. Kamermans, (Eds.), Predictive Modelling forArchaeological Heritage Management: a research agenda, Amersfoort:Rijksdienst voor het Oudheidkundig Bodemonderzoek, 2005.
[16] H. Kamermans, Smashing the Crystal Ball. A critical evaluation of the DutchNational Archaeological Prdeictive model (IKAW), International Journal ofHumanities and Arts Computing 1 (2007) 71–84.
[17] H. Kamermans, M. Wansleeben, Predictive modeling in Dutcharchaeology, Joining forces, in: J. A. Barceló, I. Briz, A. Vila, (Eds.), NewTechniques for Old Times, Proceedings of CAA Conference, 26th AnnualMeeting, Barcelona, 1998, BAR International Series 757, Archaeopress,Oxford, 1999, pp. 225–230.
[18] T.A. Kohler, Putting Social Sciences Together Again: An Introduction to theVolume, in: T. Kohler, G. Gumerman (Eds.), Dynamics in Human andPrimate Societies, Oxford University Press, UK, 1999, pp. 1–18.
[19] P. Verhagen, T.G. Whitley, Integrating Archaeological Theory andPredictive Modelling. A Live Report from the Scene, Journal ofArchaeological Method and Theory 19 (2012) 49–100.
[20] C. Kincaid, Predictive Modeling and its Relationship to Cultural ResourceManagement Applications, in: J. W. Judge and L. Sebastian (Eds.),Quantifying the Present and Predicting the Past: Theory, Method andApplication of Archaeological Predictive Modelling, U.S. Department ofthe Interior, Bureau of Land Management, Denver, U.S. GovernmentPrinting Office, Washington, D.C, 1988, pp. 549–569.
[21] T. G. Whitley, G. Moore, G. Goel, D. Jackson., Beyond the Marsh:Settlement Choice, Perception and Spatial Decision-Making on theGeorgia Coastal Plain, in: B. Frischer, J. Webb Crawford, D. Koller, (Eds.),Making History Interactive, Proceedings of CAA Conference, 37th AnnualMeeting, Williamsburg, Virginia, United States of America, March 22-26,2009, Archaeopress, Oxford, 2010, pp. 380–390.
[22] J. Jarosl/ aw, I. Hildebrandt-Radke, Using multivariate statistics and fuzzylogic system to analyse settlement preferences in lowland areas of thetemperate zone: an example from the Polish Lowlands, Journal ofArchaeological Science 36:10 (2009) 2096–2107.
[23] A. Bauer, N. Kathleen, L. Park, T. Matney, Archaeological site distribution bygeomorphic setting in the southern Lower Cuyahoga River Valley,Northeastern Ohio: initial observations from a GIS database,Geoarchaeology: An International Journal 19:8 (2004) 711–729.
[24] B. Duke, Quantifying Palaeolithic landscapes: computer approaches toterrain analysis and visualization, in: M. Doerr and A. Sarris (Eds), The digitalheritage of archaeology, Proceedings of CAA Conference, 29th AnnualMeeting, Heraklion, Crete, Greece, 2002, Hellenic Ministry of Culture,Athens, Greece, 2003, pp. 139–146.
[25] R. Fletcher, Some spatial analyses of Chalcolithic settlement in SouthernIsrael, Journal of Archaeological Science 35:7 (2008) 2048–2058.
[26] K.L. Kvamme, A predictive site location model on the high plains: anexample with an independent test, Plains Anthropologist 37:138 (1992)19–40.
[27] Z. Stancic, K. Kvamme, Settlement pattern modelling through BooleanOverlays of social and environmental variables, in: J.A. Barcelo, I. Briz, A.Vila, New Techniques for Old Times, Proceedings of CAA Conference, 26thAnnual Meeting, Barcelona, 1998, BAR International Series 757,Archaeopress, Oxford, 1999, pp. 231–237.
606 Aikaterini Balla, Gerasimos Pavlogeorgatos, Despoina Tsiafakisand George Pavlidis

[28] V. Vanacker, G. Govers, G. Van Peer, C. Verbeek, J. Desmet, J. Reyniers,Using Monte Carlo simulation for the environmental analysis of smallarchaeologic datasets, with the Mesolithic in Northeast Belgium as a casestudy, Journal of Archaeological Science 28:6 (2001) 661–669.
[29] R.E. Warren, Predictive Modeling in Archaeology: A Primer, in: K. M. S. Allen,S. W. Green, E. B. W. Zubrow (Eds.), Interpreting Space: GIS andArchaeology, Taylor & Francis, London, 1990, pp. 90–111.
[30] G.R. Willey, Prehistoric Settlement Patterns in the Viru Valley, Peru. Bureau ofAmerican Ethnology Bulletin 155. Smithsonian Institution, Washington, DC, 1953.
[31] S. Williams, Settlement patterns in the lower Mississippi valley, in: G. Willey(Ed.), Prehistoric Settlement Patterns in the New World, Viking FundPublications in Anthropology 23, New York, 1956, pp. 52–62.
[32] L. Williams, D. Thomas, R. Bettinger, Notions to numbers: Great Basinsettlements as polythetic sets, in: C.L. Redman (Ed.), Research and Theoryin Current Archaeology, John Wiley & Sons, New York, 1973, pp. 215–237.
[33] T.L. Saaty, The Analytic Hierarchy Process, McGraw Hill International, NewYork, London, Toronto, 1980.
[34] H. Voogd, Multi-criteria evaluations for urban and regional planning, PionLimited, London, 1983.
[35] K. Kotsakis, S. Dafou, GIS and predictive modelling of archaeological sitelocation: the Langadas survey project, 2nd HellasGIs “Social Practices andSpatial Information, European and Greek Expertise in GIS”, Thessaloniki,June 27–28, Greece, 2002.
[36] T. Aubry, L. Luís, A.L. Dimuccio, Nature vs. Culture: present-day spatialdistribution and preservation of open-air rock art in the Coa and DouroRiver Valleys (Portugal), Journal of Archaeological Science 39:4 (2012)848–866.
[37] R. Fernandes, G. Geeven, S. Soetens, V. Klontza-Jaklova, Dele-tion/Substitution/Addition (DSA) model selection algorithm applied to thestudy of archaeological settlement patterning, Journal of ArchaeologicalScience 38:9 (2011) 2293–2300.
[38] D. Graves, The use of predictive modelling to target Neolithic settlementand occupation activity in mainland Scotland, Journal of ArchaeologicalScience 38:3 (2011) 633–656.
[39] A.K. Moysiadis, K. G. Perakis, Probability Modelling of Archaeological Siteswith the Use of Geoinformation, 30th EARSeL Symposium: Remote Sensingfor Science, Education and Culture, May 5-June 3, Paris, France, 2010.
[40] C. Siart, B. Eitel, D. Panagiotopoulos, Investigation of past archaeologicallandscapes using remote sensing and GIS: a multi-method case study fromMount Ida, Crete, Journal of Archaeological Science 35:11 (2008)2918–2926.
[41] S. Vaughn, T. Crawford, A predictive model of archaeological potential:An example from northwestern Belize, Applied Geography 29:4 (2009)542–555.
[42] D. Alexakis, A. Sarris, T. Astaras, K. Albanakis, Detection of Neolithicsettlements in Thessaly (Greece) through multispectral and Hyperspectralsatellite Imagery, Sensors 9:2 (2009) 1167–1187.
[43] E. Simoni, V. Pappas, Method for the exploitation of archaeologicalinformation deriving from the implementation of building permits, 6thHellasGIS “Geographical Information Systems”, Athens, December 2–3,Greece, 2010.
607Modelling Archaeological and Geospatial Information for Burial Site Prediction,Identification and Management

[44] A. L/ uczak, Using predictive modeling methods as a way of examining pastsettlement patterns: an example from southern Poland, Colloquium: Non-destructive approaches to complex archaeological sites in Europe: around up. Ghent University, 15–17/1/2013, Belgium, 2013.
[45] J. De Reu, J. Bourgeois, P. De Smedt, A. Zwertvaegher, M. Antrop, M. Bats,P. De Maeyer, P. Finke, M. Van Meirvenne, J. Verniers, P. Crombé,Measuring the relative topographic position of archaeological sites in thelandscape, a case study on the Bronze Age barrows in northwest Belgium,Journal of Archaeological Science 38:12 (2011) 3435–3446.
[46] D. Löwenborg, Digital Perceptions of the Landscape: A GIS based analysisof the location of burial grounds in Västmanland, Sweden, ActaArchaeologica 81:1 (2010) 124–137.
[47] D. Löwenborg, Landscapes of death: GIS modelling of a dated sequenceof prehistoric cemeteries in Västmanland, Sweden, Antiquity 83:322 (2009)1134–1143.
[48] P. Fisher, C. Farrelly, A. Maddocks, C. Ruggles, Spatial Analysis of VisibleAreas from the Bronze Age Cairns of Mull, Journal of ArchaeologicalScience 24:7 (1997) 581–592.
[49] K. E. Lageras, Visible intentions? Viewshed analysis of Bronze Age burialmounds in western Scania, Sweden, in: C. Scarre (Ed.), Monuments andLandscape in Atlantic Europe. Perception and Society during the Neolithicand Early Bronze Age, Routledge, London/New York, 2002, pp. 179–191.
[50] D. Wheatley, Cumulative Viewshed Analysis: a GIS-based method forinves-tigating intervisibility, and its archaeological application, in: G. Lock,Z. Stancic (Eds.), Archaeology and Geographical Information Systems: AEuropean Perspective, Taylor & Francis, London, 1995, pp. 171–186.
[51] P. E. Woodman, A predictive model for Mesolithic site location on Islayusing logistic regression and GIS, in: S. J. Mithen (Ed.), Hunter-GathererLandscape Archaeology: The Southern Hebrides Mesolithic Project, 1988-98, Archaeological Fieldwork on Colonsay, Computer Modelling,Experimental Archaeology, and Final Interpretations, The McDonaldInstitute for Archaeological Research, Cambridge, 2000, pp. 445–464.
[52] Z. Al-Muheisen, A. Al-Shorman, The Archaeological Site of Bediyeh: theConstructed Landscape, Syria 81 (2004) 177–190.
[53] G. Burns, A. K. Fronabarger, T. G. Whitley, Predictive modeling of culturalresources in the Theban Necropolis, Luxor, Egypt, in: A. Posluschny, K.Lambers, I. Herzog (Eds.), Layers of perception. Proceedings of CAAConference, 35th Annual Meeting, Berlin, Germany 2007, Rudolf HabeltGmbH, Bonn, 2008.
[54] G. L. A. Fry, B. Skar, G. Jerpansen, V. Bakkestuen, L. Erikstad, Locatingarchaeological sites in the landscape: a hierarchical approach based onlandscape indi-cators, Landscape and Urban Planning 67:1-4 (2004)97–107.
[55] D. Löwenborg, Using Geographically Weighted Regression to Predict SiteRepresentativity, in: B. Frischer, J. W. Crawford, D. Koller (Eds), MakingHistory Interactive, Proceedings of CAA Conference, 37th Annual Meeting,Williamsburg, Virginia 2009, Archaeopress, Oxford, 2010, pp. 203–215.
[56] R.J.A. Talbert (Ed.), The Barrington Atlas of the Greek and Roman World,Princeton University Press, New Jersey, 2000.
[57] D. Delikaraoglou, I. Mintourakis, On the Merging of Heterogeneous HeightData from SRTM, ICESat and Survey Control Monuments for EstablishingVertical Control in Greece: An Initial Assessment and Validation, in: S. P.Mertikas (Ed.), Gravity, Geoid and Earth Observation, International
608 Aikaterini Balla, Gerasimos Pavlogeorgatos, Despoina Tsiafakisand George Pavlidis

Association of Geodesy Symposia, Springer Berlin Heidelberg, 2010,pp. 289–294.
[58] C. Hirt, M.S. Filmer, W. E. Featherstone, Comparison and validation of therecent freely available ASTER-GDEM ver1, SRTM ver4. 1 and GEODATADEM-9S ver3 digital elevation models over Australia, Australian Journal ofEarth Sciences 57 (2010) 337–347.
[59] A. Mouratidis, P. Briole, K. Katsambalos, SRTM 3 DEM (versions 1,2,3,4)validation by means of extensive kinematic GPS measurements: a casestudy from North Greece, International Journal of Remote Sensing 31:23(2010) 6205–6222.
[60] M. Lilimbaki-Akamati, K. Troxidis, New Macedonian tomb at LefkadiaImathias, AEMTH 18 (2004), 465–484.
[61] S. G. Miller, The Tomb of Lyson and Kallikles, A painted Macedonian Tomb.Philipp von Zabern, Mainz am Rhein, 1993.
[62] J. Conolly, M. Lake, Geographical Information Systems in Archaeology,Cambridge University Press, Cambridge, 2006.
[63] K.L. Kvamme, Development and testing of quantitative models, in: W.J.Judge, L. Sebastian (Eds.), Quantifying the Present and Predicting the Past:Theory, Method and Application of Archaeological Predictive Modelling,U.S. Department of the Interior, Bureau of Land Management ServiceCenter, Denver, CO, 1988, pp. 325–428.
609Modelling Archaeological and Geospatial Information for Burial Site Prediction,Identification and Management