Modelling and Simulation of the SGT5 – 2000E Gas Turbine ...
20
Journal of Energy Technology and Environment 3(2) 2021 pp. 88-107 88 Modelling and Simulation of the SGT5 – 2000E Gas Turbine Model for Power Generation 1 Egware H.O*, 1 Obanor A.I, 2 Aniekwu A.N, 3 Omoifo O.I and 1 Ighodaro O.O 1 Department of Mechanical Engineering, University of Benin, Benin City, Nigeria 2 Department of Civil Engineering, University of Benin, Benin City, Nigeria 3 Department of Computer Engineering, University of Benin, Benin City, Nigeria *Corresponding Author EmaiL: [email protected], [email protected] Article Info Abstract Keywords: Modelling, Steady State, Gas turbine model, Design, Off-design, Validation In this paper, a steady-state flow modelling and simulation of an SGT5 – 2000E gas turbine model was carried using Ebsilon Professional Software. The design and off-design conditions were considered according to the environmental ambient air temperature. The model results were validated using design and actual operating data by applying the error percentage analysis. The validated results obtained ranged from -3.13% to 0.88% for design condition, while -3.24% to 2.66% for off-design condition. In addition, the model validation results were found to be in good agreement with the actual installed operating data. Thus, the model data obtained can be utilized for further studies such as energy, exergy and environmental analyses. Received 04 May 2021 Revised 24 May 2021 Accepted 28 May 2021 Available online 12 June 2021 https://doi.org/10.37933/nipes.e/3.2.2021.10 https://nipesjournals.org.ng © 2021 NIPES Pub. All rights reserved 1. Introduction The relevance of energy resources is important in almost all parts of the economy because of their necessity. The direct increase in energy and power consumption is a result of the increase in urbanization, population, technological development and number of industries [1,2]. The majority of the power plants in the country are gas turbine power plants because of their low cost, short installation period and abundant availability of natural gas. The gas turbine power plants can operate as a simple open cycle system, a combined cycle system, or combined heat and power system in the power plant generation setup [3,4]. The applications of gas turbine shaft or propulsion power and as cogeneration for industrial, automotive and commercial purposes had become reliable and popular [5-8]. “All gas turbines operate on the thermodynamic cycle known as the Brayton cycle” [9]. Simple gas turbine major components are compressors, combustors, turbines, and generators. It operates continuously by taking in the fresh air from the atmosphere into the compressor. The air is then compressed to high pressure in the compressor and discharged into the combustors. Here the compressed air is mixed with fuel and burnt continuously after ignition to liberate its energy at constant pressure. Then the combustion products with high pressure and temperature flow into the turbine, the burnt gas thermal power is converted to mechanical shaft power in the turbine, which in turn drives the generator shaft. The mechanical shaft power is converted to electrical power by the generator. the flue gases are discharged into the atmosphere at constant pressure after expansion through the turbine to low temperature and pressures.
Transcript of Modelling and Simulation of the SGT5 – 2000E Gas Turbine ...
Journal of Energy Technology and Environment 3(2) 2021 pp. 88-107
88
Modelling and Simulation of the SGT5 – 2000E Gas Turbine Model for Power
Generation
1Egware H.O*, 1Obanor A.I,2 Aniekwu A.N, 3Omoifo O.I and 1Ighodaro O.O 1Department of Mechanical Engineering, University of Benin, Benin City, Nigeria 2Department of Civil Engineering, University of Benin, Benin City, Nigeria 3Department of Computer Engineering, University of Benin, Benin City, Nigeria
*Corresponding Author EmaiL: [email protected], [email protected]
Article Info Abstract
Keywords:
Modelling, Steady State, Gas turbine model, Design, Off-design, Validation
In this paper, a steady-state flow modelling and simulation of an
SGT5 – 2000E gas turbine model was carried using Ebsilon
Professional Software. The design and off-design conditions were
considered according to the environmental ambient air
temperature. The model results were validated using design and
actual operating data by applying the error percentage analysis.
The validated results obtained ranged from -3.13% to 0.88% for
design condition, while -3.24% to 2.66% for off-design condition.
In addition, the model validation results were found to be in good
agreement with the actual installed operating data. Thus, the model
data obtained can be utilized for further studies such as energy,
exergy and environmental analyses.
Received 04 May 2021
Revised 24 May 2021
Accepted 28 May 2021
Available online 12 June 2021
https://doi.org/10.37933/nipes.e/3.2.2021.10
https://nipesjournals.org.ng
© 2021 NIPES Pub. All rights reserved
1. Introduction
The relevance of energy resources is important in almost all parts of the economy because of their
necessity. The direct increase in energy and power consumption is a result of the increase in
urbanization, population, technological development and number of industries [1,2]. The majority
of the power plants in the country are gas turbine power plants because of their low cost, short
installation period and abundant availability of natural gas. The gas turbine power plants can operate
as a simple open cycle system, a combined cycle system, or combined heat and power system in the
power plant generation setup [3,4]. The applications of gas turbine shaft or propulsion power and
as cogeneration for industrial, automotive and commercial purposes had become reliable and
popular [5-8]. “All gas turbines operate on the thermodynamic cycle known as the Brayton cycle”
[9]. Simple gas turbine major components are compressors, combustors, turbines, and generators. It
operates continuously by taking in the fresh air from the atmosphere into the compressor. The air is
then compressed to high pressure in the compressor and discharged into the combustors. Here the
compressed air is mixed with fuel and burnt continuously after ignition to liberate its energy at
constant pressure. Then the combustion products with high pressure and temperature flow into the
turbine, the burnt gas thermal power is converted to mechanical shaft power in the turbine, which
in turn drives the generator shaft. The mechanical shaft power is converted to electrical power by
the generator. the flue gases are discharged into the atmosphere at constant pressure after expansion
through the turbine to low temperature and pressures.
H.O Egware et al. / Journal of Energy Technology and Environment
3(2) 2021 pp. 88-107
89
The performances of all gas turbines are affected by local or ambient air conditions such as
temperature, relative humidity, etc [10,11]. The rated capacities of all combustion turbines are based
on the International Standard Organization (ISO) conditions of an ambient air temperature of 15 0C,
relative humidity of 60% and ambient pressure of 101.325 kPa at sea level. The installed SGT5 –
2000E Power Plant is located in Ihobvor community an area of an average ambient air temperature
of 26 0C, relative humidity of 70%, and ambient pressure of 1.013bar [12]. Ambient air temperature
has a clear impact on the gas turbine power plant because the air mass is inversely proportional to
its ambient air temperature and proportionate to its power produced. So, it is important to study the
effect of ambient air temperature on power output and other output parameters of gas turbine power
plants as reported in Saravanamuttoo et al. [9]. The report also stressed that this is very important
to the customer, at any specific condition, the performance of the power plant must be guaranteed
readily by the manufacturer of the gas turbine. Simon et al. [13] explained in their report that actual
outcomes may differ depending on local site conditions. This makes it necessary to have design and
guarantee performance for gas turbine power plants when the site ambient air temperature differs
from the design ambient air temperature. Most manufacturers of gas turbine power plant models
provide scanty information about the power plant because they are proprietary to them [14,15].
General data provided by them are usually compressor air inlet temperature, exhaust mass flow rate
and temperature, compressor pressure ratio, power out, heat rate and thermal efficiency at ISO
condition. In order to determine the other parameters such as mass flow rates of air and fuel,
compressor discharge temperature and pressure, turbine inlet pressure and temperature. Many
researchers used the thermodynamic model equations, which are sometimes passed through
cumbersome iteration. This led to the use of modelling software, which makes the iteration process
simple. Numerical modelling and simulations are considered as the initial move towards the
underlying idea approval. The gas turbine power plant to be investigated requires a detailed model’s
execution to accurately assess the performances of power plants in ambient temperature variation
and part load function [16,17]. A decent number of modelling tools have been utilized for power
plant simulations and modelling analysis. From various programming software accessible, for
example, APROS, Aspen, Autodynamics, HYSYS, gProms, SIMODIS, PowerSim, MMS, and
ProTRAX; the Ebsilon Professional package has been chosen. This product package considers far-
reaching power plant process cycle usage for steady-state and semi-dynamic simulations and plant
parameters advancement measures. Albeit, physical equations depicting all parts in Ebsilon
Professional programming condition are valid for steady-state estimation thus, it is conceivable to
disregard the dynamic impacts by carrying out the arrangement of reenactments on a little timescale
[18]. It is acknowledged by utilizing a blend of “time Series” and “ebsScript” include at the
programming level to make and simulate such semi-dynamic systems [19].
EBSILON Professional 14 and ASPEN Softwares are alternative simulating programming software.
The first is intended for chemical processes simulation, while the last is ideal to balance mass and
energy in processes of power plants. For power plant analysis which involves energy and mass
balance as in the thermodynamic and environmental analysis of gas turbine power plant, EBSILON
Professional 14 is preferable. EBSILON Professional is one of the utmost utilized energy and mass
balance computation programming in the European Countries that speak the German language [20].
It shows high intermingling solidness, high computation speed, and is adjusted to Microsoft
environments. EBSILON has all the highlights needed for this investigation and speaks to the ideal
apparatus for the study of gas turbines [21]. This part quickly sums up the principal highlights of
this product
OEM-GTLib, created in participation with and dispersed by VTU Energy GmbH, contains countless
gas turbine models. These are changed under genuine performance conduct and depend on
legitimate producer information. Accordingly, one can choose the ideal gas turbine for one's
H.O Egware et al. / Journal of Energy Technology and Environment
3(2) 2021 pp. 88-107
90
capacity plant to study. The library contains gas turbines from Alstom, Siemens, Rolls Royce,
General Electric, Solar Turbines, Centrax, and Hitachi [22].
EBSILON software has been used for various research works in power plant analysis by Miguez
Da Rocha [23] on the study of retrofitted solar-powered Combined Cycle Power Plant; Jaszczur and
Dudek [24] in the thermodynamics investigation of a gas turbine combined cycle incorporation with
a high-temperature nuclear system; Garcia Sanchez – Cervera [25]; Wojcik and Wang [26] in steam
power plant optimization of energy for an effective process of a post-combustion of CO2 capture
plant; and Wallentinen [27] in the analysis of a concentrated solar power gas turbine with thermal
storage. Zyrkowski and Zymelka [28] analyzed the behaviour of 2 225MW coal units by utilizing
EBSILON Professional Software. The model results were validated using test results from the power
plant. Matjanov [29] also used the software in modelling and analysis of the Tashkent CHP
enhancement with an air inlet cooling system. Design data were used to validate their models in
their various researches without considering actual operating varied ambient air temperature. There
are many studies carried out using ebsilon software, but these few were mentioned to ascertain that
Ebsilon software has been previously used for research work. It has been employed as an accurate
tool, precise and powerful tool which support the design, modification, or retrofitting of power plant
for the past twenty years of successful applications and further development [27,30,31].
The SGT5 -2000E gas turbine model has been installed in Ihobvor community, Benin City, Edo
State, Nigeria. The ISO condition parameters provided did not have detailed data that can be used
for further studies. So, to determine these important parameters such as mass flow rates of air and
fuel, compressor discharge temperature and pressure, turbine inlet temperature, thus, this study
presents the modelling and simulation of the SGT5 -2000E gas turbine using EBSILON
Professional. The focus of the study is to obtain these important data which will be validated by
actual operating parameters from the installed power plant.
2. Methodology
The methodology for this study was based on the gas turbine model description, the
thermodynamic equations, modelling and simulation of the SGT5 – 2000E model, validation of
the model developed and simulation analysis.
2.1 Thermodynamic Operational Principle of the SGT5 – 2000E Model Power Plant
The installed SGT5 -2000E gas model Power Plant works on the Brayton cycle. The schematic and
temperature–specific entropy (T – s) diagrams of the installed SGT5 -2000E Power Plant are
illustrated in Figures 1 and 2 respectively. For the initial starting of the power plant, the air
compressor (axial flow type) is initially driven by an electric motor until 60% of the turbine shaft
speed is achieved. The maximum net thermal efficiency of the Azura Edo Power plant operating as
the open simple cycle will always be less than 40% because 60% of the turbine shaft power is used
to drive the air compressor. At the point when the turbine starting structure is activated, the air
intake plenum taking fresh air from the surrounding air, filtered it at state 1 and is compressed in
the 16-stage air compressor. At the 11th stage, the air extraction valve is opened and the variable
IGVs are closed during start-up for pulsation protection. The extraction bleeding valve closes
automatically at 95% speed of the turbine shaft, which allows the compressed air to enter into the
silo combustor annular space at state 2, then enters liners of the combustor. For appropriate
combustion, the compressed air flows into the burning zone through the metering hole in each of
the combustor liners.
Fuel is given to the streamlines, each ending at a fuel nozzle. The fuel is introduced into the burning
chamber by the nozzles at a steady rate depend on the load and speed required by the gas turbine.

H.O Egware et al. / Journal of Energy Technology and Environment
3(2) 2021 pp. 88-107
91
The presented fuel blends in with the compressed air and is exploded utilizing either of the sparkle
plugs. At the moment when the fuel blend is lighted in one burning chamber; fire is spread through
cross-interfacing fire cylinders to all other ignition chambers. At the point when the turbine rotor
approximates the working rate, the pressure of the combustion causes the spark plugs to withdraw
subsequently eliminating their electrode from the hot zone. It is planned for appropriate dilution and
cooling. At state 3, the hot gas flows into a 4-stage turbine after expanding into different progress
pieces joined to the aft end of the chamber liners from the combustor. In every turbine nozzle, the
hot gas kinetic energy is raised as the drop in pressure in each after row of rotating blades. Part of
the burnt gas kinetic energy is transferred into useful work on the rotor of the turbine. The flue
gases, after flowing through the third stage of blades, are coordinated into the fumes hood and
diffuser, which contains a progression of going vanes to divert the gases from axial flow to radial
flow directions with the least fumes hood losses. At state 4 the gases flow into the fumes plenum
and are released with the air through the fumes stack. The turbine uses part of the power generated
to drive the air compressor as earlier mentioned and the rest is obtainable for valuable work at the
gas turbine output flange, which is coupled to a 3000-rpm generator. The generator will convert the
mechanical power to electrical power, which is supplied to the national grid.
Figure 1: A Typical Schematic Diagram of SGT5 – 2000E Model Power Plant
Figure 2: A Typical T- s Diagram of the Installed SGT5 -2000E Power Plant Cycle

H.O Egware et al. / Journal of Energy Technology and Environment
3(2) 2021 pp. 88-107
92
2.2 Thermodynamic Model Equations
The compressor discharged temperature is calculated using Equation (1) and exhaust gas
temperature from the turbine was determined by Equation (2) as provided in Cengel and Boles
[32]and Ehyaei et al. [33]. The pressure ratio was evaluated using Equation (3).
1
2 1
11
pc
c
rT T
− −
= + (1)
4 3 1
11 1
g
g
t
T
p
T T
r
−
= − −
(2)
2
1cp
pr
p=
and
3
4
pt
pr
p=
(3)
Equations (4) to (13) was used to determine the various performance of the gas turbine model were
obtained from Cengel and Boles [32]; Rogers and Mayhew [34]; Eastop and McConkey [35];
Egware and Obanor [36]; Egware et al. [37].
The work done by compressor and turbine was evaluated using Equations (4) and (5) respectively.
( )2 1C a paW m c T T= − (4)
( )3 4T g pgW m c T T= − (5)
The thermal power of the power plant was determined by applying Equations (6) and (7).
themal T CP W W= − (6)
( ) ( )3 4 2 1*thermal g pg a paP m c T T m c T T= − − − (7)
The heat supply by the fuel, gross thermal efficiency, and the heat from flue gas of the gas turbine
was determined using Equations (8) to (10) respectively.
Heat supply, fHS m LHV= (8)
Gross thermal efficiency,
net
f
P
thgr m LHV =
(9)
Flue gas losses

H.O Egware et al. / Journal of Energy Technology and Environment
3(2) 2021 pp. 88-107
93
Flue Gas Heat, ( )4 1flue g pgQ m c T T= − (10)
The electrical power generated, Pnet is expressed in Equation (11)
Pnet = Pthermal – Poss (11)
where Ploss is the total losses for mechanical, generator and auxiliary losses
The net thermal efficiency ( net ) was determined as expressed in Equation (12)
*
netnet
f
P
m LHV =
(12)
The heat rate (HR) of the gas turbine power plant was computed using Equation (13)
3600
net
HR
=
(13)
2.3 Modelling and Simulation of the SGT5 – 2000E Gas Turbine Power Plant
The model of the installed turbine power plant is the siemens SGT5 – 2000E. The nominal
conditions for the Model ISO parameters are presented in Table 1. The power plant model structure
executed in EBSILON Professional programming is shown in Figure 3. The principal model data
are recorded in Table 1.
Table 1: Nominal conditions for ISO SGT5 - 2000E Gas Turbine Power Plant
ISO Design condition
S/N Parameters Design values
1 Power (MW) 166
2 Heat Rate(kJ/kWh) 10375
3 Thermal Efficiency (%) 34.7
4 Turbine Exhaust Temperature (0C) 541
5 Exhaust mass flow rate (kg/s) 525
6 Pressure Ratio (rp) 12
7 Ambient air temperature (0C) 15
8 Ambient air pressure (bar) 1.013
9 Lower Heating Value, LHV (MJ/kg) 45.011
The assumptions made in the modelling the Power plant are as follows:
(i) The simulations are performed at a steady state.
(ii) Neglecting the transient impact caused by start-up and shut down during operation.
(iii) The pressure drops in Ebsilon was considered for each component nominal pressure drops.
The SGT5 – 2000E Turbine model comprises of an air compressor, a combustion chamber, a gas
turbine, and a generator, which was modelled by selecting and connecting the components
mentioned together. The ISO conditions of 1.013bar pressure and 150C temperature for ambient air
were used to establish the design performance outcomes of SGT5 – 2000E Turbine. The values of

H.O Egware et al. / Journal of Energy Technology and Environment
3(2) 2021 pp. 88-107
94
ambient air temperature, pressure, pressure ratio, exhaust mass flow rate and temperature from Table
1 were used to perform the modelling of the ISO SGT5 – 2000E Turbine. The “genera input value”
was utilized to set the nominal mass flow rate and temperature of the flue gas, whereas the pressure
ratio was set in the gas turbine. The isentropic efficiencies of the compressor and turbine used are
90% and 85% respectively. The mechanical and generator efficiency used is 99% and 98.5%
respectively. The composition and LHV of the fuel when inputted accordingly. After inputting all
data and performing the model simulation, the mass flow rates of air and fuel are attained for the
nominal conditions in the gas turbine. This formed the root profile for further simulations of the
model.
Figure 3: Topology of ISO SGT5 – 2000E based on the Fixed Exhaust Data
Then, the values of air and fuel mass flow rates gotten will be used to carry out the simulation again
without the exhaust temperature and mass flow rate. When the initial results for exit conditions are
obtained, the nominal condition for the gas turbine will be achieved. This explanation is illustrated
in Figure 4. This is done to enable the mass flow rate of air and mass flow rate of fuel that enters
the compressor and combustion chamber respectively to determine the gas turbine performance
under partload. This will make it possible to input the new parameters of air for off-design
conditions using the “boundary value input”.
Figure 4: Topology of ISO SGT5 – 2000E
H.O Egware et al. / Journal of Energy Technology and Environment
3(2) 2021 pp. 88-107
95
2.4 The SGT5 – 2000E Gas Turbine in Off-design Modelling
When the gas turbine is operating in the design condition is also referred to as nominal condition or
ISO condition as the case may be or 100% off-design condition. When the power plant operates at
any condition different from nominal specifications is known as off-design condition performance.
The off-design conditions can be experienced when there are changes in ambient air conditions such
as temperature and humidity, or when the power output generated by the turbine is less or more than
the design power output. The Off-design model will be carrying out to change air ambient
temperature and when the loads' performance is different from nominal.
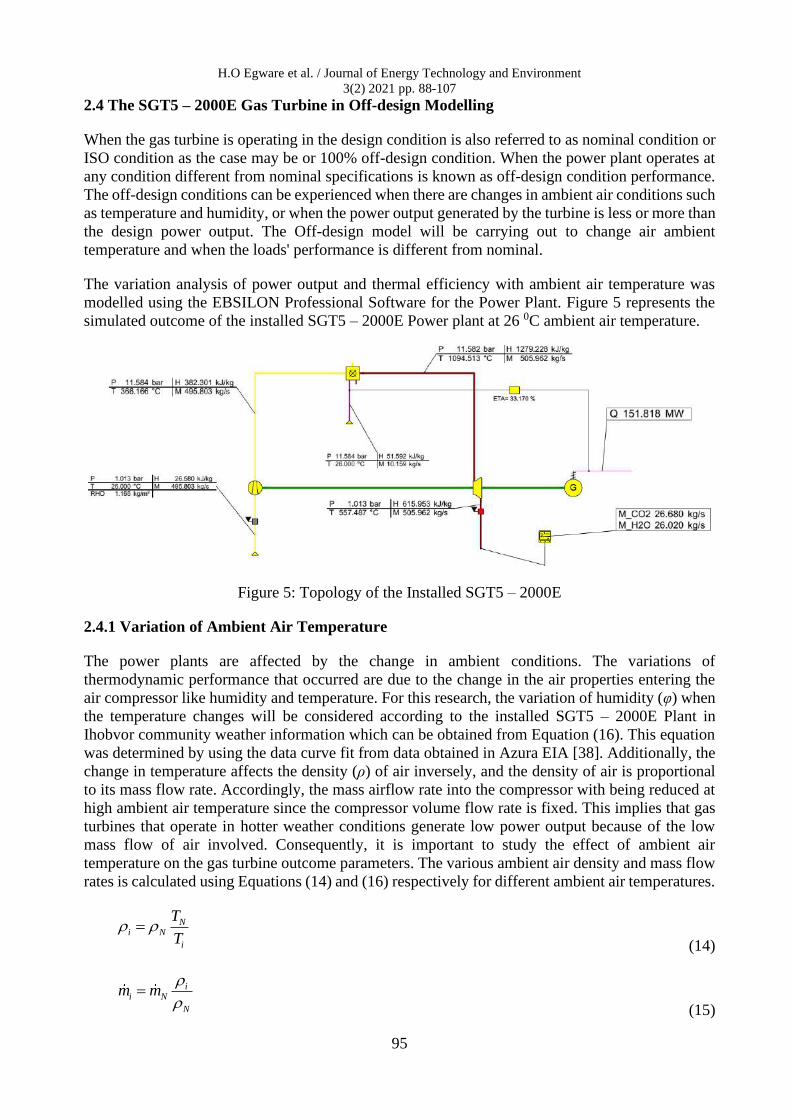
The variation analysis of power output and thermal efficiency with ambient air temperature was
modelled using the EBSILON Professional Software for the Power Plant. Figure 5 represents the
simulated outcome of the installed SGT5 – 2000E Power plant at 26 0C ambient air temperature.
Figure 5: Topology of the Installed SGT5 – 2000E
2.4.1 Variation of Ambient Air Temperature
The power plants are affected by the change in ambient conditions. The variations of
thermodynamic performance that occurred are due to the change in the air properties entering the
air compressor like humidity and temperature. For this research, the variation of humidity (φ) when
the temperature changes will be considered according to the installed SGT5 – 2000E Plant in
Ihobvor community weather information which can be obtained from Equation (16). This equation
was determined by using the data curve fit from data obtained in Azura EIA [38]. Additionally, the
change in temperature affects the density (ρ) of air inversely, and the density of air is proportional
to its mass flow rate. Accordingly, the mass airflow rate into the compressor with being reduced at
high ambient air temperature since the compressor volume flow rate is fixed. This implies that gas
turbines that operate in hotter weather conditions generate low power output because of the low
mass flow of air involved. Consequently, it is important to study the effect of ambient air
temperature on the gas turbine outcome parameters. The various ambient air density and mass flow
rates is calculated using Equations (14) and (16) respectively for different ambient air temperatures.
Ni N
i
T
T =
(14)
ii N
N
m m
=
(15)

H.O Egware et al. / Journal of Energy Technology and Environment
3(2) 2021 pp. 88-107
96
3 2
1 1 10.0408 3.1218 80.238 774.44t t t = − + − + (16)
where TN, ρN, and ṁN are ambient air absolute temperature, density and air mass flow rate at nominal
or design condition respectively; Ti, ρi and ṁi are ambient air absolute temperature, density and air
mass flow rate at off-design conditions respectively; ti and ϕ are ambient air temperature and relative
humidity respectively.
The mass flow rate of fuel was computed by EBSILON software according to the air ratio entered.
In Ebsilon, the parameter that helps to control the maximum temperature obtained from the gas
turbine cycle is represented by “ALAM” and is known as air ratio. For a given amount of fuel, the
ratio of the actual mass of air to the stoichiometric mass of air is defined as the air ratio. When the
air ratio is changed, the combustion chamber will take in less or more fuel. The turbine inlet
temperature of the cycle will also change. If the air ratio is increased more air will be accepted about
close to the stoichiometric air, which will result in the reduction of turbine inlet and exhaust
temperatures. However, the gas turbine inlet and exhaust temperatures will be increased when the
air ratio is reduced.
2.4.2 Variation of Partload
When an amount of power delivered is lower or higher than the nominal power, which is enough
for satisfying the demand, is term as partload operation by the gas turbine. This happens when the
load demand is different from the nominal load. A controller is introduced to take care of the load
adjusting accordingly as needed. The off-design model for the partload variation is shown in Figure
6. Once the correct load is inputted in the controller the air ratio is adjusted accordingly. The amount
of air and fuel flow rates needed to generate the corresponding power is then calculated. Partload
of 40 – 110% of the nominal load condition was considered for this analysis. GT partload is
controlled by using the “GT load level controller” to regulate the exhaust mass flow rate in the GT
combustor and the range 40-110%.was used for the load variation analysis.
Figure 6: Topology of the Installed SGT5 – 2000E for Part Load Analysis
2.5 Variation of Efficiency in Components
The pressure ratio and power output of gas turbine changes during off-design operations. The
compressors and turbine's isentropic efficiencies are also affected. The isentropic efficiencies of the
compressor and turbine vary directly to their mass flow rates. Normally, the designed or defaults
isentropic efficiencies are used for design conditions simulation, while for off-design simulation the
H.O Egware et al. / Journal of Energy Technology and Environment
3(2) 2021 pp. 88-107
97
isentropic efficiencies will now vary according to the actual mass flow rate. Tables 2 and 3 show
the correction curves for the compressor and turbine to take care of the variation between isentropic
efficiencies and mass flow rates. The isentropic efficiency values are denoted by ETAI as shown in
Tables 2 and 3.
Table 2: Variation of Compressor Isentropic Efficiency with Mass flow rate of Air ṁ/ṁN ETAI/ETAIN
0 0 0.4 0.9 1 1
1.2 1.1
Table 3: Variation of Turbine Isentropic Efficiency with Mass flow rate of Exhaust Gas ṁ/ṁN ETAI/ETAIN
0 0.85 0.4 0.9 0.7 0.95 1 1
1.2 1.1
2.6 Validation of the Model
The model built is used for monitoring existing gas turbine power plant performance, the values
obtained was compared with the ISO and installed SGT5 – 2000E data. The Power generated,
exhaust mass flow rate, turbine exhaust temperature, and heat rate was used for ISO condition
validation. The operating data from the operating SGT5 -2000E was used for the line operating
validation for the model. Equation (17) can be utilized to compute the percentage error in the model
[23,27,29, 39-41].
( )Actual data - Model data *100%%ModelError =
Actual data (17)
The actual operating data obtained from the installed SGT5 -2000E power plant are presented in
Table 4.
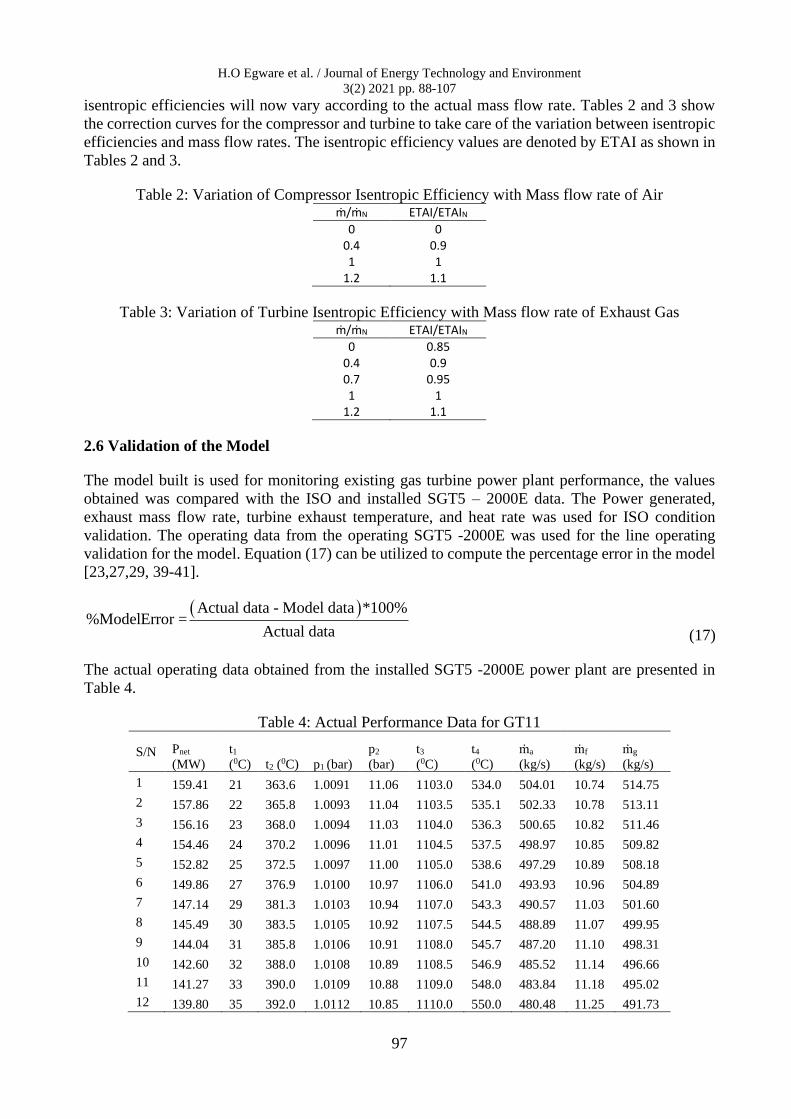
Table 4: Actual Performance Data for GT11
S/N Pnet
(MW)
t1
(0C) t2 (0C) p1 (bar)
p2
(bar)
t3
(0C)
t4
(0C)
ṁa
(kg/s)
ṁf
(kg/s)
ṁg
(kg/s)
1 159.41 21 363.6 1.0091 11.06 1103.0 534.0 504.01 10.74 514.75
2 157.86 22 365.8 1.0093 11.04 1103.5 535.1 502.33 10.78 513.11
3 156.16 23 368.0 1.0094 11.03 1104.0 536.3 500.65 10.82 511.46
4 154.46 24 370.2 1.0096 11.01 1104.5 537.5 498.97 10.85 509.82
5 152.82 25 372.5 1.0097 11.00 1105.0 538.6 497.29 10.89 508.18
6 149.86 27 376.9 1.0100 10.97 1106.0 541.0 493.93 10.96 504.89
7 147.14 29 381.3 1.0103 10.94 1107.0 543.3 490.57 11.03 501.60
8 145.49 30 383.5 1.0105 10.92 1107.5 544.5 488.89 11.07 499.95
9 144.04 31 385.8 1.0106 10.91 1108.0 545.7 487.20 11.10 498.31
10 142.60 32 388.0 1.0108 10.89 1108.5 546.9 485.52 11.14 496.66
11 141.27 33 390.0 1.0109 10.88 1109.0 548.0 483.84 11.18 495.02
12 139.80 35 392.0 1.0112 10.85 1110.0 550.0 480.48 11.25 491.73
H.O Egware et al. / Journal of Energy Technology and Environment
3(2) 2021 pp. 88-107
98
3. Results and Discussion
In this research work, EBSILON Professional 11.4 was used for the modeling and simulation of
SGT5 – 2000E. The validation and analysis results of SGT5 -2000E for design and off-design
conditions are presented in the section.
3.1 Model Validation
The validation results of the SGT5 – 2000E model for both ISO and Azura Edo guarantee conditions
developed in Ebsilon are presented in Table 5. Equation (17) was used to compute the percentage
error or deviation between the design data and model data. This was carried out to ensure that the
model is consistent with the ISO design data, which form the root profile of the model that all other
conditions simulation was done.
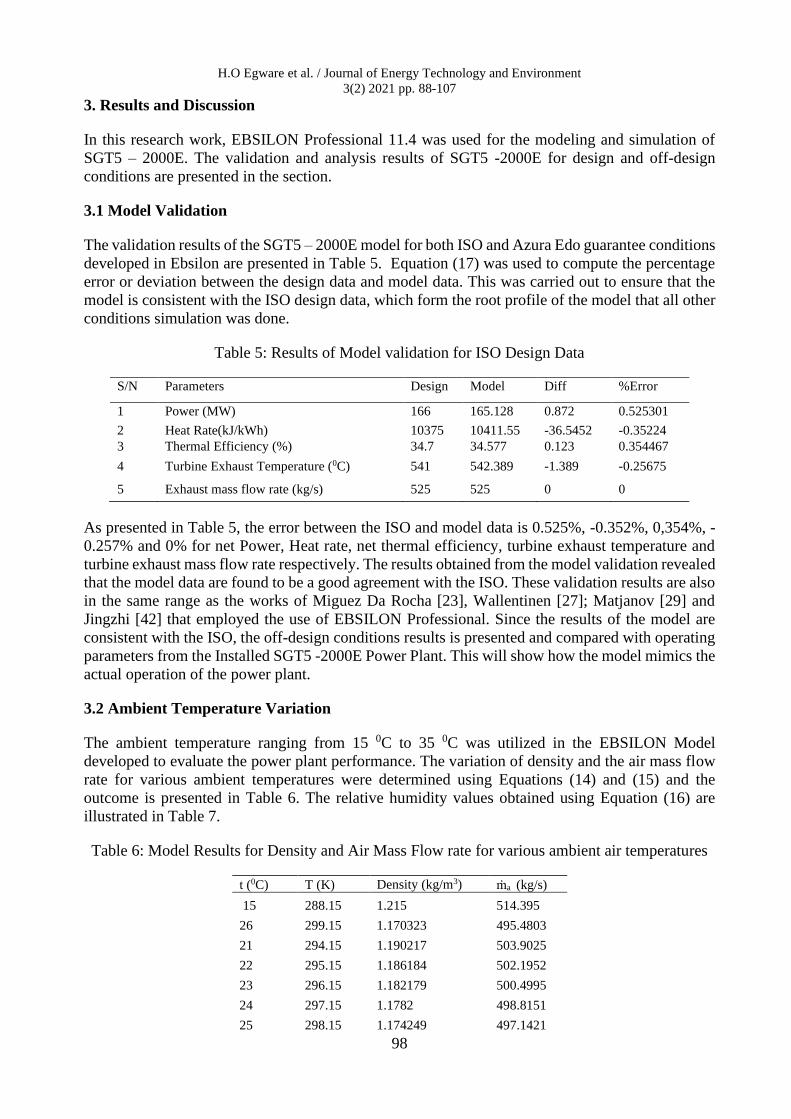
Table 5: Results of Model validation for ISO Design Data
S/N Parameters Design Model Diff %Error
1 Power (MW) 166 165.128 0.872 0.525301
2 Heat Rate(kJ/kWh) 10375 10411.55 -36.5452 -0.35224
3 Thermal Efficiency (%) 34.7 34.577 0.123 0.354467
4 Turbine Exhaust Temperature (0C) 541 542.389 -1.389 -0.25675
5 Exhaust mass flow rate (kg/s) 525 525 0 0
As presented in Table 5, the error between the ISO and model data is 0.525%, -0.352%, 0,354%, -
0.257% and 0% for net Power, Heat rate, net thermal efficiency, turbine exhaust temperature and
turbine exhaust mass flow rate respectively. The results obtained from the model validation revealed
that the model data are found to be a good agreement with the ISO. These validation results are also
in the same range as the works of Miguez Da Rocha [23], Wallentinen [27]; Matjanov [29] and
Jingzhi [42] that employed the use of EBSILON Professional. Since the results of the model are
consistent with the ISO, the off-design conditions results is presented and compared with operating
parameters from the Installed SGT5 -2000E Power Plant. This will show how the model mimics the
actual operation of the power plant.
3.2 Ambient Temperature Variation
The ambient temperature ranging from 15 0C to 35 0C was utilized in the EBSILON Model
developed to evaluate the power plant performance. The variation of density and the air mass flow
rate for various ambient temperatures were determined using Equations (14) and (15) and the
outcome is presented in Table 6. The relative humidity values obtained using Equation (16) are
illustrated in Table 7.
Table 6: Model Results for Density and Air Mass Flow rate for various ambient air temperatures
t (0C) T (K) Density (kg/m3) ṁa (kg/s)
15 288.15 1.215 514.395
26 299.15 1.170323 495.4803
21 294.15 1.190217 503.9025
22 295.15 1.186184 502.1952
23 296.15 1.182179 500.4995
24 297.15 1.1782 498.8151
25 298.15 1.174249 497.1421
H.O Egware et al. / Journal of Energy Technology and Environment
3(2) 2021 pp. 88-107
99
26 299.15 1.170323 495.4803
27 300.15 1.166424 493.8295
28 301.15 1.162551 492.1897
29 302.15 1.158703 490.5607
30 303.15 1.154881 488.9425
31 304.15 1.151084 487.3349
32 305.15 1.147312 485.7379
33 306.15 1.143564 484.1513
34 307.15 1.139841 482.575
35 308.15 1.136142 481.009
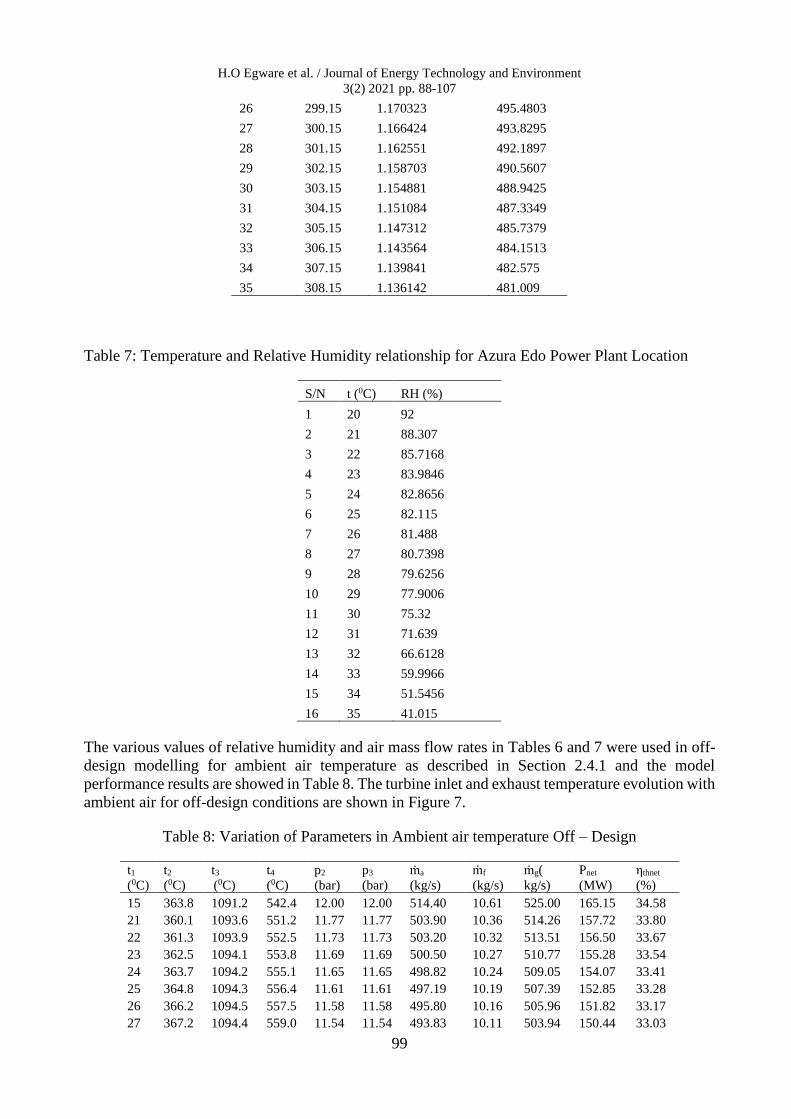
Table 7: Temperature and Relative Humidity relationship for Azura Edo Power Plant Location
S/N t (0C) RH (%)
1 20 92
2 21 88.307
3 22 85.7168
4 23 83.9846
5 24 82.8656
6 25 82.115
7 26 81.488
8 27 80.7398
9 28 79.6256
10 29 77.9006
11 30 75.32
12 31 71.639
13 32 66.6128
14 33 59.9966
15 34 51.5456
16 35 41.015
The various values of relative humidity and air mass flow rates in Tables 6 and 7 were used in off-
design modelling for ambient air temperature as described in Section 2.4.1 and the model
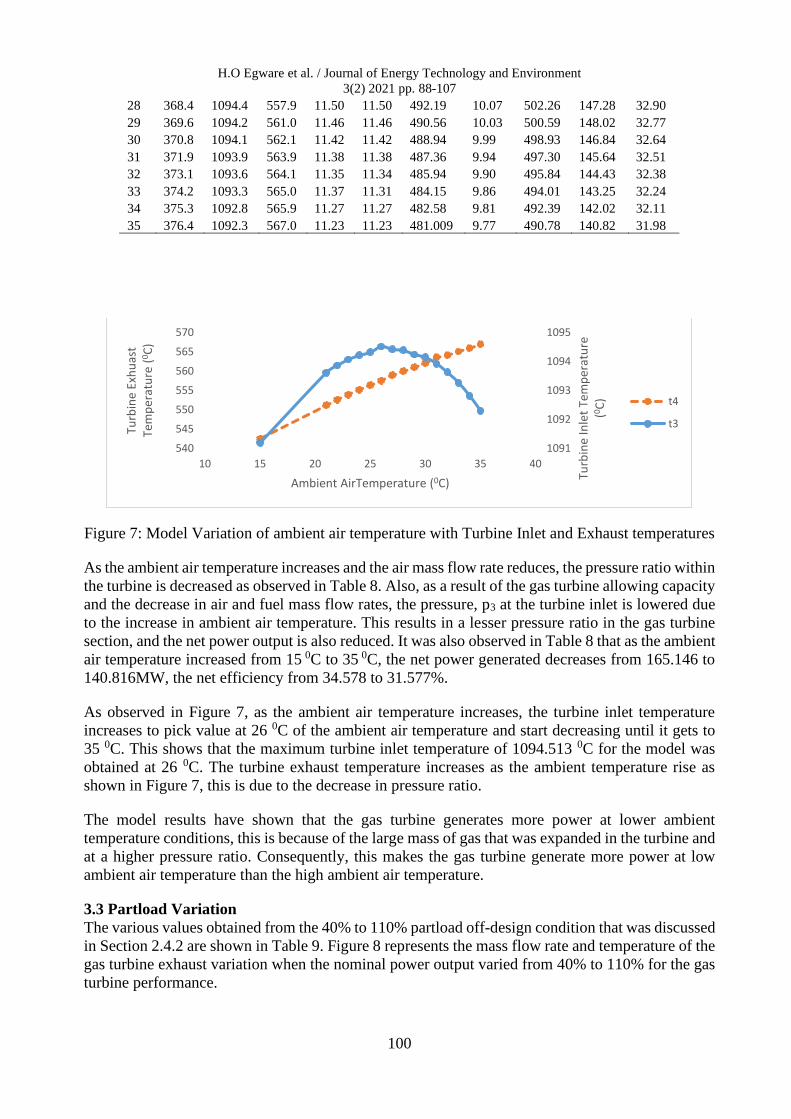
performance results are showed in Table 8. The turbine inlet and exhaust temperature evolution with
ambient air for off-design conditions are shown in Figure 7.
Table 8: Variation of Parameters in Ambient air temperature Off – Design
t1
(0C)
t2
(0C)
t3
(0C)
t4
(0C)
p2
(bar)
p3
(bar)
ṁa
(kg/s)
ṁf
(kg/s)
ṁg(
kg/s)
Pnet
(MW)
ηthnet
(%)
15 363.8 1091.2 542.4 12.00 12.00 514.40 10.61 525.00 165.15 34.58
21 360.1 1093.6 551.2 11.77 11.77 503.90 10.36 514.26 157.72 33.80
22 361.3 1093.9 552.5 11.73 11.73 503.20 10.32 513.51 156.50 33.67
23 362.5 1094.1 553.8 11.69 11.69 500.50 10.27 510.77 155.28 33.54
24 363.7 1094.2 555.1 11.65 11.65 498.82 10.24 509.05 154.07 33.41
25 364.8 1094.3 556.4 11.61 11.61 497.19 10.19 507.39 152.85 33.28
26 366.2 1094.5 557.5 11.58 11.58 495.80 10.16 505.96 151.82 33.17
27 367.2 1094.4 559.0 11.54 11.54 493.83 10.11 503.94 150.44 33.03
H.O Egware et al. / Journal of Energy Technology and Environment
3(2) 2021 pp. 88-107
100
28 368.4 1094.4 557.9 11.50 11.50 492.19 10.07 502.26 147.28 32.90
29 369.6 1094.2 561.0 11.46 11.46 490.56 10.03 500.59 148.02 32.77
30 370.8 1094.1 562.1 11.42 11.42 488.94 9.99 498.93 146.84 32.64
31 371.9 1093.9 563.9 11.38 11.38 487.36 9.94 497.30 145.64 32.51
32 373.1 1093.6 564.1 11.35 11.34 485.94 9.90 495.84 144.43 32.38
33 374.2 1093.3 565.0 11.37 11.31 484.15 9.86 494.01 143.25 32.24
34 375.3 1092.8 565.9 11.27 11.27 482.58 9.81 492.39 142.02 32.11
35 376.4 1092.3 567.0 11.23 11.23 481.009 9.77 490.78 140.82 31.98
Figure 7: Model Variation of ambient air temperature with Turbine Inlet and Exhaust temperatures
As the ambient air temperature increases and the air mass flow rate reduces, the pressure ratio within
the turbine is decreased as observed in Table 8. Also, as a result of the gas turbine allowing capacity
and the decrease in air and fuel mass flow rates, the pressure, p3 at the turbine inlet is lowered due
to the increase in ambient air temperature. This results in a lesser pressure ratio in the gas turbine
section, and the net power output is also reduced. It was also observed in Table 8 that as the ambient
air temperature increased from 15 0C to 35 0C, the net power generated decreases from 165.146 to
140.816MW, the net efficiency from 34.578 to 31.577%.
As observed in Figure 7, as the ambient air temperature increases, the turbine inlet temperature
increases to pick value at 26 0C of the ambient air temperature and start decreasing until it gets to
35 0C. This shows that the maximum turbine inlet temperature of 1094.513 0C for the model was
obtained at 26 0C. The turbine exhaust temperature increases as the ambient temperature rise as
shown in Figure 7, this is due to the decrease in pressure ratio.
The model results have shown that the gas turbine generates more power at lower ambient
temperature conditions, this is because of the large mass of gas that was expanded in the turbine and
at a higher pressure ratio. Consequently, this makes the gas turbine generate more power at low
ambient air temperature than the high ambient air temperature.
3.3 Partload Variation
The various values obtained from the 40% to 110% partload off-design condition that was discussed
in Section 2.4.2 are shown in Table 9. Figure 8 represents the mass flow rate and temperature of the
gas turbine exhaust variation when the nominal power output varied from 40% to 110% for the gas
turbine performance.
1091
1092
1093
1094
1095
540
545
550
555
560
565
570
10 15 20 25 30 35 40
Turb
ine
Inle
t Te
mp
erat
ure
(0 C
)
Turb
ine
Exh
uas
t Te
mp
erat
ure
(0 C
)
Ambient AirTemperature (0C)
t4
t3
H.O Egware et al. / Journal of Energy Technology and Environment
3(2) 2021 pp. 88-107
101
Table 9: Model Results for Partload Variation off – Design
S/N
Part
Load
(%)
ṁa
(kg/s)
ṁf
(kg/s)
ṁg
(kg/s) λ t4 (0 C) t3 (0 C)
p3
(bar)
ηth
(%)
Pnet
(MW)
p2
(bar) rpc rpt
1 110 495.4 11.1 506.4 2.86 593.68 1152.13 11.83 33.736 168.3 11.84 11.68 11.68
2 100 496.3 10.2 506.5 3.1 558.52 1095.49 11.60 33.182 153 11.60 11.45 11.45
3 90 494.8 9.4 504.3 3.36 526.38 1041.90 11.32 32.462 137.7 11.32 11.17 11.17
4 80 496.2 8.6 504.8 3.7 489.37 981.76 11.07 31.689 122.4 11.07 10.93 10.93
5 70 496.3 7.7 504.1 4.1 453.39 922.58 10.80 30.719 107.1 10.80 10.66 10.66
6 60 496.6 6.9 503.5 4.6 416.42 861.72 10.51 29.521 91.8 10.51 10.38 10.37
7 50 496.2 6.1 502.3 5.23 379.30 799.77 10.20 27.251 76.5 10.20 10.07 10.06
8 40 495.2 5.2 500.5 6.06 341.41 736.01 9.86 26.1 61.2 9.86 9.73 9.73
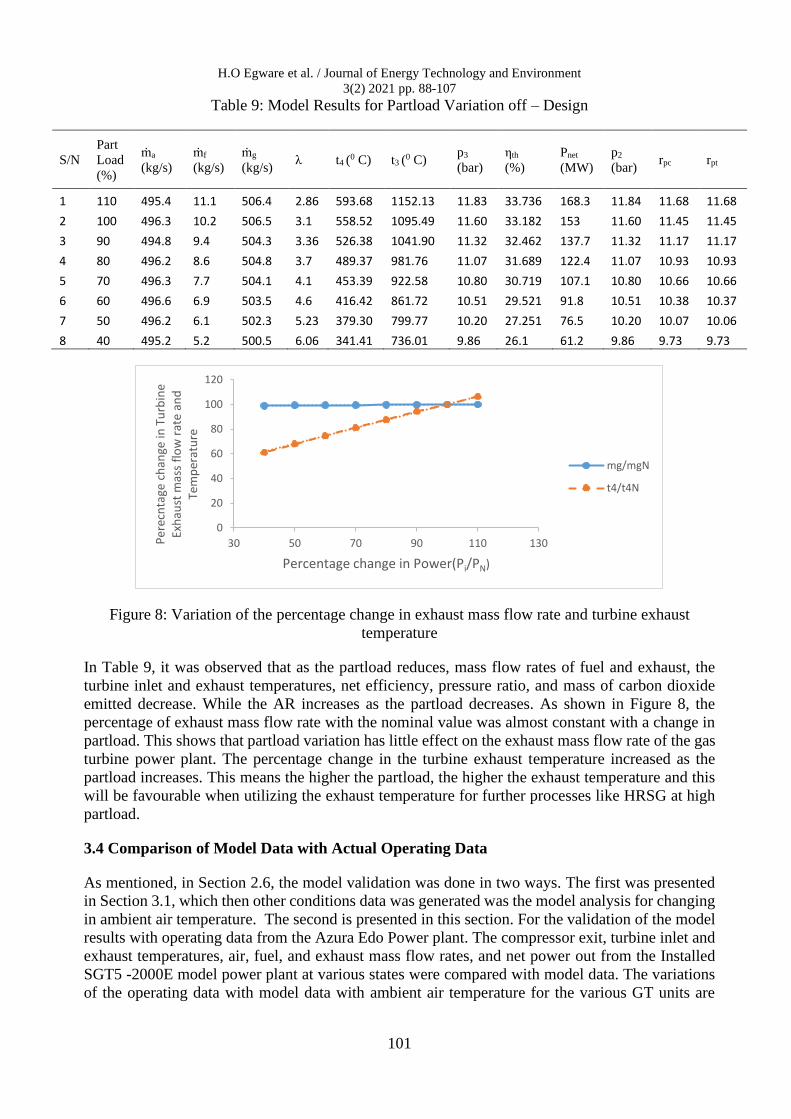
Figure 8: Variation of the percentage change in exhaust mass flow rate and turbine exhaust
temperature
In Table 9, it was observed that as the partload reduces, mass flow rates of fuel and exhaust, the
turbine inlet and exhaust temperatures, net efficiency, pressure ratio, and mass of carbon dioxide
emitted decrease. While the AR increases as the partload decreases. As shown in Figure 8, the
percentage of exhaust mass flow rate with the nominal value was almost constant with a change in
partload. This shows that partload variation has little effect on the exhaust mass flow rate of the gas
turbine power plant. The percentage change in the turbine exhaust temperature increased as the
partload increases. This means the higher the partload, the higher the exhaust temperature and this
will be favourable when utilizing the exhaust temperature for further processes like HRSG at high
partload.
3.4 Comparison of Model Data with Actual Operating Data
As mentioned, in Section 2.6, the model validation was done in two ways. The first was presented
in Section 3.1, which then other conditions data was generated was the model analysis for changing
in ambient air temperature. The second is presented in this section. For the validation of the model
results with operating data from the Azura Edo Power plant. The compressor exit, turbine inlet and
exhaust temperatures, air, fuel, and exhaust mass flow rates, and net power out from the Installed
SGT5 -2000E model power plant at various states were compared with model data. The variations
of the operating data with model data with ambient air temperature for the various GT units are
0
20
40
60
80
100
120
30 50 70 90 110 130Per
ecn
tage
ch
ange
in T
urb
ine
Exh
aust
mas
s fl
ow
rat
e an
d
Tem
per
atu
re
Percentage change in Power(Pi/PN)
mg/mgN
t4/t4N

H.O Egware et al. / Journal of Energy Technology and Environment
3(2) 2021 pp. 88-107
102
presented in Figures 9 to 15. The summary of the resulted errors between model data and operating
data for various parameters and GT units is presented in Table 10.
Figure 9: Model Validation for variation in compressor exit temperature with ambient air
temperature for the GT
Figure 10: Model Validation for variation in turbine inlet temperature with ambient air
temperature
Figure 11: Model Validation for variation in turbine Exhaust temperature with ambient air
temperature
150
200
250
300
350
400
450
20 22 24 26 28 30 32 34 36
Co
mp
ress
or
Exit
Tem
per
atu
re
(oC
)
Ambient Air Temperarure (0C)
t2 Actual t2 Model
900
950
1000
1050
1100
1150
20 22 24 26 28 30 32 34 36Turb
ine
Inle
t Te
mp
erat
ure
(0
C)
Ambient Air Temperarure (0C)
Actual Model
300
350
400
450
500
550
600
20 22 24 26 28 30 32 34
Turb
ine
Exit
Tem
per
atu
re (
0C
)
Ambient Air Temperature (0C)
Actual Model

H.O Egware et al. / Journal of Energy Technology and Environment
3(2) 2021 pp. 88-107
103
Figure 12: Model Validation for variation in air mass flow rate with ambient air temperature
Figure 13: Model Validation for variation in fuel mass flow rate with ambient air temperature
Figure 14: Model Validation for variation in exhaust mass flow rate with ambient air temperature
475
480
485
490
495
500
505
510
20 22 24 26 28 30 32 34 36
Air
Maa
a Fl
ow
rat
e(kg
/s)
Ambient Air Temperature (0C)
GT11ma Actual Model
1
3
5
7
9
11
13
20 22 24 26 28 30 32 34 36
Fuel
Mas
s Fl
ow
Rat
e (k
g/s)
Ambient Air Temperature (0C)
Actual Model
485
490
495
500
505
510
515
520
20 22 24 26 28 30 32 34 36
Exh
aust
Mas
s Fl
ow
Rat
e (k
g/s)
Ambient Air Temperature (0C)
Actual Model

H.O Egware et al. / Journal of Energy Technology and Environment
3(2) 2021 pp. 88-107
104
Figure 15: Model Validation for variation in net Power out with ambient air temperature
Table 10: Model Validation Results Using Operating Data
S/N t2 (%) t3(%) t4(%) ma(%) mf(%) mg(%) Pnet(%)
1 0.96 0.85 -3.22 0.02 3.58 0.10 1.06
2 1.23 0.87 -3.25 -0.17 4.29 -0.08 0.86
3 1.50 0.90 -3.27 0.03 5.03 0.14 0.56
4 1.78 0.93 -3.29 0.03 5.69 0.15 0.26
5 2.05 0.97 -3.30 0.02 6.37 0.16 -0.02
6 2.57 1.05 -3.33 0.02 7.75 0.19 -0.39
7 3.08 1.15 -3.25 0.00 9.11 0.20 -0.60
8 3.33 1.21 -3.23 -0.01 9.78 0.21 -0.93
9 3.59 1.27 -3.34 -0.03 10.46 0.20 -1.11
10 3.84 1.34 -3.15 -0.09 11.13 0.17 -1.29
11 4.05 1.42 -3.11 -0.06 11.80 0.20 -1.40
12 3.98 1.60 -3.09 -0.11 13.14 0.19 -0.73
AVG 2.66 1.13 -3.24 -0.03 8.18 0.15 -0.31
In Figures 9 to 15, it was observed that the model values for compressor exit, turbine inlet and
exhaust temperatures were close to the actual operating data, which both results increased linearly
as ambient air temperature increases for the turbine unit. The slightly different notice was as a result
of differences in pressure ratio observed for the model and actual data as shown in Tables 4 and 8.
The model and operating values for air and exhaust flow rates decrease with an increase in ambient
air temperature and slight differences between were observed as shown in Figures 12 and 14 in the
gas turbine power plant. The comparison between the model and operating values for fuel flow rate
as shown in Figure 13 revealed that model data decreases slightly while the operating data increases
as ambient air temperature increases. The high mass flow rate of fuel in the operating data could be
attributed to the fact that the power plant needed more fuel to meet up power generated at a low-
pressure ratio value compared to the corresponding model value with a higher-pressure ratio. As
shown in Figure 15, both the model and operating data for net power output decrease as ambient air
temperature increases. It was observed that much difference was not noticed between the model data
and operating data. This also shows that the mass flow rate of fuel plays an important role in power
generation, which resulted from the increased fuel mass flow rate to reduce the effect of the low-
pressure ratio observed in the operating data.
135
140
145
150
155
160
165
20 22 24 26 28 30 32 34 36
Net
Po
wer
Ou
tpu
t (M
W)
Ambient Air Temperature (0C)
Actual Model

H.O Egware et al. / Journal of Energy Technology and Environment
3(2) 2021 pp. 88-107
105
Table 10 reports the validation results showing that the average error between the model and
operating values for compressor exit, turbine inlet and exhaust temperatures, air, fuel and exhaust
flow rates and net power is 2.66, 1.13, -3.24, -0.03, 8.18, 0.15 and -0.31 respectively for the GT
unit. The moderate deviations observed in turbine inlet and exhaust temperatures, mass flow rates
of fuel, and net power generated are indications of the difference in pressure ratios between the
model and actual data. Also, it indicates some additional uncertainty in the modelling of the SGT5
– 2000E gas turbine on the same principle. The validation results are in good agreement with the
results obtained from Miguez Da Rocha [23] and Wallentinen [27] that used the same software for
their study. Therefore, the data obtained from the model validation show that the developed model
is adequate and consistent. Thus, its results can be used for further studies in the thermodynamic
evaluation of the SGT5 – 2000E gas turbine model power plant.
4. Conclusion
The modelling and simulation of the SGT5 – 2000E gas turbine model were carried out utilizing
EBSILON professional software. The modelling was done for design and off-design conditions to
provide parameters that were normally not given by manufacturers of gas turbine models. The results
of model validation obtained were in good agreement with actual operating data. Also, the data
obtained will be useful in thermodynamic and environmental analyses of the installed gas turbine
model.
Acknowledgment
The authors would like to acknowledge the support of Azura Edo Power Plant staff for their
cooperation. The authors also wish to appreciate the financial support from Nigerian Bulk Electricity
Trade (NBET) during this research work.
Nomenclature ASHRAE American Society of Heating, Refrigeration and Air Conditioning Engineers
C Compressor
CC Combustion chamber
CIT Compressor Inlet Temperature (0C, K)
cp Specific heat capacity at constant pressure (kJ/kg K)
GE General Electric
GT Gas turbine unit
HR Heat rate (kJ/kWh)
IPP Independent Power Producer
ISO International Standard Organization
LHV Lower heating value (kJ/kg)
ṁ Mass flow rate (kg/s)
NBET Nigerian Bulk Electricity Trading PLC
P Pressure (bar)
P Power (MW)
Q Heat supply/removal rate (MW)
rp Compressor Pressure ratio
T Absolute temperature ( K)
t Temperature (0C)
TIT Turbine Inlet Temperature (0C, K)
W Work done (MW)
W.R Work ratio
Greek Symbols
Relative Humidity
ɳc Compressor isentropic efficiency
ɳcc Combustion efficiency
ɳgen Generator efficiency

H.O Egware et al. / Journal of Energy Technology and Environment
3(2) 2021 pp. 88-107
106
ɳnet Net Thermal Efficiency
ɳo Overall Thermal Efficiency
ɳoc overall combined cycle efficiency
ɳT Turbine isentropic efficiency
ɳthermal Thermal efficiency
ɳthgr Gross thermal efficiency
ϒ Specific heat capacities ratio
Ρ Density (kg/m3)
Subscripts
a Air
AC Air compressor
Amb Ambient
CC Combustion chamber
f Fuel
G Exhaust gas
GT Gas turbine
T Turbine
References
[1]. Li, K., and Lin, B. (2015), Impacts of urbanization and industrialization on energy consumption/CO2 emissions:
does the level of development matter, Renewable and Sustainable Energy Reviews, 52, 1107-1122.
[2]. Shahbaz, M., Loganathan, N., Sbia, R., and Afza, T. (2015). The effect of urbanization, affluence and trade openness
on energy consumption: A time series analysis in Malaysia. Renewable and Sustainable Energy Reviews, 47, pp
683-693.
[3]. Kaviri, A. G., Jaafar, M. N. M., Lazim, T. M., and Barzegaravval, H. (2013). Exergoenvironmental optimization of
heat recovery steam generators in combined cycle power plant through energy and exergy analysis. Energy
Conversion and Management, 67, pp 27-33.
[4]. Vélez, F., Segovia, J. J., Martín, M. C., Antolín, G., Chejne, F., and Quijano, A. (2012). A technical, economical
and market review of organic Rankine cycles for the conversion of low-grade heat for power generation.
Renewable and Sustainable Energy Reviews, 16(6), pp 4175-4189.
[5]. Ahmadi M.H, Ahmadi M.A, Pourfayaz F, Hosseinzade H, Acıkkalp E, Tlili I, Feidt M, (2016), Designing a powered
combined otto and stirling cycle power plant through multi-objective optimization approach, Renew. Sustain.
Energy Rev. 62: pp 585 -595.
[6]. Tlili I (2015), Renewable energy in Saudi Arabia: current status and future potentials, Environ. Dev. Sustain. 17
(4), pp 859–886.
[7]. Tlili, I., and S. A. Musmar. (2013), Thermodynamic Evaluation of a Second Order Simulation for Yoke Ross Stirling
Engine. Energy Conversion and Management 68: pp 149–160. doi: 10.1016/j.enconman.2013.01.005
[8]. Colonna, P., Casati, E., Trapp, C., Mathijssen, T., Larjola, J., Turunen-Saaresti, T., and Uusitalo, A. (2015). Organic
Rankine cycle power systems: from the concept to current technology, applications, and an outlook to the future.
Journal of Engineering for Gas Turbines and Power, 137(10).
[9]. Saravanamuttoo H, Roger GFC, Cohen H, Straznicky PV (2009) Gas Turbine Theory, 6th edition, Pearson
Education Ltd, England.
[10]. ASHARE (2008), 2008 Handbook HVAC systems and Equipment, S.I. Edition. Chapter 17.
[11]. Egware, H.O., Onochie, U.P. and Itoje, H., (2020). Effect of incorporating fogging inlet air cooling system: a case
study of Ihovbor Thermal Power Plant, Benin City. International Journal of Ambient Energy, pp.1-7. https://doi.org/10.1080/01430750.2020.1722231
[12]. Egware H.O (2021), Thermodynamic and Environmental Modelling of Azura Edo Power Plant, PhD Seminar
Presentation, Department of Mechanical Engineering, University of Benin, Benin City, Nigeria.
[13]. Simon K., Christopher S. and Martin S. (2013), Successful Power Limit Increase of SGT5 – 2000E, Gas Turbine
on the Basis of Si3D Blading, Russia Power 2013, Moscow Russia. www.siemens.com/energy accessed on
10/10/2018.
[14]. Gülen, S.C. (2015), June. Étude on Gas Turbine Combined Cycle Power Plant: Next 20 Years. In Turbo Expo:
Power for Land, Sea, and Air (Vol. 56673, p. V003T08A003). American Society of Mechanical Engineers.
[15]. Obanor, A.I., Unuareokpa, O.J. and Egware, H.O. (2015). An Algorithm for the Design of an Axial Flow
Compressor of a Power Generation Gas Turbine. Nigerian Journal of Technology, 34(2), pp.314-324.
[16]. Najjar, Y.S., Alalul, O.F. and Abu‐Shamleh, A. (2020). Degradation analysis of a heavy‐duty gas turbine engine
under full and part load conditions. International Journal of Energy Research, 44(6), pp.4529-4542.

H.O Egware et al. / Journal of Energy Technology and Environment
3(2) 2021 pp. 88-107
107
[17]. Hübel, M., Meinke, S., Andrén, M.T., Wedding, C., Nocke, J., Gierow, C., Hassel, E. and Funkquist, J. (2017).
Modelling and simulation of a coal-fired power plant for start-up optimisation. Applied Energy, 208, pp.319-331.
[18]. Dahash, A., Mieck, S., Ochs, F. and Krautz, H.J. (2019). A comparative study of two simulation tools for the
technical feasibility in terms of modeling district heating systems: An optimization case study. Simulation
Modelling Practice and Theory, 91, pp.48-68.
[19]. Öztürk, B. and Akyüz, A.O. (2020). Realistic Lighting for Interactive Applications Using Semi-Dynamic Light
Maps. The Computer Games Journal, 9(4), pp.421-452.
[20]. Gülen, S.C. (2019). Gas turbines for electric power generation. Cambridge University Press.
[21]. Igie, U., Abbondanza, M., Szymański, A. and Nikolaidis, T. (2020). Impact of compressed air energy storage
demands on gas turbine performance. Proceedings of the Institution of Mechanical Engineers, Part A: Journal of
Power and Energy, p.0957650920906273.
[22]. Steag (2014). EBSILON®Professional 11.4, Release 11.
[23]. Miguez Da Rocha A. (2010), Analysis on Solar Retrofit in Combined Cycle Power Plants, Master Thesis, - Institut
fur Energietechnik und Thermodynamik, Technische Universit¨ at Wien Fakult¨ at fur Maschinenwesen und
Betriebswissenschaften von , Madrid Spain.
[24]. Jaszczur M.and Dudek M. (2019), Thermodynamic analysis of a gas turbine combined cycle integration with a
high temperature nuclear reactor, E3S Web of Conferences 113, SUPEHR19 Volume 1 pp 1- 6.
https://doi.org/10.1051/e3sconf/201911302019
[25]. Garcia Sanchez-Cervera I. (2010), Energetic Optimization of a Steam Cycle Power Plant for an Efficient Operation
of a Post-combustion CO2 Capture Plant, Master Thesis, E 302 - Institut fur Energietechnik und Thermodynamik,
Technische Universit¨ at Wien Fakult¨ at fur Maschinenwesen und Betriebswissenschaften von , Madrid Spain.
[26]. Wojcik J. D. and Wang J. (2018), Feasibility study of Combined Cycle Gas Turbine (CCGT) power plant
integration with Adiabatic Compressed Air Energy Storage (ACAES). Applied Energy, 221 . pp. 477-489.
doi:10.1016/j.apenergy.2018.03.089
[27]. Wallentinen B.S (2016), Concentrated Solar Power Gas Turbine Hybrid with Thermal Storage, Master Thesis in
Mechanical Engineering, Department of Energy and Process Engineering Norwegian University of Science and
Technology.
[28]. Zyrkowski M and Zymelka P (2019), Modelling of Flexible Boiler Operation in Coal Fired Power Plant, Earth
and Environmental Science 214: 012074. Pp 1-7.
[29]. Matjanov E. (2020), Gas turbine efficiency enhancement using absorption chiller. Case study for Tashkent CHP,
Energy 192 pp 116625.
[30]. Olausson, M. (2017). Thermodynamic and Economic Evaluation of a 1000MWth Chemical Looping Combustion
Power Plant (Master's thesis). Chalmers University of Technology Goteborg, Sweden.
[31]. Gacitua, L., Gallegos, P., Henriquez-Auba, R., Lorca, A., Negrete-Pincetic, M., Olivares, D., Valenzuela, A. and
Wenzel, G., (2018). A comprehensive review on expansion planning: Models and tools for energy policy analysis.
Renewable and Sustainable Energy Reviews, 98, pp.346-360.
[32]. Cengel Y.A and Boles, M.A (2010), Thermodynamics an Engineering Approach. 7th Edn: Mc Graw-Hill, New
York, pp: 1024.
[33]. Ehyaei, M. A., Mozafari, A., & Alibiglou, M. H. (2011). Exergy, economic & environmental (3E) analyses of inlet
fogging for gas turbine power plant. Energy, 36(12), 6851-6861.
[34]. Rogers GFC and Mayhew YR (1992), Engineering Thermodynamics, Work and Heat Transfer, 4 th Edition,
Pearson Education Ltd, Britain
[35]. Eastop T.D and McConkey A (2011), Applied Thermodynamics for Engineering Technologists, 5th ed. (8th
Impression), Dorling Kindersley, New Delhi, India.
[36]. Egware H.O and Obanor A.I (2013), Energy Analysis of Omotosho Phase I Gas Thermal Power Plant, International
Journal of Engineering Technology Sciences (IJETS) 1 (4): 206 – 207.
[37]. Egware H, Obanor AI and Itoje H. (2014), Thermodynamic Evaluation of a 42MWGas Turbine Power Plant.
InternationalJournal of Engineering Research in Africa 12: 83 – 94.
[38]. Azura EIA (2013), Azura Edo Independent Power Project Environmental Impact Assessment Vol. 1: Final Report
January 2013, Prepared by Environmental Resources Management. www.erm.com.
[39]. Amjady A. Keynia F and Zareipour H (2011), Short Term wind Power Forecasting Using Ridgetel Neural
Network. Electrical Power Systems Research, Vol. 81, pp 581 – 595.
[40]. Azim H and Farshid K (2017), Different Techniques for Prediction of Wind Power Generation, In: Renewable
Energy Systems, Edited by Sandip A. Kale, Chapter 5, pp 85 – 99, Nova Science Publisher Inc.
[41]. Abbaspour H, Ehyaei M.A., Ahmadi A., Panahi M., Abdalisousan A., Mirzohosseini A. (2021), Energy, exergy,
economic, exergoenvironmental and environmental (5E) analyses of the cogeneration plant to produce electrical
power and urea, Energy Conversion and Management 235: 113951.
https://doi.org/10.1016/j.enconman.2021.113951.
[42]. Jingzhi, D.I.N.G. (2014). Modeling for a 700 MW heat and power plant using EBSILON software. Huadian
Technology, p.03.