Modeling the Impact of Sustainable Intensification on Landscapes and Livelihoods using System...
15
Modeling the Impact of Sustainable Intensification on Landscapes and Livelihoods using System Dynamics Laura Schmitt Olabisi Robert B. Richardson Kurt Waldman Naomi Sakana, Phil Grabowski
-
Upload
africa-rising -
Category
Technology
-
view
94 -
download
1
Transcript of Modeling the Impact of Sustainable Intensification on Landscapes and Livelihoods using System...

Modeling the Impact of Sustainable
Intensification on Landscapes and
Livelihoods using System Dynamics
Laura Schmitt Olabisi
Robert B. Richardson
Kurt Waldman
Naomi Sakana, Phil Grabowski

Project Aim
Provide an evidence base for the linkages between field- and farm-scale sustainable agricultural intensification interventions and climate change mitigation and biodiversity conservation in Zambia (focus on Eastern & Lusaka Provinces)
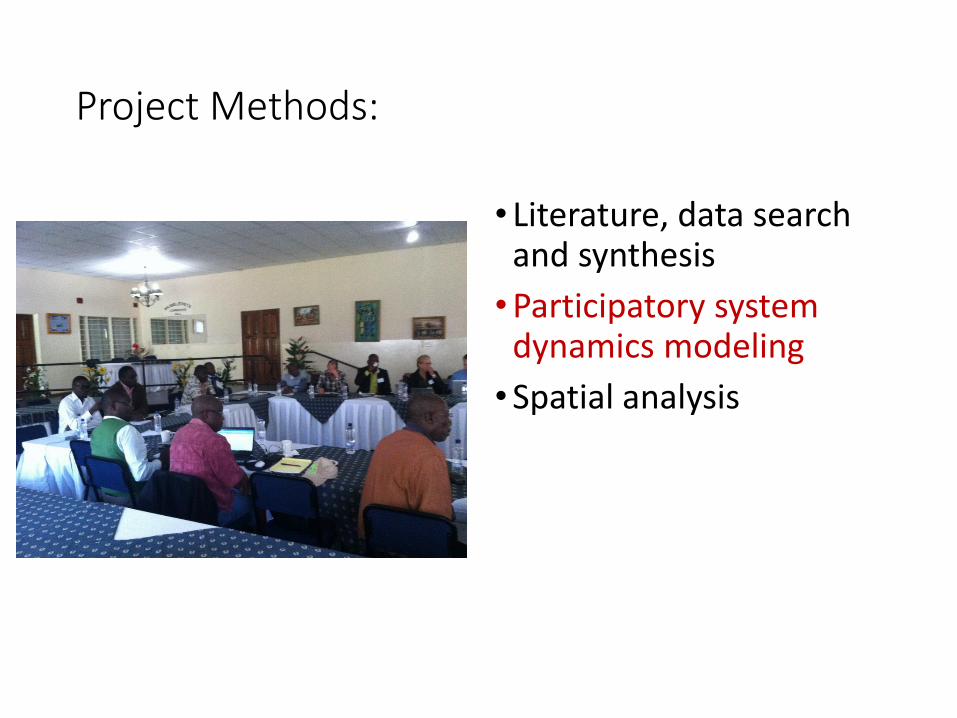
Project Methods:
• Literature, data search and synthesis
•Participatory system dynamics modeling
•Spatial analysis

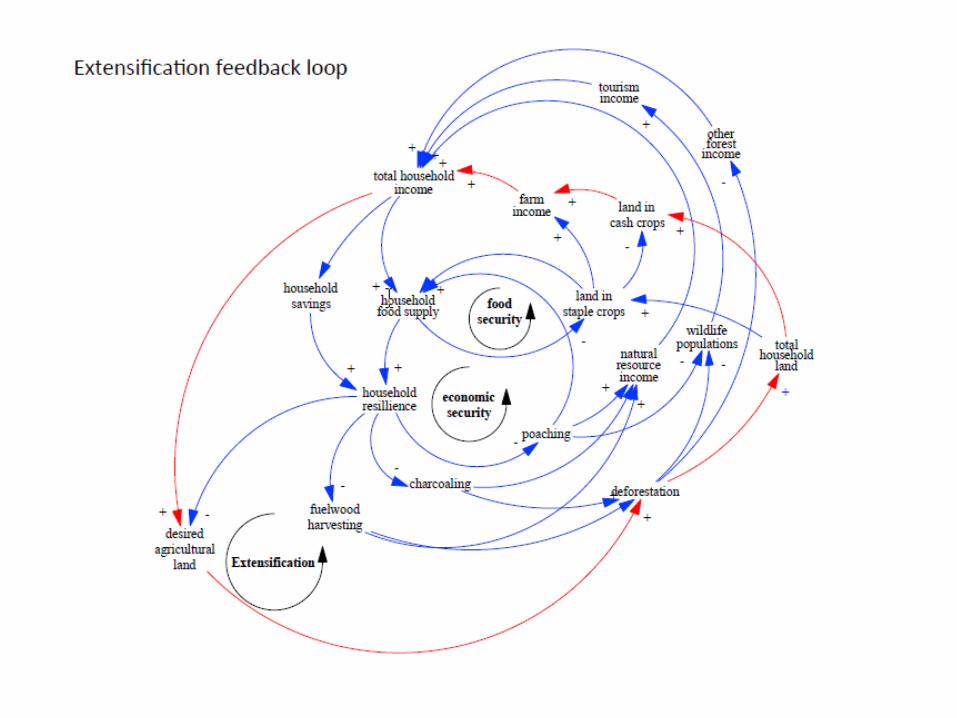
System dynamics modeling: feedback, stocks and flows, nonlinearity
Number of people
births deaths (B) (R)

Participatory Modeling in SES’s
high
high
low
low
Degree of consensus among stakeholders
Degree of understanding of the system dynamics
Mediated modeling Typical result: consensus on both problems/goals and process leading to effective and implementable policies
Mediated discussion Typical result: Consensus on goals or problems but no help on how to achieve the goals or solve the problems
Status Quo Typical result: confrontational debate and no improvement
Expert Modeling Typical result: specialized model whose recommendations never get implemented because they lack stakeholder support
Source: Van den Belt, Mediated Modeling
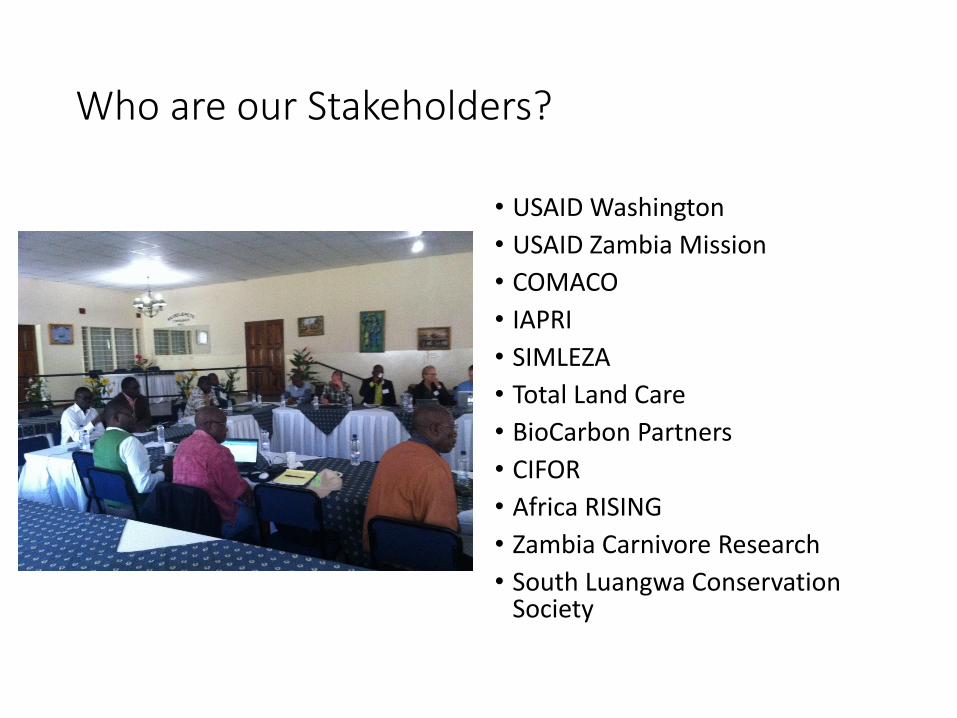
Who are our Stakeholders?
• USAID Washington
• USAID Zambia Mission
• COMACO
• IAPRI
• SIMLEZA
• Total Land Care
• BioCarbon Partners
• CIFOR
• Africa RISING
• Zambia Carnivore Research
• South Luangwa Conservation Society

Stakeholder engagement timeline

Population
Fuel
Food
Grassland
Forest
Agricultural
Decision-making
Wildlife populations

0.00E+00
1.00E+07
2.00E+07
3.00E+07
4.00E+07
5.00E+07
6.00E+07
2000 2020 2040 2060 2080 2100 2120
Hec
tare
s Forest Cover in Zambia, 2010-2110

0
200000
400000
600000
800000
1000000
1200000
1400000
20
10
20
14
20
18
20
22
20
26
20
30
20
34
20
38
20
42
20
46
20
50
20
54
20
58
20
62
20
66
20
70
20
74
20
78
20
82
20
86
20
90
20
94
20
98
21
02
21
06
21
10
Hec
tare
s/Ye
ar
Major Causes of Deforestation, 2010-2110
Agricultural deforestation Charcoal deforestation Fuelwood deforestation
0.00E+00
1.00E+07
2.00E+07
3.00E+07
4.00E+07
5.00E+07
6.00E+07
2000 2020 2040 2060 2080 2100 2120
Hec
tare
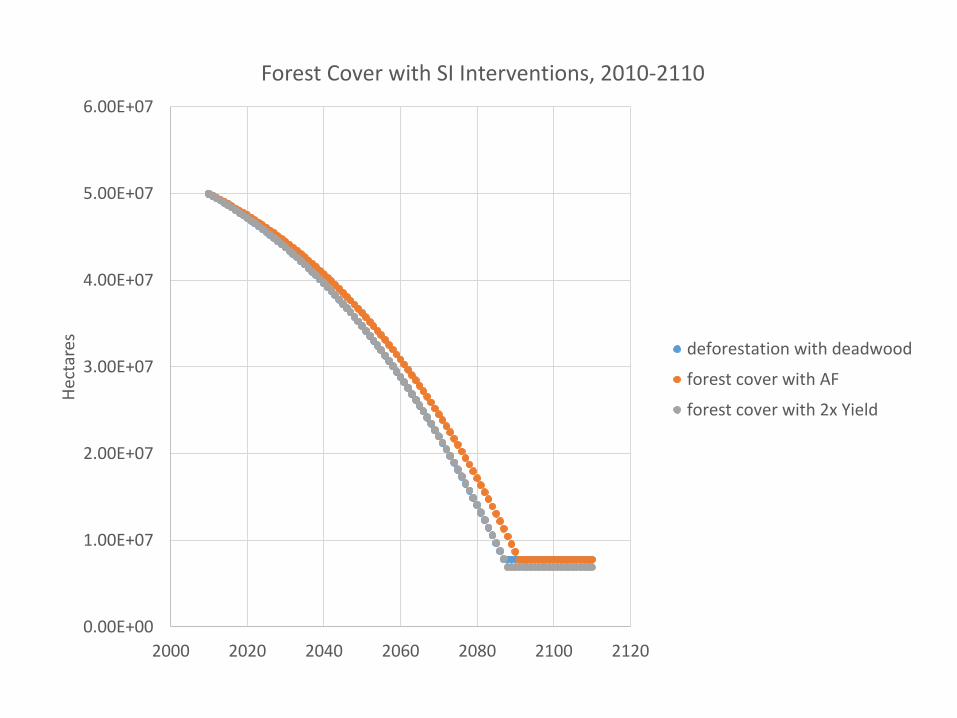
s Forest Cover with SI Interventions, 2010-2110
deforestation with deadwood
forest cover with AF
forest cover with 2x Yield

Eastern Province Model
Ifdc.org
0.00E+00
5.00E+05
1.00E+06
1.50E+06
2.00E+06
2.50E+06
3.00E+06
3.50E+06
20
10
20
15
20
20
20
25
20
30
20
35
20
40
20
45
20
50
20
55
20
60
20
65
20
70
20
75
20
80
20
85
20
90
20
95
21
00
21
05
21
10
Hec
tare
s
Land Cover in Eastern Province 2010-2110
Agricultural Forest Miombo Grassland Degraded
←17% loss
←22% loss
←22% loss

(Preliminary) Conclusions: • Smallholder farmers are not
dominant drivers of habitat degradation
• Conservation agriculture unlikely to affect habitat degradation either positively or negatively
• Focus should be on charcoal, large-scale commercial farming
• We don’t know much about poaching…or GMAs
• Eastern province may be okay…unless charcoal business expands

Africa Research in Sustainable Intensification for the Next Generation
africa-rising.net
The presentation has a Creative Commons licence. You are free to re-use or distribute this work, provided credit is given to ILRI.
Thank You