Modeling the ecological and socio-economic impacts of two...
33
Modeling the ecological and socio-economic impacts of two large reclamations on the recovery of the marine ecosystem and fisheries in Hong Kong Fisheries Centre, University of British Columbia, Canada
Transcript of Modeling the ecological and socio-economic impacts of two...
Modeling the ecological and socio-economic
impacts of two large reclamations on the
recovery of the marine ecosystem and
fisheries in Hong Kong
Fisheries Centre, University of British Columbia, Canada

2
Ussif Rashid Sumaila and William W. L. Cheung
Fisheries Centre, Aquatic Ecosystems Research Laboratory (AERL), University of British
Columbia. 2202 Main Mall, Vancouver, BC., V6T 1Z4, Canada
[email protected] ; [email protected]
EXECUTIVE SUMMARY
In recent years, a number of initiatives to restore Hong Kong’s fisheries resources have been
initiated, which are expected to bring social and ecological benefits to Hong Kong. The societal
benefits from these management initiatives can be affected by a number of government proposed
large-scale infrastructure developments that involve large reclamations in the sea. The objective
of this study is to predict the impact of the two planned reclamations (for a border-crossing
facility and the 3rd runway of the Hong Kong airport) on the recovery of the marine ecosystem,
and in turn study the development of sustainable fisheries resulting from the forthcoming ban on
trawling and commercial fishing in Marine Parks. This study shows that the proposed
reclamation projects (border-crossing facility, BFC and 3rd runway, TRW) are expected to have
negative ecological and socio-economic impacts on Hong Kong society due to projected losses in
catches and values from the country’s fishery resources. Overall, we predict that the main marine
invertebrates and fish groups would decrease in biomass because of the two reclamation projects
relative to the scenario without these projects. Also, the fishing industry will suffer losses in
landed value and net benefit, over a 20 year time-frame, of HK$129 million and HK$ 30 million,
respectively. Moreover, socially, up to 46 fishers will lose their jobs because of the projected
losses in fisheries catches that would result. To compensate these fishers that are affected by the
3
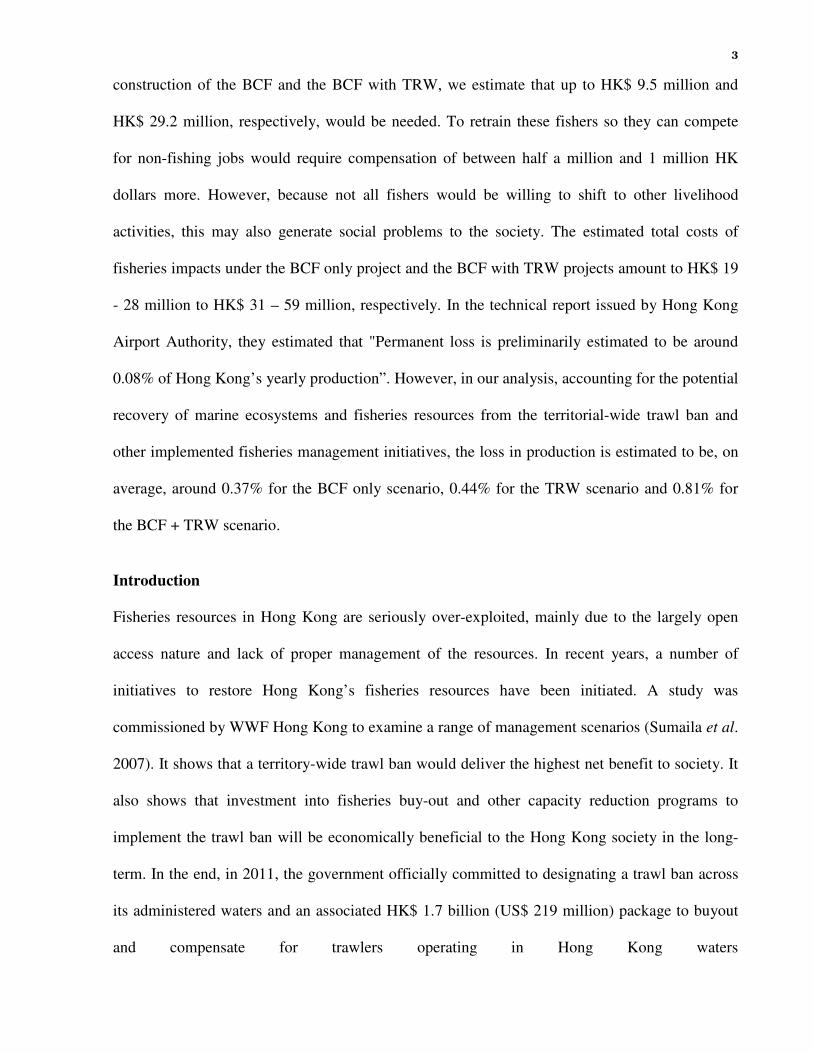
construction of the BCF and the BCF with TRW, we estimate that up to HK$ 9.5 million and
HK$ 29.2 million, respectively, would be needed. To retrain these fishers so they can compete
for non-fishing jobs would require compensation of between half a million and 1 million HK
dollars more. However, because not all fishers would be willing to shift to other livelihood
activities, this may also generate social problems to the society. The estimated total costs of
fisheries impacts under the BCF only project and the BCF with TRW projects amount to HK$ 19
- 28 million to HK$ 31 – 59 million, respectively. In the technical report issued by Hong Kong
Airport Authority, they estimated that "Permanent loss is preliminarily estimated to be around
0.08% of Hong Kong’s yearly production”. However, in our analysis, accounting for the potential
recovery of marine ecosystems and fisheries resources from the territorial-wide trawl ban and
other implemented fisheries management initiatives, the loss in production is estimated to be, on
average, around 0.37% for the BCF only scenario, 0.44% for the TRW scenario and 0.81% for
the BCF + TRW scenario.
Introduction
Fisheries resources in Hong Kong are seriously over-exploited, mainly due to the largely open
access nature and lack of proper management of the resources. In recent years, a number of
initiatives to restore Hong Kong’s fisheries resources have been initiated. A study was
commissioned by WWF Hong Kong to examine a range of management scenarios (Sumaila et al.
2007). It shows that a territory-wide trawl ban would deliver the highest net benefit to society. It
also shows that investment into fisheries buy-out and other capacity reduction programs to
implement the trawl ban will be economically beneficial to the Hong Kong society in the long-
term. In the end, in 2011, the government officially committed to designating a trawl ban across
its administered waters and an associated HK$ 1.7 billion (US$ 219 million) package to buyout
and compensate for trawlers operating in Hong Kong waters
4
(http://www.wwf.org.hk/en/news/featuredstories/?4460/Trawl-Ban-A-Pivotal-Moment-in-the-
Battle-for-Better-Hong-Kong-Marine-Conservation). The Government has also pledged to ban all
commercial fishing in its four Marine Parks, and while not yet having implemented such a
measure, is expected to do so in 2012 at the latest.
The society benefits of these management initiatives can be affected by a number of government
proposed large-scale infrastructure developments that involve large reclamations in the sea.
These development projects include, notably,
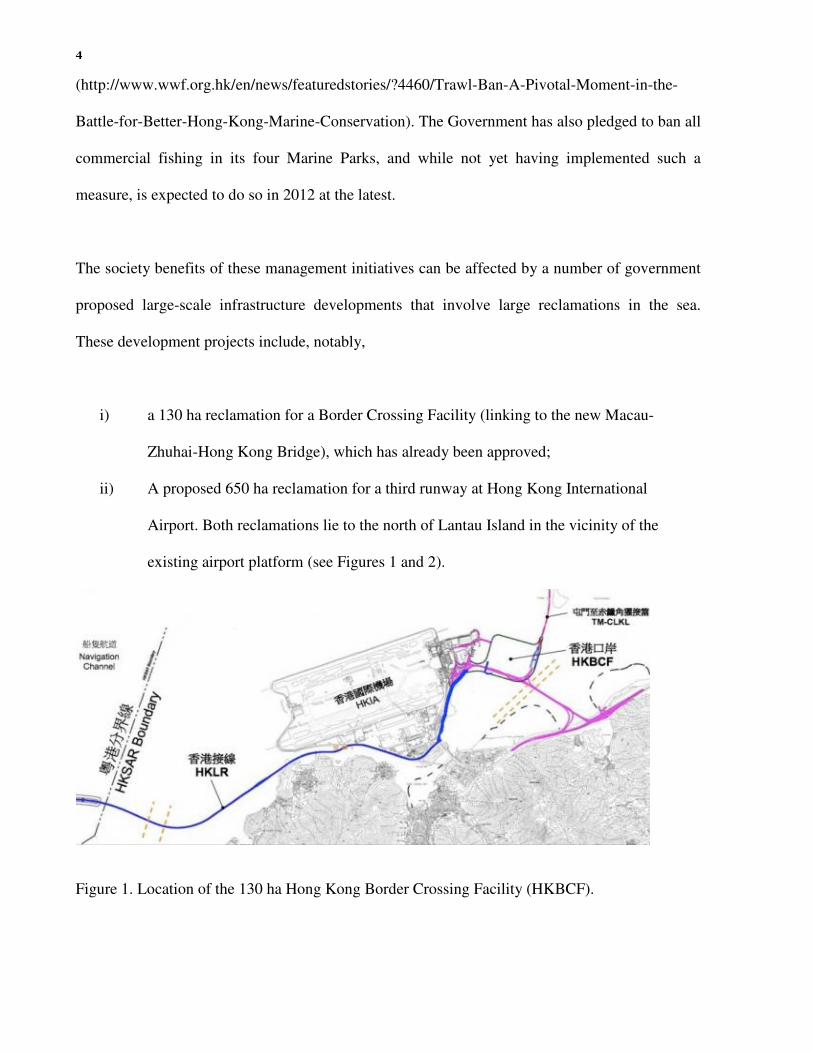
i) a 130 ha reclamation for a Border Crossing Facility (linking to the new Macau-
Zhuhai-Hong Kong Bridge), which has already been approved;
ii) A proposed 650 ha reclamation for a third runway at Hong Kong International
Airport. Both reclamations lie to the north of Lantau Island in the vicinity of the
existing airport platform (see Figures 1 and 2).
Figure 1. Location of the 130 ha Hong Kong Border Crossing Facility (HKBCF).

5
Figure 2. Location of the 650 ha proposed third runway at Hong Kong International Airport.
However, the potential implications of these projects for the future benefits of the management
initiatives have not been fully considered. The loss of coastal habitats is expected to affect the
ecosystems and exploited marine species, and the fishing section that depend directly on it.
The objectives of this study are to predict the ecological and socio-economic impacts of the two
planned reclamations on the recovery of the marine ecosystem and in turn the development of
sustainable fisheries resulting from the forthcoming ban on trawling and commercial fishing in
Marine Parks. We use an ecosystem modelling and socio-economic analytical framework that is
similar to the one employed by Sumaila et al. (2007) to project the future changes in Hong Kong
marine ecosystems and fisheries under scenarios with and without the planned reclamations. We
then compute the potential economic loss of benefits based on the differences between economic
values obtainable from the development scenarios and the baseline (no development) scenario.
We also discuss the main assumptions and uncertainties of this study and their implications for
the conclusions.

6
Method
Simulation modelling
Impacts of the effects of reclamation projects on the Hong Kong fisheries and marine ecosystem
were evaluated using the Ecopath, Ecosim and Ecospace software (Polovina, 1984; Christensen
and Pauly, 1992; Walters et al., 1997; Walters et al., 1999). (See Box 1 for an introduction to this
modelling approach). A mass-balanced Ecopath model representing a possible ecosystem state of
the Hong Kong waters in the early 2000s was constructed (see Sumaila et al. 2007 for details).
The model is an update of an earlier version of a Hong Kong ecosystem model (Pitcher et al.,
2002, 2005). Specifically, the model employed in this report uses catch data obtained from the
2001/02 Port Survey (AFCD unpublished data).
To model the effects of the spatial scenarios in this study, spatial dynamic simulations using
Ecospace based on the updated HK model were conducted. The basic set up of the spatial model
followed the 90s HK model (see Sumaila et al. 2007 for details). Hong Kong waters were
represented by 5 x 5 km2 cells (Figure 3). Habitat types were defined as: reefs, non-reef and
marine mammal habitats. Each functional group was assigned to be associated with one or more
habitat types. The marine mammal habitat is defined based on the key occurrence area of the
major groups of marine mammals (Chinese white dolphin and Finless porpoise). The inclusion of
this ‘habitat’ is primarily to mimic the local distribution of these marine mammals. However, the
habitat does not exclude the marine mammals group from entering other habitat types, or non-
mammal groups entering into the marine mammal habitat. Three types of management areas were
defined: marine parks, marine exclusive zone and marine reserves (see Sumaila et al. 2007).
Cape D’Aguilar marine reserve and the Chek Lap Kwok Marine Exclusive Zone, both areas
7
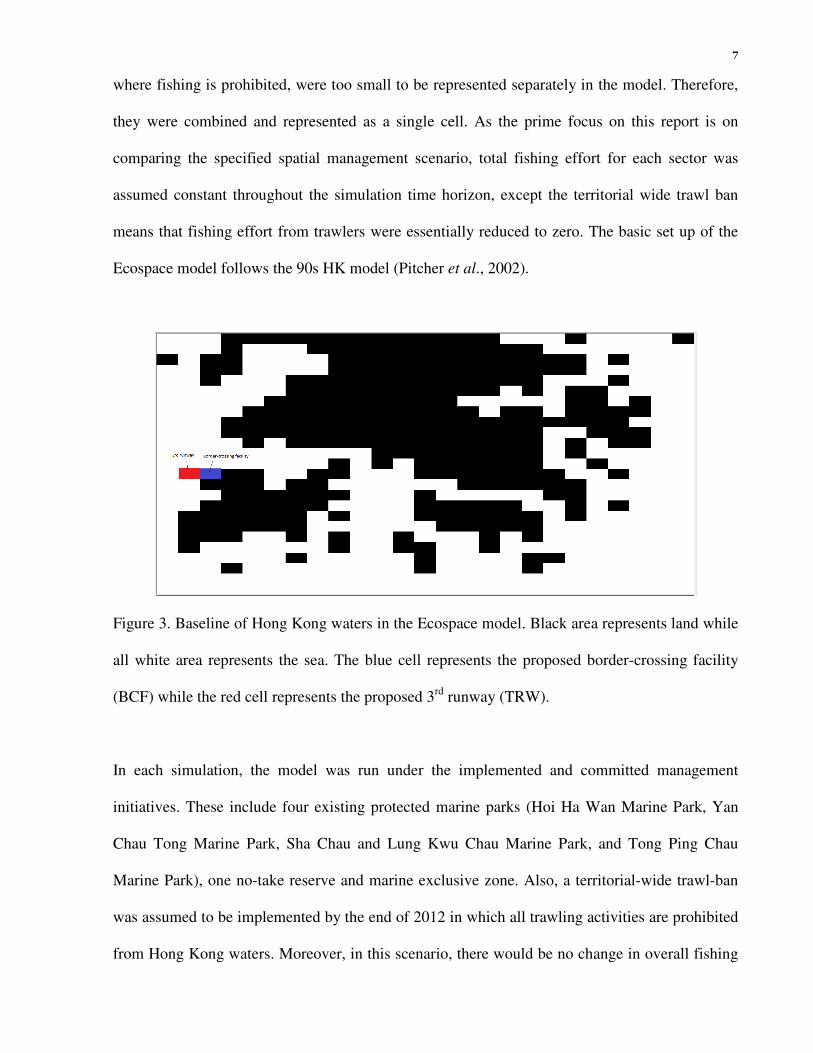
where fishing is prohibited, were too small to be represented separately in the model. Therefore,
they were combined and represented as a single cell. As the prime focus on this report is on
comparing the specified spatial management scenario, total fishing effort for each sector was
assumed constant throughout the simulation time horizon, except the territorial wide trawl ban
means that fishing effort from trawlers were essentially reduced to zero. The basic set up of the
Ecospace model follows the 90s HK model (Pitcher et al., 2002).
Figure 3. Baseline of Hong Kong waters in the Ecospace model. Black area represents land while
all white area represents the sea. The blue cell represents the proposed border-crossing facility
(BCF) while the red cell represents the proposed 3rd runway (TRW).
In each simulation, the model was run under the implemented and committed management
initiatives. These include four existing protected marine parks (Hoi Ha Wan Marine Park, Yan
Chau Tong Marine Park, Sha Chau and Lung Kwu Chau Marine Park, and Tong Ping Chau
Marine Park), one no-take reserve and marine exclusive zone. Also, a territorial-wide trawl-ban
was assumed to be implemented by the end of 2012 in which all trawling activities are prohibited
from Hong Kong waters. Moreover, in this scenario, there would be no change in overall fishing
8
effort for the non-trawling sectors (i.e., P4/7, purse seine, and miscellaneous). Assuming that the
model represent the state of the ecosystem in year 2001, the model was run for 11 years (until the
start of year 2012). Then three scenarios were considered:
(1)Baseline : The implementation of the territorial-wide trawl ban) in year 2013;
(2)BCF : Scenario (1) + Reclamation for the construction of the Border Crossing Facility
(BCF) (1.3 km-2) started in 2011, with full level of impact from the BCF through direct
loss of habitat to be realized in 2012. ;
(3)BCF & 3rd runway : Scenario (1) + Scenario (2) + Reclamation for the third airport
runway (TRW) (6.5 km2) started in 2014 and completed by 2018, with the fully level of
impact from the TRW through direct loss of habitat to be realized in 2014.
In scenarios 2 and 3, the full impact of these projects on the Hong Kong marine ecosystem is
assumed to start in 2012 and 2014, to account for the fact that ecological and fisheries impacts
would start to occur once the reclamation projects start. Also, because of the coarser spatial
resolution of the Ecospace simulation model (2 x 2 km), the footprints of the BCF and the third
runway project were each represented by 1 spatial cell. Simulations were allowed to continue to
run for 30 years from 2012 and the results in 5, 10 and 20-year (5-year average) were recorded.
9
Box 1: The Ecopath with Ecosim model
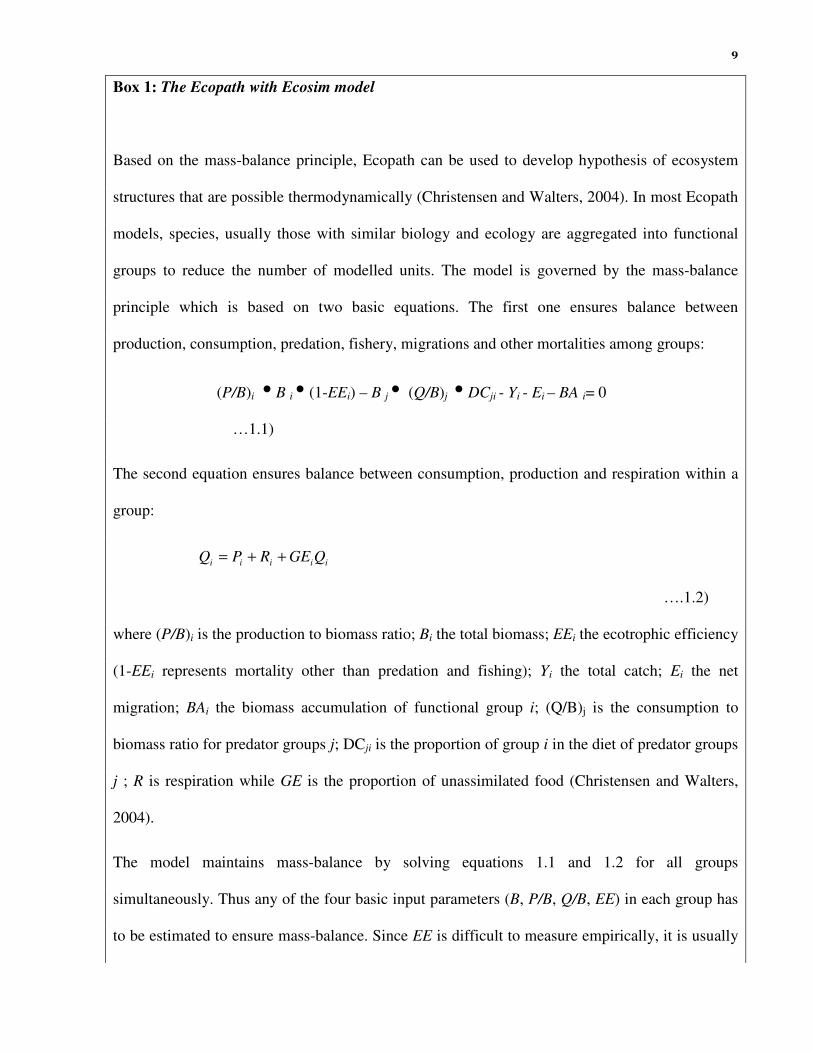
Based on the mass-balance principle, Ecopath can be used to develop hypothesis of ecosystem
structures that are possible thermodynamically (Christensen and Walters, 2004). In most Ecopath
models, species, usually those with similar biology and ecology are aggregated into functional
groups to reduce the number of modelled units. The model is governed by the mass-balance
principle which is based on two basic equations. The first one ensures balance between
production, consumption, predation, fishery, migrations and other mortalities among groups:
(P/B)i ● B i ● (1-EEi) – B j ● (Q/B)j ● DCji - Yi - Ei – BA i= 0
…1.1)
The second equation ensures balance between consumption, production and respiration within a
group:
iiiii QGERPQ ++=
….1.2)
where (P/B)i is the production to biomass ratio; Bi the total biomass; EEi the ecotrophic efficiency
(1-EEi represents mortality other than predation and fishing); Yi the total catch; Ei the net
migration; BAi the biomass accumulation of functional group i; (Q/B)j is the consumption to
biomass ratio for predator groups j; DCji is the proportion of group i in the diet of predator groups
j ; R is respiration while GE is the proportion of unassimilated food (Christensen and Walters,
2004).
The model maintains mass-balance by solving equations 1.1 and 1.2 for all groups
simultaneously. Thus any of the four basic input parameters (B, P/B, Q/B, EE) in each group has
to be estimated to ensure mass-balance. Since EE is difficult to measure empirically, it is usually
10
estimated through the mass-balance process provided that data to estimate other parameters are
available. In cases where data for B, P/B or Q/B are unavailable, EE is assumed to be 0.95.
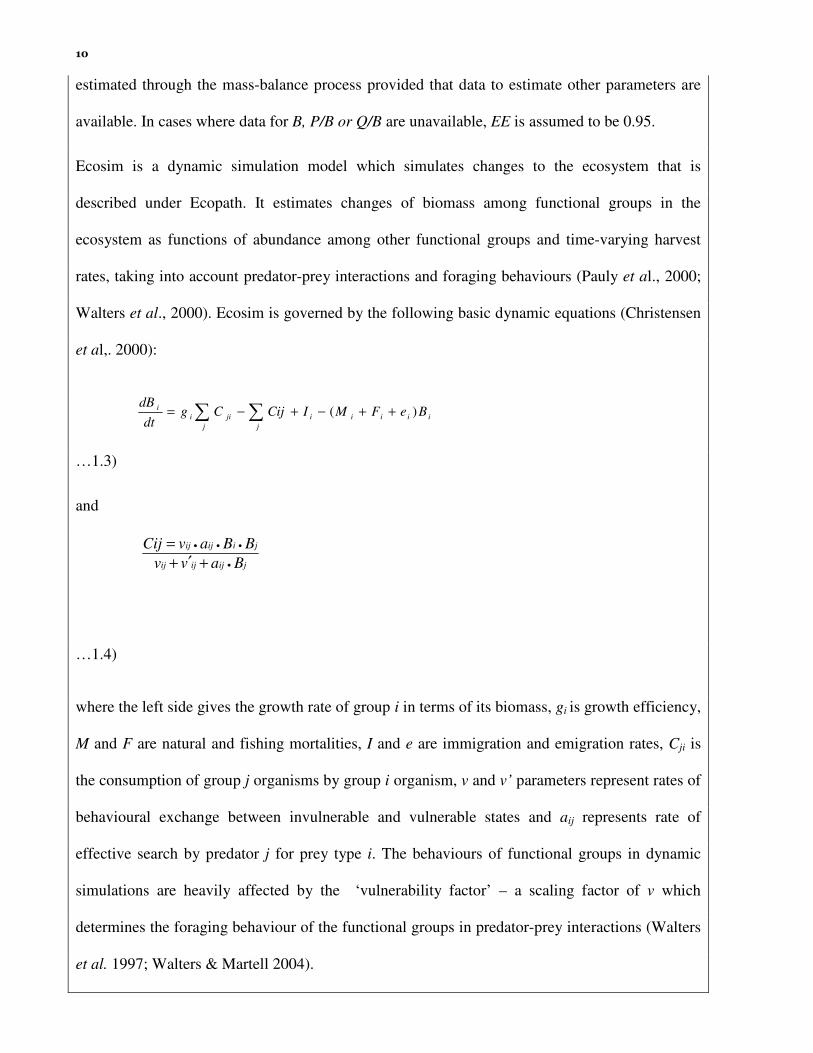
Ecosim is a dynamic simulation model which simulates changes to the ecosystem that is
described under Ecopath. It estimates changes of biomass among functional groups in the
ecosystem as functions of abundance among other functional groups and time-varying harvest
rates, taking into account predator-prey interactions and foraging behaviours (Pauly et al., 2000;
Walters et al., 2000). Ecosim is governed by the following basic dynamic equations (Christensen
et al,. 2000):
iiiii
j j
jii
i BeFMICijCgdt
dB)( ++−+−= ∑ ∑
…1.3)
and
jijijij
jiijij
Bavv
BBavCij
•
•••
+′+
=
…1.4)
where the left side gives the growth rate of group i in terms of its biomass, gi is growth efficiency,
M and F are natural and fishing mortalities, I and e are immigration and emigration rates, Cji is
the consumption of group j organisms by group i organism, v and v’ parameters represent rates of
behavioural exchange between invulnerable and vulnerable states and aij represents rate of
effective search by predator j for prey type i. The behaviours of functional groups in dynamic
simulations are heavily affected by the ‘vulnerability factor’ – a scaling factor of v which
determines the foraging behaviour of the functional groups in predator-prey interactions (Walters
et al. 1997; Walters & Martell 2004).

11
Ecospace consists of spatial replicates of Ecosim simulations in grid cells on a pre-defined base
map. Each spatial cell is linked through: (1) dispersal of organisms, (2) spatial movement of
fishing effort in response to changes in profitability of fishing, and (3) creation of protected areas
(Walters et al. 1999; Walters 2000).
The Ecopath with Ecosim, and the Ecospace software were used to address questions posed in the
technical proposal.
Predicting changes in biomass of major functional groups
We projected and compared changes in biomass of major functional groups in the Hong Kong
marine ecosystem under the three scenarios. To assess the effects of the BCF and TRW
construction projects on the Hong Kong marine ecosystem, we compare the changes in biomasses
under the airport development scenarios (Scenario 2 and 3) relative to the baseline scenario
(Scenario 1) for a range of functional groups. These groups include benthic crustaceans, shrimps,
reef-associated fishes (small, medium and large), non-reef-associated fishes (small, medium and
large) and pelagic fishes (small, medium and large). Moreover, the comparisons between
scenarios were sub-divided into three time-frames: 5-year, 10-year and 20-year.
Predicting changes in landed value and net benefits
We predicted the economic gains or losses of the fishing sectors from the two development
scenarios. Firstly, under each scenario, we calculated the landed value of the fisheries by
multiplying the unit ex-vessel fish price (as reported in Sumaila et al. 2007), adjusted to 2011
value using Consumer Price Index published by the Hong Kong Census and Statistics
Department, by catches of each functional group from 2012 to 2041 (20 years after the full
impact of the proposed 3rd runway reclamation is assumed to commence) as predicted by the
model. We also calculated net present value (NPV) of the economic benefits of the fisheries by
12
subtracting the landed value by the unit cost (see Sumaila et al. 2007 for details). We then
calculated the present value of the total landed value and economic benefits over short (5 year),
medium (10 year) and long (20 year) time frames (from the year the full impact of the 3rd
runway reclamation commences) under a discount rate of 3% per annum (Sumaila et al. 2007).
Economic gains/losses from the development projects scenarios (2 and 3) were calculated by the
differences in the present value of the predicted landed values and net economic benefits from the
fisheries in these scenarios relative to the baseline scenario (1).
Predicting the cost of re-training displaced fishers
We estimated that the number of fishers that may potentially be displaced from fishing by
estimating the number of displaced fishing vessels for each scenario using results from our
simulations. Firstly, we calculated the amount of total catch required to support one fishing vessel
operating in Hong Kong waters. Then we predicted the changes in number of fishing vessel over
time by multiplying the catch per fishing vessel value with the projected catch from the
simulation model. We then calculated the differences in the number of displaced fishers between
the development scenarios (scenarios 2 and 3) and the baseline scenario (scenario 1). Based on
an interview survey, we found that fishing vessels in inshore waters are generally operated by
two family members, with additional crew hired as needed from Mainland China. As our
analysis focused on Hong Kong fishers only, the effects of the scenarios on the demand of
mainland crew are not considered. Thus the total number of displaced fishers was calculated by
assuming that an average of two fishers would be out of jobs when one fishing vessel is
displaced.
We estimated the cost of re-training fishers who would be displaced from fishing because of the
development projects. Since the available marine-related jobs (business in scuba diving,

13
recreational fishing and marine-related tourism) are projected to be taken up by fishers who
would be displaced from fishing because of the implemented trawl ban (Sumaila et al. 2007), we
assumed that fishers who are displaced from fishing from the development projects would need
to find job in other non-marine-related sectors, such as the construction sector. In such cases, the
cost of re-training fishers can be calculated based on an assumed period of retraining and
minimum wage required to support the livelihood of the fishers during this re-training period. In
Taiwan, the government provided a retraining programme to fishers and farmers for a maximum
period of 6 months. The minimum wages in Hong Kong in 2011 is HK$ 28 per hour. Assuming a
maximum re-training period of 6 months with 35 hours per week of work, the cost of retaining
one fisher is HK$ 25,200. The Hong Kong government has an on-going fund that supports
retraining of workers. Thus, we assume that no-extra cost is needed to set up additional retraining
programmes for fishers.
We also estimated the cost of providing compensation for the displaced fishers instead of re-
training them for other livelihood sectors. We estimated the compensation per fisher based on the
method that the government used for calculating ex-gratia payment for fishers that are affected by
the trawl ban. It is calculated from the sum of 11 years of the reported landed value of the each
fisher. The averaged landed value per fisher as reported in the 2001/02 Port Survey is $HK
57,713 in 2011 value (assuming 2 fishers per vessel). Thus, the expected compensation for each
displaced fisher would be $HK 403,991.
Results
Projected ecological changes under the baseline scenario (1)
With the implementation of the territorial-wide trawl ban and without the construction of BCF
and TRW, biomasses of most groups of benthic invertebrates, reef fishes and non-reef fishes are

14
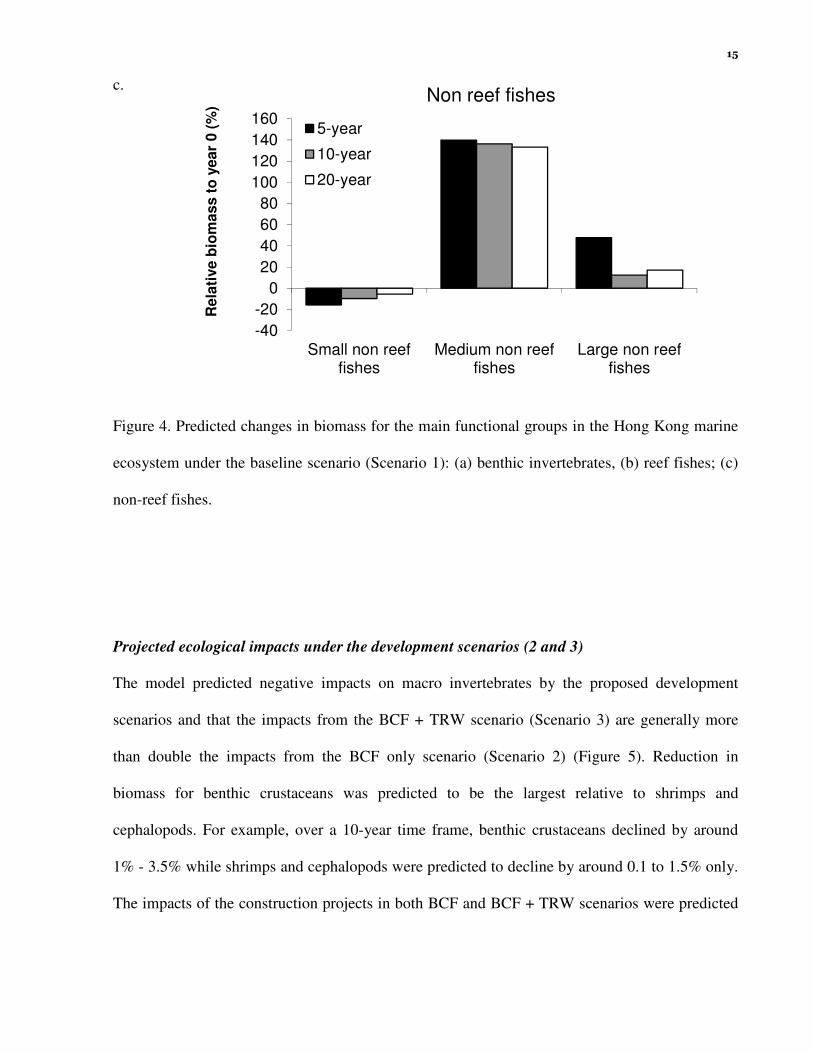
expected to increase over the 5-, 10- and 20- year time frames (Figure 4). The exception is
benthic crustaceans and small non-reef fishes. The latter groups were predicted to decrease in
biomass under this baseline scenario. The increase is largest for large reef fishes and medium
non-reef fishes, followed by cephalopods, large non-reef fishes, shrimps and medium reef fishes.
a.
-20
-10
0
10
20
30
40
50
60
Benthic crustacens Shrimps Cephalopods
Rela
tive b
iom
ass t
o y
ear
0 (
%)
Benthic invertebrates
5-year
10-year
20-year
b.
-50
0
50
100
150
200
250
300
350
Small reef fishes Medium reef fishes Large reef fishes
Rela
tive b
iom
ass t
o y
ear
0 (
%)
Reef fishes
5-year
10-year
20-year
15
c.
-40
-20
0
20
40
60
80
100
120
140
160
Small non reeffishes
Medium non reeffishes
Large non reeffishes
Rela
tive b
iom
ass t
o y
ear
0 (
%)
Non reef fishes
5-year
10-year
20-year
Figure 4. Predicted changes in biomass for the main functional groups in the Hong Kong marine
ecosystem under the baseline scenario (Scenario 1): (a) benthic invertebrates, (b) reef fishes; (c)
non-reef fishes.
Projected ecological impacts under the development scenarios (2 and 3)
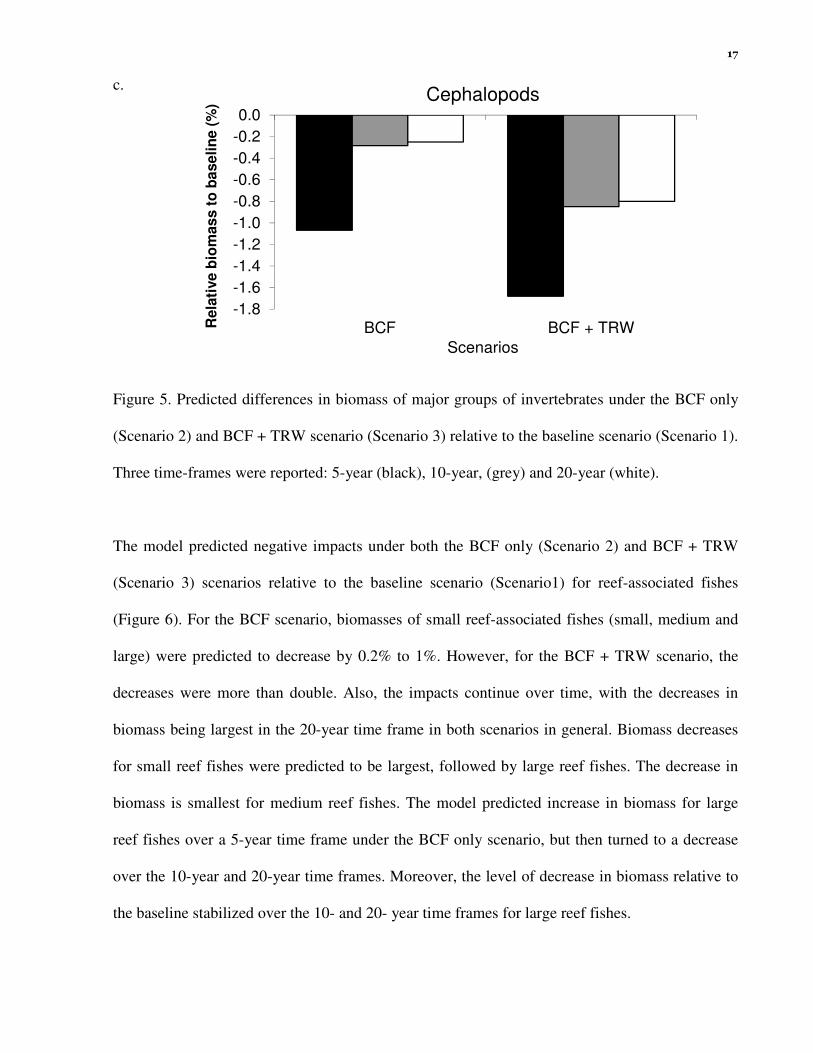
The model predicted negative impacts on macro invertebrates by the proposed development
scenarios and that the impacts from the BCF + TRW scenario (Scenario 3) are generally more
than double the impacts from the BCF only scenario (Scenario 2) (Figure 5). Reduction in
biomass for benthic crustaceans was predicted to be the largest relative to shrimps and
cephalopods. For example, over a 10-year time frame, benthic crustaceans declined by around
1% - 3.5% while shrimps and cephalopods were predicted to decline by around 0.1 to 1.5% only.
The impacts of the construction projects in both BCF and BCF + TRW scenarios were predicted

16
to be largest in the short (5-year) time frame, while the impacts are expected to become smaller in
the medium to long time frame.
a.
-4.0
-3.5
-3.0
-2.5
-2.0
-1.5
-1.0
-0.5
0.0
BCF BCF + TRWRela
tive b
iom
ass t
o b
aseli
ne (
%)
Scenarios
Benthic crustaceans
5 years
10 years 20 years
b.
-0.4
-0.3
-0.2
-0.1
0.0
0.1
BCF BCF + TRWRe
lati
ve b
iom
ass
to
bas
eli
ne (
%)
Scenarios
Shrimps
17
c.
-1.8
-1.6
-1.4
-1.2
-1.0
-0.8
-0.6
-0.4
-0.2
0.0
BCF BCF + TRWRela
tive
bio
mas
s t
o b
ase
lin
e (
%)
Scenarios
Cephalopods
Figure 5. Predicted differences in biomass of major groups of invertebrates under the BCF only
(Scenario 2) and BCF + TRW scenario (Scenario 3) relative to the baseline scenario (Scenario 1).
Three time-frames were reported: 5-year (black), 10-year, (grey) and 20-year (white).
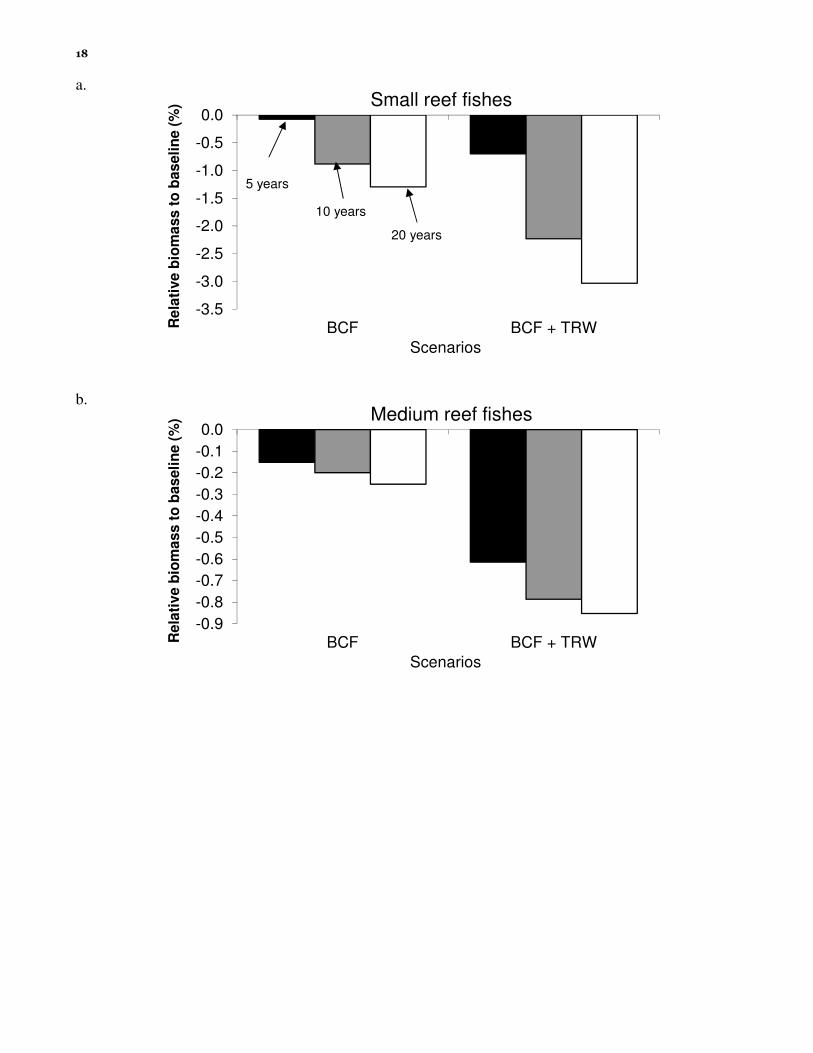
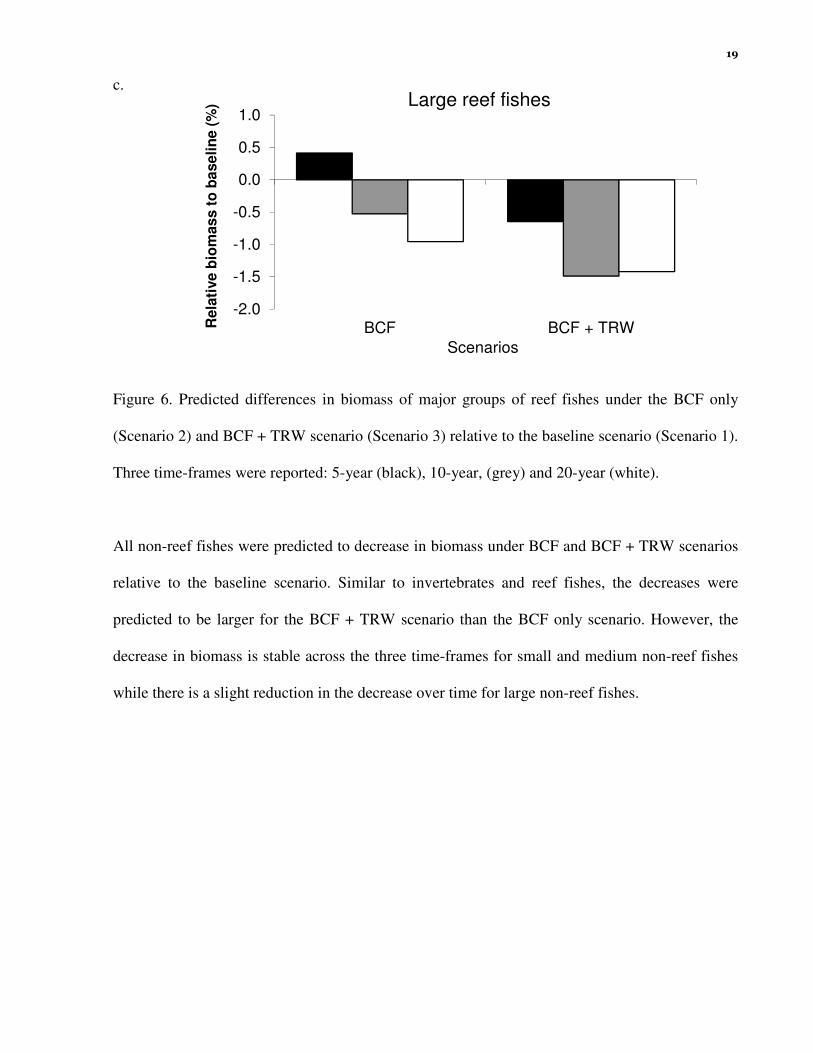
The model predicted negative impacts under both the BCF only (Scenario 2) and BCF + TRW
(Scenario 3) scenarios relative to the baseline scenario (Scenario1) for reef-associated fishes
(Figure 6). For the BCF scenario, biomasses of small reef-associated fishes (small, medium and
large) were predicted to decrease by 0.2% to 1%. However, for the BCF + TRW scenario, the
decreases were more than double. Also, the impacts continue over time, with the decreases in
biomass being largest in the 20-year time frame in both scenarios in general. Biomass decreases
for small reef fishes were predicted to be largest, followed by large reef fishes. The decrease in
biomass is smallest for medium reef fishes. The model predicted increase in biomass for large
reef fishes over a 5-year time frame under the BCF only scenario, but then turned to a decrease
over the 10-year and 20-year time frames. Moreover, the level of decrease in biomass relative to
the baseline stabilized over the 10- and 20- year time frames for large reef fishes.
18
a.
-3.5
-3.0
-2.5
-2.0
-1.5
-1.0
-0.5
0.0
BCF BCF + TRWRe
lati
ve b
iom
ass
to
bas
eli
ne (
%)
Scenarios
Small reef fishes
5 years
10 years
20 years
b.
-0.9
-0.8
-0.7
-0.6
-0.5
-0.4
-0.3
-0.2
-0.1
0.0
BCF BCF + TRWRe
lati
ve b
iom
ass
to
bas
eli
ne (
%)
Scenarios
Medium reef fishes
19
c.
-2.0
-1.5
-1.0
-0.5
0.0
0.5
1.0
BCF BCF + TRWRela
tive
bio
mas
s t
o b
ase
lin
e (
%)
Scenarios
Large reef fishes
Figure 6. Predicted differences in biomass of major groups of reef fishes under the BCF only
(Scenario 2) and BCF + TRW scenario (Scenario 3) relative to the baseline scenario (Scenario 1).
Three time-frames were reported: 5-year (black), 10-year, (grey) and 20-year (white).
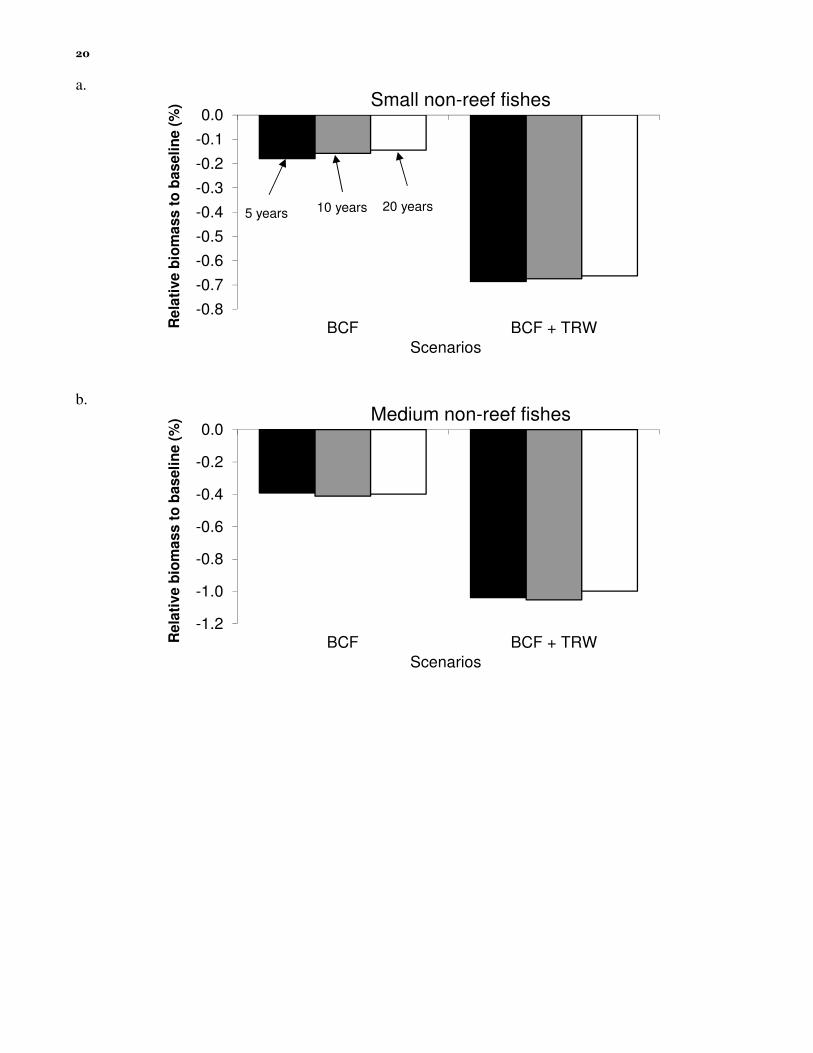
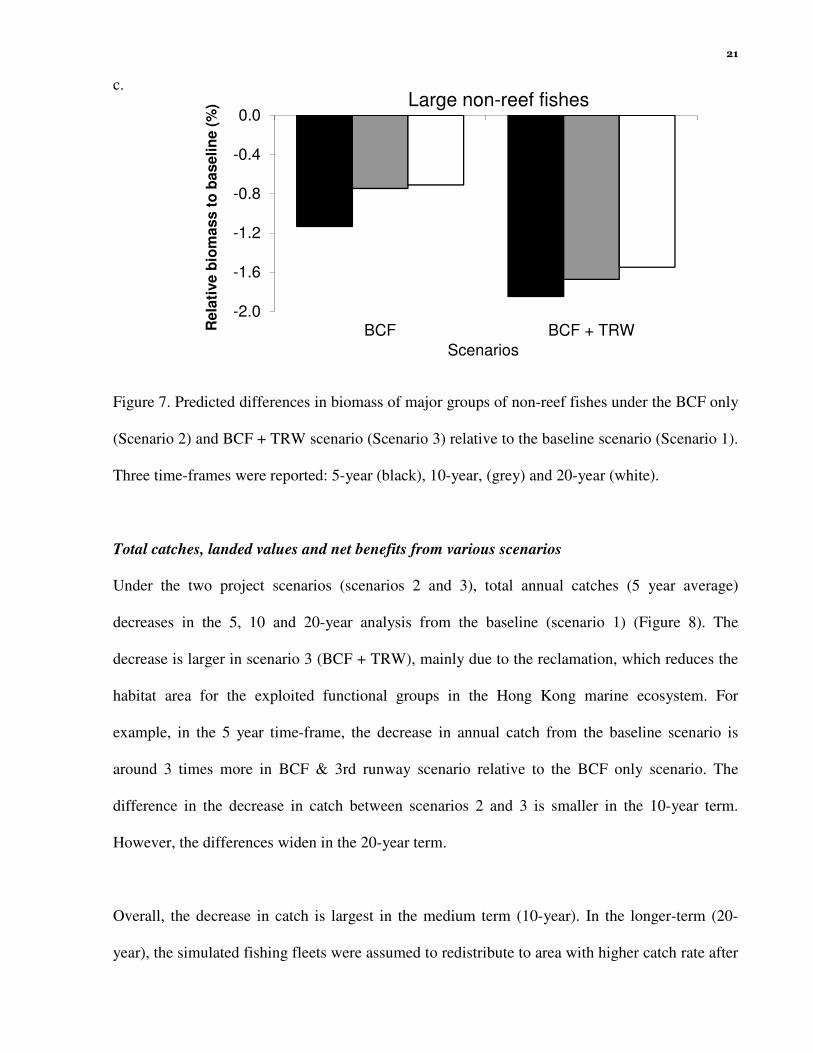
All non-reef fishes were predicted to decrease in biomass under BCF and BCF + TRW scenarios
relative to the baseline scenario. Similar to invertebrates and reef fishes, the decreases were
predicted to be larger for the BCF + TRW scenario than the BCF only scenario. However, the
decrease in biomass is stable across the three time-frames for small and medium non-reef fishes
while there is a slight reduction in the decrease over time for large non-reef fishes.
20
a.
-0.8
-0.7
-0.6
-0.5
-0.4
-0.3
-0.2
-0.1
0.0
BCF BCF + TRWRe
lati
ve b
iom
ass
to
bas
eli
ne (
%)
Scenarios
Small non-reef fishes
5 years 10 years 20 years
b.
-1.2
-1.0
-0.8
-0.6
-0.4
-0.2
0.0
BCF BCF + TRWRe
lati
ve b
iom
ass
to
bas
eli
ne (
%)
Scenarios
Medium non-reef fishes
21
c.
-2.0
-1.6
-1.2
-0.8
-0.4
0.0
BCF BCF + TRWRela
tive b
iom
ass t
o b
aseli
ne (
%)
Scenarios
Large non-reef fishes
Figure 7. Predicted differences in biomass of major groups of non-reef fishes under the BCF only
(Scenario 2) and BCF + TRW scenario (Scenario 3) relative to the baseline scenario (Scenario 1).
Three time-frames were reported: 5-year (black), 10-year, (grey) and 20-year (white).
Total catches, landed values and net benefits from various scenarios
Under the two project scenarios (scenarios 2 and 3), total annual catches (5 year average)
decreases in the 5, 10 and 20-year analysis from the baseline (scenario 1) (Figure 8). The
decrease is larger in scenario 3 (BCF + TRW), mainly due to the reclamation, which reduces the
habitat area for the exploited functional groups in the Hong Kong marine ecosystem. For
example, in the 5 year time-frame, the decrease in annual catch from the baseline scenario is
around 3 times more in BCF & 3rd runway scenario relative to the BCF only scenario. The
difference in the decrease in catch between scenarios 2 and 3 is smaller in the 10-year term.
However, the differences widen in the 20-year term.
Overall, the decrease in catch is largest in the medium term (10-year). In the longer-term (20-
year), the simulated fishing fleets were assumed to redistribute to area with higher catch rate after

22
the loss of fishing grounds (and the catches from it) because of the reclamation projects. Thus the
decrease in overall catch is predicted to be lower in the longer-term relative to the short (5-year)
and medium (10-year) term.
-1.2
-1.0
-0.8
-0.6
-0.4
-0.2
0.0BCF only BCF & TRW
Ch
an
ges i
n t
ota
l ca
tch
(% r
ela
tiv
e t
o t
he b
aselin
e)
Scenarios
Year 5
Year 10
Year 20
Figure 8. Predicted changes in total annual catch relative to the baseline under two scenarios: (1)
reclamation for the construction of the border-crossing facility (BCF); and (2) reclamation for
both the BCF and the TRW in year 5, 10 and 20 (5-year average).
Under the development scenarios (2 and 3), discounted total landed values and net benefits (=
landed values minus cost, with the flow of benefits through time discounted by a discount rate of
3%) decrease from the baseline (scenario 1) under all time frames (5-, 10- and 20- year) (Figure
9). The decreases in both landed values and net benefits are much larger in the scenario with BCF
and 3rd runway than the BCF scenario over all time-frames. Overall, the decreases in landed
value and net benefits increase over the time-frame considered. The BCF & TRW scenario is
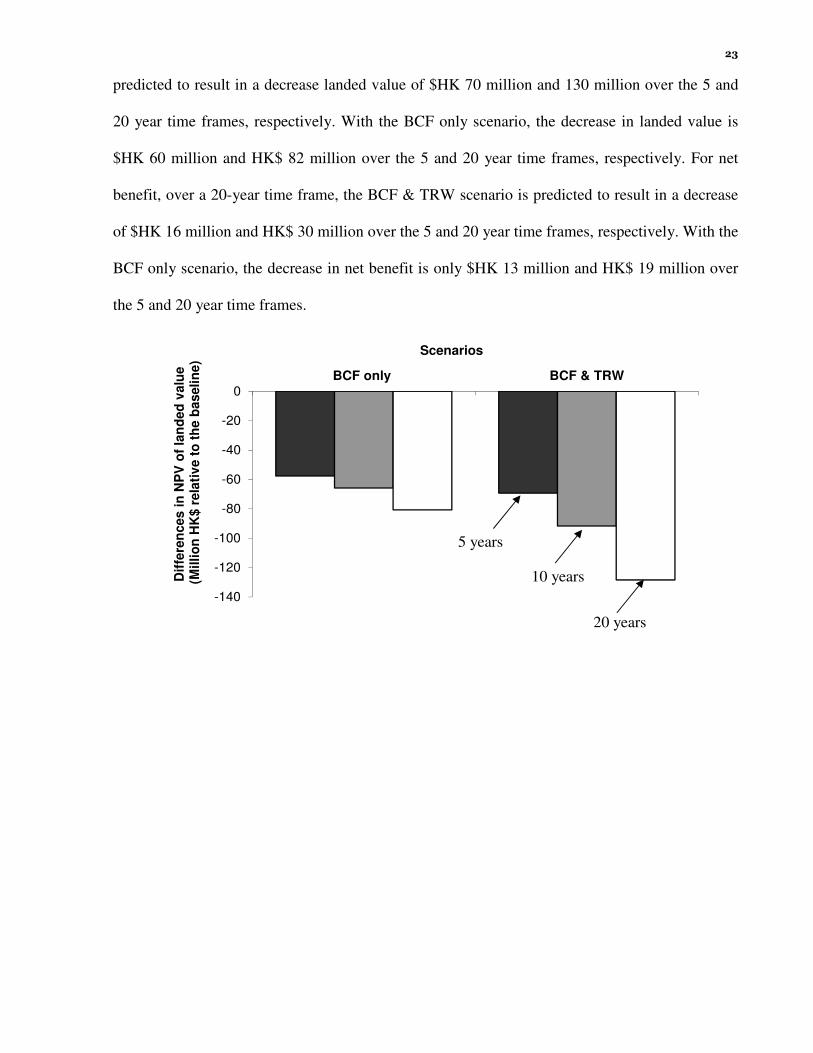
23
predicted to result in a decrease landed value of $HK 70 million and 130 million over the 5 and
20 year time frames, respectively. With the BCF only scenario, the decrease in landed value is
$HK 60 million and HK$ 82 million over the 5 and 20 year time frames, respectively. For net
benefit, over a 20-year time frame, the BCF & TRW scenario is predicted to result in a decrease
of $HK 16 million and HK$ 30 million over the 5 and 20 year time frames, respectively. With the
BCF only scenario, the decrease in net benefit is only $HK 13 million and HK$ 19 million over
the 5 and 20 year time frames.
-140
-120
-100
-80
-60
-40
-20
0BCF only BCF & TRW
Dif
fere
nces i
n N
PV
of
lan
ded
valu
e(M
illi
on
HK
$ r
ela
tiv
e t
o t
he b
aselin
e)
Scenarios
5 years
10 years
20 years

24
-35
-30
-25
-20
-15
-10
-5
0BCF only BCF & TRW
Dif
fere
nces i
n N
PV
of
ben
efi
ts(M
illio
n H
K$ r
ela
tiv
e t
o t
he b
as
elin
e)
Scenarios
5 years
10 years
20 years
Figure 9. Predicted differences in discounted (PV) landed value (upper graph) and net benefits
(lower graph) from the fisheries relative to the baseline through 5-year, 10-year and 20-year time
frames under two scenarios: (1) reclamation for the construction of the border-crossing facility
(BCF); and (2) reclamation for both the BCF and the TRW.
Displacement of fishers and cost for their re-training
The BCF only (scenario 2) and BCF with TRW (scenario 3) scenarios results in an increase in the
number of fishers to be displaced from fishing relative to the baseline scenario. In the BCF only
scenario, we projected that 7.5 non-trawler fishing vessels (15 Hong Kong fishers) would be
displaced from fishing while 23 non-trawler vessels (46 fishers) would be displaced under the
BCF with 3rd runway scenario. If we assumed that all of the displaced fishers could be re-trained
to enter other livelihood sector, the cost of re-training these displaced fishers would be $HK
378,000 and $HK 1,159,200 under scenario 2 and 3, respectively. However, if the government
are to provide full compensation for all the displaced fishers, the estimated cost would become
$HK 9.5 million and 29.2 million under scenario 2 and 3, respectively.
25
We calculated the total cost of each of the development scenarios from the loss in NPV of net
benefits over a 20 year time frame and the cost of retraining displaced fishers or compensating
for their losses. For the BCF only scenario, the estimated total costs of fisheries impacts amount
to HK$ 18.9 – 28.1 million. For BCF and TRW scenario, the estimated costs would be 30.7 –
58.8 million, respectively. The reader is referred to Appendix 1 for more results.
Discussion
The objective of this study is to predict the impact of the two reclamations on the recovery of the
marine ecosystem and in turn the development of sustainable fisheries resulting from the
forthcoming ban on trawling and commercial fishing in Marine Parks. Without the proposed
reclamation projects, we would expect to see substantial growth in biomasses of major groups of
marine invertebrates and fishes in Hong Kong marine ecosystems under the trawl ban and other
implemented conservation measures, as has been suggested in Sumaila et al. (2007). However,
the implementation of the proposed BCF and TRW would negatively affect the recovery of the
marine ecosystems but reducing the expected growth in biomasses of these organisms. These
would counter the effectiveness of these conservation measures.
Our analysis also suggested substantial negative impacts of the BCF and TRW projects on Hong
Kong fisheries. We find that even when we look at only the market value of the potential fish
catch to be lost, this is not completely trivial, especially, if we consider the socioeconomic
conditions of fishing communities in Hong Kong. It should also be noted that the numbers
calculated herein assume that all parts of Hong Kong waters are homogeneous and equally
productive but we know that ecosystem are not homogenous. In addition, a major potential
impact of reclamation is on the hydrology of Hong Kong waters, which may in turn have

26
implications on the ecology of the waters around the reclamation sites. Thus, if the proposed area
to be reclaimed is critical ecological habitats for exploited species in the surrounding area, the
numbers reported in here could be under-estimates (and vice versa).
Moreover, we did not account for the potential synergistic or interactions between other past,
existing or proposed development projects, which is likely to magnify the impacts of the
development projects that we considered in this report.
On the employment front, we find that a number of fishers will be displaced who are either
unable or unwilling to take up jobs that may be created from the reclamation. Hence, the social
impact of the reclamation will likely be much larger that the impacts depicted by the numbers
computed in this report and that the economic impacts would be closer to the higher end of our
estimates as the government needs to fully compensate for the loss of livelihood of the displaced
fishers.
Other more specific modelling assumptions and uncertainties include:
1. Modelling reef habitats
The representation of reef habitat in the spatial model is limited by the spatial resolution of the
grid system. The Hong Kong marine ecosystem is represented by 2 x 5 km2 cells and this
resolution is too coarse to accurately represent the relatively small and patchy distribution of reef
habitats in Hong Kong. Thus reef habitats from different areas are collectively represented by 5
spatial cells. This affects the predicted spatial distribution of organisms, and fishing effort.
27
2. Modelling impacts from development projects
The representation of the proposed reclamation for the BCF and 3rd airport run is limited by the
resolution of the spatial model. Specifically, the grid resolution of the Ecospace model is 2 x 2
km, while the estimated footprint of the proposed reclamation is around 1.3 km2 and 6.5 km2.
Thus the model may over-estimate the effects of the BCF (represented by one of the 2 km x 2 km
square). In contrast, the BCF with 3rd runway scenario is assumed to occupy 2 spatial cells.
3. Compliance with management
The model assumes perfect and instantaneous compliance with all fishery regulations. However,
in reality, non-compliance is likely especially during the time just after the implementation of the
new regulations. In particular, illegal fishing in the existing marine parks and reserve was
reported from our previous survey (Sumaila et al. 2007) and it is likely that such illegal fishing
activities may occur if the various management scenarios were to be implemented.
4. Parameter uncertainty
The simulation models (Ecopath, Ecosim and Ecospace) that we employed in this study required
considerable amounts of biological data, many of which could not be estimated from reliable
local data. In such cases, these parameters were obtained from empirical equations or from areas
that are similar to the Hong Kong ecosystem (see Pitcher et al., 2002). As such, the absolute
values of the estimated results should be viewed with caution. This is particularly the case for the
short-term simulations (5-year) because the uncertainty of the simulation trajectory at short time
scales is particularly high. The results become more reliable when comparing results from

28
simulations that have reached, or are nearly reaching equilibrium. Nonetheless, we believe that
the results should be valid for broad scale comparisons of impacts between management
scenarios.
5. Structural uncertainty of the model
Various structural assumptions and approximation are made in the model given the amount of
data available. Firstly, the Hong Kong marine ecosystem is assumed to be closed (no migrations
or dispersal with systems outside Hong Kong waters). This is probably not completely valid
given the small area of Hong Kong waters and its connectivity with the Pearl River Estuary in the
west and the South China Sea in the east. Dispersal, migration and recruitment from outside
Hong Kong waters may increase the recovery rate of the stock when management scenarios are
implemented. Secondly, detailed ontogenic changes in spatial resource usage (e.g., spawning and
nursery grounds) are not modeled. Thirdly, oceanographic and other physical changes (e.g.,
nutrient inputs) are not represented in the model. In addition, the economic component of the
model is static, i.e., profitability of fishing fleets and prices do not change dynamically with time,
except to account for inflation, as the ecosystem changes. However, the major focus of this study
is to compare the fisheries impacts across scenarios. Therefore, our analysis should be more
robust to these assumptions and approximations.
Concluding remarks
Our study shows that the proposed reclamation projects are expected to have negative socio-
economic impacts on the Hong Kong society. Overall, we predicted that the fishing industry will
suffer losses in landed value and net benefit, over a 20 year time-frame, of HK$129 million and
29
30 million. Moreover, socially, up to 46 fishers will lose their fishing livelihood because of the
projected loss in fisheries catch as a result of the proposed reclamation projects, resulting in the
need to spend $9.5 million and 29.2 million for compensation packages. To retrain these fishers,
about half a million to 1 million HK dollars more would be needed. The estimated total costs of
fisheries impacts under the BCF only project, and the BCF with TRW project amount to HK$ 19
– 28 million to HK$ 31 – 59 million, respectively. The absolute values of our results may be
affected by a number of modelling assumptions, but the trends should be robust to these
uncertainties.
30
References
Christensen, V., Pauly, D., 1992. ECOPATH II - a software for balancing steady-state ecosystem
models and calculating network characteristics. Ecological Modelling 61, 169-185.
Christensen, V., Walters, C.J., 2004. Ecopath with Ecosim: methods, capabilities and limitations.
Ecological Modelling 172, 109-139.
Pitcher, T., Buchary, E. & Trujillo, P., 2002. Spatial simulations of Hong Kong's marine
ecosystem: ecological and economic forecasting of marine protected areas with human-
made reefs. Fisheries Centre Research Reports 10(3).
Polovina, J.J., 1984. Model of a coral reef ecosystem I. The ECOPATH model and its application
to French Frigate Shoals. Coral Reefs 3, 1-11.
Walters, C., Christensen, V., Pauly, D., 1997. Structuring dynamic models of exploited
ecosystem from trophic mass-balance assessment. Reviews in Fish Biology and Fisheries
7, 139-172.
Walters, C., Pauly, D., Christensen, V., 1999. Ecospace: Prediction of mesoscale spatial patterns
in trophic relationships of exploited ecosystems, with emphasis on the impacts of marine
protected areas. Ecosystems 2, 539-554.
Sumaila, U.R., Cheung, W.W.L., and Teh, L. 2007. 'Rebuilding Hong Kong's Marine Fisheries:
An Evaluation of Management Options.' (Fisheries Centre, University of British
Columbia: Vancouver) 118
Walters, C. J., Martell, S.J.D., 2004. Fisheries ecology and management Princeton: Princeton
University Press.

31
Appendix 1: Detail results of analysis
(a) Landed value & net present value of benefits (2011 value)
Landed Values (Loss) Net Benefits (Loss)
BCF only
3rd Runway
only
BCF & 3rd
Runway BCF only
3rd Runway
only
BCF & 3rd
Runway
5 years -$57,749,246 -$11,510,107 -$69,259,353 -$13,282,327 -$2,647,324 -$15,929,651
10 years -$65,835,371 -$25,828,487 -$91,663,858 -$15,142,135 -$5,940,552 -$21,082,687
20 years -$80,671,580 -$47,774,742 -$128,446,322 -$18,554,463 -$10,988,191 -$29,542,654
(b) Number of displaced fishers and compensation required
Displacemen
t of fishers
BCF only (7.5
fishing vessels
with 15 HK
fishers)
3rd Runway
(15.5 fishing
vessels with
31 HK
fishers)
BCF and 3rd
Runway (23
fishing vessels
with 46 HK
fishers)
Re-training -$378,000 -$781,200 -$1,159,200
Full
compensatio
n -$9,522,702 -$10,988,191 -$29,202,951
(C)Total Cost (loss in NPV of net benefits over 20 years and cost of retraining displaced fishers)
BCF only 3rd Runway only BCF & 3rd Runway
-$18,932,463 -$11,796,391 -$30,701,854
(d) Predicted production from HK waters (t) (5-yr average)
5 yr 10 yr 20 yr
Baseline 155,582 160,313 163,994
BCF only 155,246 159,245 163,612
3rd Runway
only 154,875 159,620 163,316
BCF & 3rd
Runway 154,539 158,552 162,934
32
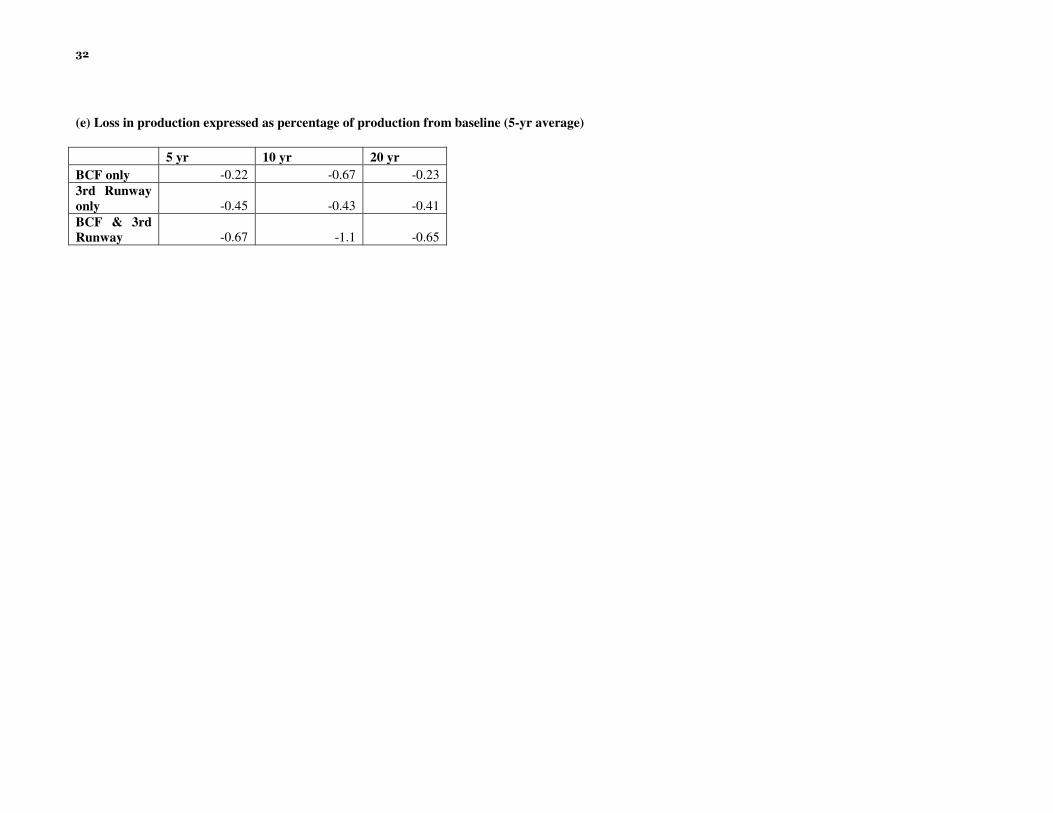
(e) Loss in production expressed as percentage of production from baseline (5-yr average)
5 yr 10 yr 20 yr
BCF only -0.22 -0.67 -0.23
3rd Runway
only -0.45 -0.43 -0.41
BCF & 3rd
Runway -0.67 -1.1 -0.65

33