MODELING STRANDED OIL IN THE RESIDUAL OIL ZONE Koperna_-_Mod_ROZs_SPE Midland.pdf · MODELING...
36
MODELING STRANDED OIL IN MODELING STRANDED OIL IN THE RESIDUAL OIL ZONE THE RESIDUAL OIL ZONE (Oil (Oil - - Water Flushing Water Flushing Hydrodyamics Hydrodyamics ) ) Prepared by: Prepared by: George J. George J. Koperna Koperna Jr. Jr. Advanced Resources International, Inc. Advanced Resources International, Inc. Prepared for: Prepared for: SPE International Conference on CO2 Capture, Storage, and Utiliz SPE International Conference on CO2 Capture, Storage, and Utiliz ation ation “Geological Aspects of CO “Geological Aspects of CO 2 2 Injection in Subsurface Reservoirs Injection in Subsurface Reservoirs Affecting CO Affecting CO 2 2 EOR and CO EOR and CO 2 2 Storage” Storage” November 2, 2009 November 2, 2009 San Diego, California San Diego, California
Transcript of MODELING STRANDED OIL IN THE RESIDUAL OIL ZONE Koperna_-_Mod_ROZs_SPE Midland.pdf · MODELING...
MODELING STRANDED OIL IN MODELING STRANDED OIL IN THE RESIDUAL OIL ZONETHE RESIDUAL OIL ZONE
(Oil(Oil--Water Flushing Water Flushing HydrodyamicsHydrodyamics))
Prepared by:Prepared by:George J. George J. KopernaKoperna Jr.Jr.
Advanced Resources International, Inc.Advanced Resources International, Inc.
Prepared for:Prepared for:SPE International Conference on CO2 Capture, Storage, and UtilizSPE International Conference on CO2 Capture, Storage, and Utilizationation
“Geological Aspects of CO“Geological Aspects of CO22 Injection in Subsurface Reservoirs Injection in Subsurface Reservoirs Affecting COAffecting CO22 EOR and COEOR and CO22 Storage”Storage”
November 2, 2009November 2, 2009San Diego, CaliforniaSan Diego, California
2SPE Midland
Examining the Effects of Hydrodynamics and Reservoir Examining the Effects of Hydrodynamics and Reservoir Properties on Creating a Tilted OWC.Properties on Creating a Tilted OWC.
To explore whether hydrodynamic flow is truly able to To explore whether hydrodynamic flow is truly able to reshape the oil column in a reservoir, resulting in a substantiareshape the oil column in a reservoir, resulting in a substantial l ROZ:ROZ:
1.1. We constructed a hypothetical 2We constructed a hypothetical 2--D cross section of a D cross section of a typical Permian Basin oil reservoir and its underlying typical Permian Basin oil reservoir and its underlying aquifer, and aquifer, and
2.2. Subjected this reservoir to varying horizontal aquifer flow Subjected this reservoir to varying horizontal aquifer flow rates and permeability values to examine the effect of rates and permeability values to examine the effect of these variables on the OWC tilt and the creation of a ROZ. these variables on the OWC tilt and the creation of a ROZ.
Origin and Occurrence of Residual Origin and Occurrence of Residual Oil ZonesOil Zones
3SPE Midland
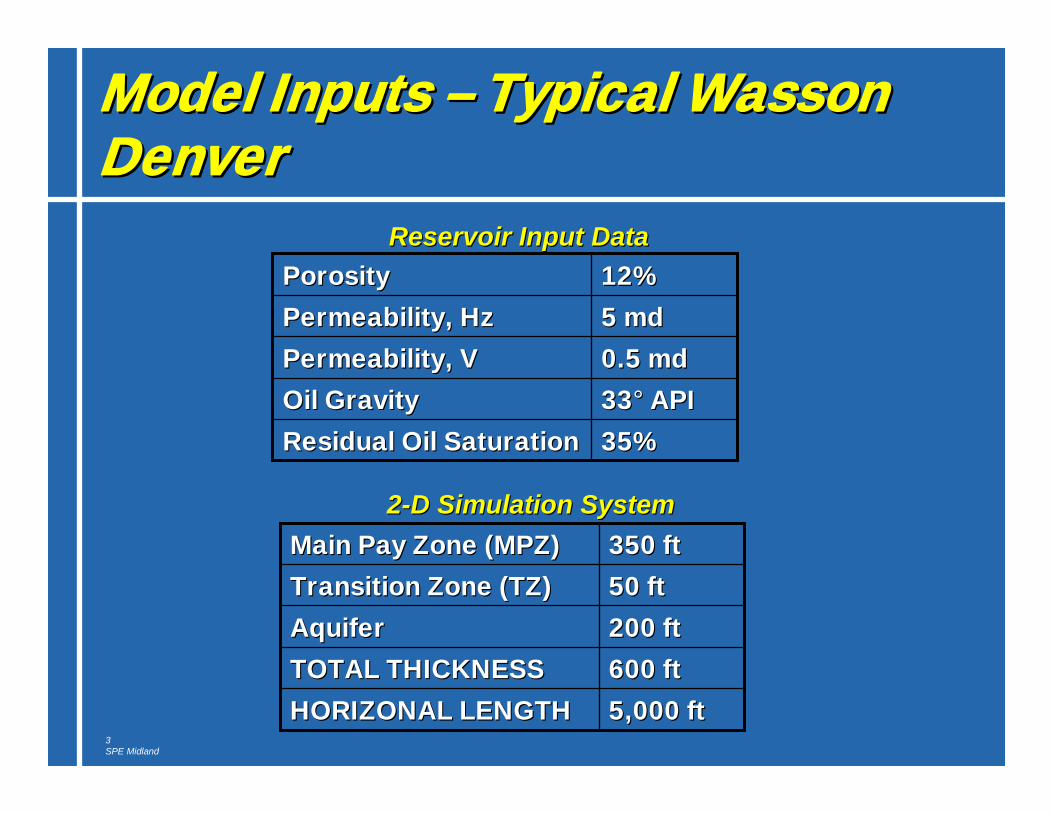
Model Inputs Model Inputs –– Typical Wasson Typical Wasson DenverDenver
3333°° APIAPIOil GravityOil Gravity
35%35%Residual Oil SaturationResidual Oil Saturation
0.5 0.5 mdmdPermeability, VPermeability, V
5 5 mdmdPermeability, HzPermeability, Hz
12%12%PorosityPorosity
600 ft600 ftTOTAL THICKNESSTOTAL THICKNESS
5,000 ft5,000 ftHORIZONAL LENGTHHORIZONAL LENGTH
200 ft200 ftAquiferAquifer
50 ft50 ftTransition Zone (TZ)Transition Zone (TZ)
350 ft350 ftMain Pay Zone (MPZ)Main Pay Zone (MPZ)
Reservoir Input DataReservoir Input Data
22--D Simulation SystemD Simulation System
4SPE Midland
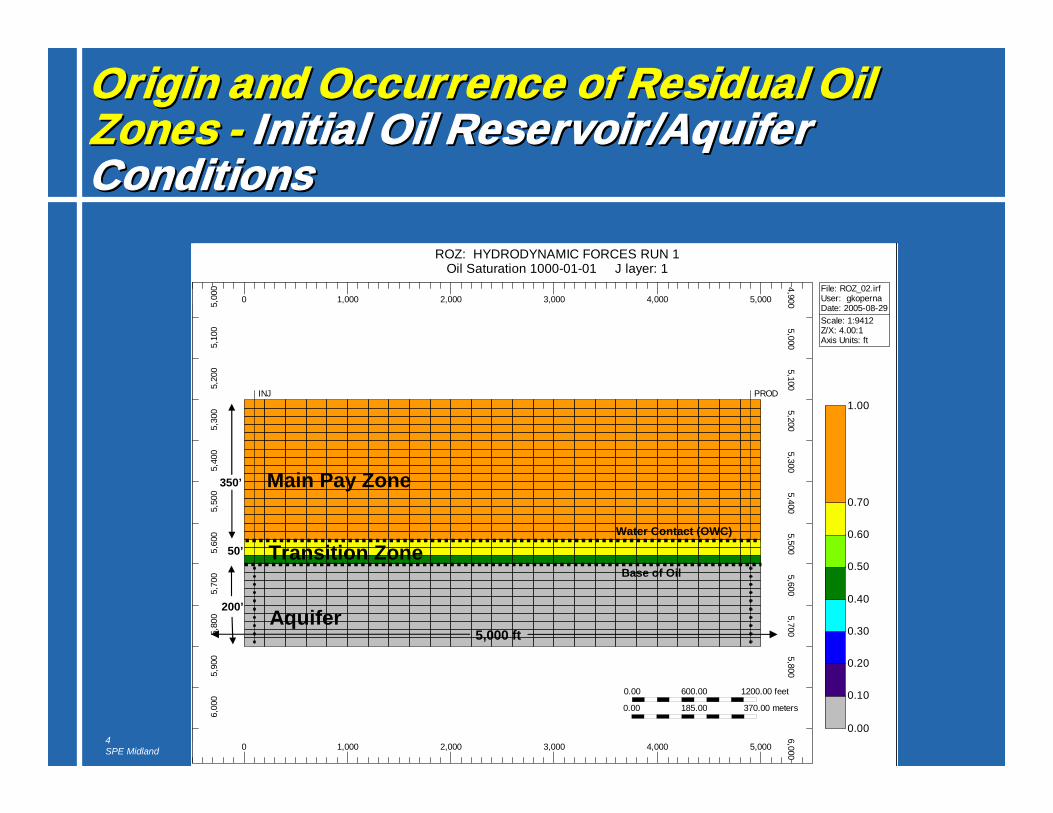
Origin and Occurrence of Residual Oil Origin and Occurrence of Residual Oil Zones Zones -- Initial Oil Reservoir/Aquifer Initial Oil Reservoir/Aquifer ConditionsConditions
INJ PROD
0 1,000 2,000 3,000 4,000 5,000
0 1,000 2,000 3,000 4,000 5,0005,00
05,
100
5,20
05,
300
5,40
05,
500
5,60
05,
700
5,80
05,
900
6,00
0
4,9005,000
5,1005,200
5,3005,400
5,5005,600
5,7005,800
5,9006,000
0.00 600.00 1200.00 feet
0.00 185.00 370.00 meters
File: ROZ_02.irfUser: gkopernaDate: 2005-08-29Scale: 1:9412Z/X: 4.00:1Axis Units: ft
0.00
0.10
0.20
0.30
0.40
0.50
0.60
0.70
1.00
ROZ: HYDRODYNAMIC FORCES RUN 1Oil Saturation 1000-01-01 J layer: 1
Main Pay Zone
Aquifer
Transition Zone
350’
200’
Water Contact (OWC)
Base of Oil
50’
5,000 ft
5SPE Midland
Origin and Occurrence of Residual Origin and Occurrence of Residual Oil Zones Oil Zones -- Effects of Low Hydrodynamic Effects of Low Hydrodynamic Flow on OWC Tilt Flow on OWC Tilt
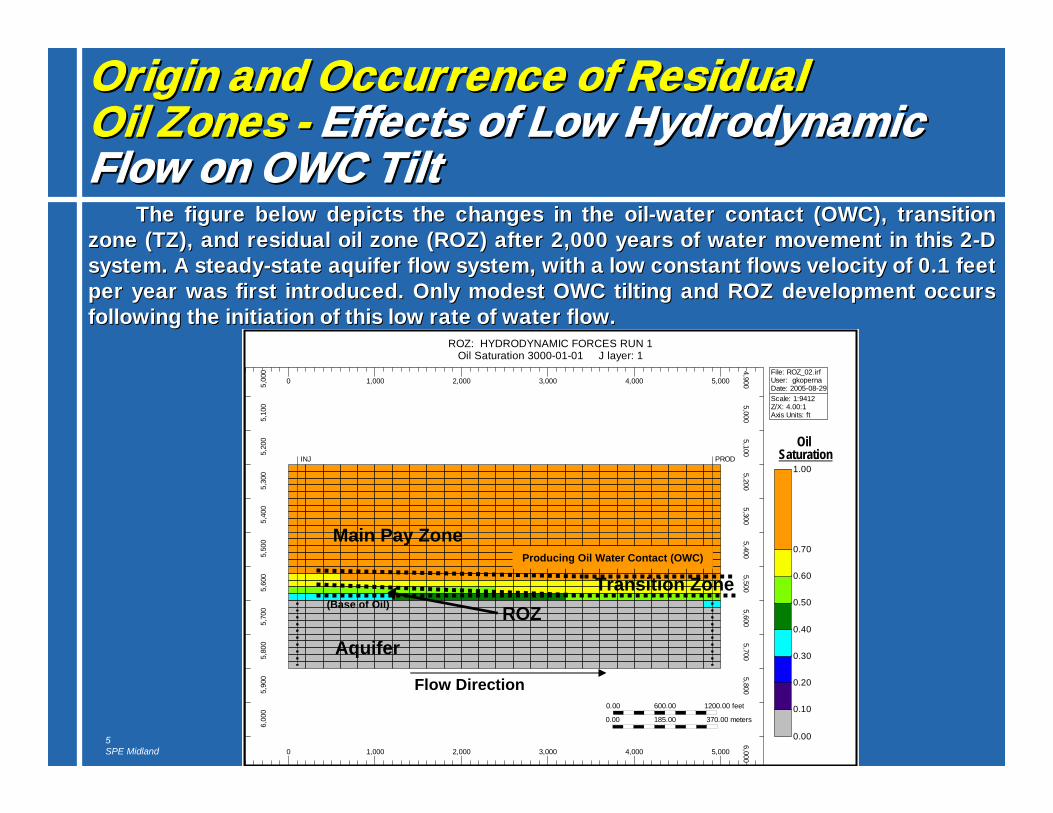
The figure below depicts the changes in the oilThe figure below depicts the changes in the oil--water contact (OWC), transition water contact (OWC), transition zone (TZ), and residual oil zone (ROZ) after 2,000 years of watezone (TZ), and residual oil zone (ROZ) after 2,000 years of water movement in this 2r movement in this 2--D D system. A steadysystem. A steady--state aquifer flow system, with a low constant flows velocity ofstate aquifer flow system, with a low constant flows velocity of 0.1 feet 0.1 feet per year was first introduced. Only modest OWC tilting and ROZ dper year was first introduced. Only modest OWC tilting and ROZ development occurs evelopment occurs following the initiation of this low rate of water flow.following the initiation of this low rate of water flow.
INJ PROD
0 1,000 2,000 3,000 4,000 5,000
0 1,000 2,000 3,000 4,000 5,0005,00
05,
100
5,20
05,
300
5,40
05,
500
5,60
05,
700
5,80
05,
900
6,00
0
4,9005,000
5,1005,200
5,3005,400
5,5005,600
5,7005,800
5,9006,000
0.00 600.00 1200.00 feet
0.00 185.00 370.00 meters
File: ROZ_02.irfUser: gkopernaDate: 2005-08-29Scale: 1:9412Z/X: 4.00:1Axis Units: ft
0.00
0.10
0.20
0.30
0.40
0.50
0.60
0.70
1.00
ROZ: HYDRODYNAMIC FORCES RUN 1Oil Saturation 3000-01-01 J layer: 1
Main Pay Zone
Aquifer
Transition ZoneROZ
Flow Direction
(Base of Oil)
Producing Oil Water Contact (OWC)
Oil Saturation
6SPE Midland
Origin and Occurrence of Residual Origin and Occurrence of Residual Oil Zones Oil Zones -- Effects of Higher HydrodynamicEffects of Higher HydrodynamicFlow on OWC TiltFlow on OWC Tilt
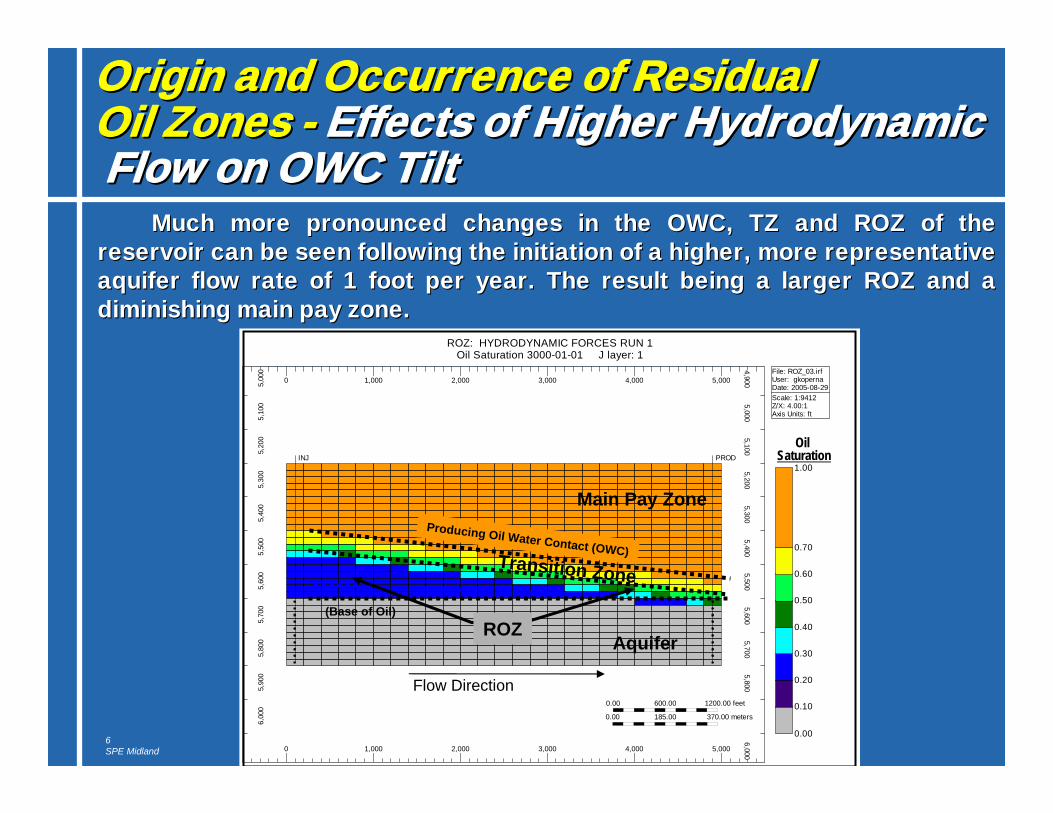
Much more pronounced changes in the OWC, TZ and ROZ of the Much more pronounced changes in the OWC, TZ and ROZ of the reservoir can be seen following the initiation of a higher, morereservoir can be seen following the initiation of a higher, more representative representative aquifer flow rate of 1 foot per year. The result being a larger aquifer flow rate of 1 foot per year. The result being a larger ROZ and a ROZ and a diminishing main pay zone.diminishing main pay zone.
INJ PROD
0 1,000 2,000 3,000 4,000 5,000
0 1,000 2,000 3,000 4,000 5,0005,00
05,
100
5,20
05,
300
5,40
05,
500
5,60
05,
700
5,80
05,
900
6,00
0
4,9005,000
5,1005,200
5,3005,400
5,5005,600
5,7005,800
5,9006,000
0.00 600.00 1200.00 feet
0.00 185.00 370.00 meters
File: ROZ_03.irfUser: gkopernaDate: 2005-08-29Scale: 1:9412Z/X: 4.00:1Axis Units: ft
0.00
0.10
0.20
0.30
0.40
0.50
0.60
0.70
1.00
ROZ: HYDRODYNAMIC FORCES RUN 1Oil Saturation 3000-01-01 J layer: 1
Main Pay Zone
Aquifer
Transition Zone
Flow Direction
(Base of Oil)
Producing Oil Water Contact (OWC)
ROZ
Oil Saturation
7SPE Midland
Origin and Occurrence of Residual Oil Origin and Occurrence of Residual Oil Zones Zones -- Effects of Higher Hydrodynamic Effects of Higher Hydrodynamic Flow on OWC TiltFlow on OWC Tilt
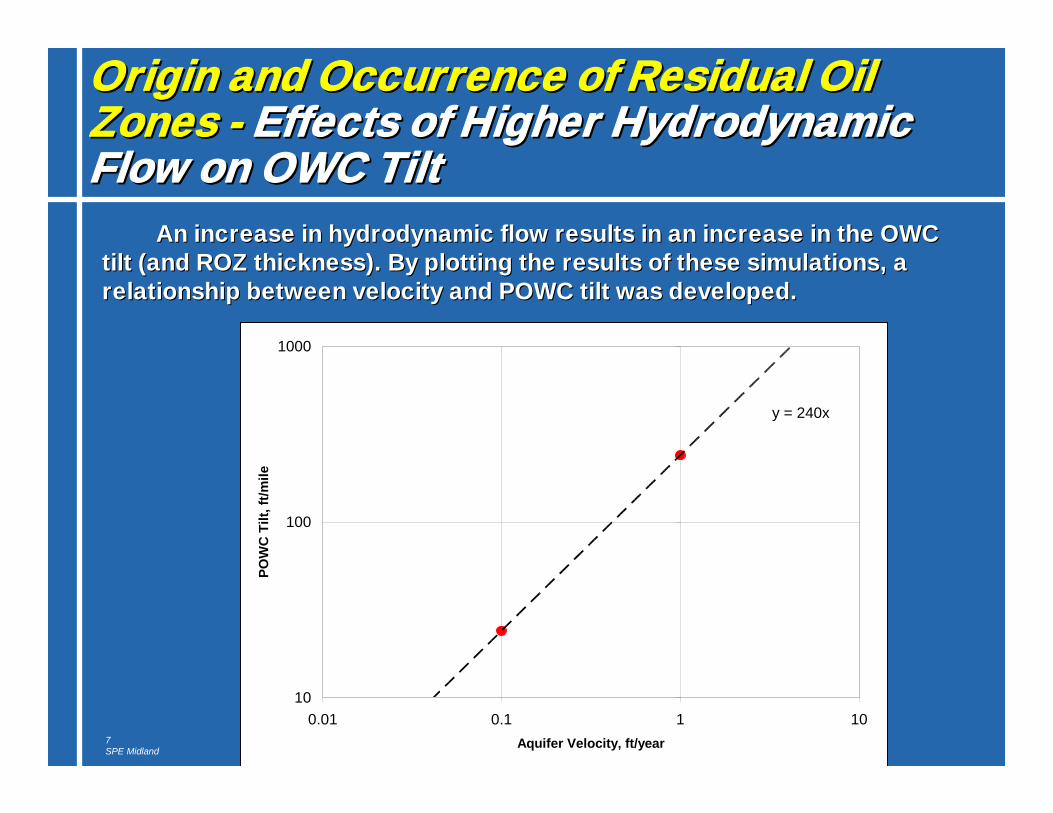
An increase in hydrodynamic flow results in an increase in the OAn increase in hydrodynamic flow results in an increase in the OWC WC tilt (and ROZ thickness). By plotting the results of these simultilt (and ROZ thickness). By plotting the results of these simulations, a ations, a relationship between velocity and POWC tilt was developed.relationship between velocity and POWC tilt was developed.
y = 240x
10
100
1000
0.01 0.1 1 10Aquifer Velocity, ft/year
POW
C T
ilt, f
t/mile
8SPE Midland
Origin and Occurrence of Residual Oil Origin and Occurrence of Residual Oil Zones Zones -- Effects of Aquifer Permeability Effects of Aquifer Permeability on OWC Tilton OWC Tilt
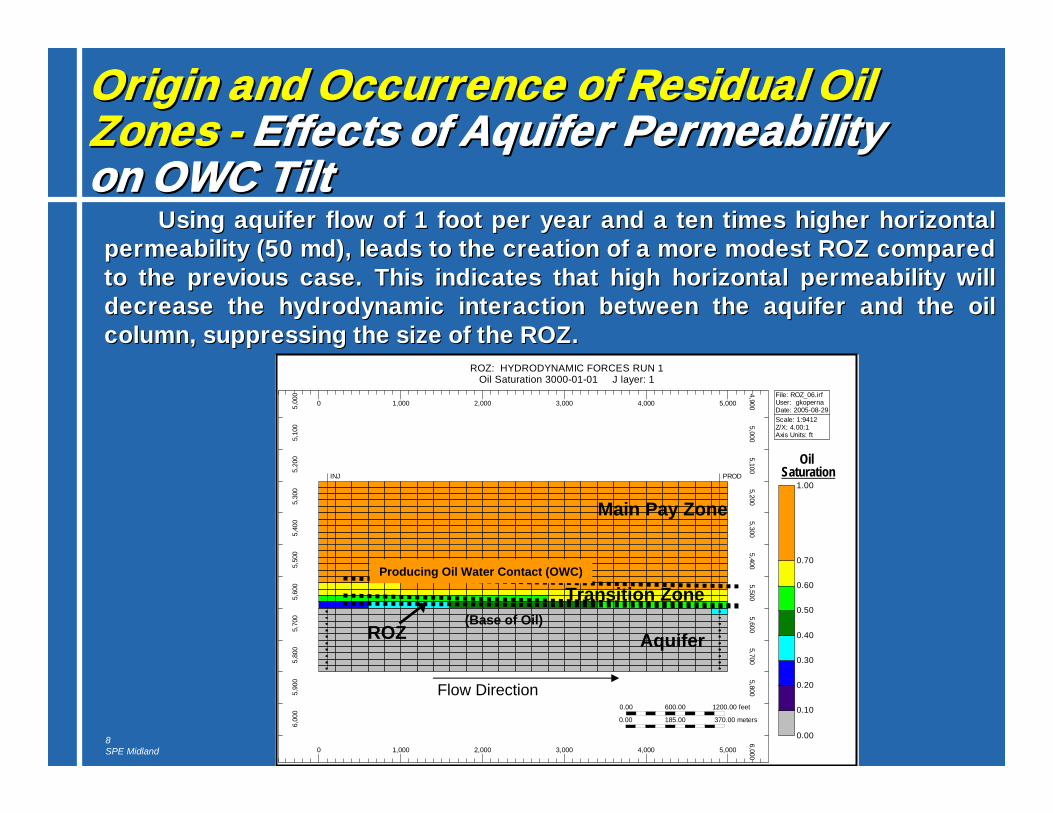
Using aquifer flow of 1 foot per year and a ten times higher horUsing aquifer flow of 1 foot per year and a ten times higher horizontal izontal permeability (50 permeability (50 mdmd), leads to the creation of a more modest ROZ compared ), leads to the creation of a more modest ROZ compared to the previous case. This indicates that high horizontal permeato the previous case. This indicates that high horizontal permeability will bility will decrease the hydrodynamic interaction between the aquifer and thdecrease the hydrodynamic interaction between the aquifer and the oil e oil column, suppressing the size of the ROZ.column, suppressing the size of the ROZ.
INJ PROD
0 1,000 2,000 3,000 4,000 5,000
0 1,000 2,000 3,000 4,000 5,0005,00
05,
100
5,20
05,
300
5,40
05,
500
5,60
05,
700
5,80
05,
900
6,00
04,900
5,0005,100
5,2005,300
5,4005,500
5,6005,700
5,8005,900
6,000
0.00 600.00 1200.00 feet
0.00 185.00 370.00 meters
File: ROZ_06.irfUser: gkopernaDate: 2005-08-29Scale: 1:9412Z/X: 4.00:1Axis Units: ft
0.00
0.10
0.20
0.30
0.40
0.50
0.60
0.70
1.00
ROZ: HYDRODYNAMIC FORCES RUN 1Oil Saturation 3000-01-01 J layer: 1
Flow Direction
Main Pay Zone
Aquifer
Transition Zone
ROZ(Base of Oil)
Producing Oil Water Contact (OWC)
Oil Saturation
9SPE Midland
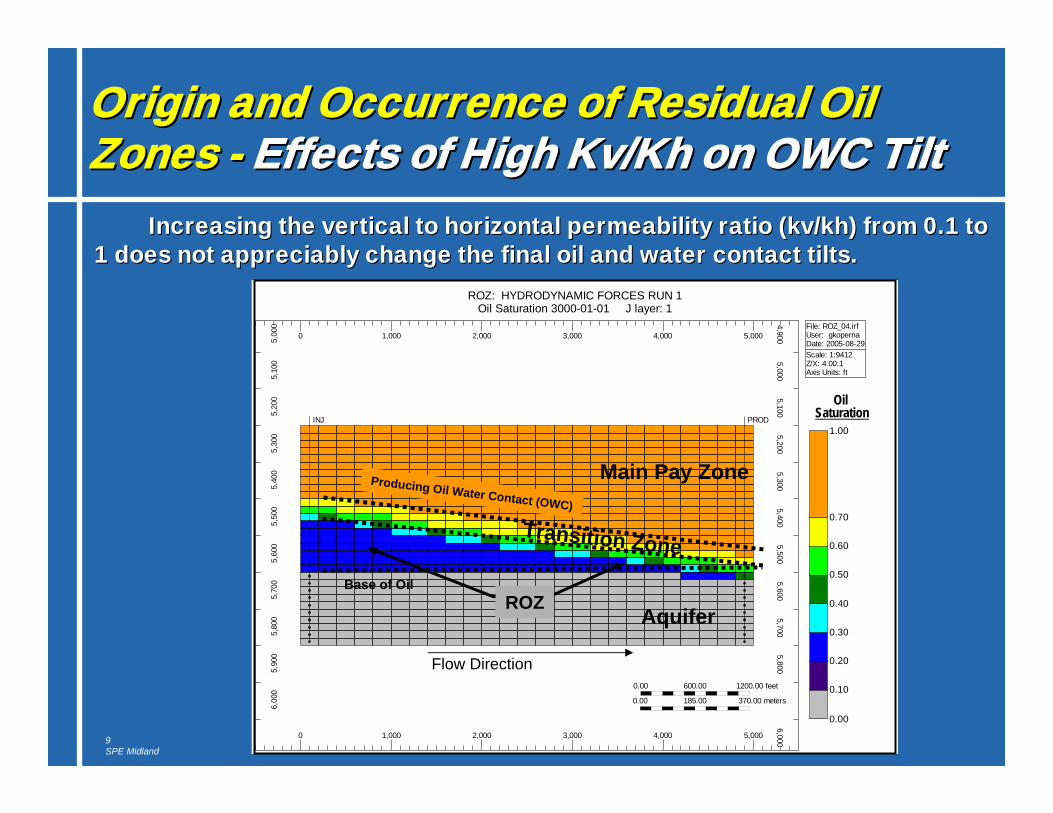
Origin and Occurrence of Residual Oil Origin and Occurrence of Residual Oil Zones Zones -- Effects of High Effects of High Kv/KhKv/Kh on OWC Tilton OWC Tilt
Increasing the vertical to horizontal permeability ratio (Increasing the vertical to horizontal permeability ratio (kv/khkv/kh) from 0.1 to ) from 0.1 to 1 does not appreciably change the final oil and water contact ti1 does not appreciably change the final oil and water contact tilts.lts.
INJ PROD
0 1,000 2,000 3,000 4,000 5,000
0 1,000 2,000 3,000 4,000 5,0005,00
05,
100
5,20
05,
300
5,40
05,
500
5,60
05,
700
5,80
05,
900
6,00
04,900
5,0005,100
5,2005,300
5,4005,500
5,6005,700
5,8005,900
6,000
0.00 600.00 1200.00 feet
0.00 185.00 370.00 meters
File: ROZ_04.irfUser: gkopernaDate: 2005-08-29Scale: 1:9412Z/X: 4.00:1Axis Units: ft
0.00
0.10
0.20
0.30
0.40
0.50
0.60
0.70
1.00
ROZ: HYDRODYNAMIC FORCES RUN 1Oil Saturation 3000-01-01 J layer: 1
Main Pay Zone
Aquifer
Transition Zone
Flow Direction
Base of Oil
Producing Oil Water Contact (OWC)
ROZ
Oil Saturation
10SPE Midland
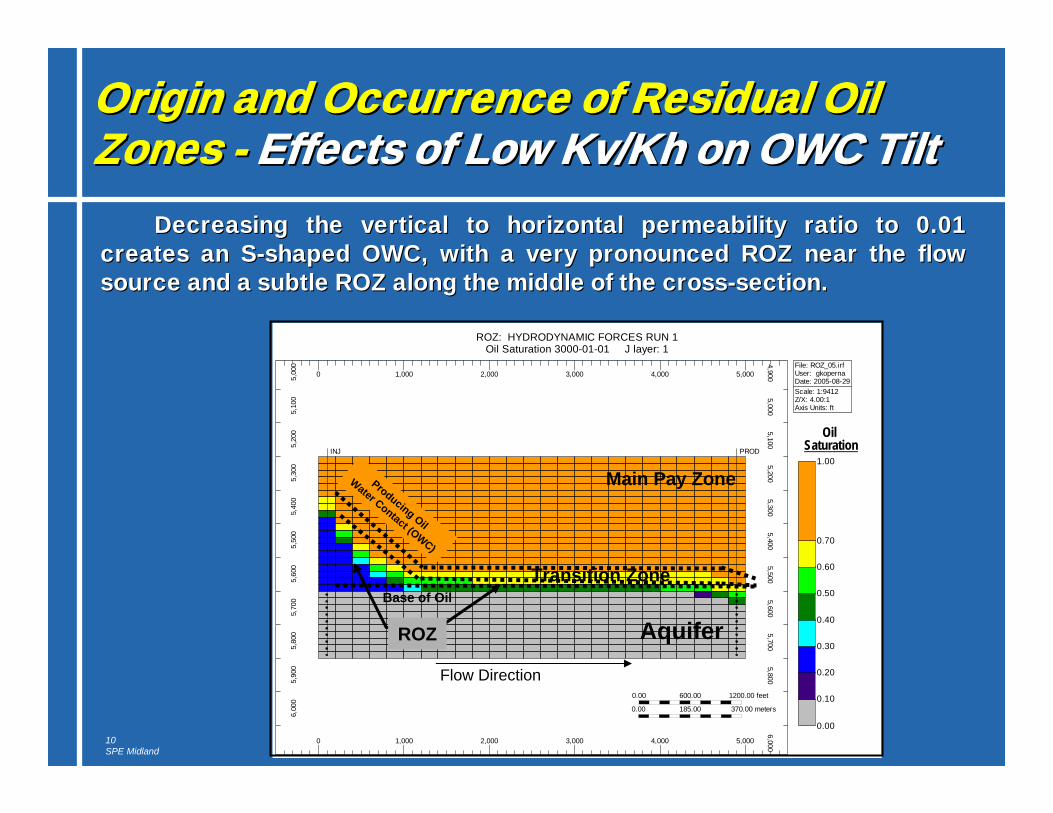
Origin and Occurrence of Residual Oil Origin and Occurrence of Residual Oil Zones Zones -- Effects of Low Effects of Low Kv/KhKv/Kh on OWC Tilton OWC Tilt
Decreasing the vertical to horizontal permeability ratio to 0.01Decreasing the vertical to horizontal permeability ratio to 0.01creates an Screates an S--shaped OWC, with a very pronounced ROZ near the flow shaped OWC, with a very pronounced ROZ near the flow source and a subtle ROZ along the middle of the crosssource and a subtle ROZ along the middle of the cross--section. section.
INJ PROD
0 1,000 2,000 3,000 4,000 5,000
0 1,000 2,000 3,000 4,000 5,0005,00
05,
100
5,20
05,
300
5,40
05,
500
5,60
05,
700
5,80
05,
900
6,00
04,900
5,0005,100
5,2005,300
5,4005,500
5,6005,700
5,8005,900
6,000
0.00 600.00 1200.00 feet
0.00 185.00 370.00 meters
File: ROZ_05.irfUser: gkopernaDate: 2005-08-29Scale: 1:9412Z/X: 4.00:1Axis Units: ft
0.00
0.10
0.20
0.30
0.40
0.50
0.60
0.70
1.00
ROZ: HYDRODYNAMIC FORCES RUN 1Oil Saturation 3000-01-01 J layer: 1
Main Pay Zone
Aquifer
Transition Zone
Flow Direction
Base of Oil
Producing Oil
Water Contact (OWC)
ROZ
Oil Saturation
Modeling Stranded Oil in Modeling Stranded Oil in the Residual Oil Zonethe Residual Oil Zone
2. The Permian Basin2. The Permian Basin
12SPE Midland
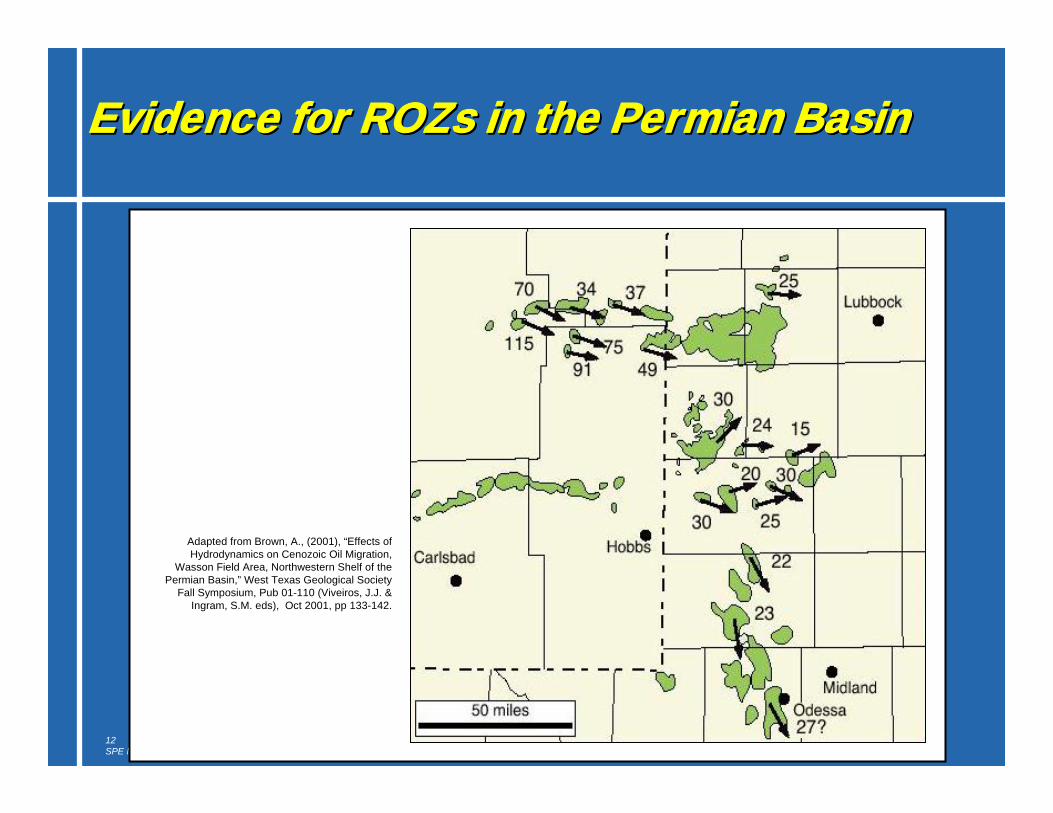
Adapted from Brown, A., (2001), “Effects of Hydrodynamics on Cenozoic Oil Migration,
Wasson Field Area, Northwestern Shelf of the Permian Basin,” West Texas Geological Society
Fall Symposium, Pub 01-110 (Viveiros, J.J. & Ingram, S.M. eds), Oct 2001, pp 133-142.
Evidence for Evidence for ROZsROZs in the Permian Basinin the Permian Basin
13SPE Midland
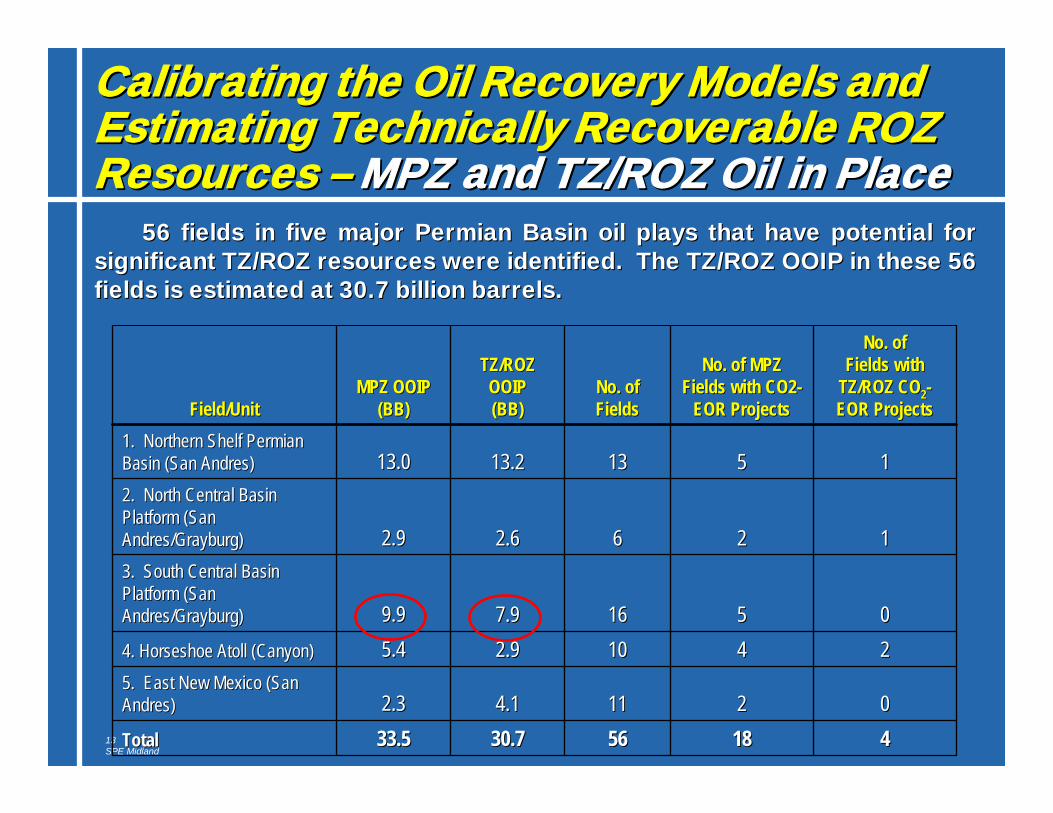
33.533.52.32.3
5.45.49.99.9
2.92.9
13.013.0
MPZ OOIP MPZ OOIP (BB)(BB)
441818565630.730.7TotalTotal
002211114.14.15. East New Mexico (San 5. East New Mexico (San Andres)Andres)
224410102.92.94. Horseshoe Atoll (Canyon)4. Horseshoe Atoll (Canyon)
005516167.97.9
3. South Central Basin 3. South Central Basin Platform (San Platform (San Andres/Andres/GrayburgGrayburg))
1122662.62.6
2. North Central Basin 2. North Central Basin Platform (San Platform (San Andres/Andres/GrayburgGrayburg))
1155131313.213.21. Northern Shelf Permian 1. Northern Shelf Permian Basin (San Andres)Basin (San Andres)
No. of No. of Fields with Fields with
TZ/ROZ COTZ/ROZ CO22--EOR ProjectsEOR Projects
No. of MPZ No. of MPZ Fields with CO2Fields with CO2--
EOR ProjectsEOR ProjectsNo. ofNo. ofFieldsFields
TZ/ROZ TZ/ROZ OOIPOOIP(BB)(BB)Field/UnitField/Unit
56 fields in five major Permian Basin oil plays that have potent56 fields in five major Permian Basin oil plays that have potential for ial for significant TZ/ROZ resources were identified. The TZ/ROZ OOIP isignificant TZ/ROZ resources were identified. The TZ/ROZ OOIP in these 56 n these 56 fields is estimated at 30.7 billion barrels.fields is estimated at 30.7 billion barrels.
Calibrating the Oil Recovery Models and Calibrating the Oil Recovery Models and Estimating Technically Recoverable ROZ Estimating Technically Recoverable ROZ Resources Resources –– MPZ and TZ/ROZ Oil in PlaceMPZ and TZ/ROZ Oil in Place
14SPE Midland
Calibrating the Oil Recovery Models and Calibrating the Oil Recovery Models and Estimating Technically Recoverable ROZ Estimating Technically Recoverable ROZ Resources Resources -- Background on COBackground on CO22--PROPHETPROPHET
The The COCO22--PROPHET PROPHET model was developed by the Texaco Exploration model was developed by the Texaco Exploration and Production Technology Department (EPTD) as part of the DOE Cand Production Technology Department (EPTD) as part of the DOE Class I lass I costcost--share program.share program.
In its simplest form, this model generates streamlines for fluidIn its simplest form, this model generates streamlines for fluid flow flow between injection and production wells, and then uses finite difbetween injection and production wells, and then uses finite difference ference methods to determine oil displacement and recovery calculations methods to determine oil displacement and recovery calculations along the along the established streamlines. Data input requirements are less demandestablished streamlines. Data input requirements are less demanding and ing and computational times are much shorter than when using fullcomputational times are much shorter than when using full--scale reservoir scale reservoir simulation. simulation.
Input requirements for Input requirements for COCO22--PROPHET PROPHET can generally be obtained or can generally be obtained or calculated using engineering formulations. Key input parameters calculated using engineering formulations. Key input parameters impacting impacting oil recovery include:oil recovery include:
1. Residual oil saturation,1. Residual oil saturation,2. Dykstra2. Dykstra--Parsons coefficient,Parsons coefficient,3. Oil and water viscosity,3. Oil and water viscosity,4. Reservoir pressure and temperature, and4. Reservoir pressure and temperature, and5. Minimum miscibility pressure.5. Minimum miscibility pressure.
15SPE Midland
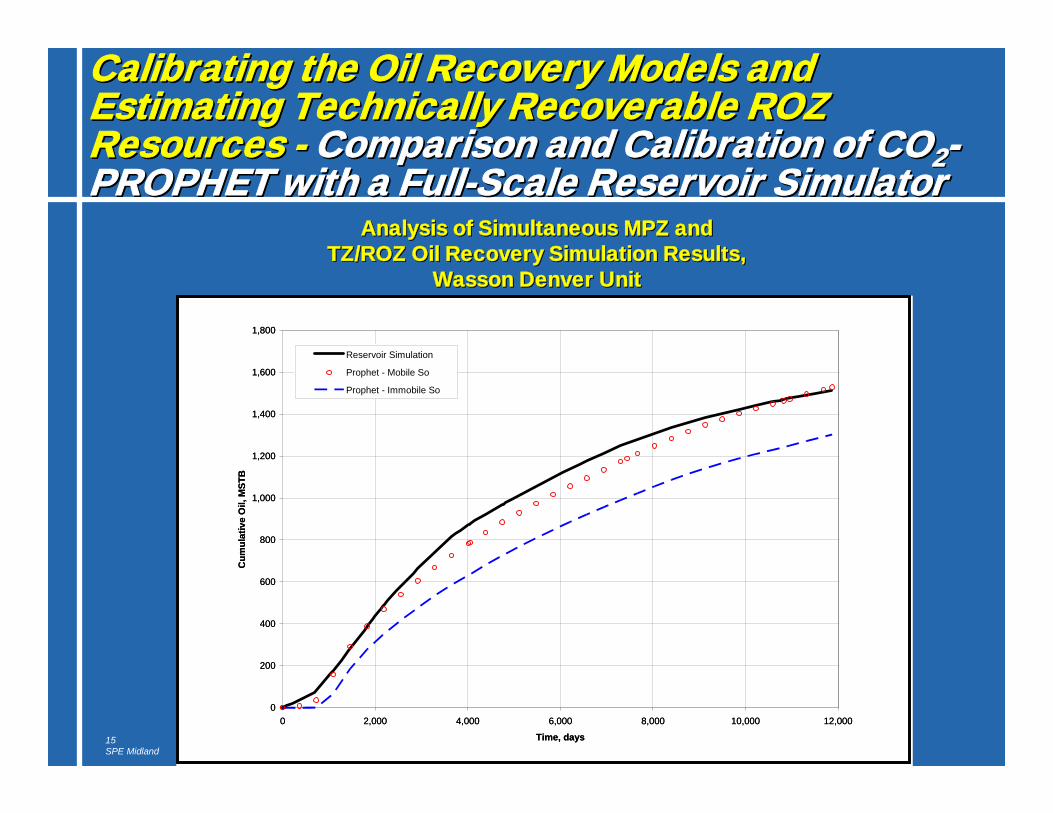
Calibrating the Oil Recovery Models and Calibrating the Oil Recovery Models and Estimating Technically Recoverable ROZ Estimating Technically Recoverable ROZ Resources Resources -- Comparison and Calibration of COComparison and Calibration of CO22--PROPHET with a FullPROPHET with a Full--Scale Reservoir SimulatorScale Reservoir Simulator
Analysis of Simultaneous MPZ and Analysis of Simultaneous MPZ and TZ/ROZ Oil Recovery Simulation Results, TZ/ROZ Oil Recovery Simulation Results,
Wasson Denver UnitWasson Denver Unit
0
200
400
600
800
1,000
1,200
1,400
1,600
1,800
0 2,000 4,000 6,000 8,000 10,000 12,000
Time, days
Cum
ulat
ive
Oil,
MST
B
Reservoir Simulation
Prophet - Mobile So
Prophet - Immobile So
0
200
400
600
800
1,000
1,200
1,400
1,600
1,800
0 2,000 4,000 6,000 8,000 10,000 12,000
Time, days
Cum
ulat
ive
Oil,
MST
B
Reservoir Simulation
Prophet - Mobile So
Prophet - Immobile So
16SPE Midland
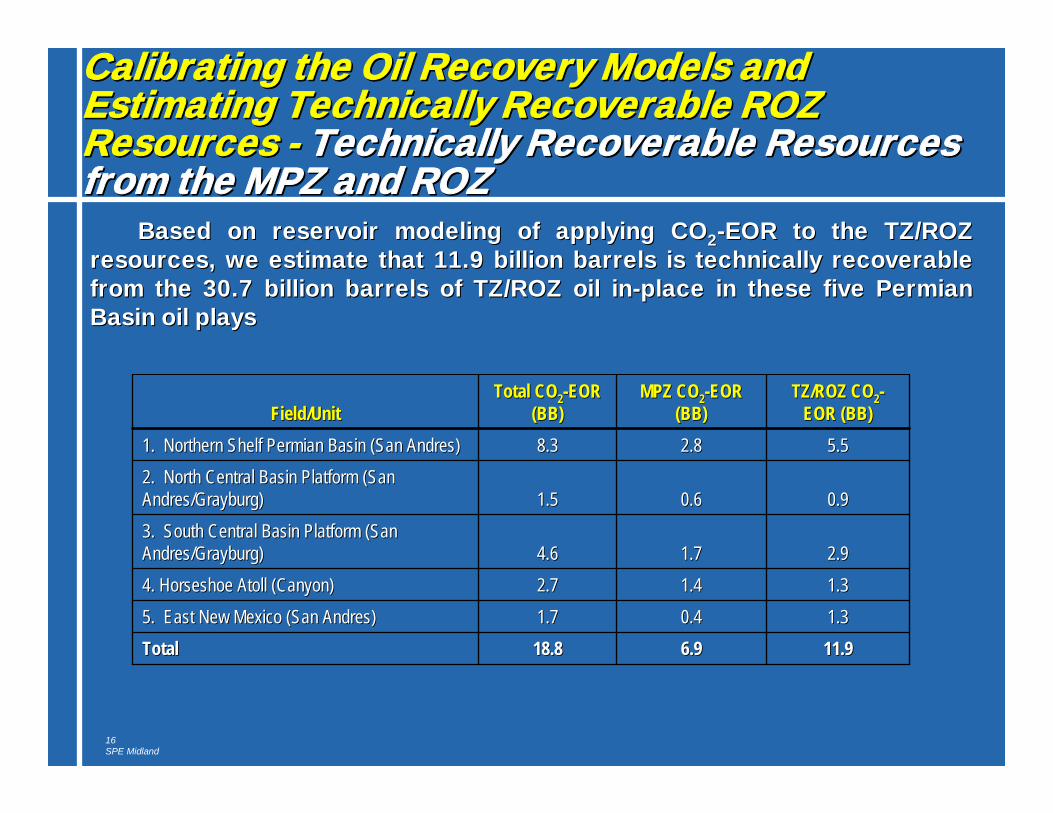
11.911.96.96.918.818.8TotalTotal1.31.30.40.41.71.75. East New Mexico (San Andres) 5. East New Mexico (San Andres) 1.31.31.41.42.72.74. Horseshoe Atoll (Canyon)4. Horseshoe Atoll (Canyon)2.92.91.71.74.64.6
3. South Central Basin Platform (San 3. South Central Basin Platform (San Andres/Andres/GrayburgGrayburg))
0.90.90.60.61.51.52. North Central Basin Platform (San 2. North Central Basin Platform (San Andres/Andres/GrayburgGrayburg))
5.55.52.82.88.38.31. Northern Shelf Permian Basin (San Andres)1. Northern Shelf Permian Basin (San Andres)
TZ/ROZ COTZ/ROZ CO22--EOR (BB)EOR (BB)
MPZ COMPZ CO22--EOR EOR (BB)(BB)
Total COTotal CO22--EOR EOR (BB)(BB)Field/UnitField/Unit
Based on reservoir modeling of applying COBased on reservoir modeling of applying CO22--EOR to the TZ/ROZ EOR to the TZ/ROZ resources, we estimate that 11.9 billion barrels is technically resources, we estimate that 11.9 billion barrels is technically recoverable recoverable from the 30.7 billion barrels of TZ/ROZ oil infrom the 30.7 billion barrels of TZ/ROZ oil in--place in these five Permian place in these five Permian Basin oil playsBasin oil plays
Calibrating the Oil Recovery Models and Calibrating the Oil Recovery Models and Estimating Technically Recoverable ROZ Estimating Technically Recoverable ROZ Resources Resources -- Technically Recoverable Resources Technically Recoverable Resources from the MPZ and ROZfrom the MPZ and ROZ
17SPE Midland
Economically Recoverable Oil Resources in Economically Recoverable Oil Resources in Transition and Residual Oil Zones Transition and Residual Oil Zones -- Basic Basic Economic ModelEconomic Model
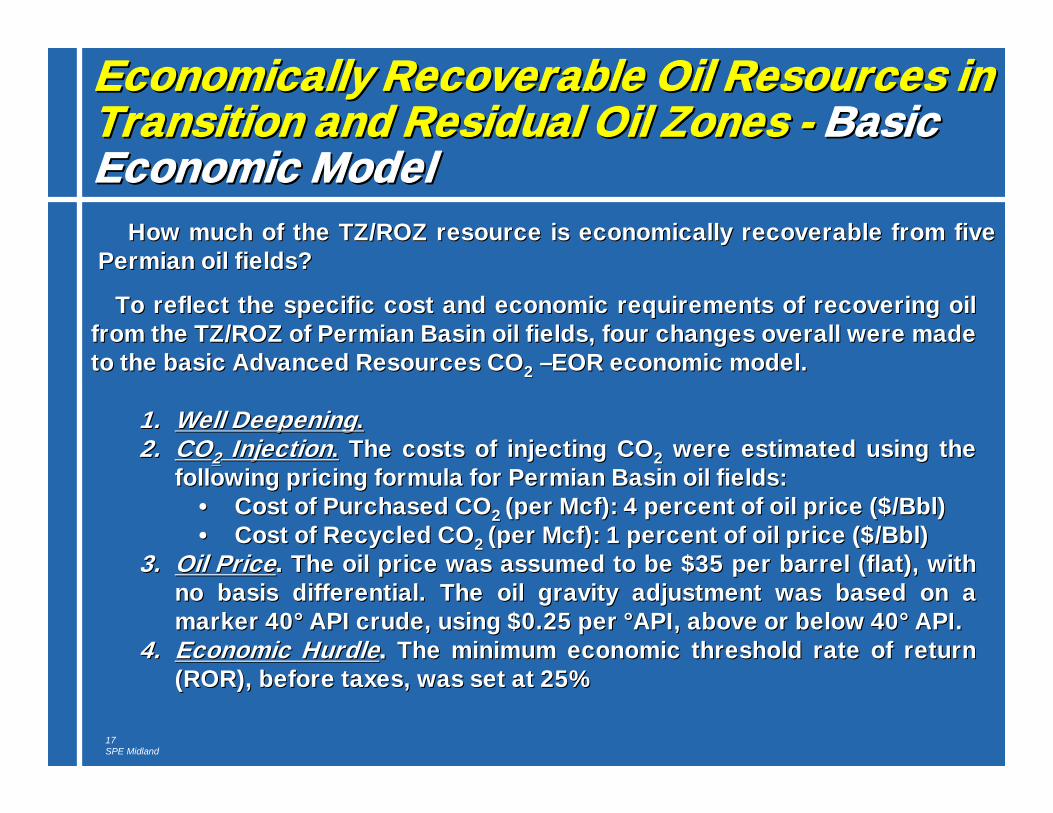
How much of the TZ/ROZ resource is economically recoverableHow much of the TZ/ROZ resource is economically recoverable from five from five Permian oil fields?Permian oil fields?
To reflect the specific cost and economic requirements of recoTo reflect the specific cost and economic requirements of recovering oil vering oil from the TZ/ROZ of Permian Basin oil fields, four changes overalfrom the TZ/ROZ of Permian Basin oil fields, four changes overall were made l were made to the basic Advanced Resources COto the basic Advanced Resources CO22 ––EOR economic model.EOR economic model.
1.1. Well DeepeningWell Deepening..2.2. COCO22 InjectionInjection.. The costs of injecting COThe costs of injecting CO22 were estimated using the were estimated using the
following pricing formula for Permian Basin oil fields:following pricing formula for Permian Basin oil fields:•• Cost of Purchased COCost of Purchased CO2 2 (per (per McfMcf): 4 percent of oil price ($/Bbl)): 4 percent of oil price ($/Bbl)•• Cost of Recycled COCost of Recycled CO2 2 (per (per McfMcf): 1 percent of oil price ($/Bbl)): 1 percent of oil price ($/Bbl)
3.3. Oil PriceOil Price. . The oil price was assumed to be $35 per barrel (flat), with The oil price was assumed to be $35 per barrel (flat), with no basis differential. The oil gravity adjustment was based on ano basis differential. The oil gravity adjustment was based on amarker 40° API crude, using $0.25 per °API, above or below 40° Amarker 40° API crude, using $0.25 per °API, above or below 40° API.PI.
4.4. Economic HurdleEconomic Hurdle. . The minimum economic threshold rate of return The minimum economic threshold rate of return (ROR), before taxes, was set at 25%(ROR), before taxes, was set at 25%
18SPE Midland
Economically Recoverable Oil Resources Economically Recoverable Oil Resources in Transition and Residual Oil Zones in Transition and Residual Oil Zones --Economically Recoverable ResourcesEconomically Recoverable Resources
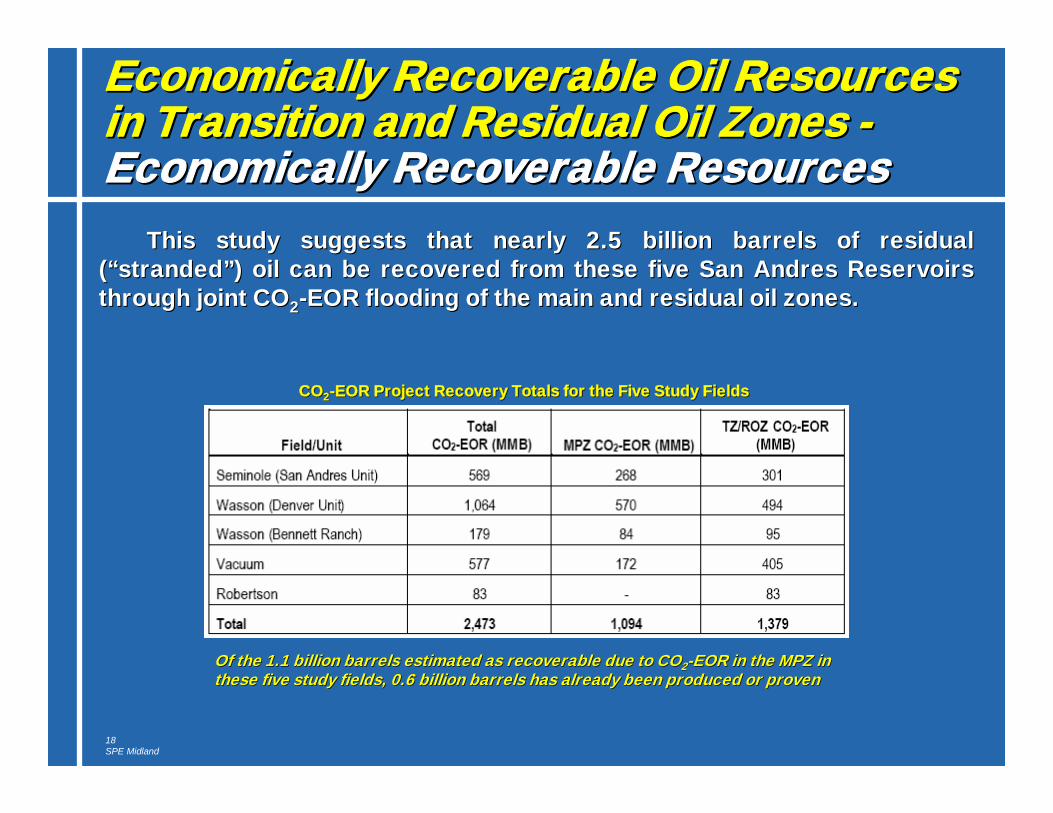
COCO22--EOR Project Recovery Totals for the Five Study FieldsEOR Project Recovery Totals for the Five Study Fields
This study suggests that nearly 2.5 billion barrels of residual This study suggests that nearly 2.5 billion barrels of residual (“stranded”) oil can be recovered from these five San Andres Res(“stranded”) oil can be recovered from these five San Andres Reservoirs ervoirs through joint COthrough joint CO22--EOR flooding of the main and residual oil zones.EOR flooding of the main and residual oil zones.
Of the 1.1 billion barrels estimated as recoverable due to COOf the 1.1 billion barrels estimated as recoverable due to CO22--EOR in the MPZ in EOR in the MPZ in these five study fields, 0.6 billion barrels has already been prthese five study fields, 0.6 billion barrels has already been produced or provenoduced or proven
19SPE Midland
Economically Recoverable Oil Resources in Economically Recoverable Oil Resources in Transition and Residual Oil Zones Transition and Residual Oil Zones --Marginal Economic AnalysisMarginal Economic Analysis
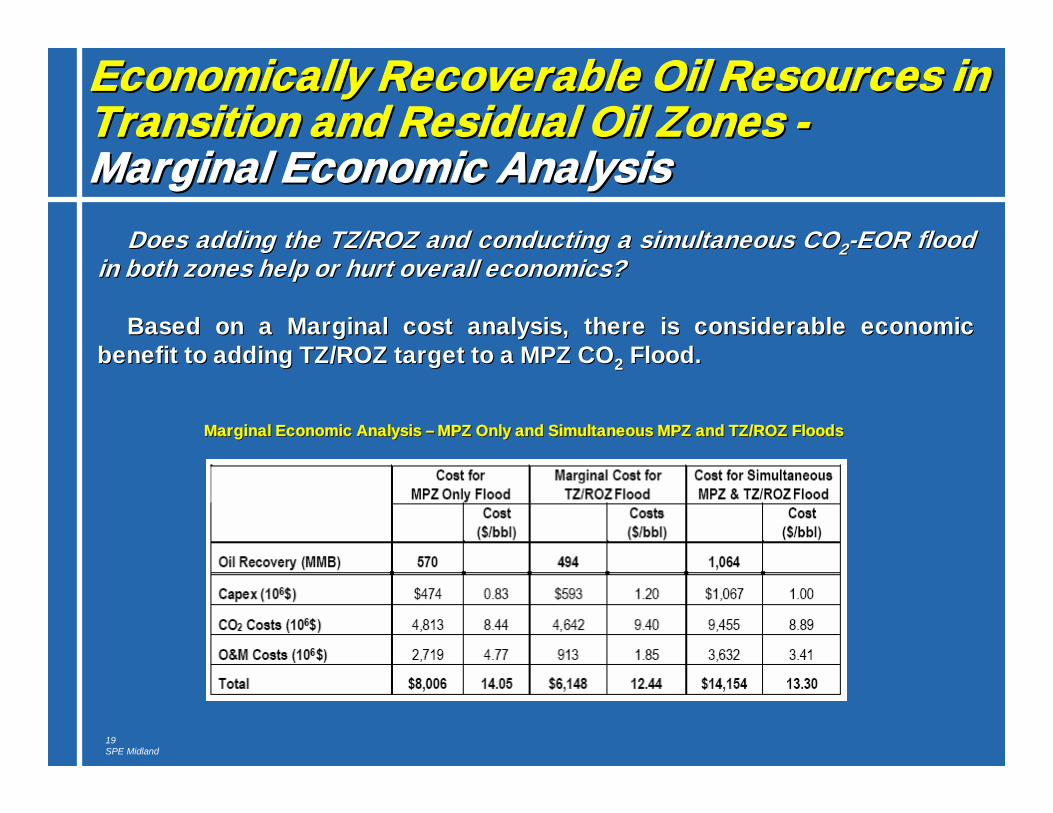
Marginal Economic Analysis Marginal Economic Analysis –– MPZ Only and Simultaneous MPZ and TZ/ROZ FloodsMPZ Only and Simultaneous MPZ and TZ/ROZ Floods
Does adding the TZ/ROZ and conducting a simultaneous CODoes adding the TZ/ROZ and conducting a simultaneous CO22--EOR flood EOR flood in both zones help or hurt overall economics?in both zones help or hurt overall economics?
Based on a Marginal cost analysis, there is considerable ecBased on a Marginal cost analysis, there is considerable economic onomic benefit to adding TZ/ROZ target to a MPZ CObenefit to adding TZ/ROZ target to a MPZ CO22 Flood.Flood.

Modeling Stranded Oil in Modeling Stranded Oil in the Residual Oil Zonethe Residual Oil Zone
3. The Williston Basin3. The Williston Basin
21SPE Midland
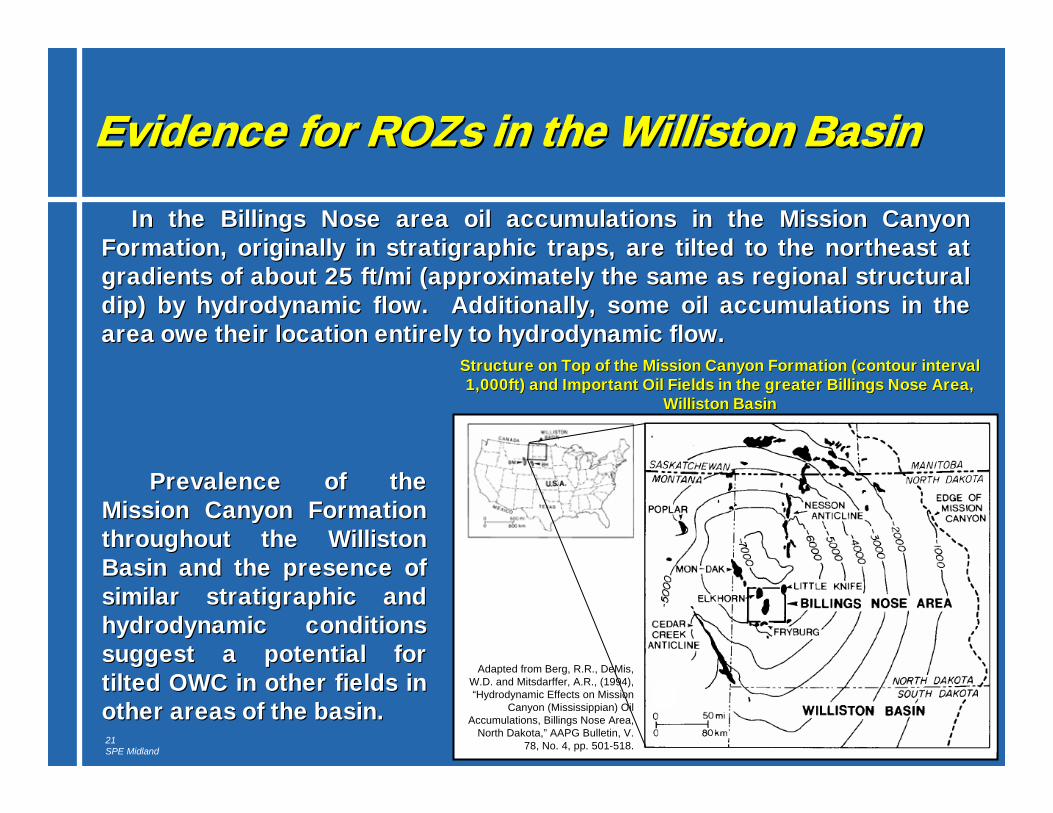
In the Billings Nose area oil accumulations in the Mission In the Billings Nose area oil accumulations in the Mission Canyon Canyon Formation, originally in Formation, originally in stratigraphicstratigraphic traps, are tilted to the northeast at traps, are tilted to the northeast at gradients of about 25 ft/mi (approximately the same as regional gradients of about 25 ft/mi (approximately the same as regional structural structural dip) by hydrodynamic flow. Additionally, some oil accumulationsdip) by hydrodynamic flow. Additionally, some oil accumulations in the in the area owe their location entirely to hydrodynamic flow. area owe their location entirely to hydrodynamic flow.
Evidence for Evidence for ROZsROZs in the Williston Basinin the Williston Basin
Structure on Top of the Mission Canyon Formation (contour intervStructure on Top of the Mission Canyon Formation (contour intervalal1,000ft) and Important Oil Fields in the greater Billings Nose A1,000ft) and Important Oil Fields in the greater Billings Nose Area, rea,
Williston BasinWilliston Basin
Adapted from Berg, R.R., DeMis, W.D. and Mitsdarffer, A.R., (1994), “Hydrodynamic Effects on Mission
Canyon (Mississippian) Oil Accumulations, Billings Nose Area,
North Dakota,” AAPG Bulletin, V. 78, No. 4, pp. 501-518.
Prevalence of the Prevalence of the Mission Canyon Formation Mission Canyon Formation throughout the Williston throughout the Williston Basin and the presence of Basin and the presence of similar similar stratigraphicstratigraphic and and hydrodynamic conditions hydrodynamic conditions suggest a potential for suggest a potential for tilted OWC in other fields in tilted OWC in other fields in other areas of the basin.other areas of the basin.
22SPE Midland
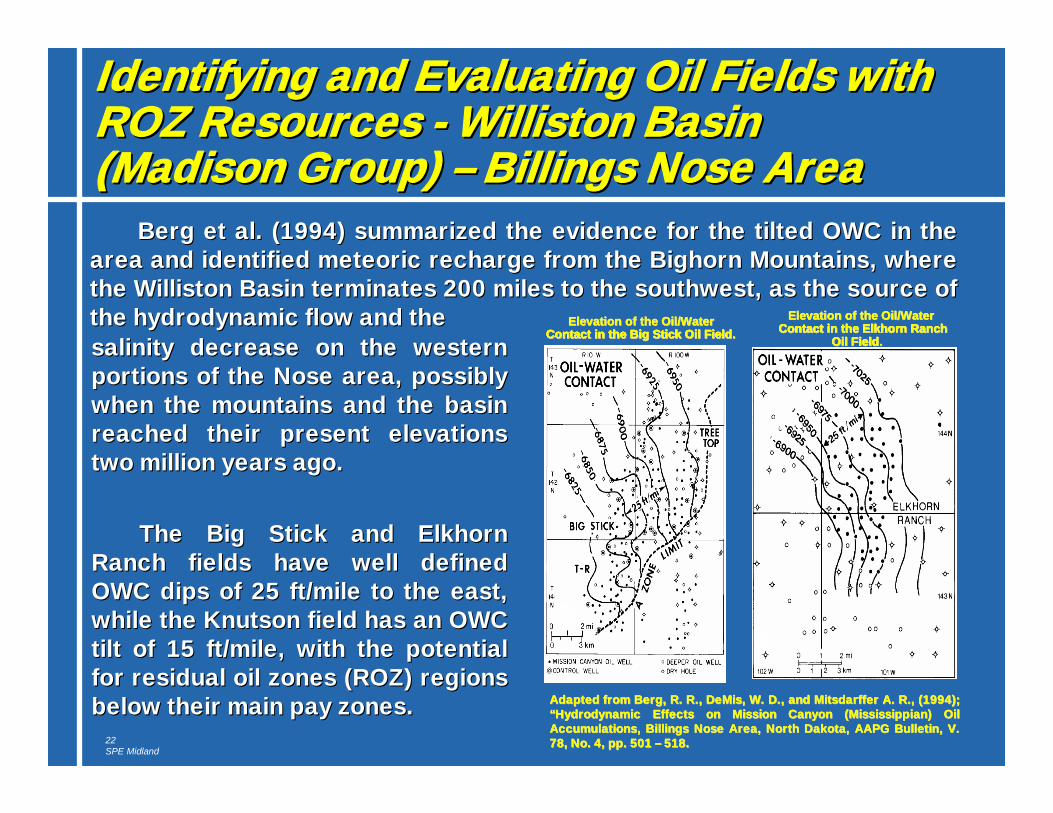
Berg et al. (1994) summarized the evidence for the tilted OWC inBerg et al. (1994) summarized the evidence for the tilted OWC in the the area and identified meteoric recharge from the Bighorn Mountainsarea and identified meteoric recharge from the Bighorn Mountains, where , where the Williston Basin terminates 200 miles to the southwest, as ththe Williston Basin terminates 200 miles to the southwest, as the source of e source of the hydrodynamic flow and the the hydrodynamic flow and the
Identifying and Evaluating Oil Fields with Identifying and Evaluating Oil Fields with ROZ Resources ROZ Resources -- Williston Basin Williston Basin (Madison Group) (Madison Group) –– Billings Nose AreaBillings Nose Area
salinity decrease on the western salinity decrease on the western portions of the Nose area, possibly portions of the Nose area, possibly when the mountains and the basin when the mountains and the basin reached their present elevations reached their present elevations two million years ago. two million years ago.
The Big Stick and Elkhorn The Big Stick and Elkhorn Ranch fields have well defined Ranch fields have well defined OWC dips of 25 ft/mile to the east, OWC dips of 25 ft/mile to the east, while the Knutson field has an OWC while the Knutson field has an OWC tilt of 15 ft/mile, with the potential tilt of 15 ft/mile, with the potential for residual oil zones (ROZ) regions for residual oil zones (ROZ) regions below their main pay zones. below their main pay zones.
Elevation of the Oil/Water Elevation of the Oil/Water Contact in the Big Stick Oil Field.Contact in the Big Stick Oil Field. Contact in the Elkhorn Ranch Contact in the Elkhorn Ranch
Oil Field.Oil Field.Contact in the Big Stick Oil FieldContact in the Big Stick Oil FieldElevation of the Oil/Water Elevation of the Oil/Water
Contact in the Elkhorn Ranch Contact in the Elkhorn Ranch Oil FieldOil Field
Adapted from Berg, R. R., Adapted from Berg, R. R., DeMisDeMis, W. D., and , W. D., and MitsdarfferMitsdarffer A. R., (1994); A. R., (1994); “Hydrodynamic Effects on Mission Canyon (Mississippian) Oil “Hydrodynamic Effects on Mission Canyon (Mississippian) Oil Accumulations, Billings Nose Area, North Dakota, AAPG Bulletin, Accumulations, Billings Nose Area, North Dakota, AAPG Bulletin, V. V. 78, No. 4, pp. 501 78, No. 4, pp. 501 –– 518.518.
23SPE Midland
Identifying and Evaluating Oil Fields with Identifying and Evaluating Oil Fields with ROZ Resources ROZ Resources -- Williston Basin Williston Basin (Madison Group) (Madison Group) –– Billings Nose AreaBillings Nose Area
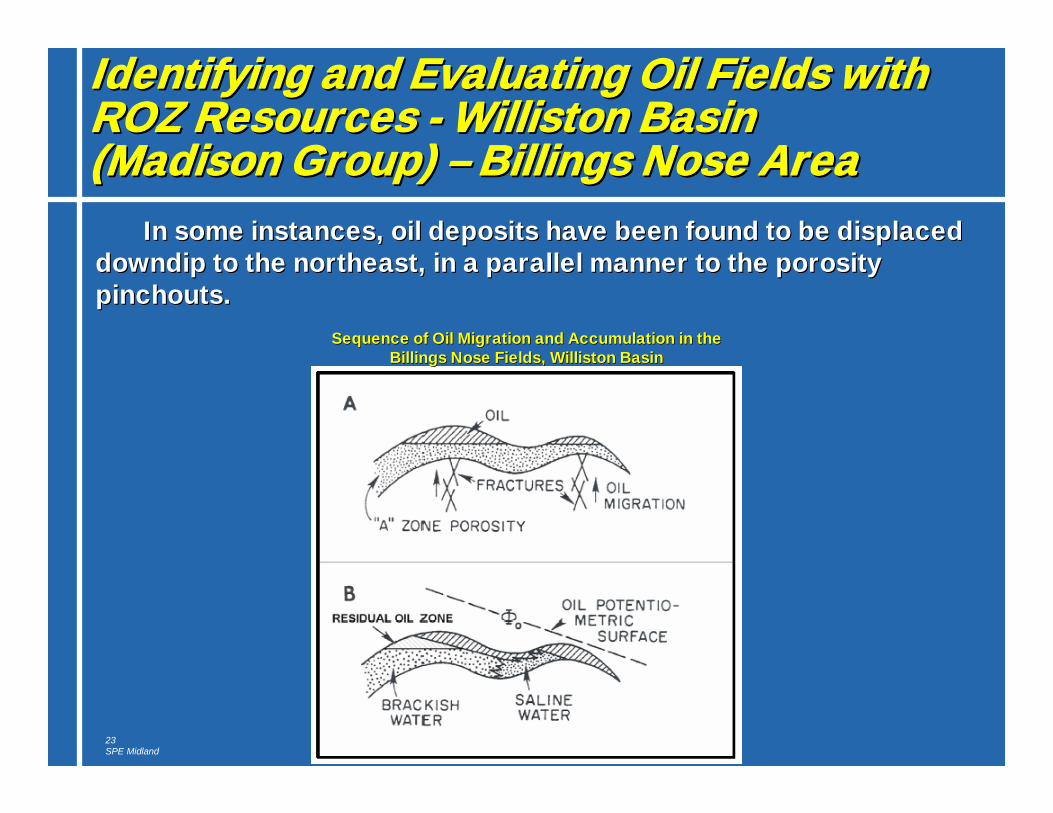
Sequence of Oil Migration and Accumulation in the Sequence of Oil Migration and Accumulation in the Billings Nose Fields, Williston BasinBillings Nose Fields, Williston Basin
In some instances, oil deposits have been found to be displaced In some instances, oil deposits have been found to be displaced downdipdowndip to the northeast, in a parallel manner to the porosity to the northeast, in a parallel manner to the porosity pinchoutspinchouts. .
24SPE Midland
Identifying and Evaluating Oil Fields with Identifying and Evaluating Oil Fields with ROZ Resources ROZ Resources –– Williston Basin Williston Basin (Madison Group)(Madison Group)
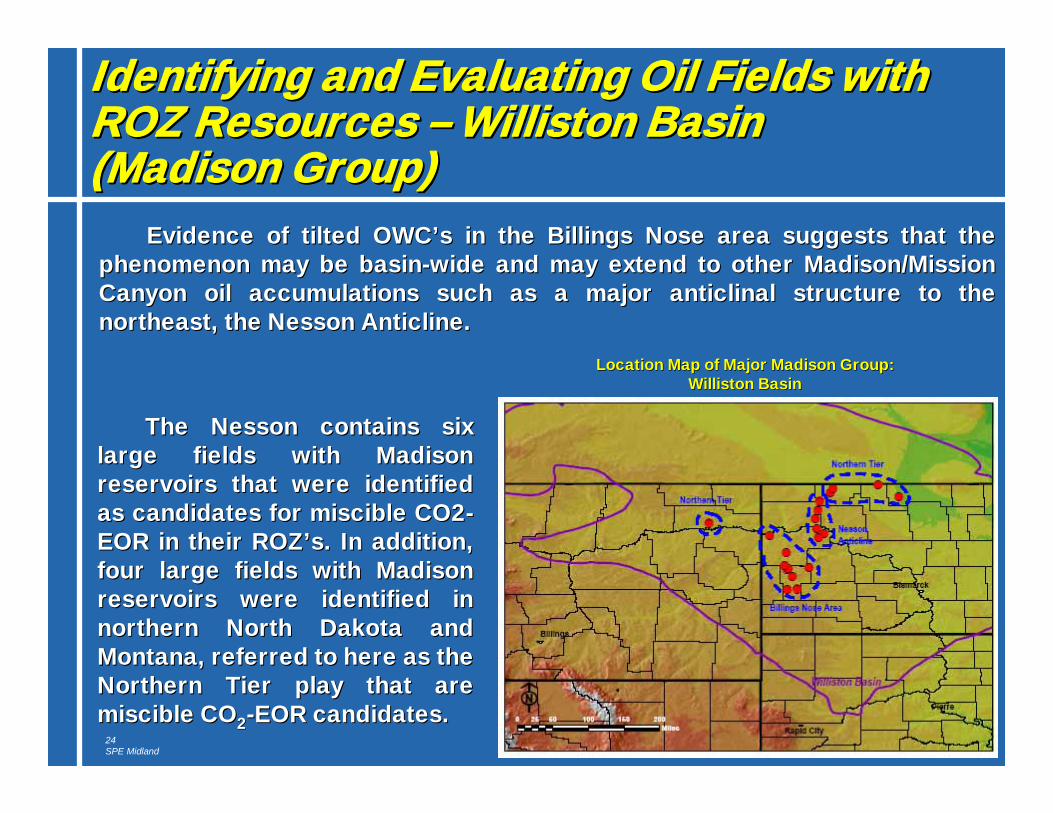
Location Map of Major Madison Group:Location Map of Major Madison Group:Williston BasinWilliston Basin
Evidence of tilted Evidence of tilted OWC’sOWC’s in the Billings Nose area suggests that the in the Billings Nose area suggests that the phenomenon may be basinphenomenon may be basin--wide and may extend to other Madison/Mission wide and may extend to other Madison/Mission Canyon oil accumulations such as a major Canyon oil accumulations such as a major anticlinalanticlinal structure to the structure to the northeast, the northeast, the NessonNesson Anticline. Anticline.
The The NessonNesson contains six contains six large fields with Madison large fields with Madison reservoirs that were identified reservoirs that were identified as candidates for miscible CO2as candidates for miscible CO2--EOR in their EOR in their ROZ’sROZ’s. In addition, . In addition, four large fields with Madison four large fields with Madison reservoirs were identified in reservoirs were identified in northern North Dakota and northern North Dakota and Montana, referred to here as the Montana, referred to here as the Northern Tier play that are Northern Tier play that are miscible COmiscible CO22--EOR candidates. EOR candidates.
25SPE Midland
Results: MPZ and TZ/ROZ Oil In PlaceResults: MPZ and TZ/ROZ Oil In Place
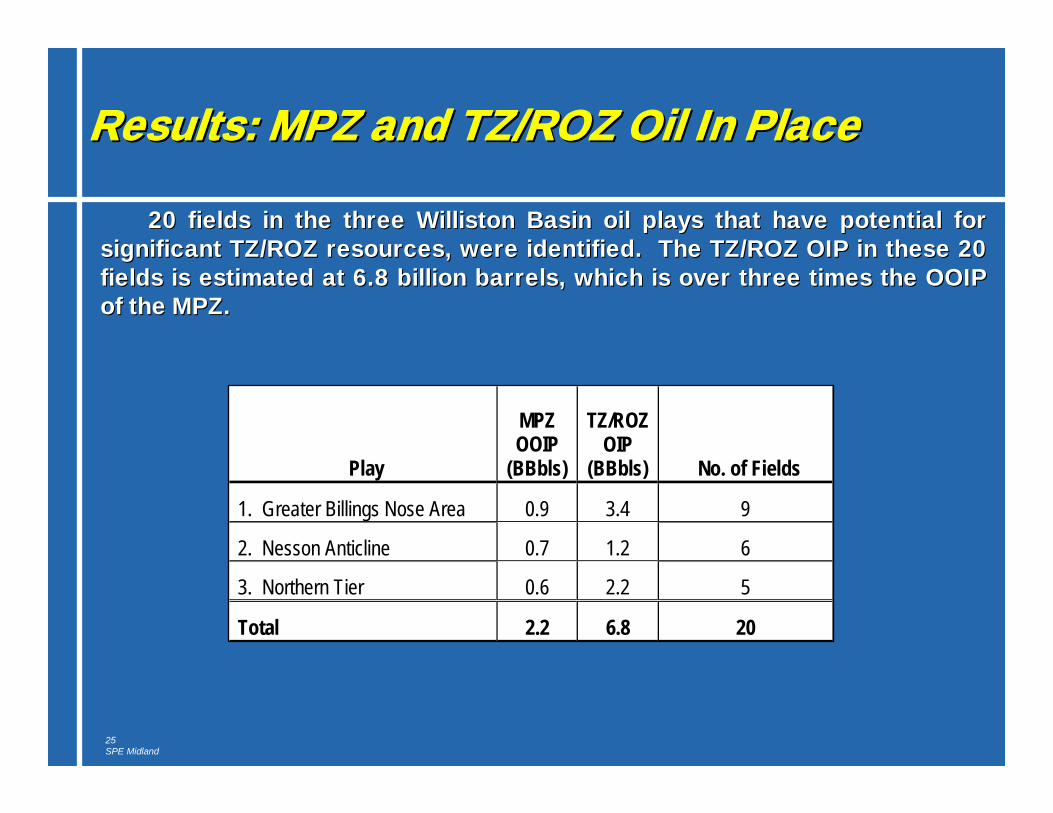
20 fields in the three Williston Basin oil plays that have poten20 fields in the three Williston Basin oil plays that have potential for tial for significant TZ/ROZ resources, were identified. The TZ/ROZ OIP isignificant TZ/ROZ resources, were identified. The TZ/ROZ OIP in these 20 n these 20 fields is estimated at 6.8 billion barrels, which is over three fields is estimated at 6.8 billion barrels, which is over three times the OOIP times the OOIP of the MPZ.of the MPZ.
Play
MPZ OOIP
(BBbls)
TZ/ROZ OIP
(BBbls) No. of Fields
1. Greater Billings Nose Area 0.9 3.4 9
2. Nesson Anticline 0.7 1.2 6
3. Northern Tier 0.6 2.2 5
Total 2.2 6.8 20
26SPE Midland
Results: Technically Recoverable Results: Technically Recoverable Resources from the MPZ and ROZResources from the MPZ and ROZ
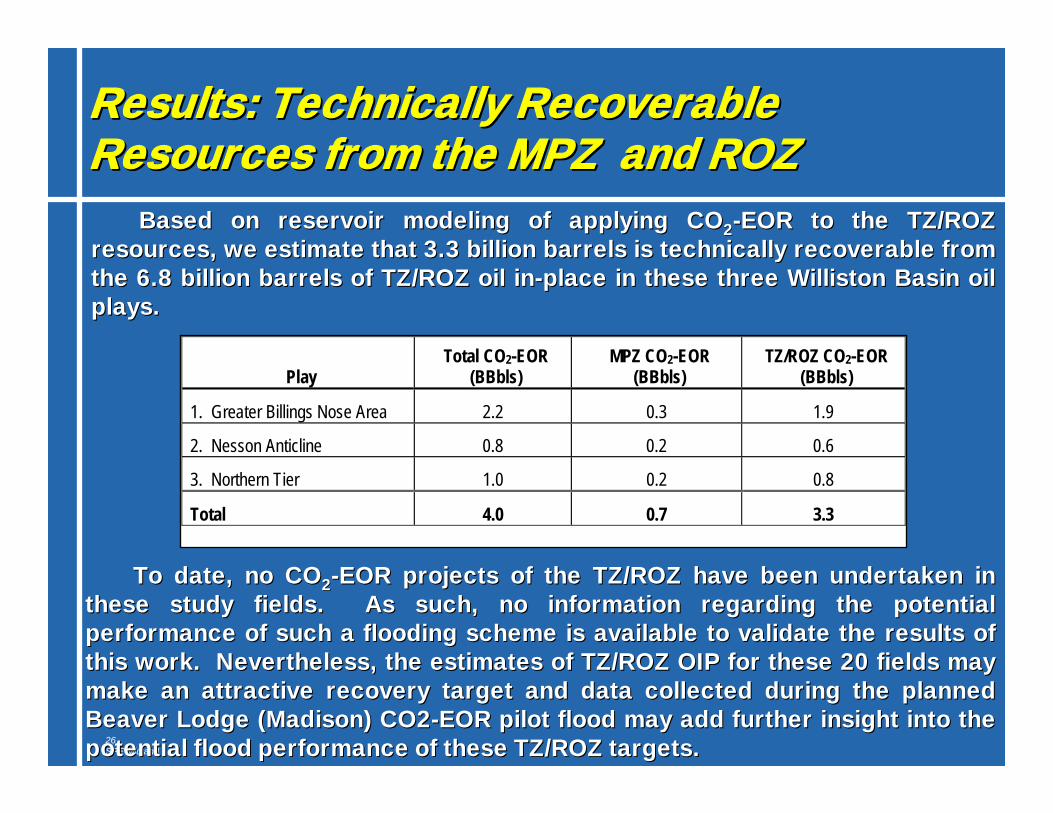
Based on reservoir modeling of applying COBased on reservoir modeling of applying CO22--EOR to the TZ/ROZ EOR to the TZ/ROZ resources, we estimate that 3.3 billion barrels is technically rresources, we estimate that 3.3 billion barrels is technically recoverable from ecoverable from the 6.8 billion barrels of TZ/ROZ oil inthe 6.8 billion barrels of TZ/ROZ oil in--place in these three Williston Basin oil place in these three Williston Basin oil plays.plays.
To date, no COTo date, no CO22--EOR projects of the TZ/ROZ have been undertaken in EOR projects of the TZ/ROZ have been undertaken in these study fields. As such, no information regarding the potenthese study fields. As such, no information regarding the potential tial performance of such a flooding scheme is available to validate tperformance of such a flooding scheme is available to validate the results of he results of this work. Nevertheless, the estimates of TZ/ROZ OIP for these this work. Nevertheless, the estimates of TZ/ROZ OIP for these 20 fields may 20 fields may make an attractive recovery target and data collected during themake an attractive recovery target and data collected during the planned planned Beaver Lodge (Madison) CO2Beaver Lodge (Madison) CO2--EOR pilot flood may add further insight into the EOR pilot flood may add further insight into the potential flood performance of these TZ/ROZ targets.potential flood performance of these TZ/ROZ targets.
Play Total CO2-EOR
(BBbls) MPZ CO2-EOR
(BBbls) TZ/ROZ CO2-EOR
(BBbls)
1. Greater Billings Nose Area 2.2 0.3 1.9
2. Nesson Anticline 0.8 0.2 0.6
3. Northern Tier 1.0 0.2 0.8
Total 4.0 0.7 3.3

Modeling Stranded Oil in Modeling Stranded Oil in the Residual Oil Zonethe Residual Oil Zone
4. The Big Horn Basin4. The Big Horn Basin
28SPE Midland
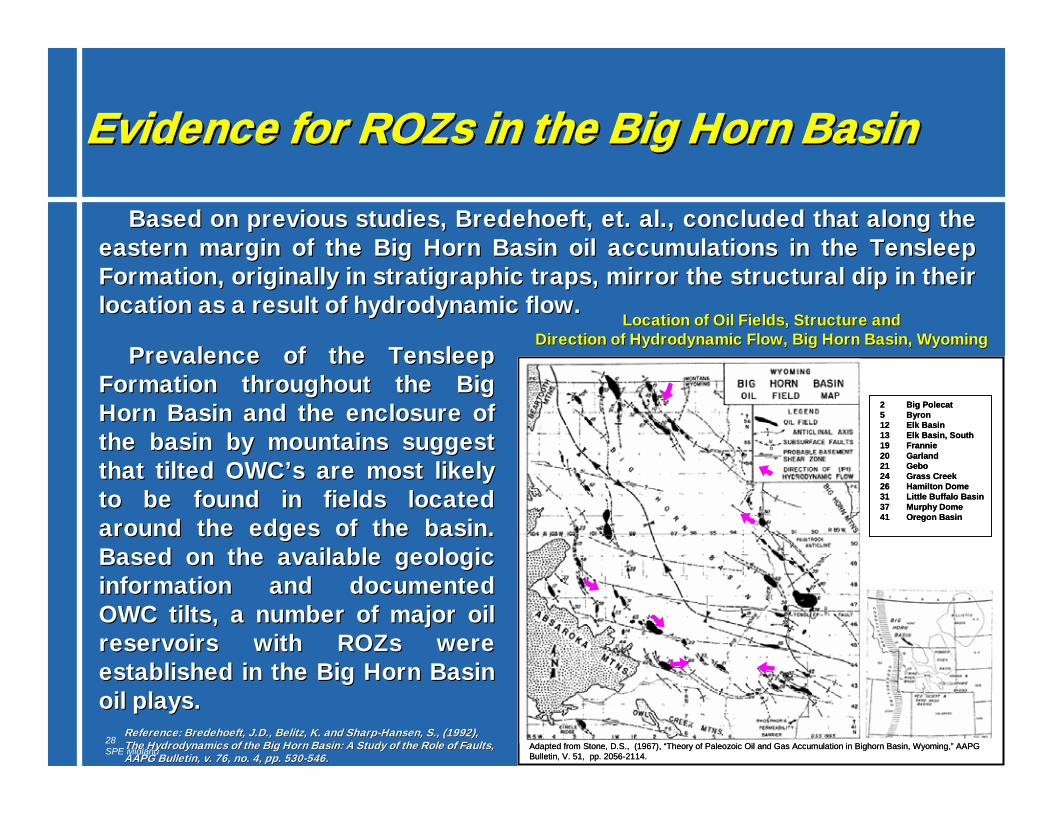
Evidence for Evidence for ROZsROZs in the Big Horn Basinin the Big Horn Basin
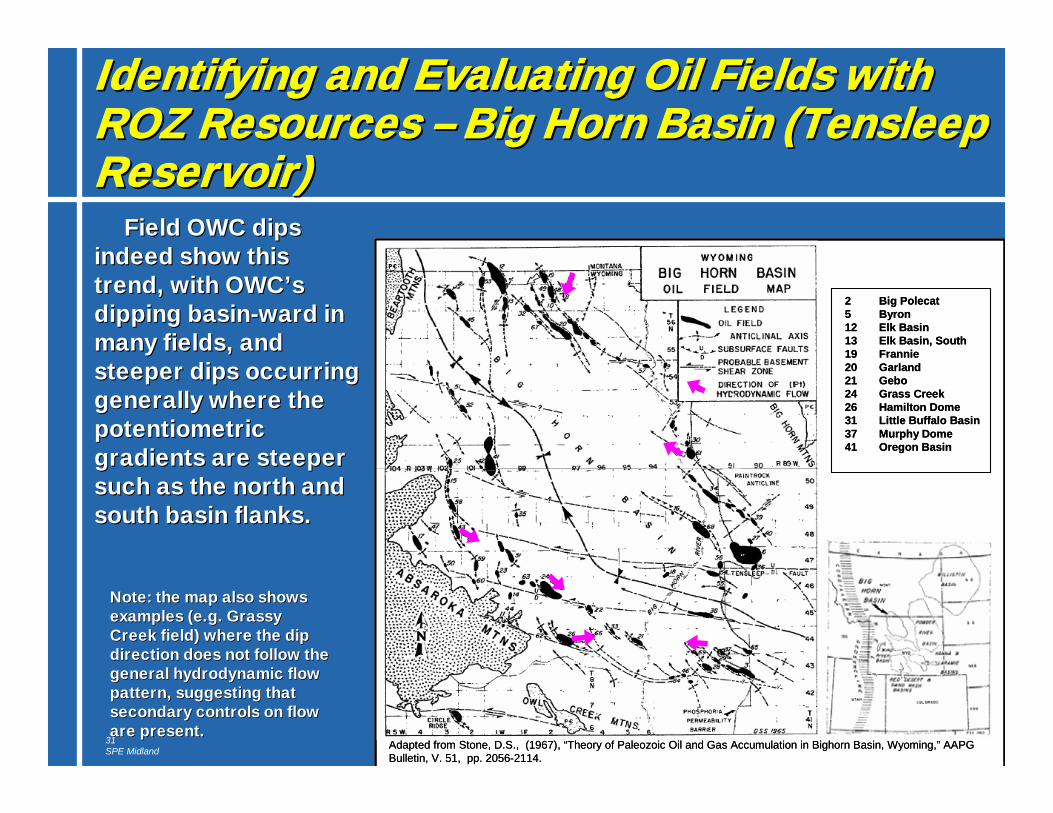
Location of Oil Fields, Structure andLocation of Oil Fields, Structure andDirection of Hydrodynamic Flow, Big Horn Basin, WyomingDirection of Hydrodynamic Flow, Big Horn Basin, Wyoming
Adapted from Stone, D.S., (1967), “Theory of Paleozoic Oil and Gas Accumulation in Bighorn Basin, Wyoming,” AAPG Bulletin, V. 51, pp. 2056-2114.
2 Big Polecat5 Byron12 Elk Basin13 Elk Basin, South19 Frannie20 Garland21 Gebo24 Grass Creek26 Hamilton Dome31 Little Buffalo Basin37 Murphy Dome41 Oregon Basin
Based on previous studies, Based on previous studies, BredehoeftBredehoeft, et. al., concluded that along the , et. al., concluded that along the eastern margin of the Big Horn Basin oil accumulations in the eastern margin of the Big Horn Basin oil accumulations in the TensleepTensleepFormation, originally in Formation, originally in stratigraphicstratigraphic traps, mirror the structural dip in their traps, mirror the structural dip in their location as a result of hydrodynamic flow.location as a result of hydrodynamic flow.
Prevalence of the Prevalence of the TensleepTensleepFormation throughout the Big Formation throughout the Big Horn Basin and the enclosure of Horn Basin and the enclosure of the basin by mountains suggest the basin by mountains suggest that tilted that tilted OWC’sOWC’s are most likely are most likely to be found in fields located to be found in fields located around the edges of the basin. around the edges of the basin. Based on the available geologic Based on the available geologic information and documented information and documented OWC tilts, a number of major oil OWC tilts, a number of major oil reservoirs with reservoirs with ROZsROZs were were established in the Big Horn Basin established in the Big Horn Basin oil plays.oil plays.
Reference: Reference: BredehoeftBredehoeft, J.D., , J.D., BelitzBelitz, K. and Sharp, K. and Sharp--Hansen, S., (1992), Hansen, S., (1992), The Hydrodynamics of the Big Horn Basin: A Study of the Role of The Hydrodynamics of the Big Horn Basin: A Study of the Role of Faults, Faults, AAPG Bulletin, v. 76, no. 4, pp. 530AAPG Bulletin, v. 76, no. 4, pp. 530--546.546.
29SPE Midland
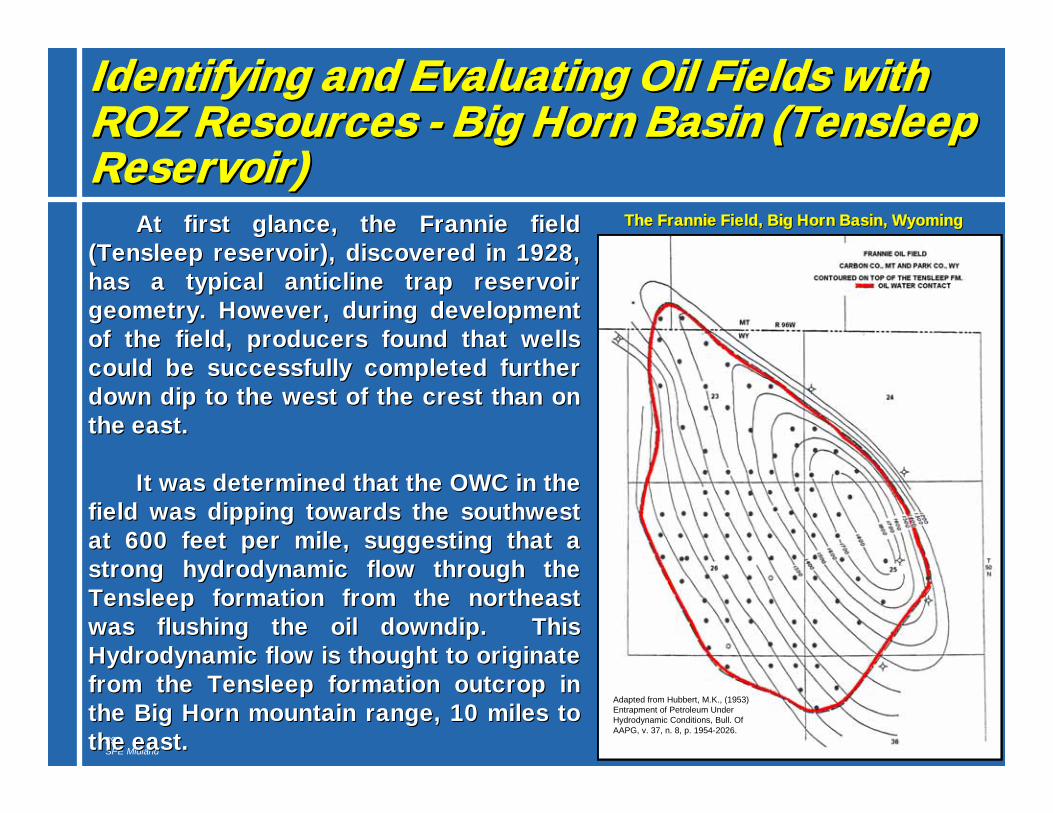
Identifying and Evaluating Oil Fields with Identifying and Evaluating Oil Fields with ROZ Resources ROZ Resources -- Big Horn Basin (Big Horn Basin (TensleepTensleepReservoir)Reservoir)
The The FrannieFrannie Field, Big Horn Basin, WyomingField, Big Horn Basin, Wyoming
Adapted from Hubbert, M.K., (1953) Entrapment of Petroleum Under Hydrodynamic Conditions, Bull. Of AAPG, v. 37, n. 8, p. 1954-2026.
Adapted from Hubbert, M.K., (1953) Entrapment of Petroleum Under Hydrodynamic Conditions, Bull. Of AAPG, v. 37, n. 8, p. 1954-2026.
At first glance, the At first glance, the FrannieFrannie field field ((TensleepTensleep reservoir), discovered in 1928, reservoir), discovered in 1928, has a typical anticline trap reservoir has a typical anticline trap reservoir geometry. However, during development geometry. However, during development of the field, producers found that wells of the field, producers found that wells could be successfully completed further could be successfully completed further down dip to the west of the crest than on down dip to the west of the crest than on the east.the east.
It was determined that the OWC in the It was determined that the OWC in the field was dipping towards the southwest field was dipping towards the southwest at 600 feet per mile, suggesting that a at 600 feet per mile, suggesting that a strong hydrodynamic flow through the strong hydrodynamic flow through the TensleepTensleep formation from the northeast formation from the northeast was flushing the oil was flushing the oil downdipdowndip. This . This Hydrodynamic flow is thought to originate Hydrodynamic flow is thought to originate from the from the TensleepTensleep formation outcrop in formation outcrop in the Big Horn mountain range, 10 miles to the Big Horn mountain range, 10 miles to the east. the east.
30SPE Midland
Identifying and Evaluating Oil Fields with Identifying and Evaluating Oil Fields with ROZ Resources ROZ Resources -- Big Horn Basin (Big Horn Basin (TensleepTensleepReservoir)Reservoir)
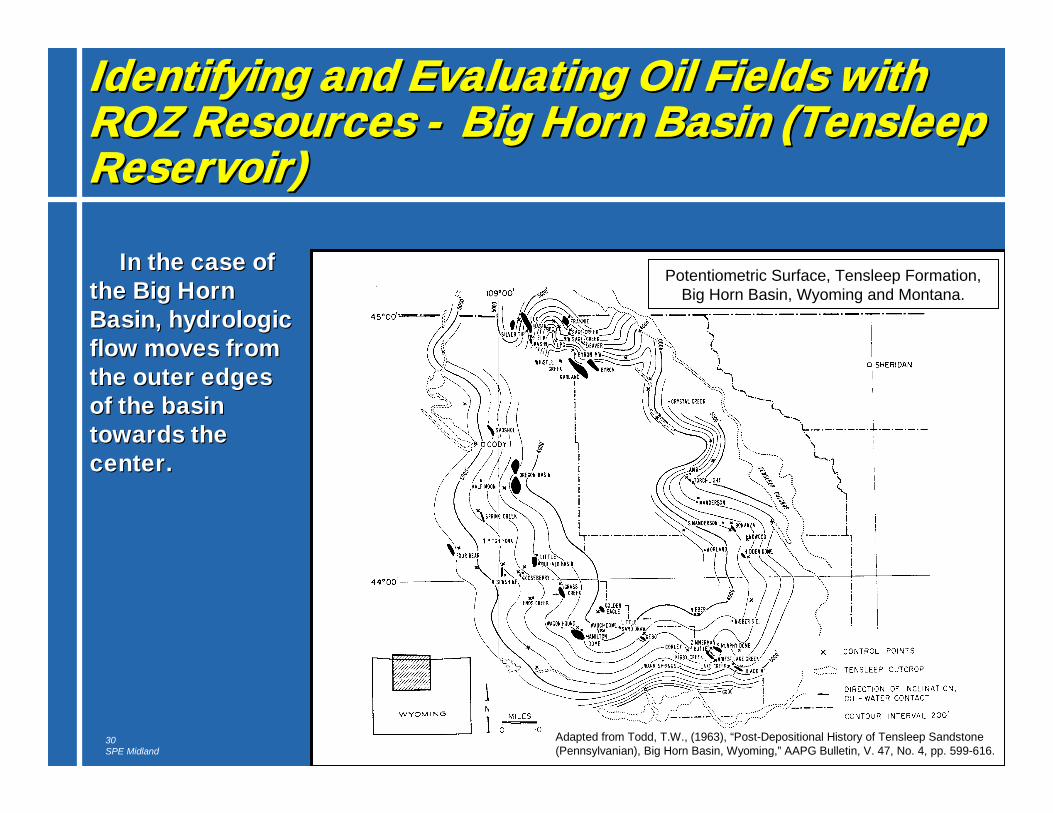
Adapted from Todd, T.W., (1963), “Post-Depositional History of Tensleep Sandstone (Pennsylvanian), Big Horn Basin, Wyoming,” AAPG Bulletin, V. 47, No. 4, pp. 599-616.Adapted from Todd, T.W., (1963), “Post-Depositional History of Tensleep Sandstone (Pennsylvanian), Big Horn Basin, Wyoming,” AAPG Bulletin, V. 47, No. 4, pp. 599-616.
Potentiometric Surface, Tensleep Formation, Big Horn Basin, Wyoming and Montana.
In the case of In the case of the Big Horn the Big Horn Basin, hydrologic Basin, hydrologic flow moves from flow moves from the outer edges the outer edges of the basin of the basin towards the towards the center. center.
31SPE Midland
Field OWC dips Field OWC dips indeed show this indeed show this trend, with trend, with OWC’sOWC’sdipping basindipping basin--ward in ward in many fields, and many fields, and steeper dips occurring steeper dips occurring generally where the generally where the potentiometricpotentiometricgradients are steeper gradients are steeper such as the north and such as the north and south basin flanks. south basin flanks.
Identifying and Evaluating Oil Fields with Identifying and Evaluating Oil Fields with ROZ Resources ROZ Resources –– Big Horn Basin (Big Horn Basin (TensleepTensleepReservoir)Reservoir)
Adapted from Stone, D.S., (1967), “Theory of Paleozoic Oil and Gas Accumulation in Bighorn Basin, Wyoming,” AAPG Bulletin, V. 51, pp. 2056-2114.
2 Big Polecat5 Byron12 Elk Basin13 Elk Basin, South19 Frannie20 Garland21 Gebo24 Grass Creek26 Hamilton Dome31 Little Buffalo Basin37 Murphy Dome41 Oregon Basin
Note: the map also shows Note: the map also shows examples (e.g. Grassy examples (e.g. Grassy Creek field) where the dip Creek field) where the dip direction does not follow the direction does not follow the general hydrodynamic flow general hydrodynamic flow pattern, suggesting that pattern, suggesting that secondary controls on flow secondary controls on flow are present.are present.
32SPE Midland
Results Results -- MPZ and TZ/ROZ Oil in PlaceMPZ and TZ/ROZ Oil in Place
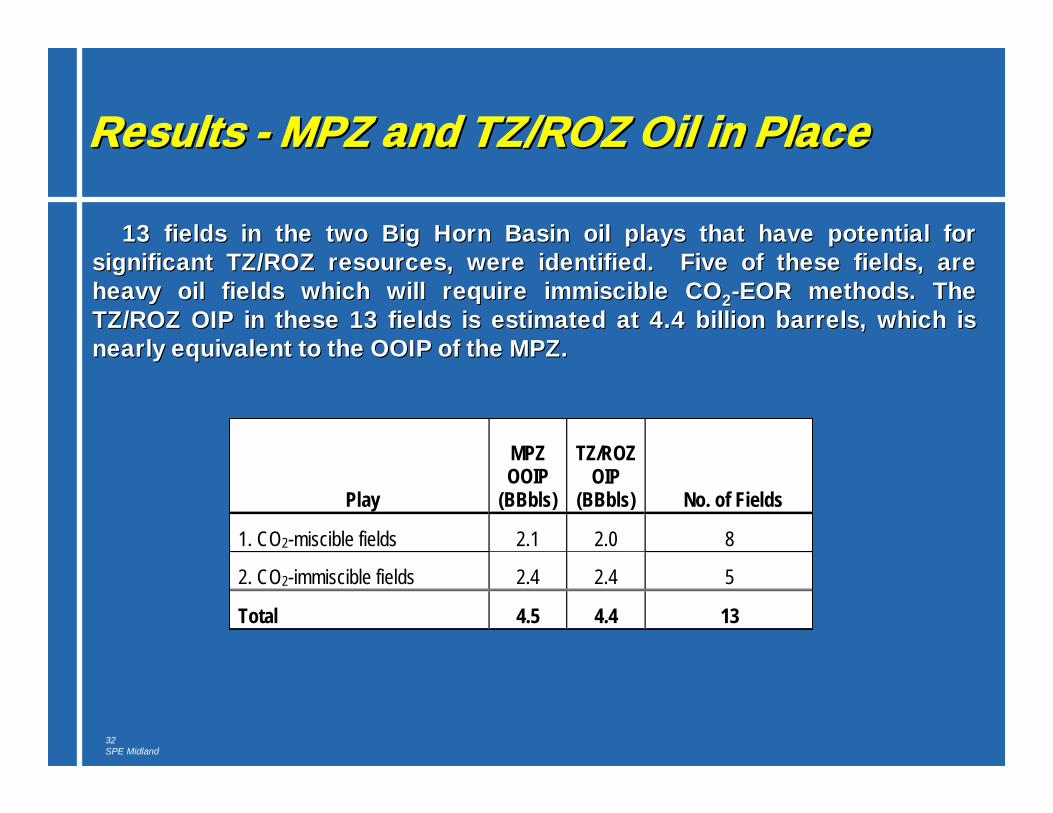
13 fields in the two Big Horn Basin oil plays that have pot13 fields in the two Big Horn Basin oil plays that have potential for ential for significant TZ/ROZ resources, were identified. Five of these fisignificant TZ/ROZ resources, were identified. Five of these fields, are elds, are heavy oil fields which will require immiscible COheavy oil fields which will require immiscible CO22--EOR methods. The EOR methods. The TZ/ROZ OIP in these 13 fields is estimated at 4.4 billion barrelTZ/ROZ OIP in these 13 fields is estimated at 4.4 billion barrels, which is s, which is nearly equivalent to the OOIP of the MPZ.nearly equivalent to the OOIP of the MPZ.
Play
MPZ OOIP
(BBbls)
TZ/ROZ OIP
(BBbls) No. of Fields
1. CO2-miscible fields 2.1 2.0 8
2. CO2-immiscible fields 2.4 2.4 5
Total 4.5 4.4 13
33SPE Midland
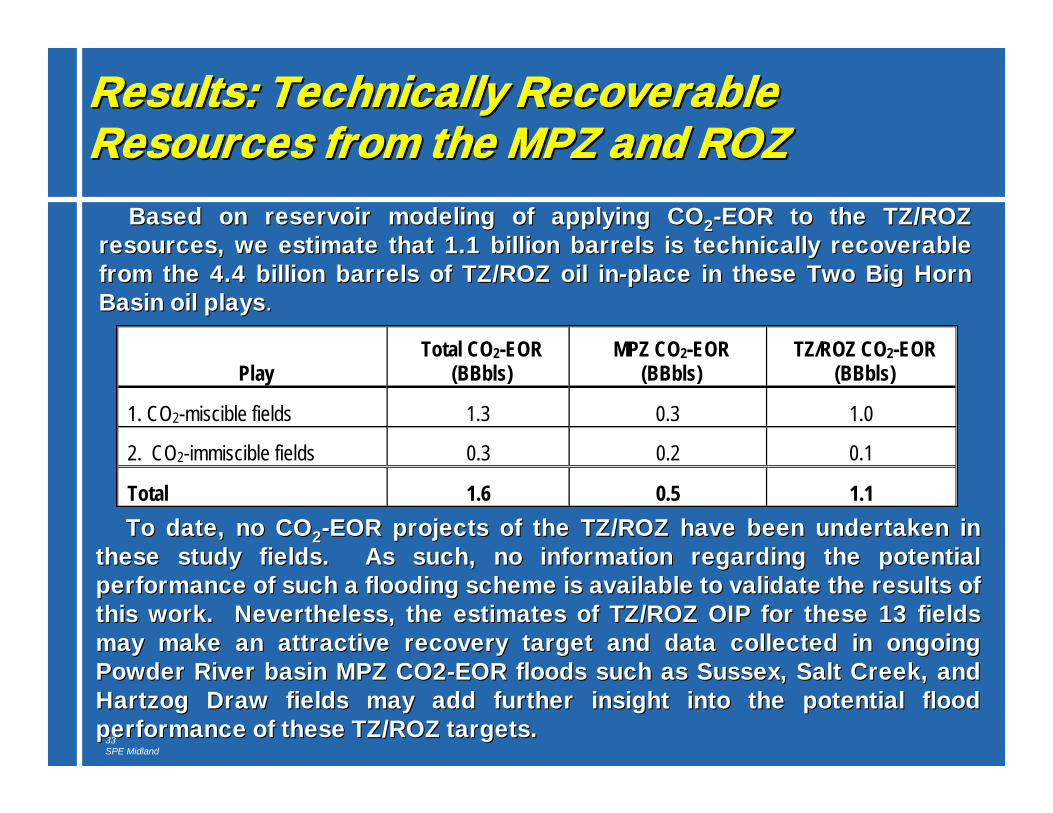
Results: Technically Recoverable Results: Technically Recoverable Resources from the MPZ and ROZResources from the MPZ and ROZ
Based on reservoir modeling of applying COBased on reservoir modeling of applying CO22--EOR to the TZ/ROZ EOR to the TZ/ROZ resources, we estimate that 1.1 billion barrels is technically rresources, we estimate that 1.1 billion barrels is technically recoverable ecoverable from the 4.4 billion barrels of TZ/ROZ oil infrom the 4.4 billion barrels of TZ/ROZ oil in--place in these Two Big Horn place in these Two Big Horn Basin oil playsBasin oil plays..
Play Total CO2-EOR
(BBbls) MPZ CO2-EOR
(BBbls) TZ/ROZ CO2-EOR
(BBbls)
1. CO2-miscible fields 1.3 0.3 1.0
2. CO2-immiscible fields 0.3 0.2 0.1
Total 1.6 0.5 1.1 To date, no COTo date, no CO22--EOR projects of the TZ/ROZ have been undertaken in EOR projects of the TZ/ROZ have been undertaken in
these study fields. As such, no information regarding the potenthese study fields. As such, no information regarding the potential tial performance of such a flooding scheme is available to validate tperformance of such a flooding scheme is available to validate the results of he results of this work. Nevertheless, the estimates of TZ/ROZ OIP for these this work. Nevertheless, the estimates of TZ/ROZ OIP for these 13 fields 13 fields may make an attractive recovery target and data collected in ongmay make an attractive recovery target and data collected in ongoing oing Powder River basin MPZ CO2Powder River basin MPZ CO2--EOR floods such as Sussex, Salt Creek, and EOR floods such as Sussex, Salt Creek, and HartzogHartzog Draw fields may add further insight into the potential flood Draw fields may add further insight into the potential flood performance of these TZ/ROZ targets.performance of these TZ/ROZ targets.
Modeling Stranded Oil in Modeling Stranded Oil in the Residual Oil Zonethe Residual Oil Zone
5. Conclusions5. Conclusions
35SPE Midland
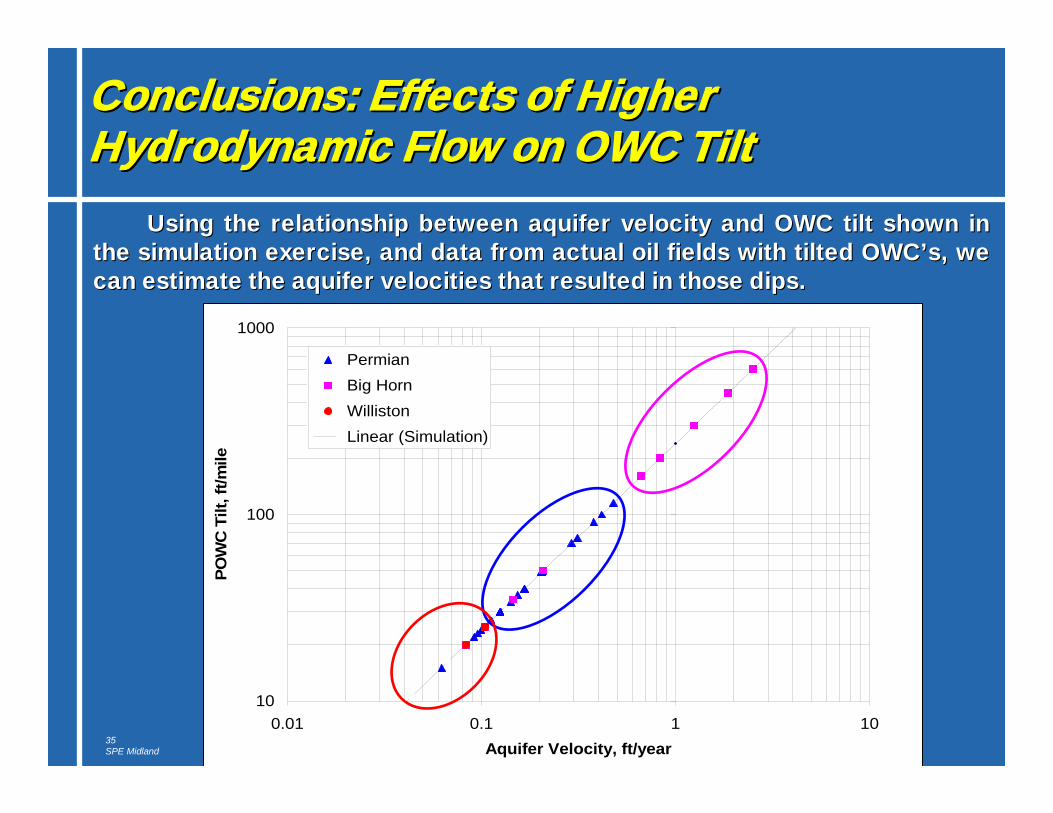
Conclusions: Effects of Higher Conclusions: Effects of Higher Hydrodynamic Flow on OWC TiltHydrodynamic Flow on OWC Tilt
Using the relationship between aquifer velocity and OWC tilt shoUsing the relationship between aquifer velocity and OWC tilt shown in wn in the simulation exercise, and data from actual oil fields with tithe simulation exercise, and data from actual oil fields with tilted lted OWC’sOWC’s, we , we can estimate the aquifer velocities that resulted in those dips.can estimate the aquifer velocities that resulted in those dips.
10
100
1000
0.01 0.1 1 10Aquifer Velocity, ft/year
POW
C T
ilt, f
t/mile
PermianBig HornWillistonLinear (Simulation)
36SPE Midland
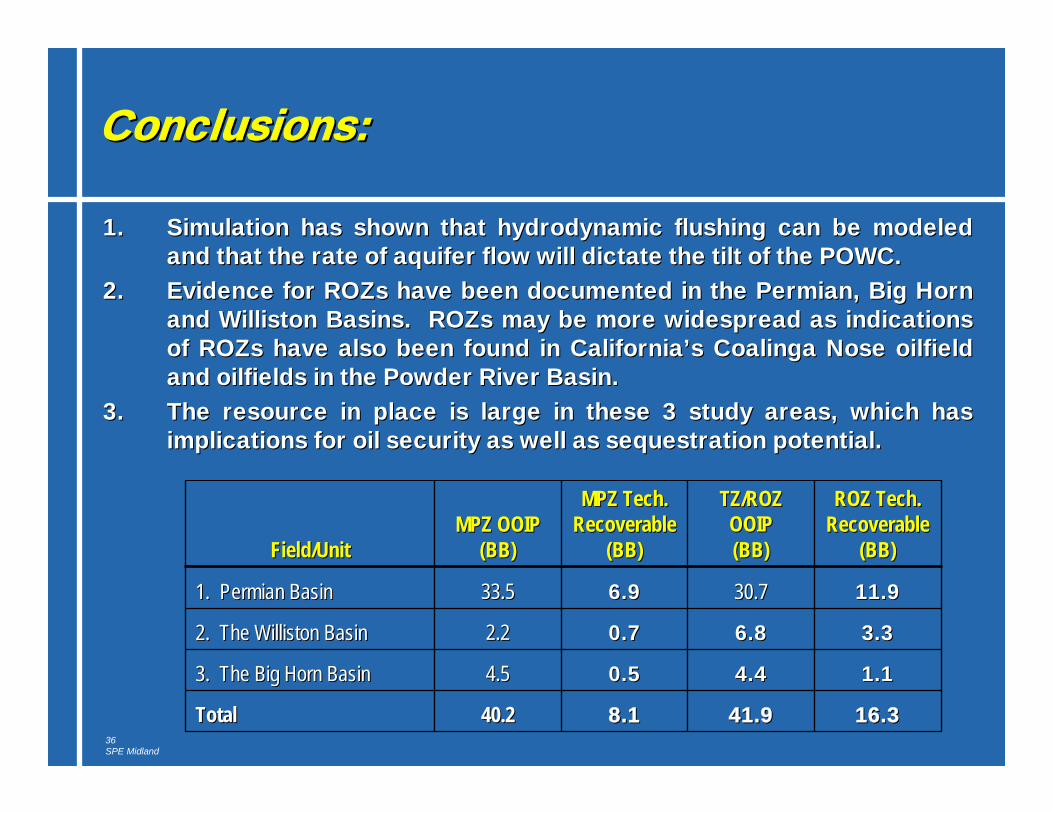
1.1. Simulation has shown that hydrodynamic flushing can be modeled Simulation has shown that hydrodynamic flushing can be modeled and that the rate of aquifer flow will dictate the tilt of the Pand that the rate of aquifer flow will dictate the tilt of the POWC.OWC.
2.2. Evidence for Evidence for ROZsROZs have been documented in the Permian, Big Horn have been documented in the Permian, Big Horn and Williston Basins. and Williston Basins. ROZsROZs may be more widespread as indications may be more widespread as indications of of ROZsROZs have also been found in California’s Coalinga Nose oilfield have also been found in California’s Coalinga Nose oilfield and oilfields in the Powder River Basin.and oilfields in the Powder River Basin.
3.3. The resource in place is large in these 3 study areas, which hasThe resource in place is large in these 3 study areas, which hasimplications for oil security as well as sequestration potentialimplications for oil security as well as sequestration potential..
Conclusions:Conclusions:
8.18.1
0.50.5
0.70.7
6.96.9
MPZ Tech. MPZ Tech. RecoverableRecoverable
(BB)(BB)
40.240.2
4.54.5
2.22.2
33.533.5
MPZ OOIP MPZ OOIP (BB)(BB)
16.316.341.941.9TotalTotal
1.11.14.44.43. The Big Horn Basin3. The Big Horn Basin
3.33.36.86.82. The Williston Basin2. The Williston Basin
11.911.930.730.71. Permian Basin1. Permian Basin
ROZ Tech. ROZ Tech. RecoverableRecoverable
(BB)(BB)
TZ/ROZ TZ/ROZ OOIPOOIP(BB)(BB)Field/UnitField/Unit