Modeling Populations forces that act on allelic frequencies.
19
Modeling Populations forces that act on allelic frequencies
-
Upload
alan-watts -
Category
Documents
-
view
219 -
download
0
Transcript of Modeling Populations forces that act on allelic frequencies.

Modeling Populations
forces that act on allelic frequencies

What to model? Model Type 1 (analytical): Simulate the
change in allele frequencies directly by mathematical modeling of the forces that act on them.
Model Type 2 (numerical): Simulate individuals of a population(s) having DNA sequence polymorphisms, and allow them to evolve randomly or under certain forces.
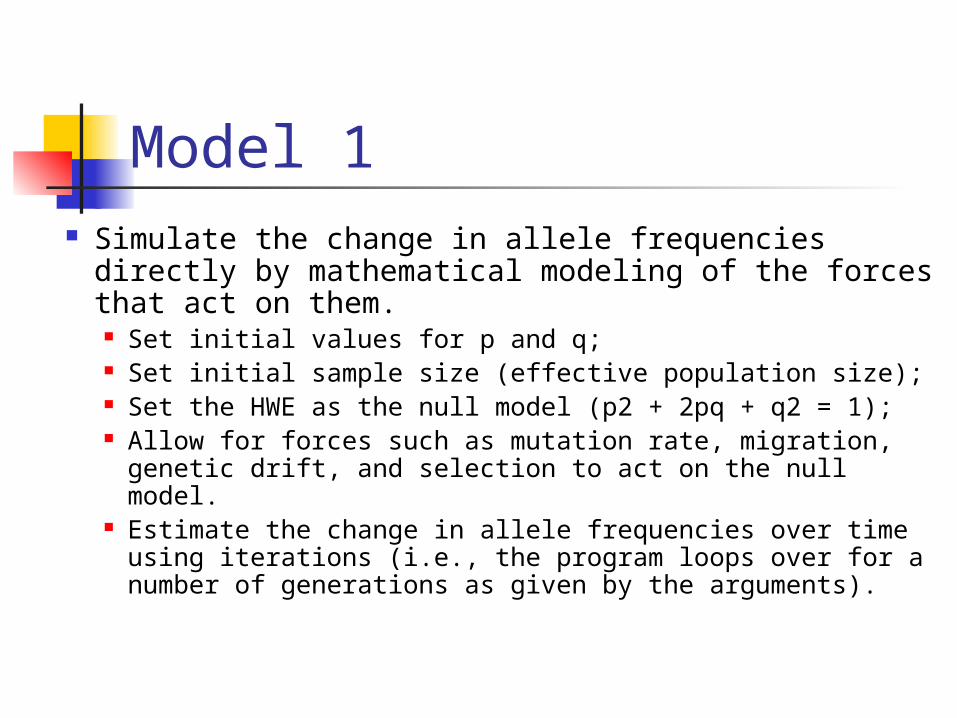
Model 1 Simulate the change in allele frequencies directly
by mathematical modeling of the forces that act on them. Set initial values for p and q; Set initial sample size (effective population size); Set the HWE as the null model (p2 + 2pq + q2 = 1); Allow for forces such as mutation rate, migration, genetic
drift, and selection to act on the null model. Estimate the change in allele frequencies over time using
iterations (i.e., the program loops over for a number of generations as given by the arguments).

Null hypotheses to be tested: Change in allele frequencies over
time is not affected by the initial frequencies of p and q sample size, mutation rate, degree of
selection, or migration. If affected, how so?
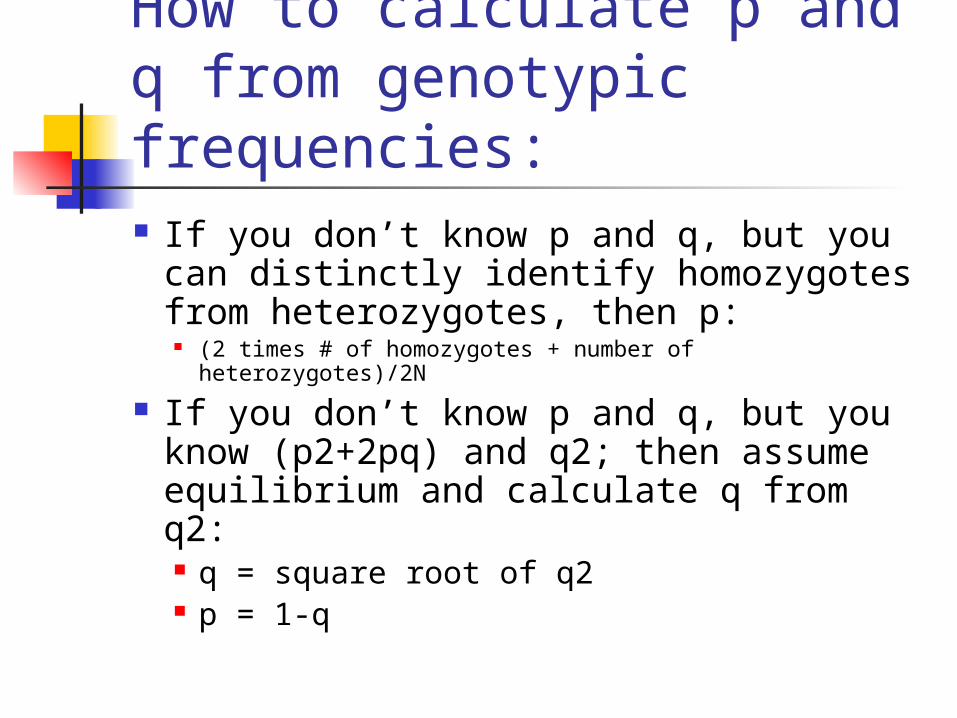
How to calculate p and q from genotypic frequencies: If you don’t know p and q, but you
can distinctly identify homozygotes from heterozygotes, then p:
(2 times # of homozygotes + number of heterozygotes)/2N
If you don’t know p and q, but you know (p2+2pq) and q2; then assume equilibrium and calculate q from q2: q = square root of q2 p = 1-q
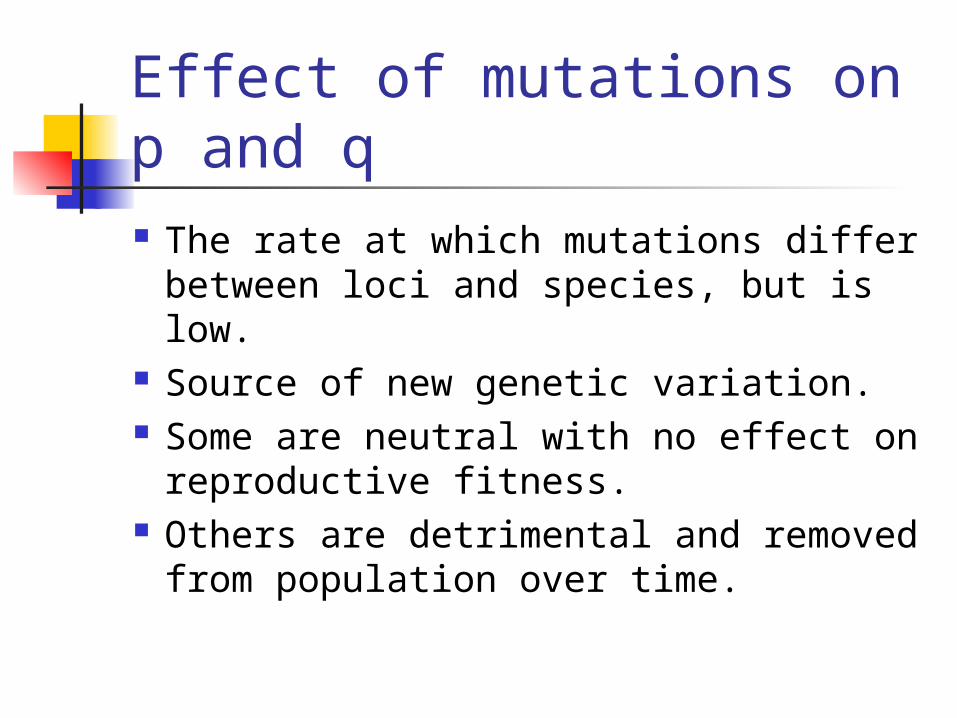
Effect of mutations on p and q The rate at which mutations differ
between loci and species, but is low. Source of new genetic variation. Some are neutral with no effect on
reproductive fitness. Others are detrimental and removed
from population over time.

Forward and reverse mutation Assume that mutation is the only
force. The mutation of A a is called
forward mutation, symbolized with u.
The mutation of a A is called reverse mutation (occur at a lower rate), symbolized with v.

A hypothetical population Where the frequency of A is p, and the
frequency of a is q. Assume that population is large and there is
no selection. In each generation a proportion (u) of all A
alleles mutates to a, and a proportion (v) of all a mutates back to A. If u = 10-4, and p = 1, and N = 100,000; 10-4 x
100,000 = 10 A alleles mutate to a. The decrease in p is up, and increase in p is vq. If u equal v, then population achieves equilibrium.
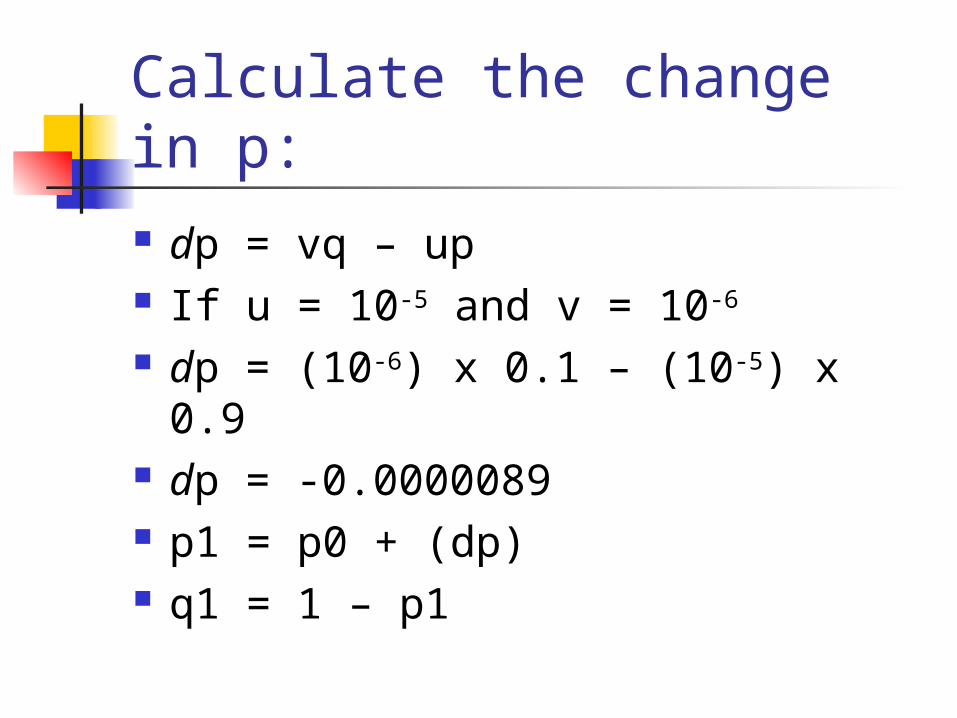
Calculate the change in p: dp = vq – up If u = 10-5 and v = 10-6
dp = (10-6) x 0.1 – (10-5) x 0.9 dp = -0.0000089 p1 = p0 + (dp) q1 = 1 – p1

Allele A is fixed (p =1.0) and mutates Aa at rate of 10-4

Allele A is fixed, Aa is 10-4 and aA is 10-5

Random genetic drift Random change in allelic frequency due
to chance is called random genetic drift. Sampling error arise from chance
deviations from expected proportions. Sampling variance for the allele
frequency is: pq/2N
Variance is inversely proportional to the sample size!

Effective population size (Ne) Genetic drift is random and unpredictable. Not all individuals contribute gametes to
the next generation. To determine the magnitude of genetic
drift, we must know Ne. Ne equals the equivalent number of adults
contributing gametes to the next generation (i.e., number of breeding adults).
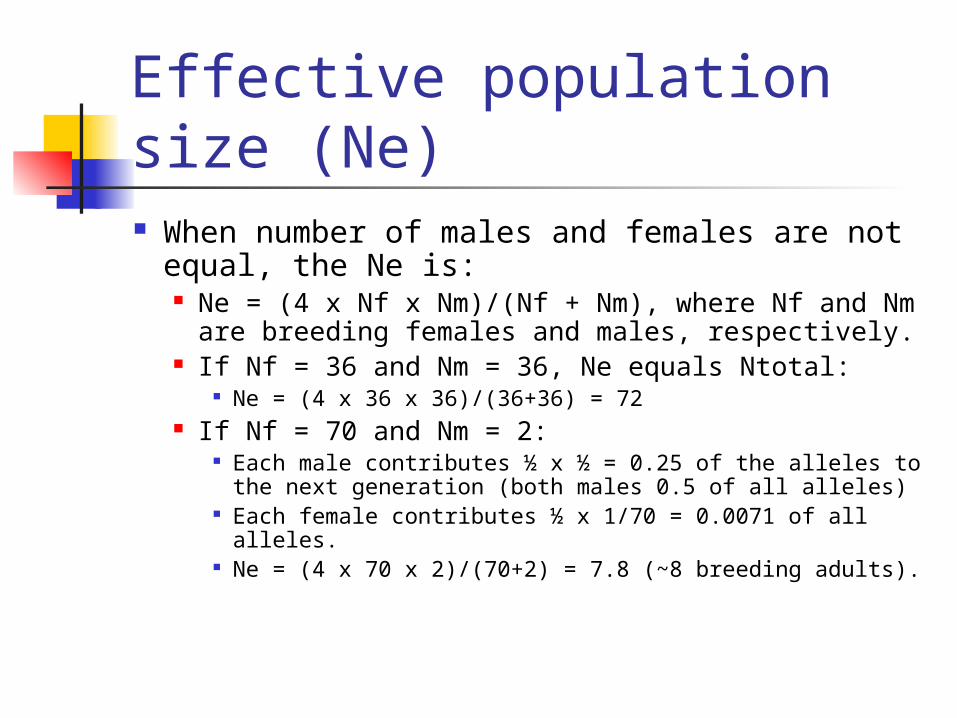
Effective population size (Ne) When number of males and females are
not equal, the Ne is: Ne = (4 x Nf x Nm)/(Nf + Nm), where Nf and Nm
are breeding females and males, respectively. If Nf = 36 and Nm = 36, Ne equals Ntotal:
Ne = (4 x 36 x 36)/(36+36) = 72 If Nf = 70 and Nm = 2:
Each male contributes ½ x ½ = 0.25 of the alleles to the next generation (both males 0.5 of all alleles)
Each female contributes ½ x 1/70 = 0.0071 of all alleles.
Ne = (4 x 70 x 2)/(70+2) = 7.8 (~8 breeding adults).

Sampling variance of p Remember sampling variance:
sp2 = pq/2N
Consider unequal number of breeding males and females: sp
2 = pq/2Ne
Standard error: sp = √pq/2Ne
95% confidence limit = p 2sp

Buri’s study of genetic drift in Drosophila
Actual data for 107 experimental populations.
Randomly selected 8 males and 8 females (N = 16) from each population for the next generation for 19 consecutive generations.
Calculated the frequency of bw75 allele, and generated a frequency distribution among 107 populations.

Fig. 22.12, Effect of drift (q0=0.5; Ne = 20).

Simulation of genetic drift

Other factors reducing Ne Differential production of offspring Fluctuating population size Overlapping generations