
Modeling Pigmented Materials for Realistic Image Synthesismeyer/papers/haase-meyer-tog-1992.pdf ·...
31
Modeling Pigmented Materials for Realistic Image Synthesis CHET S. HAASE and GARY W. MEYER University of Oregon This article discusses and applies the Kuhelka Munk theory of pigment mixing to computer graphics in order to facilitate improved image synthesis. The theories of additive and subtractive color m]xing arc discussed and are shown to be insufficient for pigmented materials. The Kubclka Munk theory of pigment mixing is developed and the relevant equations arc derived. pigmer]t mixing experiments are performed and the results are displayed on cokw tekm’ision monitors. A paint program that uscs Kubelka Munk theory to mix real pigments is presented. Theories of color matching with pigments are extended to determine rcflectances for use in realistic image synthesis. (’categories and Subject Descriptors: 1.3.4 [Computer Graphics]: Graphics Utilities patnt .s,v,<tcm.s:1.17 [Computer Graphics]: Three-Dimensional Graphics and Realism color, .shad- jf),qr, .shfldof IIIIg, and text MI.(, (;cneral Terms: Al~oritbms, Experimentation, Human Factors Additi[,nal Key Words and Phrases: Color matching, color science, cnlor selection, illumination modeling. pigment mixing 1, INTRODUCTION The illumination model in computer graphics is constantly being refined so that it provides an ever more accurate model of reality. However, no illumina- tion model will work unless the objects in the scene have been properly described. This fact has been realized and the surface properties of objects have been painstakingly modeled, especially as they relate to reflection direction and strength. But a comprehensive approach to object modeling should also take into account the physical makeup of those surfaces. In particular, most manufactured objects in the real world have pigmented surfaces, such as painted items, plastic objects, and textiles. To accurate] y This research was funded by a grant from Apple Computer, Inc. Additional support was provided by the Hewlett-Packard (hmpany and the Oregon Advanced Computing Institute,. .kuthors’ address: Department of Computer and Information Science, University of Oregon, Eugene, OR 97403. Permission to copy without fec all or part of this material is granted provided that the copies are not made or distributed for direct commercial advantage, the ACM copyright notice and tbe title of tbe publication and its date appear, and notice is given that copying is by permission of the Association for Computing Machinery. To copy otherwise, or to republish, requires a fee and/or specific permission. c 1992 ACM 0730-0301/92/ 1000-305$01.50 ACM Transactions on Graphics, Vol. 11. No. 4, octoher 1992, Pages 305 335
Transcript of Modeling Pigmented Materials for Realistic Image Synthesismeyer/papers/haase-meyer-tog-1992.pdf ·...
Modeling Pigmented Materials for RealisticImage Synthesis
CHET S. HAASE and GARY W. MEYER
University of Oregon
This article discusses and applies the Kuhelka Munk theory of pigment mixing to computergraphics in order to facilitate improved image synthesis. The theories of additive and subtractivecolor m]xing arc discussed and are shown to be insufficient for pigmented materials. TheKubclka Munk theory of pigment mixing is developed and the relevant equations arc derived.pigmer]t mixing experiments are performed and the results are displayed on cokw tekm’ision
monitors. A paint program that uscs Kubelka Munk theory to mix real pigments is presented.Theories of color matching with pigments are extended to determine rcflectances for use inrealistic image synthesis.
(’categories and Subject Descriptors: 1.3.4 [Computer Graphics]: Graphics Utilities patnt.s,v,<tcm.s:1.17 [Computer Graphics]: Three-Dimensional Graphics and Realism color, .shad-jf),qr,.shfldofIIIIg,and textMI.(,
(;cneral Terms: Al~oritbms, Experimentation, Human Factors
Additi[,nal Key Words and Phrases: Color matching, color science, cnlor selection, illuminationmodeling. pigment mixing
1, INTRODUCTION
The illumination model in computer graphics is constantly being refined sothat it provides an ever more accurate model of reality. However, no illumina-tion model will work unless the objects in the scene have been properlydescribed. This fact has been realized and the surface properties of objectshave been painstakingly modeled, especially as they relate to reflectiondirection and strength. But a comprehensive approach to object modelingshould also take into account the physical makeup of those surfaces. Inparticular, most manufactured objects in the real world have pigmentedsurfaces, such as painted items, plastic objects, and textiles. To accurate] y
This research was funded by a grant from Apple Computer, Inc. Additional support was providedby the Hewlett-Packard (hmpany and the Oregon Advanced Computing Institute,..kuthors’ address: Department of Computer and Information Science, University of Oregon,Eugene, OR 97403.Permission to copy without fec all or part of this material is granted provided that the copies arenot made or distributed for direct commercial advantage, the ACM copyright notice and tbe titleof tbe publication and its date appear, and notice is given that copying is by permission of theAssociation for Computing Machinery. To copy otherwise, or to republish, requires a fee and/orspecific permission.c 1992 ACM 0730-0301/92/ 1000-305$01.50
ACM Transactions on Graphics, Vol. 11. No. 4, octoher 1992, Pages 305 335
306 . C. S. Haase and G. W. Meyer
model the color of any pigmented object, the physical interactions within thepigmented surface must be included.
A straightforward way of specifying color in a graphics scene is via thecommon red, green, and blue ( RGB ) triplet. This approach is the easiest todeal with in scene generation computations, since this specification is exactlywhat is needed by the computer to generate colors for the screen output. Butthis method is far removed from reality—the RGB method is only appropri-ate for additive colorants, such as colored lights (e.g., the phosphors in themonitor screen); nonemitting objects should be specified in terms of theirreflective and transmissive characteristics.
A second approach for specifying color is in cyan, magenta, and yellow( CiWY ) space. This specification is in the domain of subtractive color synthe-sis and accurately models the effect of light transmission through a coloredsurface. This specification is especially important with respect to the colorreproduction industry. For instance, color printer manufacturers must dealwith translating images from the domain of computer monitors (in which allcolors are RGB ) to the domain of hardcopy devices, in which the colors mustbe specified in CMY coordinates (Stone, et al., 1988). This subtractive methodis also used in some screen-based painting applications, such as Small (1991)and some commercially available programs, as a better attempt to modelrealistic color mixing. However, as will be shown in this paper, this method isinsufficient for representing pigmented surfaces, since CMY color synthesisworks best for purely transmitting materials; pigmented surfaces have bothtransmitting and reflecting characteristics.
The most accurate way of dealing with light in a synthetic imagingapplication is on a wavelength-by-wavelength basis [8, 14, 19]. It is only inthis way that the more subtle illumination modeling and color calculationproblems can be handled. The spectral energy distributions of the lightsources in the environment must be given and the spectral reflectance,transmittance, and absorptance of the surfaces with which these light sourcesinteract must be specified. Pigment mixing is an example of an opticalphenomenon which must be modeled in this way. The Kubelka-Munk theoryis used by the paint industry to predict the reflectance that will result whentwo or more pigments are mixed. This theory has been discussed within acomputer graphics context [12] but has not been used to solve color synthesisproblems.
In this paper we introduce the Kubelka-Munk theory of pigment mixingand apply that theory to computer graphics to facilitate correct-color calcula-tion for realistic image generation. Section 2 develops some of the significantdifferences in additive and subtractive color mixing and discusses the needfor different mixing theory for pigmented materials. Section 3 introduces anddevelops the Kubelka-Munk theory of pigment mixing. Section 4 discussesthe pigment-mixing experiments carried out for this project. Section 5 intro-duces the topic of color matching with respect to pigments; given a samplecolor, it is possible to calculate a pigment mixture that will render anapproximation to this color. The final section provides a summary.
ACM Transactions on Graphics, Vol. 11, No. 4, October 1992

Fragmented Materials for Realistic Image Synthesis 307
Fig. 1. Color television monitor gamut in CIE XYZ space
2. SUBTRACTIVE COLOR MIXING
The human visual system contains three types of daylight receptors, calledcones. The spectral sensitivity functions of the three cone types are different,but they do overlap significantly. Because there are only three types of conesto sample the entire visible spectrum, it is possible for two different spectralenergy distributions to produce the same three cone signals. When thishappens the visual system is unable to distinguish between the color sensa-tions evoked, and the spectral energy distributions are said to be metamers.This means that satisfactory color reproduction can be achieved withouthaving to perfectly reconstruct the original spectral energy distribution. Infact, the number, shape, and position of the spectral sensitivity functionsmake it possible to reproduce most colors by manipulating only the short,medium, and long wavelength regions of the spectral energy distributionsused to create the reproduction.
The most straightforward way of controlling the energy in these threedifferent portions of the spectrum is to combine the light from three sources.This approach, which is called additive color synthesis, is used in the stan-dard cathode ray tube of color televisions and monitors where three electronguns independently address the short, medium, and long (blue, green, andred) areas of the spectrum. For instance, in combining a light from the shortwavelength region with one from the medium wavelength region, a spectralenergy distribution is produced which elicits the visual sensation of cyan. Thecolor television monitor gamut produced by additively mixing the light fromthe three red, green, and blue primaries is shown in Figure 1.
A more indirect way of controlling the energy in the three different spectralregions is to place a stack of three filters in front of a light source. Thisapproach is called subtractive color synthesis, because information is re-moved from the spectral energy distribution of the light source. This ac-
ACM Transactions on Graphics, Vol. 11. No. 4. Octohcr 1992.

308 . C, S. Haase and G. W. Meyer
complishes the same goal as additive color synthesis but does not allowcompletely independent control of the short, medium, and long wavelengthregions of the spectrum. For instance, suppose two subtractive colorants areused—cyan and yellow—the cyan colorant transmits energy in the mediumand short regions of the spectrum (similar to the cyan produced in theadditive example above), and the yellow passes energy in the long andmedium regions. By combining these colorants in subtractive color mixing(further explained below), we derive a colorant which controls energy in themedium region and we see a green color; essentially, the short and longspectral energy present in both components was subtracted from the finalresult. Again, the visual system is being stimulated by selectively manipulat-ing particular regions of the visible spectrum.
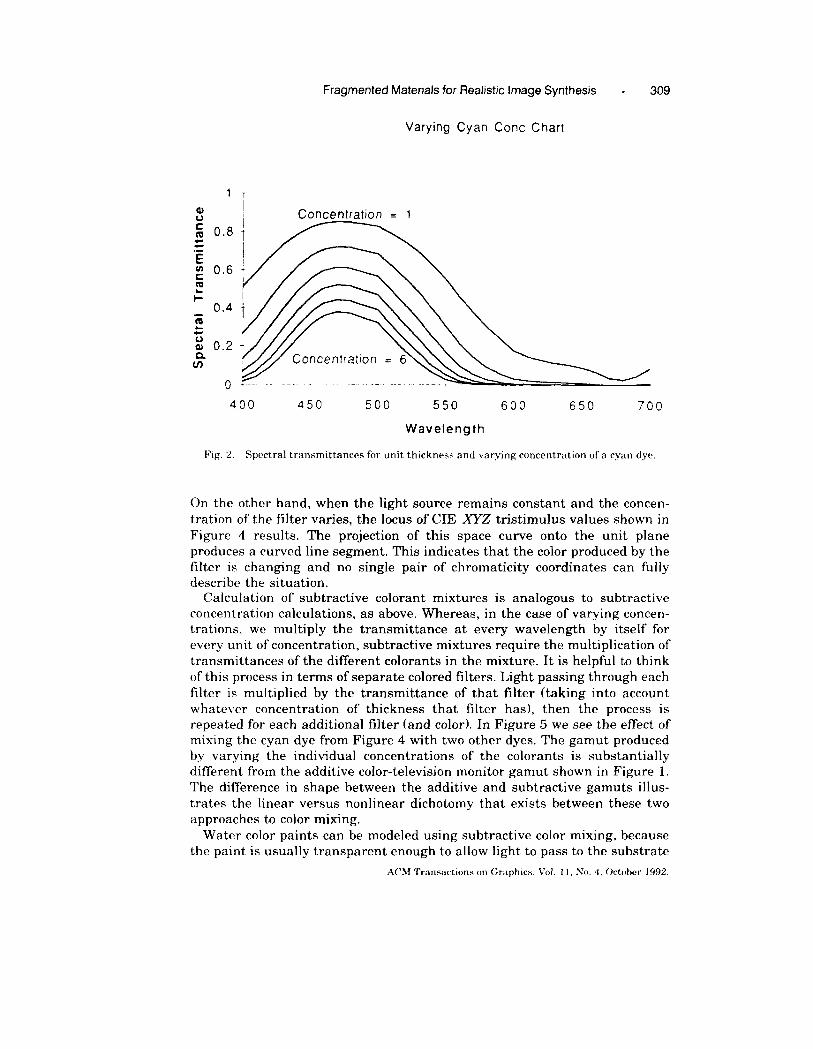
The example of the colored filter given above is a very simplified view ofsubtractive color. Instead of talking about the long, medium, and short areasof the visible spectrum, we can quantify the characteristics of a givensubtractive colorant on a wavelength-by-wavelength basis. In particular, ateach wavelength of the visible spectrum, the colorant will allow some givenpercentage of light energy to pass through. This information, plotted graphi-cally with wavelength versus the percentage of light passed through thematerial, gives us the transmittance curve for that filter. An example of sucha curve is seen in Figure 2, where we see that more light energy toward thelower end of the spectrum is allowed to pass than light energy at the higherend. Thus, given a light source which emits equal energy at all wavelengths,the resulting color of the light passing through the example filter would becyan.
These subtractive colorants are made from some clear material in which acolored substance is dissolved at a given concentration. The transmittancedata discussed above assumes a given thickness of the colorant layer, h, anda given concentration, c, of the colorant. If we change either of these variables—the thickness or the colorant concentration—we would expect the nature ofthe transmittance of the filter to change as well. These transmittance changesare described by the Bouguer and Beer laws. Bouguer’s law states that givena transmittance T at a particular wavelength and a thickness h, the trans-mittance at a thickness of nh at that wavelength is Tn. Similarly, Beer’s lawstates that given a transmittance T at a particular colorant concentration cand a constant thickness, the transmittance at that wavelength is Tm wherethe concentration is mc [10]. The effect of varying the concentration of ahypothetical dye can be seen in Figure 2.
Changing the concentration or the thickness of a filter produces a locus oftristimulus values which is much different than the collection of tristimulusvalues created by varying the intensity of a light source that shines through afilter with constant transmittance characteristics. Given a filter that corre-sponds to unit concentration of the dye shown in Figure 2, Figure 3 depictsthe locus of CIE XYZ tristimulus values produced by changing the intensityof the light passing through the filter. This locus is a straight line thatprojects to a single point on the unit plane. This means that a single pair ofchromaticity coordinates can be used to describe the colors that are produced.
ACM Transactions on Graphics, Vol. 11, No. 4, October 1992
Fragmented Materials for Realistic Image Synthesis . 309
Varying Cyan Cone Chart
IConcentration = 1
IT
1
I
1
.
..–— —— .
400 450 500 550 600 650 700
Wavelength
Fig. 2. Spectral transmittances for unit thickness and varying concentration of a cyan dye.
On the other hand, when the light source remains constant and the concen-tration of the filter varies, the locus of CIE XYZ tristimulus values shown inFigure 4 results. The projection of this space curve onto the unit planeproduces a curved line segment. This indicates that the color produced by thefilter is changing and no single pair of chromaticity coordinates can fullydescribe the situation.
Calculation of subtractive colorant mixtures is analogous to subtractiveconcentration calculations, as above. Whereas, in the case of varying concen-trations, we multiply the transmittance at every wavelength by itself forevery unit of concentration, subtractive mixtures require the multiplication oftransmittances of the different colorants in the mixture. It is helpful to thinkof this process in terms of separate colored filters. Light passing through eachfilter is multiplied by the transmittance of that filter (taking into accountwhatever concentration of thickness that filter has), then the process isrepeated for each additional filter (and color). In Figure 5 we see the effect ofmixing the cyan dye from Figure 4 with two other dyes. The gamut producedby varying the individual concentrations of the colorants is substantiallydifferent from the additive color-television monitor gamut shown in Figure 1.The difference in shape between the additive and subtractive gamuts illus-trates the linear versus nonlinear dichotomy that exists between these twoapproaches to color mixing.
Water color paints can be modeled using subtractive color mixing, becausethe paint is usually transparent enough to allow light to pass to the substrate
A(’M Transactions on (;raphim, Vol. 11, .?Jo.4, october 1992.

310 * C. S. Haase and G. W. Meyer
Fig. 3. Locus of values in CIEXYZ space resulting from shininga light of varying intensitythrough a cyan filter with con-stant concentration. The intersec-tion with the unit plane is asingle point.
Fig. 4. Locus of values in CIE XYZ space resulting fromshining a light of constant intensity through a cyan filterof varying concentration. The intersection with the unitplane is a curved line.
Fig. 5. Gamut produced in CIE XYZ space by mixingvarying concentrations of cyan, yellow, and magenta dyes.
and reflect back through the paint appropriately colored with respect to thetransmitting properties of the watercolor [lo]. Pigmented materials such asartists’ oil paints, on the other hand, do not work as well within thesubtractive domain. The preceding discussion assumed that the materialsinvolved were transparent and allowed light to pass through the substance,
ACM Transactions on Graphics, Vol. 11, No. 4. October 1992

Fragmented Materials for Realistic Image Synthesis . 311
I I
Fig. 6. Light interactions within a pigmented material (after Evans, 1948),
selectively absorbing light energy at certain wavelengths; but pigmentedsolutions consist of opaque particles in a transparent medium, quite differentfrom the completely transparent solutions of subtractive colorants.
To understand pigmented solutions, we must look at them on a particlelevel. Each pigment particle has both absorbing and reflecting properties.The absorption of a pigment particle is related to its transmittance, becauseabsorption is equal to 1 minus the transmittance. But in addition to thisabsorption effect, there is the effect of selective reflectance, or scattering, oflight energy. Scattering is the property that determines how much of theincident light is reflected from the surface of the pigment particle perwavelength. Each of these two factors (illustrated in Figure 6) can be de-scribed by spectral curves which describe the percentage of energy absorbedor scattered by the pigmented solution at each visible wavelength. Togetherthese absorption and scattering properties produce spectral reflectance char-acteristics which create the color that we observe.
The problem in making calculations based on these properties is that eachpigment particle in the solution has the properties of scattering and absorp-tion. In the case of the transparent solutions discussed previously, thecolorant was completely dissolved in the solution or material. But in the caseof pigments, the pigment material is ground up finely and distributedthroughout some filler, such as linseed oil in the case of artists’ oil paints.Making calculations based on the independent properties of scattering andabsorption for every pigment in the solution would require accounting for thesize, density, and shape of every particle. One of the theories of scattering
A(’M Transacti(]ns on Graphics, Vol. I 1, No. 4. octoher 199$2

312 . C. S. Haase and G. W. Meyer
and absorption of materials, the Mie theory, uses this information to calcu-late various properties of individual pigment particles. But this level of detailis somewhat too complex for calculating information about pigment solutions[17]. Some other means to calculate the absorption and scattering for theoverall material would be very beneficial. This, then, was the motivation forthe work done by Kubelka and Munk.
3. KUBELK+MUNK THEORY
Instead of looking at pigmented solutions on a particle level, Kubelka andMunk observed the effects of light energy in the entire solution. This ap-proach incorporated the ideas behind the pigment particle scattering andabsorption interactions, but allowed a much easier and more comprehensivecalculation of entire pigmented systems. By using this approach, Kubelkaand Munk came up with the equations that are still used in the pigmentindustry today.
Kubelka and Munk examined what happens as light traverses a thin layerof paint applied over a substrate. At any location in the paint, light from thesurface is moving deeper into the material and light that has reflected fromthe substrate is traveling back toward the top of the film. A certain fraction,K, of the light traveling in each direction will be absorbed by the material,and another portion, S, will be scattered. Light from each direction that isscattered is assumed to contribute to the amount of light traveling in theopposite direction. A set of differential equations were written as a result ofthis analysis. A complete derivation of these equations is given in theAppendix.
For complete hiding (i.e., when the pigment layer is so thick that thesubstrate cannot be seen), the solution of the differential equations for thereflectance, R=, is
/( )K2 KR.=l+; –
F+2F.
This is often rewritten as:
K
()(1 - R.)2
z= 2R. “
(1)
(2)
Using Equation 1, we can now derive the spectral reflectance of any pig-mented material at complete hiding if we know its respective K and S values(and the spectral properties of the solution in which the pigments areimmersed). These are the equations that were used for all of the workreported in this paper. Solutions to the differential equations can also befound for the case in which the spectral characteristics of the base materialaffect the spectral composition of the entire system [ 16].
ACM Transactions on Graphics, Vol. 11, No. 4, October 1992

Fragmented Materials for Realistic Image Synthesis
We can find the properties of mixtures of pigmented solutions byfact that combinations of absorption and scattering are linear [9]:
K,v = ~ K, c,1–1
Sw= ~ s,c,,=1
and
K
(-)
X: ,K, c,
s ~= L; ,S,c,
where
Kiv absorption of pigment mixture
SM scattering of pigment mixture
n number of pigments in mixture
313
using the
(3)
(4)
(5)
(’, concentration of i th pigment in mixture by weight of dry pigment
K, absorption of i th pigment
s, scattering of ith pigment.
Each equation is calculated for each wavelength. The use of these equationsin predicting mixtures and matches of colors is covered in later sections ofthis paper.
It is helpful at this point to look at the K and S values more closely interms of their significance and their calculation. First of all, the units of Kand S are not important for the purposes of these equations. As they arealways used in conjunction with each other for the Kubelka–Munk equations,their significance is in their ratio. This simplifies the gathering of theabsorption and scattering data significantly; instead of having to measure theactual units of K and S for any particular sample, we can use the equationsabove and spectral reflectance curves to derive unitless K and S values [ 15].
For example, to derive the K and S values for the titanium dioxidepigment used throughout this work, S was set equal to 1 at all wavelengthsand K was determined by using a given spectral reflectance curve for R [ 11]and Equation 2 above [ 15]. Once the K and S data for one pigment (titaniumdioxide, in this case) has been calculated, the K and S for any given pigmentmay be derived, using the equations above and data for the spectral re-flectance of various mixtures of the known pigment with the pigment inquestion. In the case of cadmium yellow medium, one of the primary pig-ments used in this project, two spectral curves were used [ 11]: one ofcadmium yellow medium as a masstorze (i.e., a pure pigment) and one ofcadmium yellow medium as a tint (i.e., mixed with titanium dioxide in agiven ratio). By using Equations 2 and 5 above, and knowing the K and Svalues for titanium dioxide and the relative concentrations of the pigments in
A(7.M Transact][ms IInGraphics, Vol. 11, N(I. 4, octoh~,r 19%?
314 . C. S. Haase and G. W. Meyer
the tinted sample, there were two equations in two unknowns, and the K andS values for cadmium yellow medium were solved for appropriately.
Again, the actual units of K and S are irrelevant as long as the relativeproportions of the factors are correct. However, pigment data gathered fromdifferent sources must be used with caution. For instance, if the data for twodifferent pigments were gathered from different sources (perhaps computedusing two different sets of K and S data for titanium dioxide), the pigmentsshould not be used together in the same equations. Unfortunately, the datarequired by the Kubelka–Munk equations must be extremely accurate, andgathering such data can be very difficult. The method of calculating K and Sgiven above is very straightforward, but those K and S values will only be asgood as the spectral curves on which they were based. Moreover, the datamust be consistent across pigments. For example, if titanium dioxide is usedas the tinting agent in the K and S calculations, any insufficiencies in thedata for titanium dioxide will be reflected in unsatisfactory data for all otherpigments that used these values in their own K and S calculations.
There are many areas in the process of data gathering which must behandled carefully. To begin with, the measurement of pigment data must beconsistent with its proposed use. For instance, since this research uses oilpaints for examples, we gathered data from oil paints. Spectral curves thatdescribe the reflectance for those pigments in other solutions are insufficientfor our purposes. Also, the mixing of the pigment compounds is important;the ratio of pigment to solution as well as the ratio of pigments in tints couldaffect the outcome. Application of the pigment compounds to the measure-ment background is also problematic; a layer of the pigmented solution whichdoes not completely hide the background will be affected by that backgroundcolor. Measuring the spectral curve for the mixture is another importantarea. The accuracy of the measuring device in addition to the suitability ofthe lighting and viewing conditions can strongly affect the outcome of themeasurements.
Several simplifying assumptions were made in the theory and equationsdeveloped by Kubelka and Munk. First of all, the pigmented solution istreated as a uniform material, assuming complete dispersion of pigment inthe solution and homogeneous density of pigment particles. In reality, vari-ous forms of deviations from this idea can occur, including flocculation(clumping) and floating of the pigment particles [211. Second, diffuse lightingand viewing conditions are assumed, and there is no account for surfacereflection. Finally, the pigment surface is assumed to be planar, with no lightescaping from the edges of the surface. This case is seen in the aboveassumption that light energy is either undisturbed, absorbed, or scattered.These assumptions are discussed more fully in [4] and [21].
Further work has been done on the Kubelka–Munk equations and itsshortcomings. An important example is the work of Saunderson [24], inwhich a formula was proposed which attempts to account for both externaland internal surface reflection. This formula is used to adjust the measuredreflectance from which K and S are determined. Given the Fresnel re-
ACM Transactions on Graphics, Vol. 11,No. 4, October 1992

Fragmented Materials for Realistic Image Synthesis . 315
tlectance equation:
where
n , refraction index of the external medium (i.e., the air)
nz refraction index of the internal medium (i.e., the oil).
Saunderson’s formula is as follows:
R“, –klR,=kl+
1 –kl –ky +kzR,~
(6)
(7)
where
R, theoretical reflectance; spectral reflectance adjusted for use in deter-mining K and S
R,,, measured reflectance; spectral reflectance measured by a spectropho-tometer
k[ front-surface reflectance of the film
kz internal reflectance of the film.
4. PIGMENT MIXING
Given a set of pigments with absorption and scattering data, we can calculatethe absorption and scattering curves for any specified mixture of the pig-ments using Equations 3 through 5 in the previous section. The K and Scurves for these pigments can then be used to derive the spectral curves forthe mixtures using Equation 1. Finally, the colors of these mixtures can bedisplayed on the computer monitor by converting the spectral curve to CIEXYZ coordinates and then transforming into the RGB primaries of themonitor. This ability to calculate correct pigment mixtures and display thoseresults accurately on the monitor means that we can now bring the world ofrealistic color selection and mixture into computer graphics. For instance,artists could use their experience with paints and palettes to select and mixcolors on the computer just as they would in the studio; they are no longerlimited to the RGB additive color selection methods that monitor technologyhas imposed.
The difference between organic and inorganic paint mixtures provides agood example of why it is critical to use Kubelka-Munk theory to predictpigment mixtures. This organic/inorganic distinction is an important one forartists; mixtures of white with inorganic paints tend to “gray” out much morethan those with organic pigments. For example, mixtures of napthol red (anorganic paint) with titanium dioxide and cadmium red (an inorganic paint)with titanium dioxide can be compared. Although the red colors look verysimilar in their masstone states, their respective mixtures with white arequite different. This difference can be seen in Figure 7 where the effect is
ACM Transactions on Graphics, Vol. 11, No. 4, octoher 1992.

316 . C. S. Haase and G. W. Meyer
Fig. 7. Canvas painted with real pigments showing mixtures of cadmium red (top)and napthol red (bottom) with titanium white. From left to right the tint concentra-tions were 2, 5, 10, 20, 40, 80, and 100 percent by dry weight of pigment.
demonstrated using real pigments. These differences are known to those whouse paints; artists choose their palettes very carefully based on the types ofcolors they would like to produce from paint mixtures.
The existing algorithms that are used in computer graphics to simulatepaint mixing are unable to capture this difference between organic andinorganic pigments. Commercially available electronic paint programs use anRGB instead of a spectral representation for the paints that are mixed. Aweighted average based upon the convolution mask of the brush profile istaken between the RGB of the paint being applied and the RGB of thebackground. Oddy and Willis 1221 have extended this approach to include apigment medium, but it is still an RGB averaging technique. For efficiency,paint programs often use the non-gamma corrected RGB values, whichmeans that the mixing cannot even be described as additive.
Given the RGB values for the pure cadmium red, napthol red, and tita-nium white pigments used in Figure 7, a pigment mixing simulation thatapplies this weighted average RGB approach leads to the result shown inFigure 8. Because there is no way to directly relate the pigment concentra-tions used to create Figure 8 to the proportions employed in the weightedaverage RGB approach, the color scales in this figure were computed bylinearly interpolating between the RGB values for titanium white and theRGB values for each of the two pigments. The white pigment RGB to redpigment RGB proportions are identical for corresponding swatches in thetwo color scales, and the initial proportions were selected so that the begin-ACM Transactions on Graphics, Vol. 11, No. 4, October 1992.

Fragmented Materials for Realistic Image Synthesis - 317
Fig. 8. Result of using paint mixing approach employed by traditional painting programs tosimulate the mixture of cadmium red and napthol red pigment with titanium white.
ning colors in the real and the simulated cadmium red scales were close (anexact match was not possible). Note that because both pigments in theirmasstone states have almost identical RGB values, there is little differencebetween the cadmium red and the napthol red color scales in the simulation.Converting from an RGB to a CiWY representation has no effect on thisresult because the transformation is linear. A wavelength-based approachthat models the pigments as cyan, yellow, and magenta filters is also inca-pable of capturing the mixing differences between the two pigments.
In order to correctly model pigment mixing in computer graphics, apigment-based approach, such as the Kubelka-Munk method, must be em-ployed. This is the only way to include the absorption and scattering phenom-ena that take place in real paint films. An important step in this approach isto obtain data for the pigments which is suited to the purposes of theapplication. In our case, we were comparing our research results with artists’oil paints, so we needed to get data for the pigments in a medium of oil.Off-the-shelf oil paints can contain various ingredients in addition to themain pigment, so we used pure dry pigment and linseed oil.
To obtain K and S data for the cadmium red and napthol red pigments, itwas first necessary to create masstone solutions for cadmium red, naptholred, and titanium white; this was done by mixing linseed oil with the purepigments. Next, a tint with titanium white was created for each red pigment
ACM Transactions on Graphics, Vol. 11. No. 4. October 1992.

—
318 . C. S. Haase and G. W. Meyer
Nap Tit New Chart
1.00
0.00Napthol Red Masstone
— .—
400 450 500 550 600 650 700
Wavelength
Fig. 9. Spectralreflectancecurvesfor titaniumwhite,naptholred, and a tint of titaniumwhitewith naptholred.
by combining measured amounts of dry pigment with oil. Spectral measure-ments were then taken of all masstones and tints (Figure 9). From thespectral curve for titanium white, we deduced K and S values for thatpigment by setting S equal to one at all wavelengths and solving for K. Usingthese absorption and scattering values and the spectral curves for the mas-stones and tints for each red pigment, the K and S curves were calculated asdescribed in the previous section (Figure 10). Finally, given the data for allthree pigments, the spectral curves for arbitrary concentrations were calcu-lated using Equation 1.
The results of the Kubelka-Munk modeled canvas are seen in Figure 11.This example compares favorably with the actual paint mixtures in Figure 7.It is interesting to contrast this result with that shown for additive mixing inFigure 8. With both the real mixtures and the Kubelka-Munk modeledmixtures, there is a marked difference between the two stripes; cadmium redgoes to white much faster than napthol red. But in the additive mixingexample, both pigments proceed at about the same rate and the difference atany given concentration is not very significant. These differences are quan-tifiable, using a color difference formula. In Figure 12, we have plotted A E asmeasured in CIE L*a*b* coordinates for the Kubelka-Munk and additivepictures. We can see that the color differences between the pigment scales inthe Kubelka-hfunk experiment are much higher for the tints at smaller redpigment concentrations. But with the additive experiment, the color difler-
ACM Transactions on Graphics, Vol. 11, No. 4, October 1992.

Fragmented Materials for Realistic image Synthesis . 319
napthol ks new chari copy
Fig. 10. K and S curves corresponding to napthol red pigment shown in Fig. 9
Fig. 11. Result of using Kubelka-Munk theory to simulate the mixture of cadmium red andnapthol red pigment with titanium white.
ACM Transactions on Graphics, Vol. 11, No. 4. October 1992.

—
320 . C. S. I+aase and G. W. Meyer
12
10
8
:6
4
2
Kubelka-Munk Mixing
J_____ RGB Mixing
1 2 3 4 5 6 7
Swatch Number
Fig. 12. Color difference in CIE L*a*b * space between the cadmium red and napthol red scalesin Figure 8 and between the same color scales in Fig. 11.
ences remain relatively flat, showing that the mixing differences for thepigments were not picked up by the additive mixing approach.
Another experiment that was performed for paint mixing calculationsinvolved modeling a color wheel which was painted using standard off-the-shelf paints and then modeled using data for the pigments in those paints.The color wheel (Figure 13) was thus constructed: the outer circle uses justthe three primaries-alizarin red, prussian blue, and cadmium yellowmedium—as marked on the canvas. These primaries were mixed in 50/50proportions to derive secondaries, which lie halfway between each of theprimaries. Each secondary was then mixed with each primary to derive thetertiaries, which complete the circle. The inner circle is composed of 50/50mixtures of the primaries and secondaries with titanium dioxide, shown inthe middle of the wheel.
The possible gamut in CIE L*a*b* space that can be produced using thesefour pigments was computed using Kubelka-Munk theory and is shown inFigure 14. For comparison, consider Figure 15 which shows the position inCIE L*a*b* space of the color television monitor gamut from Figure 1.Clearly the pigments are not capable of producing colors as saturated asthose created by the monitor. It is also interesting to note that a very darkcolor is also not possible using the four pigments selected. A simulation of thecanvas shown in Figure 13 was also done and is included as part of Figure 19which is discussed in Section 6. It should be noted that both the gamut inFigure 14 and the canvas in Figure 19 were not computed using data that wemeasured ourselves but from masstone and tint curves published elsewhere[11]. As described in the previous section, such data must be used with care,because of differences that may exist in materials and measurement tech-niques.
ACM Transactions on Graphics, Vol. 11, No, 4, October 1992.

Fragmented Materials for Realistic Image Synthesis . 321
Fig. 13. Canvas painted with real pigments showing mixtures of cadmium yellow (12o’clock), alizarin red (4 o’clock), prussian blue (8 o’clock), and titanium white (center).
There are many potential uses for this approach to color mixing. One ofthese applications is in computer painting programs; as the organic/in-organic mixing experiment pointed out, much more realistic results can bederived by using these pigment mixing techniques than by using currentpainting program mixing techniques. One such application that has beendeveloped is an airbrush program that uses the Kubelka-Munk approach tocolor mixing to predict realistic mixing of colors on the painting canvas.
Instead of using arbitrary RGB colors for the painting tool, the user selectscolors from among a palette of available pigments (Figure 16). This palette islimited only by the pigment data available to the program. When the userselects a color, the K and S data for that pigment is loaded into the airbrush.Painting then occurs in the usual paint program manner except that, wherecolors overlap on the canvas, their mixture is correctly computed and dis-played. This is accomplished by having each pixel, as well as the brush, keeptrack of its own current K and S values. When any pixel is painted over, newK and S values are calculated using the data for the brush and the pixel andEquations 3 and 4. Then the reflectance of the pigment mixture is deter-mined, the RGB tristimulus values are found, and the appropriate color isdisplayed in that pixel.
This painting program uses a K and S frame buffer technique which storesthe current K and S values for each pixel at four specific wavelengths. Thesewavelengths were selected to compute tristimulus values from spectral en-ergy distributions by using Gaussian quadrature [19]. Limiting the wave-length information is necessary for the purposes of real time interaction and
ACM Transactions on Graphics, Vol. 11, No. 4, October 1992.

322 . C. S. Haase and G. W. Meyer
Fig. 14. Gamut produced in L*u*b* space by mixingvarying concentrations of cadmium yellow, prussian blue,alizarin red, and titanium white.
Fig. 15. Color television monitor gamut in L*a*b* space.
conservation of memory resources. Since the pigment reflectances are quitesmooth, the errors caused by this low sampling rate are minimized. Theprogram also manipulates the floating point K and S values in appropriateinteger form to save memory resources. Future hardware developments maymake it possible to avoid these optimization methods and still maintain goodperformance.
5. COLOR MATCHING
Most scene generation in computer graphics involves specification of objectcolor by RGB triplets; this method is certainly an easy way to pick a color,ACM Transactions on Graphics, Vol. 11, No. 4, October 1992.

Fragmented Materials for Realistic Image Synthesis . 323
Fig. 16. Airbrush program showing pigment selection, current brush color,and artwork being worked on.
Fig. 17. Use of a hue, saturation, and brightness color model to select a color tobe matched. Program mixes pigment concentrations to generate a reflectance thatwill create the desired color.
and it is also readily interpreted by the computer during scene computation.However, when color fidelity is critical and when rendering techniques, suchas ray tracing and radiosity are being used, a wavelength based approach tospecifying color is necessary. A database of spectral reflectances can becreated [20] to facilitate the use of such curves in image synthesis. Colorsavailable when such an approach is used are limited to the number of curvesin the database. The number of possible colors can be increased, and thenumber of curves in the database can be decreased, by storing pigment datainstead of individual reflectances. Pigment mixtures can be determined by
ACM Transactions on Graphics, Vol. 11, NIL 4. October 1992.

324 . C. S. Haase and G. W. Meyer
using the techniques described in the previous section. However, speci&ingcolor in terms of pigment concentrations is not very intuitive for most people;if a particular shade of red is imagined for some plastic object in the scene,the typical computer user would probably not be able to come up withappropriate pigment concentrations which would produce this particular red.
What is required is a method for interpreting the user’s intuitive colordesignation and then producing a pigment specification. This problem isknown in the pigment industry as “color matching.” In standard color match-ing problems, a sample of color is presented and a match is computed whichmost closely approximates that color. For instance, if you want to repaintpart of your house but do not have the original paint, the paint store couldgive you a mixture which approximates that color using potentially verydifferent pigments than were used originally. What we need to do in com-puter graphics matching is analogous. For example, in creating a graphicsimage, the user may want to specify the color of a wall using RGB values(which could be textually or graphically entered, depending on what userinterface tools were available for the scene description). Then the matchingprogram would convert this color into concentrations of whatever pigmentsprovided the best match.
From the preceding sections of this article it is clear that, given a set ofpigments about which the proper data is known, we can predict the outcomeof mixtures of those pigments. Therefore it is reasonable to assume that wecan use these capabilities to calculate color matches with the pigments-thatis, given certain data about an arbitrary color, it is possible to specify whichpigments and concentrations are required to approximate the closest matchpossible to that color.
For this project, we wanted a program that would allow the user to specifya color in terms of its color space coordinates, either RGB or CIE XYZ. Animportant additional feature was to give the user a graphical interface forthis specification, so that the user did not have to know the actual coordi-nates but could choose the color interactively and visually. The programwould also allow the user to specify various parameters and constraints forthe program to use in calculating the match, such as how close the matchshould be and which set of pigments to use. Given this color specification, theprogram would compute the best color match with the given set of pigments.
There are several possible approaches to this matching problem. Theydiffer in the types of data required for the computations, the computationalcomplexity involved, and the suitability of the results. The most straightfor-ward approach to solving the problem is to iterate through the set ofavailable pigments, calculate their mixtures in all possible combinations andconcentrations, and choose the mixture that comes the closest to matchingthe sample. Although this brute-force method is certainly the slowest possi-ble, it is also the most accurate; since all possible mixtures are checked, theresult is the most correct. In addition, this method provides the greatestflexibility in terms of the data required for the calculations, because dataabout the sample can be provided in any suitable form. The calculationsdepend on the data only to the extent that it is needed to see how close a
ACM Transactions on Graphics, Vol. 11, No. 4, October 1992

Fragmented Materials for Realistic Image Synthesis . 325
mixture has come to matching the sample. The search time can be limited byvarious means, including: restricting the set of pigments being searched,halting calculations when a mixture comes within some specified tolerance,and having the program intelligently direct the search based on some criteriasuch as pigment suitability. Although these methods can shorten the searchtime significantly, a much more efllcient method is required.
Another approach to color matching is spectrophotometric matching [2, 5,17, 23, 27], in which the calculations attempt to find a match with a spectralcurve that best fits the spectral curve of the given color. While the algorithmused for this approach is much more eflicient than the brute-force approachdescribed above, the data required for the calculations are not appropriate forour application. Since the color we would like to match may be specified onlyin terms of CIE XYZ or RGB, we do not necessarily have a characteristicspectral curve to match against. Clearly, another method is needed.
Tristim UIUSmatching, a better approach, is the one taken in most of thecolor matching references used in this research, including [2, 3, 13, 17, 18].Just as in spectrophotometric matching, this method intelligently narrowsdown the search using a steepest descent method of optimization to find thebest match for a set of pigments. But this method also has the advantage ofrequiring that only the tristimulus coordinates of the sample color be matched.Tristimulus matching makes a linear approximation of the nonlinear func-tions involved in the Kubleka-Munk equations, so it may require severaliterations to arrive at an answer (if a match is possible). Each iterationresults in a new trial match which is then compared to the sample usingsome color difference formula. If the trial is not within a pre-specifiedtolerance, then a new match is calculated. If at any time the concentrationvalues of any of the pigments become negative, then a match with thesepigments is not possible.
While this method is adequate for many cases of color matching, it hassome disadvantages. Most significantly, this approach as described in theliterature is limited to a given set of three pigments plus white. To use theformulas as is, a general match from a larger set of pigments could only bederived by iterating through the set of pigments, coming up with the bestmatch from all sets of three. But in a general color-matching case, this maybe terribly inefficient; a large pigment database would require a substantialcalculation time to find the best match. Furthermore, the user may notnecessarily want to be limited to three pigments in the resulting color match.If a better match could be derived from a larger set of pigments, then it wouldbe helpful to provide that match instead.
Another problem with the tristimulus method is that the amount of changerequired in the pigment concentrations for the next match is based on theabsolute differences between the CIE XYZ coordinates of the current trialmatch and the sample match; a color difference formula is used to judgewhether the trial is a good match, but CIE XYZ coordinates are used toderive each new trial. The color difference formula would be a better metric touse in deriving the trial matches as is done in Cogno et al. [7]. Finally, it isimportant to account for metamerism in any color match. Metamerism is the
ACM Transactions on Graphics, Vol. 11, No. 4, October 1992.

—
326 . C. S. Fiaase and G. W. Meyer
degree to which a color changes in different lighting and viewing conditions.Usually, we do not want a color to appear very different across environments,so we would like to limit the degree of metamerism to some tolerance level.
A matching algorithm must therefore take into account an arbitrarily largeset of pigments, make better use of the color difference formula, and have theability to control the degree of metamerism. Its main goal, of course, is to finda match which is as close to the sample color as possible. In other words, thecolor difference should be equal to zero. Therefore, we need to minimize thecolor difference function.
The CIE L*a*b* color difference formula [28] is:
AE = [( Aa*)2 + (Ab*)2 + (AL*) 2] ’/2
where
()1/3
L* = 116 ; – 16
a*=500[Ei3-Er31
b*=200[(~r3-(:r31
(8)
(9)
( 10)
(11)
and
x, Y, z tristimulus values of the color in question
XO, YO,ZO tristimulus values of the light source
Aa*, Ab*, AL* differences in values between colorants.
First we note that minimizing this value can also be achieved by minimizingits square, A E2, thus we can eliminate the square root from Equation 8. Tofind the minimum for A E2, any of several numerical methods may be used.We used the method of steepest descent, which follows the negative of thegradient at any given point on the function to get as close to zero as possible.This is an iterative method, like the tristimulus method explained above,which takes guesses at minimum values and then refines these guesses byrepeated application of the same equation. Both this method and the tristim-UIUSmethod depend on some initial guess. Allen [1] describes an algorithm toderive an intelligent first guess based on spectrophotometric data. Lackingthis type of data, we use an arbitrary guess for the first trial, as suggested byBillmeyer and Saltzman [6].
An important constraint which complicates the situation is that the concen-trations of the pigments should remain positive. The tristimulus method, asdescribed in the references, does not attempt to find the closest match.Instead, if a match within the specified tolerance cannot be found, itscalculations return negative values for some pigment concentrations, indicat-ing that a match is not possible. Our method, however, should be able to
ACM Transactions on Graphics, Vol. 11, No. 4, October 1992.

Fragmented Materials for Realistic Image Synthesis . 327
obtain the closest match possible. This ability is especially important forwhat we are trying to accomplish—matching RGB colors with their closestsubtractive approximations; many colors in RGB space may not have exactmatches with any combination of pigments. Instead of using the positiveconcentration value as a constraint on the problem, though, we can rewritethe concentration value c, as the square of some value q,. This will allow theequations to be solved for the optimal qi values while the Ct values remainpositive. Using this technique allows us to keep the values of the concentra-tions positive without adding a complicating constraint to the problem.
Now we can proceed with finding the gradient for A E2. This will be thedirection vector toward the minimum. For the gradient we will need thepartial derivatives of the formula with respect to the q, of each of thepigments involved. We know that:
~AE~ I?AE2—_— x 2q*.
~q, (?Ct(12)
Next, by the Chain Rule:
(?AEP ~AE2 (7X dAE2 dY (?AE2 dZ——+ ——+——~c =
dx ac, dY (?C, az dc, “1
These component partials are written as follows:
/IAE2 –lOOO Aa* + 232 AL* + 400Ab*
dY = 3Y2’’3X;’3
dAE2 –400Ab*— .
dz 3z2/3zy3
and
(13)
(14)
( 15)
(16)
(17)
( 18)
(19)
where
(?R SMK, – KM S,
1
1
H~=
s;
x l-& ’20)
ACM Transactions on Graphics, Vol. 11, No. 4, october 1992.

328 . C. S. Haase and
and
k loo/’ZAsAyA
G. W. Meyer
‘A, yA, 2A observer matching functions
SA given light source
R, spectral curve of match
KM, SM K and S for the current match trial
K,, Si K and S for the ith pigment
A wavelength; our method uses 16 wavelengths, spaced at 20 nmincrements from 400 to 700 nm.
Given the current match trial, the gradient is just a vector containing thevalues for the left side of Equation 12. Some multiple of this gradient isadded to each current q, which are then used to derive new values for eachCi. These new Ci values are used to calculate a new match trial. If the matchis within a specified tolerance of the sample or if a match is not possible butthe nearest minimum has been reached, then the program is finished. If not,the process is repeated.
The factor by which the gradient is multiplied has a severe effect on thecalculation process, determining how fast an answer can be reached and howgood that answer is. For our program, we based the multiplier on a scalarfactor of the current color difference between the sample and the match;trials that were further away would take longer steps than those closer in.This method helps the program avoid overshooting the minimum and havingto backtrack. The other important consideration for the multiplier is for thosecases in which no perfect match is possible; in these cases, we would like toderive the closest minimum. The gradient multiplier helps this process. If theprogram ever overshoots the minimum, it is clear that the current step size istoo large. So a scaling factor is input into the equation which decreases thegradient multiplier by half. Overshooting again causes another halving of thescalar multiplier. In this way, the closer the program gets to a minimum,whether it is a match or not, the smaller steps it will take. Execution thencontinues until either a match or a minimum has been found.
A further important enhancement can be made to this approach to accountfor metamerism. In order to keep the degree of metamerism as low aspossible, the function to be minimized could be rewritten as some combina-tion of equations of the form of Equation 8, where each equation wascalculated for a different light source or viewing condition. Then minimizingthis new formula would result in a match which was minimized across thesedifferent conditions. The effects of metamerism upon the result could beeasily changed by weighting the different components of the equation appro-priately. For example, let us suppose that we wished to achieve a matchunder CIE standard illuminant C but also wished to minimize metamerismfor CIE standard illuminant A. Let us further suppose that the metamerismcomponent of the match was only ~ as important as the initial match. Thenour minimizing equation would be A E2 = 4 A E$ + A E;.
ACM Transactions on Graphics, Vol. 11, No. 4, October 1992.

Fragmented Materials for Realistic Image Synthesis . 329
The approach we took toward color matching provided two major advan-tages over the standard color matching techniques covered in the references.First, we minimize in terms of a color difference formula, so the results weget are the closest color match in terms of this formula. This is in contrast tothe tristimulus approach, which minimizes over X, Y, and Z and thus onlyachieves a minimum in tristimulus space, which does not necessarily corre-spond to a minimum color difference. Second, our formula admits an arbi-trary number of pigments and attempts to find a suitable match from thatset, regardless of how many pigments are to be used. This is helpful in manycases where either many pigments are required to make a match or the userdoes not know which limited set of pigments would be adequate. The tristim-UIUSmethod formula, on the other hand, requires there to be a set number ofpigments. In the usual form, this number is only three, though more could beadded for different light sources [13, 17]; in this case, the user would have toknow ahead of time which pigments were suitable or the machine would haveto iterate through a larger set of pigments until an appropriate match werefound.
There are some things about this approach, however, that would requirefurther development for a full-featured color matching algorithm. First, thissteepest descent approach is guaranteed to find a minimum, but it will notnecessarily be the global minimum; i.e., if there are many pigments involvedand the initial guess is far from the true global minimum, the equationsmight settle on a local minimum even though a better match might exist withsome other combination. This problem can be easily addressed throughpigment choice and through the initial guess, although a more automatedway of achieving this is desirable. Also, the equation does not take intoaccount the cost of the pigments, which is important in many color matchingapplications. Finally, there is currently no way to limit the number ofpigments used in the resulting match, other than the total number ofpigments involved; if the user inputs 100 pigments into the program, then theresult could potentially be a mixture which uses a small concentration fromeach pigment.
We developed a program using the above techniques and specifications.The user inputs several pieces of information for the search to begin. Tochoose the color to be matched, the user can input color coordinates eithertextually using CIE XYZ or RGB coordinates or graphically (Figure 17).Next, the user may choose which pigments should be used in determining thematch. The tolerance level, which is the color difference in CIE L*a* b* spacebelow which the computer considers the match successful, can also be speci-fied by the user. All of these selections are handled via a dialog box (Figure17).
Using this information, the program uses the method described above,iterating through several trial matches until a minimum is found. Data forthe closest match is displayed on the screen, including concentration valuesfor each of the chosen pigments, the color difference, the resulting CIE XYZvalues, a color swatch of the match color, and windows displaying thespectral curve and color of each trial used in deriving the match (Figure 18).
ACM Transactions on Graphics, Vol. 11, No. 4, October 1992.

—
. C.S. Haaseand G. W. Meyer
I Trial 1 /
] Trial 8
——— —-—. -—
400 450 500 550 600 650 700
Wavelength
Fig. 18. Final result ofasuccessful match bythecolor matching pro@amfor acolorselectidinthe manner shown in F]g. 17. The pigments used for this match were titanium white, prussianblue, cadmium yellow and alizann red. Successive attempts by the program to create the matchare shown.
6. CONCLUSION
The purpose of this work was to demonstrate the capabilities of realisticpigment modeling in the field of computer graphics. Techniques used in thepigment industry have been modified to work within the domain of computergraphics to facilitate more realietic computer color specification. The openingsections of this paper motivated and validated the approach taken here. Themixing techniques discussed in Section 4 provide the basis for better, morerealistic painting programs and other tools which require mixing and display-ing pigmented materials. Finally, the matching techniques discussed inSection 5 show the feasibility of combining intuitive color selection withrealistic color computation in generating realistic computer images.
As a final example, consider the image in Figure 19. Using the matchingand mixing programs described in this article we can derive spectral curvesfor arbitrary pigment mixtures. These curves can then be used to specifyrealistic colors for materials in computer generated scenes. Every color in thescene depicted in Figure 19 was described by a characteristic spectral curve.Most of the objects, except the RGB monitor picture and the white canvas,use curves which represent real pigment mixtures calculated by our pro-grams. For example, the color wheel on the canvas is based upon thepigments used to create the artwork shown in Figure 13. With the exceptionof the color television picture, notice that unrealistic highly saturated colorsdo not occur. The range of colors possible has been constrained in a realisticway by the selection of a limited number of pigments and by the accuratesimulation of their mixing properties.
ACM Transactions on Graphics, Vol. 11, No. 4, October 1992.

Fragmented Materials for Realistic Image Synthesis
Fig. 19. Image demonstrating the use of pigment mixing and color matchingtechniques. All surfaces had spectral retlectances determined from pigment mixtures.
APPENDIX
The Kubelka-Munk equations for complete hiding given in Section 3 wereused to perform the pigment mixing work described in this paper. They arederived here from the initial assumptions because this detail is not availablein most of the widely available references.
The situation as it occurs in a given pigmented solution is shown in Figure20. In this figure, the pigmented solution is a paint, applied in a uniformthickness of x over a substrate of reflectance R,. Let i be the incident lightwhich is transmitted down through the paint, either directly from the sourceor by scattering of light off of pigment particles. Let j be the light which isreturning to the surface, either by being reflected off of the substrate orscattered from pigment particles.
Suppose we are examining some very thin sub-layer of the paint, ofthickness dx. The amount of light that is lost from i through the layer is:
(K + S)icLx (21)
and the amount lost from j is:
(K + S)jdx
where S is the scattering component and K is the absorption. Now we mustadd back to i and j that light which was scattered from light coming in the
ACM Transactions on Graphics, Vol. 11. No. 4, October 1992.

—
332 . C, S. Haaseand G. W. Meyer
\ A
dx i j
\ ‘x
4
TSubstrate of Reflectance f3g
Fig. 20. Coordinate system used to calculate light energy scattering and absorptioninside a pigmented surface.
other direction; i.e., the light that was scattered from the incident light isadded to the light returning to the surface and vice versa. Then we have:
di=(K+S)idx– Sjdx (23)
–dj= (K+ S)jdx –Sidx. (24)
Note that since i and j represent light vectors traveling in opposite direc-tions, the change of their signs through the film are opposite,
The solution to Equations 23 and 24 begins by setting a = (1 + K/S) andreexpressing them as
di—=~i–jS dx
(25)
– dj
Sdx=aj–i. (26)
Adding these two equations together and rearranging leads to
idj –jdi .2— –2a$ + ‘~ + 1.
i2Sdx – 1
From the Quotient Rule, we get:
d(j/i) ‘ “2— .
S dx–2a< + ‘~ – + 1.
L
Setting r = j/i then gives us
dr
Sdx ‘r2–2ar+l
ACM Transactions on Graphics, Vol. 11, No. 4, Octcber 1992.
(27)
(28)
(29)
Fragmented Materials for Realistic Image Synthesis . 333
and therefore
/
dr
r’S J dx.
–2ar+l=(30)
We would like to know the value of the change in r as the thickness variesfrom O to some arbitrary thickness t.At a thickness of O, the value of r willsimply be the reflectance of the substrate, R~. At a thickness of t, thereflectance is equal to some R. Using integration by partial fractions we have
f
R dr 1 ~ dr
–/
1 R dr
fi~rz –2czr+l= –J2b~~r–(a +b)–2b~~r–(a– b)
~ in(R-a -b)(R~-a+b)——
2b (R–a+b)(R~–a–b)(31)
where b = ~az – 1. Therefore, from Equation 30
(R-a -b)(R~-a+b)A In = St.2b (R–a+b)(R~–a–b)
(32)
The particular thickness that we are interested in solving for is t = x, asthis thickness provides complete hiding of the substrate. We can solve for thereflectance at this thickness, R,, as t - X:
~n(R-a-b)(R~-a+b)= 2Stb
(R-a +b)(R~ -a-b)(33)
(R-a -b)(R~-a+b)~2.sth =( R-a+ b)(RX -a-b). (34)
For the following substitutions,
R=R,
RK=O
we get:
1R. =
a+fi
——‘+%-T” (35)
This form is one variation of the Kubelka-Munk formula for computing R,.The more common forms can be obtained from this by rearrangement and aregiven in the text as Equations 1 and 2,
A(’M Transactions on Graphics, Vol 11. NO 4, october 19~2

.
334 . C. S. Haase and G.
ACKNOWLEDGMENTS
W, Meyer
The authors would like to thank Robert Gamblin of Gamblin Oils for his helpin understanding the world of artists’ paints, Michael Ken y for writing theAirbrush pigment painting program shown in Figure 16, Christy Wisemanfor creating the artwork displayed in Figure 16, Linda Peting for developingthe color space visualization program that generated Figures 1, 4, 3, 5, and14, Sohail Mohammad for modeling the scene in Slides 8 and 11, and DavidCollett for his mathematical assistance in obtaining the color matchingmethod used in Section 5. The images shown in Slides 8, 11, and 19 wereproduced using the Radiance software package developed by Greg Ward atthe Lawrence Berkeley Laboratories and modified by Roy Ramberg at theUniversity of Oregon to handle light on a wavelength-by-wavelength basis.
REFERENCES
1.
2,3.
4.
5.
6.
7.
8.
9.10.11.
12.
13.14.
15.
16,
17.18.
19.
20.
21.
ALLEN, E. Basic equations used in computer color matching. J. Optical Sot. Am. 56, 9(Sept. 1966), 1256-1259.ALLEN, E. Analytical color matching. J, Paint Technoi. 39, 509 (June 1967), 368-376,ALLEN, E. Basic equations used in computer color matching 11. Tristimulus match, two-con-stant theory. J. Optical Sot. Am. 64, 7 (July 1974), 991–993.ALLEN, E, Advances in colorant formulation and shading. In MC Color77, F. W. Billmeyer,Jr, and G. Wyszecki, Eds, Adam Hilger, Bristol, England, 1978, 153-179.BfiLANG~R,P. R. Linear-programming approach to color-recipe formulations. J, Optical Sot,Am. 64, 11 (Nov. 1974), 1541-1544.BR.LMIIY~R,JR,, F. W. AND SALTzMti, M. Principles of Color Technology, Second Edition.Wiley, New York, 1981.C()~NO, J. A., JLIiSGMAN,D., ANDCONNO,J, C. Linear and quadratic optimization algorithmsfor computer color matching, Cokw Res, Appl. 13, 1 (Feb. 1988), 40-42.COOK, R. L. ANDTORRANCE,K, E. A Reflectance model for computer graphics. ACM Trans.Graph. 1 (1982), 7-24.DUNCAN,D. R. The colour of pigment mixtures, Proc, Phys, Sot., 52 ( 1940), 390-400.
EVANS,R. M. An Introduction to Color. Wiley, New York, 1948.FIITSKO,J. M., Er). NPIRI Rau, Materials Handbook, Volume 4 Pigments, National Associa-tion of Printing Ink Manufacturers, Harrison, N. Y., 1983.FISHKIN. K. P. Applying color science to computer graphics. Master’s thesis, Univ. ofCalifornia, Berkeley, 1983.GALL, L. Computer colour matching. In Colour 73, Adam Hilger, London, 1973, 153-178.HALL, R. A. ANDGREENIWRG,D. P. A testhed for realistic image synthesis, IEEE Comput.Graph. Appl. 3 ( 1983), 10-20.
JOHNSTON,R. M. Color theory. In Pigments Handbook, T. C. Patton, Ed. Wiley, New York,1973, 229-228.KORTOM, R. G. Reflectance Spectroscopy (English translation by J. E. Lohr), SpringerVerlag, New York, 1969.KU~HNL R. G. Computer Colorant Formulation, D, C. Heath, Lexington, Mass., 1975,MARSH, J, S. AND PLANT, D, A. Instrumental colour match prediction using organic pig-ments. J. Oil Colour Chem. Assoc. 47 (Aug. 1964), 554–575.MEYER, G. W. Wavelength selection for synthetic image generation, Comput. Vision, Graph,Image Process. 41 (1988), 57-79.MEVKR, G. W. AND HALIZ,R, E. A spectral database for realistic image synthesis. Graph.Interface ’91 (1991), 47-52.
MrITON, P. B. Opacity, hiding power, and tinting strength. In Pi~ments Handbook, T. C.Paton, Ed. Wiley, -New-York, 19;3, 289-339, - -
ACM Transactions on Graphics, Vol. 11, No. 4, October 1992.

Fragmented Materials for Realistic Image Synthesis . 335
22. OIM)Y, R. J. ~NIJW[[.MS, P, J. A physically based colour model, COmpuf. Graph. Forum 10(1991) 121-127.
23. PMW, R. H. ANOSTEARNS,E. I. Spectrophotometric formulation. J. Optical SW. Am. ,?4, 2(Feb. 1944), 112 113.
24. S.4(IN1JItMcJs,J. L. Calculation of the color of pigmented plastics. .1. Optlca/ .%x, Am, .’12(~~C. 1942),727-736.
25. SM.41.I.,D. Simulating watercolor by modeling diffusion, pigment, and paper fibers, InImage Handling and Reproduction Systems Integration, W. Bender and W. Plouffe, Eds.Pr{x. SP{E1460 (Bellingham, Wash., 1991), 140-146.
26. STOW, M. C,, COWAX. W, B., ANOBMTTY, J. C. Color gamut mapping and the pr-intingofdigital colorimages. AC’A4Trarrs. Graph. 7,4 (Oct. 1988),249-292.
27. WAI,OIWT,E., MCCARTIW, C. ,J., ANDBKRNS, R, S. Spectrophotometric color matching basedon two-constant Kubelka Munk theory, ColorRes. App/. 13, 6(Dec, 1988), 3.58 362.
28. WysXM~I, C,, AXn STI],FX, W. S. (%lor Science: Concepts and Methods, Quantitative Dataand Fornzu[ar, ,2nd Edition. Wiley, New York, 1982.
Receiv~d September 1991: revised March 1992; accepted June 1992
ACM Transactions nnGraphics, Vol. 11, Nw 4.oct,Jher 1992.