MODELING PEDESTRIAN SAFETY AT …d-scholarship.pitt.edu/33129/1/Thesis EIL MSIS.pdfMODELING...
104
MODELING PEDESTRIAN SAFETY AT ROUNDABOUTS by Elliott I. Levenson B.A., University of Pittsburgh, 1984 J.D. University of Pittsburgh School of Law, 1988 B.S. Computer Science, University of Pittsburgh, 2002 M.S.I.S. (Expected) Information Science, University of Pittsburgh, 2017 Submitted to the Graduate Faculty of The School of Information Science in partial fulfillment of the requirements for the degree of Master of Science University of Pittsburgh 2017
Transcript of MODELING PEDESTRIAN SAFETY AT …d-scholarship.pitt.edu/33129/1/Thesis EIL MSIS.pdfMODELING...

MODELING PEDESTRIAN SAFETY AT ROUNDABOUTS
by
Elliott I. Levenson
B.A., University of Pittsburgh, 1984
J.D. University of Pittsburgh School of Law, 1988
B.S. Computer Science, University of Pittsburgh, 2002
M.S.I.S. (Expected) Information Science, University of Pittsburgh, 2017
Submitted to the Graduate Faculty of
The School of Information Science in partial fulfillment
of the requirements for the degree of
Master of Science
University of Pittsburgh
2017

ii
UNIVERSITY OF PITTSBURGH
SCHOOL OF INFORMATION SCIENCE
This thesis was presented
by
Elliott I. Levenson
It was defended on
July 24, 2017
and approved by
Hassan Karimi, Professor, Graduate Program, Information Science and Technology
Yu-Ru Lin, Associate Professor, Graduate Program, Information Science and Technology
Thesis Advisor, Stephen C. Hirtle, Professor, Graduate Program, Information Science and Technology

iii
Copyright © by Elliott I. Levenson
2017

iv
MODELING PEDESTRIAN SAFETY AT ROUNDABOUTS
Elliott I. Levenson, M.S.I.S.
University of Pittsburgh, 2017
This study proposes a method for using a human participant in a field experiment to model
pedestrian safety at roundabouts in the United States. Studies show that roundabouts are safer for
vehicles, but are inconclusive as to whether pedestrians are at greater risk at roundabouts than at
signalized intersections. Recent simulations, including virtual reality, can model pedestrian vehicle
interaction, but the proposed technique could use real-world data to calibrate these models. Eight
hours of video was made to gather data at a signalized intersection and a roundabout. A physical
simulation was used to assess the pedestrian’s cross/don’t cross decision. Standard walking pace
was simulated at 3.5 feet per second and a disabled pedestrian at half that pace. This study focused
on factors such as signalization, approach streams, exit vs. entrance lanes, pace and direction to
provide a realistic picture of the cross vs. don’t cross decision. Data showed that slow pedestrians
had a significantly higher rate of don’t cross decisions at the roundabout. Roundabouts are thought
to be safer for pedestrians than signalized intersections due to a lower number of conflict points,
but the confusing multiple streams of roundabout traffic converging on exit lanes and the frames
of approaching traffic at roundabout entrances may mean that another concept may be needed to
fully capture pedestrian risks. The data on ‘relevant traffic’ showed that pedestrians had to be
attentive to almost six times as many approach streams of traffic in the roundabout as in the
signalized intersection. The value of this study is four-fold: 1) Future studies could revisit the
conflict point at the core of Traffic Conflict Analysis and consider conflict streams as well; 2)

v
Future studies could consider the cross/don’t cross decision as an important data point with which
to evaluate the safety of roundabout crossings; 3) Slow pedestrians fared worse in their ability to
cross at the roundabout than at the signalized intersection; 4) The human participant in a field
experiment method can be a valuable source of data for calibrating pedestrian safety simulation
systems.

vi
TABLE OF CONTENTS
PREFACE ...................................................................................................................................... xi
1.0 INTRODUCTION ............................................................................................................... 1
1.1 HISTORY OF SIGNALIZED INTERSECTIONS IN THE UNITED STATES ............ 1
1.2 THE ROUNDABOUT ALTERNATIVE ........................................................................ 2
1.3 ROUNDABOUT DESIGN .............................................................................................. 4
1.4 SAFETY STANDARDS IN ROUNDABOUT DESIGN ................................................ 6
1.5 CONFLICT POINTS AS AN ALTERNATIVE DATA COLLECTION EVENT ......... 7
1.6 A CASE FOR COMPREHENSIVE ANALYSIS OF PEDESTRIAN SAFETY AT ROUNDABOUTS ..................................................................................................................... 10
2.0 BACKGROUND AND RELATED WORK ..................................................................... 13
2.1 PUBLIC DATASETS ON ROUNDABOUTS, ACCIDENTS AND INJURIES ............... 13
2.2 RELATED WORK: THE EUROPEAN STUDIES ............................................................ 15
2.3 RELATED WORK: THE U.S. STUDIES .......................................................................... 18
2.4 USE OF CONFLICT POINTS AND VIDEO FOR ANALYSIS ....................................... 28
2.5 METHODS OF CONFLICT ANALYSIS .......................................................................... 29
2.6 DISABLED, ELDERLY, VISUALLY IMPAIRED AND CHILD PEDESTRIANS ........ 31
2.7 BICYCLE SAFETY AT ROUNDABOUTS ...................................................................... 32
2.8 RELATED WORK: THE HUMAN PARTICIPANT SIMULATION............................... 35
3.0 HYPOTHESIS, METHODS AND ANALYSIS ............................................................... 38
3.1 HYPOTHESIS – RESEARCH QUESTION ...................................................................... 38
3.1.1 Summary of Methods ................................................................................................................. 38
3.1.2 Human Participant in the Field Environment ............................................................................. 39
3.1.3 Accounting for Bias in the Experiment ...................................................................................... 39
3.1.4 Entrance and Exit Lane Data ..................................................................................................... 40
3.1.5 Conflict Streams ......................................................................................................................... 41
3.2 SITE SELECTION METHODOLOGY ........................................................................ 42

vii
3.2.1 Proof of Concept Data Collection Effort ................................................................................... 44
3.3 DATA COLLECTION MEASURES ............................................................................ 46
3.3.1 Video Camera Data Collection .................................................................................................. 46
3.3.2 Method: Contemporaneous Comparator Data ........................................................................... 47
3.3.3 Data Scenarios ........................................................................................................................... 49
3.3.4 Data Coding: Roundabout .......................................................................................................... 49
3.3.5 Data Coding: Signalized Intersection......................................................................................... 50
3.3.6 Data Extraction Technique ......................................................................................................... 52
4.0 EMPIRICAL DATA .......................................................................................................... 53
4.1 LIMITATIONS AND WEAKNESSES OF THIS STUDY ................................................ 53
4.2 CASE STUDY: ROUNDABOUT AND SIGNALIZED INTERSECTION, UNITY TOWNSHIP, PENNSYLVANIA ............................................................................................. 54
4.2.1 The Roundabout ......................................................................................................................... 54
4.2.2 The Signalized Intersection ........................................................................................................ 56
4.3 ANALYSIS ......................................................................................................................... 58
4.3.1 Case Study Experimental Design ............................................................................................... 59
4.3.2 Crossing Position ....................................................................................................................... 61
4.3.3 Traffic Volume ........................................................................................................................... 61
4.3.4 Roundabout Geometry ............................................................................................................... 64
4.3.5 Signalized Intersection ............................................................................................................... 64
4.3.6 Crossing Decisions ..................................................................................................................... 65
4.3.7 Roundabout Entrance Lane “Frame” ......................................................................................... 66
4.3.8 Observed Differences between the Signalized Intersection and the Roundabout ...................... 67
4.3.9 Direction of Travel ..................................................................................................................... 71
4.3.10 Speed of Pedestrian .................................................................................................................. 73
4.3.11 Effect of Multiple Vehicles ...................................................................................................... 75
4.3.12 Conflict Point Anomaly ........................................................................................................... 76
5.0 SUMMARY AND CONCLUSIONS ................................................................................ 81
APPENDIX A. GLOSSARY OF TERMS AND ACRONYMS .................................................. 84
BIBLIOGRAPHY ......................................................................................................................... 88

viii
LIST OF TABLES
Table 2.1: Table of Comparison of U.S. Studies of Pedestrian Safety at Roundabouts .............. 27
Table 3.1: Table of Intervention Techniques (Adapted from Retting, 2003) .............................. 45
Table 3.2: Data Description ......................................................................................................... 48

ix
LIST OF FIGURES
Figure 1.1: Basic Geometric Elements of a Roundabout ............................................................... 5
Figure 1.2: Key Roundabout Characteristics ................................................................................. 5
Figure 2.1: Vehicle-pedestrian conflicts at signalized intersections (FHWA, 2000, Ex. 5-5) ..... 30
Figure 2.2: Vehicle-pedestrian conflicts at single-lane roundabouts (FHWA, 2000, Ex. 5-6) ... 31
Figure 2.3: One-Lane vs. Two-Lane Roundabout Conflict Points (Cumming, 2011, at p.28) .... 34
Figure 3.1: Still from Video of Roundabout Pedestrian Simulation ............................................ 50
Figure 3.2: Still from Video of Signalized Intersection Pedestrian Simulation ........................... 51
Figure 4.1: Monastery Drive Roundabout (Glovis, EROS Center, USGS, 2017) ....................... 55
Figure 4.2: Pa. Route 981 Signalized Intersection (Glovis, EROS Center, USGS, 2017) .......... 57
Figure 4.3: Chart of Total Vehicular Traffic ................................................................................ 62
Figure 4.4: Chart of Percent of Relevant Traffic ......................................................................... 63
Figure 4.5: Chart of Total Decisions per Intersection Type ........................................................ 66
Figure 4.6: Entrance Lane Percentage Crossing Decision ........................................................... 67
Figure 4.7: Exit Percentage Cross Decision................................................................................. 68
Figure 4.8: Decision to Cross a Roundabout Entrance Lane Chart ............................................. 69
Figure 4.9: Decision to Cross at a Roundabout Exit Lane Chart ................................................. 70
Figure 4.10: Signalized Intersection Decision-making by Direction of Pedestrian Travel ......... 73
Figure 4.11: Cross Decision - Speed and Intersection Type Roundabout vs Intersection ........... 74

x
Figure 4.12: Percent of Multiple Vehicles vs Percent Cross Decisions....................................... 76

xi
PREFACE
I would like to thank Professor Hirtle, my Committee Chair for his guidance and Professor Hassan
Karimi, who together opened my eyes to the world of Geospatial Analysis. My thanks to Professor
Yu-Ru Lin, my Advisor for her instruction on Data Visualization and Data Mining. Thanks also
to Senior Engineer Pete Jenior of Kittelson and Association, Inc. in Baltimore, Jeff Bucher, P.E.
of the Pa. Department of Transportation, Jeff Shaw of the U.S. Department of transportation, the
HSIS, NHTSA and the IIHS, HLDI for data and support for my efforts. Thanks also to my wife,
Holly and daughter Margo for supporting me the past three years on this quest. Thanks also to my
Father, the late Dr. Myron Herbert Levenson, PhD. and my Mother, the late Dr. Beverly L. Darwin.
Thanks also to my brother, Barton Levenson, for his review of my Thesis and data and my
classmates Katie Rogers, Qilu Cao and Eric Corrado for their assistance and to my videographer
Jia Yin Tang. Thanks finally to the Professors, Students and Staff of the School of Information
Science for letting me fulfill my dream to go back to school and get my Master’s Degree.

1
1.0 INTRODUCTION
A review of past literature has shown that roundabouts are a safer alternative for motorized
vehicles than traffic-light controlled intersection, but do roundabouts actually increase the risk to
pedestrians and non-motorized vehicles? This paper will focus on whether a new method for
assessing safety at roundabouts provides more accurate data to research answers to this question.
1.1 HISTORY OF SIGNALIZED INTERSECTIONS IN THE UNITED STATES
The culture of urban and regional planning is in a constant state of change. In the last century,
concerns about improving traffic circulation to support commerce, military-inspired road building
projects and new ways of handling congestion came to the fore. As cities rapidly expanded,
concerns about safely moving pedestrians and traffic created a need for complex intersections with
traffic movement regulation.
One innovation was the electric traffic light. Osborne’s (2014) research indicated that the
first electric traffic light system was installed in the United States in 1912. The modern red, yellow
and green light system was implemented in Detroit, Michigan in 1920. The traffic light, in less
than a century of sustained use, may now be perceived as costly to municipal governments,
creating congestion and causing long idling times that create pollution. Palat and DelHomme

2
(2012), confirmed that drivers running yellow lights was a risk of signalized intersections that
contributed to accidents.
1.2 THE ROUNDABOUT ALTERNATIVE
A review of literature supports safer alternatives to traffic lights. The roundabout has been
identified as a primary solution. A Pennsylvania Department of Transportation initiative to replace
signalized intersections with roundabouts indicates the safety benefits for vehicles. (Lester, 2015)
"One of the most important benefits of a modern roundabout is the increased level of safety resulting from the reduction of vehicle-vehicle conflict points... On average, roundabouts in the United States have shown total crash reductions of 37 percent and injury crash reductions of 51 percent.” (PennDOT, 2001 p. 4.) Headrick and Uddin, (2014) used geospatial data analysis to evaluate the conversion of
signalized intersections to other methods. Their data evidenced more efficient traffic flow, faster
average speed, reduced delay, less idling time, fewer crashes, lower pollutant emissions, and
conservation of fuel. Wei, Grenard and Shah (2016) showed that capacity modeling could be used
to assist planners in justifying conversions to roundabouts. But, these studies did not focus on
pedestrians.
Mukai and Hayashi, (2015) were concerned that drivers may be unfamiliar with these new
roundabouts as they become installed in greater numbers. This could pose additional danger to
pedestrians. Allowing drivers to view instructional videos and use roundabout simulators may
alleviate this unfamiliarity (Insurance Institute for Highway Safety, 2010; Forum8, 2016). Mukai

3
and Hayashi (2015) approached this problem by using geospatial analytics to study how to best
train drivers unfamiliar with roundabouts.
Replacing traffic lights with roundabouts has been supported by initiatives at several levels
of Government in the United States and has been a topic of research and priority for the Federal
government since at least 2002, at the federal level (U.S. DOT, FHWA, 2015), state level (Lester,
2015; PennDOT, 2001), and municipal level. Most notable is the City of Carmel, Indiana
(Brochure [n.d.]), which has been converting almost all traffic lights to roundabouts.
A survey of pertinent literature will show that other nations and some municipalities in the
United States, such as Carmel, Indiana (Brochure, [n.d.]) have used roundabouts and traffic circles
to replace traffic lights. While current literature has shown that these conversions resulted in a
significant reduction in the severity of vehicular accidents anecdotal evidence may show a higher
risk to bicycles and pedestrians.
The FHWA (2015) in “A Review of Fatal and Severe Injury Crashes at Roundabouts” used
data on roundabouts from Washington State and Wisconsin. They specifically examined
pedestrian accidents at roundabouts. They looked at geometry, noting that splitter islands separate
entering and exiting traffic, deflect and slow entering traffic and provide a pedestrian refuge. They
noted that fatal roundabout crashes were less likely to involve pedestrians or bicyclists when
compared to fatal intersection crashes, but this may be due to the small number of roundabouts in
general.
The FHWA (2015) actually observed no pedestrian fatalities at roundabouts. Although
pedestrians and bicyclists were noted to be involved in only a small percentage of crashes, these
crashes were more likely to be severe. Bicycles were noted to be more commonly involved in
injury crashes at roundabouts than pedestrians; this could be due to bicycle sharing the traffic lanes

4
upon entering and traversing roundabouts. Accidents at roundabouts were only observed in
Washington State and pedestrian accidents only accounted for only 2-3% of all accidents at
roundabouts.
1.3 ROUNDABOUT DESIGN
The PennDOT Guide to Roundabouts (PennDOT, 2001) on p.2, distinguishes roundabouts from
traffic circles and rotaries. A roundabout has seven characteristics: 1) Yield control is used on all
entries, 2) Approaching roadways do not enter the roundabout perpendicular to the circulating
roadway, but, the traffic is deflected by splitter islands to enter at as small an angle as possible, 3)
Circulating vehicles within the roundabout have right of- way, 4) Pedestrian access is only allowed
across the legs of the roundabout behind the yield line, 5) Parking is not allowed within the
circulatory roadway or at the entries, 6) Vehicles circulate counter-clockwise and pass to the right
of the central island and 7) Raised Splitter Islands.
“Roundabout” is the term preferred by the United States and Pennsylvania governments.
PennDot distinguishes rotaries and traffic circles as follows:
"Rotaries generally had large diameters that resulted in high speeds within the circulatory roadway. They typically provided little or no deflection of the through traffic paths, and some required the circulating traffic to yield to entering traffic. The latter caused congestion, and the intersection would often ‘lock-up.’ Neighborhood traffic circles are typically built to calm traffic and/or improve the aesthetics of local street intersections. The approaches may by uncontrolled or stop controlled." PennDOT (2001) p.3
What does a roundabout look like and how does it work? We may examine the graphic from
PennDOT (2016b) at p.3-7. Note the entry and exit points, the circulatory roadway and the truck

5
apron. The PennDOT (2016b) diagram at p.3-8 shows the roundabout from the perspective of
moving traffic.
Figure 1.1: Basic Geometric Elements of a Roundabout
(PennDOT, 2016b Figure 3.6 at p. 3-7)
Figure 1.2: Key Roundabout Characteristics
(PennDOT, 2016b Figure 3.1 at p. 3-8)
The PennDOT (2016b) diagrams show roundabout characteristics that will be referenced
throughout this study. It is an optimal design, not necessarily reflective of all roundabouts. Number
of lanes, direction of travel and marked pedestrian lanes all have an effect on safety as we will see
in the review of the literature. While there are several categories for roundabout design, this study
will only focus on a single-lane roundabout with a 15-mph entry speed and one entering lane
approach.

6
1.4 SAFETY STANDARDS IN ROUNDABOUT DESIGN
The Public Transport Authority of Western Australia (2016) (PTAWA) set forth comprehensive
guidelines for roundabout design to make them safer for pedestrians. First, they noted two dangers
for pedestrians: 1) Right of way for vehicles and 2) Waiting for gaps in traffic to cross. Item one
would not hold true in Pennsylvania, as pedestrians proceeding legally in a marked crosswalk,
always have the right of way over vehicles. Furthermore, Pennsylvania being the locus of the
study, mandates right-of-way for the pedestrian once they enter the crosswalk:
Pa. Cons. Stat. 75 § 3542. "Right-of-way of pedestrians in crosswalks. (a) General rule.--When traffic-control signals are not in place or not in operation, the driver of a vehicle shall yield the right-of-way to a pedestrian crossing the roadway within any marked crosswalk or within any unmarked crosswalk at an intersection.")
Disadvantages noted by the PTAWA were that: 1) Turning vehicles have right of way over
pedestrians crossing the carriageway and 2) Pedestrians need to select appropriate gaps in the
traffic stream. The gaps are where the danger may arise for the elderly, the handicapped and
children as they must make decisions about when to traverse the entering and exit lanes of the
roundabout. (PTAWA, 2016 p. 172)
The PTAWA recommended several engineering countermeasures including: reducing
vehicle approach speeds via entry curvature or deflection on approaches, ensuring unobstructed
sight lines between pedestrians and motorists, ensuring crossings are located within pedestrian
walk lines, splitter islands which are as large as the site allows and locating signs and vegetation
so as not to obscure pedestrians, particularly children and people in wheelchairs. (PTAWA, 2016
pp. 173). These design issues, while not the focus of this study aided in site selection, evaluating
the overall safety of the physical site and the geometric design of the location being studied.

7
1.5 CONFLICT POINTS AS AN ALTERNATIVE DATA COLLECTION EVENT
In the absence of the rare actual collision and injury observation, recent analysis presumes that it
would be nearly impossible to observe enough accidents at intersections to draw valid conclusions
about safety, unless one had unlimited automated traffic monitoring 24 hours a day for a year at
multiple intersections. (Sadeq and Sayed, 2016). The strength of the 'Traffic Conflict Technique'
for analyzing traffic safety as a proven solution to this lack of data was analyzed at length by Sadeq
and Sayed (2016). Amundsen and Hydén (1977) viewed traffic conflicts as events where two or
more road users approach one another in space and time such that there will be an imminent
collision if their movements don’t change.
Roundabout geometry is important in understanding these ‘conflict points’. Gross (2013,
p.235), defined conflict points as points in an intersection where traffic is “crossing, converging
and diverging”, as illustrated in the graphic below. This definition is critical, because many studies
used conflict points as criteria for assessing safety. Retting (2003) defined ‘conflicts’ as locations
where a vehicle had to change direction to avoid a collision.
Possible data collection techniques may include:
• Before and after studies of pedestrian injury at converted roundabouts. (Gross,
2013)
• Review of comprehensive datasets on pedestrian injury at roundabouts. (Stone,
2002)
• Broad and continuous automated observation of intersections for accidents with
injury (requiring intense application of resources). (Hourdos, 2012; Flannery, 2001)

8
• Anecdotal evidence of roundabout safety issues from multiple sources. (Flannery,
2001)
• Manual observation of traffic and pedestrian flow through hypothetical conflict
points. (Ismail, 2009)
There are many possible measures for assessing safety risks that focus on conflict points.
A brief survey of these methods proved instructive in determining which measures to select. Ismail
(2009), selected (TTC) as it was the primary traffic conflict indicator in the literature. Ismail (2009)
noted that accurate estimation of TTC required considerable field measurement of road user
position, speed, and direction of movement. Other conflict indicators mentioned by Ismail (2009)
were gap time (GT), post-encroachment time (PET), and deceleration rate (which are the primary
measures for left-turn conflicts).
• Post encroachment time (PET) - time difference between the moment an offending
road user leaves an area of potential collision and the moment of arrival of a
conflicted driver with right-of-way.
• Gap time (GT) – was calculated at each instant by projecting the movement of the
interacting road users in space and time.
• Deceleration-to-safety time (DST) - deceleration to reach a nonnegative PET value
if the movements of the conflicting road users remain unchanged. (DST captures
greater details of the traffic event.)

9
Sadeq and Sayed (2016) mention that video (such as the University of British Columbia
'automated traffic safety tool') is the favored mechanism for recording traffic flow by use of various
computerized and automated techniques due to rich detail accuracy and a permanent record
allowing conflicts to be reviewed and analyzed at any later time.
What is it about the Traffic Conflict Technique (TCT) that would prove more helpful than
observation of real accidents? TCT gathers real field data in contrast to hypothetical simulations,
such as that of Saccomanno (2008), who presented a comprehensive analysis of traffic simulations.
However, Sadeq and Sayed (2016) point out that the video technique allows analysts to proactively
observe unsafe driving at the roundabout and investigate the relationship between maneuvers and
road characteristics.
Sadeq and Sayed (2016) used five cameras mounted on buildings above a roundabout in
Vancouver, British Columbia, Canada. The roundabout was similar in geometry to the Latrobe
Roundabout used in this study, except that the Vancouver Roundabout is two-lane at all entry and
exit points and it had marked pedestrian crossing across each lane and through the splitter islands.
Video recording is a proven technique, as manual data collection of conflict point activities
is too difficult to record due to high traffic volume, but use of measures such as TTC, while
valuable, might prove very complex for studying understand the pedestrian decision-making
process.

10
1.6 A CASE FOR COMPREHENSIVE ANALYSIS OF PEDESTRIAN SAFETY AT
ROUNDABOUTS
Retting (2003) observed that roughly 100,000 pedestrians are injured and 4,500 pedestrians are
killed every year by motorized vehicles. He observed that the problem is worse for vulnerable
pedestrians. Retting (2001) in his earlier study, viewed the greatest danger as vehicle speed. He
saw the solution to be in traffic engineering. His study concluded that regression to the mean
among high samples sizes gave results that might not be conclusive about whether roundabouts
really were effective countermeasures. Thus, the few European studies that directly addressed
pedestrian safety at roundabouts may require further examination.
Ismail (2009) encouraged collection of more data and further analysis to understand the
processes that cause pedestrian collisions. He also noted that pedestrian injuries and fatalities occur
with unexpected frequency in traffic incidents, despite the fact that the volume of data on
pedestrian exposure to collision risk was sparse, compared with data on vehicle collisions. He also
mentioned a growing municipal sustainability movement, which encouraged improvement of
pedestrian traffic conditions, with increasing public fund allocation for safety programs that focus
on pedestrian injuries.
Harkey’s (2006) U.S. study noted that as roundabouts gained popularity in the U.S., there
was concern that although roundabouts were safer for vehicles, they might not provide pedestrians
greater safety benefits. Harkey (2006, p.2.) notes:
“Although available information suggests that Roundabouts are relatively safe, there is concern about the effects of different design configurations on the safety of bicycles and pedestrians, particularly pedestrians with disabilities. For example, pedestrians with blindness and low vision use cues from traffic sounds to determine

11
when to cross the roadway. The free-flowing traffic at a Roundabout can sometimes make this task extremely difficult.” p.2
Gross (2013) also noted the need for a substantially larger database than earlier U.S. studies
provided. This lack of data led to inconsistent knowledge on the safety effects of conversion of
signalized intersections to roundabouts. More data was needed to shore-up safety estimates and to
better identify geometry and traffic conditions where conversion to roundabouts would provide
safer conditions.
Gross (2013) did a ‘before and after’ analysis of converted roundabouts in eight states in
the U.S. He claimed that his study accounted for the ‘Regression to the Mean’ problem noted by
Retting (2014) which had been a possible concern about the European studies of pedestrian safety.
Barnett, Pols and Dobson (2005, p.215) describe this phenomenon:
"Regression to the mean (RTM) is a statistical phenomenon that can make natural variation in repeated data look like real change. It happens when unusually large or small measurements tend to be followed by measurements that are closer to the mean...The effect of RTM in a sample becomes more noticeable with increasing measurement error and when follow-up measurements are only examined on a sub-sample selected using a baseline value... RTM is a ubiquitous phenomenon in repeated data and should always be considered as a possible cause of an observed change. Its effect can be alleviated through better study design and use of suitable statistical methods."
Gross (2013) argued that the studies of pedestrian safety at roundabouts are only now
at the same starting point where studies of vehicular safety at roundabouts were at their
inception. There is just not sufficient attention to pedestrian accidents to build a sufficient
dataset worthy of statistical significance. This work hopes to build on Gross’ (2013) desire

12
for more data and provide a useful method for gathering pedestrian safety data at
roundabouts.

13
2.0 BACKGROUND AND RELATED WORK
This chapter will focus on two aspects: 1) a review of existing datasets to provide an overview of
data on pedestrian injuries and Fatalities in the United States and 2) a discussion of related
international and U.S. work on this topic. The datasets and literature will be reviewed to determine
if accidents with serious injury or death are reduced by roundabouts for pedestrians and if the
existing methods to gather data pedestrian roundabout safety may be augmented.
Data from PennDOT and the Fatality Analysis Reporting System (FARS) from the National
Highway Traffic Safety Administration (NHTSA) was reviewed. FARS is a census of fatal motor
vehicle crashes that occurred within the U.S. since 1975. The Highway Safety Information System
(HSIS) is a multistate database published by the University of North Carolina Highway Research
Center (HSRC) and sponsored by the Federal Highway Administration (FHWA) containing crash
and safety data from a select group of states.
2.1 PUBLIC DATASETS ON ROUNDABOUTS, ACCIDENTS AND INJURIES
The Pennsylvania Department of Transportation embarked on an effort to transform signalized
intersections to roundabouts. See PennDOT (2016a). As of this date, 29 of 60 contemplated
conversions were completed. 10 of these converted signalized intersections were analyzed by
PennDOT, using the ‘before-and-after’ technique to determine if they provided a higher level of

14
safety after conversion. The trends were similar to those seen in other studies. The study found
that fatalities, major and moderate injuries were reduced, possibly by the 'calming effect' of
roundabouts on vehicle traffic. Oddly, minor injury and property-damage-only accidents
increased, possibly due to driver confusion about roundabout rules or geometry. (PennDOT 2017).
However, pedestrian accidents were not examined.
The dataset PennDOT provided is sparse, as the 10 converted signalized intersections are
in low-volume areas as opposed to urban centers like Philadelphia. The small dataset does s some
trends supported by other research. At the 10 intersections studied, they noted 16% fewer crashes
overall, 49% fewer accidents with significant injury or fatality, but 15% more accidents without
injury
The NHTSA (2017) collects data on vehicle accidents and injuries across the United States.
They tracked injuries from 2001-2015. Their data showed that roughly 70,000 pedestrians are
injured from vehicles accidents out of approximately 2.5 million accidents per year. The number
of accidents with injury has declined over this period, but the percentage of pedestrians injured
relative to all vehicle accidents with injury has risen (NHTSA, 2017). As noted in the literature
cited later in this study, it is unclear how many of these accidents occurred at roundabouts.
An NHTSA (2017b) breakdown from the Fatality Analysis Reporting System (FARS) does
show many different categories of intersections where pedestrian injuries occurred, but there is not
yet a specific category for roundabouts, making it a time-consuming task determine which
accidents occurred at roundabouts.
A website created by Kittelson & Associates (2017a), one of America’s foremost experts
on roundabout design engineering, visualizes an in-depth survey of roundabouts in the United
States. Kittelson’s searchable database comprises roundabout data from 1999 to the present,

15
identifying approximately 3,800 existing and proposed roundabouts. While Kittelson’s (2017b)
work is a good start to allow matching of accidents to roundabouts, much more data is needed to
understand the safety effects of converting signalized intersections to roundabouts in the United
States.
A first-hand exploration of the data confirmed what most of the U.S. studies note: that available
data is too sparse. This requires a more comprehensive effort to get clearer data to determine
whether roundabouts are safer for pedestrians than signalized intersections.
2.2 RELATED WORK: THE EUROPEAN STUDIES
The FHWA’s (2000) research relied on European countries due to a lack of United States research
on the topic of pedestrian safety at roundabouts in the U.S. at that time. They examined the studies
from the U.K. (Crown, 1998; Maycock, 1984), Holland (Schoon, 1993), France (Alphand (1991);
CETUR (1992); SETRA (1998)) and Norway (Seim, 1991). Sixteen types of collisions were
organized in the FHWA table “Comparison of Collision Types at Roundabouts” (FHWA, 2000)
on p. 114, which examined roundabout accidents from France, the U.K. and Australia. They listed
three types of pedestrian accidents by percentage of all accidents at roundabouts: Pedestrian on
crosswalk (3.5-5.9%), pedestrian outside crosswalk (1%) and pedestrian in circulatory roadway
(3.5%).
The FHWA (2000) noted that while roundabout safety was improved for motor vehicles, but
less so for pedestrians, citing Maycock’s (1984) British study and Schoon’s (1993) Dutch study.
The FHWA (2000) reasoned that the safety effects of roundabouts were due to lower vehicle

16
speeds, fewer conflict points and the splitter island which allows pedestrians to observe entering
and exiting vehicles separately.
Seim’s (1991) Norway study of 59 roundabouts and 124 signalized intersections on crash data
between 1985 and 1989 showed that only one of 33 crashes with injury recorded at the roundabouts
involved a pedestrian, compared with the signalized intersections, where pedestrians were
involved in 57 of 287 injury crashes. Maycock’s (1984) study broke down the types of roundabouts
where accidents occurred, including mini, conventional, flared and signalized, while Schoon’s
(1993) study compared vehicle types as well as pedestrian-involved crashes at roundabouts.
Single-lane roundabouts were considered safer than multilane because of fewer conflicts between
road users, and shorter pedestrian crossing distances. In general, the safety effects from
roundabouts were due to: 1) roundabouts having fewer conflict points than signalized intersections
reducing crash rate and severity, 2) lower absolute vehicle speeds, 3) consistent relative speeds
among vehicles, 4) Pedestrians only having to observe one direction per lane, meaning fewer
places to check for conflicting vehicles, 5) vehicles approaching from defined paths and 6) a lower
magnitude of conflicting flows at each conflict point vs. the chaos of signalized intersections
FHWA (2000, p. 103-104).
The U.S. Insurance Institute for Highway Safety (IIHS), also relying heavily on the earlier
European studies, concluded that:
"Roundabouts generally are safer for pedestrians. Pedestrians walk on sidewalks around the perimeter and cross only one direction of traffic at a time. Crossing distances are relatively short, and traffic speeds are lower than at traditional intersections." (IIHS 2016)

17
The IIHS Highway Loss Data Institute (HLDI) stated on their site that "Two studies also
have reported reductions in pedestrian crashes of about 75 percent after conversion to
Roundabouts." But the articles and supporting data were not cited. (HLDI, 2004). Retting (2003
p. 1457), discussing Brilon’s (1993) German study and Schoon’s Dutch study (1994) addressed
the issue directly:
“European studies indicate that, on average, converting conventional intersections to Roundabouts can reduce the rate of pedestrian crashes by about 75%. Single-lane Roundabouts, in particular, have been reported to involve substantially lower pedestrian crash rates than comparable intersections with traffic signals.”
Retting (2001) goes on to compare the three best known studies on the issue of pedestrian
safety at roundabouts, albeit the most recent study is almost 25 years old: 1) Brilon (1993) –
Germany: Before-and-after study on 25 intersections converted from traffic signals or stop signs
to modern roundabouts: pedestrian crashes decreased 75%. 2) Schoon (1994) – Netherlands:
Before-and-after study on 181 intersections converted from traffic signals or stop signs to modern
roundabouts: pedestrian crashes decreased 73%. 3) Brude and Larsson (2001) – Sweden: Empirical
data for 72 roundabouts compared with comparable intersections with signals: One lane
roundabouts: pedestrian crashes were 3–4 times lower than predicted for comparable signalized
intersections, but two lane roundabouts showed pedestrian crash risk comparable to signalized
intersections.
It is striking that Brude and Larsson (2001) noted that single-lane roundabouts are safer for
pedestrians than double-lane roundabouts. This could be due to a higher number of conflict points.
In a previous study of pedestrian safety, Retting (2001) did a broad survey of before-and-after data
on vehicle accidents after roundabout installation, but he noted that only four pedestrian and three

18
bicycle accidents were observed in all of the data. He stated: “However, these samples are too
small to give conclusive evidence on the safety of these road-user groups at Roundabouts.” Retting
(2001) at p.631.
The European studies were based on European installation of roundabouts preceding the
American effort by at least 20 years, and it should be studied whether the culture and rules of
European driving and pedestrian behaviors are significantly different from those of the U.S.
2.3 RELATED WORK: THE U.S. STUDIES
Recent U.S. efforts to evaluate safety at roundabouts were conducted by Hourdos (2012), Stone
(2002), Rouphail (2005) and Harkey (2006). As discussed below, Stone (2002) noted the limited
amount of U.S. pedestrian safety data, because pedestrian-vehicle crashes are rare when compared
to vehicle-vehicle crashes. Thus conflict data, models and simulations are needed to gather
adequate data to draw valid conclusions. Stone (2002) observed that a lack of data could be due to
documented intersections being located where there is few pedestrians and that roundabouts lack
identifiable categories in accident reports and thus are not easily identified in the U.S. accident
databases.
Stone’s (2002) goal was to study the safety aspects of modern roundabouts for pedestrians.
While roundabouts were common throughout the world, the U.S. only recently saw them as
potentially safe. Stone’s (2002) team also sought to 1) identify useful methods to study the
problem, 2) compare existing methods to synthesize a research methodology and 3) by case study,
to understand the safety of a roundabout compared to a conventional signalized intersection.

19
Stone (2002) does touch on the issue of pedestrian safety as a matter of perception, finding
that many pedestrians do not perceive roundabouts as safe even though approach speeds are lower
and unexpected turning movements are precluded. He observed that both roundabouts and two-
way stop-controlled intersections require pedestrians to judge ‘gaps’ in the major stream of traffic.
He mentioned that while some literature concluded that pedestrian safety was worse at roundabouts
vs. stop sign controlled intersections, there was a lack of studies to substantiate their opinions.
Stone (2002) learned that roundabouts may be difficult to traverse for pedestrians with
physical impairments due to: 1) longer crossing distances, 2) traffic in constant motion, and 3)
difficulty for visually impaired pedestrians to judge gaps from sound alone. He recommended that
signalized intersections offered explicit guidance to pedestrians through visual and audible signals,
so that the decision process for visually impaired pedestrians may be easier than at roundabouts.
He noted that at signalized intersections, pedestrian signals protect pedestrians when traffic
volumes are heavy. Walk signals consisting of illuminated words or symbols assigned right-of-
way and guaranteed adequate crossing time.
First, Stone (2002) observed that as roundabouts were implemented in the U.S., pedestrians
could be prone to unsafe crossings for reasons including new geometries and lack of signalization.
He discussed European, Australian and U.S. studies that documented how slower speeds and
(relying on the FHWA’s (2000) definition of ‘conflict point’) a reduction in conflict points from
32 at the signalized intersection to 8 at the roundabout, improved vehicular and pedestrian safety.
But, Stone (2002) asserted that existing literature on U.S. roundabouts was unclear on pedestrian
safety, especially for the disabled, due to scarcity of pedestrian accident data at roundabouts,
especially at signalized intersections reconstructed as roundabouts.

20
In his research, Stone (2002) employed a case study, statistical analysis and simulation to
compare pedestrian safety at a conventional signalized intersection to a modern roundabout.
Pedestrian accident histories for the signalized intersection were examined with and without the
proposed roundabout. The goal was to quantify the magnitude, frequency and severity of the
pedestrian safety problem, conduct crash analyses for certain pedestrian accident cases at
roundabouts and signalized intersections and identify factors that correlate with pedestrian
accident causation and safety improvement.
Stone (2002) chose a location to collect data on traffic and pedestrian volumes, road
geometry and accidents. Next, he performed forensic analysis on collected data to document causes
of pedestrian accidents. The final step was to conduct accident analysis by hypothetically
retrofitting the signalized intersection with the proposed roundabout design. Traffic Conflict
Analysis was used to measure the comparative operation of roundabouts and conventional
intersections.
In the end, Stone’s (2002) simulation analysis showed that 1) the planned roundabout
would have equivalent pedestrian capacity and potentially better safety than the original signalized
intersection 2) traffic diversion at roundabouts with fewer lanes than the intersection it replaced,
would produce a reduction in pedestrian accidents, and 3) that a single-lane roundabout could
handle more pedestrians safely than a four-lane signalized intersection.
Another issue explored in the U.S. studies was how to measure pedestrians’ judging of
‘gaps’ in traffic at crossings. Harkey (2006), used timings to understand the gaps, similar to Sadeq
and Sayed’s (2016) ‘TTC’ measurement. Harkey’s (2006) objective was to develop methods of
estimating the safety impacts of roundabouts. He collected observational data in multiple states
from a large number of roundabouts with different geometries. The study was undertaken as a part

21
of an NHRCP (2006) project entitled: ‘Applying Roundabouts in the United States’ NCHRP 3-65
Final Report.
Harkey’s (2006) study used digital video to collect data. He applied site selection criteria
which included a high number of pedestrians, adequate geometry and traffic. He collected data on
769 crossing events at 10 approaches. The measures he used were based on what happens when
the pedestrian arrives at the cross walk and assesses the gap between approaching vehicles. But
Harkey’s (2006) focus was on the pedestrian’s assessment of gaps and motorist yielding behavior,
rather than pedestrian decision-making. He measured a ‘normal’ pace of crossing, but did not
measure the slow gait of a physically disabled or elderly pedestrian. He did compare data on entry
vs. exit legs. Harkey (2006) was disappointed to note that during 769 crossing events only 4 actual
pedestrian-vehicle conflicts were observed.
Harkey (2006), observed five different pedestrian actions: 1) go around blocking vehicle,
2) run to avoid vehicle, 3) stop for a vehicle while crossing, 4) aborted crossing and 5) proceeded
normally across. Harkey (2006) compared crossing pace, using 4.4-5.0 feet per second which is
faster than the standard 3.5 fps, stated in the Manual on Uniform Traffic Control Devices. (FHWA,
2009):
“Except as provided in Paragraph 8, the pedestrian clearance time should be sufficient to allow a pedestrian crossing in the crosswalk who left the curb or shoulder at the end of the WALKING PERSON (symbolizing WALK) signal indication to travel at a walking speed of 3.5 feet per second to at least the far side of the traveled way or to a median of sufficient width for pedestrians to wait.” (FHWA, 2009 at p. 497)
Harkey (2006) concluded that safety problems with roundabouts included: 1) sight lines
from vehicles to the pedestrian 2) exit legs being higher risks than entry legs for disabled

22
pedestrians and 3) two-lane approaches being riskier than one lane approaches. Harkey did note
that vehicles not yielding to pedestrians occurred: 32% of the time at roundabouts, 15% of the time
at signalized intersection and 4% of the time at stop signs.
Rouphail (2005) made the first attempt in a U.S. study to explicitly modeling pedestrian-
vehicle interactions at roundabouts in a micro-simulation traffic environment. He sought to
document visually impaired pedestrian crossing performance at roundabouts by using exploratory
computer modeling. He sought then to use the model to examine impacts of alternative treatment
by capturing ‘gap acceptance behavior’ into a simulation model of pedestrian and vehicular
operation at roundabouts. He observed that pedestrian volumes were too low at roundabouts to
provide statistical confidence regarding their performance.
Rouphail (2005) focused on the concept of ‘delay’, and pedestrian gap perception behavior.
He observed higher delays for blind pedestrians at exits than at entrances. They noted that adding
signals would make roundabouts safer but it defies the entire concept of a roundabout which is
continuous motion with a yield to pedestrians in crosswalks and a yield to other vehicles in the
circulatory roadway.
Rouphail’s (2005) process consisted of selection of a tool, selection and coding of a test
roundabout, incorporating observational data of actual pedestrian gap perception behavior and
conduct of modeling experiments related to the differential performance of sighted and blind
pedestrians at roundabouts. Due to a lack of sample size, he assumed that pedestrian gap
acceptance behavior was homogenous. One limitation he noted was that although he used real-
world observation for calibration of pedestrian gap perception parameters, they had to use default
values for others. Their volumes, turning movements, speed limits and geometry did in fact come
from actual test sites.

23
He used the VISSIM (2017) traffic simulation software package for coding and modeling
pedestrian behavior. VISSIM uses a Windows-based interface, simulation processor for moving
traffic and people and outputs a movie in a common software format. Rouphail (2005) used latency
and crossing time to assess gaps, applied the concept of crossing points and he explored the
situation where if the vehicle is behind the yield line, when the pedestrian is at the crossing point,
the vehicle yields.
For site selection, he observed three different roundabouts to collect data. The preferred
roundabout was a single lane ‘compact urban roundabout’. They simulated traffic for based on
actual noon peak hour. They used a crossing pace of 1.22 m/s (equating to 4.0 fps, where the
FHWA (2009) standard mentioned above is 3.5 fps.). He called the situation where a pedestrian
confronted multiple vehicles ‘queuing’. Rouphail (2005) used sensitivity analysis to investigate
the relationship between delay for blind and sighted pedestrians and vehicle volume. Empirical
distribution was coded in as time went on. For visualizations, their model was able to create
trendlines from the data.
Rouphail’s (2005) study is valuable for its understanding of the value of a simulation model
where volumes of data are low and risk to human participants is high.
“The effective use of computer modeling in the present case suggests that modeling may represent a viable alternative to traditional field data collection methods where subjects are placed at risk for the sake of treatment evaluation. While modeling does not rule out the need for eventual evaluation of effects “in the field,” it does permit one to approach operational field evaluations with the knowledge (from the model) that the treatments being evaluated have been shown to have a high probability of success.” (Rouphail, 2005, p. 218).

24
In Retting’s (2001) first study, he noted that traffic signals were the primary devices to
regulate traffic lights at intersections, roundabouts being seldom used in the U.S. at that time. In
Retting’s (2001) study, he used before and after with empirical Bayes to account for regression to
the mean as a way of accounting for differences in traffic volume. He reviewed data from eight
different U.S. states. The data showed reductions in accidents. Retting (2001) concluded that there
is significant accident reduction from conversion to roundabouts, due to elimination of certain
vehicular conflict points that exist at signalized intersections.
In Retting’s (2003) next study, he cited the European studies which showed a 75%
reduction in pedestrian crashes by conversion to roundabouts. Retting (2003) isolated the
vulnerable populations: 1) pedestrians were 35% of motor vehicle deaths in urban areas, 2)
children 5-9 had the highest population injury rate, 3) pedestrians older 80 had the highest
population-based death rate, and 4) pedestrians older than 65 years were more likely than younger
pedestrians to be struck at intersections.
Hourdos (2012), in a more recent study touching directly on this topic, examined data on
pedestrian and bicycle safety at roundabouts in the State of Minnesota, United States. It was the
intention of Hourdos’ study to attempt to. In the most direct sense, he collected data and analyzed
both who yielded (vehicle or pedestrian) and also very specific pedestrian timings of pedestrian
delay while waiting for traffic at the conflict point to pass.
Hourdos (2012) discussed results of research on accessibility of modern urban roundabouts
for pedestrians and bicycles. Like the Pennsylvania law cited above, Minnesota law also requires
all vehicles to yield to pedestrians already in the crossing. The primary focus was driver yielding
behavior. He noted that:

25
1. A pedestrian crossing starting from the splitter island had a higher probability for driver
yielding, due to ambiguity of pedestrian intent.
2. When vehicles exited the roundabout, there was a lower probability the driver would
yield possibly due to increased pressure on the driver to clear the roundabout quickly.
3. The more vehicles in the roundabout the lower probability of yielding to pedestrians.
Hourdos (2012) collected long periods of video records and observed tens of thousands of
pedestrians using the crossings at two different sites in order to capture near-accident events. But,
there were no observations of such interactions with traffic and only three cases out of thousands
of crossing events were even considered as close-calls. Hourdos (2012) study was also not able to
observe the interaction of people with disabilities, making it inconclusive whether roundabout
crossings are perfectly safe. Investigated conditions that could affect the yielding behavior of
drivers.
Friction was however seen between pedestrians and drivers at roundabout crossings. The
location where crossing starts and the direction of the vehicle were seen to be determinants of
driver yielding behavior. The size of the pedestrian group, indicated a slight tendency for drivers
to yield to larger groups. The focus was on the driver's perspective and not the pedestrian. Hourdos
(2012) found that for multiple vehicles confronting the pedestrian, the more vehicles in the
roundabout, thus the lower probability of a driver yielding to pedestrians.
Hourdos (2012) noted real problems with the safety and comfort of visually impaired
individuals at roundabout crossings which were observed to be no better than signalized
intersections. New roundabouts in Minnesota also generated a significant amount of complaints
from pedestrians suggesting difficulties in crossing and reduced safety. Hourdos (2012) noted that
some suggest signalization of roundabouts, but the Federal Highway Administration’s

26
‘Roundabout Informational Guide’ states: “Roundabouts should never be planned for metering or
signalization.” In other words, signalization would negate the benefits from constructing a
roundabout instead of a traditional signalized intersection.
Hourdos (2012) used site selection criteria based on characteristics that permit evaluation
of pedestrian experience in crossing a roundabout: modern urban roundabouts, adequate pedestrian
traffic and geometry. Site visits for candidate study sites was conducted where information
defining physical conditions was collected. At the beginning of the study, no specific attributes of
pedestrian crossing events were identified, observation was intended to define them.
Hourdos (2012) used video to observe the entire scene of the roundabout during pedestrian
crossing events. They collected 16 days of data, 15 hours per day and four videos per hour, for 960
hours of video in each roundabout for a total of 1,920 hours of video. Their statistical method
involved quantitative analysis to identify trends and Logistic Regression was applied as a causal
analysis tool to identify important influences on driver yielding behavior and the effect they have
in the probability a vehicle yields to a pedestrian in a roundabout crossing, because the outcome
variable was binary: Yield=1 vs. No-Yield=0. The question left unanswered by Hourdos (2012) is
whether focusing on the driver’s reaction to the pedestrian is of more value to assess safety than
the pedestrian’s reaction to the vehicle.

27
Table 2.1: Table of Comparison of U.S. Studies of Pedestrian Safety at Roundabouts
Stone (2002) Harkey (2006) Rouphail (2005) Hourdos (2012)
Study: safety aspects of modern roundabouts for pedestrians. simulated retrofit of signalized intersection to roundabout
accessibility of modern urban roundabouts for pedestrians. develop methods to estimate the safety impacts of roundabouts
recommend improved treatments at roundabouts for blind pedestrians
safety of abled and disabled pedestrians at roundabouts
Results: reduction in pedestrian accidents. single-lane roundabouts safer than four-lane signalized intersection
roundabouts need re-design for safe access for pedestrians. exit legs are riskier than entry legs. two lane approaches riskier than one lane
higher delays for blind pedestrians at exits than at entrances. adding signals would make roundabouts safer for the blind
pedestrian crossing from splitter island, higher probability of driver yielding. exiting roundabout, lower probability of driver yielding
Pedestrian Cross/Don’t Cross Decision
pedestrian gap assessment
pedestrian gap assessment, motorist yielding behavior
pedestrian gap assessment, motorist yielding behavior, delay
pedestrian yield, motorist yielding behavior, timing
Tools: simulation modeling,- forensic accident report analysis, case study
statistical analysis exploratory computer traffic simulation modeling - VISSIM
statistical analysis
Site Selection:
traffic volumes, pedestrian volumes, road geometrics, and accidents
high number of pedestrians, number of lanes and average daily traffic.
single lane ‘compact urban roundabout’. simulated traffic based on actual noon peak hour.
modern urban roundabouts, adequate pedestrian traffic and geometry
Data Collection:
analysis of crash records
digital video observed three roundabouts to collect data for the simulation.
digital video
Crossing Pace:
2.5-5.5 fps range in 0.5 fps increments in simulation
4.4-5.0 fps 1.22 mps observed, not controlled
Multiple Vehicles:
focus on traffic volume queuing queuing the more vehicles in the roundabout, lower probability of driver yielding
Conflict Points:
roundabouts reduce conflict points from 32 down to 8 (FHWA)
pedestrian-vehicle conflict, not conflict point
conflict with vehicle flow, not conflict point
considered only in citing Harkey (2006)

28
The U.S. studies examined the issue of pedestrian safety at roundabouts in depth. Stone (2002),
Harkey (2006) and Rouphail (2005), considered pedestrian decision-making via gap assessment
while Hourdos (2012) examined pedestrian yield behavior. This study seeks to more directly
isolate the pedestrian’s cross/don’t cross decision. While accident histories for the signalized
intersection were available for Stone's (2002) study, the principal investigator has no such
available data for either intersection, requiring a different technique. Rouphail (2005) and Stone
(2002) used simulation techniques to create models that could be enhanced by seeding with
additional data gleaned form a live setting.
2.4 USE OF CONFLICT POINTS AND VIDEO FOR ANALYSIS
Ismail (2009) noted how recognized measures for analyzing traffic conflict data could be applied
to pedestrian conflicts at intersections. He also recommended that video could be applied to
analyze pedestrian safety at crosswalks. In line with those conclusions, this study, after
encountering high traffic volume at various observed intersections, concurred that video was
essential for accurate data collection.
Ismail (2009) recommended studying conflict points with video for several reasons: 1)
collisions are rare and random, requiring years of study, over which time many factors can change,
2) collision-based safety analysis is reactive, requiring a significant number of collisions to be
recorded and 3) collision data reporting is often incomplete and biased toward very severe
collisions. In one study noted by Ismail (2009), over a decade, pedestrian-involved collisions
accounted for only 3.6% of the all collisions in British Columbia, Canada, 4) pedestrian traffic is
sparser than motorized traffic as collecting such data is complex.

29
Ismail (2009) thus recommended Traffic Conflict Techniques (TCT’s) for several reasons:
1) Traffic conflicts are more frequent than collisions, 2) TCT’s produce estimates of average
accident frequency comparable with those of accident-based analysis. On the other hand, data
collection is subject to observer variability, compromising reliability and repeatability of data
collection. Employment of human observers can be expensive, including the effort to extract
pedestrian data from videos. Ismail (2009) solved these problems with his unique advanced
automated video analysis system to “(a) detect and track road users in a traffic scene and classify
them as pedestrians or motorized road users, (b) identify important events that may lead to
collisions, and (c) calculate several severity conflict indicators.”
Ismail (2009) collected video data over two days at an intersection in Vancouver, British
Columbia. Four conflict indicators were automatically computed for all pedestrian–vehicle events
and provided detailed insight into the conflict process. Simple detection rules on the indicators
were tested to classify events. Ismail proved the value of video data collection and automated
object analysis as a tool for collecting data on pedestrian safety at roundabouts.
2.5 METHODS OF CONFLICT ANALYSIS
Conflict point analysis or the ‘Traffic Conflict Techniques’ favored by Ismail (2009) should
include the following factors: 1) existence of a conflict, 2) exposure to the conflict (measuring
the product of the two conflicting stream volumes), 3) severity of the conflict (relative velocities
of the conflicting streams and angle, 4) vulnerability of the pedestrian (survivability) (FHWA,
2000) at p. 104-105 and 5) additional lanes considerably increasing pedestrian conflict points.
(FHWA, 2000) at p. 106.

30
The FHWA (2000) compared vehicle-pedestrian conflicts at signalized intersections and
roundabouts. Signalized intersections reduce pedestrian-vehicle conflicts by signal phasing that
allows only a few legal movements at any given time. In the diagram below, a pedestrian crossing
at a signalized intersection with protected-permitted turns, right on red allowed, creates four
vehicular conflicts, each from a different direction, for a total of 16 pedestrian-vehicle conflicts:
1) crossing movements on red (typically high-speed, illegal), 2) right turns on green, 3) left turns
on green (legal for protected-permitted or permitted left turn phasing) and 4) right turns on red.
The FHWA (2000) noted that for pedestrians at roundabouts, there are two conflicting
vehicular movements on each approach, as shown in their diagram: conflict with entering vehicles
and conflict with exiting vehicles.
Figure 2.1: Vehicle-pedestrian conflicts at signalized intersections (FHWA, 2000, Ex. 5-5)

31
Figure 2.2: Vehicle-pedestrian conflicts at single-lane roundabouts (FHWA, 2000, Ex. 5-6)
With multiple approach lanes, additional conflicts are added with each additional lane that a
pedestrian must cross. (FHWA, 2000) at p. 109.
2.6 DISABLED, ELDERLY, VISUALLY IMPAIRED AND CHILD PEDESTRIANS
The FHWA (2000) noted that crash data was non-existent on pedestrians with disabilities at
roundabouts. Considerations for vulnerable pedestrians included: 1) roundabout crossing is
difficult for disabled pedestrians without help, 2) roundabout legs could be equipped with a
pedestrian-activated signal at crossings, 3) heavy vehicle volume leaving insufficient gaps in
traffic to cross, may warrant audible signals.

32
Visually impaired pedestrians are obviously more vulnerable when there is no phasing of
traffic and pedestrians. Some of the possible design remedies mentioned in the FHWA (2000)
report included: raised speed tables with detectable warnings, treatments for the visually impaired
to find crosswalks and raised pavement markers with flashing lights to alert drivers of pedestrians.
They concluded that more research is required to develop the information that governments need
to determine where installation of roundabouts may be appropriate and what design features are
required for people with disabilities.
Rouphail’s (2005) work, discussed extensively above, focused on visually-impaired
pedestrians and concluded that roundabouts would be safer for visually-impaired pedestrians with
certain engineering modifications, but particularly, the installation of traffic signals which negates
the entire concept of continuous traffic flow at roundabouts.
2.7 BICYCLE SAFETY AT ROUNDABOUTS
Bicycle traffic is fundamentally different than pedestrian traffic, but bicycles are relatively slow
and vulnerable compared to motorized vehicles, like pedestrians. Cumming (2011) noted that
bicycles have extra risk at roundabouts as they must enter the circulating lane of a roundabout and
follow the flow of motorized vehicle traffic.
Cumming (2011) studied accidents and conflict points in Victoria, Australia from 2005-
2009. He noted that at urban roundabouts there was more significant bicycle traffic than was
observed at six high- speed rural roundabouts which had relatively no bicycle traffic. Cummings
(2011) identifies a much higher number of conflict points or ‘conflict streams’ at roundabouts than

33
other studies. Cumming (2011) referred to conflict points as ‘Danger Points’ where the paths of
two vehicles may coincide. He noted that due to roundabouts having fewer conflict points and the
geometry of roundabouts deflecting traffic, it creates safer conditions for motorists than traditional
intersections. Cumming (2011) did actually observe eight pedestrian accidents with vehicles at
roundabouts over the four-year period of observation, but that was not the focus of his study. He
noted greater danger from two-lane roundabouts where the number of bicycle conflict points
increases dramatically from four to sixteen.
It is Cumming’s identification of the concept of ‘conflict streams’ that has the most
relevance for the current study. It seems truer to the FHWA’s (2000) definition of ‘conflict point’
with converging and diverging traffic, in essence, a pedestrian or bicycle must be observant of
streams or paths of vehicle traffic instead of a fixed point.

34
Figure 2.3: One-Lane vs. Two-Lane Roundabout Conflict Points (Cumming, 2011, at p.28)
Re-printed with permission of Copyright holder @Engineers Australia, 2011.

35
2.8 RELATED WORK: THE HUMAN PARTICIPANT SIMULATION
The closest related work to this study is the remarkably similar effort by Wu (2009) to use virtual
reality to have a human participant actually experience a computer-modeled roundabout
environment. While Wu’s (2009) effort had exciting possibilities for training pedestrians on how
to use roundabouts, his effort combined with the method I propose, could allow this study’s method
to be used to more extensively model Wu’s (2009) simulation and virtual reality system.
Wu (2009) sought to use a virtual reality environment to assess how human participants
acting as pedestrians tend to judge the ‘gap’ between approaching vehicles as they attempt to make
a decision to cross a lane of a roundabout like Stone (2002), Harkey (2006) and Rouphail (2005)
who also used the gap estimation as a measure. Wu’s (2009) simulation used validated models of
vehicle behavior to add realism to the experiment. Wu (2009) mentioned the decision-making
process, but did not approach the cross/don’t cross decision directly.
Wu (2009) focused on the roundabout exit lane crossing only but not the entrance lane as
drivers were considered to be less likely to yield when exiting a roundabout, thus creating a more
interesting conflict. He did allude to the conflict point conundrum: “The issue is likely to be more
confusing in a roundabout, where vehicles can be entering the circulating pathway from several
directions” (Wu, 2009, p. 35). He discusses this confusion in terms of ‘connecting points’, but he
describes the ¼, ½ and ¾ approaches in similar terms as this study.
Wu (2009) used The Maya (Autodesk, 2017) and Vizard (Worldviz, 2017) tools to create
the simulation model. The model created a variety of traffic scenarios at the virtual roundabout.
These tools could model traffic volume, pedestrian volume and vehicle speeds. He programmed
the traffic in streams, to allow for multiple vehicle scenarios to affect decision-making. The virtual

36
roundabout provided both visual and auditory cues. Images from the virtual reality roundabout
may be seen in Figures 2 and 3 of Wu’s (2009) study on p.36.
Wu (2009) used twelve human participants ages 20-45, all able-bodied adults, who were
trained on how to use the system. The system simulated speed, paths of approaching vehicles and
duration of gaps to test the pedestrian’s decision-making. The experiment took place inside a large
room. The participants could physically cross when they felt safe and comfortable crossing. In this
instance, an unsafe crossing could be thrown out. In real life, the experiment ends with a collision.
He simulated crossing in both directions, which allows for the study of facing or not facing
circulating traffic.
Limitations included the horizontal field of view, which affects the realism of the
experiment to a degree and that the pedestrians would likely be more conservative in their
decisions in a real environment. Wu (2009) voiced a concern (shared by Hourdos (2012)) that
visually-impaired pedestrians would have safety issues at roundabouts due to confusing auditory
cues. Wu’s experiment is intriguing as it can safely model behavior of live pedestrians at
roundabout crossings, but 1) it lacks some elements of realism, 2) it does not account for traversal
of entrance lanes, 3) it doesn’t make a comparison to a signalized intersection and 4) while it does
reflect pedestrian decision-making, it doesn’t focus on the binary cross/don’t cross decision. Wu’s
(2009) model however could be enhanced in these regards with additional data from a live field
setting.
The U.S. based studies of pedestrian safety at roundabouts since the year 2000, have used
a variety of techniques to gather data. Datasets of actual accidents were reviewed, before and after
studies conducted with real data, video software with automated capture of activities was

37
employed and an assortment of computer modeling techniques were used, ranging from statistical
modeling tools to virtual reality.
The question is: how can we improve upon modeling given the difficulty and cost of long-
term observation of numerous roundabouts? The method proposed in the study, could provide an
answer: actual decision-making data from a live pedestrian to build a realistic simulation model.

38
3.0 HYPOTHESIS, METHODS AND ANALYSIS
3.1 HYPOTHESIS – RESEARCH QUESTION
A review of past literature has shown that roundabouts are a safer alternative for motorized vehicles than
signalized intersections, but do roundabouts actually increase risk to pedestrians and non-motorized
vehicles? Does the roundabout give the vulnerable pedestrian the same ability to cross a lane of traffic
safely as does the signalized intersection? Can a method using a human participant in a field experiment
calibrate existing modeling and virtual reality techniques with real world data?
3.1.1 Summary of Methods
In order to answer these questions, this study collected and extracted data from several hours of
video at two comparable intersections: The first, a one-lane, four-way roundabout and the other a
traditional four-way signalized intersection. The data was manually extracted from the video by
observation and recorded into a spreadsheet. Entrance and exit lanes were considered separately
and slow pedestrians were simulated to get a better understanding of safety in the crosswalk for
the elderly and disabled.

39
3.1.2 Human Participant in the Field Environment
The principal investigator of this study acted as a staged participant crossing at each lane around
each intersection in either a clockwise or counter-clockwise direction in constant motion. At all
times, the principal investigator obeyed traffic rules and exercised due caution. In the signalized
intersections, cross buttons were always pressed and the principal investigator did not proceed
until the walk sign was illuminated, however two of the eight walk sign activation buttons
intermittently malfunctioned. This is not uncommon in literature to use oneself as human
participant, but it avoids placing another participant at physical risk, albeit, a participant obeying
traffic rules and taking due care would be at no more risk than any other pedestrian. Different
protocols and participant training will have to be used in future studies attempting this technique
if a human participant is involved in the field environment.
3.1.3 Accounting for Bias in the Experiment
Because the principal investigator of this study acted as pedestrian, informal controls were
necessary to account for bias in the conduct if the experiment and in decision-making. The
principal investigator obeyed all traffic rules at all times. The principal investigator only proceeded
in the signalized intersection when the walk signal was illuminated. The principal investigator
proceeded with caution where the walk light was malfunctioning. The principal investigator never
proceeded into the traffic lane in either intersection when a converging vehicle would have already
had right of way under Pennsylvania Law. (In Pennsylvania, as stated above a driver must yield
right if way for a pedestrian already in the crosswalk). However, common sense presumes that a

40
driver obeying the traffic laws must be given reasonable time to react to a pedestrian, i.e. a
pedestrian cannot enter the crosswalk and deliberately place themselves in imminent danger.
3.1.4 Entrance and Exit Lane Data
The exit lane data documented a pedestrian’s cross/don’t cross decision upon arrival at each exit
lane of traffic at the roundabout. The data included the pedestrian’s consideration of vehicles
already in the circulatory roadway plus vehicles entering from one of the four entrances at ¼, ½,
¾ and 1 complete revolution from the lane being crossed.
The entrance lane data documented the pedestrian’s cross/don’t cross decision upon arrival
at each entrance lane of traffic at the roundabout, where the pedestrian must assess vehicles in
three frames of view: 1) ‘Blocking’ (physically blocking the pedestrian’s path across the lane of
traffic), 2) ‘In-Frame’ (visible to the horizon on the approaching road) 3) ‘Out-of-Frame’ (vehicle
becomes relevant to the crossing decision from over the horizon only because of blocking or in-
frame approaching vehicles). The ‘framing’ concept is presented as a unique innovation in
evaluating the pedestrian crossing decision, indicating that the roundabout may be a much richer
and riskier environment than the ‘one conflict point per lane’ concept proposed by the FHWA.
Hourdos (2012), used a similar labeling concept for the legs of a roundabout, with the ‘¼’
lane being at 90°, ‘½’ lane being at 180° and so forth. What this study labels as the ‘¼’ lane is the
closest entrance lane to the pedestrian who is crossing the nearest roundabout exit (assuming
counter-clockwise U.S. vehicle flow). The labels used in this study are relative positions based on
the location of the pedestrian as they cross an exit lane. The ‘¼’ lane is nearest the pedestrian, the
‘½’ lane is across the roundabout, the ‘¾’ lane is opposite the ¼ lane (but ¼ more distant than the

41
½ lane) and ‘1’ is the entrance lane adjacent to the exit lane the pedestrian is crossing, where the
vehicle does a full revolution and exit to conflict with the pedestrian.
The highest risk is from proximity, ‘¼’ away being the most imminent danger, but then,
other vehicles may come into play, creating a much higher level of risk than is normally
explainable by the ‘one conflict point per exit lane’ concept in the literature. A hypothesis being
that the closer the entering vehicle, the more likely the pedestrian will decide in favor of ‘don’t
cross’.
This is contrasted with the signalized intersection, where this study examined a pedestrian’s
cross/don’t cross decision at each exit or entrance lane of traffic at a phased crosswalk where the
pedestrian had to consider vehicular traffic coming from up to three lanes at once to make their
crossing decision.
3.1.5 Conflict Streams
Traffic Conflict Techniques were used for analysis rather than a longitudinal survey of
roundabouts, as actual pedestrian-at-roundabout accident report data is sparse. Conflict Streams
were evaluated in order to account for paths of multiple converging vehicles. I initially used the
term ‘conflict vector’ as a label in this studies’ data collection, but it might be confused with the
scientific concept of a vector. I did not change the data label, however. ‘Conflict stream’ as used
by Cumming (2011) might be a more descriptive term to describe the path of a vehicle as it
traverses a roundabout.
This study will complement the video-based studies of Sadeq and Sayed (2009) and the
United States studies by Hourdos (2012), Stone (2002), Rouphail (2005), Wu (2009) and Harkey

42
(2006), but will differ by virtue of capturing data from the pedestrian’s perspective with a simple
binary cross/don’t cross decision instead of a complex gap time estimation, or assessment of driver
yielding behavior.
3.2 SITE SELECTION METHODOLOGY
Site selection criteria for this study was similar to the techniques used by the studies referenced
herein to find a suitable four-way roundabout and a four-way signalized intersection to compare
and contrast as opposed to doing a ‘before-and-after’ study with actual accident data. However,
the amount of time to collect that sort of data is measured in years, as actual pedestrian incidents
at Intersections are rare compared to vehicle accidents and extremely sparse where roundabouts
are concerned.
Site selection was based on similar methods used by Flannery (2001) in her study. She
conducted a three-year study of various roundabouts using actual crash data along with conflict
point analysis to understand vehicle safety at roundabouts.
Flannery (2001) reviewed actual accident data, driver testimonials and videotapes
developed at roundabouts in Maryland, Florida, and Nevada. She noted the need to improve
geometric design on approaches to rural roundabouts to reduce loss-of-control accidents (which
were observed to be 47% of roundabout accidents); the need for adequate right-of-way to deflect
vehicles around the center island (the center island was a critical part of design for traffic slowing);
and in municipal choice of roundabout location, the need for guidance regarding volume-to-

43
capacity ratios. Additional sites were used as case studies despite lacking some of the needed
characteristics.
Flannery (2001) noted eight vehicular conflict points at a single lane roundabout and 32 at
one-lane-in, one-lane-out, four-way signalized intersections based on diverging, merging and
crossing traffic flow. The large number of conflict points makes manual recording and observation
of vehicle conflict point data nearly impossible at traditional intersections.
Thus, the principal investigator, in line with Flannery’s (2001) analysis, restricted this
study to pedestrian conflict points and conflict streams. Flannery (2001) noted that some geometry-
based safety risks at roundabouts were: lack of proper sight distance, lack of available right-of-
way for proper deflection at urban roundabouts, and lack of balanced traffic flows.
Flannery (2001) noted some driver anomalies at roundabouts that could be related to driver
unfamiliarity with roundabouts: 1) Drivers increased their speed on entry. 2) Drivers cut across
several lanes in the circulating roadway to exit the roundabouts (double-lane roundabout
geometry) and 3) several drivers entered the roundabouts by making a left turn and proceeding
clockwise to exit.
This study focused on moderate and low speed roundabouts where pedestrian and non-motorized
vehicle conflicts would be most likely. Thus, this study sought single-lane roundabouts with good
sight distance from all directions, rural roundabout locations and balanced traffic flow in all four
directions. Two intersections were compared, the first, being a standard roundabout as defined by
PennDOT, the other a standard, nearby four-way, signalized intersection. The choice of a nearby
comparable intersection, was to achieve observation of similar traffic composition in terms of
driver characteristics and volume. The time of day and week was chosen to be similar as well.

44
3.2.1 Proof of Concept Data Collection Effort
The objectives of the preliminary data collection were exploratory only, with the goal to: 1) learn
techniques for traffic data collection, 2) understand traffic flow, 3) understand pedestrian and other
non-vehicular traffic patterns, 4) understand the effects of traffic controls and 5) understand
roundabout geometry.
The data collection started with the selection of three intersections as a proof of concept.
Data was collected at each intersection between 7:00AM and 8:00 AM on four Wednesdays in
February 2017 under good visibility, despite cold temperatures and light rain. Five minutes of data
was collected for each leg of each intersection. There were some issues: 1) an engineering
schematic would be helpful for each intersection, 2) it is difficult to try to capture data for each
traffic signal when there are opposing lanes proceeding and 3) it is almost impossible for a human
observer to capture light timing, traffic volume and time through the intersection simultaneously.
Three different intersections were selected for observation: 1) a traffic triangle, 2) a yield sign
controlled four-way roundabout, both located in South Park, PA and 3) a five-way signalized
intersection with pedestrian crossing signals in Bethel Park, PA.
The data collection efforts involved photographs, film and manual counting of vehicles in
an intersection. Timings were sampled. Indications of driver confusion, if any, were recorded, such
as: not obeying a traffic control, proceeding in the wrong direction of traffic flow or near conflicts
with other vehicles or non-vehicular traffic. The roundabout proved inadequate due to inadequate
traffic flow from two of the four approaches. The geometry of the comparable three and five-way
intersections made them likewise unsuitable for the study. A four-way comparable traditional
intersection was preferable instead.

45
More suitable locations were scouted with the following requirements: 1) both intersections
in close proximity for similar volume and type of traffic, with adequate visibility for videography
and four approach lanes for similar geometry of traffic and adequate traffic flow, 2) a yield-
controlled roundabout with one entrance and exit lane at each approach and 3) a signalized
intersection with protected pedestrian crossing signals. Two intersections, near Latrobe, PA, met
these criteria. The intersections selected were a roundabout next to St. Vincent’s University along
Monastery Drive and a contiguous, four-way signalized intersection at PA Route 981 and
Monastery Drive. The table below captures characteristics of the selected intersections against
Retting’s (2003) intervention techniques for safe design.
Table 3.1: Table of Intervention Techniques (Adapted from Retting, 2003)
Intervention Signalized Intersection
Roundabout Safety Benefit
Traffic Signal yes no 50% fewer pedestrian-vehicle conflicts
Traffic Signal Change Interval Timing
yes n/a 95% fewer pedestrian-vehicle conflicts
Pedestrian Prompting Devices
(visual, no audio cues)
no
Advance Stop Lines
yes (yield lines only)
Refuge Islands yes (yellow waiting pad)
(raised splitter islands)
Crosswalk Marking yes No

46
3.3 DATA COLLECTION MEASURES
Two sessions of four hours each were observed at each intersection. The video recorded all
vehicles at each intersection. The video also documented the pedestrian’s decision-making. The
data was later extracted to find traffic volume at each intersection. Ismail’s (2009) timing measures
were not used, as the focus was on the decision itself. The cross/don’t cross decision was decided
upon as the simplest to record and the most basic indicator or safety that could answer these
research questions: 1) how likely is a pedestrian to make a decision to cross a lane of traffic at the
signalized intersection compared to the roundabout? 2) which factors influence the cross/don’t
cross decision?
3.3.1 Video Camera Data Collection
A ‘GoPro Hero Session’ video camera system with accompanying ‘GoPro Capture’ App were
used from a single fixed emplacement at each intersection as selected by the videographer. The
VLC Media Player software (VLAN, 2016) was used for video playback video to permit manual
transcription of the video data to a spreadsheet. Variables for video collection included: 1)
unobstructed views allowing capture of all vehicles and pedestrians entering and exiting each
intersection, 2) battery life to ensure at least four hours of video and 3) clear resolution to ensure
that the vehicles and pedestrians could be correctly counted during playback.

47
3.3.2 Method: Contemporaneous Comparator Data
There was no empirical data for the roundabout at Monastery Drive prior to its installation
(PennDOT 2016b; PennDOT 2016d). Existing data from ‘before and after’ studies of pedestrian
safety at roundabouts in the United States was almost non-existent. Thus, the method of finding a
comparable signalized intersection and then comparing data between the two was chosen for this
study.
Assumptions included: 1) drivers generally obey traffic law, 2) the pedestrian can
reasonably rely on signals when if legally in crosswalk, 3) the pedestrian has an unobstructed view
of each intersection and 4) the rational human participant will make safe, valid crossing decisions.
The data would address the following questions in this study:
• How many ‘cross/don’t cross’ decisions made under each circumstance and why?
• How many ‘cross’ decisions will the slow pace pedestrian make compared to the
standard pace pedestrian?
• At which location is the pedestrian more likely to make a ‘cross’ decision?
• Is the roundabout more dangerous for all pedestrians?
• a pedestrian moving counter-clockwise (back to traffic) has less opportunity to assess
safety of a crossing decision and will make fewer ‘cross’ decisions
• a pedestrian moving clockwise (facing traffic) has a better opportunity to assess
safety of a crossing decision and will make more ‘cross’ decisions
• multiple vehicles create greater risk for pedestrians

48
Table 3.2: Data Description
Label Data Description Where Collected Decision cross/don’t cross
(binary) the pedestrian decides whether to cross a lane of traffic or to wait for a safer opportunity
each lane crossing
Conflict Stream – Signalized Intersection
left front right front left rear right rear (nominal)
the direction of an approaching vehicle from the pedestrian’s reference at the point of crossing
each lane crossing
Conflict Stream – Roundabout Entrance Lane
Blocking in-frame out-of-frame (nominal)
the proximity of approaching vehicles in proximity to the pedestrian
each lane crossing
Conflict Stream – Roundabout Exit Lane
¼, ½, ¾, 1+, in-the-circle (vehicles moving inside the circular roadway) (nominal)
proximity of approaching vehicles from the four approach directions from the pedestrian’s reference at the point of crossing
each lane crossing
Multiple Vehicles number of vehicles influencing a pedestrian’s crossing decision (numeric)
vehicles may queue and limit opportunities to cross until some or all have passed the point of crossing
each lane crossing
Pace of Travel Standard - 3.5fps Slow - 1.75 fps (nominal)
simulates an able or disabled pedestrian’s walking pace
each hour of data
Total Traffic Volume average per hour (numeric)
total vehicle count all traffic
Traffic Influencing the Decision
relevant, irrelevant (count)
vehicles which influence the pedestrian’s decision to cross
all traffic
Direction of Travel Clockwise counter-clockwise (nominal)
clockwise walking direction faces traffic in the roundabout
each half hour of data

49
3.3.3 Data Scenarios
The following scenarios were observed with one hour of video data each:
• Scenario 1: Roundabout, Standard Pace, CCW (Counter-Clockwise) Direction
• Scenario 2: Roundabout, Standard Pace, CW (Clockwise) Direction
• Scenario 3: Roundabout, Slow Pace, CCW Direction
• Scenario 4: Roundabout, Slow Pace, CW Direction
• Scenario 5: Signalized Intersection, Standard Pace, CCW Direction
• Scenario 6: Signalized Intersection, Standard Pace, CW Direction
• Scenario 7: Signalized Intersection, Slow Pace, CCW Direction
• Scenario 8: Signalized Intersection, Slow Pace, CW Direction
3.3.4 Data Coding: Roundabout
Data Set 1: Standard Pace/Data Set 5: Slow Pace, Walking Direction, Counter-Clockwise.
Data Set 2: Standard Pace/Data Set 6: Slow Pace, Walking Direction, Clockwise.
1. Exit Lane (Traffic exits from the Circulatory Roadway on the left/behind) a. C - car is already in the circulatory roadway b. ¼ - car is in the nearest entrance lane, ¼ of the distance to the exit lane c. ½ - car is on the opposite side of the circulatory roadway, ½ of the distance to the exit lane d. ¾ - car is at the furthest distance from the exit lane, ¾ of the distance to the exit lane e. M - Multiple cars in the Circulatory Roadway Grouped on one line In Italics f. 1+ - car travels at least 360° around the Circulatory Roadway before exiting 2. Entrance Lane (Traffic is entering the Circulatory Roadway from the right)
a. B - Car is blocking the pedestrian’s path or imminent b. F - Car is traveling towards the Circulatory Roadway and is within the horizon

50
c. O - Car is traveling towards the Circulatory Roadway and is not within the horizon until the pedestrian has to make a decision to cross
3. Total traffic volume per hour.
• Total Hourly Traffic (THT) will be collected as THT = TTR + TTI
• Total Traffic Relevant (TTR) (traffic with an effect on the crossing decision)
• Total Traffic Irrelevant (TTI) (traffic with no effect on the crossing decision)
o Vehicle passes after the pedestrian clears the conflict point
o Vehicle crosses a lane which is not a conflict point for that pedestrian
Figure 3.1: Still from Video of Roundabout Pedestrian Simulation
3.3.5 Data Coding: Signalized Intersection
Data Set 3: Standard Pace/Data Set 7: Slow Pace, Walking Direction, Counter-Clockwise
1. Exit Lanes (Traffic exits from the Signalized Intersection)

51
a. car is already in the intersection b. car is in front turning legal left c. car is from behind turning legal right d. multiple cars in the intersection e. car violates no right/left on red or runs red light
2. Entrance Lane (Far Lane) (Traffic is entering from the right on legal right on red)
Time the pedestrian waits on the safety pad until the car passes or stops
3. Total traffic volume per hour.
Data Set 4: Standard Pace/Data Set 8: Slow Pace, Walking Direction: Clockwise
1. Exit Lanes (Same)
2. Entrance Lane (Near lane) (Same, except traffic is entering from the left on legal right on red)
3. Total traffic volume per hour.
Figure 3.2: Still from Video of Signalized Intersection Pedestrian Simulation

52
3.3.6 Data Extraction Technique
A spreadsheet was prepared with the column attributes for each data item listed in the previous
sections. The video was played back by the principal investigator in twelve-minute segments. The
start and stop time of day was recorded. The pedestrian was observed in each scenario as they
approached each lane of each type. The pedestrian decision at each lane crossing was recoded into
either a ‘cross’ or ‘don’t cross’ column in relation to each vehicle that influenced the crossing
decision. Total traffic volume was recorded and then categorized as influencing the pedestrian’s
crossing decision (recorded as relevant traffic) or not influencing the pedestrian’s decision
(recorded as irrelevant traffic). Columns were added to aggregate data and determine crossing
percentages under each circumstance. Charts were then prepared from the data to cluster or
compare data.

53
4.0 EMPIRICAL DATA
The advantage of empirical data obtained from observation is that real-world observations of U.S.
traffic patterns for this specific purpose can lead to more comprehensive modeling of the issue of
pedestrian safety at roundabouts. Wu’s (2009) virtual reality method could be expanded to
entrance lanes of roundabouts and even extended to comparison studies of signalized intersections.
4.1 LIMITATIONS AND WEAKNESSES OF THIS STUDY
The weaknesses of this study are that 1) it depends upon the reliability of human and video
observation and data collection at a busy intersection, and 2) the principal investigator as human
participant may unknowingly bias the results. The only other options are observations of the public
(Sadeq and Sayed, 2016), virtualized environments with human participants (Wu, 2009) or
simulations Stone (2002).
Another limitation was that data had to be manually observed from video and then
transcribed to a spreadsheet, leading to transcription errors. A more extensive effort could use
electronic civil engineering traffic monitoring systems for more accurate counts or use carefully-
placed video monitoring systems which included advanced data- scraping object recognition and
analysis software.
This study could have also compared odd-geometry intersections such as three and five-
way, stop-sign controlled intersections, mixed-control intersections and roundabouts with multiple

54
lanes or roundabouts with lighted crosswalks, but the added complexity would make valid
comparisons difficult without carefully defined parameters.
4.2 CASE STUDY: ROUNDABOUT AND SIGNALIZED INTERSECTION, UNITY
TOWNSHIP, PENNSYLVANIA
A roundabout needed certain characteristics as defined in the literature to be a good subject for the
comparison study: 1. four-way like the comparator signalized intersection, 2. yield-based entry,
roughly equal and constant traffic flow from all directions, good fields of observation and one-
lane rather than multi-lane approaches and circular roadway.
4.2.1 The Roundabout
The Monastery Drive roundabout is located just below St. Vincent’s University on one end and a
highway on the other. It met all of the required characteristics, except it lacked a marked pedestrian
crosswalk. It proved to otherwise be a sufficient location for evaluating pedestrian decision-
making and conflict stream data.

55
Intersection 1: Monastery Drive/Saint Vincent Drive, Latrobe, Unity Township,
Westmoreland County, Pennsylvania, USA Type: Roundabout; Status: Existing; Control Type:
All Way Yield; Year Completed: 2010; Approaches: 4; Latitude: 40.2957; Longitude: -79.39741:
Figure 4.1: Monastery Drive Roundabout (Glovis, EROS Center, USGS, 2017)
Reprinted with permission of Glovis, courtesy of the USGS Earth Resources Observation and Science (EROS) Center, U.S.
Geological Survey (2017)
Traffic at the roundabout was moderate and constant in all directions. It averaged about
450 vehicles per hour. All manner of traffic proceeded through the roundabout during my
observation: a runner, a walker, a bicycle, a three-wheeled motorcycle, two-wheeled motorcycles,
pickups hauling trailers and cars. Traffic slowed significantly upon approach.

56
The geometry has no marked pedestrian walkways or sidewalks. Splitter islands on all four
approaches allow a pedestrian to only look one way when crossing each entrance lane. Each
pedestrian crossing of a lane took about 5-6 seconds for an able adult on foot, while paying
attention to traffic. Pedestrian crossing points were marked with ‘P1’ to ‘P8’ for reference.
4.2.2 The Signalized Intersection
The signalized intersection also required certain characteristics: 1) traditional four-way
intersection, 2) signalized control at each entrance, 3) signalized and marked pedestrian crossing,
4) moderate and constant traffic flow from each approach, 5) clear fields of observation for the
video camera.
The Four-Way signalized intersection at Monastery Drive and State Route 981 in Unity
Township, Westmoreland County, Pennsylvania was deemed suitable. It averaged about 725
vehicles per hour. Route 981 is a relatively high-speed state road. Four approaches converge at the
traffic light into three three-lane approaches and one two-lane approach.
There are marked pedestrian crosswalks with button press to request a crossing signal. The
buttons were pressed on every crossing. The signal buttons on the east side of the signalized
intersection were malfunctioning and did not elicit the walk light at all. Pedestrian crossing points
are marked with a gold ‘P’ at each lane.
There were eleven lane crossings for pedestrians. Twelve conflict streams were observed.
The pedestrian signal blocked converging vehicles from directly across the signalized intersection
and blocked a right turn with a ‘no turn on red’ sign. The only converging vectors were permissive
right into the exit lanes, permissive left into the exit lane and permissive right at the entrance lane

57
(where permitted). This indicated only twelve possible conflict streams and not twenty-four or
thirty-two as the literature assumed.
A conflict stream as “a vehicle approach which influences a pedestrian’s cross/don’t cross
decision at a given vehicular approach lane”. The conflict stream provides a more realistic measure
of vehicle-pedestrian convergence than the static conflict point. Pedestrians, in real-life, must
beware of moving traffic, not artificially designated points on the ground.
Intersection 2: Monastery Drive and 5919 Pa. 981, Unity Township, Westmoreland
County, Pennsylvania, USA. Type: Four Way Intersection; Status: Existing; Control Type: Traffic
Light; Year Completed: Unknown; Approaches: 4; Latitude: 40.2958; Longitude: -79.3941:
Figure 4.2: Pa. Route 981 Signalized Intersection (Glovis, EROS Center, USGS, 2017)
Reprinted with permission of Glovis, courtesy of the USGS Earth Resources Observation and Science (EROS) Center, U.S.
Geological Survey (2017)
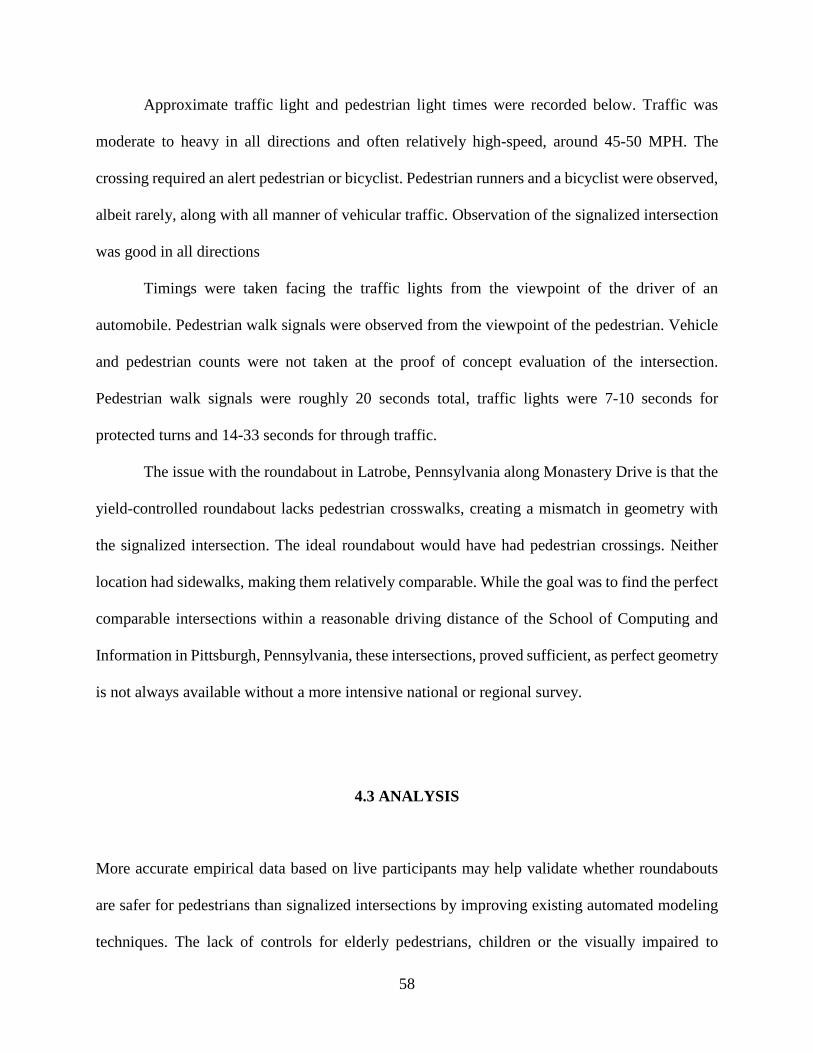
58
Approximate traffic light and pedestrian light times were recorded below. Traffic was
moderate to heavy in all directions and often relatively high-speed, around 45-50 MPH. The
crossing required an alert pedestrian or bicyclist. Pedestrian runners and a bicyclist were observed,
albeit rarely, along with all manner of vehicular traffic. Observation of the signalized intersection
was good in all directions
Timings were taken facing the traffic lights from the viewpoint of the driver of an
automobile. Pedestrian walk signals were observed from the viewpoint of the pedestrian. Vehicle
and pedestrian counts were not taken at the proof of concept evaluation of the intersection.
Pedestrian walk signals were roughly 20 seconds total, traffic lights were 7-10 seconds for
protected turns and 14-33 seconds for through traffic.
The issue with the roundabout in Latrobe, Pennsylvania along Monastery Drive is that the
yield-controlled roundabout lacks pedestrian crosswalks, creating a mismatch in geometry with
the signalized intersection. The ideal roundabout would have had pedestrian crossings. Neither
location had sidewalks, making them relatively comparable. While the goal was to find the perfect
comparable intersections within a reasonable driving distance of the School of Computing and
Information in Pittsburgh, Pennsylvania, these intersections, proved sufficient, as perfect geometry
is not always available without a more intensive national or regional survey.
4.3 ANALYSIS
More accurate empirical data based on live participants may help validate whether roundabouts
are safer for pedestrians than signalized intersections by improving existing automated modeling
techniques. The lack of controls for elderly pedestrians, children or the visually impaired to

59
traverse roundabout crossings with continuous traffic flow is a known safety issue. (Rouphail,
2005). This concern may require re-design of roundabouts where pedestrian traffic may be high
regardless of whether the location is rural or urban. Due to the scarcity of existing data,
consideration of conflict streams together with conflict points may add precision to traffic conflict
techniques for assessing the question of safety at roundabouts.
Computer simulation, modeling and virtual reality simulation have proven to be effective
tools to understand pedestrian safety risks at roundabouts (Wu, 2009). Experiments such as this
one could feed valuable real-world data about pedestrian decision-making into simulation systems
like Wu’s (2009) virtual reality to create a more accurate assessment of safety risks at roundabouts
without requiring extensive surveys.
4.3.1 Case Study Experimental Design
The design of the experiment that is the foundation of the case study is simple. There are not an
adequate number of pedestrians to study at most of the suitable modern roundabouts. Thus, the
principal investigator acts as pedestrian in a constant movement around the intersection. The most
critical assumption of the experiment, is that a rational actor, acting as pedestrian, doesn’t want to
be struck by a vehicle. Hence the method of using a live participant as the pedestrian moving across
conflict streams at real intersections making rational cross/don’t cross decisions is internally valid.
This method has several benefits: 1) there is an adequate supply of data (Preliminary
observation at different intersections showed that pedestrian and bicycle traffic were almost non-
existent), 2) every standard pedestrian scenario is covered and 3) the movement of the pedestrian
and the cross/don’t cross decisions are easily tracked by video.

60
The unique aspects of this study are: 1) examination of pedestrian’s perspective of safety
at roundabouts, 2) use of the conflict stream instead of conflict point as the true influence in the
pedestrian’s decision and 3) use of human participant in a field experiment data on real
roundabouts as a basis for simulation data. The relevant data include: 1) the cross/don’t cross
decision, 2) the pedestrian’s perspective of approaching traffic that influenced these decisions and
3) total traffic volume per hour.
The current study is unique as that the principal investigator used himself as a simulation
tool, by constantly circling each intersection. Video was taken from ground-level to capture the
pedestrian's perspective. The study did not focus on timings, as a rational pedestrian doesn’t think
in terms of timings. Pedestrians are not standing at a crossing point with a stopwatch, but rather,
estimating vehicle distance, gaps between vehicles, vehicle approach speed and visual cues such
as activated turn signals or driver eye contact.
Data was manually transcribed by observing playback of the recorded video and
performing a manual count of vehicles and decisions. The manual counting may be imperfect
(missing counts while viewing hours of film), but object recognition software could also be
imperfect (inability to recognize certain objects or distinguishing individual objects among groups
of objects).
There are many observations about the data that must be defined, explained or clarified.
The key item of data is the ‘cross/don’t cross decision’. This is where the participant pedestrian
must decide whether it is safe to proceed across a single lane of traffic. The key assumption is that
an intersection-type where a pedestrian makes significantly more ‘cross’ decisions per lane versus
don’t cross decisions, is safer than another intersection where the percentage of cross decisions is
much lower.

61
4.3.2 Crossing Position
For this study, ‘crossing position’ is defined as the physical point where the pedestrian is standing
at the traffic lane and must make a decision to cross or not cross. On the video, the pedestrian can
be observed turning their head to look for traffic as a signal that they are in a crossing position.
The pedestrian may also turn body towards oncoming traffic to signal that they are in a crossing
position. Decisions are only counted from the point where the pedestrian has assumed the crossing
position, otherwise it is premature, likewise if the pedestrian has already entered the traffic lane.
4.3.3 Traffic Volume
Traffic video was made on a weekend day and on a weekday. The day of the week showed more
traffic on a weekday than a weekend, but the differences in traffic volume were not significant. A
higher traffic volume could affect the comparison between the two intersections, but does not
impact the cross/don’t cross decision-making process in any observable way. The volume of traffic
relates more to site selection and not intersection geometry. Traffic volume can be seen in the
table. Total traffic is differentiated from relevant traffic. Relevant traffic is defined herein as that
traffic which enters into the pedestrian’s decision-making process. The total of all traffic through
both intersections was manually recorded from the video. A total of 4,889 vehicles went through
both intersections. The chart shows almost twice as much traffic at the signalized intersection.

62
Figure 4.3: Chart of Total Vehicular Traffic
A total of 3,091 vehicles were observed at the signalized intersection (Route 981) in four
hours of video, of which only 8.70% were relevant to the cross decision, while 1,798 vehicles were
observed at the roundabout in four hours of video, of which fully 48.94% factored into the
cross/don’t cross decision. The preliminary indication was that a pedestrian had to be eight times
as alert to traffic at the roundabout as at the signalized intersection. This was an unexpected result.
The chart shows the huge disparity in ‘relevant traffic’.

63
Figure 4.4: Chart of Percent of Relevant Traffic
The signalized intersection was on a main, undivided highway with traffic going to and
from Latrobe and U.S. Route 30. The pedestrian’s direction of travel, clockwise vs. counter-
clockwise, is independent of traffic volume, as each conflict is a single decision. Volume of traffic
does factor into pedestrian decision-making, when the traffic is clustered around one particular
lane crossing decision as multiple vehicles tend to queue up over time when the slow pedestrian is
trying to cross one lane of traffic. Total traffic by direction of pedestrian travel was recorded to
test a hypothesis that where the pedestrian faces traffic at exit lanes, they would make significantly
more cross decisions as they could observe the closest converging vehicles.

64
4.3.4 Roundabout Geometry
The roundabout at Monastery Drive and St. Vincent’s Road is not to modern code (FHWA, 2000).
It had a tree and sign in the center island that obstructs the view from two angles of entry. It has
no marked crosswalks. It does have a slowdown marking where a crosswalk would be
hypothetically located on the entrance lane. The roundabout does have splitter islands which can
be used for pedestrian refuge.
Speed limits at the roundabout are 15 miles per hour (mph) from all directions, as a
consequence, most drivers approached the roundabout slowly. Drivers did not appear to know how
or when to use turn signals once in the circular roadway portion of the roundabout. Use of a signal
can be confusing as it could be difficult to determine when to signal, i.e., a signal too early or too
late could indicate the wrong exit point to another driver or pedestrian. Traveling a full circuit
through the circular roadway is rare. It is used on purpose for making a U-turn or change of mind,
see for example, Hourdos’ (2012) 360⁰ U-Turn Concept.
It was also difficult to define when a vehicle is in the circular roadway once the pedestrian
assumed a crossing position. For the purposes of the experiment, it was assumed that once a vehicle
had started to enter the circular roadway and/or was still within the circular roadway when the
pedestrian assumed the crossing position, it was assumed to be ‘in the circle’.
4.3.5 Signalized Intersection
Speed limits for the signalized intersection at U.S. Route 981 are 25 mph on Monastery Drive and
40 mph on State Route 981 on the approach to the signalized intersection. There are protected
pedestrian crosswalks with 20 seconds or less of crossing signal time. One of the entrance lanes,

65
Monastery Drive (eastbound), has a protected right-turn light and the two opposing entrance lanes
on Route 981 have protected left-turn lanes. The data is ranked by percentage of decision to cross
for each feature. Slow pedestrians tended to make significantly lower cross decisions than the
standard speed pedestrians in almost every situation.
4.3.6 Crossing Decisions
The crossing decision is simply cross or don’t cross. By don’t cross, the pedestrian waits for the
next opportunity to cross that particular lane. No matter how many vehicles come through that
conflict point, it only counted as one decision. Some decisions might be hurried out of safety,
technically, this might be considered a bad cross, but an effort was made to be sufficiently careful
so as not to affect the results.
Some drivers made eye contact out of courtesy, forming an unspoken agreement that the
pedestrian was permitted to cross. Acting as pedestrian, I would wave my hand to allow a vehicle
to proceed, as the initial decision was ‘don’t cross’ based on the proximity of the vehicle and the
goal was to accurately reflect that decision in the data.
The chart below illustrates the number of separate decisions that had to be made by the
pedestrian at each intersection type. The roundabout required three times as many decisions as the
signalized intersection, indicating a riskier environment where the pedestrian had to be
significantly more alert to approaching vehicles.

66
Figure 4.5: Chart of Total Decisions per Intersection Type
4.3.7 Roundabout Entrance Lane “Frame”
The concept of ‘frames’ was developed to capture the nature of the approaching vehicle at the
roundabout entrance lanes from the pedestrian’s perspective. Here, geometry dictated this
measurement. A blocking vehicle, is one that is already stopped or moving into the circular
roadway literally blocking the pedestrian’s attempt to cross the entrance lane.
‘In-frame’ means that the vehicle was visible when the pedestrian arrived at the crossing
position. ‘out-of-frame’ vehicles, were vehicles that appeared on the horizon immediately after the
pedestrian assumed the crossing position, but were moving at such a high rate of speed or otherwise
part of an existing queue of entering vehicles, such that the out-of-frame vehicle still influenced
the crossing decision. When the pedestrian was walking at the slow pace, many more out-of- frame
vehicles at became relevant at the roundabout entrances.

67
4.3.8 Observed Differences between the Signalized Intersection and the Roundabout
It is worth restating the hypothesis for the purpose of the case study: would pedestrians be safer if
the signalized intersection at 981 and Monastery were replaced by a roundabout? Entrance lane
cross decisions percentages are illustrated in the table below. The pedestrian made significantly
fewer decisions to cross an entrance lane at the roundabout 19% than at the intersection 62%.
Figure 4.6: Entrance Lane Percentage Crossing Decision
Exit lane percentage cross decisions are illustrated in the table below. Across all categories,
the pedestrian made significantly fewer decisions to cross at roundabout exit lanes, a rate of 29%
than at the signalized intersection exit lanes, a rate of 77%. This could be due to several factors.

68
One of course is signalization. Cross traffic is literally stopped by the red-light signal, so traffic
cannot traverse the intersection into an exit lane while the pedestrian crossing signal is activated.
At one of the lanes, the protected red light was restricted by a ‘no turn on red’ sign which turned
off the permissive red arrow signal when the pedestrian crossing signal was activated, preventing
the nearest vehicle from turning right on red from Monastery Drive eastbound and crossing the
pedestrian’s path in the exit lane of northbound-facing U.S. Route 981.
Figure 4.7: Exit Percentage Cross Decision
The decision to cross roundabout entrance lanes depended largely on how close the
approaching vehicles were to the pedestrian. Blocking vehicles required almost always a ‘don’t

69
cross’ decision. ‘In-frame vehicles often were in close enough proximity to require a ‘don’t cross’
decision. So-called ‘out-of-frame’ vehicles were adequately distant to most often permit the
pedestrian to make a ‘cross’ decision. A caveat, is that the small sample size must be taken into
account.
Figure 4.8: Decision to Cross a Roundabout Entrance Lane Chart
At the roundabout exit lanes, results were similar, the closer the proximity of the entering
traffic ¼ turn, ½ turn, or the closer the proximity of moving traffic, by virtue of being within the
circular roadway (in-the-circle) the more likely decision by the pedestrian in the interest of safety
was ‘don’t cross’. The sample sizes are relatively well-balanced.

70
Figure 4.9: Decision to Cross at a Roundabout Exit Lane Chart
At the signalized intersection, due to the signalized pedestrian crossing light, entrance lane
crossing decisions were rare or were rendered mostly unnecessary due to the traffic being stopped
by the red-light signal. At exit lanes, the pedestrian favored a ‘cross’ decision where the approach
was permissive right on red and mixed if it was a permissive left. This higher rate of crossing at
the intersection was curious, despite the presence of much higher traffic volume at the signalized
intersection. It appears to relate to the protected crossing signal unexpectedly eliminating some of
the conflict streams.
While one of every two vehicles factored into a pedestrian's decision whether to cross a
roundabout lane, only one of twelve vehicles factored into a pedestrian's decision whether to cross
a signalized intersection lane which was is protected by a pedestrian walk signal. These

71
conclusions are supported by the data, which showed that a pedestrian had to make three times as
many decisions when crossing a roundabout lane as when crossing a protected pedestrian lane at
a signalized intersection. However, despite almost twice as much traffic volume at the signalized
intersection, the pedestrian had a much smaller number of decisions to make at the signalized
intersection than at the roundabout.
Clusters of vehicles were more relevant at the roundabout in decision-making then at the
protected pedestrian crossing at the signalized intersection. This could be due to the signals
controlling the flow of traffic in a more predictable manner, than at the roundabout with the
constant flow of traffic.
At exit lanes in both intersection types, the slow pedestrian made many fewer cross
decision than the faster pedestrian. This could be due to different factors at each type of
intersection. At the signalized intersection, exit lanes could be approached by vehicle from up to
three directions. At the roundabout, as described above, there could be five directions of vectors
from which vehicles could approach the pedestrian’s lane of crossing.
4.3.9 Direction of Travel
Vehicles travel in a counter-clockwise direction in a roundabout in the United States (turning to
the right upon entering). For the pedestrian’s direction of travel, walking clockwise in the
roundabout goes against traffic flow, thus the pedestrians is facing traffic, permitting safer crossing
decisions. The counter-clockwise direction is with traffic flow and is more dangerous, because
exiting traffic, especially from only ¼ of the circle away from the pedestrian is behind the
pedestrian’s back, forcing them to look over their shoulder.
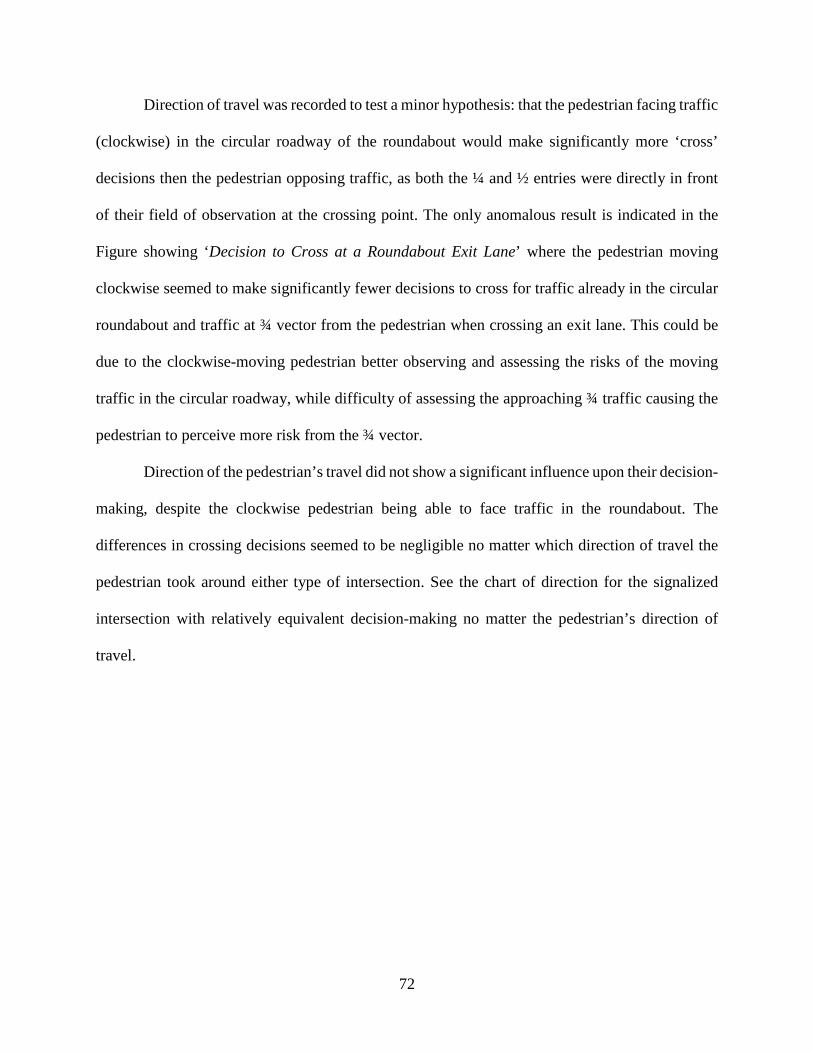
72
Direction of travel was recorded to test a minor hypothesis: that the pedestrian facing traffic
(clockwise) in the circular roadway of the roundabout would make significantly more ‘cross’
decisions then the pedestrian opposing traffic, as both the ¼ and ½ entries were directly in front
of their field of observation at the crossing point. The only anomalous result is indicated in the
Figure showing ‘Decision to Cross at a Roundabout Exit Lane’ where the pedestrian moving
clockwise seemed to make significantly fewer decisions to cross for traffic already in the circular
roundabout and traffic at ¾ vector from the pedestrian when crossing an exit lane. This could be
due to the clockwise-moving pedestrian better observing and assessing the risks of the moving
traffic in the circular roadway, while difficulty of assessing the approaching ¾ traffic causing the
pedestrian to perceive more risk from the ¾ vector.
Direction of the pedestrian’s travel did not show a significant influence upon their decision-
making, despite the clockwise pedestrian being able to face traffic in the roundabout. The
differences in crossing decisions seemed to be negligible no matter which direction of travel the
pedestrian took around either type of intersection. See the chart of direction for the signalized
intersection with relatively equivalent decision-making no matter the pedestrian’s direction of
travel.

73
Figure 4.10: Signalized Intersection Decision-making by Direction of Pedestrian Travel
The data did not support the hypothesis, as the counter-clockwise pedestrian made 10%
more ‘cross’ decisions than the clockwise pedestrian at a standard rate of speed and the slow,
counter-clockwise pedestrian made 2% more ‘cross’ decisions than the slow clockwise pedestrian.
4.3.10 Speed of Pedestrian
The data showed a significant difference in cross decisions when walking at the slow pace. The
slow pedestrians had to wait for more multiple vehicle clusters (queues). The fewer decisions to
cross by the slow pedestrian were expected.

74
Figure 4.11: Cross Decision - Speed and Intersection Type Roundabout vs Intersection
In the roundabout, the slow pedestrian decided to cross 41% of the time that the standard
speed pedestrian decided to cross. Within the signalized intersection, the slow pedestrian decided
to cross 55% of the time that the standard speed pedestrian decided to cross. This shows that the
slow pedestrian perceived that it was safer to cross in the signalized intersection in relation to the
standard speed pedestrian than in the roundabout.
The standard speed pedestrian in the roundabout only decided to cross 42% as often as the
standard speed pedestrian in the signalized intersection. This percentage drops to only 27% as
many decisions to cross in the roundabout as in the signalized intersection. This demonstrates a
much lower level of confidence by the slow pedestrian to cross in the roundabout.

75
The slow pedestrian (approximately 10-12 seconds to cross one traffic lane vs. 5-6 seconds
for the standard speed pedestrian) made significantly fewer ‘cross’ decisions at exit lanes of the
roundabout than at the intersection. The slow pedestrian made significantly fewer cross decisions
at entrance lanes of the Intersection than at the roundabout, but the traffic volumes were so low as
to render any valid comparison of those results insignificant. Both the slow and the standard speed
pedestrian made significantly fewer cross decisions at all lanes of the roundabout than at the
signalized intersection.
4.3.11 Effect of Multiple Vehicles
The data showed a significant difference in the effect of multiple vehicles. The presence of multiple
vehicles per lane crossing attempt was almost universally higher at the roundabout than at the
signalized intersections. The geometry of the signalized intersection seemed to account for fewer
vehicles being in play from the perspective of the pedestrian. This could be due to the reduction in
conflict streams of approaching vehicles caused by the pedestrian signals closing off otherwise
expected conflict streams.
Despite one outlier at the signalized intersection in a clockwise direction, the trend was
very strong that as more clusters of multiple vehicles appeared when the pedestrian attempted to
cross a lane, the fewer cross decisions the pedestrian was able to make.

76
Figure 4.12: Percent of Multiple Vehicles vs Percent Cross Decisions
4.3.12 Conflict Point Anomaly
The roundabout appears from the data to be less safe for the pedestrian than the signalized
intersection. Even with a marked crosswalk at a roundabout, the lack of signalization by design,
permits drivers to not have to yield until a pedestrian is actually within the roadway. The number
of conflict streams was dramatically reduced at the signalized intersection by virtue of the
protected signalized pedestrian crosswalk.
The difference between this study and previous studies is in the subtle definition of a
‘conflict point’. Gross (2013, p. 235) defined the ‘conflict point’ as points in an intersection where
traffic is crossing, converging and diverging. The FHWA (2000, p. 104) definition is: "A conflict

77
point is a location where the paths of two motor vehicles, or a vehicle and a bicycle or pedestrian
queue, diverge, merge, or cross each other."
Several studies relied on the FHWA (2000) conflict point diagrams. However, these
diagrams seem to count converging vehicles according to the FHWA’s own definition in the
intersection diagram but not in the roundabout diagram. This study views these converging
vehicles as conflict streams which influence the pedestrians cross/don’t cross decision. Further,
when a pedestrian walk signal is illuminated, any center lanes are blocked by a signal and any
crossing or entering traffic in the middle lane is blocked, so a pedestrian would never encounter
more than twelve conflicts in a full revolution if they were to make a full circuit around all lanes
of the intersection.
If we use the FHWA’s (2000) rationale on the number of conflict points, defining conflicts
the same way in each diagram, once we include converging traffic, as per the definitions cited
above, the number of conflict streams at roundabout exits could be no less than thirty-two, (three
per entrance lane and at least five per exit lane), which is almost three times the number of actual
conflict streams at the signalized intersection.
In the roundabout, vehicles approaching from five different vectors may create a conflict
at each exit lane alone. Going further, if the pedestrian is blocked at the entrance lane and another
car is converging, that is two conflicts at once and a distant vehicle that becomes relevant by virtue
of queues of earlier vehicles who have not yet entered the circular roadway, one could conceive of
at least three conflicts at roundabout entrances alone, where the literature only expects one conflict.
This study draws an inference from these definitions. If we consider the situation from the
decision-making perspective of the pedestrian, how many vehicles do they have to pay attention
to at each type of intersection? If we look at the FHWA’s (2000) diagram above, we see vehicle

78
conflict points marked on the roundabout based on their own definition. But does this apply to the
pedestrian’s understanding of traffic streams that influence their decision to cross a lane of traffic?
Sadeq and Sayed’s (2016) visualized actual vehicle-pedestrian conflicts, generated from
actual conflict streams that more accurately represent the approaching vehicles that may influence
the pedestrian’s decision. To the pedestrian who circumnavigates the roundabout, every time they
cross an entrance they only have to worry about one potential conflict, from a single lane of
entering traffic. However, when they cross an exit lane, there are five points of convergence, not
one, when the pedestrian arrives at the crossing position: Vehicles situated in the circular roadway
at ¼, ½ and ¾ turn from the exit plus vehicles at 1 full turn, who may influence the decision by
queueing if the pedestrian has to wait for closer vehicles.
At the signalized intersection in particular, there are four exit and seven entrance lanes.
Four of the lanes are always blocked by the signals when a pedestrian has the walk sign. For the
seven remaining lanes, at three of the lanes there is only one conflict point and for the other lanes
there are two conflict points, for a total of eleven conflict streams, far less than the nineteen to
thirty-two that were predicted by the literature for a four-way signalized intersection.
While the roundabout should only have eight conflict points according to the FHWA
(2000), if we measure both equally, there are only eleven conflict streams at the signalized
intersection at U.S. Route 981. If we count approaching vehicles, every vehicle entering the
roundabout or within the circular roadway is a potential conflict for each of the four lanes, for a
staggering total of thirty-two conflict streams, five at each exit lane and three at each entrance lane.
This could explain the large difference in required cross/don’t cross decision-making at the
roundabout.

79
The difference in cross decisions remains constant between the slow and standard speed
decision no matter what the geometry. The slow pedestrian has to be more cautious, so the result
should be consistent in any type of intersection. However, the pedestrian in general seems to make
significantly fewer cross decisions in the roundabout no matter what the speed of the pedestrian
when we compare slow speed pedestrians to slow and standard speed pedestrians to standard when
we compare data from the signalized intersection against the roundabout. The yield-controlled
roundabout seems to require more caution for the slow pedestrian than the signalized intersection.
The data supports the hypothesis that the roundabout is generally less safe for the
pedestrian than the signalized intersection for two reasons:
1) the literature presumes a higher number of conflict points at the four-way signalized
intersection than at the roundabout, this does not consider the fact that the pedestrian walk
signal actually eliminates some of these expected conflict points, thus requiring fewer
decisions than anticipated;
2) If conflict points are defined the same way for each intersection type, based not on the
number of lanes, but on the number of legally converging traffic vectors, the roundabout
conflict points balloon from eight converging vehicles to as many as thirty-two converging
vehicles.
This study could complement the other studies which concluding that roundabouts
compared to signalized intersections reduced conflicts from thirty-two down to eight. The estimate
of thirty-two conflict points for signalized intersections does not take into account the effect of the
walk signals and red-light signals that eliminated the majority of the possible vehicle-pedestrian
conflict streams.

80
Several of the United States simulation-based studies did not use or observe actual
crossings. The advantage of a human participant for the experimental model was the assumption
that no reasonable person will take a physical risk of being struck by a vehicle and thus decision-
making reflects personal interest and thus assures accuracy.

81
5.0 SUMMARY AND CONCLUSIONS
This study proposed a unique new method for assessing and modeling pedestrian safety at
roundabouts in the United States. The method uses a live human participant at two real
intersections, one a roundabout and the other a signalized intersection, each with four vehicle
approaches. The use of the participant proved to be internally valid, as no reasonable participant
would risk injury by making unsafe cross/don’t cross decisions in real life. The model may be
suitable to provide real-world data to calibrate existing simulation, modeling and virtual reality
systems that assess safety at roundabouts.
The second aspect of this study that was unique, was to understand a basic flaw in the
literature and governmental guidance in the understanding of pedestrian conflicts with vehicles.
The concept of the ‘conflict point’ must be revisited by researchers as it does not only fail to
adequately capture either the risks inherent to the pedestrian in an intersection from converging
traffic from multiple possible approach vectors or to coincide with the generally accepted
definition of conflict point which specifically included ‘converging’ vehicles. The conflict point
is thus too simplistic to capture the multiple traffic flows that may cross the conflict point in the
lane to be traversed and influence the pedestrian’s crossing decision.
The third aspect of this study that has value, is instead of using complex ‘Gap Analysis’
and ‘Time to Collision’ computations, the pedestrian’s decision-making in conjunction with the

82
factors such as signalization, approach vectors, exit vs. entrance lanes, slow vs. fast pace and
direction provide a more realistic picture of the essentially binary decision: cross vs. don’t cross.
Fourth, the study had a practical focus on the disabled or elderly pedestrian. The
experiment used a walking pace at half the rate of the standard pace pedestrian. While data
expectedly showed that the slow pedestrian had a much lower rate of ‘cross’ decisions than the
standard speed pedestrian, the study exposed that the slow pedestrian had a much higher rate of
‘don’t cross’ decisions at the roundabout than at the Intersection, rendering the roundabout a much
riskier environment for the disabled or elderly pedestrian than the signalized intersection where
the traffic signals effectively cut off many approach vectors.
Finally, roundabouts were thought to be safer for pedestrians than signalized intersections
due to a lower number of conflict points, but the confusing multiple vectors of roundabout traffic
converging into exit lanes and the frames of approaching traffic at roundabout entrances did not
accurately capture the risks a pedestrian must take into account when traversing the roundabout.
The data on relevant traffic showed that pedestrians had to be attentive to almost six times as many
approach vectors in the roundabout as they were in the signalized intersection.
This study is limited, but the value in its application are four-fold: 1) conflict stream data
is an improvement upon the conflict point and should be at the core of traffic conflict analysis, 2)
the binary cross/don’t cross decision is critical data for evaluating the safety of roundabout
crossings, 3) slow pedestrians fared much more poorly in their ability to cross at the roundabout
than at the signalized intersection, 4) the human participant in a field experiment method can be a
valuable source of data for calibrating pedestrian safety simulation systems.

83
Future studies should examine the conflict stream to 1) augment the concept of the conflict
point in order to reflect traffic flow patterns that influence a pedestrian’s decision to cross a lane
of traffic, 2) use the cross/don’t cross decision to evaluate the safety of roundabout crossings as a
more measurable and realistic data point for understanding the pedestrian’s decision of when to
cross, and 3) data from the human participant in a field experiment method can be used to calibrate
simulation and virtual reality modeling systems to more accurately evaluate issues of pedestrian
safety in locations with moderate vehicular traffic.

84
APPENDIX A. GLOSSARY OF TERMS AND ACRONYMS
CCW Counter-Clockwise Direction of Travel CW Clockwise Direction of Travel Circulatory Roadway The circular roadway around the Central Island in a roundabout Conflict ‘“near-miss” situations in which a vehicle had to abruptly brake or swerve to avoid striking a pedestrian or a pedestrian had to take sudden evasive action to avoid being struck.’ Retting (2003) at p. 1457 Conflict Point
• Points in an intersection where traffic is crossing, converging and diverging. Gross et. al. (2013 p. 235)
• "A conflict point is a location where the paths of two motor vehicles, or a vehicle and a bicycle or pedestrian queue, diverge, merge, or cross each other." FHWA (2000 p. 104)
Conflict Stream A conflict stream is a vehicle approach which influences a pedestrian’s cross/don’t cross decision at a given vehicular approach lane. Conflict Vector See conflict stream. Crossing Position ‘Crossing Position’ is the physical point where the pedestrian is standing at the traffic lane and must make a decision to cross or not cross. Entrance Lane Terms – Roundabout
• B (blocking) - Car is blocking the pedestrian’s path or imminent • F (in-frame) - Car is traveling towards the Circulatory Roadway and is visible from the
horizon one frame away (within 5 seconds)

85
• OF (out-of-frame)- Car is traveling towards the Circulatory Roadway and is not visible from the horizon until the pedestrian makes a decision to cross but has not yet entered the lane
Exit Lane Terms – Roundabout
• C - car is already in the Circulatory Roadway • ¼ - car is in the nearest entrance lane, 90°, ¼ of the distance to the exit lane conflict point • ½ - car is on the opposite side of the Circulatory Roadway, 180°, ½ of the distance to the
exit lane conflict point • ¾ - car is at the furthest distance from the exit lane, 270°, ¾ of the distance to the exit
conflict point • M - Multiple cars in the Circulatory Roadway Grouped on one line In Italics • 1+ - car travels at least 360° around the Circulatory Roadway before deciding to exit
(anomaly, lost or indecisive driver) See generally, Hourdos (2012). FARS Fatality Analysis Reporting System (FARS) FHWA U.S. Department of Transportation, Federal Highway Administration fps Feet per Second HLDI Highway Loss Data Institute of the Insurance Institute for Highway Safety, Arlington, VA, USA IIHS Insurance Institute for Highway Safety, Arlington, VA, USA Intersection (1) The area embraced within the prolongation or connection of the lateral curb lines, or, if none, then the lateral boundary lines of the roadways of two highways which join one another at, or approximately at, right angles, or the area within which vehicles traveling upon different highways joining at any other angle may come in conflict. Pa Vehicle Code, Title 75 Section 102 Definitions mph Miles per Hour mps Meters per second NHTSA U.S. National Highway Transportation and Safety Administration

86
PennDot Pennsylvania Department of Transportation Relevant Traffic That traffic which poses enough risk to a pedestrian crossing a lane of traffic so as to influence the pedestrian’s decision-making process. Rotary First Use 1836 "2 a road junction formed around a central circle about which traffic moves in one direction only —called also circle, traffic circle" https://www.merriam-webster.com/dictionary/rotary Merriam-Webster, Incorporated, 2017 Roundabout (British) First Use 1734, "Rotary 2 https://www.merriam-webster.com/dictionary/Roundabout Merriam-Webster, Incorporated, 2017 Roundabout (US) Roundabout—a circular intersection with yield control at entry, which permits a vehicle on the circulatory roadway to proceed, and with deflection of the approaching vehicle counter-clockwise around a central island. FHWA (2009 p.19) Total Hourly Traffic (THT) Total Hourly Traffic is the total traffic volume per hour at an intersection based on observed data.
• Total Hourly Traffic (THT) is computed as: THT = TTR + TTI Total Traffic Relevant (TTR) TTR is all vehicular traffic with an effect on the crossing decision, for example:
• The pedestrian has to stop to avoid a conflict • The pedestrian crosses after assessing the likelihood of a potential conflict
Total Traffic Irrelevant (TTI) TTI is all traffic with no effect on the crossing decision for example:
• Vehicle passes after the pedestrian clears the conflict point • Vehicle crosses a lane which is not a conflict point for that pedestrian
Traffic Calming Traffic calming is an important tool for improving quality of life. It slows or diverts cars so streets are safer and more inviting to pedestrians, bicyclists, and children. Traffic calming makes drivers more aware of sharing street space with other users. Traffic calming, Hoyle, C. 1995 Publisher: APA Planning Advisory Service (July 1, 1995) Traffic Circle First use 1942 "a circular area where two or more roads meet and on which all vehicles must go in the same direction" https://www.merriam-webster.com/dictionary/traffic%20circle Merriam-Webster, Incorporated, 2017

87
Traffic-control signal. A device, whether manually, electrically or mechanically operated, by which traffic is alternately directed to stop and permitted to proceed. Pa Vehicle Code Title 75 Section 102 Definitions VLC VLC is a free and open source cross-platform multimedia player and framework that plays most multimedia files as well as DVDs, Audio CDs, VCDs, and various streaming protocols.

88
BIBLIOGRAPHY
Alphand, F., U. Noelle, and B. Guichet. (1991) “Roundabouts and Road Safety: State of the Art in France.” In Intersections without Traffic Signals II, Springer-Verlag, Germany (W. Brilon, ed.), pp. 107–125.
Amundsen, F. H., C. Hyden (Eds.) (1977) Proceedings from the first workshop on traffic conflicts.
26-27 September 1977, Oslo, Norway Autodesk, Inc. ‘Maya’ Computer Animation Software (2017)
https://www.autodesk.com/products/maya/overview (Retrieved July 14, 2017) Barnett, A. G. (2004). Regression to the mean: what it is and how to deal with it. International Journal of Epidemiology, 34(1), 215-220. doi:10.1093/ije/dyh299 BBC - Nottingham - History - The man who gave us traffic lights. (2009, July 16). Retrieved from
http://www.bbc.co.uk/nottingham/content/articles/2009/07/16/john_peake_knight_traffic_lights_feature.shtml
Brilon W., Stuwe B., Drews O. (1993) Sicherheit und Leistungsfahigkeit von
Kreisverkehrsplatzen. Bochum, Germany: Lehrstuhl fur Verkehrswesen, Ruhr-Universitat Bochum; 1993
Brude U, Larsson J. What Roundabout design provides the highest possible safety? Nordic Road Transport Res. 2000;12:17–21. Carter, D. L., W. W. Hunter, C. V. Zegeer, J. R. Stewart, and H. F. Huang. Pedestrian and
Bicyclist Intersection Safety Indices: Research Report. Draft Final Report. FHWA, Feb. 2006
Centre d’Etude des Transports Urbains (CETUR). “Safety of Roundabouts in Urban and Suburban Areas.” Paris, 1992. (Cited by FHWA 2000) City of Carmel All About Roundabouts [Brochure] (n.d.) Retrieved from http://www.carmel.in.gov/Modules/ShowDocument.aspx?documentID=732 Crown, B. “An Introduction to Some Basic Principles of U.K. Roundabout Design.” Presented at
the ITE District 6 Conference on Roundabouts, Loveland, Colorado, October, 1998. (Cited by FHWA 2000)

89
Cumming, B. (2011) Roundabouts: Why they are dangerous for cyclists and what can be done
about it. Transport Engineering in Australia, Vol. 13 No. 1 Institution of Engineers Australia, 2011
Daniels, S., Brijs, T., Nuyts, E., Wets, G. (2008). The effects of Roundabouts on traffic safety for
bicyclists: An observational study. Accident Analysis & Prevention, Volume 40, Issue 2, March 2008, Pages 518–526. http://www.sciencedirect.com/science/article/pii/S0001457507001352
Daniels, S., Brijs, T., Nuyts, E., Wets, G. (2010). Explaining variation in safety performance of Roundabouts. Accident Analysis & Prevention Volume 42, Issue 2, March 2010, Pages 393–402. http://www.sciencedirect.com/science/article/pii/S0001457509002280 Engelsman, J.C. and Uken, M. (2007) Turbo Roundabouts as an Alternative to Two Lane Roundabouts. Proceedings of the 26th Southern African Transport Conference (SATC 2007). http://www.lags.corep.it/doc/turbo-Roundabout.pdf Pages 581-589. FHWA, U.S. Department of Transportation, (2015) Accelerating Roundabout Implementation in the United States – Volume I of VII Evaluation of Rectangular Rapid‐Flashing Beacons (RRFB) at Multilane Roundabouts. Publication No. FHWA-SA-15-069 September 2015. FHWA, U.S. Department of Transportation (2000, June) Roundabouts: An Informational Guide. Report No. FHWA-RD-00-67. FHWA, U.S. Department of Transportation (2009) Manual on Uniform Traffic Control Devices 2009 Edition FHWA, U.S. Department of Transportation (2016) Intersection Safety, Roundabout and Mini
Roundabouts http://safety.fhwa.dot.gov/intersection/innovative/Roundabouts/ last modified date: May 31, 2016
FHWA, U.S. Department of Transportation. (2015) Accelerating Roundabout Implementation in
the United States – Volume IV of VII A Review of Fatal and Severe Injury Crashes at Roundabouts. PUBLICATION NO. FHWA-SA-15-072 SEPTEMBER 2015 https://safety.fhwa.dot.gov/intersection/innovative/Roundabouts/docs/fhwasa15072.pdf
Flannery, A. (2001) Geometric Design and Safety Aspects of Roundabouts. Transportation
Research Record: Journal of the Transportation Research Board 2001 1751:, 76-81 http://trrjournalonline.trb.org/doi/abs/10.3141/1751-09
Forum8 (2014) ‘The 5th Cloud Programming World Cup’. Analysis of drive behavior in shared
spaces and architecture of large scale simulation environments (video) Retrieved from http://cpwc.forum8.co.jp/works_2014/CPWC2014_07-J-0010.html
Forum8 (2016) UC-win/Road Driving Simulators Retrieved from

90
http://www.forum8.com/idrive_simulator.htm Glovis (2017) USGS Earth Resources Observation and Science (EROS) Center, U.S. Geological Survey. https://glovis.usgs.gov/ Gross, F., Lyon, C., Persaud, B., & Srinivasan, R. (2013). Safety effectiveness of converting
Signalized Intersections to Roundabouts. Accident Analysis & Prevention, 50, 234-241. doi:10.1016/j.aap.2012.04.012
Harkey, D., & Carter, D. (2006). Observational Analysis of Pedestrian, Bicyclist, and Motorist
Behaviors at Roundabouts in the United States. Transportation Research Record: Journal of the Transportation Research Board, 1982, 155-165. doi:10.3141/1982-21
Headrick, J., & Uddin, W. (2014). Traffic flow microsimulation for performance evaluation of
Roundabouts and stop-controlled intersections at highway overpass. Advances in Transportation Studies, 2004, 34:7-18
Highway Loss Data Institute of the Insurance Institute for Highway Safety. (2004) HLDI Status
Report (2004). What works and what doesn't to reduce pedestrian crash deaths. Status Report, Vol. 39, No. 6, July 3, 2004 http://www.iihs.org/iihs/sr/statusreport/article/39/6/2
Hourdos, J. (2012) Investigation of Pedestrian/Bicyclist Risk in Minnesota Roundabout
Crossings, Principal Investigator Minnesota Trac Observatory, Department of Civil Engineering University of Minnesota September 2012 Research Project Final Report 2012-28
Insurance Institute for Highway Safety (2010, July 2) How Roundabouts work. Retrieved from https://www.youtube.com/watch?v=1DJDjaa25Co Insurance Institute for Highway Safety. (2016) Roundabouts. Retrieved from http://www.iihs.org/iihs/topics/t/Roundabouts/topicoverview Ismail, K., Sayed, T., Saunier, N., & Lim, C. (2009). Automated Analysis of Pedestrian-Vehicle
Conflicts Using Video Data. Transportation Research Record: Journal of the Transportation Research Board, 2140, 44-54. doi:10.3141/2140-05
Kittelson & Associates, Inc. a (KAI) Transportation Engineering Firm (Webpage) (2017) http://Roundabouts.kittelson.com/Home/About Kittelson & Associates, Roundabouts Database, (2017) http://Roundabouts.kittelson.com/ Lester, P. (2015) Roundabouts gaining traction in Pennsylvania. The Morning Call (2015,
January 31) http://www.mcall.com/news/local/mc-lehigh-valley-penndot-Roundabouts-20150131-story.html
Maycock, G., and R.D. Hall. Crashes at four-arm Roundabouts. TRRL Laboratory Report LR

91
1120. Crowthorne, England: Transport and Road Research Laboratory, 1984. (Cited by FHWA 2000)
Mukai N., Hayashi M. (2015) Analysis of Driving Behaviors at Roundabout Intersections by
Using Driving Simulator. In: Damiani E., Howlett R., Jain L., Gallo L., De Pietro G. (eds) Intelligent Interactive Multimedia Systems and Services. Smart Innovation, Systems and Technologies, vol. 40. Springer, Cham
National Highway Transportation and Safety Administration (NHTSA), (2017) Estimates of
Total People Injured and Pedestrians Injured in Motor Vehicle Traffic Crashes, By Year General Estimates System (GES) 2001-2015.
National Highway Transportation and Safety Administration (NHTSA), (2017), Fatality
Analysis Reporting System (FARS) Pedestrian Fatalities in Motor Vehicle Traffic Crashes, by Year, Type of Intersection of the Crash and Pedestrian Location at Time of Crash Fatality Analysis Reporting System (FARS) 2010-2014 FINAL & 2015 ARF NHTSA.
NCHRP (2006) Applying Roundabouts in the United States’ NCHRP 3-65 Final Report. Transportation Research Board of the National Academies, Washington, D.C. 2006 Osborne, H. (2014) History of Traffic Lights: 100th Anniversary of the First Electric Traffic
System (2014, August 5) Retrieved from http://www.ibtimes.co.uk/history-traffic-lights-100th-anniversary-first-electric-traffic-system-1459680
Palat, B., & Delhomme, P. (2012). What factors can predict why drivers go through yellow
traffic lights? An approach based on an extended Theory of Planned Behavior. Safety Science, 50(3), 408-417.
Pennsylvania Department of Transportation (2001) Guide to Roundabouts, PENNDOT Publication Number 414. Prepared by: Michael Baker Jr., Inc. May 2001 Pennsylvania Department of Transportation (2016) PA Roundabouts (B-C-Public) – 120216. Pennsylvania Department of Transportation (2016) Design Manual, Part 2 Highway Design, Publication 13M (DM-2) March 2015 Edition - Change #1 October 2016 Pennsylvania Department of Transportation (2017) Roundabouts - Before & After w By Year (First 10) Data Summary. Public Transport Authority, The Government of Western Australia (2016) Planning and
Designing for Pedestrians: Guidelines 172-176. Pedestrian Crossing Facilities 9.6 Roundabouts. (Version 6 -01/12/2016)
Retting, R. Ferguson, S. McCartt, A. (2003) A Review of Evidence-Based Traffic Engineering

92
Measures Designed to Reduce Pedestrian–Motor Vehicle Crashes. American Journal of Public Health: September 2003, Vol. 93, No. 9, pp. 1456-1463.
Retting, R., Persaud, B., Garder, P. and Lord, D. (2001) Crash and Injury Reduction Following
Installation of Roundabouts in the United States. American Journal of Public Health Vol. 91, No. 4 pp. 628-631 2001
Rouphail, N., Hughes, R., & Chae, K. (2005). Exploratory Simulation of Pedestrian Crossings at
Roundabouts. Journal of Transportation Engineering, 131(3), 211-218. doi:10.1061/(asce)0733-947x(2005)131:3(211)
Saccomanno, F., Cunto, F., Guido, G., Vitale, A. (2014) Comparing Safety at Signalized
Intersections and Roundabouts Using Simulated Rear-End Conflicts. Transportation Research Record: Journal of the Transportation Research Board. Issue Number: 2078 Publisher: Transportation Research Board ISSN: 0361-1981. http://trrjournalonline.trb.org/doi/10.3141/2078-12
Sadeq, H. Sayed, T. (2016) Automated Roundabout Safety Analysis: Diagnosis and Remedy of
Safety Issues. J. Transp. Eng., 2016, 142(12) Conference: Transportation Research Board 94th Annual Meeting Publication Date: 2015 https://trid.trb.org/view.aspx?id=1337733
Schoon, C., van Minnen, J. (1994) The safety of Roundabouts in the Netherlands. Traffic Eng Control. March 1994:142–148. Schoon, C., van Minnen, J. (1993) Accidents on Roundabouts: II. Second study into the road
hazard presented by Roundabouts, particularly with regard to cyclists and moped riders. R-93-16. The Netherlands: SWOV Institute for Road Safety Research, 1993.
Schroeder, B., Long, R., Barlow, J. Rodegerdts, L; et. al.; (2011) Crossing Solutions at
Roundabouts and Channelized Turn Lanes for Pedestrians with Vision Disabilities NCHRP Report 674 Transportation Research Board National Academy of Sciences Washington, D.C. 2011 ISBN 978-0-309-15530-4, DOI 10.17226/14473 www.TRB.org
Seim, K. (1991) “Use, Design and Safety of Small Roundabouts in Norway.” In “Intersections
Without Traffic Signals II”, Springer-Verlag, Germany (W. Brilon, ed.), 1991, pp.270–281. (Cited by FHWA 2000)
SETRA/CETE de l’Ouest. “Safety Concerns on Roundabouts.” 1998. (Cited by FHWA 2000) Stone, J, KoSok, C & Pillalamarri, S. (2002) The Effects of Roundabouts on Pedestrian Safety
Prepared for The Southeastern Transportation Center University of Tennessee – Knoxville; Knoxville, Tennessee. Department of Civil Engineering North Carolina State University Raleigh, NC 27695-7908 Funded by The Southeastern Transportation Center with a Grant from The University Transportation Centers Program U.S. Department of Transportation August 2002

93
VideoLAN, a project and a non-profit organisation. VLC media player http://www.videolan.org/vlc/ VTP VISSIM Software "Verkehr In Städten - SIMulationsmodell" (Retrieved July 5, 2017) http://vision-traffic.ptvgroup.com/en-us/products/ptv-vissim/ Wei, T., Grenard, J., & Shah, H. (2011). Developing capacity models for local Roundabouts:
Streamlined process. Transportation Research Record: Journal of the Transportation Research Board, (2257), 1-9.
Worldviz ‘Vizard Virtual Reality Software’ (2017) http://www.worldviz.com/vizard-virtual- reality-software/ (Retrieved July 14, 2017) Wu, H., Ashmead, D. H., & Bodenheimer, B. (2009). Using immersive virtual reality to evaluate
pedestrian street crossing decisions at a Roundabout. Proceedings of the 6th Symposium on Applied Perception in Graphics and Visualization - APGV 09. doi:10.1145/1620993.1621001