Modeling Particle Resuspension for Estimating...
77
NIST Technical Note 1841 Modeling Particle Resuspension for Estimating Potential Exposure to Bacillus Spores W. Stuart Dols Andrew K. Persily This publication is available free of charge from: http://dx.doi.org/10.6028/NIST.TN.1841
Transcript of Modeling Particle Resuspension for Estimating...

NIST Technical Note 1841
Modeling Particle Resuspension for Estimating Potential Exposure to Bacillus Spores
W. Stuart Dols
Andrew K. Persily
This publication is available free of charge from:
http://dx.doi.org/10.6028/NIST.TN.1841


NIST Technical Note 1841
Modeling Particle Resuspension for Estimating Potential Exposure to Bacillus Spores
W. Stuart Dols
Andrew K. Persily
Engineering Laboratory
Prepared for:
U.S. Environmental Protection Agency
Office of Research and Development
Funded under Interagency Agreement DW-13-92340101-0
This publication is available free of charge from:
http://dx.doi.org/10.6028/NIST.TN.1841
June 2015
U.S. Department of Commerce Penny Pritzker, Secretary
National Institute of Standards and Technology Willie May, Under Secretary of Commerce for Standards and Technology and Director

Certain commercial entities, equipment, or materials may be identified in this document in order to describe an experimental procedure or concept adequately. Such identification is not
intended to imply recommendation or endorsement by the National Institute of Standards and Technology, nor is it intended to imply that the entities, materials, or equipment are necessarily
the best available for the purpose.
National Institute of Standards and Technology Technical Note 1841
Natl. Inst. Stand. Technol. Tech. Note 1841, 77 pages (June 2015)
CODEN: NSPUE2

iii
Abstract
A key challenge in assessing the risks of low level contamination following biological threat agent releases and subsequent decontamination is developing an understanding of the potential for airborne resuspension of agents that have deposited on surfaces within a building. Resuspension is a particularly difficult and important problem for the persistent and deadly biological threat agent that causes anthrax, Bacillus anthracis. The National Homeland Security Research Center of the U.S. Environmental Protection Agency, in collaboration with several other federal agencies, conducted the Biological Operation Testing and Evaluation (BOTE) study [1] to evaluate B. anthracis spore decontamination technologies and to better understand the potential inhalation exposures to spores before and after decontamination. The data collected in this study provide a unique resource to support the development of microbial exposure assessment methodologies, including the application of particulate modeling. Particulate transport modeling approaches that consider particulate characteristics and building features provide a means to quantify the distribution, transport and fate of agents in a building. Models exist to predict resuspension rates as a function of particle size, surface characteristics, human disturbance and other factors; however, these models have not been evaluated for their applicability and accuracy for determining potential inhalation exposure doses of Bacillus spores. Using the field sampling data collected in the BOTE study and resuspension rates determined using existing resuspension models, particulate transport models were used within building airflow and contaminant transport simulation tools to estimate potential inhalation exposure. Approaches to the use of such exposure modeling approaches for future risk assessment are also summarized.
Key Words: airflow, bioaerosols, CONTAM, modeling, particles, multizone modeling, risk assessment, resuspension, sensitivity analysis, simulation

iv

Table of Contents
Abstract ........................................................................................................................................... iii
List of Figures ................................................................................................................................. vii
List of Tables .................................................................................................................................. vii
Acronyms and Abbreviations ........................................................................................................ viii
Executive Summary ......................................................................................................................... 1
1 Introduction .............................................................................................................................. 3
2 Literature Review ...................................................................................................................... 4
2.1 Background..................................................................................................................................... 4
2.2 Literature Review Categories ......................................................................................................... 6
2.2.1 Relevant resuspension models ........................................................................................... 6
2.2.2 Chamber measurements of resuspension rates ................................................................. 7
2.2.3 Other chamber measurements........................................................................................... 7
2.2.4 Field measurements of resuspension rates or particle concentrations ............................. 7
2.2.5 Other model development and application ....................................................................... 7
2.2.6 Reviews ............................................................................................................................... 8
2.3 Summary of Existing Resuspension Rate Data ............................................................................... 8
2.4 Conclusions from the Literature Review ...................................................................................... 13
3 Description of BOTE Measurement Data Used for Modeling Study ...................................... 13
3.1 Building Description ..................................................................................................................... 13
3.2 BOTE Experimental Measurements ............................................................................................. 14
3.2.1 Particle Measurements ..................................................................................................... 15
3.2.2 Video of Sampling Activities ............................................................................................. 24
4 Whole-Building Resuspension Simulations Results ................................................................ 25
4.1 CONTAM Representation of PBF-632 .......................................................................................... 25
4.1.1 Weather Data .................................................................................................................... 26
4.1.2 Resuspension .................................................................................................................... 26
4.1.3 Initial Loading .................................................................................................................... 27
4.1.4 Activity Schedule ............................................................................................................... 28
4.2 Simulation Results and Comparison with Measurements ........................................................... 28
5 Sensitivity Analysis of Resuspension Exposure Model ........................................................... 33
5.1 Single-zone Simulation Model ...................................................................................................... 33
5.2 Model Inputs ................................................................................................................................ 34
5.3 Results of Sensitivity Analysis ....................................................................................................... 34
6 Proposed Resuspension Exposure Tool .................................................................................. 38
7 Summary and Conclusions ...................................................................................................... 41
8 References .............................................................................................................................. 43
Acknowledgments......................................................................................................................... 46
Appendix A. Summaries of Documents from Literature Review .............................................. 47


vii
List of Figures
Figure 1. Summary plot of resuspension rates......................................................................................... 9
Figure 2. INL building PBF-632 and decontamination containment tent............................................... 13
Figure 3. 2nd floor plan of PBF-632 ......................................................................................................... 14
Figure 4. 1st floor plan of PBF-632 .......................................................................................................... 14
Figure 5. 1st floor plan of PBF-632 building shows locations of rooms 101A and 102, the UVAPS and
IBAC devices, and the spore release ....................................................................................... 16
Figure 6. Particle measurements for Round 1, Room 101A ................................................................... 18
Figure 7. Particle measurements for Round 1, Room 102 ..................................................................... 19
Figure 8. Particle measurements for Round 2, Room 101A ................................................................... 20
Figure 9. Particle measurements for Round 2, Room 102 ..................................................................... 21
Figure 10. Particle measurements for Round 3, Room 101A ................................................................... 22
Figure 11. Particle measurements for Round 3, Room 102 ..................................................................... 23
Figure 12. CONTAM representation of 1st Floor and Plenum ................................................................. 25
Figure 13. CONTAM representation of 2nd Floor and Plenum .................................................................. 25
Figure 14. Simulation vs. measurement, Round 1, with detailed resuspension schedule ...................... 30
Figure 15. Simulation vs. measurement, Round 1, resuspension 10 x rbase, loading 10 x Lbase ................ 30
Figure 16. Simulation vs. measurement, Round 2, resuspension 10 x rbase, loading 10 x Lbase ................ 31
Figure 17. Simulation vs. Measurement, Round 3, resuspension 10 x rbase, loading 10 x Lbase ............... 31
Figure 18. Ordered Data Plot ................................................................................................................... 35
Figure 19. Main Effects Plot ..................................................................................................................... 35
Figure 20. Absolute Effects Plot ............................................................................................................... 36
Figure 21. Interactive Effects Matrix (color-coded to match the Absolute Effects Plot).......................... 37
Figure 22. Exposure tool sample screen .................................................................................................. 40
List of Tables
Table 1. Resuspension rate data from literature review – Chamber measurements (part 1).............. 10
Table 2. Resuspension rate data from literature review – Chamber measurements (part 2).............. 11
Table 3. Resuspension rate data from literature review – Field measurements .................................. 12
Table 4. Release and resuspension information for three tests ........................................................... 15
Table 5. Building level properties .......................................................................................................... 26
Table 6. Release and initial loading assumptions used in simulations ................................................. 28
Table 7. Summary of average measured and simulated resuspended airborne concentrations ......... 32
Table 8. Range of input values for sensitivity analysis .......................................................................... 34
Table 9. Key inputs for resuspension exposure calculations ................................................................ 39

viii
Acronyms and Abbreviations
BG Bacillus globigii
BOTE Biological Operation Testing and Evaluation
CBR chemical, biological and radiological
CFU colony-forming unit
EPA U.S. Environmental Protection Agency
FPSL fluorescent polystyrene latex
IBAC (trademark name, not an acronym)
INL Idaho National Laboratory
NHSRC National Homeland Security Research Center
NIST National Institute of Standards and Technology
NOAA National Oceanic and Atmospheric Administration
PBF Power Burst Facility
PSU Pennsylvania State University
UVAPS Ultraviolet Aerodynamic Particle Sizer
1
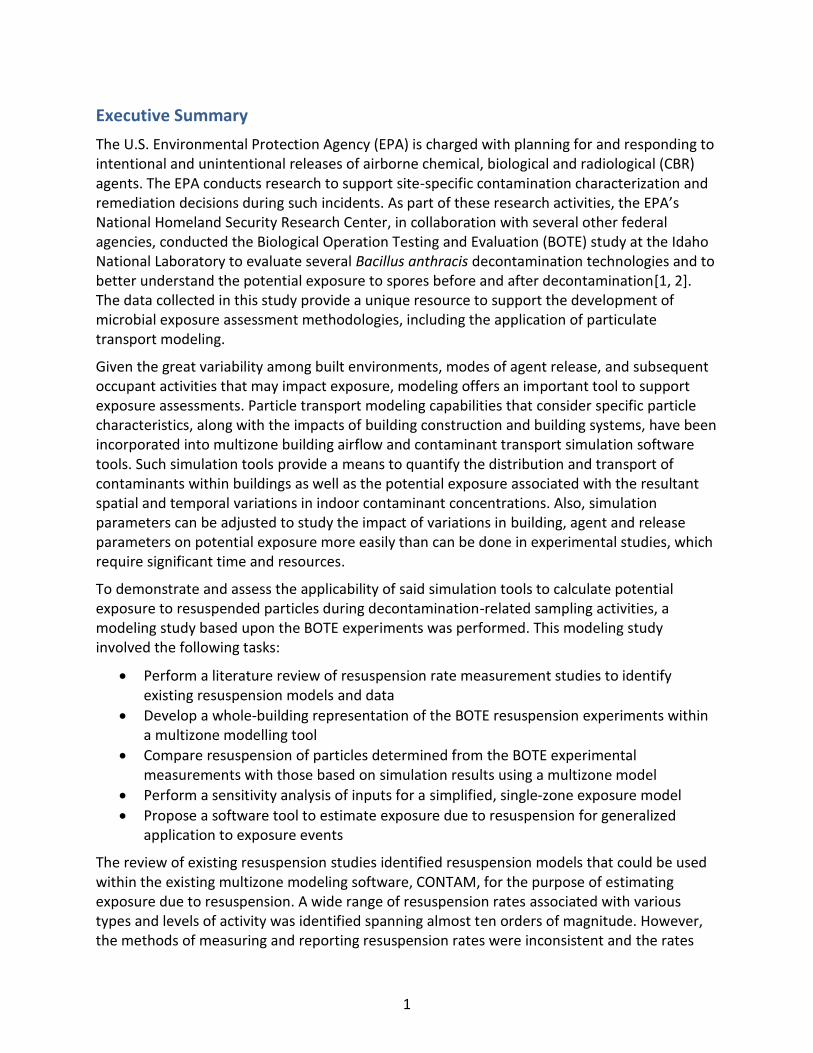
Executive Summary
The U.S. Environmental Protection Agency (EPA) is charged with planning for and responding to intentional and unintentional releases of airborne chemical, biological and radiological (CBR) agents. The EPA conducts research to support site-specific contamination characterization and remediation decisions during such incidents. As part of these research activities, the EPA’s National Homeland Security Research Center, in collaboration with several other federal agencies, conducted the Biological Operation Testing and Evaluation (BOTE) study at the Idaho National Laboratory to evaluate several Bacillus anthracis decontamination technologies and to better understand the potential exposure to spores before and after decontamination[1, 2]. The data collected in this study provide a unique resource to support the development of microbial exposure assessment methodologies, including the application of particulate transport modeling.
Given the great variability among built environments, modes of agent release, and subsequent occupant activities that may impact exposure, modeling offers an important tool to support exposure assessments. Particle transport modeling capabilities that consider specific particle characteristics, along with the impacts of building construction and building systems, have been incorporated into multizone building airflow and contaminant transport simulation software tools. Such simulation tools provide a means to quantify the distribution and transport of contaminants within buildings as well as the potential exposure associated with the resultant spatial and temporal variations in indoor contaminant concentrations. Also, simulation parameters can be adjusted to study the impact of variations in building, agent and release parameters on potential exposure more easily than can be done in experimental studies, which require significant time and resources.
To demonstrate and assess the applicability of said simulation tools to calculate potential exposure to resuspended particles during decontamination-related sampling activities, a modeling study based upon the BOTE experiments was performed. This modeling study involved the following tasks:
Perform a literature review of resuspension rate measurement studies to identify existing resuspension models and data
Develop a whole-building representation of the BOTE resuspension experiments within a multizone modelling tool
Compare resuspension of particles determined from the BOTE experimental measurements with those based on simulation results using a multizone model
Perform a sensitivity analysis of inputs for a simplified, single-zone exposure model
Propose a software tool to estimate exposure due to resuspension for generalized application to exposure events
The review of existing resuspension studies identified resuspension models that could be used within the existing multizone modeling software, CONTAM, for the purpose of estimating exposure due to resuspension. A wide range of resuspension rates associated with various types and levels of activity was identified spanning almost ten orders of magnitude. However, the methods of measuring and reporting resuspension rates were inconsistent and the rates

2
varied widely, revealing the need for more rigorous and consistent means of determining and presenting resuspension rates for use in multizone modeling software.
The whole-building particle resuspension simulations required many assumptions related to particle transport and building conditions. Among the most significant assumptions were initial particle loadings, resuspension rates and resuspension activity levels. Considering the fairly uncertain nature of these assumptions, the order of magnitude agreement between measured and simulated results that was obtained is encouraging.
To address the wide range of uncertainty in the model inputs, a sensitivity analysis was performed. This analysis, aimed at identifying the most significant effects of several inputs to a single-zone resuspension exposure model, revealed that initial surface loading, resuspension rate and their interactions were most significant; deposition rate, outdoor air change rate and their associated interactions were somewhat less significant but still significant; and deposition surface area and its interactions were relatively insignificant. These results were utilized in considering input parameters to a proposed software tool to estimate exposure due to resuspension.
An outline was presented of such a proposed tool that could be used to provide a quick and simple means to estimate the potential for exposure due to resuspension by those who respond to and then decontaminate facilities that experience a CBR event. Such a tool could be developed for laptop platforms and/or adapted for use on hand-held devices.

3
1 Introduction
The U.S. Environmental Protection Agency (EPA) is charged with planning for and responding to intentional and unintentional releases of airborne chemical, biological and radiological (CBR) agents [3-6]. The EPA conducts research to support site-specific contamination characterization and remediation decisions during these potential incidents. To facilitate greater risk-based remediation decision making, it is important to better understand agent transport into and within buildings, potential occupant exposure, and the effectiveness of various decontamination strategies [7, 8]. A key challenge associated with assessing the exposure due to potential releases of CBR agents is evaluating the risks of low level contamination following biothreat agent releases and subsequent decontamination efforts. This issue is of particular interest for Bacillus anthracis, the causative agent of anthrax [9, 10]. Given the great variability among built environments, potential modes of agent release, and subsequent occupant activities that may lead to exposure, modeling offers an important tool to support exposure assessments. Particulate transport modeling capabilities that consider specific particulate characteristics, building construction and building system (e.g., ventilation and filtration) features have been incorporated into multizone building airflow and contaminant transport simulation software tools [11, 12]. Such simulation tools provide a means to quantify the distribution and transport of contaminants within buildings as well as the potential exposure associated with resultant spatial and temporal variations of indoor contaminant concentrations. Also, simulation parameters can more easily be adjusted to study the impact of variations in building, agent and release parameters on potential exposure than experimental studies, which require significant time and resources.
The EPA’s National Homeland Security Research Center (NHSRC), in collaboration with several other federal agencies, conducted the Biological Operation Testing and Evaluation (BOTE) study [1] at the Idaho National Laboratory (INL) to evaluate several Bacillus anthracis decontamination technologies and to better understand the potential exposure to spores before and after decontamination. The data collected in this study provide a unique resource to support the development of microbial exposure assessment methodologies, including the application of particulate transport modeling.
Models have been developed to predict resuspension rates as a function of particle size, surface characteristics, human disturbances and other factors, but their applicability and accuracy for use in exposure assessment have not been fully determined. Whole-building airflow and contaminant transport simulation software was used to determine the applicability of resuspension models to estimate potential human exposures to biological contaminants. The applicability of resuspension models was tested using the field sampling data collected from the BOTE study and resuspension rates determined from existing resuspension models from the literature.

4
2 Literature Review
A literature review was conducted to identify models that predict resuspension rates for use in the analysis performed as part of this study. The literature review was focused on rate-based resuspension models.
2.1 Background
In describing the work performed under this project, it is important to distinguish between resuspension models, resuspension rates determined from these models and building simulation tools in which resuspension rates are applied. The following describes the terminology and mathematical context within which the resuspension rates identified in the literature review were considered. A description of the literature review that was conducted as part of this effort is then provided, followed by a summary of resuspension rate data found during the review.
Zhang [13] defines particle resuspension as “a process in which particles detach from the surface and become airborne again.” For the purposes of this study, particle resuspension models were characterized into two categories: physical and rate-based. Resuspension simulation tools are the software within which such a resuspension model is implemented. Physical resuspension models characterize particle resuspension based on the interaction between specific forces that attach a particle to and detach a particle from a surface, e.g., gravitational, mechanical and electrostatic. Rate-based models provide resuspension rates based on general parameters including particle size and type, surface characteristics such as carpet or tile, and disturbance type or activity such as walking or vacuuming. Rate-based models are more relevant to this effort than the fundamental physical models as the latter are more difficult to apply, particularly on a whole-building scale, without very detailed inputs.
The whole-building multizone airflow and contaminant transport simulation software CONTAM [11] is a building simulation tool in which resuspension modeling has been implemented.1 CONTAM is arguably the most widely used software for simulating contaminant transport on a whole-building scale and is used in the current study. To provide context for the use of resuspension rates within CONTAM, the mass balance model employed by CONTAM is presented. This explanation is also helpful in identifying those resuspension studies presented in the literature review that are most relevant to this project. Note that the results of these studies are presented in several different forms that are not always amenable to application within the mass balance model employed by CONTAM and similar simulation tools.
CONTAM employs the following mass balance equations to represent a two-compartment model of resuspension in a well-mixed zone or room. The two compartments refer to the air and surfaces for a given zone. These equations account for particle generation within the zone and entry of particles from outside the zone and assume that particles are removed only by deposition and airflow out of the zone.
1 While other multizone airflow and contaminant transport simulation tools do exist, COMIS is the only tool known to the authors that is similar to CONTAM in its capabilities. However, COMIS does not directly support resuspension and is no longer under development within the U.S.

5
For the air:
𝑉 dC𝑧 dt⁄ = P𝑄𝐶o(𝑡) + 𝑟𝐴𝑟𝐿𝑠(𝑡) + 𝐺 − 𝑄𝐶𝑧(𝑡) − 𝑘𝑑𝑉𝐶𝑧(𝑡) (1)
For the surface:
𝐴𝑠 dL𝑠 dt⁄ = 𝑘𝑑𝑉𝐶𝑧(𝑡) − 𝑟𝐴𝑟𝐿𝑠(𝑡) (2)
where:
V = zone volume [m3] Ar = resuspension surface area [m2] As = deposition surface area [m2] Cz = zone particle concentration in air [kg/m3] Co = particle concentration of air flowing into the zone [kg/m3] Ls = particle surface loading [kg/m2] Q = volumetric airflow rate [m3/s] r = particle resuspension rate [1/s] kd = particle deposition rate [1/s] (kd = d As /V ) d = particle deposition velocity [m/s] G = particle generation rate [kg/s] P = particle penetration factor [-] t = time [s]
As outlined below in discussing the literature review, measurements have been performed to estimate resuspension rates using various methods, with results being reported in various forms including resuspension rate, resuspension factor, resuspension fraction and emission factor. The following presents some background information on how these various forms of resuspension rates relate to one another.
To relate these forms of resuspension measurements, steady state conditions must apply. Assuming steady state conditions in equation (1), the following equation provides the steady state concentration of particles in the air.
𝐶𝑠𝑠 =𝐺 + 𝑃𝑄𝐶𝑜 + 𝑟𝐴𝑟𝐿𝑠
𝑄 + 𝑘𝑑𝑉 (3)
Resuspension measurement conditions and results are sometimes reported in ways that are not conducive for them to be applied readily in the above equations. In some cases, the deposition surface area is associated with the resuspension rate, as opposed to the smaller area involved in resuspension. In other cases, a resuspension factor, K, is reported as the ratio of the air concentration to the surface concentration in units of inverse length, e.g., m-1. However, it is not always clear whether or not the reported values were measured under steady conditions. The following equation provides the relationship between K and r at steady state.
𝐾 =𝐶𝑠𝑠𝐿𝑠
=𝐺 + 𝑃𝑄𝐶𝑜 + 𝑟𝐴𝑟𝐿𝑠
𝐿𝑠(𝑄 + 𝑘𝑑𝑉) (4)

6
In other cases, results are reported as a dimensionless emission factor, E, which is the ratio of particles suspended in the air to particles available for resuspension on the surface. The emission factor can be related to the resuspension factor according to the following equation.
𝐸 = 𝐾𝑉
𝐴𝑠 (5)
These resuspension and emission factors are sometimes presented in terms of count concentrations or mass concentrations for various particle size ranges. To be useful in applying equations (1) and (2), sufficient information on measurement conditions and parameters must be provided to allow resuspension factors to be converted to a resuspension rate as presented in equation (6).
𝑟 =𝐾𝐿𝑠(𝑄 + 𝑘𝑑𝑉) − 𝐺 − 𝑃𝑄𝐶𝑜
𝐴𝑟𝐿𝑠 (6)
For the purposes of this modeling study, resuspension rates, as addressed later in Section 2.3, were employed because they can readily be applied to predict airborne particle concentrations for conditions other than those under which the resuspension rate measurements were performed. Specifically, these values can be used directly within models using equations (1) and (2) to estimate potential exposure due to resuspension.
The resuspension fraction, F, is the particle resuspension intensity based on the actual area disturbed by the activity instead of the entire deposition surface area loaded with particles. For walking, F is the resuspension rate times the ratio of the floor area (As) to the foot contact area
(Ar) divided by the contact frequency, [1/time] as presented in the following equation.
𝐹 =𝑟𝐴𝑠
𝜔𝐴𝑟 (7)
2.2 Literature Review Categories
The documents reviewed are grouped into the following categories:
Relevant resuspension models
Chamber measurements of resuspension rates
Other chamber measurements
Field measurements of resuspension rates or particle concentrations
Other model development and application
Reviews.
This Section describes the types of studies in each category. Appendix A contains the reference and abstract of each publication examined.
2.2.1 Relevant resuspension models
Among all the literature identified in the review, only two publications described models to predict resuspension rates based on user inputs. These models were developed by the Pennsylvania State University (PSU) for the U.S. Army Center for Health Promotion and Preventive Medicine. The first, described by Bahnfleth et al. [14], is a Microsoft Excel
7
spreadsheet that yields resuspension rates based on user input of a number of variables: particle size, particle type (from a limited set of choices), and flooring (carpet or linoleum). The second model, Freihaut et al. [15], presents an approach using “look-up” tables, which yield resuspension rates adjusted for factors such as particle type, flooring, and relative humidity. Note that the resuspension rates obtained from these two approaches do not agree with each other. This discrepancy, which is more than an order of magnitude in most cases, was investigated and the spreadsheet results are considered to be more reliable based on their being better referenced and explained in the source documents.
2.2.2 Chamber measurements of resuspension rates
The papers in this category include chamber studies in which resuspension rates were measured in laboratory test chambers, as well as a small number of chamber studies that do not provide resuspension rates but which are nonetheless of interest. The chamber measurements of resuspension rates involved either actual or simulated human walking to induce resuspension for different types and sizes of particles, flooring types and environmental conditions, e.g., relative humidity. The results of these measurements are summarized graphically and in tabular form in Section 2.3, below.
2.2.3 Other chamber measurements
Several other papers describe chamber studies that did not measure resuspension rates but measured other quantities of interest. These studies included detailed measurements of adhesion forces holding particles to a surface. Other studies described approaches to measuring resuspension rates but did not present any measurement results. One study was focused on outdoor resuspension as opposed to the indoor environments of interest to this effort. There were a number of particle resuspension studies conducted in nuclear facilities, starting in the 1960s time frame, based on concerns about radioactive dust [15]. These studies are not covered in this report based on the unique aerosols and space types involved. Similarly, there has been and continues to be research on aerosol resuspension outdoors induced by wind and considering various environmental and soil properties [16, 17]. This work is also not considered relevant to the present study.
2.2.4 Field measurements of resuspension rates or particle concentrations
There have been a number of studies in which resuspension rates were measured in actual buildings, in many cases residences. Most of these measurements involved walking, but other occupant activities were studied as well. In other field studies, only airborne particle concentrations were measured as opposed to the resuspension rates.
2.2.5 Other model development and application
The papers in this category include model development and application efforts of interest but were not directly applicable to the current effort in that they do not provide methods for estimating resuspension rates. For example, simulation studies of resuspension impacts on particle concentrations in buildings have been conducted using building airflow and contaminant transport models. Other studies have modeled the detailed processes impacting particles on surfaces.

8
2.2.6 Reviews
This last category includes articles that have reviewed the literature on resuspension. Two of these were focused on outdoor resuspension rather than indoor. The reviews of indoor resuspension studies were useful in identifying relevant references and for verifying the information obtained in this literature review.
2.3 Summary of Existing Resuspension Rate Data
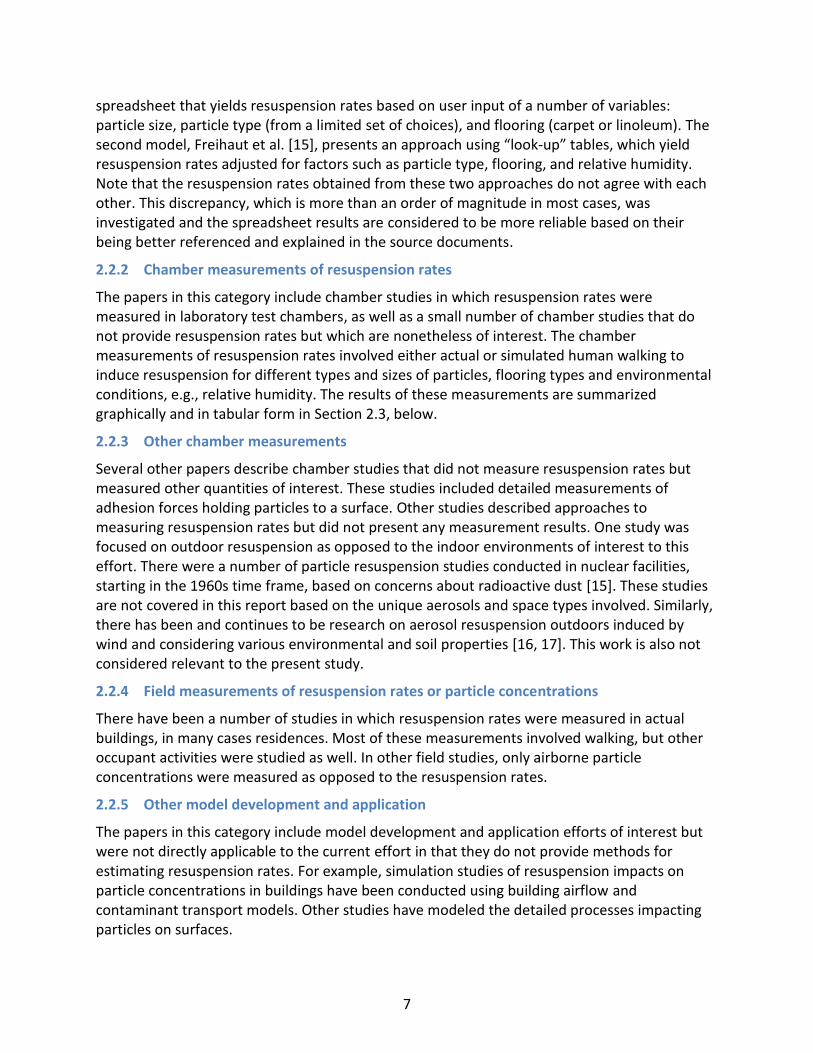
As noted above, a number of studies report measured resuspension data from chamber and field experiments. Table 1 and Table 2 provide a summary of chamber measurements and Table 3 provides a summary of field measurements. All three tables summarize those reported values including information on the test space, particle type, environmental conditions, floor type, and particle size. Figure 1 provides a plot of resuspension rates based on Table 1 through Table 3.
Where possible, resuspension data were converted from reported units to resuspension rates in units of h-1. However, this was not always possible based on reported measurement conditions and results. Each point in Figure 1 represents the individual results of each study, so the x-axis is not quantitative but serves to report the individual test results. The Reference column of Table 1 through Table 3 provides the citation from which the data were obtained. These citations are all contained in Appendix A. The particle sizes in Table 1 through Table 3 are those reported in each of the cited studies, typically the aerodynamic diameter.
As seen in Figure 1 and Table 1 through Table 3, resuspension values in the literature vary widely, covering a range of almost ten orders of magnitude, with strong dependencies on particle size, particle type, floor type and activity. While these values do not necessarily support predictions for a given set of field conditions, they do provide an indication of the range of resuspension rates that might exist in the field.
9
Figure 1. Summary plot of resuspension rates

10
Table 1. Resuspension rate data from literature review – Chamber measurements (part 1)
Reference Test Space and Particle Type
Floor Type Particle size
(m) Activity
Reported Results (entries that don't use default units are noted)
Factor (m-1) Rate (h-1) (mg min-1 person-1) Fraction
CHAMBER MEASUREMENTS
Gomes et al. 16 L chamber Olefin carpet 2.1 to 16 Simulated walking with sample vibration and air puff
1.00E-04 6.00E-02
(2005 and 2007) [18, 19]
Quartz and Roach dust Linoleum 1.00E-08 6.00E-06
Gomes et al. All values are resuspension rates (h-1)
(2005) [18] Quartz Spore Dust mite
as reported in Linoleum 0.3 to 0.39 Walking @ 114 steps/min 2.74E-04 1.64E-03 2.12E-04
Bahnfleth et al. 0.4 to 0.49 1.90E-04 1.21E-04 3.59E-05
(2007) [14] 0.5 to 0.64 1.94E-04 2.23E-04 3.10E-05
0.65 to 0.79 1.77E-04 2.13E-04 4.07E-05
0.8 to 0.99 1.83E-04 2.75E-04 2.15E-05
1.0 to 1.59 7.62E-05 3.66E-04 5.83E-05
1.6 to 2.0 1.26E-04 3.08E-04 2.11E-05
>2.0 2.83E-05 2.47E-04 8.40E-05
Carpet 0.3 to 0.39 5.57E-04 5.00E-02 8.28E-05
0.4 to 0.49 4.44E-04 3.34E-03 8.88E-05
0.5 to 0.64 6.06E-04 5.75E-03 2.74E-04
0.65 to 0.79 2.99E-04 7.08E-03 1.90E-04
0.8 to 0.99 3.68E-04 7.80E-03 1.45E-04
1.0 to 1.59 5.02E-04 1.06E-02 2.44E-04
1.6 to 2.0 2.80E-04 8.40E-03 2.36E-04
>2.0 7.80E-05 7.62E-03 1.67E-04
Hu 16 L chamber Vinyl tile Alumina: Air puffs to simulate human step All values are resuspension rates [h-1]
(2008b) [20] Alumina Loop carpet 0.35 to 10 Vinyl tile Alumina Silica Spore Dust mite
Silica sand Spore: w/ high electrostatic field 2.98E-05 4.28E-01 1.47E+00 7.88E-01
Spore 0.58 to 16.57 w/ medium electrostatic field 1.82E-05 3.00E-01 1.32E+00 4.60E-01
Dust mite control (no field applied) 1.62E-05 2.98E-01 1.00E+00 5.21E-01
Carpet w/ high electrostatic field 5.15E-05 2.66E-01 6.24E-01 2.59E-01
w/ medium electrostatic field 1.19E-04 1.96E-01 1.25E+00 3.67E-01
control (no field applied) 7.71E-05 3.43E-01 8.10E-01 5.50E-01
Qian and Ferro 54.4 m3 chamber Vinyl tile 0.8 to 1.0 30 min cycle of walking and tapping feet
1.40E-03
(2008a) [21] Test dust New loop carpet 1.0 to 2.0 1.60E-03
Old loop carpet 2.0 to 5.0 5.20E-03
5.0 to 10 1.30E-02
Thornburg et al. 4.75 m3 chamber Carpet 1.0 Walking (min) 3.47E-04 3.93E-02
(2009) [22] Asbestos fiber (max) 3.15E-03 3.56E-01
simulant Vacuuming (min) 5.22E-03 4.95E+00
(max) 7.19E-02 6.81E+01

11
Table 2. Resuspension rate data from literature review – Chamber measurements (part 2)
Reference Test Space and Particle Type
Floor Type Particle size
(m) Activity
Reported Results (entries that don't use default units are noted)
Factor (m-1) Rate (h-1) (mg min-1 person-1) Fraction
CHAMBER MEASUREMENTS (continued)
Rosati et al. Test chamber New loop carpet 1.0 Walking for 5 minutes 2.03E-07 3.91E-06
(2008) [23] Arizona test dust Old carpet (range of all values measured) 2.62E-05 2.50E-03
Shaughnessy and Vu Test chamber 25 m3 Carpet (FT) 0.8 to 1.5 Walking for 10 minutes All values are resuspension rates [h-1]
(2012) [24] Textile (VCTT) 105 steps/min FT VCTT VCT
Vinyl tile (VCT) loading 18 g/m2 (2.65 ± 0.78)E-03 (7.47 ± 0.30)E-04 (9.54 ± 1.95)E-03
loading 100 g/m2 (3.32 ± 1.10)E-03 (6.36 ± 1.95)E-04
loading 150 g/m2 (5.25 ± 0.43)E-03 (1.49 ± 5.26)E-03
1.5 to 3.0 loading 100 g/m2 (2.08 ± 0.75)E-02 (4.43 ± 0.82)E-03
loading 150 g/m2 (4.18 ± 0.22)E-02 (1.52 ± 0.71)E-02
Manthena and Ferro Test chamber Vinyl tile (T) Walking for 10 minutes All values are resuspension rates [h-1]
(2009) [25] Arizona test dust (ATD) New carpet (C) ATD-T RD-T ATD-C RD-C
Real house dust (RD) 0.4 to 0.8 0.0001 to 0.0002 0.0002 to 0.0006 0.0003 to 0.0006 0.0002 to 0.0004
0.8 to 1.0 0.0002 to 0.0004 0.0004 to 0.002 0.0003 to 0.002 0.0006 to 0.002
1.0 to 2.0 0.0003 to 0.0005 0.0008 to 0.004 0.0006 to 0.002 0.001 to 0.003
2.0 to 5.0 0.001 to 0.003 0.004 to 0.03 0.003 to 0.01 0.007 to 0.03
5.0 to 10 0.009 to 0.01 0.01 to 0.2 0.008 to 0.03 0.01 to 0.08
Tian et al. Test chamber 0.12 m3 Hard (2 types) 0.4 to 10 Simulated walking for 55 sec Reported range of values
(2014) [26] Real house dust Carpet (3 types) 9.24 E-05 1.0E-07
9.24 E-02 1.0E-04

12
Table 3. Resuspension rate data from literature review – Field measurements
Reference Test Space and Particle Type
Floor Type Particle size
(m) Activity
Reported Results (entries that don't use default units are noted)
Factor (m-1) Rate (h-1) (mg min-1 person-1) Fraction
FIELD MEASUREMENTS
Ferro et al. Single family Wood PM2.5 2 persons walking, 1st floor 0.22
(2004) [27] residence Rug 1 person walking, 1st floor 0.13
Dust 1 person walking, basement 0.06
PM5 2 persons walking, 1st floor 0.72
1 person walking, 1st floor 0.50
1 person walking, basement 0.28
Hambreaus operating suite Vinyl Not reported Moist floor mopping 2.00E-04 1.22E-03
(1978) [28] bacteria 4 people walking for 30 min 3.50E-03 2.13E-02
Karlsson et al. Experimental room Not reported 6.3 1 person, table work activity 4.68E+00
(1996) [29] Grass pollen
Karlsson et al. Experimental room PVC floor 12 Walking and paperwork; not clear to which the resuspension rate corresponds
6.25E-04 5.00E-04
(1999) [29] Freeze dried spores (Bacillus subtilis)
(clusters of 1.8 x 0.9 spores)
Qian et al. Dust Loop carpet PM10 Walking for 30 min 1.40E-06
(2008b) [30]
Thatcher and Residential building Carpet 0-0.5 4 residents, normal activity 9.90E-07
Layton Inert dust Wood 0.5-1.0 4.40E-07
(1995) [31] Vinyl 1-5 1.80E-05
5-10 8.30E-05
10-25 3.80E-04
>25 3.40E-05
Buttner et al. 35.2 m3 chamber Vinyl 1.8 - 3.5 Walking for 1 minute 4.30E-05
(2002) [32] Spore Loop carpet 4.30E-05
Pile carpet 3.90E-03
Shaughnessy and Vu School floors w/ Carpet (FT) Walking for 10 minutes All values are resuspension rates [h-1]
(2012) [24] mobile chamber Textile (VCTT) 105 steps/min FT VCTT
8 m3 Vinyl tile (VCT) 0.8 to 1.5 Loading ≈ 60 g/m2 (1.79 ± 0.82)E-02 (4.15 ± 2.40)E-03
Loading ≈ 160 g/m2 (7.25 ± 1.98)E-03 (2.76 ± 0.69)E-03
1.5 to 3.0 Loading ≈ 60 g/m2 (5.52 ± 1.98)E-02 (1.73 ± 1.59)E-02
Loading ≈ 160 g/m2 (2.48 ± 1.00)E-02 (8.65 ± 2.26)E-03

13
2.4 Conclusions from the Literature Review
Based on the literature review, the spreadsheet model presented in Bahnfleth et al. [14], referred to herein as the PSU model, is the only viable option identified for calculating resuspension rates from walking based on independent parameters of particle size, floor loading, floor type, number of occupants and walking speed. The PSU model was therefore used to estimate resuspension rates for the subsequent modeling using the BOTE INL data. In addition, given the uncertainty in resuspension rate prediction, the measured rates from the literature and other relevant parameters were also considered in conducting the sensitivity analysis presented below.
3 Description of BOTE Measurement Data Used for Modeling Study
Three rounds of biological release and decontamination experiments took place in April and May of 2011 in a building located at INL. Complete descriptions and BOTE study results can be found in the BOTE report [1]. This Section contains a description of that building and the experimental measurements that were performed. Measurement results are presented against which simulation results will be compared herein for the purposes of evaluating the applicability and accuracy for determining potential inhalation exposure due to particle resuspension.
3.1 Building Description
The building used in the BOTE study and for the modeling analysis described in this report is the Power Burst Facility 632 (PBF-632) located at INL and shown in Figure 2. This building is the same building that was used in previous exercises aimed at the evaluation of sample planning methods and multizone modeling validation of particle release experiments [1, 33-35]. Floor plans for the two floors of PBF-632 are shown in Figure 3 and Figure 4. Each floor is approximately 24.4 m x 15.2 m for a total of 372 m2 per floor. Most of the floor is covered with laminate floor tile with several rooms on each floor covered with carpet including rooms 101A and 102 shown in Figure 5. Each floor contains a constant volume air handler located within a mechanical room on the floor it serves with no provision for bringing in outdoor air. Supply air ducts are located above suspended ceilings on the floor that they serve. The building was modified for decontamination studies by installing dedicated return ducts and decontamination distribution ducts below the suspended ceiling, i.e., within the occupiable space on each floor. A large tent (shown in Figure 2) was erected around the entire building for the decontamination studies.
Figure 2. INL building PBF-632 and decontamination containment tent

14
Figure 3. 2nd floor plan of PBF-632
Figure 4. 1st floor plan of PBF-632
3.2 BOTE Experimental Measurements
The three particle resuspension experiments consisted of the dissemination of Bacillus atrophaeus subsp. globigii (BG), which is used as a surrogate for Bacillus anthracis. During each of these experiments, 200 mg were released on the 1st floor and 0.5 mg were released on the second floor through the use of automated nebulizers placed on the downstream side of the filter banks of the recirculating air handling system. Releases took place in the early afternoon. The fans of the air handlers were left on for approximately two hours after each release and then turned off for the remainder of each experiment. Particles were allowed to settle overnight, and sampling took place during the following days as detailed in Table 4.
1
2
3
4
5
6
7
8
9
10
11
12
13
13 R
@ 9
15/6
4" =
10'-
0"
12 T
@ 1
2"
= 1
2'-0"
Janitor
Men
WomenOfficeOfficeOfficeOffice
OfficeOfficeOffice Office Office
Office
Office
Office
Office
Storage
Office Office
Mechanical Room
1
2
3
4
5
6
7
8
9
10
11
12
13
13 R
@ 9
15/6
4" =
10'-0
"
12 T
@ 1
2" =
12'-0"
Lobby
Office Office Office
Office Office Office
Office
Office
Office
Office
Mechanical RoomOffice
Women
Men

15
Table 4. Release and resuspension information for three tests
Test BG Release (2 mg)
Resuspension Period
Building Entry Room 101A Room 102
Date Fan on Fan off Date Time Enter Exit Enter Exit
Round 1 2011-04-16 13:18 15:18 2011-04-17 09:18 12:06 n/a n/a 16:47
Round 2 2011-04-25 14:16 16:16 2011-04-26 08:09 09:28 11:31 11:59 13:38
Round 3 2011-05-10 15:22 17:22 2011-05-11 08:42 11:51 14:34 16:02 17:54
In addition to the three BG releases, a set of so-called building characterization tests was performed prior to the BG decontamination experiments. These characterization tests were performed by releasing 1 m mono-dispersed fluorescent polystyrene latex (FPSL) particles in an attempt to establish target release levels for the BG experiments. While this simulation study does not address these FPSL particle releases, these particles did contribute to initial loadings of non-viable particles during the resuspension tests.
3.2.1 Particle Measurements
The BOTE study utilized two types of real-time aerosol monitors referred to as Ultraviolet Aerodynamic Particle Sizer (UVAPS) [36] and IBAC [37]. The UVAPS provides counts in 52
individual bins of particle diameter ranging from 0.5 m to 20 m at approximately one-minute intervals. The manufacturer of the UVAPS provides software to read the raw data files and export them to text files in units of number of particles per cubic centimeter, which were then imported into a spreadsheet for further analysis. The IBAC counter provides total counts of
particles ranging from 0.7 m to 10 m in diameter at one-second intervals, and data are written to files in units of number of particles per liter. Note that the IBAC did not provide counts in individual particle size bins as did the UVAPS. Detailed descriptions of this equipment can be found in the BOTE report [1].
Both the UVAPS and the IBAC are capable of distinguishing viable and non-viable particles based on fluorescence [38]. However, for the data collected during these experiments, the particles were not distinguished by fluorescence. Therefore, the BG data from these experiments do not distinguish the particles as viable or non-viable. UVAPS aerosol monitors measured real-time particle aerosol levels in two rooms, 101A and 102, both located on the first floor of the building as shown in Figure 5. Of these two rooms, only Room 101A also contained a single IBAC sampler. The corresponding figures reveal that the total UVAPS count matches that of the IBAC count very well, indicating that particles sizes were well within the range of the IBAC counter. There was no real-time particle monitoring of the outdoor air.

16
Figure 5. 1st floor plan of PBF-632 building shows locations of rooms 101A and 102, the UVAPS and IBAC devices, and the spore release
Plots of particle measurements reveal the time history over the range of particle sizes measured by the UVAPS and IBAC instruments during the simulant release phase through the resuspension phase. Figure 6 through Figure 11 show these plots for the three rounds of BG release in rooms 101A and 102. Each plot shows the release event occurring in the early afternoon, followed by the resuspension activity beginning the next morning between 6 a.m. and 12 noon. The time the building was first entered and the sampling period are provided in
the title of each plot. To reduce clutter, only bins in the range from 0.5 m to 5 m are plotted for the UVAPS measurements (Also to reduce clutter, not all of the bins in this range are shown,
for example particles larger than 5 m, which were not elevated above background levels). The UVAPS curves include all one-minute data as obtained from the aforementioned data files. However, IBAC curves were obtained using one-minute data gleaned from the one-second raw data files. Both UVAPS and IBAC one-minute data were smoothed using ten minute time averages to improve the clarity of the plots.
The plots reveal the significant increase in particle concentrations associated with the initial releases soon after the indicated times of release. Particles in the size ranges plotted (from
0.5 m to 5 m diameter) were all elevated by at least an order of magnitude above their respective background levels. This release period is followed by decay of concentrations until the times at which the buildings were entered for the performance of the sampling experiments. (The perfectly linear portions in some UVAPS plots indicate data missing from raw data files.) The plots reveal increased levels in both rooms 101A and 102 very close to the reported building entry times even though building entry occurs typically an hour or more prior
1
2
3
4
5
6
7
8
9
10
11
12
13
13 R
@ 9
15/6
4" =
10'-0
"
12 T
@ 1
2" =
12'-0"
Lobby
Office Office Office
Office Office Office
Office
Office
Office
Office
Mechanical RoomOffice
Women
Men
101A
101
103 105 107 109
106 108 110
104
102
Lobby
Women
Men
Mechanical Room
UVAPS IBAC
UVAPS
IBAC IBAC IBAC
IBAC
IBAC IBAC IBAC IBAC IBAC
IBAC
Spore release location

17
to entry into the two rooms. These elevations in concentrations were assumed to be the result of resuspension due to human activity elsewhere in the building and not in the specific rooms. These elevations are an indication that inter-zone particle transport was occurring within the building as a result of airflow and diffusion transport processes. More discussion on these measurement results is provided later when comparisons are made with simulation results.

18
Figure 6. Particle measurements for Round 1, Room 101A

19
Figure 7. Particle measurements for Round 1, Room 102

20
Figure 8. Particle measurements for Round 2, Room 101A

21
Figure 9. Particle measurements for Round 2, Room 102

22
Figure 10. Particle measurements for Round 3, Room 101A

23
Figure 11. Particle measurements for Round 3, Room 102

24
3.2.2 Video of Sampling Activities
Video of the BOTE testing was analyzed in an attempt to obtain detailed information on occupant activity to support the development of resuspension schedules for use in the CONTAM simulations. Seventeen video cameras were located throughout both floors of the building and at the building entrance through which the sampling personnel entered. Each camera continuously captured video during the three rounds of sampling. The three sampling periods covered between 5 hours and 9 hours each, for a total of approximately 23 hours of experimental time yielding approximately 380 hours of video.
The video was reviewed for the first round of sampling to determine the types of resuspension-related activities that were occurring during the post-contamination sampling periods. Video revealed multiple teams of sample collectors moving throughout the building simultaneously; utilizing carts to transport sampling equipment; performing multiple sampling-related activities including: vacuuming, climbing ladders and removing ceiling tiles, and shuffling papers. During the sampling period there were anywhere from one to five 3-person teams within the building. Discerning the exact time and location of all members was ultimately determined not to be considered a critical issue due to the uncertainty in attributing resuspension rates to the range of occupant activities occurring within the building and the wide range of particle sizes that were resuspended into the air as a result of these activities.

25
4 Whole-Building Resuspension Simulations Results
Simulations were performed to compare the airborne particle concentrations provided by field sampling data collected during the BOTE study to simulated airborne concentrations calculated based on resuspension rates evaluated from the literature. The objective of these simulations was to demonstrate that multizone building airflow and contaminant modeling can be used to predict resuspension of deposited/settled particles given relevant input data (building and system characteristics, particle size, deposition rates, initial loading, information on activities inducing resuspension, and resuspension rates) in support of estimations of potential human exposures to residual biocontamination.
4.1 CONTAM Representation of PBF-632
The CONTAM representation of PBF-632 was based largely on a previous version developed for other studies carried out in the same building [33-35]. Each level of the building was represented in CONTAM by a schematic of the floor plan via the CONTAM sketchpad. The representation used in this study consisted of four levels – the 1st and 2nd floors and their respective plenums that contain the air distribution ductwork. CONTAM sketchpads are shown for each of the four levels in Figure 12 and Figure 13. The nominal floor area of the building is 372 m2 with a nominal volume of approximately 2610 m3. Individual level properties are provided in Table 5.
Figure 12. CONTAM representation of 1st Floor and Plenum
Figure 13. CONTAM representation of 2nd Floor and Plenum

26
Table 5. Building level properties
Level Nominal Height
[m] Nominal Volume
[m3]
1st floor 2.44 906
1st floor plenum 0.61 227
2nd floor 2.44 906
2nd floor plenum/attic 1.22 570
The building representation was modified for the purposes of this project by utilizing the weather data for the BOTE test period, placing resuspension source/sinks in every zone depending on the type of flooring located in the zone, setting initial zone concentrations and surface loadings, and scheduling system airflows and resuspension activity. These modifications are described below.
4.1.1 Weather Data
NIST obtained weather data from the “PBF” weather station of the National Oceanic and Atmospheric Administration (NOAA) INL Weather Center website (http://www.noaa.inel.gov/metgraph). Weather data included barometric pressure, outdoor temperatures, wind speed and wind direction at five-minute intervals. These data were reformatted into the format required by CONTAM. There were no indoor temperature measurements available and the building was unconditioned. Therefore, indoor and outdoor temperatures were set to be the same leading to mostly wind-driven air infiltration and two-way airflow through interior doorways as described in [35]. The tent around the building was accounted for by utilizing a wind pressure modifier based on urban terrain to reduce the effect of wind pressure on the building [35].
4.1.2 Resuspension
Resuspension source/sinks were placed in each zone over the entire floor area of the two floors. Only the floor surfaces were modeled, either as carpet or laminate according to the type of flooring installed for the purposes of the BOTE study. It was assumed for the purposes of simulation that all deposition occurred onto the floors, i.e., deposition onto vertical surfaces was considered negligible.
Resuspension rates were selected based on the literature review presented previously. Resuspension was attributed solely to people walking on the two types of flooring: carpet and laminate. Baseline resuspension rates (rbase) for each floor type were selected from the rate-
based PSU resuspension model [14] for 1 m diameter particles, a walking rate of 114 steps/min and a resuspension surface area of 0.028 m2 (the size of a single foot print). These baseline rates are:
Carpet = 1.06 x 10⁻² h-1
Laminate = 3.67 x 10⁻⁴ h-1
These rates are referred to as baseline rates, because they are for a single person walking. As described below, they were adjusted in the simulations to reflect increased levels of activity.

27
4.1.3 Initial Loading
CONTAM is capable of simulating particle releases in units of mass or number per unit time over a schedule based on the contaminant source of interest. However, for the purposes of these simulations, the BG releases via nebulizers were not included as part of the analysis for two reasons. First, the rate of emission associated with the nebulizers as a function of particle size was not well characterized. Also, the surfaces accumulated particles throughout the entire set of experiments. Decontamination targeted the deactivation of viable particles but not removal of the BG (and other) particles. As previously mentioned, non-viable particles include FPSL and other unknown background particles. Therefore, simulations were performed only during the sampling phase with initial loadings estimated for all of the resuspension source/sinks prior to the start of the simulation. Surface sampling was performed using various methods to determine the number of viable particles, or colony forming units (CFU), but the total loadings (viable and non-viable) of particles were not measured. The latter quantity was required for the simulations. Therefore the initial loadings were estimated based on the known, intentional releases of BG during the BOTE project. These initial loadings did not include background particle loadings that may have been present prior to starting the release tests.
According to the BOTE Final Test Plan [39], FPSL releases were intended to determine the amount of BG that would be required to establish target floor loadings between 1.08 x 10⁵ CFU/m2 (1 x 10⁴ CFU/ft2) and 1.08 x 10⁷ CFU/m2 (1 x 10⁶ CFU/ft2) on the 1st floor and between 1 076 CFU/m2 (100 CFU/ft2) and 2 153 CFU/m2 (200 CFU/ft2) on the 2nd floor. Each of the three rounds of BG release consisted of 200 mg on the 1st floor and 0.5 mg on the 2nd floor (the assumed viability rate was not available). For the purposes of estimating initial floor loadings for simulations performed herein, all contaminant released was assumed to be dispersed evenly throughout the entire volume of the respective building level in which it was released, contaminant released was all assumed to be deposited onto the floor before resuspension activity occurred, and contaminant released was all assumed to be viable. As a result, the initial particle loadings were calculated according to equation (8).
𝐿𝑖 =𝑀𝑟𝑒𝑙
𝑉𝑝𝜌𝑝
1
𝐴𝑠 (8)
where: Li = particle surface loading [particles/m2] Mrel = mass released [kg] Vp = volume of a single particle [m3] p = density of a single particle [kg/m3] As = deposition surface area [m2]
Initial loadings were characterized by particles/area as opposed to CFU/area. The release and loading assumptions used in the simulations are provided in Table 6.

28
Table 6. Release and initial loading assumptions used in simulations
Floor Area 372 m2 (4 000 ft2)
Particle diameter 1.0 m, corresponds to a particle volume, Vp = 5.236 x 10⁻¹⁹ m3
Particle density 1 000 kg/m3
BG mass release 1st floor = 200 mg, 2nd floor = 0.5 mg
1st floor loading (baseline value, Lbase)
1.03 x 10⁹ particles/m2 (9.55 x 10⁷ particles/ft2)
5.38 x 10⁻⁷ kg/m2
2nd floor loading (baseline value, Lbase)
2.57 x 10⁶ particles/m2 (2.39 x 10⁵ particles/ft2)
1.35 x 10⁻⁹ kg/m2
Note that the loadings in the last two rows of Table 6 are approximately two orders of magnitude greater than the target loadings that were presented above in terms of CFU. This difference may be a function of assumed viability of the BG spores by experimenters when establishing release amounts or anticipated losses of particles through deposition to other surfaces, e.g., ducts and plenums, and/or removal by ventilation system filters.
4.1.4 Activity Schedule
For the purposes of comparing simulation results to measurements, a constant activity schedule and resuspension rate of ten times that of rbase (to roughly account for pre-existing particle loadings) were assumed throughout the two floors of the building and during the entire sampling period. The schedule activates the resuspension component of the source/sink models to simulate resuspension at the rate established by the source/sink properties. CONTAM does allow for very complex scheduling of resuspension, but as discussed previously, complex scheduling was not implemented in the study due to the uncertainty in associating resuspension rates with the various types and locations of activity, surface types and sizes of particles being resuspended.
4.2 Simulation Results and Comparison with Measurements
Simulations of the sampling period during which resuspension would be occurring due to occupant activity were run for the three rounds of BG release. Inputs were as described above. The measurements used for comparison are based on a limited range of particle sizes as
measured with the UVAPS, specifically the four bins of particle diameters between 0.835 m
and 1.037 m. The comparisons between measured and simulated airborne particle concentrations focused on the results within rooms 101A and 102, primarily because the UVAPS measurements enable the consideration of a specific particle size range that showed the
most significant increase above background levels and is close in size to the nominal 1 m diameter of the BG particles. This approach greatly simplified the simulation inputs to those for a single particle size as opposed to the wide range of particles whose properties can vary greatly, e.g., deposition rate and resuspension rate.
Figure 14 through Figure 17 provide plots of the comparisons between measured and predicted airborne particle concentrations for the three rounds of BG sampling tests. The dashed lines provide the measured UVAPS airborne concentrations and the solid lines provide the simulation

29
results. Chart titles provide information on resuspension rates and initial loadings used, i.e., ten times the base resuspension rate, rbase, and ten times the base loading, Lbase.
In Figure 14, the measured concentrations of Round 1 revealed that particle concentrations were clearly elevated in rooms 101A and 102 during the resuspension (sampling) periods. The review of the detailed occupancy video for Round 1 revealed that a sampling team was working in Room 101A from 12:00 to 14:30 and Room 102 from 14:30 to 16:45. The plot of measured results for Round 1 reveals that the timing of the elevated airborne concentrations do not correspond directly to the time frames of the observed activity within rooms 101A and 102 and that the airborne concentration at the measurement locations was not indicative of a constant resuspension rate and a constant air change rate, i.e., a build-up in concentration to a steady level. This discrepancy between observed activity schedules and measurements of elevated particle concentrations attributed to resuspension could be the result of variations in resuspension rates due to various types of activity, non-uniform room concentrations due to airflow patterns or resuspension location within the rooms, or some combination thereof. These observations of variability and the lack of key input variables (e.g., activity-based resuspension rates) led to the decision not to pursue detailed modeling of the resuspension activities themselves. However, for the purposes of illustration, Figure 14 provides simulation results obtained by assuming rooms were occupied during the periods obtained from the video analysis for Round 1 showing that CONTAM is capable of simulating such details if warranted.

30
Figure 14. Simulation vs. measurement, Round 1, with detailed resuspension schedule
Figure 15. Simulation vs. measurement, Round 1, resuspension 10 x rbase, loading 10 x Lbase

31
Figure 16. Simulation vs. measurement, Round 2, resuspension 10 x rbase, loading 10 x Lbase
Figure 17. Simulation vs. Measurement, Round 3, resuspension 10 x rbase, loading 10 x Lbase
32
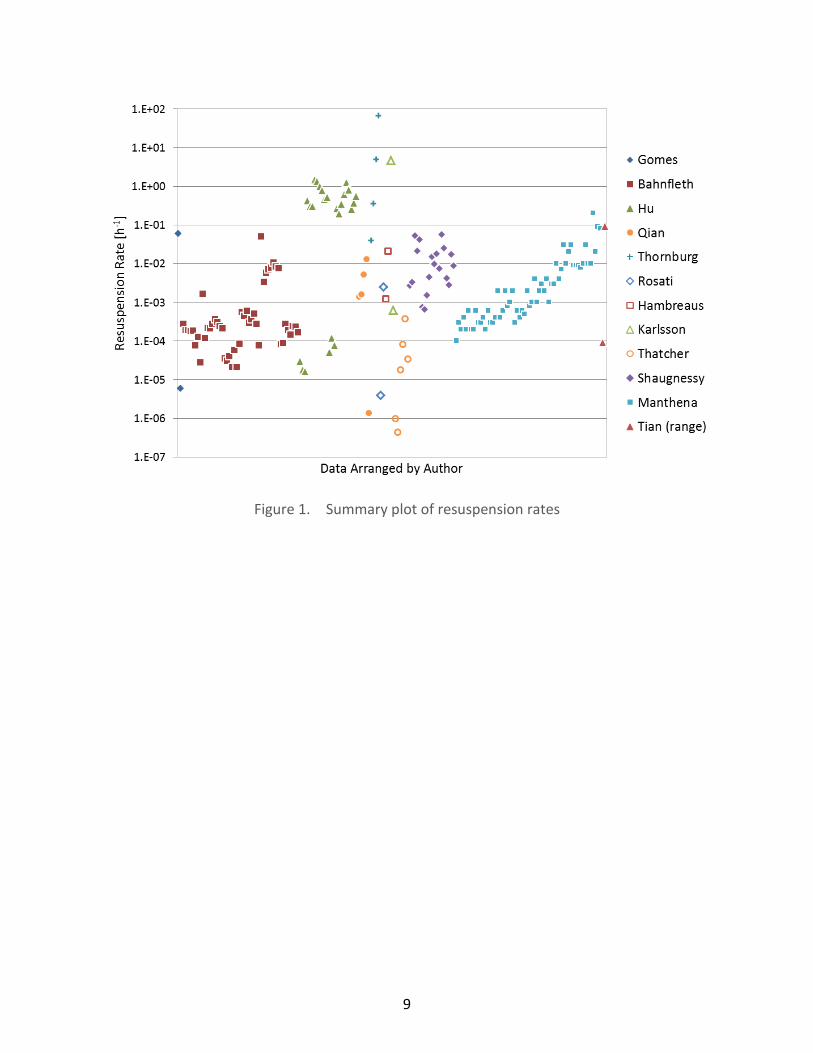
Table 7 provides a summary of comparisons between measurements and simulations for average airborne concentrations in rooms 101A and 102 based on data shown in Figure 15 through Figure 17. Average and standard deviation of air change rates determined from the CONTAM simulation are also presented. Decay rates in Room 101A were determined from measured IBAC data for several periods of each round during fan-off conditions. While these values are not directly comparable to the air change rate (and are not presented in the table), they ranged between 0.12 h-1 to 0.49 h-1.
Table 7. Summary of average measured and simulated resuspended airborne concentrations
Test
Air Change Rate [h-1]
Integration Period Average Concentration [mg/m3]
Measured Simulation Percent Diff.
AVG STD BEGIN END [h] 101A 102 101A 102 101A 102
Round 1 0.29 0.04 4/17/2011 9:15 4/17/2011 17:00 7.75 3.65E-04 4.63E-04 4.09E-04 3.91E-04 12 -16
Round 2 0.19 0.08 4/26/2011 8:05 4/26/2011 13:40 5.58 1.68E-04 1.93E-04 4.50E-04 4.10E-04 168 112
Round 3 0.08 0.03 5/11/2011 8:40 5/11/2011 18:00 9.33 3.46E-04 3.59E-04 5.64E-04 5.38E-04 63 50
The measured average concentrations ranged from approximately 1.7 x 10⁻⁴ mg/m3 to
4.6 x 10⁻⁴ mg/m3 (or assuming a 1 m particle diameter, from 3 x 10⁵ particles/m3 to 9 x 10⁵ particles/m3), and simulated values were within approximately one order of magnitude of the measured values. One order of magnitude agreement is thought to be reasonable agreement considering the uncertainty in simulation inputs, e.g., activity-related resuspension rates, initial loadings and building airflows. Further, the variation in agreement between Rounds 1 through 3 (percent differences ranging from -16 % to 168 %) is indicative of the wide variation in concentration time histories as depicted in Figure 15 through Figure 17 and is likely due to variation in activity-related resuspension rates and occupant movement patterns.
33
5 Sensitivity Analysis of Resuspension Exposure Model
The whole-building simulation results revealed that the potential exposure, i.e., average airborne concentration, was very sensitive to the simulation inputs. Future prospects of establishing a means to predict potential exposure to spore resuspension should be based on a sound basis for modeling resuspension activity and establishing the inputs to such a model. Therefore, a single-zone simulation model is applied herein to examine the sensitivity of predicted exposures to key inputs. This resuspension exposure model is then presented as a candidate for incorporation into a future software tool for resuspension exposure assessment.
In the discussion of resuspension simulations presented in Section 3, several inputs were identified as having a wide range of possible values that presumably led to some of the observed disagreement between measured and predicted values. Some inputs to the whole-building simulation were building-specific, e.g., building layout and occupancy schedules, which should not generally be associated with a high degree of uncertainty. However, other inputs are more difficult to estimate and are therefore more likely to be associated with a range of potential values, e.g., resuspension rates and particle loadings.
To examine the impact of the variations in these factors on the simulation results, a sensitivity analysis was performed by conducting a series of single zone simulations. This sensitivity analysis consisted of a two-level, full factorial analysis [40, 41] based on the Design of Experiments methodology as presented in [41]. This analysis uses graphical methods to screen for main effects and interactive effects among factors or inputs affecting the outcome of an experiment, or in this case, a simulation. This analysis provides a relatively simple method to qualify those input variables that have the most significant influence on the outcome of the calculation in question, which in this case will be the potential exposure due to resuspension for the model presented in the following section. This discussion uses several terms specific to the Design of Experiments methodology, and those terms are presented in italics below to make them easy to identify.
5.1 Single-zone Simulation Model
To focus on factors that are not building-specific, this sensitivity analysis employed CONTAM to model a single well-mixed zone with deposition and resuspension. This model is described by equations (1) and (2) with the added assumption that the outdoor concentration and the indoor source terms are both zero, leading to the following set of two equations.
For the air:
dC𝑧 dt⁄ = −(𝑄
𝑉+ 𝑣𝑑
𝐴𝑠
𝑉)𝐶𝑧(𝑡) + 𝑟
𝐴𝑟
𝑉𝐿𝑠(𝑡) (9)
For the surface:
dL𝑠 dt⁄ = 𝜐𝑑𝐶𝑧(𝑡) − 𝑟𝐴𝑟
𝐴𝑠𝐿𝑠(𝑡) (10)
This initial value problem assumes that the initial zone concentration was zero, and the floor contained an initial loading of particles. Simulations were run for an eight-hour period. The average zone concentration, Cavg, was selected as the outcome or response factor to be

34
representative of the potential exposure to which one performing sampling would be subjected.
5.2 Model Inputs
The inputs to the sensitivity analysis were selected to represent the ranges of values that might be found in realistic circumstances; however, most of the inputs can vary widely and may not be known definitively. A set of five inputs was selected for consideration in the analysis, including:
Li = initial surface loading [kg/m2] Q = volumetric outdoor airflow rate [m3/s] r = particle resuspension rate [1/s] d = deposition velocity [m/s] As = deposition surface area [m2]
Zone volume was set to 1 000 m3 and resuspension area Ar was set to 0.028 m2 (the size of a single foot print) for all simulations. Table 8 provides the ranges of the five input values that were varied. The minimum value for initial loading is based on that which would occur for a single release of BG particles in a single BOTE experiment, and the maximum was somewhat arbitrarily set to 100 times the minimum. Minimum deposition surface area was based on the zone volume divided by a ceiling height of 2.44 m and allowed to vary by two times to vary the surface-to-volume ratio from 0.41 m-1 to 0.82 m-1. The range of resuspension rates was selected based on the 25th and 75th quartiles of the data presented in Figure 1 of Section 2.3. Volumetric airflow rates were selected to include air change rates between 0.25 h-1 and 3.0 h-1, which cover a reasonable range of building air change rates. Deposition velocities were determined
based on measured deposition rates for 0.5 m to 2.5 m diameter particles as presented in [42] and [43].
Table 8. Range of input values for sensitivity analysis
Li
[kg/m2] As
[m2] r
[1/s] Q
[m3/s] d
[m/s]
Minimum 5.38E-07 410.10 2.328E-08 250 2.5E-05
Maximum 5.38E-05 820.21 1.164E-05 3000 5.0E-03
Ratio 100:1 2:1 500:1 12:1 200:1
These minimum/maximum pairs of values are referred to in the sensitivity analysis as the two levels for each input. The pairs are depicted in the following discussion and graphs as “-” and “+” (and as “-1” and “+1”), respectively.
5.3 Results of Sensitivity Analysis
Five inputs with two levels each yields a set of 32 (25) simulations for which the resultant average airborne concentrations are presented in Figure 18. This Ordered Data Plot presents resultant values in order from smallest to largest and provides the combination of input levels

35
that pertain to each result at the top of the chart. From this chart, one can readily discern which combination of inputs yields the most significant results, i.e., higher average concentration.
Figure 18. Ordered Data Plot
One of the main purposes of this sensitivity analysis is to identify those factors that have the main effects on the outcome. Figure 19 is referred to as the Main Effects Plot and provides an indication of the effect a single variable has on the outcome by plotting the mean of the responses for each variable at the indicated levels, -/+. Those factors having the steepest slope are considered most significant to the outcome relative to others; those factors with flatter lines are less significant. This plot indicates that initial surface loading and resuspension rate have the most significant effect, while deposition surface area has the least significant effect.
Figure 19. Main Effects Plot

36
While the Main Effects Plot provides information on effects related to individual variables, the Absolute Effects Plot (Figure 20) provides information on the interaction between pairs of inputs in conjunction with the main effects. Absolute effects, |Exy|, are determined by the absolute value of the difference between the means of the responses for those variables at the levels determined by the so-called multiplicative cross products as explained in Section 5.5.9.4. of [41]. For example, |ELiQ | as depicted in the Absolute Effects Plot is the absolute value of the difference between the “+1” and “-1” values of the corresponding Interactive Effects Matrix shown in Figure 21. These values of |Exy| provide a quantitative relationship among the main and interactive effects as depicted in Figure 20, which shows that the initial loading (Li), resuspension rate (r) and their interactive component (Li r) have nearly equally significant effects. Further, all factors not including the deposition surface area would appear to be relatively significant factors as demonstrated by the sharp drop-off in |Exy| at the “As” factor.
Figure 20. Absolute Effects Plot

37
Figure 21. Interactive Effects Matrix (color-coded to match the Absolute Effects Plot)
This sensitivity analysis was based on the Design of Experiments methodology as presented in [41]. While this methodology is geared towards identifying those factors that have a significant effect on an outcome of an experiment, the methodology can also be used to develop a model of the experimental outcome based on the input levels utilized in the analysis, i.e., the “+” and “-” values for each factor (see Section 5.5.9.9.5 of [41]). However, this model would be for the specific ranges of inputs and assumptions under which this analysis was performed, e.g., fixed building volume and 8-hour exposure time. It would be more useful to develop a more flexible modeling tool that would allow for a broader range of inputs and outputs as discussed in the following section.

38
6 Proposed Resuspension Exposure Tool
A key objective of the EPA BOTE project was to provide first responders and others with techniques to estimate residual risks associated with biological agents remaining after releases and/or decontamination efforts. One technique would be a software tool that would allow users to estimate indoor agent concentrations and the resultant exposures due to resuspension. This Section describes a resuspension tool that would allow the user to select key inputs and provide estimates of potential exposure as a result of resuspension.
The whole-building simulations of the BOTE resuspension experiments and the sensitivity analysis of the inputs to the proposed single-zone resuspension model presented above provide insight into the development of such a tool. While a whole-building airflow and contaminant transport representation of a specific building would be ideal for addressing particle release/resuspension events, such a representation, i.e., a multizone resuspension model, would be difficult to develop quickly and accurately for situations as they arise. The whole-building simulations presented above (including work presented in the establishment of the building representation [35]) and the review of resuspension rate studies revealed several potential issues related to application of this type of simulation to a specific building including:
establishing initial floor loadings
establishing schedules of resuspension activity, i.e., number of occupants and walking rate
associating resuspension rates with other activities, e.g., vacuuming and shuffling papers
associating resuspension rates with flooring material (and other surfaces)
establishing a building representation that captures building airflows (ventilation system, infiltration, and interzone) for multiple building operating conditions
establishing boundary conditions that drive airflow, i.e., internal and external environmental parameters such as temperatures, wind speed and direction
Based on these issues, it would be more reasonable to develop a simpler model that could be used to perform quick estimations based on a well-established set of inputs. The sensitivity analysis provided such a set of inputs based on building-related information (e.g., volume and air change rate), the literature review (e.g., walking-induced resuspension rates), and information related to release events (e.g., floor loadings based on release amounts and particle size).
The key inputs to calculating exposure due to resuspension are listed in Table 9, along with an assessment of the ability to determine reliable values for use in exposure calculations. The current view of the tool is that it would perform single-zone calculations of indoor agent levels assuming an initial loading on the interior surfaces and resuspension of that agent based on indoor activities. The first four parameters in the table, volume, air change rate, particle size and deposition rate, are fairly straightforward to specify. The tool could have default air change rates that vary by building type and operating conditions, which the user could select from a menu or other input scheme. Particle size could also be menu driven, and the deposition rate as

39
a function of particle size could be provided by the tool with the ability to be overridden by the user if they desire.
The next three variables in Table 9 are more challenging to estimate. The initial loading of the agent depends on the agent release itself, including the quantity released and the amount that enters the building in the case of an outdoor release or the amount that remains in the building if the agent release takes place indoors. If the user has this information, the loading value will be more reliable than it would be otherwise. If the user does not know the nature of the release, they will have to estimate the initial loading. The viable fraction of the agent that is available for resuspension is a key factor to determining the fraction of resuspended particles that contributes to the risk. If the user knows this fraction, the exposure estimate will be more accurate. Otherwise a conservative assumption of 100 % viability may be reasonable.
The resuspension rate is probably the most challenging input parameter to determine for this calculation. The discussion in the Literature Review Section of this report presents the range of values that has been reported in the literature and describes the dependence on particle size, surface type and activity. The tool could incorporate the PSU model, as it is the most complete approach that existed when the literature review was performed, but the user would still need to describe the activity, e.g., number of people walking and duration of their activity. It may also be possible to fit a model to other experimental measurements of resuspension rate, in particular the measurements performed by Tian et al. [26].
Table 9. Key inputs for resuspension exposure calculations
Input Parameter Assessment
Building volume Straightforward to determine; High accuracy is not critical
Building outdoor air change rate Depends on building, ventilation system type and operating conditions; Existing data to support estimates
Particle size of agent Key input that user must select
Particle deposition rate Size dependent; Values exist in literature
Initial agent loading on surfaces Challenging to determine but can be estimated from agent release information
Viable fraction of agent Potentially important for risk assessment; Availability unclear
Resuspension rate Depends on surface, particle size, activity type and activity level; Challenging to estimate
Exposure period User input
As noted in the last row of Table 9, the user would also need to specify the exposure period, which constitutes the start and stop time for the exposure calculation. This period may or may not include the period during which the resuspension activity occurs. Therefore, the user would need to separately specify the start and stop time of the resuspension activity and of the

40
exposure period. The tool would then calculate and output the average airborne agent concentration over the exposure period.
Figure 22 shows a schematic of how the exposure tool screen could appear, with the inputs identified for user entry in the upper box. The outputs, including a plot of agent concentration over time, are shown in the bottom half of the screen. This presentation is only conceptual at this time, and if the tool is developed it will likely change as programming decisions are made and input is received from beta users.
Figure 22. Exposure tool sample screen

41
7 Summary and Conclusions
This modeling study was predicated on the availability of resuspension rate models that would be applicable for use in the CONTAM multizone airflow and contaminant transport simulation tool or other similar simulation tools. The intent was to use the rates determined from such resuspension models to simulate the conditions of the BOTE resuspension experiments, and then to compare the simulation results to those obtained from the BOTE experiments.
The literature review revealed one resuspension rate model that could be used to identify resuspension rates based on a well-defined set of inputs. This model is referred to as the PSU model and provides resuspension rates that could be directly applied within CONTAM based on the following inputs: particle size, particle type, flooring type, walking rate and resuspension surface area (area of a single foot print). Several other critical observations were made based on the literature review related to the use of resuspension rates determined from experimental results within CONTAM or other similar simulation models. The methods of reporting resuspension results varied widely and included multiple forms, e.g., resuspension factor, resuspension fraction and resuspension rate. However, some results proved inapplicable, because they could not be converted to a resuspension rate parameter that can be applied in a building contaminant transport model. Conversion proved difficult due to inconsistency in reporting important experimental information, e.g., the steady-state assumption being met, resuspension surface area and air change rate of the test volume. These inconsistencies lead to the conclusion that particle resuspension experimentation requires a more rigorous approach and means of reporting results as also noted by Qian et al.[44].
Simulation results compared favorably with experimental results in that order of magnitude agreement was obtained between average airborne concentrations of resuspended particles over the period of resuspension activity for all three rounds of BOTE experiments. This result was very encouraging due to the uncertain nature of resuspension rates that vary widely depending on particle size, resuspension activity type (walking, vacuuming, shuffling papers, etc.), resuspension activity schedules (number of occupants, location of occupants, etc.), particle surface loadings, and other environmental factors (airflow rate, relative humidity, etc.). It should also be noted that the properties upon which the PSU model was based (e.g., flooring, particle types and resuspension mechanisms) did not necessarily represent those encountered in the BOTE study.
Comparisons between the experimental results and simulations revealed the inherent difficulty in capturing the detailed nature of the range of activities and associated resuspension rates. Nevertheless, given a well-formed building representation and assuming one could associate resuspension rates with particle size, flooring surfaces, activity types and schedules, a building simulation could predict potential exposure to resuspension activities. However, development of such well-formed and detailed building models and associated resuspension-related inputs would be quite resource-intensive and perhaps reserved for those buildings that warrant such attention. More work is needed to evaluate application of whole-building simulation for these more detailed analysis methods. Previous work has been performed to simulate building protection schemes with respect to CBR events [45, 46], but there does not appear to have

42
been as much done on simulating resuspension due to decontamination-related sampling after such events.
The uncertain nature of the threat that motivated this study makes it difficult to anticipate when and where the need for a detailed resuspension exposure tool would arise. Therefore, it would be more reasonable to develop a simpler tool that could be used to perform quick estimations based on a well-established set of inputs. A sensitivity analysis defined such a set of inputs based on building-related information (e.g., volume and air change rate), the literature review (e.g., walking-induced resuspension rates), and information related to release events (e.g., floor loadings based on release amounts and particle size). A relatively simple tool was proposed that would capture the main inputs and provide an estimate of potential exposure during a resuspension event. The preliminary design of the proposed tool could be modified or enhanced to accommodate additional requirements.

43
8 References
1. U.S. EPA. 2013. Bio-response Operational Testing and Evaluation (BOTE) Project
Phase 1: Decontamination Assessment, EPA/600/R-13/168. U.S. Environmental
Protection Agency: Washington, DC.
2. U.S. EPA. BOTE VIDEO. Accessed October 2013. Available from:
http://www.epa.gov/nhsrc/video/bote.html. U.S. Environmental Protection Agency.
3. Hitchcock, P.J., M. Mair, T.V. Inglesby, J. Gross, D.A. Henderson, T. O'Toole, J. Ahern-
Seronde, W.P. Bahnfleth, T. Brennan, H.E.B. Burroughs, C. Davidson, W. Delp, D.S.
Ensor, R. Gomory, P. Olsiewski, J.M. Samet, W.M. Smith, A.J. Streifel, R.H. White, and
J.E. Woods. 2006. Improving Performance of HVAC Systems to Reduce Exposure to
Aerosolized Infectious Agents in Buildings; Recommendations to Reduce Risks Posed by
Biological Attacks. Biosecurity and Bioterrorism: Biodefense Strategy, Practice, and
Science, 4(1): p. 41-54.
4. U.S. DHS. 2009. High-Priority Technology Needs Version 3.0. U.S. Department of
Homeland Security: Washington, DC.
5. FEMA. 2005. Risk Assessment A How-To Guide to Mitigate Potential Terrorist Attacks
Against Buildings, FEMA 452. U.S. Department of Homeland Security: Washington, DC.
6. National Research Council of the National Academies. 2007. Protecting Building
Occupants and Operations from Biological and Chemical Airborne Threats A
Framework for Decision Making. Washington, DC: National Academy of Sciences.
7. U.S. EPA. 2005. Compilation of Available Data on Building Decontamination
Alternatives, EPA/600/R-05/036. U.S. Environmental Protection Agency: Washington,
DC.
8. Raber, E., J.M. Hirabayashi, S.P. Mancieri, A.L. Jin, K.J. Folks, T.M. Carlsen, and P.
Estacio. 2002. Chemical and Biological Agent Incident Response and Decision Process
for Civilian and Public Sector Facilities. Risk Analysis, 22(2): p. 195-202.
9. Inglesby, T.V., D.A. Henderson, J.G. Bartlett, and et al. 1999. Anthrax as a biological
weapon: Medical and public health management. JAMA, 281(18): p. 1735-1745.
10. Price, P.N., M.D. Sohn, K.S.H. LaCommare, and J.A. McWilliams. 2009. Framework for
Evaluating Anthrax Risk in Buildings. Environmental Science & Technology, 43(6): p.
1783-1787.
11. Walton, G.N. and W.S. Dols. 2005. CONTAM User Guide and Program Documentation,
NISTIR 7251. National Institute of Standards and Technology: Gaithersburg, MD.
12. Feustel, H.E. 1998. COMIS - An International Multizone Air-Flow and Contaminant
Transport Model, LBNL-42182. Lawrence Berkeley National Laboratory: Berkeley, CA.
13. Zhang, Y. 2005. Indoor Air Quality Engineering. Boca Raton: CRC Press.
14. Bahnfleth, W.P., J.D. Freihaut, and P. Aumpansub. 2007. Phase III Task 7 Report:
Implementation of Re-suspension Factors in Building Air Flow Simulations for Cross
Contamination Risk Assessment in Multi-Zone Buildings and Determination of Source
Strengths Associated with Given Levels of Risk Reduction. Pennsylvania State University,
prepared for: U.S. Army Center for Health Promotion and Preventive Medicine
(CHPPM).
15. Freihaut, J.D., B. Hu, P. Kremer, W.P. Bahnfleth, and C. Gomes. 2008. Phase II: Task 5
Development of a Lookup Table of Resuspension Rates and Factors to be Utilized in
Indoor Air Flow Simulation Models Pennsylvania Statue University, prepared for: U.S.
Army Center for Health Promotion and Preventive Medicine (CHPPM).

44
16. Sehmel, G.A. 1980. Particle resuspension: A review. Environment International, 4(2): p.
107-127.
17. Nicholson, K.W. 1988. A review of particle resuspension. Atmospheric Environment
(1967), 22(12): p. 2639-2651.
18. Gomes, C., J. Freihaut, and W. Bahnfleth. 2005. Resuspension of Allergen-Containing
Particles under Mechanical and Aerodynamic Disturbances from Human Walking:
Introduction to an Experimental Controlled Methodology. Proceedings of Indoor Air: p.
1445-1449.
19. Gomes, C., J. Freihaut, and W. Bahnfleth. 2007. Resuspension of allergen-containing
particles under mechanical and aerodynamic disturbances from human walking.
Atmospheric Environment, 41(25): p. 5257-5270.
20. Hu, B. 2008. An Investigation of Walking Induced Electrostatic Field Effects on Indoor
Particle Resuspension, Doctor of Philosophy Thesis in College of Engineering.
Pennsylvania State University.
21. Qian, J. and A.R. Ferro. 2008. Resuspension of Dust Particles in a Chamber and
Associated Environmental Factors. Aerosol Science and Technology, 42: p. 566-578.
22. Thornburg, J. and C. Rodes. 2009. Resuspension of Fibers From Indoor Surfaces Due to
Human Activity, EPA/600/R-09/009. U.S. Environmental Protection Agency:
Washington, DC.
23. Rosati, J.A., J. Thornburg, and C. Rodes. 2008. Resuspension of Particulate Matter from
Carpet Due to Human Activity. Aerosol Science and Technology, 42: p. 472 - 482.
24. Shaughnessy, R. and H. Vu. 2012. Particle loadings and resuspension related to floor
coverings in chamber and in occupied school environments. Atmospheric Environment,
55(0): p. 515-524.
25. Manthena, S. and A.R. Ferro. 2009. Resuspension rate estimation of PM from human
activities in an indoor particle transport chamber, in Healthy Buildings 2009: Syracuse,
NY.
26. Tian, Y., K. Sul, J. Qian, S. Mondal, and A.R. Ferro. 2014. A Comparative Study of
Walking-induced Dust Resuspension using a Consistent Test Mechanism. Indoor Air.
27. Ferro, A.R., R.J. Kopperud, and L.M. Hildemann. 2004. Source Strengths for Indoor
Human Activities that Resuspend Particulated Matter. Environmental Science and
Technology, 38: p. 1759-1764.
28. Hambraeus, A., S. Bengtsson, and G. Laurell. 1978. Bacterial contamination in a modern
operating suite. 3. Importance of floor contamination as a source of airborne bacteria. J
Hyg (Lond), 80(2): p. 169-74.
29. Karlsson, E., I. Fangmark, and T. Berglund. 1996. Resuspension of an Indoor Aerosol.
Journal of Aerosol Science, 27(Supplement 1): p. S441-S442.
30. Qian, J., A.R. Ferro, and K.R. Fowler. 2008. Estimating the Resuspension Rate and
Residence Time of Indoor Particles. Journal of Air and Waste Management Association,
58: p. 502-516.
31. Thatcher, T.L. and D.W. Layton. 1995. Deposition, resuspension, and penetration of
particles within a residence. Atmospheric Environment, 29(13): p. 1487-1497.
32. Buttner, M.P., P. Cruz-Perez, L.D. Stetzenbach, P.J. Garrett, and A.E. Luedtke. 2002.
Measurement of airborne fungal spore dispersal from three types of flooring materials.
Aerobiologia, 18(1): p. 1-11.
33. U.S. DHS. 2008. Evaluation Report September 2007: Indoor Field Evaluation of Sample
Collection Methods and Strategies at Idaho National Laboratory. Department of
Homeland Security and Joint Program Executive Office for Chemical and Biological
Defense: Washington, D.C.

45
34. U.S. DHS. 2009. Evaluation Report September 2008: Indoor Field Evaluation of Sample
Collection Methods and Strategies at Idaho National Laboratory II, NSTD-09-0163.
JPEO-CBD: Washington, DC.
35. Dols, W.S., A.K. Persily, and J.B. Morrow. 2011. Model Development and Validation for
Particle Release Experiments in a Two-story Office Building NIST-TN-1703. National
Institute of Standards and Technology: Gaithersburg.
36. TSI. 2007. Model 3314 Ultraviolet Aerodynamic Particle Sizer Sensor (UVAPS) - User’s
Manual. TSI, Inc.
37. IBAC Real Time Biological Aerosol Monitor. Accessed March 2010. Available from:
http://www.icxt.com/products/icx-detection/biological/ibac/. ICx Technologies.
38. Agranovski, V. and Z.D. Ristovski. 2005. Real-time monitoring of viable bioaerosols:
capability of the UVAPS to predict the amount of individual microorganisms in aerosol
particles. Journal of Aerosol Science, 36(5-6): p. 665-676.
39. DTRA. 2011. BIO-RESPONSE OPERATIONAL TESTING AND EVALUATION (BOTE)
Final Test Plan. Defense Threat Reduction Agency.
40. Heckert, A. e-Metrology: 10-Step EDA Analysis of 2-Level Full and Fractional Factorial
Designs. Accessed October 2013. Available from: http://stat.nist.gov/~heckert/sed/e-
metrology/10step.htm. National Institute of Standards and Technology.
41. NIST. NIST/SEMATECH e-Handbook of Statistical Methods. Accessed October 2013.
Available from: http://www.itl.nist.gov/div898/handbook/pri/section5/pri59.htm.
National Institute of Standards and Technology.
42. Long, C.M., H.H. Suh, P.J. Catalano, and P. Koutrakis. 2001. Using Time- and Size-
Resolved Particulate Data To Quantify Indoor Penetration and Deposition Behavior. p.
2089-2099.
43. Howard-Reed, C., L. Wallace, and S.J. Emmerich. 2003. Deposition Rates of Fine and
Coarse Particles in Residential Buildings: Literature Review and Measurements in an
Occupied Townhouse, NISTIR 7068. National Institute of Standards and Technology.
44. Qian, J., J. Peccia, and A.R. Ferro. 2014. Walking-induced particle resuspension in
indoor environments. Atmospheric Environment, 89(0): p. 464-481.
45. Persily, A.K., R.E. Chapman, S.J. Emmerich, W.S. Dols, H. Davis, P. Lavappa, and A.
Rushing. 2007. Building Retrofits for Increased Protection Against Chemical and
Biological Releases, 7371. National Institute of Standards and Technology: Gaithersburg.
46. Persily, A.K., H. Davis, S.J. Emmerich, and W.S. Dols. 2009. Airtightness Evaluation of
Shelter-in-Place Spaces for Protection Against airborne Chemical and Biological
Releases, EPA 600/R-09/051. EPA: Gaithersburg.

46
Acknowledgments
This work was sponsored by the U.S. Environmental Protection Agency (EPA) through its Office of Research and Development under Interagency Agreement DW-13-92340101-0 under the direction of Sarah Taft (EPA). The authors would like to thank Brian Polidoro and Brady Lindemon for their assistance in reduction of measured data. We also appreciate Alan Heckert and James Filliben of the NIST Statistical Engineering Division for their insights into the topic of sensitivity analysis.

47
Appendix A. Summaries of Documents from Literature Review This appendix lists the articles and reports considered by NIST as part of this literature review organized into the following categories: Relevant resuspension models, Chamber measurements of resuspension rates, Other chamber measurements, Field measurements of resuspension rates or particle concentrations, Other model development and application, and Reviews. Each reference is followed by the published abstract. For publications that do not contain an abstract, the listed abstract is an excerpt from the publication’s introduction.
Relevant resuspension models Bahnfleth, W.P., Freihaut, J.D., and Aumpansub, P. 2007. Implementation of re-suspension factors in building air flow simulations for cross contamination risk assessment in multi-zone buildings and determination of source strengths associated with given levels of risk reduction. U.S. Army Center for Health Promotion and Preventive Medicine, Phase III Task 7 Report.
ABSTRACT There is a lot of interest in the assessment of risk resulting from bioterrorism attacks on buildings. Exposure of occupants can result from both primary aerosolization (initial airborne release of an agent) and secondary aerosolization (re-aerosolization of agent deposited on various surfaces). Reaerosolization can also cause exposures to occupants who are far away from the concentrated residual contamination sites. Consequently, it is necessary to be able to assess occupant risk in both the immediate zone of residual contamination (reservoir) and the resulting airborne contamination of other building zones due to the indigenous air flow paths of the given building.
The objective of this task is to develop a tool to help users to create key coefficients required to simulate particle deposition and re-suspension in the CONTAMW multi-zone modeling program (NIST 2006). The tool utilizes experimental re-suspension rate data for several types of particles, information extracted from CONTAMW simulations and other information to compute deposition and resuspension schedules.
A Microsoft Excel spreadsheet application was created that can be easily modified to incorporate existing and future resuspension rate data. The use of the tool is demonstrated in a parametric study for representative buildings, release types, HVAC systems and other key parameters including deposition and re-suspension of aerosols. Scenarios included exposure due to re-suspension of residual contaminant left in the floor reservoir after clean-up and reoccupation of a building.
Freihaut JD, Hu, B., Kremer P, Bahnfleth WP, and Gomes C. 2008b. Development of a Lookup Table of Resuspension Rates and Factors to be Utilized in Indoor Air Flow Simulation Models. Pennsylvania State University. Phase II Task 5 Report to U.S. Army Center for Health Promotion and Preventive Medicine, Contract DABJ05-03-P-1210.
ABSTRACT In this Phase II Task 5 report, entitled “Development of a Lookup Table of Resuspension Rates and Factors to be Utilized in Indoor Air Flow Simulations Models” the results of extensive literature reviews undertaken as well as the experimental results obtained in Phase II Task 4 and Phase III Task 10, are “synthesized into a set of recommended particle resuspension rates and factors. It is suggested that these values be utilized in Indoor Modeling

48
of Air Pathogens to estimate occupant exposure risks for conditions in which contaminated airborne particles are dominated by the reservoir resuspension processes
Chamber measurements of resuspension rates Freihaut JD, Kremer P, Gomes C, Bahnfleth WP, and Hu B 2008a. Quantification of Floor Vibration and Aerodynamic Swirl Effects on Particle Resuspension Properties. Pennsylvania State University. Phase 2 Task 4 Report to U.S. Army Center for Health Promotion and Preventive Medicine, Contract DABJ05-03-P-1210.
ABSTRACT Phase 2 Task 4 (and Phase 3, Tasks 10 and 11) focuses on the development of experimental resuspension rates and resuspension factors in well-controlled laboratory conditions which mimic typical occupant activity levels in a building in the presence of building surface particle reservoirs. Phase 2 Task 4 focuses on the resuspension phenomenology determined by mechanical vibration (floor) and aerodynamic drag and lift forces created by occupant walking.
In Phase 2 Task 4 a look-up table of resuspension rates and factors is developed from the experimental work of the other tasks and the available, applicable literature values. These resuspension values can then be utilized to model particle resuspension and estimate occupant inhalation exposure risks for a contaminated site in which field determined particle reservoir particle size concentrations and contaminant size distributions have been determined (Phase 2 Task 6).
Given the above background, the Phase II Task 4 report:
1. establishes occupant activity related, fundamental aero-mechanical disturbance drive resuspension rates of stand-alone spores and allergen carrier particles relative to “reference quartz” particles;
2. places the measured resuspension rates in the context of reported literature values.
Gomes, C., Freihaut, F. and Bahnfleth, W. 2005. Resuspension of allergen-containing particles under mechanical and aerodynamic disturbances from human walking – introduction to an experimental controlled methodology. Proceedings of Indoor Air 2005.
ABSTRACT Epidemiological evidence indicates that common environmental allergens found in building reservoirs are strongly associated with the development of bronchial hyper-reactivity (BHR) or asthma, affecting up to half the population in North America and Europe. Although they are rarely life threatening, these diseases cause much distress and lost time from school and work. These diseases are believed inhalation sensitized and developed, suggesting an aerobiological pathway of allergen-containing carrier particles from reservoir to occupant respiration. This study presents and develops a controlled and characterized method to explore the influence of human walking on the aerosolization of allergen-containing particles. Time resolved particle size distribution and allergen content are measured for particles resuspended from representative samples of flooring materials and for different sets of floor disturbances in an environmentally controlled experimental chamber. Initial results, when placed in the context of previous investigations; indicate the method can be utilized to develop a database for particle resuspension rates.

49
Gomes, C., Freihaut, F. and Bahnfleth, W. 2007. Resuspension of allergen-containing particles under mechanical and aerodynamic disturbances from human walking. Atmospheric Environment. 41(25): 5257-5270.
ABSTRACT This study presents and develops a controlled and characterized method to explore the influence of specific occupant activity on the aerosolization of allergen-containing particles. Indoor allergen-related diseases are primarily inhalation sensitized and developed, suggesting an aerobiological pathway of allergen-containing carrier particles from dust reservoir to occupant respiration. But the pathways are not well understood or quantified. The influence of occupant walking on particle aerosolization is simulated by a system in which complex floor disturbances are deconvoluted into aerodynamic and mechanical components. Time resolved particle size distributions are measured for particles resuspended from representative samples of flooring materials and different types of floor disturbances in an environmentally controlled experimental chamber. Results indicate aerodynamic disturbances, relative to mechanical, dominate the particle resuspension behavior. Dust type, dust load and floor type showed marginal influences on a normalized surface loading basis. Humidity effects were not clear since during experiments the floor samples may not have reached moisture partitioning equilibrium with the controlled air humidity. Average resuspension rates ranged from 10-7 to 10-3 min-1, having phenomenological consistency with previous, large room or chamber investigations, suggesting the method can be utilized to develop a database for particle resuspension rates.
Hu, B. 2008. An investigation of walking induced electrostatic field effects on indoor particle resuspension. PhD thesis, Architectural Engineering, Pennsylvania State University.
ABSTRACT Airborne concentration of particulate matter (PM) is an important index of indoor air quality. Researches have demonstrated the strong correlation between airborne particulate concentration and human health. Micron-sized particulate sources are commonly found in the enclosed indoor environment. Human activity is considered the main reason causing indoor particle resuspension, which leads to human secondary exposure to PM. However, no general rules have been established to empirically relate airborne particle concentration from resuspension with specific types of human activity.
This work studies the effects of electrostatic field, generated by human walking, a common human activity, on indoor particle resuspension. Particle resuspension forces, generated by human walking on indoor surface particles, can mainly be decomposed into three types: mechanical vibration, aerodynamic drag and electrostatic forces. A parametric study is carried out to compare the magnitudes of different particle resuspension force components, as well as the particle-surface adhesion force. The comparison shows that electrostatic force is a significant particle resuspension force, while the theoretically calculated particle adhesion force is much larger than each of the resuspension force components. This work suggests that real particle adhesion force is much smaller than the theoretically calculated values due to imperfect contact and thus the resuspension forces, introduced by human activity, can overcome the adhesion force to resuspend particles into the air. To testify this idea, experiments are designed to measure the real adhesion force between different particles and flooring materials with the electrostatic detachment method.

50
This work uses particle resuspension chamber as the major facility to systematically study the walking-induced electrostatic effects on particle resuspension. Experiments are designed to measure the floor surface electrostatic field strength that can be generated by human walking in indoor environment. The measured field strength profile is used for the electrostatic field simulation in the resuspension chamber experiments. The validity of the chamber experiments is testified by comparing the resuspension coefficients concluded from the resuspension chamber experiments with the results reported from field experiments. The results of chamber experiments show that the electrostatic fields introduced by human walking can have a significant influence on indoor particle resuspension. The electrostatic effects are strongly related with such factors as particle type, flooring type, relative humidity and field polarity.
Besides, this work also studies the applicability of multizone airflow and contaminant dispersion model in simulating particle resuspension and dispersion in indoor environment with a heating, ventilation and air-conditioning (HVAC) system.
Qian, J. and A. Ferro. 2008a. Resuspension of dust particles in a chamber and associated environmental factors. Aerosol Science and Technology, 42: 566-578.
ABSTRACT Experiments investigating particle resuspension from human activities were conducted in a full-scale experimental chamber. The experiments tested three types of flooring (vinyl tiles, new and old level-loop carpets) and two ventilation configurations (ceiling and side wall supply systems). The floorings were seeded with 0.1–10 μm test particles. The airborne particle concentration was measured by an array of optical particle counters (OPCs) in the chamber. Resuspension rates were estimated in size ranges of 0.8–1, 1.0–2.0, 2.0–5.0, and 5.0–10 μm ranging from 10−5–10−2 hr−1, with higher resuspension rates associated with larger particles. Resuspension via walking activity varied from experiment to experiment. “Heavy and fast” walking was associated with higher resuspension rates than less active walking, most likely due to a combination of increased pace, increased air swirl velocity, and electrostatic field effects established by the walking. The type of floorings also influenced the particle resuspension. Given the same size and mass distribution of test particles per unit floor area, resuspension rates for the seeded new level-loop carpet were significantly higher than those for the vinyl tile flooring for larger particles (1.0–10 μm) under the ceiling air supply system.
Sohn, C.W. 2006. Resuspension physics of fine particles. U.S. Army Engineer Research and Development Center, ERDC/CERL SR-06-18.
ABSTRACT Different release models can yield significantly different dynamic concentration profiles in a room depending on the release rates chosen. Results from two different cases demonstrated significantly different concentration profiles in the room of interest. This work was undertaken to: (1) Critically review the current model, (2) formulate a new, 1st order Algebraic model, and (3) use experimental data to validate the modeled theory. This report documents preliminary work that was suspended after Fiscal year 2005 (FY05). No follow-on research is currently funded.
Thornburg, J and C, Rodes. 2009. Resuspension of fibers from indoor surfaces due to human activity. U.S. Environmental Protection Agency. EPA/600/R-09/009.

51
ABSTRACT This research was directed toward 1) determining the quantity of asbestos simulant fibers resuspended (emitted) as normalized by the amount deposited, and 2) calculating asbestos simulant fiber emission factors at two heights while walking on and vacuuming seeded carpet. The asbestos fiber simulant selected for this research was calcium silicate, commonly known as Wollastonite. Three methods for measuring the quantity available for resuspension were studied:
1. MicroVac method following a modified version of ASTM D5755-95, 2. Ultrasonication method developed by Millete et al. (1993), 3. Individual carpet fiber analysis via scanning electron microscopy.
Wollastonite resuspension during walking and vacuuming was studied. Total quantity and size dependent fractions of resuspended Wollastonite were measured gravimetrically and with real-time aerodynamic particle instrumentation, respectively. Established experimental procedures were followed to seed new and old carpet with Wollastonite, characterize the quantity and size distribution of simulant fibers deposited on the carpet, resuspend the simulant fibers within an exposure chamber, and collect representative samples of resuspended fibers. The research defined a fractional carpet resuspension emission factor as ratio of Wollastonite resuspended and Wollastonite available for resuspension on the surface. The best method for estimating the amount available for resuspension was the modified MicroVac technique. This simple method only collected Wollastonite from the upper carpet fiber surfaces that were potentially available for resuspension; Wollastonite fibers embedded deep in the carpet with low probability of being resuspended were not collected. SEM analysis of individual carpet fibers worked only for new carpet fibers. Old carpet samples typically had too many “background” particles that confounded the analysis. The Millete et al. ultrasonication method poorly estimated the quantity available. The removal of a carpet plug and sonic bath released a very high number of carpet material particles that completely overwhelmed the ability to detect Wollastonite. Simulant fiber emission factors ranged from < 0.01 to 0.45, with the majority falling between 0.01 and 0.10. As expected, experimental conditions (primarily resuspension method, carpet age, and relative humidity) affected the emission factors. The majority of Wollastonite fibers resuspended from carpets were between 2 and 10 mm, with particles between 2 and 6 mm yielding the highest mass emission factors. The vacuum beater bar did resuspend a significant number of sub-micrometer particles that did not contribute much to the mass resuspended. Emission factor testing did not elucidate the influences of electrostatic and surface tension adhesion forces between the Wollastonite and carpet fibers in determining the amount available for resuspension. Further investigation of these mechanisms and their influence on emission factors will provide the requisite data needed for robust modeling exposure to resuspended particles.
Manthena, S., Ferro, A.R. 2009. Resuspension rate estimation of PM from human activities in an indoor particle transport chamber, in Healthy Buildings 2009: Syracuse, NY.
ABSTRACT Resuspension is the phenomenon of reentrainment of a previously deposited material into the atmosphere. It has been identified as a major source of indoor airborne particulate matter (PM). Human activities can increase PM concentration up to several orders of magnitude above the background levels in indoor environments. To determine the affect of
52
resuspension and the impacts of various environmental factors on resuspension, more accurate characterization is required. We conducted experiments in the Indoor Particle Transport Chamber (IPTC) at Clarkson University to characterize the resuspension from human activities from real floorings using both Arizona test dust and house dust collected from residences. For each experiment, a participant walked on different types of floorings such as hard floor and carpet inside the chamber. The floorings were seeded with Arizona test dust and house dust particles with a known size distribution of 0.1-20 µm in diameter. A number of factors, including resuspension mechanism, walking pace, shoe wear, temperature, and air exchange rate, were kept constant while relative humidity, particle type, and flooring type were varied. Resuspension rates were estimated from an air-surface compartment model using real-time particle concentration data. Resuspension rates were significantly higher for carpeting as compared with hard flooring and for house dust as compared with Arizona test dust.
Tian, Y., K. Sul, J. Qian, S. Mondal, and A.R. Ferro. A Comparative Study of Walking-induced Dust Resuspension using a Consistent Test Mechanism. Indoor Air, 2014: p. n/a-n/a. (accepted for publication 2014-03-01)
ABSTRACT Human walking influences indoor air quality mainly by resuspending dust particles settled on the floor. This study characterized walking-induced particle resuspension as a function of flooring type, relative humidity (RH), surface dust loading, and particle size using a consistent resuspension mechanism. Five types of flooring, including hardwood, vinyl, high density cut pile carpet, low density cut pile carpet and high density loop carpet, were tested with two levels of RH (40% and 70%) and surface dust loading (2 g/m2 and 8 g/m2), respectively. Resuspension fraction ra (fraction of surface dust resuspended per step) for house dust was found to vary from 10-7 to 10-4 (particle size: 0.4-10 μm). Results showed that for particles at 0.4-3.0 μm, the difference in resuspension fraction between carpets and hard floorings was not significant. For particles at 3.0-10.0 μm, carpets exhibited higher resuspension fractions compared to hard floorings. Increased RH level enhanced resuspension on high density cut pile carpet, whereas the opposite effect was observed on hard floorings. Higher surface dust loading was associated with lower resuspension fractions on carpets, while on hard floorings the effect of surface dust loading varied with different RH levels.
Other chamber measurements Gomes, C.A.S. 2004. Resuspension of allergen-containing particles subject to mechanical and aerodynamic disturbance - introduction to an experimental controlled methodology. MS thesis, Architectural Engineering, Pennsylvania State University.
ABSTRACT Epidemiological evidence indicates that common environmental allergens found in building reservoirs are strongly associated with the development of bronchial hyper-reactivity (BHR) or asthma, affecting up to half the population in North America and Europe. Although they are rarely life threatening, these diseases cause much distress and lost time from school and work. There is evidence that allergen induced respiratory distress diseases are inhalation sensitized and developed, suggesting that there must be an aerobiological pathway of allergenic containing carrier particles from building reservoir to occupant respiration. This study presents and develops an accurate method to explore the influence of human walking on the aerosolization of allergen-containing particles using an environmental controlled chamber.

53
Hu, B, J. Freihaut, W. Bahnfleth, and B. Thran. 2008a. Measurements and factorial analysis of micron-sized particle adhesion force to indoor flooring materials by electrostatic detachment method. Aerosol Science and Technology, 42: 513-520.
ABSTRACT Airborne concentration of micron-sized particulate matter (PM) is an important index of indoor air quality. While human activity is considered the main reason causing indoor particle resuspension, theoretical particle adhesion force models give predictions of adhesion force much larger than the disturbance forces introduced by human activity. This work suggests that the imperfect contact between particles and surfaces can greatly reduce the adhesion bond. Electrostatic detachment method is used to measure the actual adhesion force distribution of micron-sized particles to such common indoor flooring materials as vinyl and rubber. Comparisons are made between the theoretical predictions and experimental measurements. Factorial experiments are also designed to study the influence of particle type, flooring type and contact time on particle adhesion force.
Kildeso, J., Vinzents, P. and Schneider, T. 1998. Measuring the potential resuspension of dust from carpets. Journal of Aerosol Science, 29(Suppl. 1): S287-S288.
ABSTRACT Particles resuspended from carpets are likely to affect the indoor air quality. A simple instrument has been developed which measures the potential resuspension of dust from carpets through the use of a falling weight.
Loosmore, G.A. 2003. Evaluation and development of models for resuspension of aerosols at short times after deposition. Atmospheric Environment. 37: 639-647
ABSTRACT Resuspension is known to transport hazardous particles in the natural environment, moving a fraction of deposited material back into the atmosphere. This process is notoriously difficult to model, given the complexity of the turbulent boundary layer and chemistry of the three-phase interface (air, liquid, solid) typically found at the land surface. Wind tunnel studies have demonstrated the importance of resuspension within a short time after deposition, but there exists no robust model for short-term resuspension. Numerical simulations of accidental or terrorist releases of hazardous materials need such a model to accurately predict fate and transport of the materials within hours to days after release. Many accepted conventional models were derived from resuspension data for aged sources, such as former weapons test sites; these data sets, and the associated models, may not be appropriate for short-time resuspension. The study described here reexamined historical wind tunnel data on short-term resuspension, with the goal of developing a model appropriate for numerical simulations. Empirical models are derived from these data using a suite of parameters (friction velocity, particle diameter, surface roughness, particle density, and time). These empirical models, and the wind tunnel data, are compared quantitatively with existing conventional models from the literature. The conventional models underpredict short-time resuspension, resulting in order-of-magnitude errors in predictions of resuspended mass. Only three models perform reasonably well: the empirical models derived from the data and an adaptation of the NCRP 129 model. More data are needed to validate the empirical models and build the physical understanding of the processes involved.

54
Mukai, C., Siegel, J.A., Novoselac, A. 2009. Impact of Airflow Characteristics on Particle Resuspension from Indoor Surfaces. Aerosol Science and Technology. 43: 1022-1032
ABSTRACT Resuspension is an important source of indoor particles. We measured the resuspension of 1 to 20 μm particles on common indoor materials and explored the importance of turbulence to the resuspension process. Experimental variables included materials (linoleum, carpet, and galvanized sheet metal) and bulk air velocity (5, 10, 15, 20, and 25 m/s). At each of these conditions the turbulence intensity in the boundary layer was varied between a low, medium, and high state and ranged from 9 to 34% at the surface. For comparison of resuspension from the considered surfaces and at different flow conditions, we use the relative resuspension, which quantifies resuspension without requiring knowledge of the number of particles initially seeded on the surface. The relative resuspension compares the fraction of particles resuspended at the experimental conditions to the maximum achieved with a controlled impinging jet. In general, the results show that for the ranges considered, increasing velocity caused the largest increase in resuspension, followed by increasing turbulence intensity and then increasing particle diameter. All three material types showed consistent patterns with carpet having the largest resuspension for a given set of conditions, followed by linoleum and then by galvanized sheet metal. High turbulence and high velocity conditions minimized the differences between materials. An understanding of the relative magnitudes of these effects allows for better analysis and mitigation of indoor resuspension.
Shaughnessy R., Vu, H. 2012. Particle loadings and resuspension related to floor coverings in chamber and in occupied school environments. Atmospheric Environment. 55: 515-524.
ABSTRACT A series of experiments were conducted to evaluate characteristics of varied flooring types which may influence dirt buildup and airborne particle levels. The experiments included investigation of typical dirt loadings found on flooring in school environments, the time necessary to effectively vacuum dirt from textile flooring (both in chamber and school conditions), and the resuspension of particles generated from walking activity on various flooring types in chamber and classroom environments. The flooring types studied included textile floored surfaces (flow through (FT) carpet and variable cushion tufted textile (VCTT) floorings) and hard surface (vinyl composition tile (VCT)).
The study demonstrates that dirt buildup on textile floors will vary based on the location within the classroom. One of the primary findings of the study is that textile floor covering in schools is not a homogeneous medium. Physical characteristics vary based on the type of backing, carpet tufted type, face weight, gauge (including stitches/inch), and adhesive requirements. This variance in physical parameters contributes to significant differences in the resuspension rates (RRs) of particles into the air, generated by walking activity. FT carpet displayed significantly greater (2.5 - 5 times) RRs than VCTT in both chamber conditions and classroom environments at similar floor loadings and particle size ranges. Controlled chamber test runs revealed VCT flooring exhibiting 3.6 time higher RRs than FT flooring and 12.8 time greater RRs than VCTT flooring. Moreover, particle RRs and airborne concentrations are also a function of time of walking activity, floor dust loadings and particle size ranges.

55
Field measurements of resuspension rates or particle concentrations Ferro, A.R., Kopperud, R.J, Hildemann, L.M. 2004. Source Strengths for Indoor Human Activities that Resuspend Particulate Matter. Environmental Science & Technology. 38: 1759-1764.
ABSTRACT A mathematical model was applied to continuous indoor and outdoor particulate matter (PM) measurements to estimate source strengths for a variety of prescribed human activities that resuspend house dust in the home. Activities included folding blankets, folding clothes, dry dusting, making a bed, dancing on a rug, dancing on a wood floor, vacuuming, and walking around and sitting on upholstered furniture. Although most of the resuspended particle mass from these activities was larger than 5 um in diameter, the resuspension of PM2.5 and PM5 was substantial, with source strengths ranging from 0.03 to 0.5 mg min-1 for PM2.5 and from 0.1 to 1.4 mg min-1 for PM5. Source strengths for PM > 5 um could not be quantified due to instrument limitations. The source strengths were found to be a function of the number of persons performing the activity, the vigor of the activity, the type of activity, and the type of flooring.
Hambreaus, A., Bengtsson, S., Laurell, G. 1978. Bacterial contamination in a modern operating suite. 3. Importance of floor contamination as a source of airborne bacteria. Journal of Hygiene, 80: 169-174.
ABSTRACT The redispersal factor for bacteria-carrying particles from a contaminated floor was determined after mopping, blowing and walking activity. Walking gave the highest redispersal factor, 3-5 x 10⁻³ m-1, which was three times higher than for blowing and 17 times higher than for mopping. The mean die-away rate for the bacteria-carrying particles used was 1.9/h without ventilation and 14.3/h with ventilation. It was calculated that in the operating rooms less than 15 % of the bacteria found in the air were redispersed floor bacteria.
Karlsson, E., Fängmark, I., Berglund, T. 1996. Resuspension of an indoor aerosol. Journal of Aerosol Science. 27, Suppl. 1: S441-S442
ABSTRACT Results on one resuspension rate measurement in an office using pollen particles, about 5 um. Measured air concentration with person working at table for 1 h, yielding resuspension rate of 1.3 x 10³ s-1.
Karlsson, E., Berglund, T., Fängmark, I. 1999. The effect of resuspension caused by human activities on the indoor concentration of biological aerosols. Journal of Aerosol Science. 30, Suppl. 1: S737-S738.
ABSTRACT Two page paper on model and measurements but not much detail and model based on non-dimensional resuspension fraction (defined as fraction of particles emitted from contact area during one cycle of activity, e.g. one foot step) and frequency of human activity. Experiments using spores of about 1 um; 2 activities, walking and paperwork at desk. Results showed similar values of resuspension fraction independent of contact frequencies.
Qian, J, A, Ferro, and K, Fowler. 2008b. Estimating the resuspension rate and residence time of indoor particles. Journal of the Air and Waste Management Association. 58(4): 502-516.

56
ABSTRACT Resuspension experiments were performed in a single-family residence. Resuspension by human activity was found to elevate the mass concentration of indoor particulate matter with an aerodynamic diameter less than 10 μm (PM10) an average of 2.5 times as high as the background level. As summarized from 14 experiments, the average estimated PM10 resuspension rate by a person walking on a carpeted floor was (1.4 ± 0.6) × 10-4 hr-1. The estimated residence time for PM in the indoor air following resuspension was less than 2 hr for PM10 and less than 3 hr for 2-μm tracer particles. However, experimental results show that the 2-μm tracer particles stayed in the combined indoor air and surface compartments much longer (>>19 days). Using a two-compartment model to simulate a regular deposition and resuspension cycle by normal human activity (e.g., walking and sitting on furniture), we estimated residence time for 2-μm conservative particulate pollutants to be more than 7 decades without vacuum cleaning, and months if vacuum cleaning was done once per week. This finding supports the observed long residence time of persistent organic pollutants in indoor environments. This study introduces a method to evaluate the particle resuspension rate from semicontinuous concentration data of particulate matter (PM). It reveals that resuspension and subsequent exfiltration does not strongly affect the overall residence time of PM pollutants when compared with surface cleaning. However, resuspension substantially increases PM concentration, and thus increases short-term inhalation exposure to indoor PM pollutants.
Rosati, J.A., Thornburg, J, Rodes, C. 2008. Resuspension of particulate matter from carpet due to human activity. Aerosol Science and Technology. 42: 472-482.
ABSTRACT This work investigated the resuspension and subsequent translocation of particulate matter (PM) from carpeted flooring surfaces due to walking. In addition, the effect of HVAC systems and ceiling fans on mixing and/or translocation of resuspended PM was studied. Testing took place both in a residence with a well worn, soiled carpet and in an environmental test chamber. Prescribed walking occurred with PM measurements taken at multiple sampling heights. Scanning electron microscopy (SEM) of carpet fibers was used to determine the fraction of dust available for resuspension. These data, in conjunction with resuspended mass concentrations from this study, were used to generate emission factors by particle size for walking on both new and worn carpet.
Carpet loading does not affect the emission factor, indicating that the amount of resuspended PM is directly proportional to the available PM in the carpet. While relative humidity (RH) plays an important role in resuspension from new carpets, with high RH enhancing resuspension, it has the opposite affect with old carpets, with increased RH decreasing resuspension. With the HVAC system on, translocated particles 1.2 m horizontally from the source had number concentrations of approximately 20–40% of those at the source. With a ceiling fan on, extensive mixing was noted with little difference seen in particle resuspension by height. With the ceiling fan off, there was very little mixing present and particle size varied substantially by height.
Thatcher, T.L., Layton, D.W. 1995. Deposition, Resuspension, and Penetration of Particles within a Residence. Atmospheric Environment. 29(13): 1487-1497.
ABSTRACT Aerosol concentrations and particle size distributions were measured indoors and outdoors at a two-story residence in California during the summer months. A single central

57
sampling point in the downstairs living area was used for all indoor samples. The deposition rate for supermicron particles was measured by raising the particle concentration indoors and simultaneously measuring air infiltration rates and part concentration decay rates. For particles between 1 and 5 um diameter, the deposition velocity closely matched the calculated settling velocity. For particles larger than 5 um, the deposition velocity was less than the calculated settling velocity, probably due to the nonspherical nature of these particles. The penetration factor for supermicron particles, a measure of the amount of filtration achieved by the building shell, was calculated using experimentally determined deposition velocity and indoor/outdoor particle ratios when no resuspension or generation activities were present. A penetration factor of one was found, indicating that the building shell was not effective at removing infiltrating particles. Resuspension was measured under several different conditions and was found to have a significant impact on indoor concentrations. Just walking into a room can increase particle concentration by 100% for some supermicron particle sizes. For light activity with four people in the residence, a resuspension rate between 1.8E-5 and 3.8E-4 h-1 was found for supermicron particles assuming a particle density of 1 g m-3. These calculated rates may be lower than the actual rates due to assumptions made about particle size distribution of floor dust.
Abt, E., Suh, H.H., Catalano, P. and Koutrakis, P. 2000. Relative contribution of outdoor and indoor particle sources to indoor concentrations. Environmental Science and Technology, 34(17): 3579-3587.
ABSTRACT The effect of indoor particle sources on indoor particle size distributions and concentrations was previously investigated using real-time indoor and outdoor particle size distribution data collected in four homes in Boston in 1996. These data demonstrated the importance of indoor sources (i.e., cooking, cleaning, and movement of people) and air exchange rates on observed indoor concentrations. As part of the continued analyses of these data, a simple physical model was used to determine the source emission and infiltration rates for specific particle sizes. Decay rates were also estimated. Cooking, cleaning, and indoor work (characterized by movement of people) significantly increased PM(0.7-10) concentrations by 0.27, 0.27, and 0.25 µm3 cm-3 min-1, respectively. Cooking was the only variable significantly associated with generation of particles less than 0.5 µm in diameter. Outdoor particles (0.02-0.5 and 0.7-10 µm) were found to contribute significantly to indoor particle levels. Effective penetration efficiencies ranged from 0.38 to 0.94 for 0.02-0.5 µm particles and from 0.12 to 0.53 for 0.7-10 µm particles. Estimates for 0.7-10 µm particles decreased with increasing particle size, reflecting the influence of deposition losses from gravitational settling. The real-time particle size distribution data in conjunction with time-activity information provides valuable information on the origin and fate of indoor particles.
Buttner, M.P., Cruz-Perez, P., Stetzenbach, L.D., Garrett, P.J., Luedtke, A.E. 2002. Measurement of airborne fungal spore dispersal from three types of flooring materials. Aerobiologia. 18: 1-11.
ABSTRACT Research was conducted in an experimental room to measure the effect of human activity on airborne dispersal of settled fungal spores from carpet and vinyl tile flooring. A series of experiments were conducted in which commercial loop pile carpet, residential cut pile

58
carpet, or vinyl tile installed in the experimental room were contaminated with Penicillium chrysogenum spores. The flooring materials were contaminated to two different levels (106 and 107 colony forming units per square meter [c.f.u./m2] of flooring surface). Airborne culturable and total P. chrysogenum concentrations were measured using Andersen single-stage impactor samplers and Burkard personal slide impactor samplers, respectively. Bioaerosol concentrations were measured at floor level, 1 meter, and the adult breathing zone (1.5 meter) heights before and after human activity consisting of walking in a prescribed pattern for 1 minute in the room. Airborne P. chrysogenum concentrations were greater with the higher surface loading for all three flooring materials. For all flooring materials there was no significant difference between sampler locations, although the data from the 1-meter location were the highest, followed by the floor level and the breathing zone locations, respectively. The data from these experiments indicate that while a very small fraction of culturable P. chrysogenum spores present on flooring materials were aerosolized by walking, relatively high airborne concentrations of spores maybe re-entrained from contaminated materials. The airborne P. chrysogenum concentrations were significantly higher after walking on cut pile carpet than with the other two flooring materials at both contamination levels, with the differences in concentration often ≥ 2 orders of magnitude. No differences were measured in airborne culturable P. chrysogenum between vinyl flooring and loop pile carpet at both contamination levels. Total spore data from the experiments with the 107 c.f.u./m2 contamination level indicated that walking on loop pile carpet produced higher airborne spore concentrations than similarly contaminated vinyl tile although no significant difference was observed at the 106 c.f.u./m2 level.
Cheng, K-C, M, Marian, and L, Hildemann. 2010. Association of size-resolved airborne particles with foot traffic inside a carpeted hallway. Atmospheric Environment. 44: 2062-2066.
ABSTRACT The effect of foot traffic on indoor particle resuspension was evaluated by associating non-prescribed foot traffic with simultaneous size-resolved airborne particulate matter (PM) concentrations in a northern California hospital. Foot traffic and PM were measured every 15 min in a carpeted hallway over two 27-h periods. The PM concentration in the hallway was modeled based on the foot traffic intensity, including the previous PM concentration via an autocorrelation regression method based on the well-mixed box model. All 5 size ranges of PM, ranging from 0.75–1 μm to 5–7.5 μm, were highly correlated with foot traffic measurements for both monitoring periods (p < 0.001, R2 = 0.87–0.90). However, correlations during daytime hours were less significant than nighttime. Coefficients found via this autoregressive analysis can be interpreted to reveal (i) time-independent contributions of walking activities on PM levels for a specific location; and (ii) size-specific characteristics of the resuspended PM.
Corsi, R.L., Siegel, J.A., Chiang, C. 2008. Particle Resuspension During the Use of Vacuum Cleaners on Residential Carpet. Journal of Occupational and Environmental Hygiene. 5: 232-238.
ABSTRACT Vacuuming is generally considered to be an important activity with respect to the cleanliness of indoor environments but may lead to short-term resuspension of particulate matter and elevated particle mass in indoor air. Because resuspended particles often contain toxicants, such as lead and pesticides, or consist of biological agents that can trigger allergic reactions, it is important to understand the role of vacuuming on short-term variations in

59
indoor particulate matter concentrations. The inhalation of particles during vacuuming events may affect adversely those whose occupation requires them to clean a wide range of indoor environments, from homes to schools and offices, as well as those who occupy those environments. In response, a series of 46 experiments was completed to determine time-variant concentrations of both PM10 and PM2.5 during various vacuuming activities in 12 separate apartments. Experiments involved the use of two different non-HEPA vacuum cleaners and were completed with a vacuum cleaner activated (switched on) as well as deactivated (switched off). The latter was intended to provide insight on the potential for resuspension of particles by the mechanical agitation of vacuum cleaner movement across carpet. Separate experiments were completed also using “mock” vacuuming simulations, that is, walking on the carpet in a manner consistent with using a vacuum cleaner. Results are presented as incremental particulate matter concentration increases, relative to background (prevacuum) concentrations, and peak-to-background particle concentration ratios. Results indicate significant resuspension of PM10 mass during vacuum cleaning, with a mean time-averaged PM10 increase of greater than 17 μg/m3 above background. Resuspension of PM2.5 mass was determined to be small, that is, PM10 mass was dominated by particles greater than 2.5 μm. The frequency of vacuuming (between a 10-day standard frequency and several experiments at >24 days between vacuuming) had little influence on resuspended particle mass. Resuspension by mechanical agitation (rolling of vacuum cleaner across carpet) with the vacuum cleaner switched off was determined to be substantial, with a mean time-averaged (during vacuuming) PM10 increase of 35 μg/m3 relative to background. Peak-to-background PM10 concentrations exceeded 6 for some experiments and averaged between approximately 3 and 4 for experiments when the vacuum cleaner was switched on.
Long, C.M., Suh, H.H, and Koutrakis, P. 2000. Characterization of indoor particle sources using continuous mass and size monitors. Journal of the Air & Waste Management Association, 50(7): 1236-1250.
ABSTRACT A comprehensive indoor particle characterization study was conducted in nine Boston-area homes in 1998 in order to characterize sources of PM in indoor environments. State-of-the-art sampling methodologies were used to obtain continuous PM2.5 concentration and size distribution particulate data for both indoor and outdoor air. Study homes, five of which were sampled during two seasons, were monitored over week-long periods. Among other data collected during the extensive monitoring efforts were 24-hr elemental/organic carbon (EC/OC) particulate data as well as semi-continuous air exchange rates and time activity information.
This rich data set shows that indoor particle events tend to be brief, intermittent, and highly variable, thus requiring the use of continuous instrumentation for their characterization. In addition to dramatically increasing indoor PM2.5 concentrations, these data demonstrate that indoor particle events can significantly alter the size distribution and composition of indoor particles. Source event data demonstrate that the impacts of indoor activities are especially pronounced in the ultrafine (da ≤ 0.1 μm) and coarse (2.5 ≤ da ≤ 10 μm) modes. Among the sources of ultrafine particles characterized in this study are indoor ozone/terpene reactions. Furthermore, EC/OC data suggest that organic carbon is a major constituent of particles emitted during indoor source events. Whether exposures to indoor-generated particles,

60
particularly from large short-term peak events, may be associated with adverse health effects will become clearer when biological mechanisms are better known.
Raunemaa, T., M., Kulmala, H., Saari, M. Olin, and M. Kulmala. 1989. Indoor aerosol model: transport indoors and deposition of fine and coarse particles. Aerosol Science and Technology, 11: 11-25.
ABSTRACT Mass and elemental concentrations of particles were determined in indoor and outdoor air in urban and suburban Helsinki, Finland. The effects of outdoor-to indoor transport and indoor sources on indoor particle concentrations were studied in detail. Resuspension and deposition to surfaces were also investigated. The experimental results are used to develop and specify an aerosol physical model for particle behavior in indoor air, which is presented at the end.
Weis, C, A, Intrepido, A., Miller, P., Cowin, M., Durno, J., Gebhardt, J. and R. Bull . 2002. Secondary aerosolization of viable Bacillus anthracis spores in a contaminated US senate office. Journal of the American Medical Association, 288(22): 2853-2858.
ABSTRACT Context Bioterrorist attacks involving letters and mail-handling systems in Washington, DC, resulted in Bacillus anthracis (anthrax) spore contamination in the Hart Senate Office Building and other facilities in the US Capitol’s vicinity.
Objective To provide information about the nature and extent of indoor secondary aerosolization of B. anthracis spores.
Design Stationary and personal air samples, surface dust, and swab samples were collected under semiquiescent (minimal activities) and then simulated active office conditions to estimate secondary aerosolization of B anthracis spores. Nominal size characteristics, airborne concentrations, and surface contamination of B anthracis particles (colony-forming units) were evaluated.
Results Viable B anthracis spores reaerosolized under semiquiescent conditions, with a marked increase in reaerosolization during simulated active office conditions. Increases were observed for B anthracis collected on open sheep blood agar plates (P_.001) and personal air monitors (P=.01) during active office conditions. More than 80% of the B anthracis particles collected on stationary monitors were within an alveolar Respirable size range of 0.95 to 3.5 μm.
Conclusions Bacillus anthracis spores used in a recent terrorist incident reaerosolized under common office activities. These findings have important implications for appropriate respiratory protection, remediation, and reoccupancy of contaminated office environments.
Other model development and application Firrantello, J.T., Aumpansub, P., Bahnfleth, W.P., Hu, B., Freihaut, J.D., Thran, B., and Hutchens, S. 2007. Effects of HVAC system and building characteristics on exposure of occupants to short-duration point source aerosol releases. Journal of Architectural Engineering, 13(2): 84-94. ABSTRACT This paper presents results from the simulation of localized, short-duration bioaerosol releases in a hypothetical building similar to a dormitory or barracks using public domain multizone air flow and contaminant dispersion modeling software. The primary

61
purpose of the modeling was to generate example exposure data to be used in the development of a comprehensive microbial risk assessment methodology. However, these results are also of intrinsic interest for what they reveal about the contribution of various building characteristics to risk from airborne contaminants. A variety of parameters were varied, including building construction, heating, ventilating, and air-conditioning (HVAC) system design, and release characteristics, among others. Results of these simulations demonstrate the variability of exposure possible under different scenarios and, more particularly, the impact that HVAC design decisions can have on risk. Although a single building and restricted set of scenarios was investigated, several general conclusions could be drawn regarding factors, such as HVAC zoning and filter maintenance, that intrinsically contribute to vulnerability reduction.
Freihaut J.D., Bahnfleth W.P., and Hu, B. 2005. Modeling of Transient Aerosol Deposition and Resuspension (Secondary Aerosolization) with Multizone Air Flow and Contaminant Transport Software. Pennsylvania State University. Phase II Task 2 Report to U.S. Army Center
for Health Promotion and Preventive Medicine, Contract DABJ05-03-P-1210.
ABSTRACT The objective of the project Indoor Air Modeling for Human Pathogens is to develop indoor contaminant transport modeling procedures for use in a microbial risk assessment procedure being developed by the U.S. Army Center for Health Promotion and Preventive Medicine (CHPPM). Phase II, Task 1 of this project (Bahnfleth, et al. 2005) identified the absence of the ability to model contaminant deposition and resuspension. Phase II, Task 2 of this project, which is summarized in this report, examines the incorporation of the missing “critical variables” for deposition and resuspension into the modeling process. Specifically, this report describes how literature-based deposition and resuspension models and data can be used as the basis for simulating resuspension in the public domain CONTAM version 2.1 multizone air flow and contaminant transport modeling software (Dols and Walton 2002), which is developed and distributed by the National Institute of Standards and Technology (NIST).
Hong, T., Gurian, P.L., and Dudley Ward, N.F. 2010. Setting risk-informed environmental standards for bacillus anthracis spores. Risk Analysis, 30(10): 1602-1622.
ABSTRACT In many cases, human health risk from biological agents is associated with aerosol exposures. Because air concentrations decline rapidly after a release, it may be necessary to use concentrations found in other environmental media to infer future or past aerosol exposures. This article presents an approach for linking environmental concentrations of Bacillus anthracis (B. anthracis) spores on walls, floors, ventilation system filters, and in human nasal passages with human health risk from exposure to B. anthracis spores. This approach is then used to calculate example values of risk-informed concentration standards for both retrospective risk mitigation (e.g., prophylactic antibiotics) and prospective risk mitigation (e.g., environmental clean up and reoccupancy). A large number of assumptions are required to calculate these values, and the resulting values have large uncertainties associated with them. The values calculated here suggest that documenting compliance with risks in the range of 10−4 to 10−6 would be challenging for small diameter (respirable) spore particles. For less stringent risk targets and for releases of larger diameter particles (which are less respirable and hence less hazardous), environmental sampling would be more promising.

62
Hu, B., J. Freihaut, W. Bahnfleth, P. Aumpansub, and B. Thran. 2007. Modeling particle dispersion under human activity disturbance in a multizone indoor environment. Journal of Architectural Engineering. 13(4): 187-193.
ABSTRACT Human activity is an important factor influencing particle resuspension in the indoor environment. This work studies the applicability of a multizone airflow and contaminant transport model (CONTAM 2.1) in the simulation of indoor dispersion of particles under human activity disturbance. An iterative method is suggested to complement CONTAM 2.1, by tracking the transient particle concentration on floor surface due to dynamic deposition and resuspension process. A three-zone building with a heating, ventilation, and air conditioning system is used as the simulation case to test the convergence and accuracy of this algorithm under different particle-release scenarios. The algorithm shows a very fast convergence speed in the simulation. Comparisons of calculation results between the multizone model and the analytical model show good agreement and verify the accuracy of the multizone model simulation. The airborne particle concentration profiles and human breathing dose are also analyzed for the three-zone building model.
Hu, B. J. Freihaut, W. Bahnfleth, P. Aumpansub, and B. Thran. 2007a. Modeling particle dispersion under human activity disturbance in a multizone indoor environment. Journal of Architectural Engineering. 13(4): 187-193.
ABSTRACT Human activity is an important factor influencing particle resuspension in the indoor environment. This work studies the applicability of a multizone airflow and contaminant transport model (CONTAM 2.1) in the simulation of indoor dispersion of particles under human activity disturbance. An iterative method is suggested to complement CONTAM 2.1, by tracking the transient particle concentration on floor surface due to dynamic deposition and resuspension process. A three-zone building with a heating, ventilation, and air conditioning system is used as the simulation case to test the convergence and accuracy of this algorithm under different particle-release scenarios. The algorithm shows a very fast convergence speed in the simulation. Comparisons of calculation results between the multizone model and the analytical model show good agreement and verify the accuracy of the multizone model simulation. The airborne particle concentration profiles and human breathing dose are also analyzed for the three-zone building model.
Hu, B., Freihaut, J., Bahnfleth, W., and Thran, B. 2007b. Simulating transient particle deposition/re-suspension in indoor environments. Proceedings of Third International Building Physics Conference. Montreal.
ABSTRACT The deposition and resuspension of particles are important factors in the determination of airborne concentrations resulting from accidental and intentional contamination of a building. Most multizone airflow and contaminant transport modeling software treats particulate contaminants as gases, and may not possess the capability to track the cumulative amount of aerosol deposited, which is needed for the simulation of transient resuspension processes. A methodology is described for implementing particulate dispersion modeling in a transient, multizone simulation that is consistent with these limitations. The key elements of the method are the calculation of particulate source/sink values in the form required by the simulation software and the use of an iterative procedure to establish the

63
transient surface reservoir concentration. The method is demonstrated and tested using a widely used, public domain, multizone modeling program, CONTAM 2.1. It is shown that, although somewhat cumbersome given current capabilities, this method produces reasonable results. Modifications to existing software capabilities required for automated implementation of resuspension are also recommended.
Kim, Y., A. Gidwani, M. Sippola, and C. Sohn. 2008. Source term model for fine particle resuspension from indoor surfaces. Engineering Research and Development Center, Report ERDC/CERL TR-08-4.
ABSTRACT This Phase I effort developed a source term model for particle resuspension from indoor surfaces to be used as a source term boundary condition for CFD simulation of particle transport and dispersion in a building. Specifically, this work: (1) investigated responsible mechanisms for fine particle resuspension from indoor surfaces, (2) identified parameters relevant to resuspension, (3) performed a dimensional analysis and derivation of a resuspension model, and (4) evaluated the model against published experimental data on resuspension. Preliminary validation of the derived model was conducted based on a set of experimental data from the Lawrence Berkeley National Laboratory.
Kim, Y., A. Gidwani, B. Wyslouzil, and C. Sohn. 2010. Source term models for fine particle resuspension from indoor surfaces. Building and Environment. 45(8): 1854-1865.
ABSTRACT Understanding the dispersion of contaminants inside buildings is important for improving indoor air quality (IAQ). Detailed information on the dispersion profile within a room is required to design active protection systems and to develop countermeasure strategies against potential threats from particulate based agents. A number of computational fluid dynamics (CFD) codes in the public and commercial domain can simulate contaminant dispersion inside a building. One of the critical boundary conditions required by these CFD codes is a resuspension source term model. This paper develops general source term models for particle resuspension from indoor surfaces based on dimensional analysis. First, the physical mechanisms responsible for fine particle resuspension from indoor surfaces are investigated and relevant parameters are identified. Then, three different models are developed using dimensional analysis and published resuspension data in the literature. Finally, the models are evaluated against independent experimental data that were not used to determine the model coefficients.
Lazaridis, M. and Y. Drossinos. 1998. Multilayer resuspension of small identical particles by turbulent flow. Aerosol Science and Technology, 28(6): 548-560.
ABSTRACT A model for the resuspension of a multilayer deposit by turbulent flow is developed. The resuspension rate is obtained by solving a set of coupled, first order kinetic equations. The multilayer resuspension rate depends explicitly on single-particle resuspension rates that are determined from modified energy transfer model. The surface-particle and particle-particle interaction potentials are calculated by a microscopic approach based on the integration of the Lennard-Jones intermolecular interaction potential. The effect of the surface roughness, which leads to a distribution of the adhesive forces, is considered, as well as the energy transfer from the fluctuating part of the turbulent flow to the particle. It is shown that for a geometrical

64
arrangement of deposited particles with a co-ordination number of two (particles stacked on top of each other) particles from the top layers resuspend at lower friction velocities than particles adjacent to the surface. The predicted long term resuspension rate decays algebraically with exposure time. Calculations are presented for a two-layer deposit of either SnO, and AZ,O, particles on a stainless steel surface.
Luoma, M., and Batterman, S.A. 2001. Characterization of particulate emissions from occupant activities in offices. Indoor Air, 11: 35-48.
ABSTRACT This paper characterizes the relationship between occupant activities and indoor air particulate levels in a non-smoking office building. Occupant activities were recorded on video. Particulate concentrations were monitored by three optical particle counters (OPCs) in five size ranges at three heights. Particulate mass concentrations were measured gravimetrically and bioaerosol concentrations were determined by impaction methods. Occupant activities and number concentrations were determined with 1-min resolution over a 1-week period. Occupant activities such as walking past or visiting the monitoring site explained 24–55% of the variation of 1- to 25-mm diameter particle number concentrations. Statistical models associating particulate concentrations with occupant activities depended on the size fraction and included an autocorrelative term. Occupant activities are estimated to contribute up to 10 μg m-3 in particulate concentrations per person. Number concentrations of particles smaller than 1 mm had little correlation with indoor activities other than cigarette smoking and were highly correlated with outdoor levels. The method can be used to characterize emissions from activities if rapid measurements can be made and if activities can be coded from the video record.
Schneider, T., Kildesø, J., and Breum, N.O. 1999. A two compartment model for determining the contribution of sources, surface deposition and resuspension to air and surface dust concentration levels in occupied rooms. Building and Environment, 34: 583-595.
ABSTRACT A semi-empirical two-compartment, constant parameter model is used to predict airborne and surface dust concentrations. The model parameters are air in- and exfiltration, internal particle sources, surface deposition caused by settling, Brownian and turbulent diffusion and thermophoresis, track-in of dust particles and resuspension. Model predictions are calculated for some typical scenarios, and the soiling rate of a vertical surface is calculated for a range of friction velocities and electric field strengths. Model sensitivity is determined based on input parameter value distributions for a population of rooms estimated from published data. The predictions are sensitive to track-in and resuspension rates on which field data thus are needed.
Sextro, R. D. Lorenzetti, M. Sohn, and T. Thatcher. 2002. Modeling the spread of anthrax in buildings. Proceedings of Indoor Air 2002.
ABSTRACT The recent contamination of several U.S. buildings by letters containing anthrax demonstrates the need to understand better the transport and fate of anthrax spores within buildings. We modeled the spread of anthrax for a hypothetical office suite and estimated the distribution of mass and resulting occupant exposures. Based on our modeling assumptions, more than 90% of the anthrax released remains in the building during the first 48 hours, with

65
the largest fraction of the mass accumulating on floor surfaces where it is subject to tracking and resuspension. Although tracking and resuspension account for only a small amount of mass transfer, the model results suggests they can have an important effect on subsequent exposures. Additional research is necessary to understand and quantify these processes.
Stuempfle, A.K., Fischer, B.W. 2009. Biological aerosol hazard assessments of emergency responders in specific scenarios. Edgewood Chemical Biological Center, ECBC-CR-101 (OMI-762).
ABSTRACT The Biological-agent Indoor-Evaporation model was used to estimate the respirable particle concentration-time profile and the resuspension of particles by human activity in ventilated enclosures. Various venues, ventilation conditions, dissemination devices, Biological Warfare Agents (BWAs), and responder actions either during or following agent release were examined. The magnitude of the BWA hazards depended on the type of pathogen released, its quantity, dissemination method, and the incident site and conditions. "Scenario average particle concentration values" for the selected dissemination devices and indoor scenarios were estimated as a function of time. The expected indoor respirable particle concentrations following explosive and spray releases in typical meeting rooms depended on the device's fill weight and the agent's bulk concentration (colony forming units/gram). For the scenarios examined, maximum challenge levels/gram of agent disseminated ranged from 106—1010 particles/m3. The resuspension of deposited biological agents from flooring material by mechanical stress was a small fraction of the contamination density, but can result in a significant respiratory hazard. The reaerosolized and resuspended particulates could reach levels of ~103-105 particles/m3, depending on the flooring material and initial Hot-Zone conditions. Numerous data deficiencies and knowledge gaps regarding bioaerosols and their dissemination devices were identified. Additional experimental effort is needed.
Zhang, X., Ahmadi, G., Qian, J., and Ferro, A. 2008. Particle detachment, resuspension and transport due to human walking in indoor environments. Journal of Adhesion Science and Technology, 22: 591-621.
ABSTRACT In this work, particles detachment, resuspension and transport due to indoor human walking were studied numerically and experimentally. The stepping motions of the foot, down and up, were modeled using a combination of two effective circular disks. The flow generated by the squeezing film at the shoe–floor interface was assumed to be laminar and the corresponding velocity field was evaluated. The flow outside of the foot was modeled based on a wall jet theory. The effects of adhesion force and surface roughness were included in the analysis. Models for particle detachment and resuspension were developed. The effects of particle-wall adhesion force and the hydrodynamic drag and lift forces were included in the particle detachment model. Spreading and dispersion of resuspended particle clouds was also evaluated. Particle deposition, turbulent diffusion and Brownian diffusion were also included in the particle transport model. Comparisons of the model predictions for particle concentration in the room and for particle resuspension rate with the obtained experimental data showed good agreements. The simulation results showed that shoe bottom roughness, foot size, walking velocity, background velocity as well as the foot stepping velocities, down and up, all

66
affected particle resuspension rate from the floor as well as the corresponding particle concentrations in the indoor environment.
Reviews Hu, B., Freihaut, J.D., Bahnfleth, W., Gomes, C.A.S, Freihaut, F. and Thran, B. 2005. Literature review and parametric study: indoor particle resuspension by human activity. Proceedings of Indoor Air 2005.
ABSTRACT Once an aerosol contaminant is introduced into an indoor environment, it can remain in the air, deposit on interior surfaces or attach to dust particles already present. Human activity, such as walking and cleaning, resuspends contaminated particles, regenerating airborne contaminants. This report is a literature review on the effects of human activity on particle re-suspension in indoor environment. A parametric investigation is also made on particle resuspension effects of potential mechanical, aerodynamic and electrostatic force components, due to human activity over the particle-containing reservoir. It is shown that combinations of mechanical-aero-electro forces from human activity, can lead to significant particle resuspension in indoor environment. Additional experimental and modeling work is recommended to quantify the influence of human activity on indoor particle resuspension.
Nicholson, K.W. 1998. Review of Particle Resuspension. Atmospheric Environment. 22 (12): 2639-2651.
ABSTRACT Some of the various types of studies on particle resuspension or re-entrainment are summarized along with shortcomings. General experimental aspects have been considered, rather than focusing on the numerical values of results, and research on erosion and resuspension by mechanisms other than wind has been included. It is evident that experiments have been performed in a wide range of environmental conditions but that additional research is required, in many areas, if a quantitative assessment of resuspension is to be achieved.
Qian, J., Peccia, J., Ferro, A.R. 2014. Walking-induced particle resuspension in indoor environments. Atmospheric Environment. 89: 464-481.
ABSTRACT Resuspension of particles indoors increases the risk of consequent exposure through inhalation and nondietary ingestion. Studies have been conducted to characterize indoor particle resuspension but results do not always agree, and there are still many open questions in this field. This paper reviews the recent research of indoor resuspension and summarizes findings to answer six critical questions: 1) How does the resuspension sources compared to other indoor sources; 2) How is resuspension determined and how does the resuspension measure change as a function of particle size; 3) What are the primary resuspension mechanisms; 4) What are the factors affecting resuspension; 5) What are the knowledge gaps and future research directions in this area; and 6) How can what we know about resuspension guide better exposure mitigation strategies? From synthesized results, we conclude that resuspension is an important source for indoor particulate matter, compared with other indoor sources. Among all existing quantification terms of resuspension, resuspension fraction has the least variation in its estimates by explicitly defining surface loading and walking frequency, and thus is recommended to be adopted in future research over other terms. Resuspension
increases with particle size in the range of 0.7 - 10 m, although differences exist in

67
resuspension estimates by orders of magnitude. The primary mechanism of particle resuspension involves rolling detachment, and the adhesive forces can be greatly reduced by microscopic surface roughness. Particle resuspension is by nature complicated, affected by various factors and their interactions. There are still many open questions to be answered to achieve an understanding of resuspension fundamentals. Given the complex and multidisciplinary nature of resuspension, understanding indoor particle resuspension behavior requires cross-disciplinary participation from experts in aerosol science, textile science, surface chemistry, electrostatics, and fluid mechanics.
Sehmel, G.A. 1980. Particle resuspension: A review. Environment International, 4: 107-127.
ABSTRACT Published numerical values of resuspension variables, rates, factors, and weathering half-lives are summarized. Results of the review show the great uncertainty in accurately predicting resuspension. Resuspension rates range over six orders of magnitude from 10-12 to 10-4 fraction/sec, resuspension factors over nine orders of magnitude from 10-10 to over 10-2 m-1, and weathering half-lives from 35 days to years.