
Modeling Operating Speed of Two Lane Rural Roads
8
Procedia - Social and Behavioral Sciences 53 (2012) 664 – 671 1877-0428 © 2012 The Authors. Published by Elsevier Ltd. Selection and/or peer-review under responsibility of SIIV2012 Scientific Committee doi:10.1016/j.sbspro.2012.09.916 SIIV - 5th International Congress - Sustainability of Road Infrastructures Modeling Operating Speed Of Two Lane Rural Roads Filippo Gianmaria Praticò a , Marinella Giunta b * a,b University Mediterranea of Reggio Calabria, via Graziella Feo di Vito, 89100 Reggio Calabria, Italy Abstract This paper focuses on the analysis of the influence of road alignment on operating speed in two-lane rural roads. The authors propose a new operating speed model in which the geometric features of an alignment and the lengths of the elements (previous, current and oncoming) are explicitly considered. Furthermore the influence of the presence of accesses is evaluated. The experiments carried out allowed to quantify the influence of previous, current and oncoming elements and features on the operating speed. Outcomes are expected to benefit both researchers and practitioners Keywords: operating speed; alignment; rural road. 1. Introduction Operating speed, usually termed V85, is defined as the 85-th percentile of the speed distribution under free flow conditions. It represents the speed scenario at a given section. Operating speeds on two-lane rural roads depend on many factors related to drivers [1], vehicles, roadway environment, etc. [2], radius of a horizontal curve, curvature change rate, grade, length of the horizontal curves, deflection angle, sight distance, superelevation rate, side friction factor and pavement conditions. Several models of V85 for two-lane rural roads were developed over the past decades [3] – [8]. The curve radius and the curvature change rate are often considered to be the most important elements for determining operating speeds in a curve section. Models are usually constructed on the basis of local road conditions, such as lane and shoulder width, longitudinal grade, range of horizontal curve radius, and dryness or wetness of the pavement. * Corresponding author. Tel.: +39 0965 875471; fax: +39 0965 875230. E-mail address: [email protected] Available online at www.sciencedirect.com © 2012 The Authors. Published by Elsevier Ltd. Selection and/or peer-review under responsibility of SIIV2012 Scientific Committee
Transcript of Modeling Operating Speed of Two Lane Rural Roads

Procedia - Social and Behavioral Sciences 53 ( 2012 ) 664 – 671
1877-0428 © 2012 The Authors. Published by Elsevier Ltd. Selection and/or peer-review under responsibility of SIIV2012 Scientific Committeedoi: 10.1016/j.sbspro.2012.09.916
SIIV - 5th International Congress - Sustainability of Road Infrastructures
Modeling Operating Speed Of Two Lane Rural Roads
Filippo Gianmaria Praticòa, Marinella Giuntab* a,bUniversity Mediterranea of Reggio Calabria, via Graziella Feo di Vito, 89100 Reggio Calabria, Italy
Abstract
This paper focuses on the analysis of the influence of road alignment on operating speed in two-lane rural roads. The authors propose a new operating speed model in which the geometric features of an alignment and the lengths of the elements (previous, current and oncoming) are explicitly considered. Furthermore the influence of the presence of accesses is evaluated. The experiments carried out allowed to quantify the influence of previous, current and oncoming elements and features on the operating speed. Outcomes are expected to benefit both researchers and practitioners © 2012 The Authors. Published by Elsevier Ltd. Selection and/or peer-review under responsibility of SIIV2012 Scientific Committee Keywords: operating speed; alignment; rural road.
1. Introduction
Operating speed, usually termed V85, is defined as the 85-th percentile of the speed distribution under free flow conditions. It represents the speed scenario at a given section.
Operating speeds on two-lane rural roads depend on many factors related to drivers [1], vehicles, roadway environment, etc. [2], radius of a horizontal curve, curvature change rate, grade, length of the horizontal curves, deflection angle, sight distance, superelevation rate, side friction factor and pavement conditions.
Several models of V85 for two-lane rural roads were developed over the past decades [3] – [8]. The curve radius and the curvature change rate are often considered to be the most important elements for
determining operating speeds in a curve section. Models are usually constructed on the basis of local road conditions, such as lane and shoulder width,
longitudinal grade, range of horizontal curve radius, and dryness or wetness of the pavement.
* Corresponding author. Tel.: +39 0965 875471; fax: +39 0965 875230. E-mail address: [email protected]
Available online at www.sciencedirect.com
© 2012 The Authors. Published by Elsevier Ltd. Selection and/or peer-review under responsibility of SIIV2012 Scientific Committee

665 Filippo Gianmaria Praticò and Marinella Giunta / Procedia - Social and Behavioral Sciences 53 ( 2012 ) 664 – 671
Many models predict the operating speed only in a tangent or a curve as a function of the horizontal characteristics of individual elements, whereas others ([6], [9]) consider a combination of the horizontal and vertical alignments.
McLean (1979) [10] suggested that the operating speed in a curve depends not only on the curve radius but also on the desired speed. This latter is defined as “the speed at which drivers choose to travel under free flow conditions when they are not constrained by alignment features”.
Kerman et al. (1982) [11] proposed a model in which a bend speed depends on the approach speed and on the curve radius.
Kanellaidis et al. (1990) [12] modeled the operating speed in a curve as a function of the curve radius and of the desired speed.
Bennett (1994) [13] investigated the effects of curvature on speed in New Zealand. He found that the operating speed on horizontal curves depends on the curvature and on the 85-th percentile of approach speed.
Krammes et al. (1995) [5] evaluated the approach speed using experimental observations and found a correlation between the operating speed and several parameters related to the curve, such as the degree of the curve, length, deflection angle, and 85-th percentile of the approach speed.
Perco (2008) [14] developed a V85 prediction model for curves and tangents which included, as independent variables, not only the geometric characteristics of the individual elements but also the general character of the horizontal alignment.
Hu and Donnel (2010) [15] found that drivers decelerate at a lower rate when approaching horizontal curves with larger radii and that an increase in the length of the approach tangent increases driver deceleration rates when approaching horizontal curves. Furthermore, they supposed that a possible reason was that long approach tangents allow drivers to achieve higher speeds. They observed that an increase in the length of the horizontal curve leads to higher acceleration rates, and this leads to higher speeds. As for departure tangents, they noted that that longer departure tangents yield longer distances for drivers to achieve a desired speed on the departure tangent.
Driver perception of road characteristics after a current element was also found to be relevant for predicting the drivers behavior and the operating speed.
Praticò and Giunta (2010, 2011 and 2012) [16] - [18] proposed a new operating speed prediction model for low volume roads. The studies focused on the importance of considering the geometric features of previous elements.
All the above mentioned studies demonstrate the importance of considering the conditions of alignment preceding a horizontal element as well as the overall alignment of the road to better estimate the driver behavior and the operating speed in a current horizontal element.
In particular, the length of the current element (or, alternatively, the corresponding duration of travel) confirms to result very relevant in affecting driver behavior and speed.
Many studies developed regression equations or identified roadway features that affect speed on both rural and suburban/urban arterials [19] – [22].
Features identified included lane width, hazard rating, access density (number of access points - driveways and intersections - per mile), proximity to adjacent intersections, median opening density, presence of residential or commercial developments, posted speed limit, roadside development, median presence and type, parking along the street, pedestrian activity level.
It is relevant to observe that even if operating speed is often very sensitive to radius and grade on rural two-lane highways, several findings from the field studies demonstrated than in some contexts (urban/suburban areas), operating speed is insensitive to many geometric design decisions. For example, (Zhu and Rong, 2010) [23] analysed the impact of the accesses on the operating speed of two-lane highways. They concluded that accesses yielded a reduction of operating speeds and that the range of deceleration has a close relation with the access density.

666 Filippo Gianmaria Praticò and Marinella Giunta / Procedia - Social and Behavioral Sciences 53 ( 2012 ) 664 – 671
Another important issue which describes the complexity of rural roads is the changing nature of rural traffic which demands new and more dedicated ways to improve safety.
Indeed, it is important to acknowledge that different areas, even while they may share the "rural" classification, may have different characteristics and therefore they have different traffic safety needs.
Furthermore, the same definition of rural road and the consequent difference among rural suburban and urban roads can be considered sometimes unclear.
For example, for the Federal Highway Administration, FHWA, rural is defined as anything bordering population centers of 5,000 or less, while a urban road is considered a road bordering a population center of more than 50,000 people.
Another distinction is usually recommended between traditional rural roads/areas (stable or shrinking populations) and developed rural roads/areas (stable or growing populations).
To this end it is relevant to observe that many typical Italian two-lane rural roads often border population centers of around 5,000-50,000 people.
The change of traffic type and volumes is often associated to a change of descriptive variables of V85 variations and calls for further research, especially for typical rural roads in southern Europe, where the transition urban/suburban/rural is fairly frequent.
Indeed the above types of roads provide a mix of access and mobility and along with the mix of access and mobility a mix of operating speeds and driver behavior can be observed.
As for traffic vs. pavement relationship, it is noted that traffic composition can be very variable as well as the type of pavement and surface courses [24] - [30].
Indeed, the low volume roads, LVR, can be broadly classified as unpaved roads (where AADT, average annual daily traffic, is lower than 500 vehicles per day) and paved roads.
According to American Association of State Highway Transportation Officials, AASHTO, LVRs can be defined as paved roads with 0.7 – 1 million Equivalent Single Axel Loads (ESALs) in a given performance period, with 50,000 ESALs as a practical minimum.
Washington State department of transportation, WSDOT, limits to 50,000 ESALs/year for the design of LVRs for a design period of 20 years.
The maximum number of heavy vehicles over the design life is usually below 750,000 as suggested by the mechanistic empirical pavement design guide, M-EPDG.
In the context of the above studies, this paper focuses on the influence of road alignment and features on driver behavior and operating speed. In particular, this study deals with the explanatory potential of the length of an element (curve or tangent) in two-lane rural roads. Furthermore the influence of the presence of accesses is evaluated.
2. Experiments analysis and discussion
In pursuit of the abovementioned objectives, an experimental survey was carried out on the road SP21. SP21 is a two-lane rural road in the Province of Reggio Calabria, southern Italy. As the majority of rural, unseparated roads, it is of old construction and its alignment consistency is often
unsatisfactory. The road is characterized by a traffic volume which usually allows free-flow speeds. The longitudinal slope covers a range of ±10.0%, and the road has a positive uphill slope in one direction and
a negative downhill slope in the opposite direction. The first phase of the experimental plan involved measuring the geometric parameters of the road and
identifying the horizontal and vertical elements. To gather information on the speed distribution, speed data were preliminarily collected at six sections (both
directions at each section) using a speed laser gun.

667 Filippo Gianmaria Praticò and Marinella Giunta / Procedia - Social and Behavioral Sciences 53 ( 2012 ) 664 – 671
The actual speeds of vehicles were collected at the midpoints of the curves and tangents. Previous investigations (Praticò et al. 2011) [17] demonstrated that the accuracy and precision of this method
is optimal when the laser gun and car direction are coincident (i.e., at 0 or 180°). As a consequence, only angles in the range 0°± 10° or 180°± 10° were used. For each curve and tangent
monitored, at least 125 car speed measurements were collected [31]. This sample size was successfully verified ex-post after the real survey. The speeds of buses, motorcycles and trucks were not considered. All measurements were collected under free flow conditions, in the daytime and under dry pavement
conditions. Speed data were collected at 74 sites (37 curves and 37 tangents, in both directions). The length of the road
was around 6200m. Radii ranged from 18m to 148m, while the length of the curves ranged from 11m to 85m. Their V85 ranged from 38 to 73 km/h.
The length of the tangents ranged from 37m to 245m, while their V85 ranged from 37 to 71 km/h. We set out 10 equations in order to consider a growing complexity of relationships (see equations 1 to 10).
bRaV
id85 , (1)
gcbV85 , (2)
ni
i
fL
1
11
, (3)
ii
i
GRR*
exp1
1, (4)
e
GRR
fL
bVi
ni
*exp1
1
1
1185 . (5)
bRaV di
'1
'85 . (6)
b
RR
hRR
V n
i
iii 111
1
11185 , (7)
hR
bViRi 1
185lim . (8)

668 Filippo Gianmaria Praticò and Marinella Giunta / Procedia - Social and Behavioral Sciences 53 ( 2012 ) 664 – 671
1
'
)*
exp(1
1
1
1185iin
ii Ragce
GRR
fL
bRaV
(9)
)('
)*exp(1
1
1
1185 21
ADFR
agce
GRR
fL
bRaV
iin
ii
(10)
Where Ri is the radius of i-th element, g is the grade of the element, Li is the element length, AD, access
density, is the number of accesses per kilometer. a, b, c, a’, d’, e, f, n, G, h, R* are coefficients to calibrate. F2 is a function to calibrate.
Based on the literature analysis [13], [6], the first operating speed prediction model considered in this study was the one in equation (1), where the coefficient a (<0) tunes the weight of the main variable, R (radius), d (>0) is a scale factor, b is the value to which V85 approaches when 1/R tends to zero (it relates to the so-called desired speed, [10]). The correlation yielded a poor value of R-squared, 0.37 (a=–34; b=53; d=0.47).
To obtain information about the slope effect, we set out equation (2), where c is a coefficient, and g (%) indicates the longitudinal slope [32] – [34].
In this case, the percentage of explained variance was 24%, with b=50 and c=–0.48. Based on the gathered data and on literature ([35], [32], [36], [15]) we formalized equation (3) for considering
the effect of element length in terms of an element parameter, herein termed I. It is noted that in equation (3) Li (m) indicates the length of the i-th element, and f (positive) and n (positive,
dimensionless) are model parameters to be estimated. Note that high n and low f yield high speeds and the element parameter, i, varies from 0, when Li is equal to
0 and 1 when Li tends to infinite. The data we gathered, visual observations of driver behaviors and international literature [37] suggested us
that the effects of acceleration will be higher (and, consequently, will have a higher impact on safety) on tangents or high-radius curves. Therefore we formalized equation (4), where the effective element coefficient, i, is defined by means of a sigmoid factor F(R). Using expressions (3) and (4) we obtained equation (5), where e is a calibration factor which affects the maximum magnitude of the effect (when L and R tend to infinity), R* (where
R≥L) distinguishes between low- and high-radius curves, and G is a coefficient that accounts for the gradualness (gradient) of this transition. It is noted that higher values of G yield more gradual transitions and higher radii with a given L give higher values of V85 and viceversa and this fact agrees with driver perception of run-out risks.
Data fitting yielded an R-square value of 0.37, with b=50, f=6.8 104, n=1.0, R*=95m, G=1, e=3590. The effect of the (i-1)-th radius on the i-th operating speed was considered using the equation (6), where a’
and d’ are again calibration coefficients. In this case, an R-square close to zero was obtained. The effects of the oncoming (i+1)-th alignment element on the i-th operating speed were taken into account in
equation (7), where the n1 (dimensionless) and h coefficients are determined by fitting. h affects the maximum magnitude of an effect, whereas n1 affects the “speed” of a transition, from 0 to 1 of the expression in square brackets containing Ri+1/Ri.
We considered that: i) If the (i+1)-th element is similar (in curvature) to the i-th element, its influence will be negligible; ii) If the (i+1)-th curvature radius is higher than the previous i-th element, its influence will be negligible because the operating speed will be controlled by the current curvature; iii) If the (i+1)-th curvature radius is much lower than that of the previous i-th element, its influence will be significant (see equation 8), and
669 Filippo Gianmaria Praticò and Marinella Giunta / Procedia - Social and Behavioral Sciences 53 ( 2012 ) 664 – 671
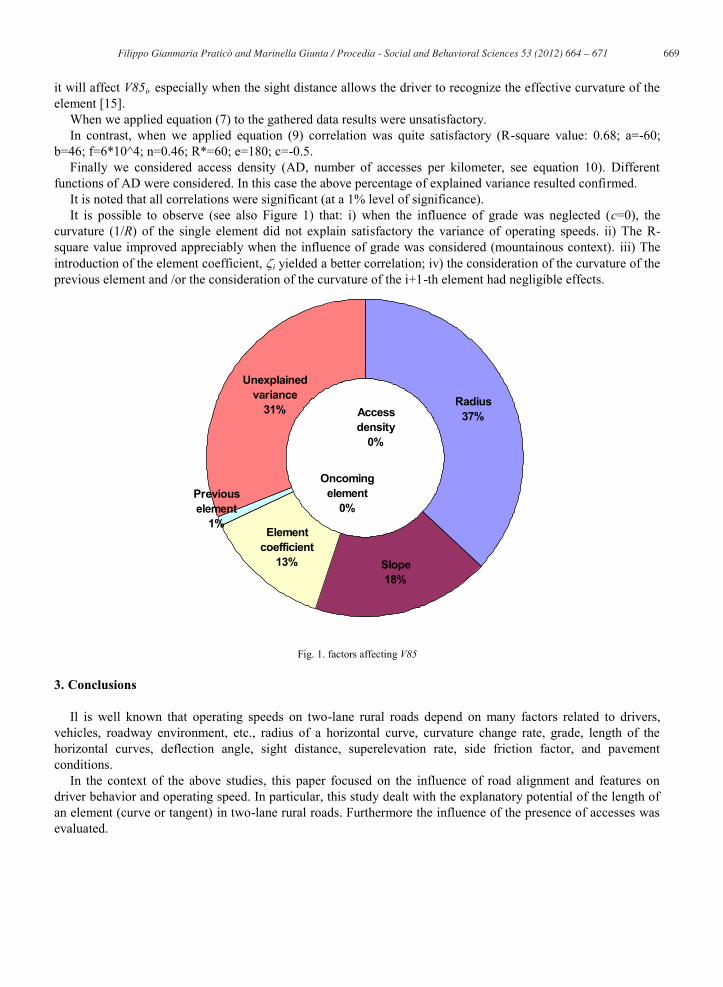
it will affect V85i, especially when the sight distance allows the driver to recognize the effective curvature of the element [15].
When we applied equation (7) to the gathered data results were unsatisfactory. In contrast, when we applied equation (9) correlation was quite satisfactory (R-square value: 0.68; a=-60;
b=46; f=6*10^4; n=0.46; R*=60; e=180; c=-0.5. Finally we considered access density (AD, number of accesses per kilometer, see equation 10). Different
functions of AD were considered. In this case the above percentage of explained variance resulted confirmed. It is noted that all correlations were significant (at a 1% level of significance). It is possible to observe (see also Figure 1) that: i) when the influence of grade was neglected (c=0), the
curvature (1/R) of the single element did not explain satisfactory the variance of operating speeds. ii) The R-square value improved appreciably when the influence of grade was considered (mountainous context). iii) The introduction of the element coefficient, i yielded a better correlation; iv) the consideration of the curvature of the previous element and /or the consideration of the curvature of the i+1-th element had negligible effects.
Radius37%
Slope18%
Element coefficient
13%
Access density
0%
Unexplained variance
31%
Previous element
1%
Oncoming element
0%
Fig. 1. factors affecting V85
3. Conclusions
Il is well known that operating speeds on two-lane rural roads depend on many factors related to drivers, vehicles, roadway environment, etc., radius of a horizontal curve, curvature change rate, grade, length of the horizontal curves, deflection angle, sight distance, superelevation rate, side friction factor, and pavement conditions.
In the context of the above studies, this paper focused on the influence of road alignment and features on driver behavior and operating speed. In particular, this study dealt with the explanatory potential of the length of an element (curve or tangent) in two-lane rural roads. Furthermore the influence of the presence of accesses was evaluated.

670 Filippo Gianmaria Praticò and Marinella Giunta / Procedia - Social and Behavioral Sciences 53 ( 2012 ) 664 – 671
Based on the operating prediction model proposed and on the experimental investigation carried out the following conclusions may be drawn.
The horizontal curvature, the longitudinal slope, and the length of an element are the main factors that influence the operating speed. Their consideration allowed to reach an explained variance of 69%. Specifically, grade greatly influences operating speed, and the synergistic effects of grade and length may potentially affect the safety of rural roads in mountainous terrain. The consideration of radius, grade and length allowed to reach an explained variance of 69%. Although previous and oncoming geometric features may be essential for the accurate analysis in a given section, from a statistical standpoint, the influence of the geometric features of the current element prevails over the influence of both past and oncoming elements.
The same consideration seem to be worth for the presence of the accesses considered in the model in terms of access density.
Results can be considered satisfactory. However, several considerations call for further research: the relationship between speed limits and country specificity, complex alignments and road type.
Outcomes are expected to benefit both researchers and practitioners.
References
[1] Paris, H., & Van den Broucke S. (2008) Measuring cognitive determinants of speeding: An application of the theory of planned behaviour. Transportation Research Part F 11 (2008) pp. 168–180. [2] Kanellaidis, G. (1995). Factors affecting drivers' choice of speed on roadway curves. Journal of Safety Research, Volume 26, Issue 1, pp. 49-56. [3] McLean, J. (1981). Driver speed behaviour and rural road alignment design. Traffic Engineering and Control Vol. 22, No. 4, pp. 208-211. [4] Lamm, R., Choueiri, E.M., Hayward, J.C., & Paluri A. (1988). Possible design procedure to promote design consistency in highway geometric design on two-lane rural roads. Transportation Research Record, No. 1195. Transportation Research Board, National Research Council, Washington, D.C., pp. 111-122. [5] Krammes, R.A., Brakett, R.Q., Shaffer, M.A., Ottesen, J.L., Anderson, I.B., Fink, K.L., Collins, K.M., Pendleton, O.J., & Messer, C.J. (1995). Horizontal alignment design consistency for two- lane highways. Report FHWA-RD-94-034, FHWA, U.S. Department of Transportation. [6] Fitzpatrick K., Elefteriadou L., Harwood D.W., Collins J.M., McFadden J., Anderson I.B, Krammes R.A., Irizarry N., Parma K.D., Bauer K.M., & Passetti K. (2000). Speed prediction for two-lane rural highways. Report No.FHWA – RD -99-171, Federal Highways Administration, 2000. [7] Misaghi, P., & Hassan, Y. (2005). Modeling Operating Speed and Speed Differential on Two-Lane Rural Roads. Journal of Transportation Engineering. Journal of ASCE, Vol. 131, No. 6, pp. 408-416. [8] Gintalas, V., Žilionienė, D., Dimaitis, M., Lukošaitis, D, Lipnevičiūtė, K., & Vitkienė, J. (2008). Analysis of design solutions in the objects of gravel roads paving programme in terms of traffic safety. The Baltic Journal of Road And Bridge Engineering, vol. 3(2), pp. 93–100. [9] Abdul-Mawjoud, A.A., & Sofia, G.G. (2008). Development of models for predicting speed on horizontal curves for two-lane rural highways”. The Arabian Journal for Science and Engineering, Vol. 33, Number 2B pp. 365-377. [10] McLean, J. (1979). An Alternative to the Design Speed Concept for low Speed Alignment Design. Transportation Research Record 702, 55-63. [11] Kerman et al., (1982). Effects of road curvature on vehicle/driver behaviour. Report By The Transportation Research Group For The Department Of Transport, University of Southampton. [12] Kanellaidis, G., Golias, J., & Efstathiadis, S. (1990). Driver’s Speed Behaviour on Rural Road Curves. Traffic Engineering and Control, London, Vol. 31, pp. 414-415. [13] Bennett, C.R. (1994). A Speed Prediction Model for Rural Two-Lane Highways. Ph.D. Dissertation, University of Auckland, New Zealand. [14] Perco, P. (2008). Influence of the general character of the horizontal alignment on the operating speed of two-lane rural road. Transportation Research Record 1743. [15] Hu, W., & Donnell, E.T. (2010) Models of acceleration and deceleration rates on a complex two-lane rural highway: Results from a nighttime driving experiment. Transportation Research Part F 13 pp.397–408. [16] Praticò F.G., & Giunta, M. (2010). Operational and safety effects of two-lane roads alignment. In. Proceedings of 4th International Symposium on Highway Geometric Design June 2-5, Valencia, Spain.

671 Filippo Gianmaria Praticò and Marinella Giunta / Procedia - Social and Behavioral Sciences 53 ( 2012 ) 664 – 671
[17] Praticò F.G., & Giunta M. (2011). Speed distribution in low volume roads: from inferences to rehabilitation design criteria. Transportation Research Record Journal of Transportation Research Board, No 2203 vol. 1 pp 79-84. [18] Praticò F.G., & Giunta M. (2012). Quantifying the effect of present, past and oncoming alignment on the operating speeds of a two-lane rural road. The Baltic Journal of Road and Bridge Engineering 2012, 7(3): pp. 179 188 [19] Fitzpatrick, K., Carlson, P. J., Wooldridge, M. D., & Brewer, M. A. (1999). Design Factors That Affect Driver Speed on Suburban Arterials. eport FHWA/TX-00/1769-3. Texas Transportation Institute, College Station, TX (August 1999). [20] Fitzpatrick K., Carlson P., Brewer M., & Wooldridge M.D. (2003). Design Speed, Operating Speed, and Posted Speed Limit Practice. Transportation Research Board, Washington, D.C., 82nd Annual Meeting, January 2003. [21] Poe, C. & Mason Jr., M. (2000). Analyzing Influence of Geometric Design on Operating Speeds Along Low-Speed Urban Streets: Mixed Model Approach. Transportation Research Record 1737. Transportation Research Board, Washington, DC (2000) pp 18-25. [22] Dimaiuta M., Donnell E., Himes S., & Porter R. (2011). Modeling Operating Speed: Synthesis Report. Chapter 2: Speed Models in North America”, Transportation Research E-Circular, Issue Number: E-C151, Transportation Research Board, ISSN: 0097-8515. [23] Zhu Z., & Rong J., (2010). The Impact of the Accesses on the Operating Speed of Two-Lane Highways. Conference Proceeding Paper, ICCTP 2010: Integrated Transportation Systems: Green, Intelligent, Reliable, Section: Traffic Safety Theory and Technology, pp. 935-942, (doi http://dx.doi.org/10.1061/41127(382)101). [24] Boscaino, G., & Pratico, F.G. (2001). Classification of surface texture indices of pavement surfaces | [Classification et inventaire des indicateurs de la texture superficielle des revêtements des chaussées]. Bulletin des Laboratoires des Ponts et Chaussees (234), pp. 17-34+123+125+127. [25] Muench, S.T., White G.C., Mahoney J.P., Pierce L.M., & Sivaneswaren N.. (2004). Long-Lasting Low-Volume Pavements in Washington State. International Symposium on Design and Construction of Long Lasting Asphalt Pavements. International Society for Asphalt Pavements, Auburn, AL, 2004, pp. 729 – 773. [26] Behrens, I.L.C. (1999). Overview of Low-Volume Roads. In Transportation Research Record. Journal of the Transportation Research Board, No. 1652, Washington, D.C, 1999, pp. 1 – 4. [27] Keller, G., & Sherar J. (2003). Low-volume roads engineering - Best Management Practices Field Guide. USDA, Forest Service, July 2003. [28] Praticò F.G., & Moro A., (2007). Permeability and volumetrics of porous asphalt concrete: a theoretical and experimental investigation. Road Materials and Pavement Design, Vol 8/4 – 2007. [29] Praticò F.G. (2007). Quality and timeliness in highway construction contracts: a new acceptance model based on both mechanical and surface performance of flexible pavements. International Journal of Construction Management and Economics, Volume 25, Issue 3, pages 305 – 313, Routledge - Taylor and Francis 2007, March, 2007 [30] Praticò, F. G., Saride, S., Puppala, A. (2011). Comprehensive life-cycle cost analysis for selection of stabilization alternatives for better performance of low-volume roads. Transportation Research Record (2204), pp. 120-129. [31] Pignataro, L.J. (1973). Traffic Engineering - Theory and Practice . Prentice-Hall Publishing Co., New Jersey. [32] NCHRP, 2003. Design Speed, Operating Speed, and Posted Speed Practices. TRB. [33] Bevilacqua, A., Di Mino, G., & Nigrelli, J. (2004). An experimental investigation on the relationship between speed and road geometry. In Proc. of 2nd International SIIV Congress New technologies and modeling tolls for roads”, Florence Italy. [34] De Luca M., Grossi R., & Garofalo C. (2002). Indagine sperimentale sulle velocità attuata dai guidatori in diverse condizioni di circolazione. un modello comportamentale per la costruzione del diagramma di velocità. In Proc. of XII SIIV Congress, Parma, 30-31ottobre, 2002, Vol. 1, pp. 372-395. [35] Schurr, K. S., McCoy, P. T., Pesti, G., & Huff, R. (2002). Relationship Between Design, Operating, and Posted Speeds on Horizontal Curves on Rural Two-Lane Highways in Nebraska. Transportation Research Board. Annual Meeting. [36] Polus, A., Fitzpatrick, K., & Fambro, D., (2000). Predicting operating speeds on tangent sections of two-Lane rural highways. Transportation Research Record Journal of Transportation Research Board, No. 1737. pp. 50–57. [37] Comte S. L., & Jamson A. H. (2000).Traditional and innovative speed-reducing measures for curves: an investigation of driver behaviour using a driving simulator. Safety Science, Volume 36, Issue 3, December 2000, pp 137-150.