Modeling of Pressure Propagation from Saltwater Disposal ... · Modeling of Pressure Propagation...
20
Modeling of Pressure Propagation from Saltwater Disposal Wells Completed in the Arbuckle Group, northern Oklahoma Kyle E. Murray, PhD, Hydrogeologist Presents: Water & Energy: Induced Seismicity by Underground Injection Ground Water Protection Council (GWPC) Meeting Oklahoma City, OK September 28, 2015
-
Upload
nguyenliem -
Category
Documents
-
view
219 -
download
2
Transcript of Modeling of Pressure Propagation from Saltwater Disposal ... · Modeling of Pressure Propagation...
Modeling of Pressure Propagation from Saltwater Disposal Wells Completed in the Arbuckle Group,
northern Oklahoma
Kyle E. Murray, PhD, Hydrogeologist
Presents:
Water & Energy: Induced Seismicity by Underground InjectionGround Water Protection Council (GWPC) Meeting
Oklahoma City, OKSeptember 28, 2015
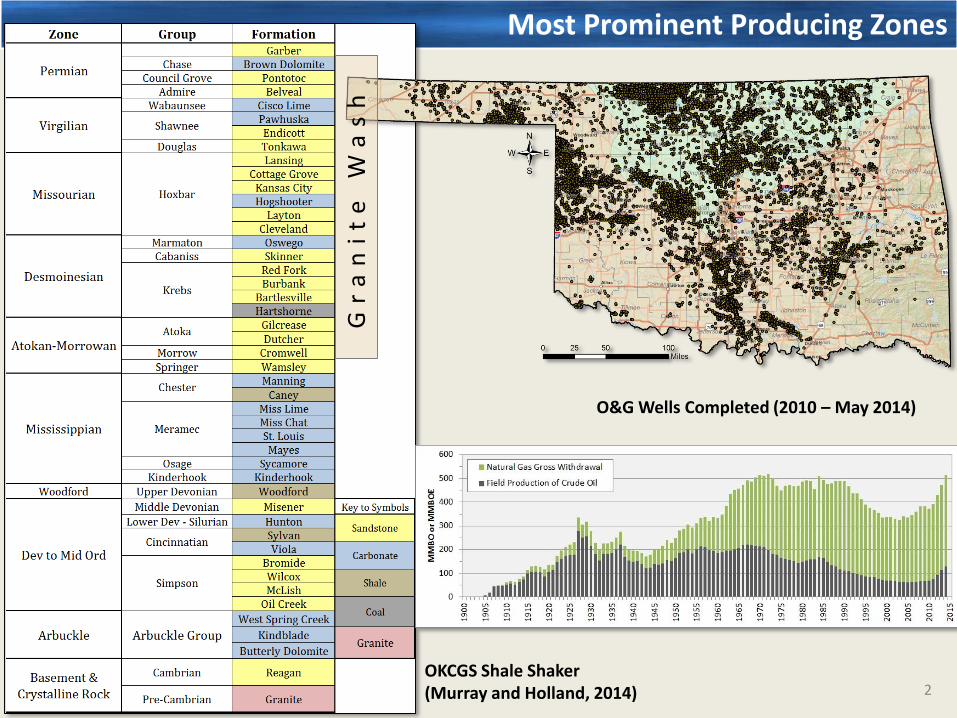
Most Prominent Producing Zones
OKCGS Shale Shaker(Murray and Holland, 2014) 2
O&G Wells Completed (2010 – May 2014)
Gr
an
it
e
Wa
sh

Oil Production by Zone for 13 Study Area Counties, 2009–2014
Compiled from:Lasser Production Database
(Murray, 2015 – in preparation)

Gas Production by Zone for 13 Study Area Counties, 2009–2014
Compiled from:Lasser Production Database
(Murray, 2015 – in preparation)
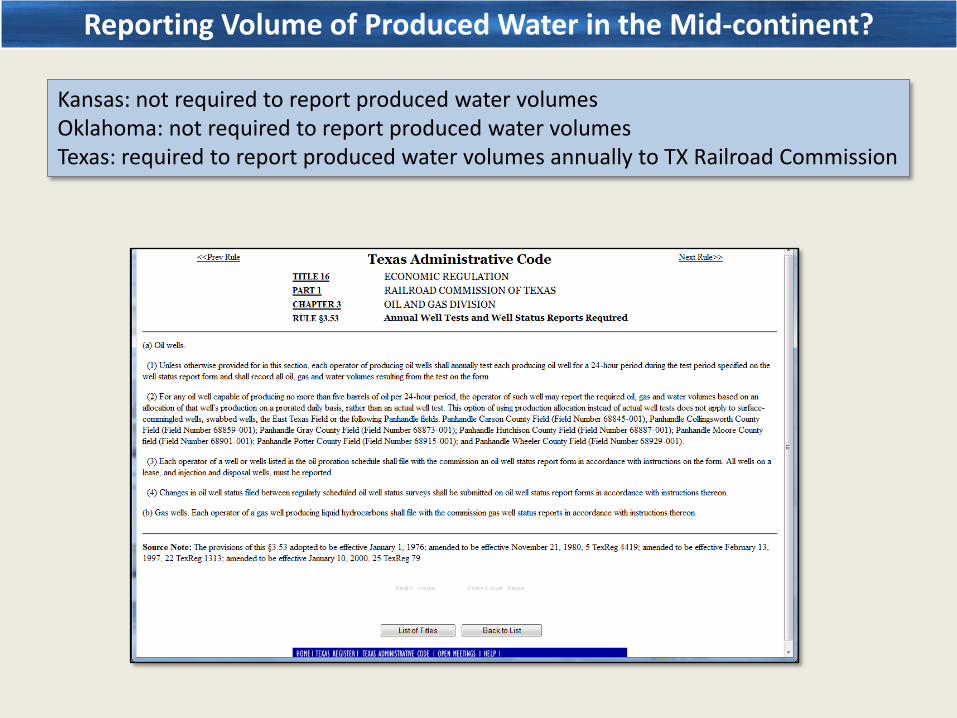
Reporting Volume of Produced Water in the Mid-continent?
Kansas: not required to report produced water volumesOklahoma: not required to report produced water volumesTexas: required to report produced water volumes annually to TX Railroad Commission

From 2000-2011, newly completed wells in OK’s Mississippian averaged:• 7.4 bbl of H2O produced for 1 bbl of oil• 9.8 bbl of H2O produced for 1 bbl oil equivalent gas
(Murray, 2013)
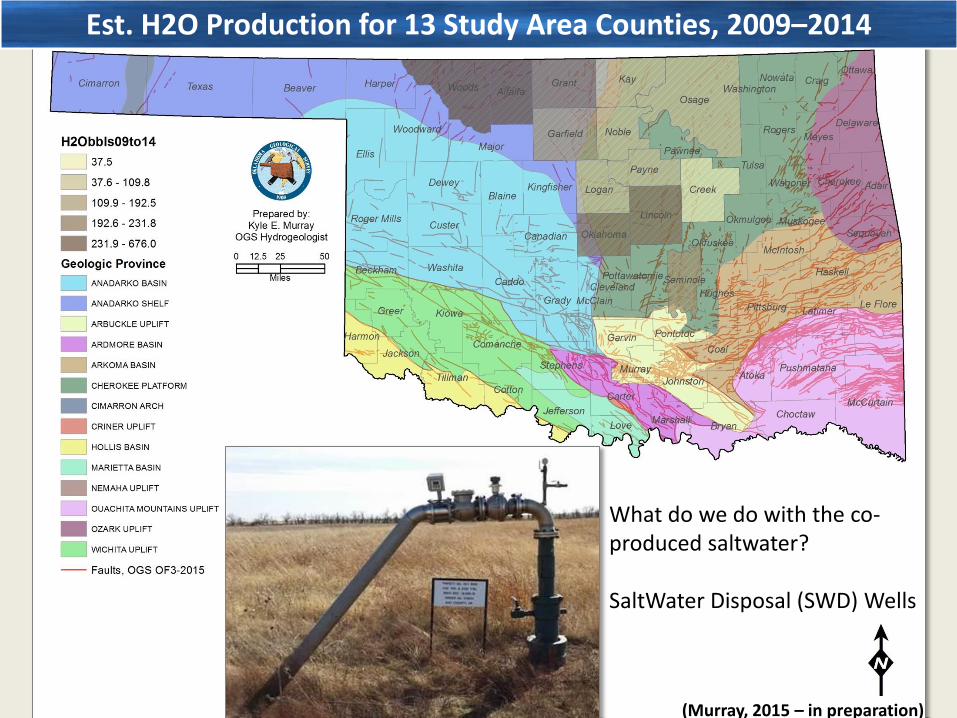
Est. H2O Production for 13 Study Area Counties, 2009–2014
What do we do with the co-produced saltwater?
SaltWater Disposal (SWD) Wells
(Murray, 2015 – in preparation)
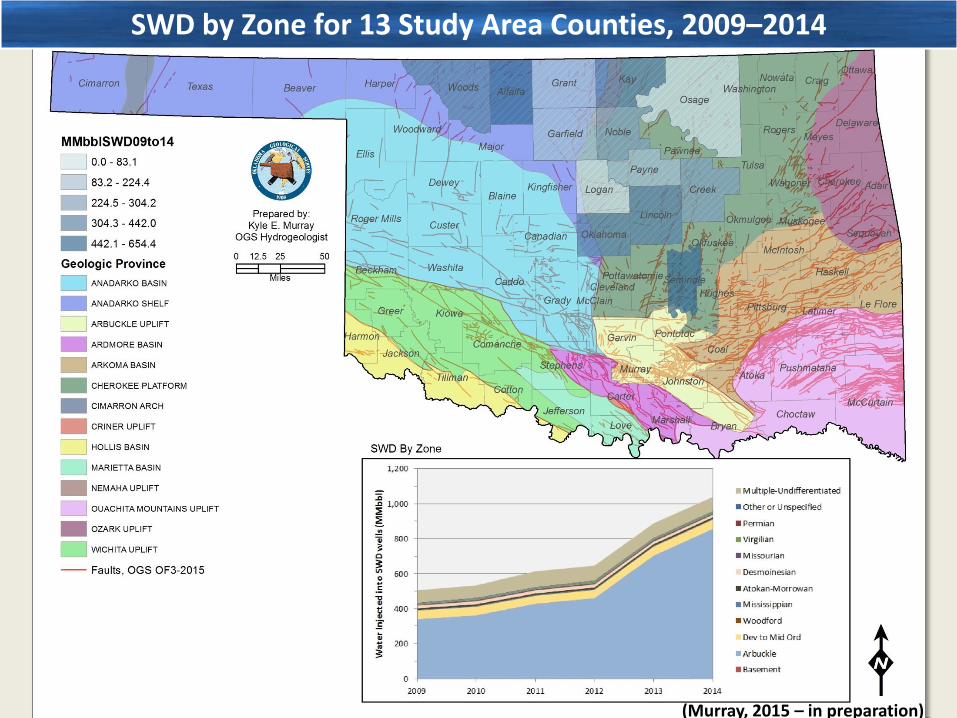
SWD by Zone for 13 Study Area Counties, 2009–2014
(Murray, 2015 – in preparation)
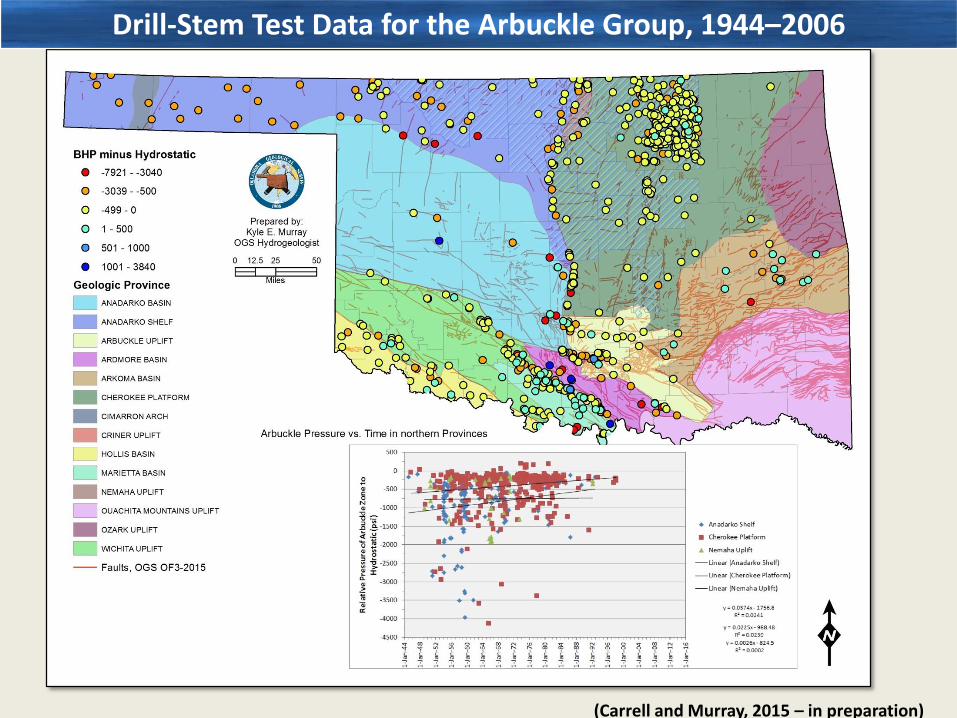
Drill-Stem Test Data for the Arbuckle Group, 1944–2006
(Carrell and Murray, 2015 – in preparation)
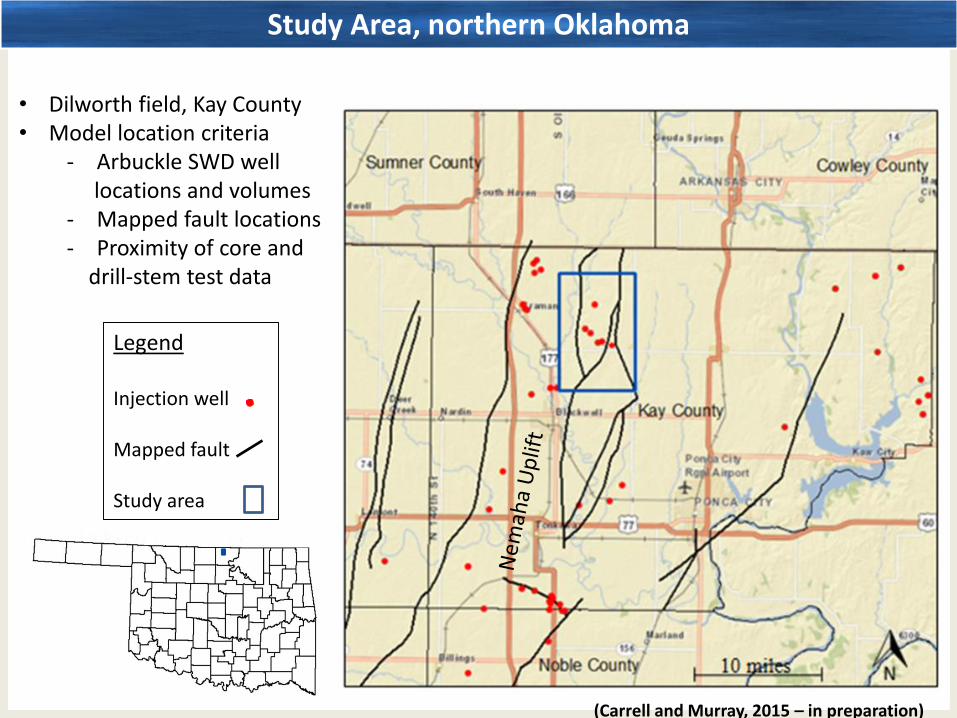
• Dilworth field, Kay County• Model location criteria
- Arbuckle SWD well locations and volumes
- Mapped fault locations- Proximity of core and
drill-stem test data
Legend
Injection well
Mapped fault
Study area
Study Area, northern Oklahoma
(Carrell and Murray, 2015 – in preparation)

Legend
OPIC core
DST location
OGS core plugs
Model area
Wellington field study
30 miles
KSOK
Hydraulic Properties
(Carrell and Murray, 2015 – in preparation)

Cross-Section Through Dilworth Field, Kay County, OK
(Carrell and Murray, 2015 – in preparation)
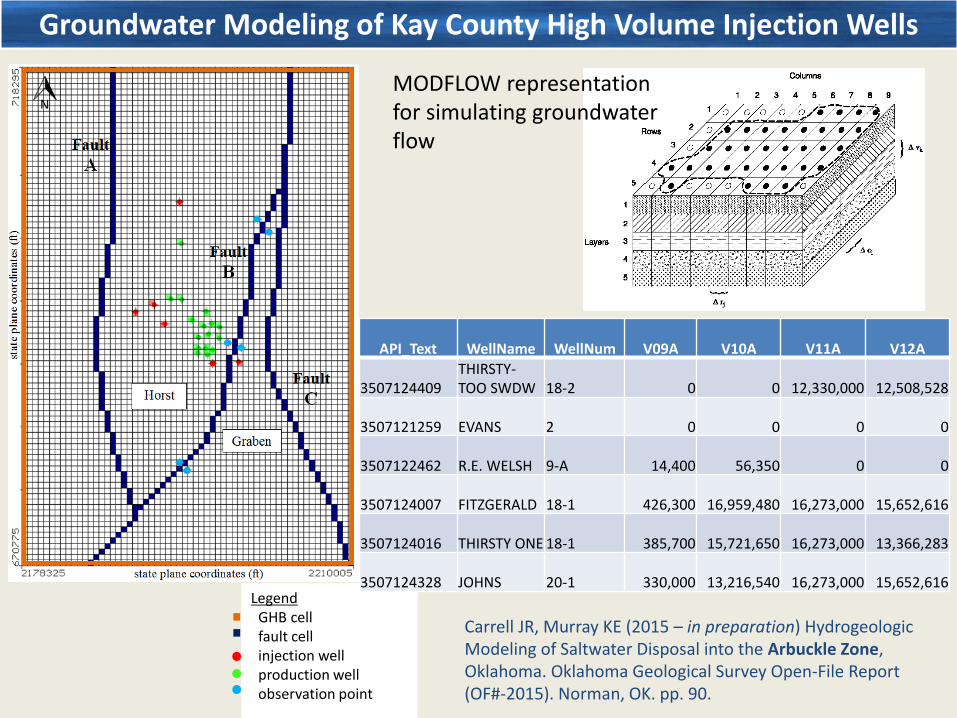
LegendGHB cellfault cellinjection wellproduction wellobservation point
Groundwater Modeling of Kay County High Volume Injection Wells
API_Text WellName WellNum V09A V10A V11A V12A
3507124409THIRSTY-TOO SWDW 18-2 0 0 12,330,000 12,508,528
3507121259 EVANS 2 0 0 0 0
3507122462 R.E. WELSH 9-A 14,400 56,350 0 0
3507124007 FITZGERALD 18-1 426,300 16,959,480 16,273,000 15,652,616
3507124016 THIRSTY ONE 18-1 385,700 15,721,650 16,273,000 13,366,283
3507124328 JOHNS 20-1 330,000 13,216,540 16,273,000 15,652,616
Carrell JR, Murray KE (2015 – in preparation) Hydrogeologic Modeling of Saltwater Disposal into the Arbuckle Zone, Oklahoma. Oklahoma Geological Survey Open-File Report (OF#-2015). Norman, OK. pp. 90.
MODFLOW representationfor simulating groundwaterflow

1: Injection into Arbuckle w/ coincident production from Arbuckle
2: Injection into Arbuckle w/o coincident production from Arbuckle
3: Injection into Arbuckle w/ various hydraulic properties for Fault B
4: Injection into Arbuckle at various distances from Fault B
5: Injection into wells w/ commingled completions in Arbuckle and Simpson Groups
6: Injection into Precambrian Basement
7: Injection into different Arbuckle intervals
8: Injection into dense, unfractured Arbuckle dolomite
9: Injection into Arbuckle at various rates
Simulated Injection Scenarios
(Carrell and Murray, 2015 – in preparation)
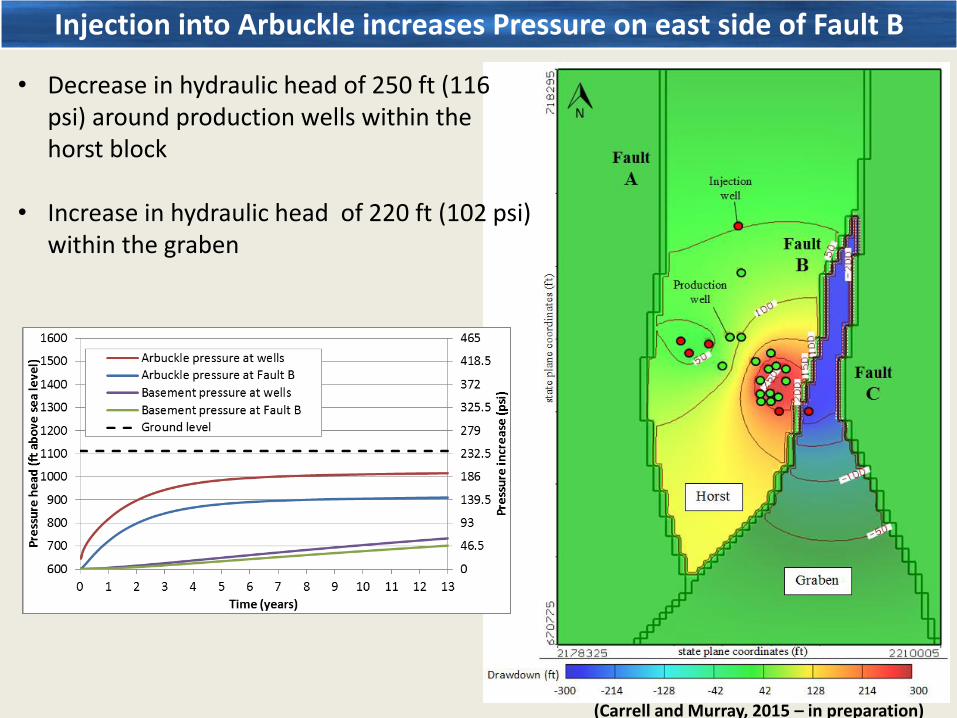
• Decrease in hydraulic head of 250 ft (116 psi) around production wells within the horst block
• Increase in hydraulic head of 220 ft (102 psi) within the graben
Injection into Arbuckle increases Pressure on east side of Fault B
(Carrell and Murray, 2015 – in preparation)
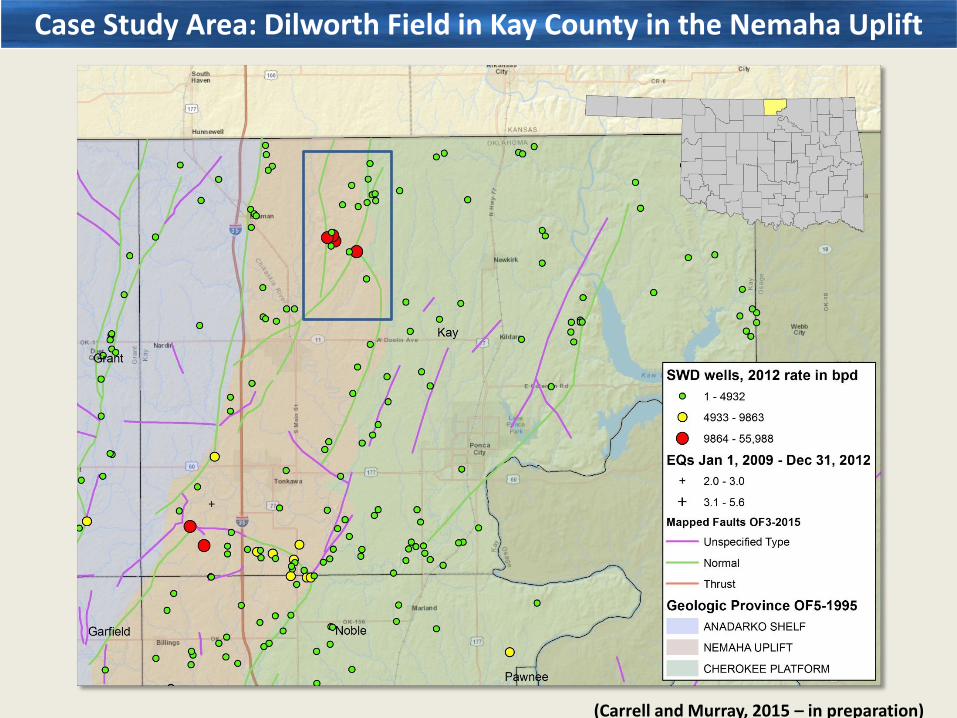
Case Study Area: Dilworth Field in Kay County in the Nemaha Uplift
(Carrell and Murray, 2015 – in preparation)
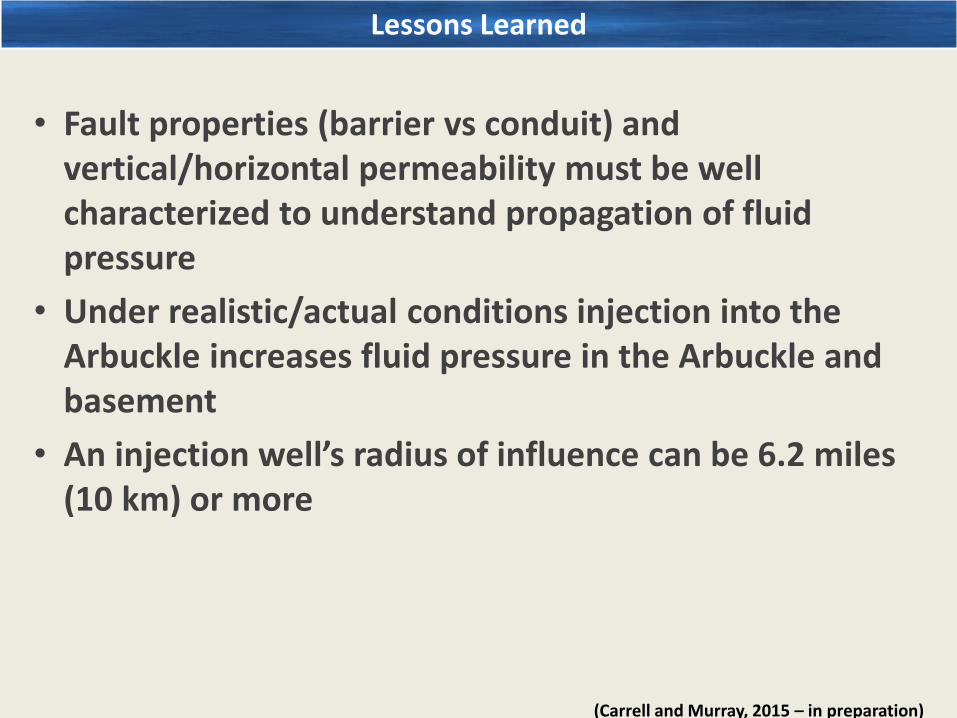
Lessons Learned
• Fault properties (barrier vs conduit) and vertical/horizontal permeability must be well characterized to understand propagation of fluid pressure
• Under realistic/actual conditions injection into the Arbuckle increases fluid pressure in the Arbuckle and basement
• An injection well’s radius of influence can be 6.2 miles (10 km) or more
(Carrell and Murray, 2015 – in preparation)
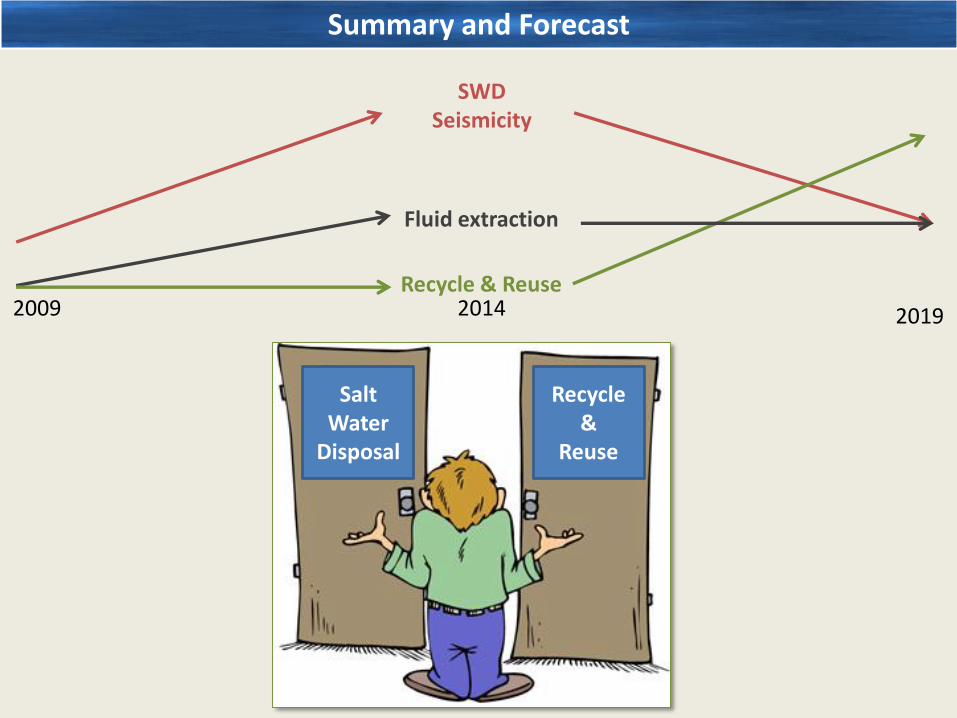
Recycle&
Reuse
SaltWater
Disposal
Summary and Forecast
SWDSeismicity
Fluid extraction
20142009 2019
Recycle & Reuse

Email: [email protected]: http://faculty-staff.ou.edu/M/Kyle.E.Murray-1/Phone: (405) 325-7502

Map of Earthquakes Mag >=2.8 since Jan 1, 2009
(Murray, 2015 – in preparation)