Modeling of microscale variations in methane fluxes Anu Kettunen Jan 17th, 2003.
14
Modeling of microscale variations in methane fluxes Anu Kettunen Jan 17th, 2003
-
Upload
eugene-berry -
Category
Documents
-
view
215 -
download
0
Transcript of Modeling of microscale variations in methane fluxes Anu Kettunen Jan 17th, 2003.

Modeling of microscale variations in methane fluxes
Anu Kettunen
Jan 17th, 2003

2
Solar energy and cycling of elements

3
Natural green house phenomenon• Atmosphere surface
temperature of Earth ca 30oC higher than without atmosphere
• Green house gases prevent Solar energy from escaping from Earth
• H2O, CO2, CH4, N2O, CFC compounds

4
Human activities
• Use of fossil fuel etc. human actions increase green house gas concentrations = enhances green house phenomenon climate change
Indicators of the Human Influenceon the Atmosphere during the Industrial Era
Robert T. Watson, IPCC chair
5
Future climate
• On average warmer
• Regional differences
• Precipitation patterns
• Likelihood for extreme events (drought, storms) increases

6
Mires• Northern mires carbon
sinks during last millenia, huge amount of carbon in peat
• Sources of green house gases (CO2 ja CH4)
• Important to understand role of mires in carbon cycle
7
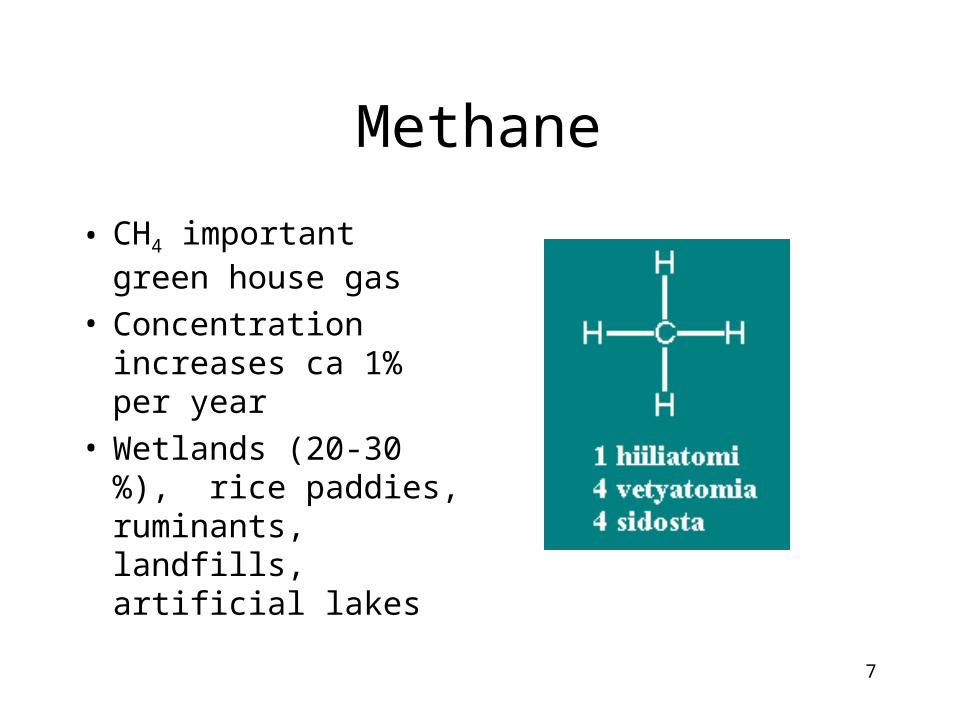
Methane
• CH4 important green house gas
• Concentration increases ca 1% per year
• Wetlands (20-30 %), rice paddies, ruminants, landfills, artificial lakes
8
Research problem
• Previously no satisfactory description of spatial and seasonal variations in methane fluxes
• Growing season measurument: CH4, T, WT etc. from different mire surfaces
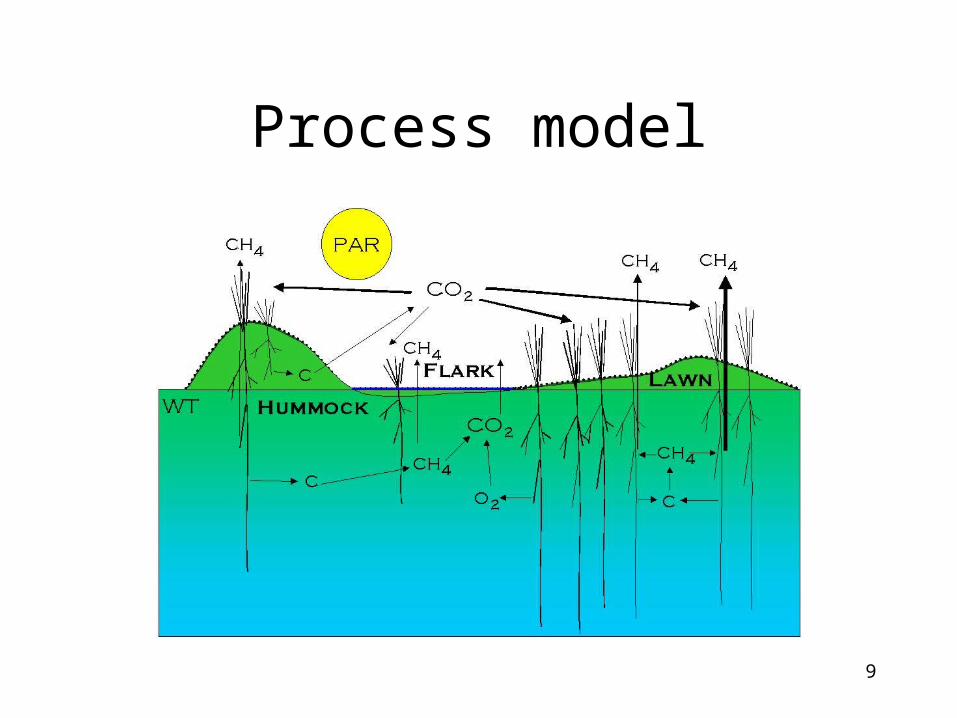
• Methane production and oxidaton potentials• Process model connects methane flux to
vegetation cover, photosynthetic cycle and peat thermal and moisture conditions
9
Process model

10
Model predictions
a. Carex lawn A
-400
-200
0
200
400
600
800
6-May 5-Jun 5-Jul 4-Aug 3-Sep 3-OctFlu
x, m
g C
H4
m-2
d-1
-40
-20
0
20
40
60
80
Wat
er t
able
,cm
fro
m p
eat
surf
ace
b. Flark B
-400
-200
0
200
400
600
800
6-May 5-Jun 5-Jul 4-Aug 3-Sep 3-OctFlu
x, m
g C
H4
m-2
d-1
-40
-20
0
20
40
60
80
Wat
er t
able
,cm
fro
m p
eat
surf
ace
c. Eriophorum lawn A
-400
-200
0
200
400
600
800
6-May 5-Jun 5-Jul 4-Aug 3-Sep 3-OctFlu
x, m
g C
H4
m-2
d-1
-40
-20
0
20
40
60
80
Wat
er t
able
,cm
fro
m p
eat
surf
ace
d. Lawn-low hummock B
-400
-200
0
200
400
600
800
6-May 5-Jun 5-Jul 4-Aug 3-Sep 3-OctFlu
x, m
g C
H4
m-2
d-1
-40
-20
0
20
40
60
80
Wat
er t
able
, cm
fro
m p
eat
surf
ace
e. Hummock A
-400
-200
0
200
400
600
800
6-May 5-Jun 5-Jul 4-Aug 3-Sep 3-OctFlu
x, m
g C
H4
m-2
d-1
-40
-20
0
20
40
60
80
Wat
er t
able
, cm
fro
m p
eat
surf
ace
f. Hummock B
-400
-200
0
200
400
600
800
6-May 5-Jun 5-Jul 4-Aug 3-Sep 3-OctFlu
x, m
g C
H4
m-2
d-1
-40
-20
0
20
40
60
80
Wat
er t
able
,cm
fro
m p
eat
surf
ace

11
Fresh carbon, NPP and T
0
500
1000
1500
2000
2500
3000
3500
4000
4500
6-May 26-May 15-Jun 5-Jul 25-Jul 14-Aug 3-Sep 23-Sep 13-Oct
Flu
x,
mg
CH
4 m
-2 d
-1
a.
• Model sensitive to fresh carbon
• If T ja CO2 NPP substrate CH4
• If only T CH4 less
0
100
200
300
400
500
600
700
800
6-May 26-May 15-Jun 5-Jul 25-Jul 14-Aug 3-Sep 23-Sep 13-Oct
Flu
x,
mg
CH
4 m
-2 d
-1
(T&GPP)-2
(T&GPP)+2
T+2
T-2

12
Transport of oxygen to peat
• The more sedges transport oxygen to peat, the lower the CH4 flux
• If methane oxidation CH4
0
100
200
300
400
500
600
700
800
6-May 26-May 15-Jun 5-Jul 25-Jul 14-Aug 3-Sep 23-Sep 13-Oct
Flu
x,
mg
CH
4 m
-2 d
-1
c.
Change in transport capacity of sedges

13
The effect of drought
• Long dry periods methanogens CH4
• If > 4-6 week drought, no recovery even after rains come
0
100
200
300
400
500
600
700
800
6-May 26-May 15-Jun 5-Jul 25-Jul 14-Aug 3-Sep 23-Sep 13-Oct
Flu
x,
mg
CH
4 m
-2 d
-1
8 wk
6 wk4 wk
2 wk
14
Main contribution of the thesis• Simulation model for CH4 fluxes from
different mire surfaces CH4 fluxes from boreal mires can be predicted under current and future climate
• Increased understanding
• Connection to general circulation models