Modeling of Fluid Flow and Heat Transfer in a Pre-salt Oil Production...
7
MODELING OF FLUID FLOW AND HEAT TRANSFER IN A PRE-SALT OIL PRODUCTION WELL Thomas Eduardt Hafemann, [email protected] Universidade Federal de Santa Catarina, Florianópolis, SC Marcus Vinicius Duarte Ferreira, [email protected] PETROBRAS/CENPES, Rio de Janeiro, RJ Jader Riso Barbosa Jr., [email protected] Universidade Federal de Santa Catarina, Florianópolis, SC Alexandre Kupka da Silva, [email protected] Universidade Federal de Santa Catarina, Araranguá, SC Abstract. Wellhead temperature increase in offshore wells has become a serious problem in harsh scenarios (e.g., high-pressure, high-temperature reservoirs) where there is great potential for high hydrocarbon flow rate production. As the high-temperature reservoir fluid flows through the tubing string towards the wellhead, the entire borehole is heated. As a result of the radial temperature gradients, the fluid pressure within the sealed annular space between tubes increases, leading to a well integrity failure scenario known as annular pressure build up (APB). This paper addresses the hydraulic and thermal behavior of a typical pre-salt oil production well aiming to better characterize the occurrence of APB for typical operational conditions. For that, one-dimensional forms of the momentum and energy equations are solved simultaneously to determine the local pressure and enthalpy of the multiphase mixture along the well. The thermodynamic and transport properties of the 24-component mixture considered were calculated using Multiflash 4.2, which was solved together with the momentum and energy equations to determine the local vapor mass fraction and the equilibrium temperature. Additionally, a thermal resistance network was used to model the heat transfer in the radial direction in the concentric multi-layered well geometry. Boundary conditions were defined based on the geothermal gradient and the hydrocarbon flow rate at the bottom hole. A sensitivity analysis was conducted to evaluate the effect of annular fluid (i.e., water based or oil based fluid) and gas/oil ratio (GOR) on the annular fluid temperature and pressure profile. Results show that the annular pressure is strongly affected by the annular fluid used, which also played an important role in the overall thermal resistance. Similarly, the GOR also highly influenced the fluid flow pressure drop in the tubing. Keywords: pre-salt, multiphase flow model, annular pressure buildup, wellbore heat transfer 1. INTRODUCTION Heat transfer issues in offshore wells have become more relevant in recent years with the exploration of high- pressure, high-temperature reservoirs. New production scenarios present challenges related to flow assurance, well drilling, completion and workover. For instance, the pre-salt area in the Santos basin is characterized by water columns up to 2300 m deep and target depths greater than 5000 m, with salt layers reaching thicknesses of 2500 m. The large light-oil reservoirs (28 to 32 degrees API) in the pre-salt region have typical pressures of 60 MPa and temperatures up to 373 K. Extreme depths, pressures and temperatures pose additional difficulties to casing design. The phenomenon known as annular pressure build up (APB)the undesirable pressure increase caused by the thermal expansion of the fluid trapped in the annulus due to heat transfer from the reservoir fluid flowing in the wellboreis one of the main issues during well construction and production given its potential catastrophic consequences to the well integrity. Several strategies to mitigate APB have been discussed in the literature (Leach and Adams, 1993; Vargo et al., 2002; Williamson et al., 2003; Moe and Erpelding, 2005). Hasan and Kabir (2002, 2012) reviewed the early literature on wellbore heat transfer, starting from the models for single-phase flow in wells and the analytical approaches for calculating the temperature distribution adjacent to the well as a function of depth and time (Ramey, 1962). More recent studies have incorporated two-phase flow phenomena, variable physical properties and other effects, such as the change in kinetic energy and the Joule-Thomson coefficient into their models (Alves et al., 1992; Hasan and Kabir, 1994; Stone et al., 2002; Pourafshary et al., 2009). This paper advances the development of models for a pre-salt production well while taking into account the thermal-hydraulic effects in the tubing and the thermal properties of the annulus, cement, casing and adjacent rock formation. The pressure and temperature of the flowing fluid are calculated via a one-dimensional two-phase flow model. Phase equilibrium and physical properties of the 24-component mixture are calculated via the commercial package Multiflash ™ , which has been coupled with the in-house well model implemented on Matlab ® . Radial heat transfer is modeled via a thermal resistance network approach for the concentric multistring well geometry. While the ultimate objective of the model is to simulate the well conditions leading to the buildup of pressure in the annulus, in this paper, a sensitivity analysis is conducted to evaluate the effect of annular fluid type (water based or oil based fluid) and gas/oil ratio (GOR) on the annular fluid temperature and pressure profile.
Transcript of Modeling of Fluid Flow and Heat Transfer in a Pre-salt Oil Production...
MODELING OF FLUID FLOW AND HEAT TRANSFER IN A PRE-SALT
OIL PRODUCTION WELL
Thomas Eduardt Hafemann, [email protected] Universidade Federal de Santa Catarina, Florianópolis, SC
Marcus Vinicius Duarte Ferreira, [email protected] PETROBRAS/CENPES, Rio de Janeiro, RJ
Jader Riso Barbosa Jr., [email protected] Universidade Federal de Santa Catarina, Florianópolis, SC
Alexandre Kupka da Silva, [email protected] Universidade Federal de Santa Catarina, Araranguá, SC
Abstract. Wellhead temperature increase in offshore wells has become a serious problem in harsh scenarios (e.g.,
high-pressure, high-temperature reservoirs) where there is great potential for high hydrocarbon flow rate production.
As the high-temperature reservoir fluid flows through the tubing string towards the wellhead, the entire borehole is
heated. As a result of the radial temperature gradients, the fluid pressure within the sealed annular space between
tubes increases, leading to a well integrity failure scenario known as annular pressure build up (APB). This paper
addresses the hydraulic and thermal behavior of a typical pre-salt oil production well aiming to better characterize the
occurrence of APB for typical operational conditions. For that, one-dimensional forms of the momentum and energy
equations are solved simultaneously to determine the local pressure and enthalpy of the multiphase mixture along the
well. The thermodynamic and transport properties of the 24-component mixture considered were calculated using
Multiflash 4.2, which was solved together with the momentum and energy equations to determine the local vapor mass
fraction and the equilibrium temperature. Additionally, a thermal resistance network was used to model the heat
transfer in the radial direction in the concentric multi-layered well geometry. Boundary conditions were defined based
on the geothermal gradient and the hydrocarbon flow rate at the bottom hole. A sensitivity analysis was conducted to
evaluate the effect of annular fluid (i.e., water based or oil based fluid) and gas/oil ratio (GOR) on the annular fluid
temperature and pressure profile. Results show that the annular pressure is strongly affected by the annular fluid used,
which also played an important role in the overall thermal resistance. Similarly, the GOR also highly influenced the
fluid flow pressure drop in the tubing.
Keywords: pre-salt, multiphase flow model, annular pressure buildup, wellbore heat transfer
1. INTRODUCTION
Heat transfer issues in offshore wells have become more relevant in recent years with the exploration of high-
pressure, high-temperature reservoirs. New production scenarios present challenges related to flow assurance, well
drilling, completion and workover. For instance, the pre-salt area in the Santos basin is characterized by water columns
up to 2300 m deep and target depths greater than 5000 m, with salt layers reaching thicknesses of 2500 m. The large
light-oil reservoirs (28 to 32 degrees API) in the pre-salt region have typical pressures of 60 MPa and temperatures up
to 373 K.
Extreme depths, pressures and temperatures pose additional difficulties to casing design. The phenomenon known
as annular pressure build up (APB)the undesirable pressure increase caused by the thermal expansion of the fluid
trapped in the annulus due to heat transfer from the reservoir fluid flowing in the wellboreis one of the main issues
during well construction and production given its potential catastrophic consequences to the well integrity. Several
strategies to mitigate APB have been discussed in the literature (Leach and Adams, 1993; Vargo et al., 2002;
Williamson et al., 2003; Moe and Erpelding, 2005).
Hasan and Kabir (2002, 2012) reviewed the early literature on wellbore heat transfer, starting from the models for
single-phase flow in wells and the analytical approaches for calculating the temperature distribution adjacent to the well
as a function of depth and time (Ramey, 1962). More recent studies have incorporated two-phase flow phenomena,
variable physical properties and other effects, such as the change in kinetic energy and the Joule-Thomson coefficient
into their models (Alves et al., 1992; Hasan and Kabir, 1994; Stone et al., 2002; Pourafshary et al., 2009).
This paper advances the development of models for a pre-salt production well while taking into account the
thermal-hydraulic effects in the tubing and the thermal properties of the annulus, cement, casing and adjacent rock
formation. The pressure and temperature of the flowing fluid are calculated via a one-dimensional two-phase flow
model. Phase equilibrium and physical properties of the 24-component mixture are calculated via the commercial
package Multiflash™
, which has been coupled with the in-house well model implemented on Matlab®
. Radial heat
transfer is modeled via a thermal resistance network approach for the concentric multistring well geometry. While the
ultimate objective of the model is to simulate the well conditions leading to the buildup of pressure in the annulus, in
this paper, a sensitivity analysis is conducted to evaluate the effect of annular fluid type (water based or oil based fluid)
and gas/oil ratio (GOR) on the annular fluid temperature and pressure profile.

Proceedings of ENCIT 2014 15th Brazilian Congress of Thermal Sciences and Engineering
Copyright © 2014 by ABCM November 10-13, 2014, Belém, PA, Brazil
2. MODELING
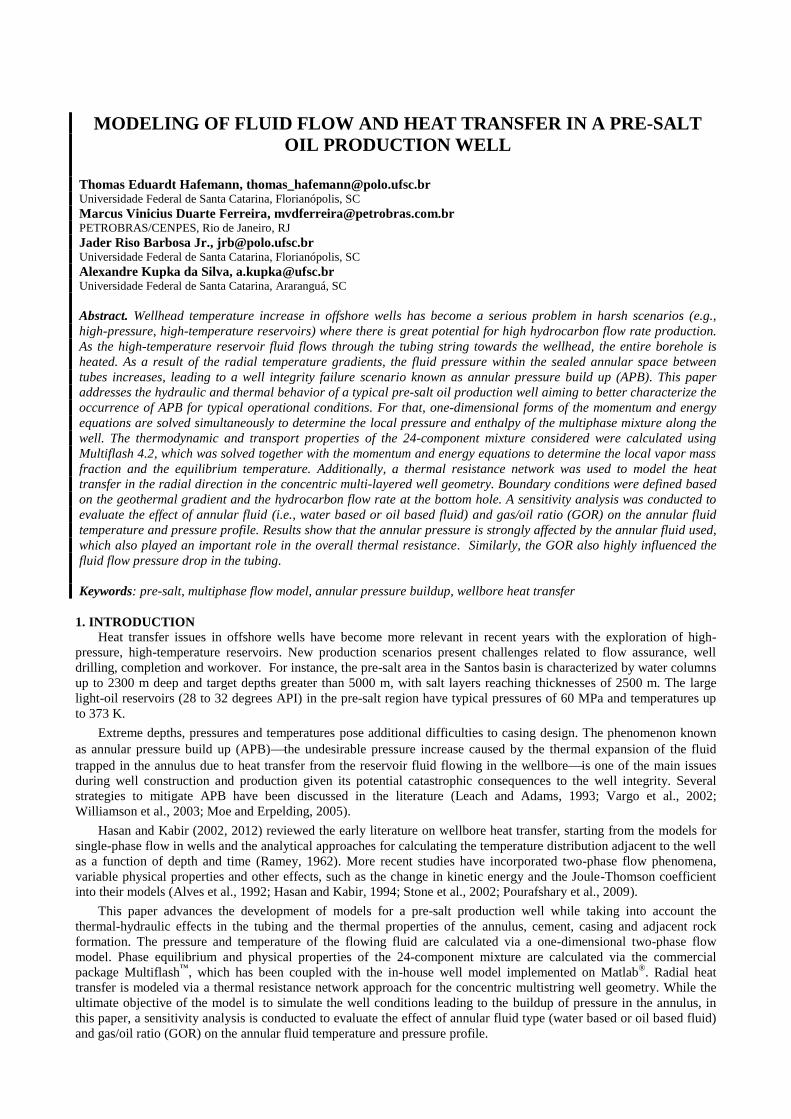
Figure 1 illustrates the basic geometry of the vertical well investigated in this paper. The momentum and energy
balance equations for the steady-state, one-dimensional flow in the tubing are given by (Brill and Mukherjee, 1999;
Hasan and Kabir, 2002):
accgf dz
Pd
dz
Pd
dz
Pd
dz
Pd
(1)
dz
dvvg
GA
Q
dz
hd mm (2)
where P is the pressure, z is the axial distance, and the subscripts f, g and acc define the frictional, gravitational and
acceleration pressure drop, respectively. In addition, g is the acceleration of gravity, h is the enthalpy and Q is the heat
rate per unit length, G is the mass velocity, is the mean velocity and A the transversal area.
Figure 1. Vertical well design presented.
The heat transfer rate in Eq. (2) was computed assuming a one-dimensional heat transfer rate in the radial direction
via a thermal network model. Each layer of the multistring well geometry was modeled as an individual resistance. The
heat transfer rate per unit length was defined based on the total resistance and the overall temperature difference
between the internal flow and the geothermal temperature profile as follows:
ftftto TTUrQ 2 (3)
where Tf and Tft are the fluid and formation temperatures, respectively, and Ut is the overall heat transfer coefficient
given by:
ft
wbftto
cem
cowbto
c
cicoto
rato
to
t
titoto
f
to
t k
rrlnr
k
rrlnr
k
rrlnr
hhr
r
k
rrlnr
h
r
U
1 (4)
where hf and ha are the convection heat transfer coefficients for the fluid in the tubing and in the annular, rti, rto, rci, rco,
rwb, and rft are the tubing and casing inner and outer radius and the wellbore and formation radius. The variables kt, kc,
kcem and kft represent the thermal conductivities of the tubing, casing, cement and formation, and hr is the radiation heat
transfer coefficient.
The heat transfer process from the heated production fluid outwards takes into account conduction, convection and
radiation mechanisms. Thermal capacitance effects have been neglected. The calculation methodology starts by
estimating the initial heat transfer rate, while the convection and radiation resistances are determined based on the
calculated wall temperatures. Then, the total heat transfer rate and the convection resistances are iterated until the
convergence is reached at a given position.
1894 m
Formation
Tubing
5337 m
Annulus
Casing
Cement
Perforations

Proceedings of ENCIT 2014 15th Brazilian Congress of Thermal Sciences and Engineering
Copyright © 2014 by ABCM November 10-13, 2014, Belém, PA, Brazil
The convection heat transfer coefficient for the two-phase flow in the tubing was calculated using the Chen (1963)
correlation, omitting the nucleate boiling contribution. Thus:
Fd
k
k
cμ
μ
x)dG(10.023h l
0.4
l
lp,l
0.8
lf
(5)
where x is the vapor quality, μl is the liquid viscosity, cp,l is the liquid specific heat capacity and kl is the liquid thermal
conductivity. In this correlation, a two-phase enhancement factor, F, has been proposed as a function of the Martinelli
parameter, Xtt, as follows:
102130352
101
173601
1
.XifX..
.XifF
tt
.
tt
tt
(6)
1050901
.
g
l
.
l
g.
ttx
xX
(7)
The thermal resistance in the annulus region was calculated using natural convection and radiation models
presented by Zhou (2013) using fluid properties of annulus fillers like brines or glycerin. The model consisted in
calculating the Rayleigh and Nusselt numbers using appropriate relationships. Once the relationships that compose the
overall heat transfer resistance are defined, the model equations are iterated until convergence is reached for the heat
transfer rate per unit length at a given axial position along the well. As the governing equations are integrated in the z
direction along the entire wellbore length, the temperature profiles in the several regions of the well and the heat
transfer rate per unit length can be finally obtained.
The Hagedorn and Brown separated flow model (Brill and Mukherjee, 1999) was used to determine the two-phase
friction factor, and the slip and non-slip properties (densities) based on the mixture liquid holdup, which is obtained
through four dimensionless groups proposed by Duns and Ros (1963). In order to calculate the total pressure drop, Eq.
(1) was rewritten as follows:
dz
dvvg
d
fv
dz
Pd mmss
s
nm
2
22
(8)
where f is the friction factor, n and s are the so-called non-slip and slip densities, respectively, and d is the inner
tubing diameter.
The Chexal-Lellouche holdup correlation (Chexal et al., 1991) was also implemented in the model. This drift-flux
type correlation is valid for wide ranges of pipe diameter and mass fluxes, having been validated for two-phase flows of
water-steam, water-air and refrigerant mixtures. In this study, the Chexal-Lellouche correlation was used in conjunction
with the Friedel correlation for the frictional pressure gradient two-phase multiplier (Collier and Thome, 1994) given
by:
0350045032
12 243
..lo,ff
foWeFr
AA.A
dz
dP
dz
dP
(9)
where A1, A2, A3 are parameters in the correlation and Fr and We are the Froude and Weber numbers (Collier and
Thome, 1994). In Eq. (9), lo represents the single-phase frictional pressure drop.
The mathematical model was implemented in Matlab®
and solved with a fourth-order Runge-Kutta method. The
phase equilibrium and thermophysical properties of the 24-component reservoir fluid were calculated using
Multiflash™
. The fluid composition was made available by Petrobras. At each control volume, the pressure and
enthalpy, together with the overall composition of the mixture, are used to compute the local equilibrium (bubble-point)
temperature and the vapor quality.
The reservoir temperature and pressure are used as boundary conditions. The total mass flow rate is an input
parameter in the simulations. The pressure drop associated with the perforations at the wellbore casing was obtained
Proceedings of ENCIT 2014 15th Brazilian Congress of Thermal Sciences and Engineering
Copyright © 2014 by ABCM November 10-13, 2014, Belém, PA, Brazil
from an extrapolation of the experimental relationship between the pressure and mass flow rate data made available for
the well evaluated in this work. This allowed the calculation of the bottom-hole pressure. The formation temperature
was initialized based on the geothermal temperature profile.
The pressure buildup in the annular was estimated considering a temperature difference scale given by the
formation temperature calculated using the geothermal temperature gradient and the mean annular temperature
calculated from the local heat transfer rate per unit length. According to Hasan et al. (2009), the pressure increase in the
annular region is a function of the fluid expansion, annular wall deformation and fluid mass conservation as follows:
fa
f
aa
a
V
V
V
VTP
(10)
where, αa is the annular fluid expansibility, κa the annular fluid compressibility, ΔT the difference between the
formation temperature and the calculated mean annular temperature, ΔV is the difference in the annular volume, by
expansion or compression, and ΔVf is the fluid volume variation considering no temperature variation. To simplify the
model adopted, the last two terms of Eq. (10) were neglected by assuming that the well annular space had rigid walls,
with no fluid leakage.
3. CASE STUDY
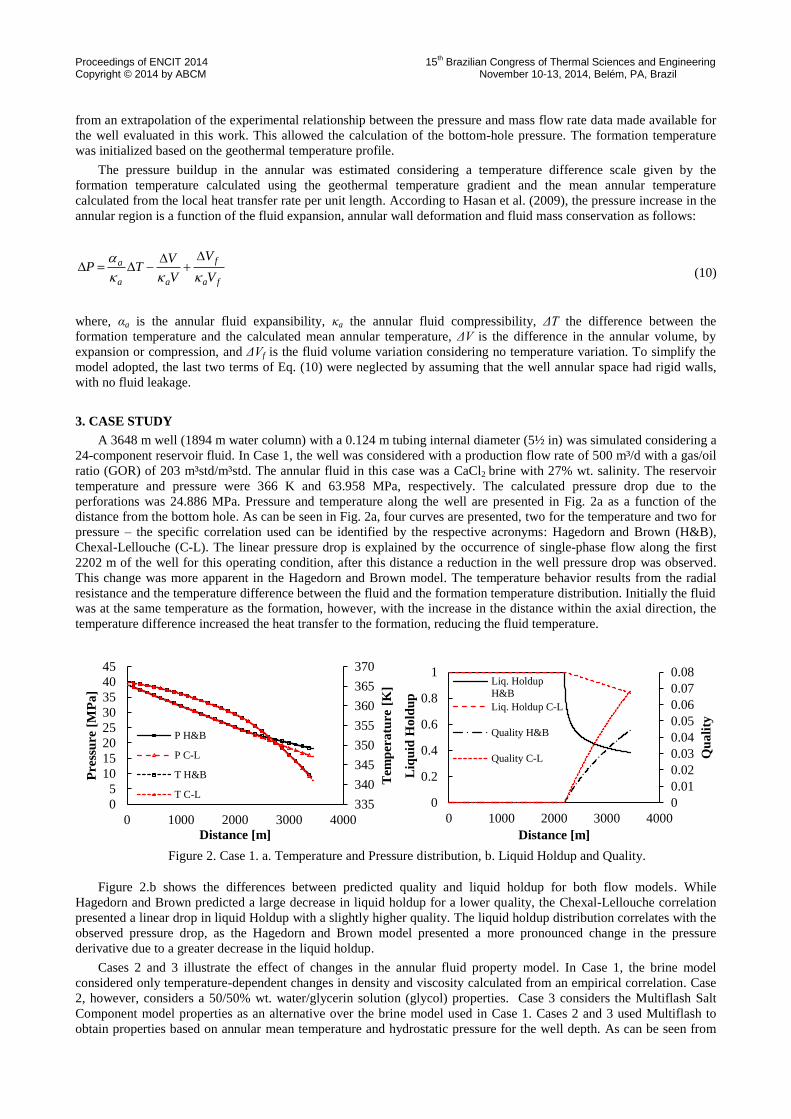
A 3648 m well (1894 m water column) with a 0.124 m tubing internal diameter (5½ in) was simulated considering a
24-component reservoir fluid. In Case 1, the well was considered with a production flow rate of 500 m³/d with a gas/oil
ratio (GOR) of 203 m³std/m³std. The annular fluid in this case was a CaCl2 brine with 27% wt. salinity. The reservoir
temperature and pressure were 366 K and 63.958 MPa, respectively. The calculated pressure drop due to the
perforations was 24.886 MPa. Pressure and temperature along the well are presented in Fig. 2a as a function of the
distance from the bottom hole. As can be seen in Fig. 2a, four curves are presented, two for the temperature and two for
pressure – the specific correlation used can be identified by the respective acronyms: Hagedorn and Brown (H&B),
Chexal-Lellouche (C-L). The linear pressure drop is explained by the occurrence of single-phase flow along the first
2202 m of the well for this operating condition, after this distance a reduction in the well pressure drop was observed.
This change was more apparent in the Hagedorn and Brown model. The temperature behavior results from the radial
resistance and the temperature difference between the fluid and the formation temperature distribution. Initially the fluid
was at the same temperature as the formation, however, with the increase in the distance within the axial direction, the
temperature difference increased the heat transfer to the formation, reducing the fluid temperature.
Figure 2. Case 1. a. Temperature and Pressure distribution, b. Liquid Holdup and Quality.
Figure 2.b shows the differences between predicted quality and liquid holdup for both flow models. While
Hagedorn and Brown predicted a large decrease in liquid holdup for a lower quality, the Chexal-Lellouche correlation
presented a linear drop in liquid Holdup with a slightly higher quality. The liquid holdup distribution correlates with the
observed pressure drop, as the Hagedorn and Brown model presented a more pronounced change in the pressure
derivative due to a greater decrease in the liquid holdup.
Cases 2 and 3 illustrate the effect of changes in the annular fluid property model. In Case 1, the brine model
considered only temperature-dependent changes in density and viscosity calculated from an empirical correlation. Case
2, however, considers a 50/50% wt. water/glycerin solution (glycol) properties. Case 3 considers the Multiflash Salt
Component model properties as an alternative over the brine model used in Case 1. Cases 2 and 3 used Multiflash to
obtain properties based on annular mean temperature and hydrostatic pressure for the well depth. As can be seen from
335
340
345
350
355
360
365
370
0
5
10
15
20
25
30
35
40
45
0 1000 2000 3000 4000
Tem
per
atu
re [
K]
Pre
ssu
re [
MP
a]
Distance [m]
P H&B
P C-L
T H&B
T C-L0
0.01
0.02
0.03
0.04
0.05
0.06
0.07
0.08
0
0.2
0.4
0.6
0.8
1
0 1000 2000 3000 4000
Qu
ali
ty
Liq
uid
Ho
ldu
p
Distance [m]
Liq. Holdup
H&B
Liq. Holdup C-L
Quality H&B
Quality C-L

Proceedings of ENCIT 2014 15th Brazilian Congress of Thermal Sciences and Engineering
Copyright © 2014 by ABCM November 10-13, 2014, Belém, PA, Brazil
Fig. 3, the annular fluid played an important role in the global thermal resistance, which affected the flowing fluid
temperature. The pressure distribution, on the other hand, was not significantly affected.
Figure 3. a. Temperature of the fluid in the tubing, b. Pressure distribution in the tubing.
The average annulus temperatures for the three cases considered are presented in Fig. 4a. As shown in Fig. 4a, the
formation temperature decrease observed in the salt layer region is much smaller than above this region, and this
prescribed temperature profile has a visible influence on the average temperature in the annulus producing a visible
slope change around ~ 2000 m. As the figure shows, Case 1 (Brine) presents the lowest annular temperatures when
compared with the glycerin based fluid (Case 2) and the Salt Component model (Case 3), which can be associated with
a higher heat transfer resistance. The Salt Component model, considering a salinity of 27 wt%, resulted in the highest
temperature distribution of the cases simulated, as a result of a smaller thermal resistance. This also resulted in a slightly
lower temperature in the tubing as presented in Fig. 3.a. This behavior can also be observed as a result of a higher heat
flux, as presented in Fig. 4b.
Figure 4. a. Annular mean temperature, b. Radial Heat flux for different cases and models.
Another important effect was that of the Gas-Oil-Ratio (GOR) on the well pressure and temperature
distribution. Figure 5.a illustrates the effect of the reservoir fluid GOR on the pressure for the Salt Component model.
Three GOR values were considered: 500, 750 and 1000m³std/m³std. It should be noted that the Salt Component model
reduces the pressure drop along the well, due to the change in density and viscosity of the mixture. For the Hagedorn
and Brown model, increasing GOR above 750 produces no significant changes, as this model tends to predict a higher
liquid holdup fraction (Fig. 5a). The Chexal-Lellouche, shown in Fig. 5.b, produced the more perceptible change in
pressure for different GOR’s. Only the Salt Component model results are presented, as the other cases produced similar
trends.
325330335340345350355360365370
0 1000 2000 3000 4000
Tem
per
atu
re [
K]
Distance [m]
Brine H&B
Brine C-L
Glycerin H&B
Glycerin C-L
SaltCo H&B
SaltCo C-L0
5
10
15
20
25
30
35
40
0 1000 2000 3000 4000
Pre
ssu
re [
MP
a]
Distance [m]
Brine H&D
Brine C-L
Glycerin H&B
Glycerin C-L
SaltCo H&B
SaltCo C-L
320
330
340
350
360
370
0 1000 2000 3000 4000
Tem
per
atu
re[K
]
Distance [m]
Brine H&B
Brine C-L
Glycerin H&B
Glycerin C-L
SaltCo H&B
SaltCo C-L0
50
100
150
200
250
0 1000 2000 3000 4000
Hea
t F
lux [
W/m
]
Distance [m]
Brine H&B
Brine C-L
Glycerin H&B
Glycerin C-L
SaltCo H&B
SaltCo C-L

Proceedings of ENCIT 2014 15th Brazilian Congress of Thermal Sciences and Engineering
Copyright © 2014 by ABCM November 10-13, 2014, Belém, PA, Brazil
Figure 5.Pressure distribution for different GOR for a. Hagedorn and Brown, b. Chexal-Lellouche.
The liquid holdup distribution for both correlations is presented in Fig. 6. With the increase of the GOR, the
Hagedorn and Brown liquid holdup distribution decreases more steeply with distance, leveling off at values between 0.3
and 0.4. The Chexal-Lellouche correlation, in contrast, gives a higher liquid holdup distribution. Both models predicted
an early occurrence of the transition to two-phase flow as a direct result of the increase in the GOR.
Figure 6. a. Hagedorn and Brown liquid holdup distribution, b. Chexal-Lellouche liquid holdup distribution.
The annular pressure buildup and annular temperature are presented in Fig. 7. While the annular temperature
showed a small variation for different annular fluids, the annular pressure buildup for the Salt Component fluid model
was almost five times higher than the obtained for the Glycerin fluid model. This behavior is related to the fluid
properties, compressibility and expansibility, and the heat transfer in annular. As presented in Fig. 4.b, the higher heat
flux presented for the Salt Component model contributed to the annular heating, while the glycerin based fluid had a
slightly lower temperature distribution as a result from a higher thermal resistance.
Figure 7.Annular pressure buildup and annular mean temperature distribution.
4. CONCLUSIONS
The development of a thermal-hydraulic model for a pre-salt production well, based on two different fluid flow
models, has been presented in this paper. Two-phase flow in the production tubing has been calculated together with
15
20
25
30
35
40
0 1000 2000 3000 4000
Pre
ssu
re [
MP
a]
Distance [m]
GOR 203 SaltCo H&B
GOR 500 SaltCo H&B
GOR 750 SaltCo H&B
GOR 1000 SaltCo H&B15
20
25
30
35
40
0 1000 2000 3000 4000
Pre
ssu
re [
MP
a]
Distance [m]
GOR 203 SaltCo C-L
GOR 500 SaltCo C-L
GOR 750 SaltCo C-L
GOR 1000 SaltCo C-L
0
0.2
0.4
0.6
0.8
1
0 1000 2000 3000 4000
Liq
uid
Ho
ldu
p
Distance [m]
GOR 203 SaltCo
GOR 500 SaltCo
GOR 750 SaltCo
GOR 1000 SaltCo
0
0.2
0.4
0.6
0.8
1
0 1000 2000 3000 4000
Liq
uid
Ho
ldu
p
Distance [m]
GOR 203 SaltCo
GOR 500 SaltCo
GOR 750 SaltCo
GOR 1000 SaltCo
320
325
330
335
340
345
350
355
360
365
370
0
10
20
30
40
50
60
0 1000 2000 3000 4000
Tem
per
atu
re [
K]
Pre
ssu
re [
MP
a]
Distance [m]
APB SaltCo H&B
APB SaltCo C-L
APB Glycerin H&B
APB Glycerin C-L
Temperature SaltCo H&B
Temperature SaltCo C-L
Temperature Glycerin
H&BTemperature Glycerin C-L

Proceedings of ENCIT 2014 15th Brazilian Congress of Thermal Sciences and Engineering
Copyright © 2014 by ABCM November 10-13, 2014, Belém, PA, Brazil
phase equilibrium in the 24-component reservoir fluid. The heat transfer model took into account the thermal properties
of the annulus fluid, cement, casing and adjacent rock formation. Pressure and temperature profiles along the well were
investigated for typical operating conditions, extrapolated from experimental data obtained from an evaluation of the
well production rate.
The increase in the dissolved gas context in the form of larger GOR values showed a great influence on the
transition to two-phase flow, which resulted in a slight reduction of the pressure drop along the well. The type of fluid
in the annular space showed some influence on the radial heat transfer and, as a result, on the properties of the
production fluid. The annular pressure buildup was highly influenced by the annular fluid properties. Although both
fluids evaluated are based on aqueous solutions, the Glycerin fluid presented an improved control of the APB problem.
The Salt Component model available in Multiflash showed good agreement with experimental results obtained by Yang
et al. (2013), and showed better results when compared to the simplified Brine model, which is based on lookup tables
for formation water.
5. REFERENCES
Alves, I.N., Alhanati, F.J.S. e Shoham, O., A unified model for predicting flowing temperature distribution in wellbores
and pipelines, SPEPE 7 (6), 363-367, 1992.
Brill, J. P. and Mukherjee, H., Multiphase flow in wells, Society of Petroleum Engineers, Richardson, Texas, 1999.
Chexal, B., Lellouche, G., Horowitz, J., Healzer, J., Oh, S., The Chexal-Lellouche Void Fraction Correlation for
Generalized Applications, Final Report NSAC-139, Nuclear Safety Analysis Center, Electric Power Research
Institute, USA.
Collier, J.G., Thome, J.R., Convective Boiling and Condensation. 3rd Edition, Oxford University Press, 1994.
Hagoort, J., An analytical model for predicting the productivity of perforated wells. Journal of Petroleum Science and
Engineering, 56(4), pp.199–218, 2007.
Duns, H. Jr. and Ros, N. C. J., Vertical flow of gas and liquid mixtures in wells, Proc., Sixth World Pet. Cong., Tokyo,
1963.
Hasan, A.R. and Kabir, C.S., Aspects of heat transfer during two-phase flow in wellbores, SPEPF, 9 (3), 211-216, 1994.
Hasan, A.R. and Kabir, C.S., Fluid flow and heat transfer in wellbores, Society of Petroleum Engineers, Richardson,
Texas, 2002.
Hasan, A.R., Minnesota-duluth, U., Izgec, B., Kabir, C. S., Ensuring Sustained Production by Managing Annular-
Pressure Buildup, Society of Petroleum Engineers, SPE121754, 2009.
Hasan, A. R. and Kabir, C.S., Wellbore heat-transfer modeling and applications. Journal of Petroleum Science and
Engineering, 86-87, pp.127–136, 2012.
Moe B. and Erpelding, P., Annular Pressure Builup: what it is and what to do about it, Deepwater Technology Journal,
August, 2000.
Pourafshary, P., Varavei, A., Sepehrnoori, K., Podio, A.L., A compositional wellbore/reservoir simulator to model
multiphase flow and temperature distribution.Journal of Petroleum Science and Engineering 69 (1–2), 40–52 Nov,
2009.
Ramey Jr., H.J., Wellbore heat transmission, Journal of Petroleum Technology, 14 (4), 427-435, Trans., AIME, 225,
1962.
Stone, T.W., Bennett, J., Law, D.H.-S., Holmes, J.A., Thermal simulation with multisegment wells, SPE Paper 78131.
SPE Res EvalEng 5 (3), 206–218 June, 2002.
Yang, J., Tang, H., Liu, Z., Yang, L., Huang, X., Yan, D., Tian, R., Prediction model of casing annulus pressure for
deepwater well drilling and completion operation, Petroleum Exploration and Development, 40(5), pp.661–664,
2013.
Zhou, F., Research on Heat Transfer in Geothermal Wellbore and Surroundings, Berlin: TechnischenUniversität Berlin,
Thesis,2013.
6. RESPONSIBILITY NOTICE
The authors are the only responsible for the printed material included in this paper.