Modeling of conductivity versus density behavior in green ...
13
Modeling of conductivity versus density behavior in green-state powder metallurgy compacts Georg Leuenberger, Reinhold Ludwig and Diran Apelian* Powder Metallurgy Research Center (PMRC) Department of Electrical and Computer Engineering *Metal Processing Institute Worcester Polytechnic Institute Worcester, MA 01609 USA Submitted: April 2002 Revised: December 2002 ABSTRACT Ongoing research at Worcester Polytechnic Institute (WPI) has recently resulted in the development of an electrostatic multi-pin instrument capable of testing green-state compacts directly following compaction. By monitoring a steady electric current flow through the sample and recording the voltages over the surface valuable information is gathered, leading to the prediction of the structural health of the green- state parts. While our prior work concentrated on the detection of surface-breaking and subsurface defects, which requires the determination of large differences in material properties over small flaw sizes, the results presented in this paper aim at the density prediction throughout the volume of the sample. This requires the detection of small changes in material properties over large regions. A physical model and a mathematical formulation are reported, which are capable of relating green-state density changes to electric conductivity in the presence of various lubricant concentrations. Preliminary electrostatic measurements of cylindrical compacts have thus far confirmed the theoretical model assumptions, showing that the electric conductivity follows indeed a complex graphical behavior that is determined by the type and concentration of the lubricant. Specifically, the green state conductivity increases as the sample density increases up to values of approximately 6.9 – 7.0 g/cm 3 . Any further density increase, however, results in a decrease in conductivity.
Transcript of Modeling of conductivity versus density behavior in green ...

Modeling of conductivity versus density behavior in green-state powder metallurgy compacts
Georg Leuenberger, Reinhold Ludwig and Diran Apelian*
Powder Metallurgy Research Center (PMRC) Department of Electrical and Computer Engineering
*Metal Processing Institute Worcester Polytechnic Institute Worcester, MA 01609 USA
Submitted: April 2002 Revised: December 2002
ABSTRACT
Ongoing research at Worcester Polytechnic Institute (WPI) has recently resulted in the development of an electrostatic multi-pin instrument capable of testing green-state compacts directly following compaction. By monitoring a steady electric current flow through the sample and recording the voltages over the surface valuable information is gathered, leading to the prediction of the structural health of the green-state parts. While our prior work concentrated on the detection of surface-breaking and subsurface defects, which requires the determination of large differences in material properties over small flaw sizes, the results presented in this paper aim at the density prediction throughout the volume of the sample. This requires the detection of small changes in material properties over large regions. A physical model and a mathematical formulation are reported, which are capable of relating green-state density changes to electric conductivity in the presence of various lubricant concentrations. Preliminary electrostatic measurements of cylindrical compacts have thus far confirmed the theoretical model assumptions, showing that the electric conductivity follows indeed a complex graphical behavior that is determined by the type and concentration of the lubricant. Specifically, the green state conductivity increases as the sample density increases up to values of approximately 6.9 – 7.0 g/cm3. Any further density increase, however, results in a decrease in conductivity.

2
Introduction
Powder metallurgy (P/M) is a special manufacturing approach to metal component fabrication that draws its attractiveness from several distinct properties. Notably the ability to fabricate complex parts to close tolerances is a key economical benefit [1]. However, this low-cost, high-volume manufacturing method imposes very special quality assurance requirements.
The P/M process can be broken down into three main manufacturing steps: the mixing of the powder, the compaction, and the sintering. It is the compaction process that produces the so-called green-state compacts. When considering the three basic P/M production steps, it is the compaction process producing the green-state parts that offers the highest pay-off for quality control through nondestructive evaluation (NDE) techniques. Detection of compaction related problems in the green-state would permit early process intervention, and thus prevent the creation of potentially significant numbers of faulty parts prior to sintering.
Initial research targeting resistivity measurements of pre-sintered, green-state powder metal compacts resulted in a surface-breaking and subsurface crack detection instrument [2, 3]. This instrument relies on an array sensor concept whereby direct current (DC) is injected into the sample and voltage distributions on the surface are processed in an effort to detect hairline cracks as small as 20 microns in size. The presence of flaws, which are due to conductivity contrasts, can be sensed through a local voltage perturbation against the unflawed baseline voltage response [4, 5]. A prototype crack detection instrument was developed at the Powder Metallurgy Research Center at WPI [6].
Our current work extends the previously developed approach of evaluating large variations in conductivity over microscopic distances by evaluating small changes of conductivity over macroscopic distances. It is reasoned that the same electrostatic approach should be applicable for the detection of density gradients in green-state compacts. During the course of this density measurement program for green state P/M parts, an initial effort was made to link the density of the part to a specific conductivity [7]. This conductivity – density relationship can subsequently be used in the reconstruction of a density map of the part. Interestingly, the outcome of these measurements differed significantly from the expected results. For non-lubricated parts, a linear relationship between the nominal density and the conductivity could be established. For lubricated parts, however, not only was the relationship nonlinear, but it also exhibited saturation and, going to high densities, the conductivity passes through a maximum as a function of densities [8]. In the following, this decline of conductivity at high densities is referred to as an inversion. The conductivity-density behavior is depicted in Figure 1, where we see the conductivity – density relationship for various lubricant mixtures over a wide range of nominal densities.
Initial attempts to explain the inversion focused on process effects. Specifically, lamination, lubricant migration, and increased oxidation through higher temperatures were thought to be responsible for this response. However, no clear experimental evidence could be developed to support any of these assumptions. As a consequence, further considerations were given to the theory of conductivity of mixtures and answers were found that seemed to explain the initially puzzling effects through physical laws. The following paragraphs attempt to explain the inversion as a physical phenomenon due to induced charges and polarization effects.

3
Non-Conducting Particles in Conducting Medium
When considering the conductivity of green-state P/M parts, we have to deal with the theory of the conductivity of mixtures. Here the metal powders, which is the main constituent of the mixture, presents the conducting medium, the lubricant particles and air bubbles are considered non-conducting. Although numerous researchers have investigated the conductivity of binary mixtures [9-12], none of the existing theories can explain the electric behavior encountered in green-state P/M parts.
The problem of determining the electrical conductivity and the dielectric constants are closely related. Both cases result in almost identical Laplace-type equations, where an electric potential must be continuous across the interface of adjacent regions with different material parameters. The required boundary condition arises from the continuity of the electrical current density, J=σΕ , perpendicular to the interface in the conductive case. Here σ denotes the electric conductivity and Ε is the electric field. Furthermore, the continuity of the displacement, D=εE, perpendicular to the interface must be maintained (ε represents the dielectric constant). Since the field E plays the same role in both cases, the governing equations for the conductivity and the dielectric constant become identical.
If the non-conducting particles in a conducting medium are treated like molecules in a solid or liquid dielectric spaced in such a way that we can assume that the effect of their presence does not considerably alter the electric field acting on the neighboring particles, then the Clausius-Mossotti equation applies:
effeff nLEPEE3
4
3
4
00
!"
!"" ==# (1)
This equation calculates the summed effect of all particles within the volume due to the external electric field E0, resulting in an effective field Eeff. Here P is the macroscopic polarization vector, n is the particle concentration, and L represents the depolarization factor. Such a model appears to be a plausible explanation, as the lubricant can be considered as individual particles embedded in the green-state P/M base material. Since the lubricant concentration is generally low, on the order of 5% or less, the mutual interaction between the polarizable particles can be neglected. The sum of their effects, however, still leads to an effective field that differs from the applied field.
The idea of having two separate material constituents with different electric properties can also be treated from a purely mechanical point of view. Considering a medium consisting of two (or more) constituents with conductivities
1! and
2! and volume fractions
1f and
2f on a completely symmetrical basis, leads
to Bruggeman’s symmetric theory [13, 14]. This theory allows us to calculate the conductivity of a random mixture of spherical particles of two constituents, both of which completely fill the medium. Generalizing the equation to three dimensions d=1,2,3, the conductivity of medium
m! is thus given by
the equation
( )( )( )
( )( )( )
0121
2
2
1
1
1=
!+
!+
!+
!
m
m
m
m
df
df
""
""
""
"" (2)
For the case of a non-conducting dispersive material ( 01=! ) in a highly conductive host medium with
h!! =
2, Eq.(2) is solved for the conductivity of the resulting mixture as
4
!!"
#$$%
&'=!
"
#$%
&
''=
chhm
f
f
d
fd1
11 ((( . (3)
Here fc denotes the critical insulator volume fraction at which the conductor - insulator transition occurs. In three dimensions fc becomes 2/3 [15].
The volume fraction of each constituent can easily be calculated from the known densities of the two constituents and the mixture. Using
!Vg = (4)
(with V being the volume and ρ the specific weight), we can calculate the contribution of each part to the weight of the mixture. Setting the weights into relation to each other, the volume fractions of either constituent can be determined as
12
21
1
!!
!!
"
"== mix
mixV
Vf (5)
The conductivity of a medium can be calculated using Bruggeman’s asymmetric theory, where the dispersion with conductivity
1! consists of an effectively infinite size range of spheres, each of which
remains coated at all volume fractions with the host medium of conductivity m
! [16,17]. Using the more general approach of oriented ellipsoids instead of spheres, the equation can be written as [15]
( ) ( ) ( )
h
L
hm
L
m
L
dm f
!
!!
!
!!/1/1/1
1 ""=
", (6)
Specifically, L denotes the depolarization factor of the ellipsoids with the short axis oriented in the direction of current flow. When the dispersion is regarded as an insulator compared to the conductivity of the host medium ( 0
1=! ), equation (6) becomes
( ) Lhm f !!= 1
1
1"" . (7)
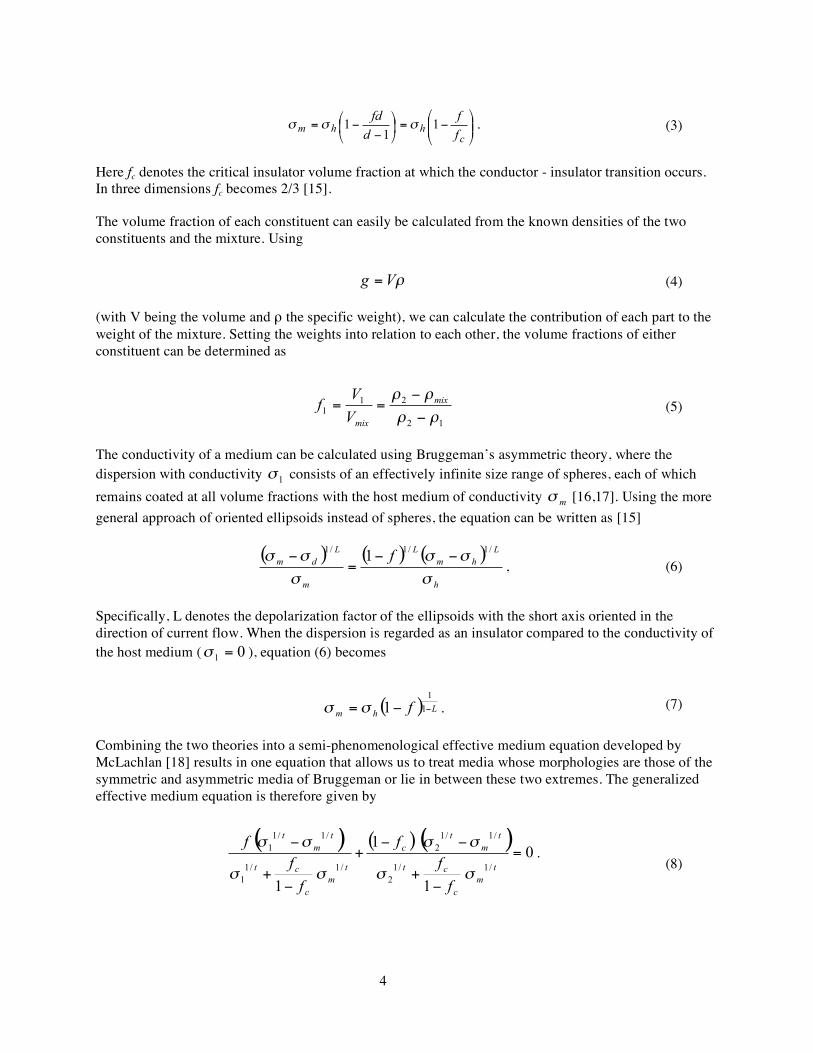
Combining the two theories into a semi-phenomenological effective medium equation developed by McLachlan [18] results in one equation that allows us to treat media whose morphologies are those of the symmetric and asymmetric media of Bruggeman or lie in between these two extremes. The generalized effective medium equation is therefore given by
( ) ( ) ( )
0
1
1
1
/1/1
2
/1/1
2
/1/1
1
/1/1
1 =
!+
!!+
!+
!
t
m
c
ct
t
m
t
c
t
m
c
ct
t
m
t
f
f
f
f
f
f
""
""
""
"".
(8)

5
with )1/( Lft c != for oriented ellipsoids and fc being the volume fraction at which the conductor-insulator transition occurs. Again assuming 0
1=! , we find
t
c
hmf
f!!"
#$$%
&'= 1(( (9)
for the conductivity of the mixture. Although this equation can be used for any mixture and morphology type, the value for fc is not readily available. Furthermore we can assume that in our case all the lubricant particles will be surrounded by the metal powder, since the volume fraction of the lubricant is very low. Hence, we may use Bruggeman’s equation for asymmetric media as given in (7).
Modeling the conductivity of a green state P/M compact was accomplished by calculating the volume fraction of air and lubricant at each density. Employing Eq. (7), the conductivity for non-lubricated parts was calculated with the conductivity iron as the base material. In a next step, the resulting conductivity was used as the background conductivity in the calculation of the lubricated parts, resulting in an overall equation of
( ) ( ) lub1
1
lub1
1
11 LLairFePM ff air !! !!= "" . (10)
Using these parameters to simulate the conductivity–density relationship over a wide density range does not show the results we obtained during the experiments. Although the volume fractions for the air and the lubricant account for a reduction in the overall conductivity, the functional relationship stays linear. This is explained by the fact that the volume fraction of the lubricant remains constant through the compaction process. The increased amounts of non-conducting lubricant particles per volume at high densities only results in a lower slope in the still linear relationship and cannot explain the inversion behavior.
Depolarization Effect
In the previous section the lubricant particles and the air inclusions within the pressed part are considered as perfect spheres. As seen above, the linear increase of low-conducting particles per volume with a linear increase in density leads to a linearly increasing conductivity, where the amount of lubricant in the mixture determines the slope of the relationship. While a spherical shape is a valid approximation for the lubricant particles in the non-compacted state, the compaction process deforms the lubricant particles to spheroidal shapes [19]. Hence, instead of regarding the depolarizing particles as spheres of constant size, we now modify this viewpoint and take into account the geometrical deformation of the lubricant during compaction.
The depolarization factor, which enters equation (8), depends on the geometry of the embedded particles. Let us consider an ellipsoidal particle of uniform dielectric properties, which is bounded by a surface defined by

6
222
),,( !"
#$%
&+!
"
#$%
&+!
"
#$%
&=
c
z
b
y
a
xzyxf (11)
In the presence of a uniform external field E0, the interior field is given by the superposition of the external field and the depolarization field E1, which is produced by a surface charge. The depolarization potential at any point within the ellipsoid is given by the surface integral
dSrr
r !"
#=$
'4
1)'(
0
nP
%&, (12)
where 1EPe
!= is the polarization of the dielectric and e
! is the electric susceptibility. Since the depolarization field inside the ellipsoid is uniform [20], we can determine it at any point. The center of the ellipsoid is the obvious point to choose. Here the exterior electric field is given by
!""#
$%%&
'++(=
)(== ** rd
c
zP
b
yP
a
xPdSr
r
nPErE zyx
2223
0
114
1)0()'(
+,. (13)
The depolarization factors are usually defined by
iiiPLE !=
1, (14)
where i = x, y, z. Due to the symmetry of the ellipsoid, all the cross terms of xy, xz, and yz do not contribute to the result when integrated over the solid angle. This allows us to separate the variables and calculate the three depolarization factors independently. Rewriting (11) in polar coordinates [21], we find the following integral for Lz:
!
"!
"!
"!
!!"
# #
$
++
$= % %2
0
2
0 2
2
2
2
2
2
2
2
2
2
2
coscos
sinsin
cossin
cossin
1
cba
cLz
(15)
In a spheroidal geometry ( cba != ) this integral can easily be evaluated. If the external field is applied along the z-axis the depolarization factor for the oblate spheroid results in
,sin1
14 1
2
2 !!
"
#
$$
%
& ''=
'e
e
e
eLZ
( (16)
where )/(1 22ace != refers to the ellipticity of the rotated ellipse with c denoting the short half-axis,
and a the long half-axis of the oblate spheroid.
As depicted in Figure 2, the depolarization factor changes in non-linear fashion. Starting from a perfect sphere with Lz=1/3, a linear change in z direction results in a non-linear change of the depolarization factor and approaches the numerical value of 1 when the extension in z-direction approaches 0.

7
If we again use (7) as the basis for calculating the conductivity of the P/M samples, the depolarization factor remains no longer constant. Increasing the density of the parts will result in a deformation of the lubricant particles. Since the lubricant itself is incompressible and can only change the shape, the volume of each lubricant particle is assumed constant. Furthermore, assuming that the spheroidal properties of the particle are conserved, any compression in z-direction results in a reduction of the short half axis c and a corresponding increase of the longer half axis a. This enlargement of the cross-section perpendicular to the current flow enhances the non-linear effect of the depolarization factor with increasing density. The sharp increase of this depolarization factor ultimately leads to a highly increased depolarization effect at high densities. Therefore the voltages recorded over a given length, based on injecting a constant DC current, begin to increase. This, in turn, leads to the experimentally observed decrease in conductivity at high densities.
Discussion of Results
Figure 3 shows the result of our simulations, for the conductivity that was calculated for non-lubricated parts and for three different lubricant mixtures. The inversion can clearly be observed. Several model parameters are available to adjust the simulation results. Parameters affecting the absolute values and the exact shape of the curve are
• the conductivity of the iron powder (background conductivity),
• the degree of deformation of the lubricant particles,
• the density, at which lubricant deformation begins to contribute, and
• the rate of deformation with increasing density.
These parameters may be used to match the simulated curves more closely to the measured absolute values. In a similar sense, one could also argue that the air bubbles within the part will also be deformed to ellipsoidal shape, before they are forced out of the compressed powder. Such a deformation would increase the depolarizing effect of these air bubbles much in the same way as the deformation of the lubricant does. The exact contribution of each of these parameters to the conductivity of green-state P/M parts provides opportunities for future research.
The aforementioned parameters are likely to change with each base material, lubricant, and even lubricant amount. The exact relationship is therefore difficult, if not impossible, to predict a priori without certain baseline measurements. Nonetheless, the presented model sufficiently explains the reasons for the inversion of the conductivity – density relationship at high densities for lubricated P/M parts. This is a key feature arising in the electrostatic green-state material characterization.
Conclusion
A new electrostatic model is presented that is capable of predicting the conductivity in green state metallurgy parts. Preliminary simulations show that the developed model appropriately describes the electrostatic situation in a green-state compact. Besides explaining the physical effects leading to the phenomenon of the observed inversion behavior, the model provides the basis for future research, investigating the effect of each model parameter in more detail.

8
It is important to note that this model is not intended to calculate the absolute value of the conductivity of a green-state P/M compact for a given density. Due to many changes in the parameters entering the model equations and due to the unknown influence of each of these parameters, this model cannot provide an absolute calculation at this point. Additional research is required to make further progress in this direction. However, the model provides a physically correct approach to calculating the conductivity–density relationship and, as such, is capable of adequately explaining the counter-intuitive inversion effect.
References
1. German, R.M., “Powder Metallurgy Science”, Metal Powder Industries Federation, Princeton, ew Jersey, 1984
2. Bogdanov, G., Ludwig, R. and Michalson, W., Measurement Science and Technology, vol. 11, 157 (2000).
3. Stander, J. G., Plunkett, J., Zenger, D., McNeill, J., and Ludwig, R., “Electric resistivity testing of green-state powdered metallurgy compacts,” in Review of Progress in Quantitative NDE, vol. 16B, Plenum Press, 1997, pp. 2005 - 2012.
4. Makarov, S., Ludwig, R., and Apelian, D., “Numerical Solution Of A Direct 3D Electrostatic Resistivity Test Of Green-State Metal Powder Compacts,” in Review of Progress in Quantitative NDE, vol. 17B, Plenum Press, 1998, pp. 1462 - 1470.
5. Ludwig, R., Makarov, S., and Apelian, D., JNDE, vol. 17, No. 2, pp. 153 (1998). 6. Ludwig, R., McNeill, J.A., and Stander, J.A., US Patent No. 6,218,846 (17 April 2001) 7. G. Leuenberger, R. Ludwig and D. Apelian, “Electrostatic detection of density variations in green-
state powder metallurgy compacts”, Proceedings of QNDE 2001 8. R. Ludwig, G. Leuenberger, S. Makarov and D. Apelian, “Electric Voltage Predictions and
Correlation with Density Measurements in Green-State Powder Metallurgy Compacts”, Journal of NDE, vol. 21, No. 1, pp. 1-9
9. Malliaris, A. And Turner, D.T., „Influence of Particle Size on the Electrical resistivity of Compacted Mixtures of Polymeric and Metallic Powders”, in Journal of Appl. Physics, vol. 42, 1971, pp. 614 – 618
10. Celzard, A., Mareche, J.F. and Payot, F., “Simple method for characterizing synthetic graphite powders”, J. of Physics D: Applied Physics, vol. 33, 2000, pp.1556-1563
11. Deprez, I and McLachlan, D.S., “The analysis of the electrical conductivity of graphite powders during compaction”, in Journal of Physics D: Applied Physics, vol. 21, issue 1, 1998, pp.101-107
12. Roberts, J.N. and Shcwartz, L.M., “Grain consolidation and electrical conductivity in porous media”, Physical Review B, vol. 31, issue 9, 1985, pp. 5990-5997
13. Bruggemann, D.A.G., „Berechnung verschiedener physikalischer Konstanten von hetoregenen Substanzen I“, in Annalen der Physik, vol. 24, 1935 pp. 636 – 679
14. Euler, K.-J., „Elektrische Leitfähigkeit von komprimierten Metallpulvern”, in Planseeberichte für Pulvermetallurgie, vol 27, 1979, pp. 15 – 31
15. McLachlan, D.S., „An equation for the conductivity of binary mixtures with anisotropic grain structures“, in J. Phys. C: Solid State Phys., vol. 20, 1987, pp. 865 - 877
16. Bruggemann, D.A.G., „Berechnung verschiedener physikalischer Konstanten von hetoregenen Substanzen II“, in Annalen der Physik, vol. 25, 1936 pp. 645 – 672
17. Landauer, Rolf, „Electrical Conductivity in Homogenous Media”, in Am. Inst. of Physics Conf. Proceedings, vol. 40, 1978, pp. 2 – 43

9
18. McLachlan, D.S., „Equation for the conductivity of metal – insulator mixtures“, in J. Phys. C: Solid State Phys., vol. 18, 1985, pp. 1891 - 1897
19. Luk, S.H., Narasimhan, K.S., Winterton, P.J., Pfingstler, T., Russel, S., “Higher green strength enhancements to increase process robustness”, Hoeganaes Technical Library, Paper No. 100
20. Maxwell, J.C., „A treatise on electricity and magnetism”, Dover Publications, New York, NY, 1954, Art. 437 and 438
21. Zapolski, H.S., “The depolarization field inside a homogeneous dielelectric: A new approach” in American Journal of Physis, vol. 55, 1987, pp.77 – 81
Figure Captions Figure 1: Conductivity – density relationship of green state PM parts with no lubricant,
0.375% and 0.75% Acra Wax(AWX) lubricant respectively (left); same curves without the non-lubricated parts, illustrating the inversion of the relationship at high densities (right).
Figure 2: Change of depolarization factor of the oblate spheroid with the geometry
changing from a sphere to a flat disk. The external field is assumed in the direction of the short half axis of the spheroid.
Figure 3: Simulation of conductivity vs. density behavior for green state PM parts with
different amount of lubricants

Figure 1
0
10000
20000
30000
40000
50000
6 6.5 7
Density [g/cm3]
Co
nd
uc
tiv
ity
[S
/m]
0
5000
10000
15000
6 6.5 7
Density [g/cm3]
Co
nd
uc
tiv
ity
[S
/m]
0.375% AWX
0.75% AWX
0.75% AWX
0.375% AWX
No Lubricant

Figure 2
0 0.1 0.2 0.3 0.4 0.5 0.6 0.7 0.8 0.9 1 0.3
0.4
0.5
0.6
0.7
0.8
0.9
1 Depolarization Factor for Oblate Spheroid
Ellipticity e
De
po
lari
za
tio
n f
acto
r L

Figure 3
6000 6200 6400 6600 6800 7000 7200 7400 7600 6
6.5
7
7.5
8
8.5
9
9.5
10 x 10
6 Conductivity vs. Density
Density [g/cm3]
Co
nd
uctivity [
S/m
]
0.375%AWX
0.5%AWX
0.75%AWX
No Lub