MODELING METHOD OF SUBSTANTIAL URBAN AREA USING 3D …icuc7/extended_abstracts/pdf/... ·...
Interdisciplinary Graduate School of Science and Engineering, Tokyo Institute of Technology, 4259–G5-2 Nagatsuta-cho, Yokohama 226-8502, Japan MODELING METHOD OF SUBSTANTIAL URBAN AREA USING 3D-CAD AND ITS APPLICATION TO THERMAL ENVIRONMENT SIMULATION IN RURAL CITIES Rihito Sato*, Akira Hoyano*, Takashi Asawa* *Tokyo Institute of Technology, Tokyo, Japan Abstract The purpose of this study is to analyze the surface temperature compere with various urban information using 3D CAD- based thermal environment simulator. Information about building shapes and materials data were collected in substantial urban area and generating 3D-CAD model which the material and physical property data were added. Then, the surface temperature distribution assumed clear sky day of summer was determined through 3D CAD- based thermal environment simulator in the center of Thuchiura city (about 30 ha), Japan. In this study, three indices were used: Thermal images of surface temperature distributions by 3-D CAD, Heat Island Potential and Mean Radiant Temperature distributions at the height of 1.5m. The results determined the precise spatial form and material influenced to sueface temperature distributions. Forthermore, the correlation between surface temperature distributions and cheractristics of social and histrical background , were discussed. Especially, increase of parking lot as to depopulation strongly affected change of surface temperature distribution. Key words: 3D-CAD, Substantial urban area, Heat island 1. INTRODUCTION Changes in land cover conditions and the increasing amount of anthropogenic heat released into the outdoor spaces aggravates the outdoor thermal environment in urban areas and increases energy consumption. And, in turn, the increased energy consumption further aggravates the outdoor thermal environment. Therefore, a countermeasure against the heat environment problems must be implemented to break this vicious cycle. In the past, urban thermal environment was the focus of numerous studies. However, it is not clear which spatial form and material component are effective in a variety of urban spaces. Recently, studies have examined in urban areas broadly using remote sensing. However, these studies were difficult to evaluate in three-dimensions. In addition, a few studies have tried to model the outdoor thermal environment of substantial urban areas using three-dimensional numerical simulations. Unfortunately, the vast quantity and variety of spatial form and materials could not be evaluated accurately in these simulations. This study uses a different approach to evaluate the surface temperature in urban area. The urban element information for a substantial urban area is collected precisely and broadly, and is used to generate a three-dimensional CAD model, to which material data and physical properties were added. Then, a numerical simulation 1) is conducted to determine the all surface temperature distribution. This approach is verified through a case study on the center of Thuchiura city, Ibaraki prefecture, Japan (Fig.1). 2. METHOD FOR GENERATING A 3D-CAD MODEL FOR THE EVALUATION OF OUTDOOR THERMAL ENVIRONMENT First, the building and ground composition materials were considered and a region was selected for evaluation, as shown in Fig. 1. Then, building form and material data were collected for the substantial urban area. These data were then used to develop a three-dimensional CAD model, to which material data and physical properties were added, as depicted in Fig. 2. Building form, material, and physical property data was collected as follows: (1) Spatial form data collection …Building heights were determined using GIS data. The building details were then collected using aerial photos and field investigations. The accuracy of these models is 0.4 m or more. (2) Surface material data collection…Before the building and ground surface materials were collected, the number of surface materials was determined from the physical property and raw material data. Then, the surface material data was collected using aerial photos and field investigations. (3) Solar reflectivity data collection…Four types of brightness values were Ibaraki Tokyo Bay Pacific Ocien Kasumigaura Lake Case study area Fig.1 Case study area (about 30ha) 0 200 400m N Historical block High-densted mid- rise building block Thuchiura Station Redevelopment block Shopping district block Station squere and business/commercial block Histrical Park Chiba Tokyo 140 º 12’E 36 º04’ N The seventh International Conference on Urban Climate, 29 June - 3 July 2009, Yokohama, Japan
Transcript of MODELING METHOD OF SUBSTANTIAL URBAN AREA USING 3D …icuc7/extended_abstracts/pdf/... ·...

Interdisciplinary Graduate School of Science and Engineering, Tokyo Institute of Technology, 4259–G5-2 Nagatsuta-cho, Yokohama 226-8502, Japan
MODELING METHOD OF SUBSTANTIAL URBAN AREA USING 3D-CAD AND ITS APPLICATION TO THERMAL ENVIRONMENT SIMULATION IN RURAL CITIES
Rihito Sato*, Akira Hoyano*, Takashi Asawa* *Tokyo Institute of Technology, Tokyo, Japan
Abstract
The purpose of this study is to analyze the surface temperature compere with various urban information using 3D CAD- based thermal environment simulator. Information about building shapes and materials data were collected in substantial urban area and generating 3D-CAD model which the material and physical property data were added. Then, the surface temperature distribution assumed clear sky day of summer was determined through 3D CAD- based thermal environment simulator in the center of Thuchiura city (about 30 ha), Japan. In this study, three indices were used: Thermal images of surface temperature distributions by 3-D CAD, Heat Island Potential and Mean Radiant Temperature distributions at the height of 1.5m. The results determined the precise spatial form and material influenced to sueface temperature distributions. Forthermore, the correlation between surface temperature distributions and cheractristics of social and histrical background , were discussed. Especially, increase of parking lot as to depopulation strongly affected change of surface temperature distribution. Key words: 3D-CAD, Substantial urban area, Heat island 1. INTRODUCTION Changes in land cover conditions and the increasing amount
of anthropogenic heat released into the outdoor spaces aggravates the outdoor thermal environment in urban areas and increases energy consumption. And, in turn, the increased energy consumption further aggravates the outdoor thermal environment. Therefore, a countermeasure against the heat environment problems must be implemented to break this vicious cycle. In the past, urban thermal environment was the focus of numerous studies. However, it is not clear which spatial form and material component are effective in a variety of urban spaces. Recently, studies have examined in urban areas broadly using remote sensing. However, these studies were difficult to evaluate in three-dimensions. In addition, a few studies have tried to model the outdoor thermal environment of substantial urban areas using three-dimensional numerical simulations. Unfortunately, the vast quantity and variety of spatial form and materials could not be evaluated accurately in these simulations. This study uses a different approach to evaluate the surface
temperature in urban area. The urban element information for a substantial urban area is collected precisely and broadly, and is used to generate a three-dimensional CAD model, to which material data and physical properties were added. Then, a numerical simulation1) is conducted to determine the all surface temperature distribution. This approach is verified through a case study on the center of Thuchiura city, Ibaraki prefecture, Japan (Fig.1).
2. METHOD FOR GENERATING A 3D-CAD MODEL FOR THE EVALUATION OF OUTDOOR THERMAL ENVIRONMENT
First, the building and ground composition materials were considered and a region was selected for evaluation,
as shown in Fig. 1. Then, building form and material data were collected for the substantial urban area. These data were then used to develop a three-dimensional CAD model, to which material data and physical properties were added, as depicted in Fig. 2. Building form, material, and physical property data was collected as follows: (1) Spatial form data collection
…Building heights were determined using GIS data. The building details were then collected using aerial photos and field investigations. The accuracy of these models is 0.4 m or more. (2) Surface material data collection…Before the building and ground surface materials were collected, the number of surface materials was determined from the physical property and raw material data. Then, the surface material data was collected using aerial photos and field investigations. (3) Solar reflectivity data collection…Four types of brightness values were
Ibaraki
Tokyo Bay Pacific Ocien
Kasumigaura Lake
Case study area
Fig.1 Case study area (about 30ha) 0 200 400m
N
Historical block
High-densted mid-rise building block
Thuchiura Station
Redevelopment block Shopping district block
Station squere and business/commercial block
Histrical Park
Chiba Tokyo
140 º 12’E 36 º04’ N
The seventh International Conference on Urban Climate, 29 June - 3 July 2009, Yokohama, Japan
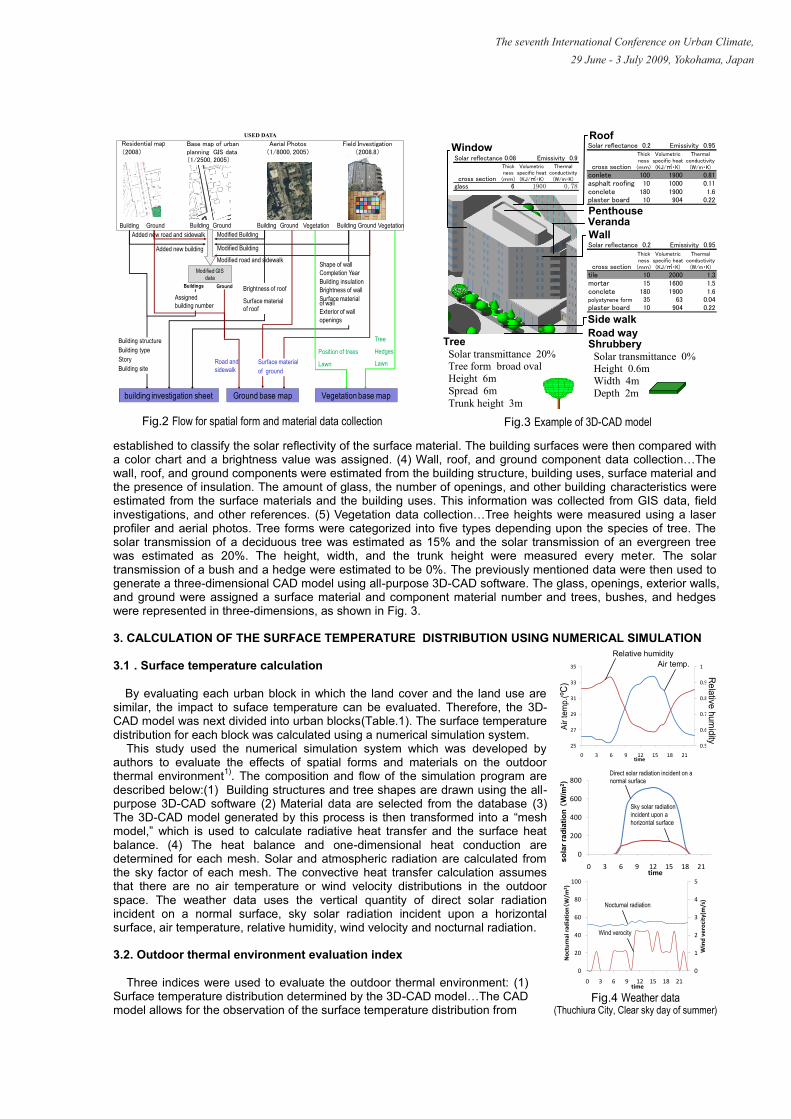
established to classify the solar reflectivity of the surface material. The building surfaces were then compared with a color chart and a brightness value was assigned. (4) Wall, roof, and ground component data collection…The wall, roof, and ground components were estimated from the building structure, building uses, surface material and the presence of insulation. The amount of glass, the number of openings, and other building characteristics were estimated from the surface materials and the building uses. This information was collected from GIS data, field investigations, and other references. (5) Vegetation data collection…Tree heights were measured using a laser profiler and aerial photos. Tree forms were categorized into five types depending upon the species of tree. The solar transmission of a deciduous tree was estimated as 15% and the solar transmission of an evergreen tree was estimated as 20%. The height, width, and the trunk height were measured every meter. The solar transmission of a bush and a hedge were estimated to be 0%. The previously mentioned data were then used to generate a three-dimensional CAD model using all-purpose 3D-CAD software. The glass, openings, exterior walls, and ground were assigned a surface material and component material number and trees, bushes, and hedges were represented in three-dimensions, as shown in Fig. 3. 3. CALCULATION OF THE SURFACE TEMPERATURE DISTRIBUTION USING NUMERICAL SIMULATION 3.1 . Surface temperature calculation
By evaluating each urban block in which the land cover and the land use are similar, the impact to suface temperature can be evaluated. Therefore, the 3D-CAD model was next divided into urban blocks(Table.1). The surface temperature distribution for each block was calculated using a numerical simulation system.
This study used the numerical simulation system which was developed by authors to evaluate the effects of spatial forms and materials on the outdoor thermal environment1). The composition and flow of the simulation program are described below:(1) Building structures and tree shapes are drawn using the all-purpose 3D-CAD software (2) Material data are selected from the database (3) The 3D-CAD model generated by this process is then transformed into a “mesh model,” which is used to calculate radiative heat transfer and the surface heat balance. (4) The heat balance and one-dimensional heat conduction are determined for each mesh. Solar and atmospheric radiation are calculated from the sky factor of each mesh. The convective heat transfer calculation assumes that there are no air temperature or wind velocity distributions in the outdoor space. The weather data uses the vertical quantity of direct solar radiation incident on a normal surface, sky solar radiation incident upon a horizontal surface, air temperature, relative humidity, wind velocity and nocturnal radiation. 3.2. Outdoor thermal environment evaluation index
Three indices were used to evaluate the outdoor thermal environment: (1) Surface temperature distribution determined by the 3D-CAD model…The CAD model allows for the observation of the surface temperature distribution from
0
1
2
3
4
5
0
20
40
60
80
100
0 3 6 9 12 15 18 21
Win
d ve
roci
ty(m
/s)
Noc
turn
al r
adia
tion
(W
/m2 )
time
0
200
400
600
800
0 3 6 9 12 15 18 21
sola
r rad
iatio
n (W
/m2 )
time
Fig.4 Weather data (Thuchiura City, Clear sky day of summer)
0.5
0.6
0.7
0.8
0.9
1
25
27
29
31
33
35
0 3 6 9 12 15 18 21
Rela
tive
hum
idit
y
Air
tem
p. (℃
)
time
Air temp.
Fig.2 Flow for spatial form and material data collection Fig.3 Example of 3D-CAD model
Base map of urban planning GIS data(1/2500, 2005)
Aerial Photos(1/8000, 2005)
Field Investigation(2008.8)
Residential map(2008)
Buildings Ground
Building Ground Vegetation
Modified GIS data
Assigned building number
Modified Building
Modified Building
Added new buildingModified road and sidewalk
Added new road and sidewalk
Building structureBuilding typeStoryBuilding site
Type of roof Brightness of roof
Surface material of roof
Shape of wallCompletion YearBuilding insulationBrightness of wallSurface material of wallExterior of wallopenings
Road and sidewalk
Surface materialof ground
Position of trees
Lawn
Tree
Hedges
Lawn
Ground base mapbuilding investigation sheet Vegetation base map
USED DATA
Building Ground Building Ground VegetationBuilding Ground
Air
tem
p.(ºC
)
R
elative humidity
Relative humidity
Direct solar radiation incident on a normal surface
Sky solar radiation incident upon a horizontal surface
Nocturnal radiation
Wind verocity
Veranda
Tree Solar transmittance 20% Tree form broad oval Height 6m Spread 6m Trunk height 3m
Solar reflectance 0.2 Emissivity 0.95
cross section
Thickness(mm)
Volumetricspecific heat(KJ/㎥・K)
Thermalconductivity
(W/m・K)
conlete 100 1900 0.81asphalt roofing 10 1000 0.11conclete 180 1900 1.6plaster board 10 904 0.22
Solar reflectance 0.2 Emissivity 0.95
cross section
Thickness(mm)
Volumetricspecific heat(KJ/㎥・K)
Thermalconductivity
(W/m・K)
tile 10 2000 1.3mortar 15 1600 1.5conclete 180 1900 1.6polystyrene form 35 63 0.04plaster board 10 904 0.22
Solar reflectance 0.08 Emissivity 0.9
cross section
Thickness(mm)
Volumetricspecific heat(KJ/㎥・K)
Thermalconductivity
(W/m・K)
glass 6 1900 0.78
Roof Window
Wall
Shrubbery Solar transmittance 0% Height 0.6m Width 4m Depth 2m
Road way Side walk
Penthouse
The seventh International Conference on Urban Climate, 29 June - 3 July 2009, Yokohama, Japan

almost any viewpoint and at various times to fully evaluate the effects of specific spatial forms and materials. (2) MRT distribution at a height of 1.5 m…The MRT (Mean Radiant Temperature) is the weighted average of the radiant interactions in a given space. A 1.5 m-high MRT distribution was used as an index to evaluate the thermal comfort of outdoor living.(3) HIP (Heat Island Potential)… HIP(Heat Island Potential) which was proposed by the authors2) is the expressed by Equation (a). The HIP is an index of the sensible heat flow rate on all surfaces in an urban block. In this equation, HIP is the heat island potential (°C), Ts is the temperature of the microscope surface (°C), Ta is the air temperature (°C), and dS is the area of the microscope surface expressed in urban blocks (m2). 4. NUMERICAL SIMULATION RESULTS 4.1. Surface temperature distribution for the entire area 3D-CAD model for the entire area and an example of the surface temperature distribution (12 p.m.) are shown in
Fig. 5 and Fig. 6. The surface temperature of a wooden house's roof increased to approximately 25 ºC higher than the air temperature. This can be explained by the roof material‟s small heat capacity and low solar reflectance. Other roofs of low solar reflectivity were also approximately 20 ºC higher than the air temperature. On the other hand, the surface temperatures of commercial/business building near the station‟s roofs were nearly 10 ºC higher than the air temperature due to their large heat capacity and high solar reflectance. The surface temperature of the historic park‟s moat was less than 10 ºC lower than the air temperature. The results indicated that the most part of ground in center of Thuchiura city was covered with high thermal capacity materials such as asphalt pavement and RC building. Therefore, solar heat absorbed daytime is emitted at night. Diurnal change of HIP also indicates urban block character and HIP values of historical block are approximately 0 ºC in the night (Fig.7).
-5
0
5
10
15
20
25
30
0 3 6 9 12 15 18 21 0
駅前
低層密集
商業
再開発地区
歴史
アスファルト(ρ=0.1)
芝地
(a) A
dSTTHIP surfacesall
as
C
=°
)(][
A
dSTTHIP surfacesall
as
C
=°
)(][
H
IP(º
C)
Name of urban block
Block area (m2)
Gross floor cover ratio
(%)
Gross building cover
ratio (%)
Number of buildings
Caracteristics of urban block
Historical block 97499 64 26 222 Wooden detached houses along old highway and
histrical park which is the ruins of a castle
Highly-densed mid-rise building block 65598 140 39 213 Mixed of old mid-rise downtown and highly-densed
detached houses
Shopping district block 16058 55 18 15 Low-rised shopping district completed 80s near the
elevated highway
Redevelopment block 36974 155 25 58 Mixed of new high-rised biulding and old
low-rised detached houses
Station square and commercial/business block
86788 236 43 114 Thuchiura railway station and its station square adjoining high-rised commercial/business buildings
Table.1 The list of urban block character
((SSuurrrroouunnddiinnggss wweerree ddiissppllaayyeedd bbyy aaeerriiaall pphhoottooss )) Fig.5 Generating 3D-CAD model (about 30ha)
TTTHHHUUUCCCHHHIIIUUURRRAAA SSSTTTAAATTTIIIOOONNN
HHHIIISSSTTTRRRIIICCC PPPAAARRRKKK
(((cccllleeeaaarrr ssskkkyyy dddaaa yyy ooofff sssuuummmmmmeeerrr 111 222 ppp ... mmm ... ))) Fig.6 Surface temperature distribution for the entire area
666000
555000
444000
333000
666555
222555
Covered with asphalt
lawn
Fig.7 Durnal change of HIP
Sun rise Sun set
Historical block
Redevelopment block Station square and commercial/business block Shopping district
block
Highly-densed mid-rise building block
The seventh International Conference on Urban Climate, 29 June - 3 July 2009, Yokohama, Japan

4.2. Charactristics of thermal environment in historical urban block
Relationship between land use about 150 years ago and distribution of recent buildings is shown Fig.8. And MRT distribution at the height of 1.5m (12 p.m.) and surface temperature distribution arround parking lot (12 p.m., 3 p.m. and 8 p.m.) are shown Fig.9 and Fig.10. Old highway area in historical block has still many row houses. However, parking lot are increasing because of depopulation recently. At 12 p.m., MRT distribution in the parking lot and road indicates about 35~40 ºC. At 3 p.m., the surface temperature of westside wall in eastside building of parking lot was approximately 20 ºC higher than to the air temperature because of high quantity of direct solar radiation. At 8 p.m., the surface temperatures of parking lot were still 7 ºC higher than the air temperature. The main reason for this characteristic is the large heat capacity of the component materials. On the other hand, the surface temperature of the detached houses decreased approximately air temperature due to radiational cooling. 5. Conclusion
The simulation performed in this paper provided a number of insights into the suface temperature. First, urban elements were collected using both existing data and field investigations. And an accurate three-dimensional CAD model was developed to analyze the surface temperature in a substantial urban area. Material and physical property data were also included in the model. The simulation revealed that building structures and materials strongly affected their surface temperatures. Furthermore, it was revealed that the land characteristics such as old land use, road direction and influence of depopulation also affected their surface temperature. Acknowledgements
This work was implemented in a part of the research project entitled „ Research on effective simulation towards a model city for low carbon society „supported by the Global Environment Research Fund (Hc-088) of the Ministry of the Environment, Japan. The authors are grateful to Ben Nakamura, Director and Research Committee on Low Carbon Society, Architectural Institute of Japan. References 1)T. Asawa, A. Hoyano, K. Nakaohkubo, 2008. Thermal design tool for outdoor spaces based on heat balance simulation using a 3D-CAD system,
Building and Environment, 43, 2112-2123 2) A. Iino, A. Hoyano, 1996. Development of a method to predict the heat island potential using remote sensing and GIS data, Energy and
Buildings 23, 199-205 3) R. Sato, A. Hoyano, A. Murakami, T. Asawa, 2005. Analysis of Outdoor Thermal Environment and Cooling Effect of Urban Greenery in
Substantial Urban Area Using 3-D CAD, Proceeding of the 2005 World Sustainable Building Conference, 2192-2199
25 30 40[℃]35
Air Temp.
Surface temp.(℃)
Example of old warehouses about 100 years ago
Fig.8 Relationship between land use about 150 years ago and distribution of recent buildings
Castle Many buildings of old highway route are overcrowded and are row house design. Recently, The case that housing sites change into parking lot has increased by decline of street.
Moat
Buildings in old samurai residence site are consist of varid building uses
The waterway was put around in the case study site about 80 years ago. However, most part of waterway was reclaimed.
Tendency of residences in old castle site is low building cover ratio and high vegetation cover ratio.
Old Street
Bounds of histrical urban block
Old samurai residences
Old high way
(clear sky day of summer 12 p.m.)
Fig.9 MRTdistributions at the height of 1.5m
12 p.m.
3 p.m.
8 p.m.
Fig.10 Surface temperature distributions for the entire area (clear sky day of summer )
It had become a parking lot though it was a residence. Surface temperature increased 60 ºC.
Influence of next site became parking lot, the westside of wall became 55 ºC.
12 p.m. 25 30 50 60 65[℃]40
Air Temp.
Surface temp.(℃)
Surface temperature of parking lot were still 10 ºC higher than the air temperature.
25 30 40[℃]35MRT(ºC)
Air Temp.
It had become a parking lot though it was a residence. MRT increased about 40 ºC.
25 30 50 55[℃]40
Air Temp.
Surface temp.(℃)
The seventh International Conference on Urban Climate, 29 June - 3 July 2009, Yokohama, Japan