Modeling Factors that Influence Firm Performance in the Eastern
158
Modeling Factors that Influence Firm Performance in the Eastern Hardwood Lumber Manufacturing Industry Brian Russell Perkins Dissertation submitted to the faculty of Virginia Polytechnic Institute & State University in partial fulfillment of the requirements for the degree of Doctorate of Philosophy in Forest Products Dr. Robert Smith, Committee Chair Dr. Brian Bond, Committee Member Dr. Robert Bush, Committee Member Dr. A. L. "Tom" Hammett, Committee Member Dr. Al Schuler, Committee Member May 4, 2009 Blacksburg, VA Keywords: firm performance, hardwood lumber manufacturing, business strategy, production technology, information technology, marketing tactics
Transcript of Modeling Factors that Influence Firm Performance in the Eastern

Modeling Factors that Influence Firm Performance in the Eastern
Hardwood Lumber Manufacturing Industry
Brian Russell Perkins
Dissertation submitted to the faculty of Virginia Polytechnic Institute & State University in partial fulfillment of the requirements for the degree of
Doctorate of Philosophy
in
Forest Products
Dr. Robert Smith, Committee Chair
Dr. Brian Bond, Committee Member
Dr. Robert Bush, Committee Member
Dr. A. L. "Tom" Hammett, Committee Member
Dr. Al Schuler, Committee Member
May 4, 2009 Blacksburg, VA
Keywords: firm performance, hardwood lumber manufacturing, business strategy, production technology, information technology, marketing tactics

Modeling Factors that Influence Firm Performance in the Eastern Hardwood Lumber Manufacturing Industry
Brian Perkins
Abstract
This research investigated the relationship between several firm-controlled,
marketing and management factors and firm performance. Hypotheses describing the
relationship between the strategic, geographic, tactical, technological and organizational
factors and firm performance of hardwood lumber manufacturers were tested. These
factors were operationalized, measured in a mail survey and used in statistical analysis to
identify relationships among the variables. An adjusted response rate of 19.8% was
obtained from the mail survey. Non-response bias was not found to be a significant
problem in the data.
A twelve measure performance indicator was developed and utilized to evaluate
the performance of hardwood lumber manufacturers who were predominantly privately-
held companies. The averages for the profit and costs performance measures were the
lowest of all twelve performance measures and this suggested that firms should focus
improvement on these measures. The current marketing tactics, including species mix,
product mix, customer mix, and promotion mix was determined. The utilization of
advanced production technology has increased in the industry since it was last measured
in 1999. The majority of respondents (60%) had dry kiln operations and 49% had a
surfacing mill. Thirty five percent of respondents indicated that their company was
certified by either forest, chain-of-custody, or both.
Of the five firm-controlled factors investigated in this research, four of them were
found to be related to firm performance. Geographic location was not found to be related
to the performance of hardwood sawmills. Firms who were backward integrated and
firms who were both backward integrated and forward integrated performed significantly
better than firms who were not vertically integrated or forward integrated. Higher
performance scores were associated with larger firms, firms who had multiple sawmills
and firms who were members of the NHLA.
There was no relationship found between diversification of the product mix,
species mix, customer mix variables and performance. The diversification of a firm's

iii
promotion expenditures was positively correlated to performance. Firms that used
optimized headrigs, optimized edgers and optimized trimmers performed significantly
better than did firms not using all three of these technologies. Firms that used computer
based log tallying, lumber tallying or inventory control performed significantly better
than firms utilizing none of these technologies.
An increase in the use of business strategy from previous studies along with a
shift towards the use of a differentiation strategy was discovered. Firms interpreted to be
following a hybrid differentiation/cost leadership strategy performed better than firms
following a cost leadership, focus, or differentiation strategy.
The implication of these results is that larger, vertically integrated firms are likely
to perform better than smaller, non-integrated hardwood lumber manufacturers. It is
recommended that firms diversify their use of promotion media and venues in order to
attract new customers. Adoption of production and information technology will help
some hardwood lumber manufacturers improve their performance. It is recommended
that hardwood lumber manufacturers control costs and differentiate their products in
order to gain competitive advantage.

iv
Acknowledgements
I would like to thank the hundreds of hardwood lumber companies who provided important data and sensitive information on their companies. Without them this research would not have been completed. I hope that each and every one of you will benefit from the assembled results and new knowledge.
I extend much gratitude to my committee chair and mentor, Dr. Bob Smith, who
continued to support me financially, academically, and personally. Thanks for all of your advice, feedback, and help in completing this project.
I would like to thank my girlfriend, Jessica Dorr, for supporting me with
encouragement and positive feedback while enduring many working weekends and stressful moments. I am very grateful for you being in my life.
I would like to acknowledge my parents, Russell and Shirley Perkins, who have
endured, supported, and hopefully enjoyed my life's circuitous journey because without their patience and love I would not have had the chance to satisfy my ceaseless desire to educate myself.
I would also like to thank all of my committee members, Dr. Al Schuler, Dr. Brian Bond, Dr. Tom Hammett and Dr. Robert Bush, who have provided indispensable advice and guidance to this research project. I would also like to thank all of my fellow graduate students over the years with whom I've had the chance to share knowledge with and gain support from. Finally and most important, I am grateful to the United States Forest Service Wood Education and Resource Center who provided funding for this research project.

v
Table of Contents
Abstract.............................................................................................................................. ii Acknowledgements .......................................................................................................... iv Table of Contents .............................................................................................................. v Table of Figures............................................................................................................... vii List of Tables .................................................................................................................. viii Chapter 1. Introduction & Literature Review............................................................... 1
Hardwood Lumber Industry ........................................................................................ 1 Performance................................................................................................................. 6 Theoretical Development........................................................................................... 10
Strategic Factors.................................................................................................... 11 Geographic Factors ............................................................................................... 12 Technological Factors........................................................................................... 13 Tactical Factors..................................................................................................... 14 Organizational Factors .......................................................................................... 15
Goals .......................................................................................................................... 16 References.................................................................................................................. 17
Chapter 2. Development of a Multiple-Measure Performance Indicator ................. 21 Introduction................................................................................................................ 21 Methods ..................................................................................................................... 22 Results & Discussion................................................................................................. 24 Conclusions................................................................................................................ 29 References.................................................................................................................. 30
Chapter 3. Profile of the Hardwood Lumber Manufacturing Industry .................... 32 Introduction................................................................................................................ 32 Objectives .................................................................................................................. 34 Methods ..................................................................................................................... 34
Sampling Strategy................................................................................................. 34 Research Instrument.............................................................................................. 35
Results & Discussion................................................................................................. 39 Response ............................................................................................................... 39 Company Demographics....................................................................................... 43 Marketing Mix ...................................................................................................... 45 Technology Utilization ......................................................................................... 51 Business Operations & Performance .................................................................... 56
Conclusions................................................................................................................ 72 References.................................................................................................................. 74
Chapter 4. Firm-Controlled Factors that Influence Business Performance ............. 77 Introduction................................................................................................................ 77 Objectives .................................................................................................................. 80 Methods ..................................................................................................................... 80 Statistical Techniques ................................................................................................ 82
Organizational Factor............................................................................................ 83 Geographic Factor................................................................................................. 85 Production Technology Factor.............................................................................. 85

vi
Information Technology Factor ............................................................................ 87 Marketing Tactics Factor ...................................................................................... 88 Strategy Factor ...................................................................................................... 92
Results & Discussion................................................................................................. 97 Organizational Factor............................................................................................ 97 Geographic Factor................................................................................................. 99 Production Technology Factor............................................................................ 100 Information Technology Factor .......................................................................... 103 Marketing Tactics Factor .................................................................................... 104 Strategy Factor .................................................................................................... 109
Conclusions.............................................................................................................. 110 References................................................................................................................ 114
Chapter 5. Changes in Strategy and Technology Over Time ................................... 116 Introduction.............................................................................................................. 116 Objectives ................................................................................................................ 117 Methods ................................................................................................................... 117 Results...................................................................................................................... 120 Conclusions.............................................................................................................. 122 References................................................................................................................ 123
Chapter 6. Conclusions, Contributions, Limitations and Recommendations......... 124 Conclusions.............................................................................................................. 124 Contributions ........................................................................................................... 129 Limitations............................................................................................................... 130 Recommendations.................................................................................................... 131
Appendix A. List of Hypotheses .................................................................................. 133 Appendix B. Statistical Test Summary ....................................................................... 134 Appendix C. Phone Survey Questions ........................................................................ 135 Appendix D. Fax Survey Questionnaire ..................................................................... 136 Appendix E. Mail Questionnaire ................................................................................. 139 Appendix F. Curriculum Vitae.................................................................................... 146

vii
Table of Figures
Figure 1. U.S. Hardwood Lumber Consumption by Market Segment ........................................... 5
Figure 2. Data Sources and Indicator Types for Business Performance Measurement.................. 7
Figure 3. Relationship Between Balanced Scorecard & Performance Improvement ..................... 9
Figure 4. Hardwood Lumber Business Performance Indicator .................................................... 28
Figure 5. U.S. Hardwood Lumber Consumption by Market Segment ......................................... 33
Figure 6. Completed Mail Questionnaires by Mailing. ................................................................ 40
Figure 7. Timeline of Returns & Responses................................................................................. 41
Figure 8. Region of Respondent's Sawmills ................................................................................. 44
Figure 9. Proportion of Lumber Species Produced by Region ..................................................... 46
Figure 10. Proportion of Grade Lumber Produced by Region & Mill Type ................................ 47
Figure 11. Proportion of Lumber Product Type Sold by Region & Mill Type ............................ 48
Figure 12. Proportion of Lumber Sold to Distribution Channels by Region & Mill Type........... 49
Figure 13. Proportion of Promotion & Advertising Expenditures by Region & Mill Type......... 50
Figure 14. Frequency of Mills Certified by Certification Type & Certification Scheme............. 57
Figure 15. Financial Dimension Performance Score Distribution................................................ 60
Figure 16. Production Dimension Performance Score Distribution ............................................. 61
Figure 17. Marketing Dimension Performance Score Distribution .............................................. 62
Figure 18. Human Resource Dimension Performance Score Distribution ................................... 63
Figure 19. Performance Index Distribution .................................................................................. 64
Figure 20. Performance Scores & Firm Size Scatter Plot............................................................. 65
Figure 21. Production Efficiency Ratio & Firm Size Scatter Plot................................................ 67
Figure 22. Sales Efficiency Ratio & Firm Size Scatter Plot ......................................................... 68
Figure 23. Sales per Volume Ratio & Firm Size Scatter Plot....................................................... 69
Figure 24. Production Efficiency Ratio & Revenue per Output Ratio Scatter Plot...................... 70
Figure 25. Hardwood Lumber Business Performance Indicator .................................................. 79
Figure 26. Performance Index Distribution .................................................................................. 82

viii
List of Tables
Table 1. Performance Measure Use and Importance Ratings....................................................... 27
Table 2. Mail Survey Response Summary.................................................................................... 39
Table 3. Non-Response Bias Comparison .................................................................................... 42
Table 4. Average Volume, Employees & Sales of Hardwood Lumber Manufacturers ............... 43
Table 5. Proportion of Firms Selling Wood Residues & Reported Prices.................................... 45
Table 6. Production Technology Use, Years Utilized, & Importance .......................................... 51
Table 7. Production Technology Utilization by Firm Size ........................................................... 52
Table 8. Information Technology Use, Years Utilized & Importance ......................................... 53
Table 9. Information Technology Utilization by Firm Size ......................................................... 54
Table 10. Type of Information Technology Used for Log, Lumber, & Inventory Tracking........ 54
Table 11. Proportion of Firms Utilizing Various Internet Functions............................................ 55
Table 12. Additional Operations of Firms .................................................................................... 56
Table 13. Importance Ratings of Business Area Variables .......................................................... 58
Table 14. Average Performance Measure Ratings ....................................................................... 59
Table 15. Performance Ratings in Response to External Trends.................................................. 66
Table 16. Responses to Open-Ended Performance Improvement Question................................. 71
Table 17. Factors Loadings for Auxiliary Operation Variables ................................................... 84
Table 18. Cluster Analysis of Production Technology Users....................................................... 86
Table 19. Cluster Analysis of Information Technology Users ..................................................... 87
Table 20. Cluster Analysis of Firms based on Proportions of Product Type Sold ....................... 89
Table 21. Cluster Analysis of Firms based on Lumber Grade Type Produced ............................ 90
Table 22. Cluster Analysis of Firms based on Distribution Channel Sales .................................. 90
Table 23. Cluster Analysis of Firms based on Species Mix ......................................................... 91
Table 24. Business Area Variable Abbreviations ......................................................................... 92
Table 25. Correlation Matrix of Business Area Variables............................................................ 93
Table 26. Factor Loadings of Business Area Variables................................................................ 94
Table 27. Factor Scores for the Strategic Clusters........................................................................ 95
Table 28. Vertical Integration Performance Score Post-Hoc Comparison ................................... 97
Table 29. Firm Type & Performance Score T-test ....................................................................... 98
Table 30. Membership Type & Performance Score T-test ........................................................... 98
Table 31. Firm Size & Performance Score Post-Hoc Comparison............................................... 99

ix
Table 32. Geographic Region Performance Score ANOVA ........................................................ 99
Table 33. Production Technology Level & Performance Score ANOVA.................................. 100
Table 34. Production Technology Level & Performance Ratio ANOVA.................................. 100
Table 35. Production Technology Clusters & Performance ANOVA....................................... 102
Table 36. Information Technology Level & Performance ANOVA .......................................... 103
Table 37. Marketing Mix Diversification & Performance Correlation ...................................... 104
Table 38. Product Type Clusters & Performance ANOVA........................................................ 105
Table 39. Lumber Grade Mix Clusters & Performance ANOVA .............................................. 106
Table 40. Distribution Channel Clusters & Performance ANOVA............................................ 107
Table 41. Species Mix Clusters & Performance ANOVA ......................................................... 108
Table 42. Strategic Clusters & Performance ANOVA ............................................................... 109
Table 43. Proportion of Firms Following a Strategy in Past and Current Research................... 118
Table 44. Proportion of Firms Utilizing a Production Technology in Past & Current Research 119
Table 45. Frequency of Strategy Utilization by Firms in each Region ...................................... 120
Table 46. Change in Strategy Utilization Z-test ......................................................................... 120
Table 47. Change in Technology Utilization Z-test.................................................................... 121
Table 48. Strategy & Region Chi-Square Test ........................................................................... 121
Table 49. Hypothesis Testing Summary..................................................................................... 129

1
Chapter 1. Introduction & Literature Review
This research project applied business research methods to the hardwood lumber
industry to measure firm performance, determine variables that influence performance,
and describe current marketing tactics and strategy. This introductory chapter reviews
the state of the hardwood lumber industry and relevant literature on business performance
measurement. The report was written with the intention of the main chapters being a
peer-reviewed publishable article. The second chapter provides an overview of the
development of the performance indicator used in the main survey. The third chapter
describes the mail survey and summarizes the current profile of the industry including its
marketing tactics and overall performance. The fourth chapter determines which factors
influence performance. The fifth chapter examines changes in business strategy and
technology utilization over time. The final chapter draws conclusions, limitations, and
recommendations from the work.
In this chapter, first an overview of the hardwood lumber manufacturing process
along with general information on product types produced, distribution channels and
promotion media utilized is presented. Next, a market analysis and economic snapshot of
the hardwood lumber industry is presented followed by a literature review on firm
performance. Then factors that potentially influence performance are reviewed and a
number of hypotheses are developed relating these factors to performance. Finally, the
goals and objectives of the project are described.
Hardwood Lumber Industry
The hardwood lumber industry is an amalgamation of lumber manufacturers, their
suppliers such as loggers and forestland owners, and their customers such as brokers,
wholesaler distributors, concentration yards, and exporters. Once the lumber is made into
finished goods such as furniture and cabinetry it is classified as a separate industry. The
focus of this research project was on hardwood lumber manufacturers, also referred to as
hardwood sawmills. The results of the research project are applicable to lumber
manufacturers and not other firms within the industry. The following section provides an
overview of the processes and products of a hardwood sawmill.

2
Hardwood lumber manufacturers produce lumber from hardwood logs. The logs
are purchased from loggers or landowners who harvest timber on forestland. The logs
can be from a variety of tree species including red oak, white oak, yellow poplar, hard
maple, soft maple, black cherry, ash, black walnut, aspen, basswood, beech, hickory,
birch, gum, pecan, cottonwood, elm, or other species depending on what is available to
the mill in that region. The species and grade of log chosen for purchasing and sawing
depends on the type of mill and its equipment, what types of lumber are selling in the
market and what is available. The delivered logs are measured for volume, grade and
species (a process known as log tallying) and then stored on the log yard until they are
sawn by the mill.
The first step in the sawmilling process is to debark the log and pass it through a
metal detector. The log may be cut to length or bucked before it is sent to the primary
saw. The primary saw can be a band headrig, circle headrig, or a scragg headrig.
Flitches of wood up to 4" thick are sawn from the log as it is turned by the carriage. Each
pass of the carriage through the saw produces another flitch. In general, higher quality
lumber is sawn from the outer portion of the log as compared to inner part of the log
where knots and other defects are more common. The log is sawn until it has 2 or 4 flat
sides and then it is termed a cant. The cant and lumber may be resawn at a secondary
saw such as a gang saw or a band resaw. The flitches are typically edged by an edger
which cut parallel to the length of the board. The ends of the board or cant are then end
trimmed by trimmers parallel to the width of the board to create a rectangular shaped
board. The boards range in thickness from ¾" to 4" thick and range in length from four
feet to 16 feet long. The width can be from 4" wide to 20" wide. The lumber is often
graded according to grade rules established by the National Hardwood Lumber
Association (NHLA). The grading system is designed so that as the lumber grade
increases then there are fewer defects such as knots, splits, decay, wane, cup, crook and
other defects in the lumber. The higher grades of lumber are more valuable than lower
grades of lumber for the same species because more defect free wood is available to end-
users. The cants, which are not typically graded, may be sized for sale as railway ties or
as pallet cants. The lumber and cants are tallied and sorted by thickness, species, and

3
grade. The sawn lumber and cants are then stored until they are sold or further processed
at the facility.
Lumber may be sold green, air dried, or kiln dried. Pallet lumber and pallet cants
along with railway ties are not kiln dried. Their end uses are in exterior applications so
they don't have to be kiln dried. Kiln dried wood is necessary for the production of
interior wood products such as flooring, furniture, millwork, and cabinetry. Kiln drying
exposes stacked lumber to high temperature, high humidity and circulating air in order to
drive moisture out of the wood by gradually reducing the humidity level. This process
increases the value of the lumber but also costs more money due to the additional
machinery, inventory, and energy needed for kiln drying. After kiln drying the lumber
maybe sold to an end-user; surfaced on two edges or all four sides; cut into custom
dimensions, sorted for color, or custom graded as required by the customer, or packaged
and loaded into containers for exporting.
The main distribution channels of hardwood lumber manufacturers include
secondary wood manufacturers, concentration yards, wholesale distributors, exports,
retail operations, and other customers. Secondary wood manufacturers include flooring,
cabinetry, millwork, furniture, dimension and pallet manufacturing. Concentration yards
purchase green or air-dried lumber and then dry and possibly sort, surface, or dimension
it before selling to other end-users. Wholesale hardwood distributors generally purchase
dried hardwood lumber and sometime surface, machine, sort or package special sizes of
lumber and then distribute it to smaller manufacturers who are geographically dispersed.
Hardwood lumber may be dried and sold directly to customers in Canada, Mexico,
Europe, Asia or South America. Hardwood lumber may also be sold to retail operations
and local users.
The edgings and trimmings of the lumber and cants are often collected via
conveyors and then chipped for sale to paper mills and other wood residue users. At
mills without chippers the slabs may be sold for firewood or burned onsite. The sawdust
from each saw is often collected by vacuum systems to be collected into a bin. This
sawdust, which is a smaller residue than chips, are then sold to composite wood mills or
used for creating steam and power for kiln drying or electricity production. Mills with
cogeneration boilers are able to create both steam and power for their operations. The

4
bark from the outside of the log is typically sold for landscaping mulch. The next section
provides an overview of the macroeconomic environment of the hardwood lumber
industry as a whole.
The hardwood lumber industry is important to the economic vitality of rural areas
in the eastern U.S. According to the U.S. Census Bureau (2005), this industry employed
an estimated 26,168 workers in 2002 and the total value of shipments was $4.4 billion.
The hardwood sawmill industry is highly fragmented, geographically dispersed, and
considered a mature industry as demonstrated by low or declining sales growth.
Hardwood lumber shipment value, after adjusting for inflation, has remained nearly flat
increasing approximately 18% from 1992 to 2005 (USCB 2007a). This stagnant growth
is a result of flat or declining real lumber prices of important lumber species such as red
oak, white oak, and yellow poplar (Luppold and Bumgardner 2007). At the same time
manufacturing costs such as energy, health care, and transportation have increased.
These stagnant sales and rising costs have decreased profitability in the industry. This in
turn has led to an increase in the number of firms exiting the industry. The softwood and
hardwood sawmill industry as a whole (NAICS 321113) has seen a general decline in
profitability that oscillates with the overall business cycle (RMA 1995-2006).
Coinciding with the conditions of low profitability has been a decrease in
production and shifts in markets for hardwood lumber. Hardwood lumber production has
decreased 11% from 1999 to 2007 (USCB 2007b). The market for hardwood lumber in
the furniture industry has changed due to a general decline in its traditional
manufacturing base (Bumgardner et al. 2004) and material substitution (Cumbo et al.
2001; USCB 2004). The domestic furniture manufacturing industry has declined and this
was one of the main customer groups of the hardwood lumber industry. In addition,
hardwood lumber has been replaced by engineered wood products in many furniture
manufacturing applications. According to the Hardwood Market Report data (2006),
from 1999 to 2007, consumption of hardwood lumber in all market segments declined by
20% and use by the domestic furniture industry declined 61% (Figure 1).

5
4.5 4.4 4 4 4 4 3.8 3.7 3.6
2.6 2.52.2 1.8 1.6 1.3 1.2 1.1 1
1.2 1.21.3 1.4 1.4 1.5 1.6 1.5 1.2
1.4 1.41.5 1.5 1.5 1.6 1.5 1.4
1.3
1.3 1.31.3 1.3 1.3 1.2 1.3
1.21
1.2 1.21.1 1.2 1.2 1.2 1.3
1.31.2
0.7 0.60.7 0.7 0.8 0.9 0.9
11
0
2
4
6
8
10
12
14
1999 2000 2001 2002 2003 2004 2005 2006 2007
Bill
ion
Boa
rd F
eet
Pallets Furniture Cabinets FlooringMillwork Exports Railway Ties
12.9 12.612.1 11.9 11.8 11.7 11.2
11.210.9
Figure 1. U.S. Hardwood Lumber Consumption by Market Segment
The consumption of hardwood lumber in the pallet industry has decreased 20%
from 1999 to 2007 (HMR 2006), due mainly to the recycling of pallet parts (Bush et al.
2002). The consumption decline in these two important market segments has created
highly competitive conditions in the industry. During this same time period, other
market segments have declined less such as flooring (7% decrease), or not changed as in
cabinets or exports. One market segment has shown growth in hardwood lumber
consumption, railway ties increased 43%. These trends of decreasing production and
consumption along with shifting markets have created adverse business conditions for the
eastern hardwood lumber industry.
The response of hardwood lumber companies to these challenging conditions
could determine their success or failure. Indeed, a number of companies have gone out
of business or have been acquired by other hardwood lumber companies. According to
statistics by the U.S. Census Bureau, there was a 36% decrease in the number of
establishments producing hardwood lumber from 1997 to 2002 (USCB 1999; USCB
2005).

6
In summary, two trends have greatly impacted this industry. First, stagnant sales
and increasing costs have led to decreasing profitability. Second, the changing markets
have led to a decrease in production and consolidation. These two main trends are likely
to continue for the foreseeable future and will continue to impact the hardwood lumber
industry. These trends are being driven by globalization, decreasing demand in the
housing and transportation sectors, and other macroeconomic factors. It would help the
industry to better understand the competitive response needed by hardwood lumber
manufacturers. It was within this context that this research project sought to discover
opportunities for improvement of firm performance in the hardwood lumber industry.
The competitive position of each firm is determined by how well it performs in
the market. This in turn is influenced by its efficient and effective use of resources,
technology, human resources, strategy, tactics, geographic location, and organizational
structure. Much of the research in the hardwood lumber industry has focused on the
efficient conversion of logs into lumber so that the forest resource could be conserved.
This research on increasing lumber yield and lumber grade recovery from hardwood logs
has helped sawmills become more competitive. Increasing the efficiency of sawmill
processes and technology has been the focus of a number of mill studies. At the same
time, other researchers have focused on how the hardwood lumber industry has changed
due to changing global markets and the available forest resources. In this study, we are
focused on investigating the influence of firm-controlled factors such as technology
utilization, strategy, tactics, business organization, and geographic diversity on overall
firm performance.
Performance
The performance of organizations, specifically businesses, has been the interest of
management researchers since the advent of the field. Business performance has
traditionally meant profitability and financial measures such as return on investment,
return on assets, and return on sales are prevalent in previous studies (Booth and
Vertinsky 1991; Cohen and Sinclair 1992; O'Laughlin and Ellefson 1981; Palepu 1985;
Rich 1986; Rumelt 1982). Zinkhan (1988) investigated the financial performance of
forest product firms using a market value risk adjusted approach. This technique is

7
limited to publicly trade companies since dividends and share prices are needed to
calculate the metric and therefore it can’t be used in this research project because
hardwood lumber manufacturers are privately held. Other studies have used non-
traditional measures of firm performance such as market share and customer satisfaction;
and subjective rating scales such as performance relative to competitors (Covin et al.
1990; Narver and Slater 1990; Pelham 1997). Over time companies and researchers have
increasingly relied on multiple measures of performance and moved away from strictly
using financial performance measures. This is because these financial measures are
generally not available from private firms.
Venkatraman and Ramanujam (1986) developed a 2 x 2 classification matrix
(Figure 2) of business performance measurement based on the data source (primary,
secondary or both) and the metric type (financial, operational or both). This matrix
succinctly describes all potential performance measurement approaches available to
researchers. The authors identified four approaches corresponding to the 4 cells and four
approaches that are combinations of adjacent cells.
Financial 1. ROI for a public company from E*Trade
2. ROI for a public company from the annual report
Operational3. Log volume recovery in a benchmarking report from an industry survey
4. Lumber grade recovery from a particular sawmill
Secondary Primary
A. Use Financial Indicators from 2 Data Sources
Data Source
Indi
cato
r Typ
e
D. Financial &Operational Indicators from Primary Data Source
C. Use Operational Indicators from 2 Data Sources
B. Financial &Operational Indicators from Secondary Data Source
Figure 2. Data Sources and Indicator Types for Business Performance Measurement
An example of each approach is shown in cells 1 – 4. The limitations of using
just one of these four approaches are evident when attempting to measure business
performance. Venkatraman and Ramanujam (1986) suggested that business performance
consists of both financial and operational performance. The authors recommended that
researchers should avoid using only one source and one indicator. They suggested using

8
one of the approaches labeled A-D in Figure 2. that combines two cells. A limitation of
applying the A, B, and C approach to the hardwood lumber industry is that secondary
sources of data are non-existent since it is predominantly privately held. The D approach
where both operational and financial performance metrics are obtained directly from the
company appears to be the only performance measurement strategy for this project.
Therefore, financial and operational performance data was collected directly from eastern
hardwood lumber manufacturers.
This research measured performance from a number of different perspectives and
avoided the weaknesses of traditional financial measures such as their lack of strategic
focus, short-term historic bias, and lack of information on quality, continuous
improvement, customer needs, or competitor actions (Neely 1999). As a result of their
observations about the limitations of traditional financial measures, Kaplan and Norton
(1996) developed the balanced scorecard.
The balanced scorecard developed by Kaplan and Norton (1998) measures
performance from four distinct perspectives of a business: financial, internal, customer
and innovation. There is a balance between leading and lagging indicators of firm
performance. The financial and internal metrics indicate the results of previous time
periods while the customer and innovation metrics are indicators of potential future
results. The financial perspective includes the traditional measures of business
performance such as return on investment, return on sales and others. The internal
perspective measures business processes needed to fulfill their mission and in hardwood
lumber manufacturing this is synonymous with production. The customer/marketing
perspective metrics focus on how well the company is satisfying their customers by
utilizing marketing techniques. Finally, the innovation/learning perspective measures
knowledge growth through employee training and retention. This perspective was
customized as human resources for hardwood lumber manufacturers since there is little
innovation in the industry.
The dimensions of the balanced scorecard are linked following a logical casual
sequence of events (Anonymous 2004). The measurement of learning, innovation and
human resources is intended to improve employee performance. As employees perform
better the internal processes of a firm are fulfilled better and there is less down time and

9
defects. The increase of the effectiveness and efficiency of internal processes, the
production process in the case of the hardwood lumber manufacturers, can lead to better
fulfillment of customer expectations and fewer customer service issues. The satisfaction
of customers can increase customer loyalty and repeat business. The sales increases from
satisfied customers and the cost savings from better internal processes help to increase
profitability in the financial dimension. All of these dimensions are but one aspect of
business performance that the balanced scorecard framework measures and this concept
is depicted graphically in Figure 3.
Figure 3. Relationship Between Balanced Scorecard & Performance Improvement
The balanced scorecard has been widely implemented by large corporations but
not by small manufacturing firms. (Paranjape et al. 2006). A number of performance
metrics from the balanced scorecard framework have been empirically validated (Jusoh et
al. 2006; Maiga and Jacobs 2003). The balanced scorecard framework was customized
for the hardwood lumber industry because the performance literature reviewed indicated
that measuring performance from multiple perspectives was valid, current, and the most
effective way given the constraints of the hardwood lumber industry. Metrics from each
perspective were developed and incorporated into a multiple-measure performance
indicator.
Employee Performance
Increased Productivity
Satisfied Customers
Increased Profitability Financial Perspective Customer Perspective Internal Perspective
Learning Perspective

10
The frequency of companies utilizing formal, integrated, multiple measures of
performance is low among manufacturing firms (Gosselin 2005). However, there is at
least one hardwood lumber company that had implemented a balanced scorecard (Miller
2006). Hardwood lumber mills measure their operational performance by a number of
metrics including: log volume recovery (overrun, lumber recovery factor), lumber grade
recovery, lumber dimensions, costs, productivity, and production (Mayer and
Wiedenbeck 2005; Rappold 2006) Financial performance in the industry is judged by
measures of profitability including return on sales, and return on investment. The
hardwood lumber industry already measures performance from two perspectives.
Evidence within the trade journal literature suggests that hardwood lumber manufacturers
cite customers and employees as important to their company’s success (Miller 2006).
The inclusion of metrics on these dimensions of firm performance (customer and human
resource) to the existing ones enabled us to see how firms perform in these increasingly
critical areas.
From the background information on the hardwood lumber industry and the
review of literature on performance, it was evident that there was a need to find out what
influenced performance in the industry. Literature from previous research and personal
knowledge of the industry were utilized to develop testable hypotheses in the next
section.
Theoretical Development
In the following section it is theorized that numerous marketing and management
factors, such as strategic, geographic, tactical, technological and organizational factors
influence firm performance of hardwood lumber manufacturers. These factors are all
within the control of the firm. Ellefson and Stone (1984) list all of these factors and more
as influencing firm and industry performance. Strategic factors could influence firm
performance since one strategy may perform better than others (Rich 1986). Geography
could influence firm performance because the forest resource changes from region to
region and species are valued differently in the market (Luppold and Dempsey 1994).
The use of advanced technology could improve productivity and firm performance (West
and Cooper 1996). Different product, promotion and customer tactics may be related to

11
performance (Ellefson and Stone 1984; Palepu 1985). Finally, firms that are vertically
integrated are likely to perform better than non-integrated firms (Cohen and Sinclair
1992).
Other factors that are beyond the control of the firm certainly impact firm
performance such as economic growth, demand, supply, substitutes, industry structure,
regulation, taxes, trade policy, natural resources, etc (Ellefson and Stone 1984; Martin et
al. 1991). These external factors are assumed to affect firms equally. Therefore, these
factors are not within the purview of this research project.
Several research studies have been conducted to investigate the link between
marketing strategies and profitability (Buzzell and Gale 1987). The profit impact of
marketing strategy (PIMS) as the project became known demonstrated that market
structure and competitive position influence strategy and tactics which in turn influence
firm performance. West and Cooper (1996) suggested that firms who rate marketing and
technology as important perform better than those who view marketing and technology as
less important. The firm-controlled factors that could impact firm performance were
chosen by reviewing literature. The following review was organized by each of the five
factors and from this hypotheses were developed.
Strategic Factors
Research into the performance and strategy of the forest products industry is
limited. Porter’s (1980) three generic strategies have been used extensively in academia
and industry. These strategies act as protection from the competition. The cost
leadership strategy is characterized by a focus on reducing costs, gaining market share
and maintaining economies of scale. The differentiation strategy is characterized by a
focus on the customer, differentiating the product or service, and brand loyalty. The
focus strategy is achieved by applying either or both the cost leadership or differentiation
strategy to a particular market segment, geographic area or customer group. Porter’s
three generic strategies were used in this research in order to build upon past research,
and because strategy is one factor that is controllable by firms that likely impacts firm
performance.
Green et al (2005) investigated the relationship of market orientation to
performance and found that a market orientation is positively related to firm and

12
marketing performance. Rich (1986) used Porter's three generic strategies (cost
leadership, differentiation, and focus) to analyze competitiveness in a survey of the
strategies and profitability of 42 major forest products companies. Results indicated that
companies following a focus and/or differentiation strategy were more profitable.
Therefore, the first hypothesis is as follows:
H1: Firms with a focus or differentiation strategy perform better than firms with a
cost leadership strategy.
Bush and Sinclair (1991) modeled the competitive strategy of the 100 largest
hardwood lumber manufacturers using Porter's model. Their results predicted a strategy
shift towards increased differentiation. In commodity markets, a production orientation
with its focus on low costs has been suggested to be a greater source of competitive
advantage versus market orientation (Pelham 1997). However, Pelham also suggested
that market orientation might be a viable strategy to compete in a cost-based marketplace.
In order to corroborate results from previous research (i.e.: Bush & Sinclair) and to
discover whether there has been a shift towards differentiation in the industry, the second
hypothesis is as follows:
H2: The hardwood lumber industry has shifted towards a differentiation and focus
strategy from a cost leadership strategy
Geographic Factors
The eastern hardwood lumber producing region is composed of many forest cover
types and the species composition of these cover types vary from sub-region to sub-
region (Luppold and Dempsey 1994). Each region has multiple cover types and the
availability of a certain species is region dependent. The market value of hardwood
lumber varies between species and even within species from region to region. For
example, red oak growing in the Northern region tends to be valued higher for its color
when compared to red oak growing in the Southern region. The two major hardwood
lumber market publications, the Hardwood Market Report (Johnson 2007) and the
Hardwood Review (Barrett 2007), publish prices for 3 distinct regions: Northern,
Southern and Appalachian. The gentle topography, long growing season and relatively
lower diversity of hardwood species in the Southern region may orient lumber producers

13
toward production and cost. Conversely, the greater species diversity, mountainous
topography, and shorter growing season in the Appalachian and Northern regions may
orient lumber producers toward marketing and differentiation. Hypotheses three and four
follow based on these two statements.
H3: More Southern hardwood lumber producers have a cost leadership strategy
than a focus or differentiation strategy
H4: More Northern and Appalachian hardwood lumber producers have a focus or
differentiation strategy than a cost leadership strategy.
Booth and Vertinsky (1991) investigated the impact of a number of factors on the
performance of the major, public North American forest product companies. Their
results indicated that geographic diversification reduced variability in returns on assets
and also reduced political and environmental risks. Given the variability in demand for
hardwood lumber species, a company utilizing a geographic diversification strategy, in
which a company operated in multiple regions (Northern, Southern, Appalachian), would
intuitively perform better than a company with geographically limited operations. Hence,
hypothesis five:
H5: Hardwood lumber producers who are geographically diversified perform
better than those firms who have geographically limited operations.
Technological Factors
Bowe et al (2001) surveyed the national hardwood lumber industry and their
results indicated that most of the companies did not use scanning or optimizing
technology. Of the mills that had adopted new technology, they tended to be
comparatively larger companies. The use of advanced technology could improve
productivity and firm performance (West and Cooper 1996). Research has shown that
lumber value could be increased by 25% - 50% by optimally edging and trimming
hardwood lumber (Kline et al. 1991). The results from the Booth and Vertinsky (1991)
research indicated that technology, as represented by capital intensity, significantly and
positively impacted profit margins. The use of technology in the forest industry has
increased productivity and performance of companies (Hetemäki and Nilsson 2005).
14
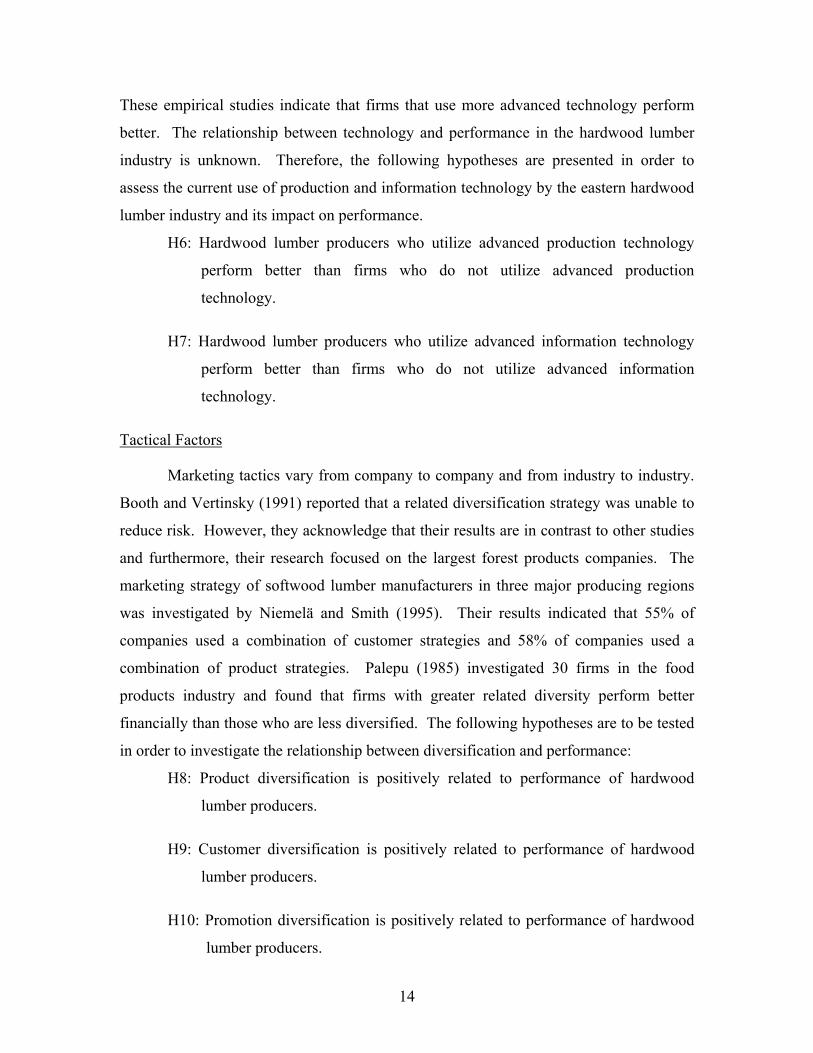
These empirical studies indicate that firms that use more advanced technology perform
better. The relationship between technology and performance in the hardwood lumber
industry is unknown. Therefore, the following hypotheses are presented in order to
assess the current use of production and information technology by the eastern hardwood
lumber industry and its impact on performance.
H6: Hardwood lumber producers who utilize advanced production technology
perform better than firms who do not utilize advanced production
technology.
H7: Hardwood lumber producers who utilize advanced information technology
perform better than firms who do not utilize advanced information
technology.
Tactical Factors
Marketing tactics vary from company to company and from industry to industry.
Booth and Vertinsky (1991) reported that a related diversification strategy was unable to
reduce risk. However, they acknowledge that their results are in contrast to other studies
and furthermore, their research focused on the largest forest products companies. The
marketing strategy of softwood lumber manufacturers in three major producing regions
was investigated by Niemelä and Smith (1995). Their results indicated that 55% of
companies used a combination of customer strategies and 58% of companies used a
combination of product strategies. Palepu (1985) investigated 30 firms in the food
products industry and found that firms with greater related diversity perform better
financially than those who are less diversified. The following hypotheses are to be tested
in order to investigate the relationship between diversification and performance:
H8: Product diversification is positively related to performance of hardwood
lumber producers.
H9: Customer diversification is positively related to performance of hardwood
lumber producers.
H10: Promotion diversification is positively related to performance of hardwood
lumber producers.

15
Organizational Factors
Many hardwood lumber producers are vertically integrated organizations in that
they own forestland, logging, sawmill, drying, and secondary machining operations. The
degree of vertical integration within the eastern hardwood lumber industry is unknown.
Anecdotal evidence and personal experience suggest that some companies are either
backward integrated or forward integrated or both. Cohen and Sinclair (1992) modeled
multiple strategies and firm profitability and found that forward integration had positive
impacts on firm profitability (return on sales). Wiedenbeck (2002) surveyed vertically
integrated hardwood manufacturers and results suggested that they could obtain more
value. The degree of organizational integration and its relationship to firm performance
in the eastern hardwood industry is unknown. Therefore, the subsequent hypothesis is
offered:
H11: Vertically integrated firms perform better than non-vertically integrated
firms.
As shown by the literature review, firm performance is influenced by a number of
factors some of which are outside of the firm’s control. The focus of this research project
was on firm-controlled factors. The five factors that were chosen for investigation were
strategic, geographic, technological, tactical, and organizational. These factors were
relevant to the hardwood lumber industry and built upon past research in the industry.
The performance of hardwood lumber manufacturers was largely unknown and warranted
study. This raised the question of how well companies were performing and how these
factors influenced their performance? How have strategy and tactics changed in response
to adverse market and economic conditions? Discovering answers to these questions
formed the basis for the goals of this project.

16
Goals
The purpose of this project was to identify and disseminate opportunities for
performance improvement of the eastern hardwood lumber industry. By investigating
factors that influence firm performance in the hardwood lumber industry, this research
identified opportunities for performance improvement. A number of hypotheses were
developed and tested in order to achieve this purpose. The secondary purpose was to
disseminate this knowledge to the hardwood lumber industry. Results and
recommendations will be distributed via publications, presentations and a workshop. The
following are the specific objectives needed to accomplish the goals of this research
project.
1. Develop multiple measures of firm performance for eastern hardwood lumber manufacturers.
2. Determine the influence of firm-controllable factors on the firm performance of eastern hardwood lumber manufacturers.
3. Determine the current marketing tactics and strategy of eastern hardwood lumber manufacturers.
The measures developed in objective one were used to measure performance in
objective two. The methods used to develop these measures are described in the next
chapter.

17
References
Anonymous. 2004. "Balanced Scorecard. Approach to Design, Development and Roll Out." Retrieved June 14, 2007, from www.eitoolkit.com/tools/initiation/bsc_design_development.ppt.
Barrett, G. 2007. Hardwood Review. Charlotte, NC, Hardwood Publishing, Inc.
Booth, D. and I. Vertinsky 1991. Strategic Positioning in a Turbulent Environment: An Empirical Study of Determinants of Performance in the North American Forest Industry. Forest Science 37: 903-923.
Bowe, S. A., R. L. Smith and P. A. Araman 2001. A National Profile of the U.S. Hardwood Sawmill Industry. Forest Products Journal 51(10): 25-31.
Bumgardner, M., U. Buehlmann, A. Schuler and R. Christianson 2004. Domestic Competitiveness in Secondary Wood Industries. Forest Products Journal 54(10): 21-28.
Bush, R., J. Bejune, B. Hansen and P. Araman 2002. Trends in the Use of Materials for Pallets and Others Factors Affecting Demand for Hardwood Products. 30th Annual Hardwood Symposium, Fall Creek Falls, TN, National Hardwood Lumber Association.76-81.
Bush, R. J. and S. A. Sinclair 1991. A Multivariate Model and Analysis of Competitive Strategy in the U.S. Hardwood Lumber Industry. Forest Science 37(2): 481-499.
Buzzell, R. D. and B. T. Gale 1987. The PIMS Principles - Linking Strategy to Performance. New York, The Free Press.
Cohen, D. H. and S. A. Sinclair 1992. The Strategic Management Paradigm and the Wood Building Products Industry: A Model of Strategies and Firm Profitability. Forest Science 38: 786-805.
Covin, J. G., J. E. Prescott and D. P. Slevin 1990. The Effects of Technological Sophistication on Strategic Profiles, Structure and Firm Performance. Journal of Management Studies 27(5): 485-510.
Cumbo, D., R. Bush and R. Smith 2001. The Upholstered Furniture Industry: Material Use Trends in Frame Stock Applications. Blacksburg, VA, Center for Forest Products Marketing & Management, Department of Wood Science & Forest Products, Virginia Tech. 21.
Ellefson, P. V. and R. N. Stone 1984. U.S. Wood-Based Industry : Industrial Organization and Performance. New York, Praeger.

18
Gosselin, M. 2005. An empirical study of performance measurement in manufacturing firms. International Journal of Productivity and Performance Management 54(5/6): 419.
Green, K. W., R. A. Inman, B. Gene and T. H. Willis 2005. Market orientation: relation to structure and performance. The Journal of Business & Industrial Marketing 20(6): 276.
Hetemäki, L. and S. Nilsson, Eds. 2005. Information Technology and the Forest Sector. Vienna, Austria, International Union of Forest Research Organizations.
HMR 2006. 10th Annual Statistical Analysis of the North American Hardwood Marketplace. Memphis, TN, Hardwood Market Report. 172.
Johnson, J. 2007. Hardwood Market Report. Memphis, TN.
Jusoh, R., D. N. Ibrahim and Y. Zainuddin 2006. Assessing the Alignment Between Business Strategy and Use of Multiple Performance Measures Using Interaction Approach. The Business Review, Cambridge 5(1): 51.
Kaplan, R. S. and D. P. Norton 1996. The balanced scorecard : translating strategy into action. Boston, Mass., Harvard Business School Press.
Kaplan, R. S. and D. P. Norton (1998). The Balanced Scorecard - Measures that Drive Performance. Harvard Business Review on Measuring Corporate Performance. Boston, MA, Harvard Business School Press 123-147.
Kline, D. E., P. A. Araman and C. Regalado 1991. Increasing Hardwood Lumber Recovery and Value at the Edger and Trimmer. Forest Industries Clinic & Show. Portland, OR.
Luppold, W. and M. Bumgardner 2007. Examination of Lumber Prices Trends for Major Hardwood Species. Wood and Fiber Science 39(3): 404-413.
Luppold, W. G. and G. P. Dempsey 1994. Factors Affecting Regional Changes in Hardwood Lumber Production. Forest Products Journal 44(6): 8-14.
Maiga, A. S. and F. A. Jacobs 2003. Balanced scorecard, activity-based costing and company performance: An empirical analysis. Journal of Managerial Issues 15(3): 283.
Martin, L., R. Westgren and E. van Duren 1991. Agribusiness Competitiveness across National Boundaries. American Journal of Agricultural Economics 73(5): 1456-1464.
Mayer, R. and J. Wiedenbeck 2005. Continuous Sawmill Studies: Protocols, Practices and Profits. Newtown Square, PA, U.S. Department of Agriculture, Forest Service, Northeastern Research Station. 32.

19
McDonald, J. 2007. "Chi-squared test of independence." Retrieved October 22, 2007, from http://udel.edu/~mcdonald/statchiind.html.
Miller, T. 2006. Hardwood Lumber Manufacturing Inc.: The Right People, The Right Product. National Hardwood Magazine 80(3): 34-36.
Narver, J. C. and S. F. Slater 1990. The Effect of a Market Orientation on Business Profitability. Journal of Marketing 54(4): 20.
Neely, A. 1999. The performance measurement revolution: why now and what next? International Journal of Operations & Production Management 19(2): 205.
Niemela, J. S. and P. M. Smith 1995. A Marketing Strategy Comparison: Finland, Western United States, and British Columbia. Forest Products Journal 45(11/12): 27-35.
O'Laughlin, J. and P. V. Ellefson 1981. U.S. Wood-Based Industry Structure: Part III - Strategic Group Analysis. Forest Products Journal 31(12): 25-31.
Palepu, K. 1985. Diversification Strategy, Profit Performance and the Entropy Measure. Strategic Management Journal 6(3): 239.
Paranjape, B., M. Rossiter and V. Pantano 2006. Performance measurement systems: successes, failures and future - a review. Measuring Business Excellence 10(3): 4.
Pelham, A. M. 1997. Market orientation and performance: the moderating effects of product and customer differentiation. The Journal of Business & Industrial Marketing 12(5): 276.
Porter, M. E. 1980. Competitive strategy: techniques for analyzing industries and competitors. New York, Free Press.
Rappold, P. 2006. Activity-based product costing in a hardwood sawmill through the use of discrete-event simulation. Wood Science & Forest Products. Blacksburg, VA, Virginia Polytechnic Institute & State University. Ph.D. 269.
Rich, S. U. 1986. Recent Shifts in Competitive Strategies in the U.S. Forest Products Industry and the Increased Importance of Key Marketing Functions. Forest Products Journal 36(7/8): 34-44.
RMA 1995-2006. Manufacturing-Sawmills NAICS 321113. Annual Statement Studies. R. M. Associates. Philadelphia, PA.
Rumelt, R. R. 1982. Diversification Strategy and Profitability. Strategic Management Journal 3(4): 359-369.
USCB 1999. Sawmills :1997. Economic Census, Manufacturing Industry Series, U.S. Census Bureau. 37.

20
USCB 2004. Upholstered Household Furniture Manufacturing: 2002. Economic Census, Manufacturing Industry Series, U.S. Census Bureau. 11.
USCB 2005. Sawmills:2002. Economic Census, Manufacturing Industry Series, U.S. Census Bureau. 13.
USCB. 2007a. "Census Bureau - Annual Survey of Manufactures." Retrieved July 5, 2007, from http://www.census.gov/mcd/asm-as2.html.
USCB 2007b. Lumber Production and Mill Stocks. Current Industry Reports, U.S. Census Bureau.
Venkatraman, N. and V. Ramanujam 1986. Measurement of Business Performance in Strategy Research: A Comparison of Approaches. Academy of Management. The Academy of Management Review 11(4): 801.
West, C. D. and J. R. Cooper 1996. Marketing and Technology - Do They Pay? 24th Annual Hardwood Symposium: Putting Research to Work For the Hardwood Industry: New Technology Available Today, Cashiers, North Carolina, Hardwood Research Council.129-139.
Wiedenbeck, J. 2002. Effect of Vertical Integration on the Utilization of Hardwood Resources. 30th Hardwood Symposium Proceedings. 144-146.
Zinkhan, F. C. 1988. Evaluating the Performance of a Forest Products Firm. Forest Products Journal 38(9): 33-36.

21
Chapter 2. Development of a Multiple-Measure Performance Indicator
Introduction
The purpose of developing a performance indicator was to accurately, and quickly
assess firm performance. Business performance has traditionally meant profitability and
financial measures such as return on investment, return on assets, and return on sales are
prevalent in previous studies (Booth and Vertinsky 1991; Cohen and Sinclair 1992;
O'Laughlin and Ellefson 1981; Palepu 1985; Rich 1986; Rumelt 1982). More recent
studies have used non-traditional measures of firm performance such as market share and
customer satisfaction; and subjective rating scales such as performance relative to
competitors (Covin et al. 1990; Narver and Slater 1990; Pelham 1997). Over time
companies and researchers have increasingly relied on multiple measures of performance
and moved away from strictly using financial performance measures. This trend formed
the basis of developing a multiple-measure performance indicator for hardwood lumber
manufacturers.
Companies within the hardwood lumber industry are predominantly privately held
and there is no publicly available performance data. Due to the highly competitive nature
of the hardwood industry, companies historically have not shared performance data. The
reluctance of companies to share performance data and the time required to develop and
provide the information would have likely caused a low response rate and so an
alternative approach was needed. This approach was to utilize subjective self-rated
operational and financial performance metrics directly from the company's president,
owner or chief executive. Studies have shown that subjective measures of performance
correlate well to objective measures (Dess and Robinson 1984; Dawes 1999; Toby et al.
2004). Therefore, subjective performance measures from multiple perspectives were
developed.
The multiple perspectives that form the basis for the performance indicator were
based on the balanced scorecard which was developed by Kaplan and Norton (1998). It
measures performance from four distinct perspectives of a business: financial, internal,
customer and innovation. The financial perspective includes the traditional measures of
business performance such as return on investment, return on sales, and others. The

22
internal perspective measures business processes needed to fulfill their mission and in
hardwood lumber manufacturing this is synonymous with production. The
customer/marketing perspective metrics focus on how well the company is satisfying
their customers by utilizing marketing techniques. Finally, the innovation/learning
perspective measures knowledge growth through employee training and retention. This
perspective was customized as human resources for hardwood lumber manufacturers
since there is little innovation in the industry. The balanced scorecard framework was
customized for the hardwood lumber industry because the performance literature
reviewed indicated that measuring performance from multiple perspectives was valid,
current, and the most effective way given the constraints of the hardwood lumber
industry.
Metrics from each perspective were developed and incorporated into a multiple-
measure performance indicator specific to hardwood lumber manufacturers. Hardwood
lumber mills measure their operational performance by a number of metrics including:
log volume recovery (overrun, lumber recovery factor), lumber grade recovery, lumber
dimensions, costs, productivity, and production (Mayer and Wiedenbeck 2005; Rappold
2006) Financial performance in the industry is judged by measures of profitability
including return on sales, and return on investment. Evidence within the trade journal
literature suggests that hardwood lumber manufacturers cite customers and employees as
important to their company’s success (Miller 2006). The inclusion of metrics on these
dimensions of firm performance (customer and human resources) to the existing ones
enabled us to see how firms perform in these increasingly critical areas. The methods
used to develop the performance indicator are described in the following section.
Methods
The performance indicator was developed by collecting information on
performance from hardwood lumber manufacturers. In order to find out which
performance measures hardwood lumber manufacturers used most frequently and the
importance of these measures a pilot survey was initiated. The pilot survey addressed the
first objective of the research project which was to develop multiple measures of
performance in the hardwood lumber industry. The pilot survey was broken into two

23
parts: preliminary phone interviews to determine what performance means in the industry
and what measures they use. Then a fax survey was conducted to find out the importance
and use of performance measures. With these two techniques, a performance indicator
specific to the industry was developed and subsequently utilized in the main mail survey.
First, phone interviews with a random sample of hardwood lumber manufacturers
were conducted. The available database was split into NHLA members and non-
members. A 5% random sample without replacement was generated by Microsoft Excel.
A total of 70 National Hardwood Lumber Association (NHLA) members representing
10% of the NHLA member database were contacted. A 10% sample of NHLA members
was conducted instead of the planned 5% sample because there was a problem with the
non-member phone numbers initially which was subsequently corrected. A total of 72
non-member hardwood lumber manufacturers representing 5% of the non-member
database were contacted. As a result, 142 hardwood lumber manufacturers were
contacted instead of the 107 that would have been contacted.
The interviewees were asked open-ended questions to determine the measures
they used to measure performance of their company; how important they thought it was
to measure performance from multiple perspectives; what influences the performance of
their company; and how they go about to improving the performance of their company
(Appendix C. Phone Survey Questions). Respondents were able to give multiple
responses. The results of the open ended questions were analyzed using text analysis.
The frequency of words was tallied for questions two, four and five. Based on these
results, the literature review, and personal knowledge of the hardwood lumber industry a
list of performance measures were developed for use in the fax survey.
A random sample of companies was selected from the sample frame to participate
in the performance measure fax survey. A 10% sample from a database of NHLA
members yielded an initial sample size of 70 firms. A 10% sample from a database of
non-NHLA companies yielded an initial sample size of 144. The database for non-
NHLA companies didn’t contain fax numbers. An attempt was made to cross-reference
each company record with another database of wood products companies. This resulted
in a failure to obtain fax numbers for the majority of the non-NHLA company sample.

24
Therefore, a 144 company sample was obtained from the other database which contained
fax numbers. The total sample for the performance measure survey was 214.
A list of 48 performance measures specific to the hardwood lumber industry was
developed in four areas that correspond to the four dimensions of the balanced scorecard:
financial, production, customer, and human resource. All of the performance measures
from the phone interviews were included and the remainder came from the literature
review of previous research. The fax survey consisted of a cover page explaining the
purpose of the survey and a two page (Appendix D. Fax Survey Questionnaire)
questionnaire on which respondents rated the performance measures. Respondents rated
on a scale from one (don't use) to four (use often) how frequently their company used
these measures and also rated from one (not important) to four (very important) how
important these performance measures were to the success of their company. The fax
survey was administered via fax over a three day period. The fax machine made up to 3
attempts to transmit the fax. After the third attempt, the fax transmittal was considered a
failure and an error report was printed. The ratings were averaged across all
respondents. The top three rated performance measures in each of the four dimensions
were used for the multiple-measure performance indicator.
Results & Discussion
The adjusted response rate for the phone interviews was 40.7% for NHLA
members and 11.1% for non-members after adjusting for unusable sample units. Some
companies could not be interviewed and therefore that sampling unit was unusable for a
variety of reasons including: disconnected phone number, duplicate record, wrong
number, changes in area codes, no answer, busy signal, not being a hardwood lumber
producer, no number available and the company not being in operation anymore. The
number of unusable interviews were subtract from the initial sample size to get adjusted
sample size. The number of usable samples included those where the attempted contact
resulted in a completed interview, a message left, or an answering machine.
The results of the open ended questions were analyzed using text analysis. The
frequency of words was counted for all respondents on each question. These counts were
then divided by the total number of respondents for each question to get a proportion of

25
respondents citing that particular word. All respondents indicated that they used profit as
an measure of performance, followed by sales (42%), production (42%), quality (33%),
costs (33%) and grade recovery (17%). The responses to question two show that the
hardwood lumber industry has a larger conception of business performance than just
financial performance. When asked about what influences the performance of their
company, respondents cited the marketplace/economy (75%), costs (75%), lumber prices
(33%), and efficiency (25%). These responses indicated that a majority think that the
economy, which is outside of their control, has a large influence on their performance.
Hardwood lumber manufactures need to actively take control of costs which were the
second most frequently cited variable that influences performance. Finally, companies
indicated that in order to improve performance they lower/control costs (50%), increase
yield/grade recovery (40%), use new technology/equipment (30%) and increase machine
productivity (30%). These suggestions by respondents are ones that all hardwood lumber
manufacturers should implement to improve their performance.
The responses to the third question about the importance of measuring from
multiple perspectives were variable and there were some differences in how the question
was asked so a text analysis was not performed. However, most responses emphasized
that it was important to look at everything but some performance dimensions get more
attention than others. For example, one company said that quality was the top concern
and production was second. The use of different performance measures may depend
upon a company’s strategy and their product market(s) and customer mix.
The results from the phone interviews were incorporated into the performance
measure fax survey. Out of the 214 faxes attempted, 92, representing 43% of the sample,
were unable to be faxed. This could be due companies who changed their fax number,
companies that went out of business or companies that no longer have a fax machine.
Besides the three attempts made by the fax machine, no other attempt was made to refax
these questionnaires.
The sample size was further reduced by 3 duplicate listings within the sample and
23 companies who were not hardwood lumber producers. A follow-up call was made
one week after the fax was sent in order to determine if the fax was received and to
encourage participation. During this time, 23 companies indicated that they were not
26
hardwood lumber producers. Some companies were concentration yards, timber
harvesting companies and some were softwood sawmills. Since our population of
interest was hardwood sawmills these companies were removed from the sample. After
removing the non-hardwood lumber producers and the duplicates, the final sample size
was 96. Five companies replied but weren’t operating anymore and they didn’t complete
the survey. Eleven companies returned questionnaires that were useable for a response
rate of 11.4%.
The respondents’ ratings were averaged and the results are shown in Table
1Error! Reference source not found.. The seven most frequently used performance
measures were costs of goods sold, selling price, quality, cost per board feet, net profit,
total sales, and yield. The seven most important performance measures were cost per
board feet, gross profit margin, quality, selling price, costs of goods sold, number and
length of downtime, and accounts receivable turnover. The four least frequently used
performance measures were sales per salesperson, training expenses, number of new
customer contacts, and market share. The four least important performance measures
were sales per employee, training expenses, sales per salesperson and tonnage of bark
produced.
The use ratings were equally distributed above and below the scale midpoint of
2.5. The majority (87.5%) of the importance ratings were above the scale midpoint of
2.5. This suggests that these performance measures are believe to be important to a
company’s success but than they aren’t used as much. The performance measures with
the greatest difference between importance and use ratings offer opportunities for
hardwood lumber manufacturers to improve their use of these measures and ultimately
their performance in this area. The top four performance measures that were rated
important to success but weren't used frequently by hardwood lumber manufacturers
were number of new customers, percent of employees trained, costs by department, and
number of new customer contacts. These results suggest the industry needs to measure
performance in these areas. By measures these variables companies can track how well
they are developing new customers and training their employees which in turn will lead
to higher performance.

27
Table 1. Performance Measure Use and Importance Ratings
Performance Measure Use Average
Importance Average
costs of goods sold 3.89 3.82selling price 3.88 3.89quality 3.75 3.89cost per board feet 3.75 4.00net profit 3.70 3.60total sales 3.50 3.67yield 3.50 3.55number of worker injuries 3.44 3.50number of customer complaints 3.44 3.59customer satisfaction 3.40 3.73gross profit margin 3.38 4.00orders received 3.38 3.45accounts receivable turnover 3.38 3.78board feet per shift 3.25 3.33number and length of downtime 3.25 3.78board feet/man hour 3.25 3.67efficiency 3.00 3.11inventory turnover 3.00 3.22log utilization 2.89 3.00grade recovery 2.75 3.22employee satisfaction 2.75 3.00new product sales / total sales 2.63 3.06quantity of energy consumed 2.50 2.82tonnage of chips produced 2.50 2.78employee hours 2.50 3.11return on investment 2.50 3.10lumber recovery 2.44 2.89current ratio 2.44 2.56% on time delivery 2.40 2.82amount of capital investment 2.40 3.10plant hours used 2.38 2.88employee turnover rate 2.38 2.56delivery schedule backlog 2.33 2.91costs by department 2.33 3.22% on grade 2.29 3.00absence level 2.29 2.65tonnage of sawdust produced 2.25 2.56production defects 2.13 2.75length of employment 2.10 2.60number of new customers 2.00 3.00% of employees trained 2.00 2.91average sales order 1.90 2.20tonnage of bark produced 1.89 2.20sales per employee 1.89 1.78market share 1.88 2.22number of new customer contacts 1.75 2.56training expenses 1.71 1.88sales per salesperson 1.50 1.90
The three performance measures that were rated the most frequently used and the
most important in each of the four dimensions (financial, production, customer, human

28
resources) were used to form the multiple-measure performance indicator. This twelve
measure performance indicator (Figure 4) consisted of the following metrics: costs, sales
and profit in the financial dimension; quality, yield and board feet per shift in the
production dimensions; selling price, customer satisfaction and orders received in the
customer dimension; and number of worker injuries, employee satisfaction and employee
turnover rate in the human resource dimension. The performance indicator was designed
with subjective performance ratings where respondents self-rated their company’s
performance on a scale from one to five for each of these 12 metrics. This performance
indicator was used in the main survey in order to measure firm performance of hardwood
lumber manufacturers.
Low
Performance High
Performance Lumber yield 1 2 3 4 5 Don’t know Number of orders received 1 2 3 4 5 Don’t know Employee Satisfaction 1 2 3 4 5 Don’t know Sales 1 2 3 4 5 Don’t know Product quality 1 2 3 4 5 Don’t know Employee turnover rate 1 2 3 4 5 Don’t know Costs 1 2 3 4 5 Don’t know Customer satisfaction 1 2 3 4 5 Don’t know Profit 1 2 3 4 5 Don’t know Board feet per shift 1 2 3 4 5 Don’t know Number of worker injuries 1 2 3 4 5 Don’t know Selling Price 1 2 3 4 5 Don’t know
Figure 4. Hardwood Lumber Business Performance Indicator
The indicator was tested for reliability using both internal consistency and split
half reliability in SPSS. The results of these two reliability tests were good. A
Cronbach's alpha of .81 was obtained which is considered good. This means that the
indicator correlated highly with all possible 12-item indicators measuring the same
variables (Garrison 2008). The total item correlations were all positive and ranged from
0.3 to 0.55 indicating that each performance measure was measuring part of the same
construct, business performance. The split half reliability analysis resulted in a
Spearman-Brown coefficient of 0.82 which is also considered good. Performance
measures from each perspective were distributed equally within the performance

29
indicator which gave the indicator balance and helped with the reliability. The split half
reliability analysis measured the reliability of half of a scale and then predicted the
reliability of the whole scale. The split half reliability was increased by equally
distributing the three performance measures from each of the four dimensions within the
performance indicator. From these tests it can be concluded that the performance
indicator was reliable.
The performance indicator was utilized during the mail survey (Chapter 3). The
twelve performance ratings of each company were summed to provide an overall
performance score for each company and the possible range for this index was from 12 to
60. This approach of developing an overall performance composite from performance
measures has been used in previous research (Pitt et al. 1996, Hoque and James 2000,
Hayes 2002, Van der Stede et al. 2006). Since the performance measures correlated well
with each other and they were measuring the same construct, it was appropriate to sum
the individual performance ratings. The distribution of total performance scores was
evaluated for normality and the degree of skewness and kurtosis was determined before
utilizing parametric statistical techniques (Chapter 4).
Conclusions
The purpose of developing a performance indicator for this research was to
accurately and unobtrusively assess firm performance. Phone interviews and a fax
survey were conducted to develop a performance indicator specific to the industry and it
was subsequently utilized in the mail survey. Metrics from each perspective were
developed and incorporated into a multiple-measure performance indicator specific to
hardwood lumber manufacturers. The performance indicator reliably and unobtrusively
measured performance within the hardwood lumber industry.
The use and implementation of performance indicators like the one developed
should help hardwood lumber manufacturers to improve their performance. The research
has identified these twelve key performance measures. Companies can take the
performance indicator and customize it to their operation, begin measuring and tracking
this information.

30
References
Booth, D. and I. Vertinsky 1991. Strategic Positioning in a Turbulent Environment: An Empirical Study of Determinants of Performance in the North American Forest Industry. Forest Science 37: 903-923.
Cohen, D. H. and S. A. Sinclair 1992. The Strategic Management Paradigm and the Wood Building Products Industry: A Model of Strategies and Firm Profitability. Forest Science 38: 786-805.
Covin, J. G., J. E. Prescott and D. P. Slevin 1990. The Effects of Technological Sophistication on Strategic Profiles, Structure and Firm Performance. Journal of Management Studies 27(5): 485-510.
Dawes, J. 1999. The relationship between subjective and objective company performance measures on market orientation. Marketing Bulletin 10: 65.
Garrison, D. G. 2008. "Reliability Analysis, from Statnotes: Topics in Multivariate Analysis." Retrieved February 27, 2008, from http://faculty.chass.ncsu.edu/garson/PA765/reliab.htm.
Kaplan, R. S. and D. P. Norton (1998). The Balanced Scorecard - Measures that Drive Performance. Harvard Business Review on Measuring Corporate Performance. Boston, MA, Harvard Business School Press 123-147.
Mayer, R. and J. Wiedenbeck 2005. Continuous Sawmill Studies: Protocols, Practices and Profits. Newtown Square, PA, U.S. Department of Agriculture, Forest Service, Northeastern Research Station. 32.
Miller, T. 2006. Hardwood Lumber Manufacturing Inc.: The Right People, The Right Product. National Hardwood Magazine 80(3): 34-36.
Narver, J. C. and S. F. Slater 1990. The Effect of a Market Orientation on Business Profitability. Journal of Marketing 54(4): 20.
O'Laughlin, J. and P. V. Ellefson 1981. U.S. Wood-Based Industry Structure: Part III - Strategic Group Analysis. Forest Products Journal 31(12): 25-31.
Palepu, K. 1985. Diversification Strategy, Profit Performance and the Entropy Measure. Strategic Management Journal 6(3): 239.
Pelham, A. M. 1997. Market orientation and performance: the moderating effects of product and customer differentiation. The Journal of Business & Industrial Marketing 12(5): 276.
Rappold, P. 2006. Activity-based product costing in a hardwood sawmill through the use of discrete-event simulation. Wood Science & Forest Products. Blacksburg, VA, Virginia Polytechnic Institute & State University. Ph.D. 269.

31
Rich, S. U. 1986. Recent Shifts in Competitive Strategies in the U.S. Forest Products Industry and the Increased Importance of Key Marketing Functions. Forest Products Journal 36(7/8): 34-44.
Rumelt, R. R. 1982. Diversification Strategy and Profitability. Strategic Management Journal 3(4): 359-369.
Toby, D. W., M. Jonathan, P. Malcolm and J. W. Stephen 2004. On the Validity of Subjective Measures of Company Performance. Personnel Psychology 57(1): 95.

32
Chapter 3. Profile of the Hardwood Lumber Manufacturing Industry
Introduction
The hardwood lumber industry is an amalgamation of lumber manufacturers, their
suppliers such as loggers and forestland owners, and their customers such as brokers,
wholesaler distributors, concentration yards, and exporters. Once the lumber is made into
finished goods such as furniture or cabinetry, it is classified as a separate industry. The
focus of this research project was on hardwood lumber manufacturers, also referred to as
hardwood sawmills. The results of the research project are applicable to lumber
manufacturers and not other firms within the industry. The following section provides an
analysis on the hardwood lumber industry.
The hardwood lumber industry is important to the economic vitality of rural areas
in the eastern U.S. According to the U.S. Census Bureau (2005), this industry employed
an estimated 26,168 workers in 2002 and the total value of shipments was $4.4 billion.
The hardwood sawmill industry is highly fragmented, geographically dispersed, and
considered a mature industry as demonstrated by low or declining sales growth. Total
hardwood lumber shipment value, after adjusting for inflation, has remained nearly flat
increasing approximately 18% from 1992 to 2005 (USCB 2007a). At the same time
manufacturing costs such as energy, health care and transportation have increased. These
stagnant sales and rising costs have decreased profitability. The softwood and hardwood
sawmill industry as a whole (NAICS 321113) has seen a general decline in profitability
that oscillates with the business cycle (RMA 1995-2006).
Coinciding with the conditions of low profitability has been a decrease in
production and shifts in markets for hardwood lumber. Hardwood lumber production has
decreased 11% from 1999 to 2007 (USCB 2007b). The market for hardwood lumber in
the furniture industry has changed due to a general decline in its traditional
manufacturing base (Bumgardner et al. 2004) and material substitution (Cumbo et al.
2001; USCB 2004). The domestic furniture manufacturing industry has declined and this
was one of the main customer groups of the hardwood lumber industry. In addition,
hardwood lumber has been replaced by engineered wood products in many furniture
manufacturing applications. According to the Hardwood Market Report data (2006),

33
from 1999 to 2007, consumption of hardwood lumber in all market segments declined by
20% and use by the domestic furniture industry declined 61% (Figure 5).
4.5 4.4 4 4 4 4 3.8 3.7 3.6
2.6 2.52.2 1.8 1.6 1.3 1.2 1.1 1
1.2 1.21.3 1.4 1.4 1.5 1.6 1.5 1.2
1.4 1.41.5 1.5 1.5 1.6 1.5 1.4
1.3
1.3 1.31.3 1.3 1.3 1.2 1.3
1.21
1.2 1.21.1 1.2 1.2 1.2 1.3
1.31.2
0.7 0.60.7 0.7 0.8 0.9 0.9
11
0
2
4
6
8
10
12
14
1999 2000 2001 2002 2003 2004 2005 2006 2007
Bill
ion
Boa
rd F
eet
Pallets Furniture Cabinets FlooringMillwork Exports Railway Ties
12.9 12.612.1 11.9 11.8 11.7 11.2
11.210.9
Figure 5. U.S. Hardwood Lumber Consumption by Market Segment
The consumption of hardwood lumber in the pallet industry has decreased 20%
from 1999 to 2007 (HMR 2006), due mainly to the recycling of pallet parts (Bush et al.
2002). The consumption decline in these two important market segments has created
highly competitive conditions in the industry. During this same time period, other
market segments have declined less such as flooring (7% decrease), or not changed as in
cabinets or exports. One market segment has shown growth in hardwood lumber
consumption, railway ties increased 43%. These trends of decreasing production and
consumption along with shifting markets have created adverse business conditions for the
eastern hardwood lumber industry.
The response of hardwood lumber companies to these challenging conditions
could determine their success or failure. Indeed, a number of companies have gone out
of business or have been acquired by other hardwood lumber companies. According to
statistics by the U.S. Census Bureau, there was a 36% decrease in the number of

34
establishments producing hardwood lumber from 1997 to 2002 (USCB 1999; USCB
2005).
In summary, two trends have greatly impacted this industry. First, stagnant sales
and increasing costs have led to decreasing profitability. Second, changing markets have
led to a decrease in production and consolidation. These two trends are likely to continue
for the foreseeable future and will continue to impact the hardwood lumber industry.
These trends are being driven by globalization, decreasing demand in the housing and
transportation sectors, and other macroeconomic factors. It would help the industry to
better understand the response needed to improve competitiveness. It was within this
context that this research project sought to discover opportunities for improvement of
firm performance in the hardwood lumber industry.
Objectives
The objectives for this chapter were to measure the current demographics,
company characteristics, marketing mix, operations, technology, strategy and overall
performance of hardwood lumber manufacturers. The specific objectives met in this
chapter include:
1. Determine the current marketing tactics of eastern hardwood lumber manufacturers.
2. Determine the performance of the industry and develop benchmarks that industry can utilize.
Methods
The primary method for the research project was a mail survey. This was chosen
as it is a cost effective manner to collect large quantities of information from a large
population. The sampling strategy is detailed next, then the research instrument and the
development of metrics and questions for inclusion in the questionnaire. Following the
methods section are the results and discussion.
Sampling Strategy
The population of interest was eastern hardwood lumber manufacturers. The unit
of analysis was hardwood lumber companies and not individual hardwood lumber mills.

35
The actual number of companies in the eastern hardwood lumber sector was unknown,
but according to Luppold's (2006) estimates there are over 2,000 companies that produce
between 1/2 to 50 million board feet of lumber annually. Previous research (Booth and
Vertinsky 1991; Bush and Sinclair 1991; Cohen and Sinclair 1992; Niemela and Smith
1995; O'Laughlin and Ellefson 1981; Rich 1986) into strategy and performance in the
forest products industry has utilized purposive sampling. Bush and Sinclair's (1991)
population was the 100 largest hardwood lumber producers and Bowe's (2001)
population was all eastern hardwood lumber producers. The sampling frame for this
research was all members of the National Hardwood Lumber Association (approximately
1,100+) and approximately 500 randomly selected non-members who were
predominantly located in the eastern hardwood region. While falling short of a complete
census of the industry due to database availability and mailing costs, this sampling
coverage was more than adequate for this research project.
Research Instrument
The data for the project was collected via a mail survey. The research instrument
was a questionnaire and these have been used extensively in forest products business
research. In order to increase response rates and reduce error, the survey followed
principles outlined in the Tailored Design Method (Dillman 2000). This method is an
adaptation of the Total Design Method. The former acknowledged that different surveys
require different methods. The latter used multiple contacts in order to increase survey
response. Elements from both methods were used in the mail survey.
The intent of the Tailored Design Method is to increase the quality and quantity of
survey response. According to social exchange theory, information exchange could be
increased by providing rewards, reducing costs, and establishing trust (Dillman 2000). In
order to establish trust, companies were informed that their responses were confidential
and that Virginia Tech has a long history of conducting confidential surveys of the
industry. Companies were provided a reward via a summary of the results and a short
benchmarking report showing their companies performance versus the respondents as a
whole. Potential costs were reduced by keeping the survey convenient and avoiding
subordinating language.

36
Each hardwood lumber company in the sample frame was mailed a personalized
cover letter and a self-administered questionnaire. The questionnaire had pre-paid return
postage. A follow-up post card reminder was sent approximately two weeks after the
initial mailing. A second mailing to non-respondents was sent approximately 1 month
after the initial mailing. A second postcard reminder was sent approximately 2 weeks
after the second mailing. A third mailing to non-respondents was sent approximately one
month after the second mailing. These five contacts ensured that the highest possible
response rate was achieved.
The questionnaire was designed to be easily understood and more sensitive
information (performance ratings) was sought towards the end of the questionnaire.
Input on the questionnaire design was sought from the research committee. Next, the
questionnaire was pre-tested in order to eliminate poorly worded questions and to prevent
misunderstanding of information sought. In order to do this, a very small number of
companies (less than 10) were faxed the questionnaire and asked to review it. Comments
and suggestions from these respondents were incorporated into a revised questionnaire in
order to improve survey response.
After the collection of the survey responses, non-response bias was monitored by
calling non-respondents and asking them two demographic questions and two ratings
questions (15 variables) from the self-administered survey. The responses from the
respondents and the non-respondents were compared for significant differences. The
wave analysis method was also used to detect bias between the early and late
respondents. In this method, the group means of the first 30 respondents and the last 30
respondents were compared on technology importance ratings and performance scores
along with firm size.
The mail survey (Appendix E. Mail Questionnaire) had a number of general
demographic questions that were prevalent in previous surveys (Bowe et al. 2001; Bush
and Sinclair 1991). First, companies were asked if they manufactured hardwood lumber.
This eliminated the possibility of including companies within the database that were
brokers, distributors, or concentration yards. The population of interest was eastern
hardwood lumber manufacturers. Next, companies were asked to estimate their

37
production volume, number of employees and annual sales. Information about their
residue production and selling price were also sought.
Measures and questions for each of the five factors (geography, strategy,
technology, tactics, and organizational) were developed or used from previous research
where appropriate. The geographic factor was measured by the firm's location within in
the eastern hardwood region. Mills indicated on a map the number of mills that they had
in each of the three hardwood regions: Appalachian, Southern and Northern. The firms'
geographic diversification was measured by the number of sawmills in each region.
Three tactical marketing factors were measured: product, customer and promotion
diversification. Three attributes of product were measured by the species distribution
(i.e.: % of red oak, hard maple, etc), product category distribution (% of lumber, cants,
pallet parts, etc.), and lumber grade distribution. Firms with more species, more product
categories, and more lumber grades were indicative of greater diversification. The
customer diversification was measured by the production volume that was sold to
different distribution channels (i.e.: % of export, end-users, wholesalers, etc.). The
promotion diversification was measured by the expenditure that was used in different
promotion and advertising mediums (i.e.: magazines, tradeshows, brochures, giveaways,
and websites).
The organizational factor was measured by asking firms to identify other business
operations from a list. The strategy factor was measured using Bush and Sinclair's (1991)
20 business area variables. The companies were asked to rate the importance of the 20
variables on a 7 point Likert scale. Two technological factors were measured:
information and production technology. A list of advanced production and information
technology was developed. Firms indicated whether they used certain technology, how
long they have used it and how important it was to their performance.
Given that most if not all of the eastern hardwood lumber manufacturers are
privately held and previous researchers (Cohen and Sinclair 1992) have had difficulty
obtaining accurate and complete financial performance information from companies, this
research project used multiple measures of business performance. Hardwood companies
weren't likely to share performance data and the respondent's time required to look up the
information would have likely caused a low response rate and so an alternative approach

38
was needed. This approach was to utilize subjective self-rated operational and financial
performance metrics directly from the company owner, president, or chief executive.
Studies have shown that subjective measures of performance correlate well to objective
measures (Dess and Robinson 1984; Dawes 1999; Toby et al. 2004). In the questionnaire,
companies were asked to rate their performance on a multiple-measure performance
indicator. This indicator was previously developed and summarized in Chapter 2. Firms
were also asked to rate how well their company has performed in response to a number of
external trends affecting hardwood lumber manufacturers. Two open-ended questions
were asked at the end of the questionnaire to determine what they would change to
improve the performance of their company and to solicit any comments and suggestions
about performance and the questionnaire. Finally, the respondents were asked if they
wanted to receive a summary of the results.
Upon completion of the survey, data was inspected and analyzed using
spreadsheets and summary statistics for each question were developed. The sales,
employment and production data were combined in various ratios to provide an overall
measure of production efficiency, sales efficiency, and revenue per output for the
respondents. The results in the next section follow the order of the questions in the
questionnaire.

39
Results & Discussion
Response
The responses from the hardwood lumber industry were adequate as compared to
other surveys in the forest products industry. Many mills were not operating during the
data collection time period (Fall 2008) due to very weak lumber demand and general
unprofitability due to uncontrollable energy and transportation costs and the housing
recession. However, a number of mills did respond and complete the questionnaire as
shown in Table 2. Table 2. Mail Survey Response Summary
Total NHLA Members
Generic NHLA Members
Non-Members
Initial Sample Size 1638 1005 135 498
Undeliverable 181 40 10 131
Declined to Participate 6 5 0 1
Duplicates 26 19 7 0
Not a Hardwood Sawmill 406 261 22 123
Incomplete 9 8 0 1
Usable 200 169 7 24
Adjusted Response Rate 19.8% 25.1% 7.3% 9.9%
Of the 1638 questionnaires mailed, 181 were returned undeliverable. A large
number of companies (406) indicated that they were not hardwood sawmills and they
were removed from the sample frame and not included in any further mailings. A few
companies declined to participate and were removed. The adjusted sample size (after
removing undeliverable, non-sawmill, duplicates, and decline-to-participate companies)
was 1010 and the adjusted response rate was 19.8%. The response rate for NHLA
members, generic NHLA, and non-NHLA companies was 25.1%, 7.3% and 9.9%,
respectively. The vast majority of the respondents were NHLA members (88%) and the
remainder were not members of the NHLA. The generic NHLA members were
companies who were members of the NHLA but no chief executive officer (CEO)
information was available. This group had a lower response rate since the cover letter
and envelope were addressed generically to the president, CEO or owner. The overall

40
response rate was satisfactory given the private nature of the industry, the sensitivity of
sharing performance data, and the difficult economic conditions that the industry faced.
In order to achieve this response rate a third mailing was conducted and this brought in a
significant number of completed questionnaires (Figure 6).
Completed Questionnaires
1st Mailing11055%
2nd Mailing43
21%
3rd Mailing48
24%
Figure 6. Completed Mail Questionnaires by Mailing.
Forty-eight completed questionnaires were returned after the third mailing
accounting for 24% of the total. The second mailing resulted in 43 completed
questionnaires or 21% of the total. Clearly, the multiple contact attempts improved the
overall quantity of survey response. The majority of completed questionnaires were
returned from the first mailing. The number of responses and returns were greatest after
the first mailing (Figure 7).

41
0
20
40
60
80
100
120
140
160
180
200
9/29/2
008
10/6/
2008
10/13
/2008
10/20
/2008
10/27
/2008
11/3/
2008
11/10
/2008
11/17
/2008
11/24
/2008
12/1/
2008
12/8/
2008
12/15
/2008
12/22
/2008
12/29
/2008
1/5/20
09
1/12/2
009
1/19/2
009
Freq
uenc
y
1st P
ostc
ard
Mai
ling
2nd
Que
stio
nnai
re M
ailin
g
2nd
Post
card
Mai
ling
3rd
Que
stio
nnai
re M
ailin
g
Figure 7. Timeline of Returns & Responses
The initial questionnaire mailing occurred September 24-26, 2008. The majority
of responses and returns occurred in the 3 week period before the first reminder postcard
was mailed. The third mailing generated a large number of response and returns shortly
before the holiday period. The data collection period was closed in the middle of January
2009. The third mailing and the four month data collection period was necessary to
achieve the good response rate and the success of the mail survey.
Due to unprecedented mill closures, the number of completed non-response calls
was only nine. Contacted non-respondents were asked about their volume, mill region,
production technology importance ratings and performance ratings. A comparison (t-
test) of means between the available non-respondents and respondents indicated no
significant differences between means. A t-test was used despite the low sample size
because the variables exhibited a normal distribution when analyzed by the Kolmogorov-
Smirnov test (Garrison 2008).
Non-response bias was also monitored by comparing the means using a t-test of a
number of variables from early respondents (n=30) and late respondents (n=30). Any of

42
the means that were significantly different could indicate non-response bias. A
significance level of 0.05 was used for the entire family of 21 t-tests. The Bonferonni
correction was utilized to achieve this family wise error rate and the significance level of
each test was 0.002 (Abdi 2007). A p-value below this level would indicate a significant
difference between means. The results of this non-response wave analysis are shown in
Table 3. Table 3. Non-Response Bias Comparison
Early Respondents Late Respondents Variables Mean Mean p-value
Production Volume 15.48 9.69 0.127 Sales 16.56 9.45 0.345
Importance Ratings Optimized Headrig 4.71 4.08 0.444 Ring Debarker 3.78 3.38 0.937 Bucking Optimizer 3.25 3 0.471 Optimized Edger 4.29 3.89 0.823 Optimized Trimmer 3 3.38 0.918 Automated Sort Bins 2.67 3.25 0.674 Lumber Dimension Control 2.25 3.17 0.955
Performance Ratings Lumber yield 4.34 3.9 0.031 Orders received 3.61 3.5 0.671 Employee satisfaction 3.83 3.85 0.933 Sales 3.63 3.78 0.569 Product quality 4.37 4.11 0.165 Employee turnover rate 3.7 3.61 0.758 Costs 3.33 3.66 0.195 Customer satisfaction 4.38 4.34 0.84 Profit 2.5 3.52 0.01 Board feet per shift 3.67 3.46 0.466 Number of Worker Injuries 4.13 4.25 0.694 Selling price 3.5 3.79 0.246
This wave analysis indicates that there was not any non-response bias found in the
data. All of the t-tests were non-significant at the individual test significance level of
0.002. The results suggest that the responses were representative of all segments of the
population and were not biased in any direction.

43
Company Demographics
In this section, summary statistics for each question in the questionnaire are
presented. The results are segmented by company type, either a single sawmill or a
multiple sawmill company and by geographic region, Northern, Southern, or Appalachian
where appropriate. The average production volume, number of employees and sales in
2007 for responding companies are shown in Table 4. Table 4. Average Volume, Employees & Sales of Hardwood Lumber Manufacturers
Single
Sawmill
Multiple Sawmill
Company NHLA
Member Non-
Member 2007 Production (million BF) 7.6 26.0 14.7 3.2
2007 Sales ($million) 8.5 24.9 13.5 1.7 2007 Employees 37 119 72 16
A typical single sawmill company produced 7.6 million board feet, had $8.5
million in sales and employed 37 people. An average multiple sawmill company
produced 26 million board feet, had $25 million in sales and employed 119 people. The
multiple sawmill companies had on average 3 sawmills. Companies that were members
of the National Hardwood Lumber Association (NHLA) had greater production, sales,
and number of employees as compared to non-member companies.
The average lumber production for single sawmills was similar to those reported
by Bowe (2000). The sum of the responding sawmills lumber production was 2.675
billion board feet. This represented about 25% of the estimated hardwood lumber
production in 2007 and indicates a good representative sample from the industry. The
single sawmill companies accounted for 165 of the respondents and multiple sawmill
companies accounted for 40 of the respondents. This indicates that the majority of firms
in the industry are single sawmill companies. The company type was corroborated by the
respondent's report of the number of sawmills in each region. A single sawmill company
reported only one mill whereas a multiple sawmill company reported more than one mill.
The majority (52%) of responding sawmills were located in the Appalachian
hardwood lumber producing region (Figure 8). Northern and Southern hardwood
sawmills accounted for 31% and 15% of responding sawmills. A total of four
respondents had sawmills in multiple regions.

44
Region of Respondent's Sawmills
Northern, 62, 31%
Appalachian, 107, 52%
Southern, 30, 15%
Multiple Regions, 4, 2%
Figure 8. Region of Respondent's Sawmills
The three regions don't coincide with geographic, political, botanical, or cultural
regions of the eastern U.S. Rather, they are based on the characteristics of the lumber
produced and sold and the species available in that region. The large proportion of mills
in the Appalachian lumber region indicates a concentration of hardwood lumber
producers and the forest resource available in that region.
The sawmills were asked about which region that they generally market and label
their lumber as. The results show that a majority of mills market and label their lumber
as Appalachian (56%), followed by Northern (31%) and Southern (13%). These
proportions are similar to those in Figure 8 and verify that the majority of respondents
were located in the Appalachian lumber producing region.
The firms were asked to indicate the types and prices of wood residues that they
produced in 2007. The average selling price at the mill and the proportions of sawmills
selling each wood residue is shown in Table 5.

45
Table 5. Proportion of Firms Selling Wood Residues & Reported Prices
The vast majority of sawmills sell their chips, sawdust and bark while only 30%
of mills sell shavings. Mills that don't sell their wood residues are generally smaller than
the industry average and their lumber production volume averaged between 2.2 and 4.2
million board feet depending on the residue type not sold. These results signify that
there are wood residues available from sawmills who currently don't sell them. This may
be due to lack of markets, inadequate machinery, low inventory holding capacity, or
inconsistent supply. Technical assistance could help these mills in generating revenue
from their wood residues and improve their performance.
The average selling price for the wood residues is similar to industry norms. The
large variability in selling prices is an indication of the high demand for wood residues
some mills have experienced. The data collection period occurred at the end of a large
increase in energy prices which spurred demand for wood residues. The utilization of
wood residues from a sawmill's operation is an important source of revenue. While the
results indicate that most mills were fully utilizing their wood residues, there is potential
for improvement in this area. Above and beyond wood residues, hardwood lumber is the
main product that hardwood sawmills sell and it is reported on next.
Marketing Mix
Three elements of hardwood lumber company's marketing mix were measured:
product mix, distribution channels, and promotion expenditures. Three aspects of the
hardwood lumber product were measured during the mail questionnaire: species mix,
product type and lumber grade distribution. Lumber is sold in species groups and this
varies from region to region depending upon the forest resource and tree species available
in that region. Firms were asked to report their 2007 lumber production for each species
group as a proportion of total lumber production. The typical species mix for a mill in
each region is presented in Figure 9.
Chips Sawdust Bark Shavings
Proportion of Sawmills Selling 92.9% 89.1% 86.2% 29.6%
Average Selling Price ($/ton) $27.86 $17.24 $18.88 $25.36
Maximum Selling Price ($/ton) $90.00 $60.00 $60.29 $68.59
Minimum Selling Price ($/ton) $2.00 $1.00 $1.00 $2.00

46
RedOak
WhiteOak
YellowPoplar
HardMaple
SoftMaple
BlackCherry
Ash BlackWalnut
Aspen Bass-wood
Beech Hick-ory
Birch Gum Other
Northern
Appalachian
Southern
41
15 80 1 1 4
159
05
1001
27
17 189 8 6 4 2114110119
5 2
33
105 5 20621343
Species Mix by Region%
of T
otal
Lum
ber P
rodu
ctio
n
Figure 9. Proportion of Lumber Species Produced by Region
In the Southern region, the predominant species mix consists of red oak, white
oak, other, and gum. It is evident from the chart that in this region mills utilize a smaller
number of species as compared to other regions. In the Appalachian region, the
predominant species mix is red oak, yellow poplar, white oak, hard maple and soft maple.
In the Northern region, sawmills typically produce hard maple, red oak, and soft maple
lumber among many other species. These results are similar to those reported by Bowe
(2000) indicating that the species mix in the industry has not changed.
Hardwood lumber companies produce different grades of lumber which are
utilized for different applications. The grades are developed, regulated and enforced by
the National Hardwood Lumber Association. The sawmills reported their 2007 lumber
grade distribution as a proportion of total grade lumber production (Figure 10).

47
17
22
8
15
16
22
12
10
20
6
13
10
26
30
23
22
25
30
21
20
21
23
20
22
11
9
15
8
11
10
5
4
5
8
5
1
1
1
1
1
0
7
3
8
16
8
1
0
0
0
0
0
0
5
0 10 20 30 40 50 60 70 80 90 100
Total
Appalachian
Northern
Southern
Single Sawmill
Multiple Sawmill
% of Total Grade Lumber Produced
FAS & IF Select & Better 1 Common 2 Common 3 CommonFramestock Custom Graded Un-Graded Other
Figure 10. Proportion of Grade Lumber Produced by Region & Mill Type
Overall, sawmills reported that 1 common accounted for 26% of production, 2
common 21%, and FAS & 1F 17%. These proportions are similar to other studies (Smith
et al 2004) and reflect the grade yield that was produced by the responding sawmills.
The common grades of lumber accounted for approximately 60% of grade lumber
production and the upper grades accounted for about 30% of production in nearly all
cases with the exception being Southern mills. Southern mills reported that 16% of their
lumber production was un-graded. Framestock, custom graded and un-graded lumber
accounted for small proportions of a mill's lumber production. In the Northern region,
mills produced more Select and Better grade lumber than FAS & 1F. Multiple sawmill
companies produced more FAS & 1F lumber (22%) than single sawmill companies
(16%). These results indicated that grade mix varies depending upon region and mill
type.
Hardwood lumber companies produce lumber in different sizes and with different
levels of processing for various markets. For secondary manufacturing markets, lumber
is typically dried in a kiln whereas pallet cants and railway ties are not kiln dried. This

48
kiln drying adds value to the lumber as does surfacing the lumber. Firms were asked to
report the type of hardwood lumber that they sold in 2007 as proportion of total lumber
sales (Figure 11).
40
43
40
33
40
38
3
3
3
2
3
1
21
20
18
26
20
25
6
4
9
4
6
9
21
20
26
17
22
17
6
7
3
9
6
6
3
3
2
8
3
4
0 10 20 30 40 50 60 70 80 90 100
Total
Appalachian
Northern
Southern
Single Sawmill
Multiple Sawmill
% of Total Lumber Sold
Rough Green Grade Lumber Rough Air Dried Lumber Rough Kiln Dried Lumber
Planed Kiln Dried Lumber Pallet Cants & Lumber Railway Ties
Other
Figure 11. Proportion of Lumber Product Type Sold by Region & Mill Type
The majority of lumber (61%) sold by the lumber manufacturers in this study was
rough green lumber or pallet cants and lumber which are also green and not surfaced.
Only 27% of lumber sold had been kiln dried or planed. Southern mills and multiple
sawmill companies reported selling more kiln dried lumber. Pallet cants accounted for
26% of lumber sold for Northern region mills. Pallet cants and lumber and railway ties
are an important product type for all mills, consisting of over one quarter of all lumber
sales in 2007.
Planed kiln dried lumber accounted for less than 10% of all lumber sold. There is
an opportunity for some sawmills to add more value to the lumber by drying and
surfacing it. A proportion of mills already dry their lumber and some have dimensioning
and concentration yards as part of their operations. These operations are reported on and
discussed in Table 12. The drying and surfacing function is also performed by

49
concentration yards who are one of the customer segments that sawmills sell to. The
proportion of lumber sales in each distribution channel in 2007 is shown in Figure 12.
23
27
21
10
23
21
23
21
30
12
25
15
4
4
4
3
4
2
37
34
37
46
35
43
9
10
6
11
8
13
5
3
2
18
4
7
0 10 20 30 40 50 60 70 80 90 100
Total
Appalachian
Northern
Southern
Single Sawmill
Multiple Sawmill
% of Total Lumber Sold
Concentration Yard Wholesale Distributors Retail OperationsManufacturers Exported Other
Figure 12. Proportion of Lumber Sold to Distribution Channels by Region & Mill Type
Manufacturers accounted for 37% of lumber sold in 2007, followed by
concentration yards and wholesale distributors at 23% each. Exported lumber accounted
for 9% of the lumber sold in 2007. Retail operations continue to be an underutilized
distribution channel for most sawmills. This is likely due to the need to dry and surface
the lumber and stock and service the retail customers. Multiple sawmill companies and
Southern mills sold more lumber to manufacturers as compared to other firms. The
responding Southern mills sold to concentration yards and wholesale distributors much
less than the other mills. Multiple sawmill companies exported more than single sawmill
companies. These results indicated that manufacturers were the primary customers of
sawmills.
In addition to hardwood lumber distribution channels, information was gathered
on promotion expenditures. Promotion was the next element of the marketing mix that
was measured in this study. The price of hardwood lumber is tracked by market report

50
services and hence not measured in this study. Promotion expenditures have not been
measured in any other study yet and it is an important part of the marketing mix. The
proportion of expenditures in each promotion type is shown in Figure 13.
27
29
22
32
26
29
9
8
10
8
6
18
8
8
11
1
5
17
7
5
10
8
6
9
4
7
2
1
6
1
15
9
18
30
15
16
7
9
7
1
8
3
22
24
21
19
28
7
0 10 20 30 40 50 60 70 80 90 100
Total
Appalachian
Northern
Southern
Single Sawmill
Multiple Sawmill
% of Promotion & Advertising Expenditures
Magazines Tradeshows Brochures Internet AdvertisingGiveaways Market Reports Direct Mailings Other
Figure 13. Proportion of Promotion & Advertising Expenditures by Region & Mill Type
The hardwood lumber manufacturers reported their promotion expenditures went
to magazines (27%), other (22%) and market reports (15%). The other category
consisted of local, lower expense advertising mediums such as newspaper, radio, and
telephone books. Multiple sawmill companies reported a large proportion of their
expenditures are used for tradeshows and brochures. Market reports accounted for 30%
of promotion expenditures for Southern mills. Of the respondents, only 60% reported
promotion expenditures and this suggests that the remaining 40% don't promote or
advertise their products or that data wasn't available. An increase in promotion and
advertising spending in the industry could help mills to better reach more customers.

51
Technology Utilization
The adoption and use of advanced production and information technology in the
hardwood lumber industry has the potential to increase productivity and performance.
The relationship between technology utilization and performance will be tested in
Chapter 4. Firms were asked about their use of information and production technology.
Firms indicated whether they used certain technology, how long they have used it and
how important it was to their performance. The results for production technology are
shown in Table 6. Table 6. Production Technology Use, Years Utilized, & Importance
An optimized headrig was utilized by nearly one half of all respondents. An
optimized edger and ring debarker were the next most frequently utilized technologies.
An optimized trimmer and automated sort bins were used by 13% and 12% of
respondents. Bucking optimizers and real time lumber dimension control were not used
frequently by companies. Ring debarkers were the longest utilized technology with an
average of 8 years in use. Optimized trimmers and optimized edgers were the newer
technologies utilized by sawmills as indicated by the number of years in use. Companies
with bucking optimizers and lumber dimension control averaged 7.8 years in use.
Optimized headrigs and edgers were rated the most important technologies to a
company's performance. Real time lumber dimension control and bucking optimizers
were rated as not important to a company's performance. These results suggest that firms
believe that they should adopt optimized headrigs and edgers to improve their
performance.
Theses results when compared to previous research (Bowe 2000) indicate that a
larger proportion of hardwood sawmills have adopted advanced production technologies.
Production Technology Proportion Utilizing Years Utilized Importance¹ Optimized Headrig 49.0% 7.5 4.3 Optimized Edger 26.0% 5.4 4.1 Ring Debarker 22.7% 8.0 3.7 Optimized Trimmer 13.2% 4.7 3.4 Automated Sort Bins 12.2% 8.2 3.1 Real-time Lumber Dimension Control 5.6% 7.8 2.6 Bucking Optimizer 3.6% 7.8 2.4 ¹ 1 = not important, 5 = very important

52
The proportion of mills with a given technology has nearly doubled in many cases. For
example, mills with optimized edgers increased from 10.1% in 1999 to 26% in 2007 and
mills with optimized headrigs increased from 27% in 1999 to 49% in 2007. The goal of
these production technologies is to increase grade recovery, lumber recovery, and
productivity. Based on empirical evidence, the adoption of these technologies has been
shown to improve production, grade and lumber yield, and lumber value, in turn leading
to improved overall performance (Anonymous 2009; Kline et al 1991). The exact
amount of improvement in lumber yield, productivity and grade recovery is generally not
disclosed by mills. The utilization of these production technologies differs according to
firm size (Table 7). Table 7. Production Technology Utilization by Firm Size
Firm Size (Annual Production) N
Optimized Headrig
Optimized Edger
Ring Debarker
Optimized Trimmer
Automated Sort Bins
Real-time Lumber Dimension Control
Bucking Optimizer
0-0.99 Million BF 18 26.3% 5.3% 10.5% 10.5% 0.0% 0.0% 0.0% 1-4.99 Million BF 51 41.8% 30.9% 27.3% 16.4% 9.1% 5.5% 7.3% 5-9.99 Million BF 60 55.6% 25.4% 15.9% 7.9% 11.1% 4.8% 3.2%
10-19.99 Million BF 32 57.6% 27.3% 15.2% 12.1% 18.2% 6.1% 0.0% 20+ Million BF 36 40.5% 24.3% 32.4% 16.2% 16.2% 8.1% 2.7%
The use of advanced production technology by the smallest firms (production
below 1 million board feet) is low or non-existent as compared to the larger firms in the
industry. The advanced production technologies require large capital investments costing
millions of dollars which are often larger than the yearly sales of these smaller mills. In
order to achieve a return on their investment in these technologies, mills need a high
production rate which are also lacking in the smaller mills. The use of optimized edgers
was similar across the four largest groups. The larger mills were more likely to use
automated sort bins and real-time lumber dimension control than the smaller mills. These
results show that in general larger mills are more likely to use advanced production
technology.

53
The use of information technology is also important to the performance and
productivity of firms and the hardwood lumber industry is no exception. Firms were
asked about their use of information technology and its importance to their performance.
The results for information technology are shown in Table 8. Table 8. Information Technology Use, Years Utilized & Importance
Information Technology Proportion Utilizing Years Utilized Importance¹ Email 84.0% 7.2 4.0 Internet 83.0% 7.3 3.7 Computer-Based Lumber Tallying 62.9% 9.5 4.5 Computer-Based Log Tallying 59.4% 9.8 4.3 Website 57.8% 5.9 3.5 Computer-Based Inventory Control 46.0% 9.1 4.3 Internet Selling 23.2% 5.1 2.8 ¹ 1 = not important, 5 = very important
The Internet and email are the most widely used information technologies in the
industry. Internet selling of lumber is only used by 23% of responding companies. The
majority of companies utilize computer-based log and lumber tallying and have a
website. The computer-based log tallying, lumber tallying and inventory control
technologies have been in use for an average of over 9 years. The Internet and email
have been used on average for about 7 years. Firms rated the computer-based log,
lumber, and inventory technologies as the most important to their performance. This
suggested that firms believe that performance can be improved by adopting these
technologies. Since logs and lumber are sawmills most expensive inputs and outputs it is
important to be able to track them effectively. Email, Internet and website were also
rated important whereas Internet selling was not as important. The results are similar to
other research on information technology in the industry. Vlosky and Smith (2003)
reported that 90% of companies in the hardwood industry used the Internet and 55% had
a website. These results indicate that a small majority of hardwood lumber
manufacturers have adopted information technology.
The use of information technologies by firm varied depending on the size of the
firm as shown in Table 9.

54
Table 9. Information Technology Utilization by Firm Size
Firm Size (Annual Production) N Email Internet
Computer-Based Lumber Tallying
Computer-Based Log Tallying Website
Computer-Based Inventory Control
Internet Selling
0-0.99 Million BF 19 68.4% 89.5% 10.5% 15.8% 36.8% 26.3% 15.8% 1-4.99 Million BF 55 65.5% 58.2% 50.9% 49.1% 34.5% 29.1% 12.7% 5-9.99 Million BF 63 85.7% 85.7% 61.9% 57.1% 54.0% 33.3% 19.0%
10-19.99 Million BF 33 90.9% 90.9% 84.8% 78.8% 69.7% 57.6% 24.2% 20+ Million BF 37 94.6% 89.2% 81.1% 75.7% 86.5% 81.1% 40.5%
Larger sized firms were more likely to use computer based lumber tallying,
computer based inventory control and computer based log tallying. The large firms may
benefit the most from these technologies since they have a large volume of logs, lumber
and inventory to track as compared to smaller firms. The differences in the proportion of
firms using email, Internet, and website were smaller between the smaller firms and
larger firms. It is possible that the adoption and use of email, Internet and website is
easier than the adoption and use of the product tracking technologies. These results show
that in general large firms utilize information technology more than smaller firms.
Firms were asked to identify the type of technology used for log tallying, lumber
tallying, and inventory control. The results are shown in Table 10. Table 10. Type of Information Technology Used for Log, Lumber, & Inventory Tracking
Technology Type Log Tallying Lumber Tallying Inventory Control Hand-Held Device 95.7% 83.8% 65.5% Voice Recorder 4.3% 4.5% 1.7% Scanner 0.0% 5.4% 6.9% Spreadsheets 0.0% 1.8% 8.6% Other 0.0% 4.5% 17.2%
Of the companies that utilized computer-based log, lumber and inventory tracking
the majority used hand-held devices. Information is manually input or bar codes are
scanned with this type of device. A small proportion utilized voice recorders or
automated scanners. Almost one quarter of companies indicated that they used manual
entry into spreadsheets or other unspecified methods for inventory control. The use of
these technologies in hardwood lumber companies has increased over time but no direct
comparison of proportions is available for the hardwood lumber industry.

55
Firms were asked to identify functions that they used the Internet for and their
responses are shown in Table 11. Table 11. Proportion of Firms Utilizing Various Internet Functions
Internet Function Proportion Utilizing Purchasing Products 65.5% Customer Inquiry 59.1% Market Research 56.4% Sales Promotion 46.3% Data Transfer 41.4% Internet Sales 29.8% Shipping Notice 29.6% Logistics 25.3% Order Status 24.1% Order Tracking 17.8% Inventory Tracking 14.1%
The main uses of the Internet were for purchasing products, customer inquiry, and
market research followed by sales promotion and data transfer. Internet sales were used
by 30% of responding companies. Inventory tracking and order tracking functions were
not used by many respondents. If more hardwood lumber companies export their lumber
in the future, then use of the Internet for logistics, order tracking, and order status
functions is likely to increase.

56
Business Operations & Performance
Hardwood lumber companies were asked about their auxiliary operations, forest
certification, business area focus, and business performance. These topics are important
in order to monitor the degree of vertical integration, the transition of companies to
greater sustainability, the prevalence of types of business strategy, and the overall
performance in the industry. First, the hardwood sawmills were asked to list operations
other than their sawmill. The number and proportion of mills having a particular
operation is shown in Table 12. Table 12. Additional Operations of Firms
Additional Operation Frequency Percentage Dry Kilns 120 59.7% Planer/Surfacing Mill 98 48.8% Trucking Operations 96 47.8% Forest Holdings 92 45.8% Logging Operations 61 30.3% Dimension Manufacturing 41 20.4% Concentration Yard 40 19.9% Pallet Manufacturing 24 11.9% Other 21 10.4% Flooring Manufacturing 20 10.0% Other Secondary Mfg. 18 9.0% Distribution Facilities 14 7.0% Cogeneration Boiler 13 6.5% Mulch Coloring Operation 7 3.5% Treating Facility 3 1.5% Pellet Mill 3 1.5%
The majority of respondents (60%) had dry kiln operations and 49% had a
surfacing mill. The proportion of mills indicating that they utilized dry kilns has
increased from 43.4% in 2000 (Bowe 2000) to 60% found in this research. These results
suggest that hardwood lumber manufacturers are adding more value to their lumber by
kiln drying it. Slightly less than one half of respondents indicated that they had trucking
operations and forest holdings. Logging operations were reported by 30% of firms.
Concentration yards and dimension manufacturing operations were prevalent in one in
five firms. Despite the recent growth of pellet mills, only 3 sawmills indicated that they
had pellet mill operations. Thirteen sawmills reported that they had a cogeneration
boiler. The lack of bioenergy production and bioenergy products among sawmills is an

57
opportunity for them to diversify their revenues and take control of an important cost
component. These operations on the output side add value to lumber through drying,
surfacing, or dimensioning. The operations such as logging and forest holdings are an
attempt to control inputs to the sawmill (i.e.: raw material supply and costs). Sawmills
who don't have these auxiliary operations have an opportunity to diversify their revenues,
add value to their lumber and control raw material characteristics.
The firms were asked if their company was certified by a forest or chain-of-
custody certification scheme and which scheme they were certified by. Thirty five
percent of respondents (71 companies) indicated that their company was certified by
either forest, chain-of-custody, or both. The type of certification by each forest
certification scheme is shown in Figure 14.
Type of Certification by Certification System
14
28
8
2
13
3
0
3
6
3
2
0
0
5
10
15
20
25
30
35
40
FSC SFI ATFS Other
Certification Program
Freq
uenc
y
Forest Custody Forest & Custody Figure 14. Frequency of Mills Certified by Certification Type & Certification Scheme
The companies that reported that they were certified were about evenly split
between the Forest Stewardship Council (FSC) and Sustainable Forestry Initiative (SFI)
certification schemes. The American Tree Farm System (AFTS) was only used by 10
companies and other schemes were used by 5 companies. The companies using the FSC

58
scheme were evenly divided between forest certification and chain-of-custody
certification and 6 companies had both certifications. The SFI certified companies
mainly had forest certification and not chain-of-custody. The AFTS scheme is used for
forest certification but can be used with other chain-of-custody certification schemes.
The results indicate that a sizable portion of hardwood lumber manufacturers are
certified. Forest certification is a "green" trend in the industry and is required by some
green building systems.
Firms were asked to rate the importance of twenty business areas on a scale from
1 (not important) to 7 very important. These business area variables were developed and
measured by Bush (1989). The ratings for each area are shown in Table 13. Table 13. Importance Ratings of Business Area Variables
Focal Business Area Importance Rating Product quality control 6.3 Efficient operation of production facilities 6.3 Providing customer service 6.3 Reputation within the industry 6.2 Procurement of raw materials 6.0 Providing rapid delivery 5.7 Employing trained/experienced personnel 5.6 Competitive pricing 5.3 Ability to manufacture specialty products 4.8 Serving particular customer groups 4.5 Investment in new processing equipment 4.5 Developing brand identification 4.2 Using new marketing techniques/methods 4.1 Owning timberlands and/or logging operations 4.0 Serving special geographic markets 4.0 Developing new products 4.0 Controlling channels of distribution 3.9 Market research 3.8 Maintaining a company sales force 3.8 Promotion and advertising 3.7
Respondents rated product quality control, efficient operations, customer service
and reputation as the most important areas that they concentrated on. Many of the
variables associated with marketing such as promotion and advertising, sales force,
market research, distribution, and new products received comparatively lower ratings.
However, all of the business areas were rated above the scale midpoint of 3.5 indicating

59
that they are all important. The hardwood lumber industry doesn't place much
importance on promotion and advertising as shown by its low importance rating and the
promotion expenditures. In a hardwood lumber market where customer attrition is
increasing, promoting and advertising to new potential customers is imperative.
Firms were asked to rate their business performance from 1 (low performance) to
5 (high performance) on 12 separate measures relating to production, finance, sales and
human resources. These performance measures were developed in Chapter 2 through
phone interviews and a fax survey of hardwood lumber companies. The performance
ratings were averaged for the 12 performance measures to give an overview of industry
performance. These averages are shown in Table 14. Table 14. Average Performance Measure Ratings
Performance Measure Average Rating Standard Deviation Customer satisfaction 4.4 0.7 Product quality 4.3 0.8 Lumber yield 3.9 0.9 Number of Worker Injuries 3.9 1.3 Employee satisfaction 3.8 0.8 Sales 3.7 0.9 Orders received 3.6 1.0 Board feet per shift 3.6 1.0 Selling price 3.6 1.0 Employee turnover rate 3.5 1.2 Costs 3.5 1.0 Profit 2.9 1.3
The responding firms rated their performance highest in customer satisfaction and
product quality. Performance on lumber yield and worker injuries were also rated as
high. The mills rated their performance on profit the lowest just slightly under neutral.
These results indicated that the industry must improve their performance in costs and
profit. The industry as a whole performed the lowest on the financial performance
dimension. The distribution for the summation of the three scores comprising the
financial dimension is shown in Figure 15.

60
0
5
10
15
20
25
30
35
40
4 5 6 7 8 9 10 11 12 13 14 15 16
Financial Performance Score
Freq
uenc
yN =198Mean = 10.1StDv. = 2.58Skewness = -0.15Kurtosis = -0.58
Figure 15. Financial Dimension Performance Score Distribution
The financial dimension consisted of the sales, cost and profit performance
measures. The average was 10.1 on a possible range of 3 to 15 and the standard
deviation was 2.58. This average was the lowest of all four dimensions and also had the
highest variability. The distribution was normal as indicated by its low skewness and
kurtosis, however, there were an unusual number of high performance scores. The
financial dimension is a lagging indicator of performance and reflected past financial
performance. The relatively low average score on the financial dimension may be an
indication that firms have not concentrated on improving performance in this area. It is
imperative that hardwood lumber manufacturers improve performance by increasing
sales, lowering costs, and this will increase profitability. The distribution of performance
scores for the production dimension is shown in Figure 16.

61
0
10
20
30
40
50
60
5 6 7 8 9 10 11 12 13 14 15 16
Production Performance Score
Freq
uenc
yN = 196Mean = 11.8StDv. = 1.99Skewness = -0.55Kurtosis = -0.54
Figure 16. Production Dimension Performance Score Distribution
The production dimension consisted of the lumber yield, product quality and
board feet per shift performance measures. The average was 11.8 with a standard
deviation of 1.99. This average was the highest of all four dimensions. The distribution
was normal as indicated by its low skewness and kurtosis, however, the distribution is
quite peaked with a high number of firms near the average. The production dimension is
a lagging indicator of performance and reflected past production performance. The high
average score on the production dimension may be an indication that firms have
concentrated on improving performance in this area. Lumber yield, product quality and
production rate are all important to overall firm performance for hardwood lumber
manufacturers. These results in conjunction with the financial dimension suggest that
firms should focus performance improvement activities upon the financial dimension and
not on the production dimension. The distribution of performance scores for the
marketing dimension is shown in Figure 17.

62
0
5
10
15
20
25
30
35
40
45
50
5 6 7 8 9 10 11 12 13 14 15 16
Marketing Performance Score
Freq
uenc
yN = 193Mean = 11.5StDv. = 1.93Skewness = -0.31Kurtosis = -0.02
Figure 17. Marketing Dimension Performance Score Distribution
The marketing dimension consisted of the orders received, customer satisfaction,
and selling price performance measures. The average was 11.5 with a standard deviation
of 1.93. This average was the second highest of all four dimensions. The distribution
was normal as indicated by its low skewness and kurtosis, however, there were a few
firms who had very low scores on this dimension. These firms in particular would
benefit from technical marketing assistance. The marketing dimension is considered a
leading indicator of performance since satisfying customers is associated with repeat
sales. These results suggest that firms were performing well in the marketing dimension.
The distribution of performance scores for the human resources dimension is shown in
Figure 18.

63
0
5
10
15
20
25
30
35
40
5 6 7 8 9 10 11 12 13 14 15 16
HR Performance Score
Freq
uenc
yN = 189Mean = 11.3StDv. = 2.41Skewness = -0.59Kurtosis = -0.11
Figure 18. Human Resource Dimension Performance Score Distribution
The human resource dimension consisted of the employee satisfaction, employee
turnover rate, and number of worker injuries performance measures. The average was
11.3 with a standard deviation of 2.41. The distribution was normal as indicated by its
low skewness and kurtosis, however, there were a number of firms who had relatively
low scores on this dimension. These firms in particular would benefit from increasing
the importance of the human resource function within their organization. Techniques to
increase employee satisfaction and reduce employee turnover would benefit the bottom
line in the long term. The human resource dimension is considered a leading indicator of
performance since satisfied employees is associated with worker productivity. These
results suggest that firms were performing relatively well in the human resource
dimension.
The performance ratings of each company were then summed for all twelve
measures to provide an overall measure of performance for the company and the possible
range for this index is from 12 to 60. These score were used as the dependent variable
for statistical tests in Chapter 4. The distribution of performance scores is shown in
Figure 19.

64
Performance Index Distribution
0
5
10
15
20
25
30
35
27 29 32 34 36 39 41 44 46 48 51 53 55 58 58+
Freq
uenc
y
AverageStDv = 6.64Kurtosis = -0.190Skewnesses = 0.010
Figure 19. Performance Index Distribution
The distribution is normal based on the low kurtosis and slight positive skewness.
The normality of the distribution was tested in SPSS by the Kolmogorov-Smirnov
goodness-of-fit test and found to be non-significant meaning that the distribution is
normal. The average score was 44 and the observed range was 27 to 60. These
performance scores were used to determine how different factors influence performance.
The performance scores were plotted against firm size (Figure 20) and it is evident that
there is no relationship between firm size and the scores.

65
Performance & Firm Size
0
10
20
30
40
50
60
70
0 10 20 30 40 50 60 70 80 90 100
Reported 2007 Volume (Million BF)
Perf
orm
ance
Inde
x
Figure 20. Performance Scores & Firm Size Scatter Plot
The lowest scores were reported by smaller firms. However, when a linear
regression was performed a very small R2 value was obtained (0.01) which indicates no
relationship between firm size and performance scores. These results suggest that
hardwood lumber companies of all sizes perform equally well.
In addition to the performance indicator, firms were asked to rate from 1 (low
performance) to 5 (high performance) how well they have responded to external macro-
environmental trends outside of their control. The ratings were averaged for each of the
13 trends to give an overview of how well the industry is performing. These averages are
shown in Table 15.

66
Table 15. Performance Ratings in Response to External Trends
Performance in Response to: Average Rating Standard Deviation Shortage of loggers 3.3 1.1 Loss of domestic customers 3.3 1.0 Lack of skilled labor 3.3 1.0 Increased operating costs 3.3 1.1 Decrease in lumber production 3.3 1.0 Increased transportation costs 3.2 1.1 High raw material prices 3.2 1.1 Increasing energy prices 3.2 1.1 Stagnant/declining lumber prices 3.1 1.0 Changes in secondary manufacturing 3.0 1.1 Demands of international customers 3.0 1.3 International competition 2.8 1.2 Demand for certified lumber 2.4 1.2
The ratings which range from 3.3 to 2.4 fall mostly around the scale midpoint and
indicate that the industry has performed neither good nor bad in response to these
external trends. The lowest average performance ratings are for demand for certified
lumber and international competition. These observed results contradict the known,
negative effects of these trends on the industry. It is possible that those firms that have
been most severely impacted by these trends have already gone out of business and hence
are not among the respondents. During data collection, a number of firms replied that
they did go out business and a number of the questionnaires were returned undeliverable
suggesting that the firm no longer existed at that location. Without being able to gather
data from failed firms and potentially failed firms, the interpretation of the results are
limited to just the responding companies. They have exhibited average performance in
response to the external trends.
The responding firms reported their sales, production volume and number of
employees in 2007. These three variables were combined in ratios to measure their
production efficiency (volume per employee), sales efficiency (sales per employee), and
revenue per output (sales per volume). These three ratios were then plotted by firm size
to detect any trends.

67
Production Efficiency
0.000
0.100
0.200
0.300
0.400
0.500
0.600
0.700
0.800
0 10 20 30 40 50 60 70 80 90 100
Reported 2007 Volume (Million BF)
Mill
ion
BF
Per E
mpl
oyee
1st Quartile = 0.14
3rd Quartile = 0.28
Median = 0.2
Figure 21. Production Efficiency Ratio & Firm Size Scatter Plot
The median production efficiency as measured by the production volume per
employee was 0.2 million board feet per employee (Figure 21). This ratio describes how
much volume was produced for each employee. The inter quartile range (IQR) between
the 3rd quartile (0.28) and the 1st quartile (0.14) is shaded on the chart. This shaded
region contains the middle 50% of the observed values. These results suggest no
relationship between firm size and production efficiency. The firms below the 1st quartile
should be aware that their production efficiency is low compared to the rest of the
industry and they can improve their performance by producing more with less people.
These production efficiency values serve as a benchmark for the industry to measure
themselves against. The next ratio is sales efficiency as measured by sales per employee
(Figure 22).

68
Sales Efficiency
$0.000
$0.050
$0.100
$0.150
$0.200
$0.250
$0.300
$0.350
$0.400
$0.450
$0.500
0 10 20 30 40 50 60 70 80 90 100
Reported 2007 Volume (Million BF)
Sale
s ($
Mill
ion)
Per
Em
ploy
ee
1st Quartile = 0.13
3rd Quartile = 0.25
Median = 0.17
Figure 22. Sales Efficiency Ratio & Firm Size Scatter Plot
The median sales efficiency as measured by sales per employee was $0.17 million
per employee. This means that in the industry each employee generates about $170,000
worth of sales. The inter quartile range between the 3rd quartile (0.25) and the 1st quartile
(0.13) is shaded on the chart. There is no relationship evident between firm size and sales
efficiency either. The median sales efficiency can serve as a benchmark for the industry
to measure themselves against. The firms below the 1st quartile should be aware that
their sales efficiency is low compared to the rest of the industry and they can improve
their performance by generating more revenue or reducing their number of employees.
The preferred choice would be to generate more revenue and add more value to their
products. The next ratio is revenue per output. This measure includes all sales not just
lumber sales. However, this ratio provides a view of how valuable each mill's output was
in the market. Figure 23 shows the sales per volume.

69
$0.00
$0.50
$1.00
$1.50
$2.00
$2.50
$3.00
0 10 20 30 40 50 60 70 80 90 100
Reported 2007 Volume (Million BF)
Tota
l Sal
es P
er V
olum
e (B
F)
1st Quartile = 0.62
3rd Quartile = 1.1
Median = 0.83
Figure 23. Sales per Volume Ratio & Firm Size Scatter Plot
The median revenue per output as measured by sales per volume was $0.83 per
board foot. This means that in the industry each board foot generates $0.83 worth of
revenue. This ratio is a consequence of each mill's product types and species mix. The
inter quartile range between the 3rd quartile ($1.1) and the 1st quartile ($0.62) is shaded on
the chart. This shaded region contains the middle 50% of observed values. There is no
relationship evident between firm size and sales per volume either. The firms below the
1st quartile should be aware that their revenue per output is low compared to the rest of
the industry and they can improve their performance by adding more value to their
products (i.e.: selling planed or rough kiln dried lumber) and/or switching to higher
valued species. Mills can measure their progress in improving performance by setting
goals using this information.
The ratios have been plotted against firm size and no relationship has been
exhibited. The next figure shows production efficiency plotted against sales per volume.

70
0.000
0.100
0.200
0.300
0.400
0.500
0.600
0.700
0.800
0.900
$0.00 $1.00 $2.00 $3.00 $4.00 $5.00 $6.00
Sales per volume ($/BF)
Volu
me
per e
mpl
oyee
(Mill
ion
BF)
1st Q
uarti
le =
0.6
1
Med
ian
= 0.
83
3rdQ
uarti
le =
1.1
1st Quartile = 0.14
3rd Quartile = 0.28
Median = 0.2
Figure 24. Production Efficiency Ratio & Revenue per Output Ratio Scatter Plot
The majority of responding firms are within the inter quartile ranges (IQR) at the
intersection of the shaded areas (Figure 24). These shaded areas contain the middle 50%
of all observed values. This plot does seem to suggest a trade off between revenue per
output and production efficiency at least for some firms. The six firms that are below the
1st quartile (lower left) on both measures have exhibited poor revenue per output and poor
sales per volume. A number of firms (23, 11% of respondents that are plotted in the
lower right of the figure) have high sales per volume but sub-1st quartile production
efficiency. The firms with these characteristics would benefit from an improvement in
production efficiency. Another group of companies have high production efficiency but
sub-1st quartile sales per volume and these firms should improve their performance on the
latter measure. These results indicate that most responding sawmills are very competitive
in their production efficiency and revenue per output. These measures give mills a way
to benchmark their performance against the industry average.
Firms were asked what they would change to improve the performance of their
company. The responses were summarized, categorized, and then tallied to provide
frequencies and proportions. Roughly one half of responding companies (96) provided

71
responses to the open ended question. The responses to this question are shown in Table
16. Table 16. Responses to Open-Ended Performance Improvement Question
Changes Needed to Improve Performance Frequency Percentage Upgrade Equipment or Technology 31 30% Lower Costs (Logs, Energy, Labor & Transportation) 27 26% Improve Markets/Economy 13 13% Training & Improve Workforce/Sales/Management 13 13% Increase Efficiency/Recovery 12 12% Increase Sales & Sales Price 11 11% Decrease or Stop Production 7 7% Other Production Related 7 7% Other Marketing Related 7 7% Increase Specialty Products/Customers 5 5% Other Regulation Related 5 5% Diversify 4 4% Increase Log Supply 4 4% Better Communication & Coordination 3 3% Increase Value Added 3 3% Adapt to & Focus on Industrial Timber Market 2 2% Enter new markets 2 2% Increase Retail Sales 2 2% Nothing 2 2% Own & Invest in Timberland 2 2% Unknown 2 2%
Thirty percent of respondents suggested that they would upgrade equipment or
technology to improve their performance. Many of these respondents cited the need for
large amount of capital as a limitation. Reducing costs in general and log costs
specifically were the next most frequently mentioned change needed. Other suggested
changes were to improve the markets and economy, improve the workforce, sales force
and management, increase efficiency, and increase sales and sales price. A number of
suggestions were categorized as relating to either production, marketing, or regulation.
The results suggest that mills should focus on upgrading equipment, lowering costs,
increasing efficiency and sales, and improving their workforce in order to improve their
performance. Improving the market and economy along with modifying regulation are
outside of an individual firm's control.

72
Conclusions
The vast majority of the respondents were NHLA members (88%) and the
adjusted response rate was 19.8%. Response rates were much lower for generic NHLA
members and non-members. The results from this research are most applicable to
companies with demographics similar to the average sized company. A third mailing and
a four month data collection period was needed to achieve satisfactory response rates. A
comparison of means between the available non-respondents and early respondents and
the early respondents and late respondents did not detect non-response bias. The lumber
production, sales and number of employees were all similar to previous studies (Bowe
2000). Most of the responding companies were located in the Appalachian hardwood
region and a large majority sold their wood residues.
The marketing mix of hardwood lumber companies including product,
distribution and promotion was measured. The species mix consisted mainly of oak,
maple and poplar. The common grades of lumber accounted for approximately 60% of
lumber production and the upper grades accounted for about 30% of production. The
majority of lumber (61%) sold was rough green lumber or pallet lumber and cants. The
sawmill distribution channels in order of sales percentage were manufacturers,
concentration yards and wholesale distributors. Magazines, market reports, and other
mediums were where hardwood sawmills spent most of their promotion expenditures
despite 40% of respondents not having any promotion expenditures. Based on this
information, there is potential for hardwood lumber companies to: sell more value added
products (i.e. dried lumber); advertise and promote their mills better; diversify their
species mix; and explore retail distribution channels. Mills would need to place increased
emphasis on marketing, identify new customers, and target new markets.
The utilization of advanced production technology has increased in the industry.
The proportion of mills utilizing a given technology has doubled in many cases. The
industry should adopt optimized headrigs, optimized edgers, and optimized trimmers to
improve performance. A large majority of respondents are utilizing the Internet and
email whereas a small majority are utilizing log, lumber and inventory information
technology. Information technology was rated important to performance and should be
adopted by firms.

73
The majority of respondents (60%) had dry kiln operations and 49% had a
surfacing mill. The proportion of mills indicating that they utilized dry kilns has
increased from 43.4% in 2000 (Bowe 2000) to 60% found in this research. This suggests
that the amount of kiln capacity in the industry has increased and that companies are
seeking to add more value to their lumber by drying it. Thirty five percent of respondents
(71 companies) indicated that their company was certified by either forest, chain-of-
custody, or both. These firms are well positioned to take advantage of demand for
certified lumber being created by green building systems. Respondents rated product
quality control, efficient operations, customer service and reputation as the most
important areas that they concentrated on. The changes in auxiliary operations and
certification were important trends for companies to be cognizant of.
The distribution of tallied performance scores on the indicator was normal and
evidence suggested that there was no relationship between firm size and performance
scores. Industry wide profit and costs performance was rated the lowest and this suggest
areas for firms to improve upon. There was no relationship between the three ratios
(production efficiency, sales efficiency, and revenue per output) and firm size. These
ratios provided benchmarks for mills to measure themselves against. The results from the
open-ended question suggested that mills should focus on upgrading equipment, lowering
costs, increasing efficiency and sales, and improving their workforce in order to improve
their performance. In the next chapter, performance and its relationship to firm-
controlled factors are investigated.

74
References
Abdi, H. (2007). Bonferroni and Sidak corrections for multiple comparisons. Encyclopedia of Measurement and Statistics. N. J. Salkind. Thousand Oaks, CA, Sage 103-107.
Anonymous. 2009. "INOVEC Optimization and Control Systems Company Information." Retrieved May 12,, 2009, from http://www.inovec.com/ino/successstories.html.
Booth, D. and I. Vertinsky 1991. Strategic Positioning in a Turbulent Environment: An Empirical Study of Determinants of Performance in the North American Forest Industry. Forest Science 37: 903-923.
Bowe, S. 2000. Modeling the Adoption Decision Process of Future Scanning and Optimizing Technology in Hardwood Sawmills. Department of Wood Science & Forest Products. Blacksburg, Virginia Tech. PhD. 138.
Bowe, S. A., R. L. Smith and P. A. Araman 2001. A National Profile of the U.S. Hardwood Sawmill Industry. Forest Products Journal 51(10): 25-31.
Bumgardner, M., U. Buehlmann, A. Schuler and R. Christianson 2004. Domestic Competitiveness in Secondary Wood Industries. Forest Products Journal 54(10): 21-28.
Bush, R. 1989. Business-level competitive strategy in the United States hardwood lumber industry. Wood Science & Forest Products. Blacksburg, VA, Virginia Polytechnic Institute and State University. Ph.D. 209.
Bush, R., J. Bejune, B. Hansen and P. Araman 2002. Trends in the Use of Materials for Pallets and Others Factors Affecting Demand for Hardwood Products. 30th Annual Hardwood Symposium, Fall Creek Falls, TN, National Hardwood Lumber Association.76-81.
Bush, R. J. and S. A. Sinclair 1991. A Multivariate Model and Analysis of Competitive Strategy in the U.S. Hardwood Lumber Industry. Forest Science 37(2): 481-499.
Cohen, D. H. and S. A. Sinclair 1992. The Strategic Management Paradigm and the Wood Building Products Industry: A Model of Strategies and Firm Profitability. Forest Science 38: 786-805.
Cumbo, D., R. Bush and R. Smith 2001. The Upholstered Furniture Industry: Material Use Trends in Frame Stock Applications. Blacksburg, VA, Center for Forest Products Marketing & Management, Department of Wood Science & Forest Products, Virginia Tech. 21.
Dawes, J. 1999. The relationship between subjective and objective company performance measures on market orientation. Marketing Bulletin 10: 65.

75
Dess, G. G. and J. Richard B. Robinson 1984. Measuring organizational performance in the absence of objective measures: The case of the privately-held firm and conglomerate business unit. Strategic Management Journal 5(3): 265-273.
Dillman, D. A. 2000. Mail and Internet Surveys : The Tailored Design Method New York, John Wiley & Sons.
Garrison, D. G. 2008. "T-tests, from Statnotes: Topics in Multivariate Analysis." Retrieved February 26, 2008, from http://faculty.chass.ncsu.edu/garson/PA765/ttest.htm.
HMR 2006. 10th Annual Statistical Analysis of the North American Hardwood Marketplace. Memphis, TN, Hardwood Market Report. 172.
HRE 2006. Hardwood Review Express. Charlotte, NC, Hardwood Publishing, Inc. 6 12.
Kline, D. E., P. A. Araman and C. Regalado 1991. Increasing Hardwood Lumber Recovery and Value at the Edger and Trimmer. Forest Industries Clinic & Show. Portland, OR.
Kline, R. B. 1998. Principles and practice of structural equation modeling. New York, Guilford Press.
Luppold, W. 2006. Personal Communication. B. Perkins. Princeton, WV.
McDonald, J. 2007. "Chi-squared test of independence." Retrieved October 22, 2007, from http://udel.edu/~mcdonald/statchiind.html.
Niemela, J. S. and P. M. Smith 1995. A Marketing Strategy Comparison: Finland, Western United States, and British Columbia. Forest Products Journal 45(11/12): 27-35.
O'Laughlin, J. and P. V. Ellefson 1981. U.S. Wood-Based Industry Structure: Part III - Strategic Group Analysis. Forest Products Journal 31(12): 25-31.
Palepu, K. 1985. Diversification Strategy, Profit Performance and the Entropy Measure. Strategic Management Journal 6(3): 239.
Rich, S. U. 1986. Recent Shifts in Competitive Strategies in the U.S. Forest Products Industry and the Increased Importance of Key Marketing Functions. Forest Products Journal 36(7/8): 34-44.
RMA 1995-2006. Manufacturing-Sawmills NAICS 321113. Annual Statement Studies. R. M. Associates. Philadelphia, PA.
Smith, P., S. Dasmohapatra and W. Luppold 2004. A profile of Pennsylvania's hardwood sawmill industry. Forest Products Journal 54(5): 43-49.
Toby, D. W., M. Jonathan, P. Malcolm and J. W. Stephen 2004. On the Validity of Subjective Measures of Company Performance. Personnel Psychology 57(1): 95.

76
USCB 1999. Sawmills :1997. Economic Census, Manufacturing Industry Series, U.S. Census Bureau. 37.
USCB 2004. Upholstered Household Furniture Manufacturing: 2002. Economic Census, Manufacturing Industry Series, U.S. Census Bureau. 11.
USCB 2005. Sawmills : 2002. Economic Census, Manufacturing Industry Series, U.S. Census Bureau. 13.
USCB. 2007. "Census Bureau - Annual Survey of Manufactures." Retrieved July 5, 2007, from http://www.census.gov/mcd/asm-as2.html.
USCB 2007. Lumber Production and Mill Stocks. Current Industry Reports, U.S. Census Bureau.
Vlosky, R. P. and T. M. Smith 2003. eBusiness in the U.S. Hardwood Lumber Industry. Forest Products Journal 53(5): 21-29.

77
Chapter 4. Firm-Controlled Factors that Influence Business
Performance
Introduction
Hardwood lumber manufacturers have been impacted by stagnant sales and
increasing costs which have led to decreasing profitability. Changes in hardwood lumber
markets such as the decline in consumption by furniture and pallet manufacturers have
led to decreases in production. These trends have resulted in mill closures and
consolidation in the industry and were driven by globalization, decreasing demand in the
housing and transportation sectors, and other macroeconomic factors. It would benefit
firms in the industry to understand how to improve their performance. It was within this
context that this research project sought to discover opportunities for improvement of
firm performance in the hardwood lumber industry.
The business literature suggests that numerous marketing and management
factors, including strategic, geographic, tactical, technological, and organizational factors,
may influence firm performance. These factors were all within the control of the firm.
Ellefson and Stone (1984) listed all of these factors and more as influencing firm and
industry performance. Strategic factors could influence firm performance since one
strategy may perform better than others (Rich 1986). Geography could influence firm
performance because the forest resource changes from region to region and species are
valued differently in the market (Luppold and Dempsey 1994). The use of advanced
technology could improve productivity and firm performance (West and Cooper 1996).
Different product, promotion and customer tactics may be related to performance
(Ellefson and Stone 1984; Palepu 1985). Finally, firms that were vertically integrated
could perform better than non-integrated firms (Cohen and Sinclair 1992). These factors
were measured in a mail survey and used in statistical analysis to identify relationships
among the variables.
Other factors that were beyond the control of the firm certainly impact firm
performance such as economic growth, demand, supply, substitutes, industry structure,
regulation, taxes, trade policy, natural resources, etc (Ellefson and Stone 1984; Martin et

78
al 1991). These external factors were assumed to affect firms equally. Therefore, these
factors were not within the purview of this research project.
Business performance has traditionally meant profitability and financial measures
such as return on investment, return on assets, and return on sales are prevalent in
previous studies (Booth and Vertinsky 1991; Cohen and Sinclair 1992; O'Laughlin and
Ellefson 1981; Palepu 1985; Rich 1986; Rumelt 1982). More recent studies have used
non-traditional measures of firm performance such as market share and customer
satisfaction; and subjective rating scales such as performance relative to competitors
(Covin et al. 1990; Narver and Slater 1990; Pelham 1997). Over time, companies and
researchers have increasingly relied on multiple measures of performance and moved
away from strictly using financial performance measures. This trend formed the basis of
developing a multiple-measure performance indicator for hardwood lumber
manufacturers (Chapter 2).
Companies within the hardwood lumber industry are predominantly privately held
and there was no publicly available performance data. The reluctance of companies to
share performance data and the time required to develop and provide the information
would have likely caused a low response rate and so an alternative approach was needed.
This approach was to utilize subjective self-rated operational and financial performance
metrics directly from the company's president, owner, or chief executive. Studies have
shown that subjective measures of performance correlate well to objective measures
(Dess and Robinson 1984; Dawes 1999; Toby et al. 2004). Therefore, subjective
performance measures from multiple perspectives were developed.
The multiple perspectives that formed the basis for the performance indicator
were based on the balanced scorecard which was developed by Kaplan and Norton
(1998). It measured performance from four distinct perspectives of a business: financial,
internal, customer and innovation. The financial perspective included the traditional
measured of business performance such as return on investment, return on sales and
others. The internal perspective measures business processes needed to fulfill their
mission and in hardwood lumber manufacturing this was synonymous with production.
The customer/marketing perspective metrics focused on how well the company was
satisfying their customers by utilizing marketing techniques. Finally, the

79
innovation/learning perspective measured knowledge growth through employee training
and retention. This perspective was customized as human resources for hardwood
lumber manufacturers since there was little innovation in the industry. The balanced
scorecard framework was customized for the hardwood lumber industry because the
performance literature reviewed indicated that measuring performance from multiple
perspectives was valid, current, and the most effective way given the constraints of the
hardwood lumber industry.
Metrics from each of the four perspectives were developed and incorporated into
a multiple-measure performance indicator specific to hardwood lumber manufacturers.
The three performance measures that were rated the most frequently used and the most
important in each of the four dimensions (financial, production, customer, human
resources) were used to form the multiple-measure performance indicator. This twelve
measure performance indicator (Figure 25) consisted of the following metrics: costs,
sales and profit in the financial dimension; quality, yield and board feet per shift in the
production dimensions; selling price, customer satisfaction and orders received in the
customer dimension; and number of worker injuries, employee satisfaction and employee
turnover rate in the human resource dimension.
Low
Performance High
Performance Lumber yield 1 2 3 4 5 Don’t know Number of orders received 1 2 3 4 5 Don’t know Employee Satisfaction 1 2 3 4 5 Don’t know Sales 1 2 3 4 5 Don’t know Product quality 1 2 3 4 5 Don’t know Employee turnover rate 1 2 3 4 5 Don’t know Costs 1 2 3 4 5 Don’t know Customer satisfaction 1 2 3 4 5 Don’t know Profit 1 2 3 4 5 Don’t know Board feet per shift 1 2 3 4 5 Don’t know Number of worker injuries 1 2 3 4 5 Don’t know Selling Price 1 2 3 4 5 Don’t know
Figure 25. Hardwood Lumber Business Performance Indicator
The performance indicator was designed with subjective performance ratings
where respondents self rated their company’s performance on a scale from one (low

80
performance) to five (high performance) on each of these 12 metrics. This performance
indicator was used in the main survey in order to measure individual firm performance of
hardwood lumber manufacturers.
The performance indicator was tested for reliability using both internal
consistency and split half reliability using SPSS. The results of these two reliability tests
were good. A Cronbach's alpha of .81 was obtained which was considered good. This
meant that the indicator correlated highly with all possible 12-item indicators measuring
the same variables (Garrison 2008a). The split half reliability analysis resulted in a
Spearman-Brown coefficient of 0.82 which was also considered good. From these tests it
can be concluded that the performance indicator was reliable.
From the background information on the hardwood lumber industry and the
review of literature on performance, it was evident that there was a need to find out what
influenced performance in the industry. The performance of the hardwood lumber
manufacturers was largely unknown and warranted study. This raised the question of
how well companies were performing and what influenced their performance?
Discovering answers to these questions formed the basis of the goals for this chapter.
Objectives
The purpose of this chapter was to identify opportunities for performance
improvement of eastern hardwood lumber manufacturers by investigating factors that
influenced firm performance. A number of hypotheses were developed and tested in
order to achieve this purpose. The main objective of this chapter is to determine the
influence of firm-controllable factors on the firm performance of eastern hardwood
lumber manufacturers. The completion of this objective will identify opportunities for
performance improvement. The next section describes the methods needed to achieve the
objective.
Methods
A mail survey of hardwood lumber manufacturers was conducted during the fall
of 2009. An adjusted response rate of 19.8% was obtained and the questionnaire
measured demographics, business performance, marketing mix, operations, strategy,
technology, and geographic region. The 12-item performance indicator developed in

81
Chapter 2 was used by respondents to subjectively self-rate their performance. The
questions and performance indicator can be found in Appendix E. Mail Questionnaire.
The responses to the questionnaire were summarized in Chapter 3. The methods for this
chapter involved utilizing response data in various statistical tests in order to: detect
factors within the data (factor analysis), identify homogeneous groups within the
population (cluster analysis), and detect the presence or absence of relationships between
the independent and dependent variables.
Factor analysis and correspondence analysis were utilized to reduce data into
components. Factor analysis was utilized for the strategy factor where numerical data
was measured and correspondence analysis was utilized for the organizational factor
where categorical data was measured. These analyses reduced the number of variables
into a smaller number of components, dimensions or factors. The results of the factor
and correspondence analysis were then used to classify or cluster firms into groups.
Cluster analysis was utilized to identify groups so that their performance means
could be tested with ANOVA or t-tests. Cluster analysis has been widely utilized in
business research and the social sciences. It has been used to identify homogeneous
groups within a larger data set based on a given variable. Similar cases or respondents
are grouped into clusters based on their response to a given variable. Clusters formed by
statistical should be homogeneous and easy to interpret. Cluster membership was used as
the independent variable in an ANOVA or t-test.
In most statistical tests that were conducted to test hypotheses, the dependent
variable was the performance score variable (Appendix B. Statistical Test Summary).
The comparison of performance means was accomplished by utilizing t-tests or analysis
of variance (ANOVA). The t-test and ANOVA tested for differences between group
means and a significant difference was customarily indicated by an alpha (p-value) of
0.05 or less. The test results of the ANOVA or t-test were used as evidence for rejecting
or accepting hypotheses. The calculation of performance scores is described next
followed by a detailed explanation of the statistical analyses and tests for each of the five
factors and the associated hypotheses.

82
Statistical Techniques
Once data was collected and examined it was entered into SPSS. In nearly all
cases the dependent variable was performance as measured by the performance indicator
previously described. The twelve performance ratings of each company were summed to
provide an overall performance score for each company and the possible range for this
index was from 12 to 60. This approach of developing an overall performance
composite from performance measures has been used in previous research (Pitt et al.
1996, Hoque and James 2000, Hayes 2002, Van der Stede et al. 2006). The distribution
of total performance scores was evaluated for normality and the degree of skewness and
kurtosis was determined (Figure 26).
Performance Index Distribution
0
5
10
15
20
25
30
35
27 29 32 34 36 39 41 44 46 48 51 53 55 58 58+
Freq
uenc
y
AverageStDv = 6.64Kurtosis = -0.190Skewnesses = 0.010
Figure 26. Performance Index Distribution
The average score was 44 and the observed range was 27 to 60. The distribution
was normal based on the low kurtosis and slight positive skewness. Highly skewed
(greater than 3) or highly kurtosis (between 8 and 20) distributions require non-
parametric statistical techniques (Kline 1998). The normality of the distribution was
tested in SPSS by the Kolmogorov-Smirnov goodness-of-fit test and found to be non-

83
significant meaning that the distribution was normal. These performance scores were the
dependent variable used to determine how different factors influenced performance. In
addition to the performance indicator, the sales, employment and production data were
combined in various ratios to provide an overall measure of production efficiency, sales
efficiency, and revenue per output for the respondents. Comparison of performance on
these three additional performance variables was conducted in some instances. In the
next section, a description of the statistical procedures and tests that were utilized for
each factor (i.e. organization, geography, technology, tactics, and strategy) is presented.
Organizational Factor
Hardwood lumber producers could be vertically integrated organizations in that
they own forestland, logging, sawmill, kiln drying, and secondary manufacturing
operations. The degree of vertical integration within the eastern hardwood lumber
industry was measured by asking companies to identify their auxiliary operations. The
most frequently cited operations were dry kilns (60%), surfacing mills (49%), trucking
operations (48%), forest holdings (46%), and logging operations (30%). Vertically
integrated firms were hypothesized to perform better than non-vertically integrated firms
(Hypothesis 11). In order to compare performance between these firm types the vertical
integration dimension within the data had to be confirmed and then the firms had to be
classified. A correspondence analysis was used to identify the integration dimension.
Correspondence analysis is a data reduction technique used to identify factors
from categorical data. The categorical data for the auxiliary operations was input into
SPSS and analyzed. A two factor solution was generated which represented backward
integration (Factor 2) with forest holdings and logging operations loading onto this factor
(shown in bold) and not loading onto the first factor. The first factor represented forward
integration (Factor 1) with dry kilns, surfacing mill and dimension manufacturing loading
on to this factor (shown in bold) as shown in Table 17.

84
Table 17. Factors Loadings for Auxiliary Operation Variables
Factor
Operations Variable 1
"Forward Integrated"
2
"Backward Integrated"
Forest Holdings .036 .464
Logging Operations .003 .408
Dry Kilns .434 .025
Planer/Surfacing Mill .540 .003
Trucking Operations .118 .132
Dimension Manufacturing .447 .154
Pallet Manufacturing .089 .049
Treating Facility .021 .066
Concentration Yard .280 .025
Cogeneration Boiler .212 .009
Flooring Manufacturing .210 .069
Other Secondary Manufacturing .198 .008
Pellet Manufacturing .001 .114
Distribution Facilities .238 .003
Mulch Coloring Operation .056 .004
Other .001 .006
The dimension manufacturing variable and the other operational variables were
dropped from further use as classifiers as they were used by a small percentage of
respondents (20% or less) and they didn't correlate highly (above 0.4) with the factors.
Dimension manufacturing didn't discriminate either backward or forward integration as
well as the other variables because it loaded onto the second factor and the first factor.
The two factors represented firms that were backward integrated and forward integrated.
A third and fourth possible level of vertical integration was constructed consisting of
those companies who were both backward and forward integrated and those who weren't
integrated at all. Each company was then classified depending upon their yes or no
responses as backward integrated, forward integrated, backward and forward integrated
or not integrated. An analysis of variance (ANOVA) was conducted with the
performance scores as the dependent variable and the categories as the independent
variable.

85
Three other organizational related performance comparisons were possible with
the data that was collected. Two types of firms were identified in the mail questionnaire:
those with a single sawmill and those with multiple sawmills. Firms were classified as
either belonging to the National Hardwood Lumber Association (NHLA) or not. The
firm type and membership type comparisons were made using a t-test. The last
comparison was of firm size and performance. Respondents were classified into five
groups based on their reported production volume and then the group means were
compared with an ANOVA.
Geographic Factor
During the theoretical development (Chapter 1), Hypothesis 5 (H5) was
developed and stated hardwood lumber producers who are geographically diversified
perform better than those firms who have geographically limited operations. Companies
with at least one mill in two different regions were to be considered geographically
diversified. The responses to the mail survey indicated that only 4 companies had mills
in more than one region. Therefore, H5 couldn't be tested due to a lack of mills with this
requisite characteristic. In lieu of the planned test, a comparison of performance between
mills in the Appalachian, Southern, and Northern regions was conducted. The
performance scores of firms in each region were compared using ANOVA.
Production Technology Factor
Firms were initially classified into two categories based on their yes or no
responses of utilizing production technologies: high technology users or low technology
users. Firms who indicated that they used all of the following: optimized headrigs,
optimized edgers and optimized trimmers were considered high technology users. This
classification was warranted given the frequency of companies utilizing optimized
headrigs (49%), optimized edgers (26%) and optimized trimmers (13%). These three
technologies were the main lumber manufacturing technologies and were also rated
important to performance. The performance scores of firms in each category were
compared using ANOVA.
The number of firms classified as high technology users was low with only 18 out
of 197 firms utilizing all three technologies. This classification didn't adequately capture
the diversity of responses and adoption levels by responding firms. For example, some

86
firms didn't utilize all three technologies and only utilized only one or two of them.
Therefore, a cluster analysis was conducted to identify homogeneous groups within the
results. A two-step cluster analysis was used because of the categorical data type and the
large sample size. All seven production technology variables were analyzed and a 3
cluster solution was identified. The homogeneity of responses within the clusters was
low and the practical rationale of the clusters was confusing. Therefore, another cluster
analysis was conducted with only 3 production technology variables: optimized headrig,
optimized edger, and optimized trimmer. A four cluster solution based on these three
variables is shown Table 18. Table 18. Cluster Analysis of Production Technology Users
Use Optimized Headrig Use Optimized Edger Use Optimized Trimmer No Yes No Yes N Y
Cluster Frequency Percent Frequency Percent Frequency Percent Frequency Percent Frequency Percent Frequency Percent 1 (n=32) 5 16% 27 84% 0 0% 32 100% 32 100% 0 0% 2 (n=26) 4 15% 22 85% 6 23% 20 77% 0 0% 26 100% 3 (n=48) 0 0% 48 100% 48 100% 0 0% 48 100% 0 0% 4 (n=92) 92 100% 0 0% 92 100% 0 0% 92 100% 0 0%
This 4 cluster solution provided both high homogeneity within the clusters and a
practical interpretation of the results. All Cluster 1 firms utilized optimized edgers and
most used optimized headrigs but none used optimized trimmers. All cluster 2 firms
utilized optimized trimmers and most but not all used the other two technologies. All
firms in cluster 3 utilized optimized headrigs but none used optimized edgers or
trimmers. Firms in cluster 4 didn't utilize any of these advanced production technologies.
A cluster variable was generated by SPSS and this represented the firm's membership in a
particular cluster. This variable was used in ANOVA as the independent variable to
compare performance means between groups.

87
Information Technology Factor
For information technology, firms who indicated that they used one or more of the
log, lumber, or inventory measurement information technologies listed were considered
high technology level firms. This classification was warranted given the results in
Chapter 3 which show that these technologies were important to firm performance and a
large majority of firms already utilized email and the Internet and therefore these
technology variables weren't useful for classifying firms. A two-step cluster analysis was
also conducted to identify homogeneous clusters and verify the classification utilized. A
7 cluster solution based on the computer based log tallying, lumber tallying, and
inventory control variables was identified in SPSS (Table 19). Table 19. Cluster Analysis of Information Technology Users
Use CB Log Tallying Use CB Lumber Tallying Use CB Inventory Control N Y N Y N Y
Cluster Frequency Percent Frequency Percent Frequency Percent Frequency Percent Frequency Percent Frequency Percent
1 (n=63) 0 0% 63 100% 0 0% 63 100% 0 0% 63 100%
2 (n = 36) 0 0% 36 100% 0 0% 36 100% 36 100% 0 0%
3 (n = 13) 5 38% 8 62% 13 100% 0 0% 0 0% 13 100%
4 (n = 13) 0 0% 13 100% 13 100% 0 0% 13 100% 0 0%
5 (n = 50) 50 100% 0 0% 50 100% 0 0% 50 100% 0 0%
6 (n = 13) 13 100% 0 0% 0 0% 13 100% 13 100% 0 0%
7 (n = 15) 15 100% 0 0% 0 0% 15 100% 0 0% 15 100%
The cluster analysis identified 7 homogeneous groups based on these three
variables. All of the groups except cluster 5 utilized some combination of either
computer based log tallying, lumber tallying or inventory control. Cluster 5 firms didn't
utilize any of these three information technologies and this cluster was the same size
(n=50) as the low tech group utilizing the initial classification (Table 36). This meant
that the initial classification and the cluster analysis were in agreement. Cluster 1 had 63
firms that utilized all three information technologies. These results indicated that firms
had adopted varying levels of information technology and that a slight majority (56%)
utilized two or more of these technologies. The performance scores and performance
ratios of high and low information technology firms were compared utilizing ANOVA.

88
Marketing Tactics Factor
In the theoretical development section, three hypotheses (H8, H9, & H10) were
proposed and stated a positive relationship existed between product, customer and
promotion diversification and firm performance of hardwood lumber manufacturers. The
null hypothesis was that these three variables were not related to firm performance. In
order to determine this, a linear regression analysis was conducted. The amount of
variance of the dependent variable (performance score) explained by each of the
independent variables (R2) was determined. The independent variables entered the model
and an ANOVA was used to determine if the independent variables explained a
significant portion of the variance in the dependent variable.
First, the diversification level of each firm on each marketing mix variable was
computed. This measure was computed by using the following measure of
diversification adapted from Palepu (1985) which was also used by Booth and Vertinsky
(1991).
D = ∑ Pi * ln(1 / Pi)
Where:
D = diversification
Pi = share of ith segment
ln = natural log
i = segment or category
This computation was conducted for species, product type and grade mix in the
product category and for distribution channels and promotion expenditures. This
measure of diversification increased as the firm has more types of products, distribution
channels, or promotion venues. The minimum diversification value is zero and it is
reached when a firm had all of its products, distribution channels or promotions in one
segment. The maximum diversification was reached when the firm’s sales or production
were equally distributed among all possible segments. For example, if a company had
their production split equally among 10 species their total diversification would be 2.302
whereas a company with their production split equally among 3 species would be 1.0986.

89
The mean diversification score, adjusted R2, and significance level for each marketing
mix variable are shown in the results section.
In addition to testing for a relationship between marketing mix diversification and
firm performance, a comparison of firm performance between different groups based on a
firm's market mix was also conducted. Firms were grouped utilizing two-step cluster
analysis for each of the following marketing mix variables: product type, species mix,
grade mix, and distribution channel. Promotion expenditures were not able to be
clustered due to the low proportion of firms reporting this information or having these
expenditures. The values shown in bold are the largest in that category and serve as a
basis for interpretation and description of the clusters. A cluster variable was generated
for each cluster analysis and then an ANOVA was conducted to detect differences
between groups on performance scores and ratios for each marketing mix variable. The
cluster profiles for each variable are presented next. Table 20. Cluster Analysis of Firms based on Proportions of Product Type Sold
Cluster N
Rough Green Grade
Lumber Percent
Rough Air-Dried Grade
Lumber Percent
Rough Kiln-Dried Grade
Lumber Percent
Planed Kiln-Dried
Grade Lumber Percent
Pallet Cants & Lumber Percent
Railway Ties
Percent
1 "green" 116 59.1 4.2 2.1 0.7 24.7 8.2 2 "dry" 87 14.8 0.9 46.0 13.7 16.1 2.4
As shown in Table 20, Cluster 1 mainly sold rough green grade lumber and
pallets cants and lumber in 2007. Cluster 2 mainly sold rough kiln dried grade lumber
and nearly equal parts rough-green and planed kiln-dried grade lumber and pallets cants
and lumber. The performance of these two clusters was compared with ANOVA in the
results section.
A cluster analysis on the grade mix variable was conducted next. The custom
graded and un-graded variables were excluded due to the low percentage of lumber
produced in these categories. A two cluster solution was identified by SPSS (Table 21).

90
Table 21. Cluster Analysis of Firms based on Lumber Grade Type Produced
Cluster N
FAS Percent
Select & Better
Percent
1 Common Percent
2 Common Percent
3 Common Percent
Framestock Percent
1 "lower grade"
98 7.2 17.5 20.4 22.1 13.0 6.6
2 "higher grade"
87 28.8 6.7 32.8 19.1 7.8 3.0
The firms in cluster 1 had a relatively low percentage of lumber production in the
upper grades and a lumber grade distribution that was skewed toward the lower grades.
Cluster 1 firms also had a higher percent of ungraded lumber (11%) as compared to
cluster 2 firms (1%). The firms in cluster 2 had higher proportions of lumber production
in the upper grades and a lumber grade distribution that was skewed toward the upper
grades. The performance of these two clusters was compared with ANOVA.
A cluster analysis on the distribution channel variable was conducted next. A
three cluster solution was identified by SPSS (Table 22). Table 22. Cluster Analysis of Firms based on Distribution Channel Sales
Cluster N
Concentration Yard
Percent
Wholesale Distributors
Percent
Retail Operations
Percent
Manufacturers Percent
Exported Percent
1 "intermediaries" 106 34.6 33.3 1.9 20.3 1.7
2 "exporters" 34 13.5 14.2 14.4 20.5 36.1
3 "manufacturers" 59 7.2 8.7 1.6 76.3 5.8
Cluster 1 firms distributed their lumber mainly through concentration yards and
wholesale distributors with the remainder going to manufacturers. Firms in cluster two
exported 36% of their lumber sold in 2007, then 20% went to manufacturers, and nearly
equal proportions went to the other three distribution channels. This cluster had a large
proportion of their lumber sales to retail operations. Firms in the third cluster sold 76%
of their lumber directly to manufacturers and nearly equal parts going to concentration
yards, wholesale distributors and exports. The performance of these three clusters was
compared with ANOVA.

91
A cluster analysis on the species mix variable was conducted next. A three
cluster solution was identified by SPSS (Table 23). Table 23. Cluster Analysis of Firms based on Species Mix
Cluster
Species
1 "Northern
Hardwoods"
2 "Appalachian Hardwoods"
3 "Southern
Hardwoods"
N 66 105 16
Red Oak Percent 15.0 32.6 14.4
White Oak Percent 3.9 18.2 8.4
Yellow Poplar Percent 1.9 18.0 4.3
Hard Maple Percent 33.3 5.0 1.0
Soft Maple Percent 15.6 3.3 1.6
Black Cherry Percent 10.9 2.2 0.9
Ash Percent 6.1 3.9 2.8
Black Walnut Percent 0.4 2.3 8.4
Aspen Percent 3.2 0.2 0.0
Basswood Percent 2.7 0.8 0.0
Beech Percent 0.6 0.9 0.1
Hickory Percent 0.7 3.6 13.1
Birch Percent 4.6 0.6 0.1 Gum Percent 0.0 1.4 12.8
Other Species Percent 1.1 2.3 32.0
Cluster 1 firms produced mainly hard maple, soft maple, red oak, black cherry,
ash, and birch. Firms in cluster 2 produced mainly red oak, white oak, and yellow poplar.
Companies in the third cluster produced other species, red oak, hickory, gum and black
walnut. The performance of these three clusters was compared with ANOVA.

92
Strategy Factor
The first hypothesis that was developed (H1), stated that firms with a focus or
differentiation strategy perform better than firms with a cost leadership strategy. The
measurement of business strategy was conducted by utilizing the focal business area
variables developed by Bush (1989). These variables were designed to be an
operationalization of Porter's three generic strategies (differentiation, focus and cost
leadership). Firms rated the importance of each variable from 1 (not important) to 7
(very important) and these variables are shown in Appendix E. Mail Questionnaire. The
importance ratings for all respondents were used in a factor analysis.
Factor analysis is a data reduction technique used to find latent dimensions or
components (i.e.: factors) within a large number of variables. Variables that are related
to the same factor will be highly correlated with each other and load onto that factor more
so than other factors. The Kaiser-Meyer-Olkin measure of sampling adequacy was 0.897
which indicated that the correlation matrix was suitable for factor analysis. Bartlett's Test
of Sphericity was also significant (<0.01) which indicated that the variables in the
correlation matrix were related and hence suitable for factor analysis. The variable
abbreviations (Table 24) and correlation matrix between each variable is shown in Table
25. Table 24. Business Area Variable Abbreviations
Developing new products (DNP) Serving special geographic markets (SSGM)
Providing customer service (PCS) Ability to manufacture specialty products (AMSP)
Efficient operation of production facilities (EOPF) Promotion and advertising (PA)
Product quality control (PQC) Maintaining a company sales force (MCSF)
Employing trained/experienced personnel (ET/EP)
Owning timberlands and/or logging operations (OTLO)
Competitive pricing (CP) Providing rapid delivery (RD) Developing brand identification (DBI) Market research (MR) Using new marketing techniques/methods (NMT/M)
Investment in new processing equipment (INPE)
Controlling channels of distribution (CCD) Serving particular customer groups (SPCG)
Procurement of raw materials (PRM) Reputation within industry (RWI)

93
Table 25. Correlation Matrix of Business Area Variables
DNP PCS EOPF PQC ET/EP CP DBI NMT/M CCD PRM SSGM AMSP PA MCSF OTLO RD MR INPE SPCG RWI DNP 1.000 PCS .268 1.000
EOPF .216 .413 1.000 PQC .175 .655 .485 1.000
ET/EP .220 .412 .428 .500 1.000 CP .194 .226 .290 .301 .314 1.000 DBI .396 .314 .147 .280 .204 .135 1.000
NMT/M .522 .305 .213 .208 .226 .323 .588 1.000 CCD .403 .181 .160 .116 .270 .343 .468 .569 1.000 PRM .118 .307 .456 .385 .480 .378 .159 .147 .250 1.000
SSGM .382 .163 .213 .184 .223 .325 .404 .494 .578 .289 1.000 AMSP .407 .356 .273 .282 .301 .221 .318 .425 .321 .342 .446 1.000
PA .416 .151 .051 .118 .180 .321 .356 .589 .484 .156 .454 .399 1.000 MCSF .420 .298 .150 .202 .304 .301 .499 .552 .569 .201 .419 .319 .580 1.000 OTLO .058 .151 .152 .161 .134 .210 .064 .137 .198 .245 .004 .086 .253 .251 1.000
RD .253 .483 .359 .537 .409 .314 .306 .392 .332 .329 .322 .369 .349 .398 .225 1.000 MR .434 .305 .071 .285 .173 .257 .418 .618 .549 .179 .478 .429 .608 .546 .191 .442 1.000
INPE .334 .308 .201 .239 .306 .252 .375 .443 .438 .227 .361 .308 .441 .550 .244 .514 .505 1.000 SPCG .299 .354 .142 .259 .219 .315 .291 .415 .386 .200 .437 .363 .325 .354 .120 .471 .484 .485 1.000
RWI .157 .634 .382 .618 .356 .261 .304 .240 .139 .409 .204 .245 .147 .249 .198 .434 .238 .300 .366 1.000

94
SPSS was utilized to conduct the factor analysis where the correlation matrix was
analyzed with the principal components extraction method. A three factor solution was
chosen beforehand in order to identify the variables associated with the differentiation,
focus and cost leadership strategies. Prior to the three factor solution a factor analysis
based on a minimum eigenvalue of 1 and with unrestricted number of factors resulted in a
four factor solution with only one variable loading onto the fourth factor. Given the
similarity between the two solutions and that the three factor solution explained 55% of
the variance within the data; the three factor solution was utilized. Furthermore, the scree
plot indicated that a three factor solution adequately accounted for the variability within
the data. The component matrix was rotated with varimax rotation which is the most
common type of rotation (Garrison 2008b). This technique was utilized to interpret
factor loadings easier. The component loadings, which are the correlation coefficient
between the variable and factor, are shown in Table 26. Table 26. Factor Loadings of Business Area Variables
Component (Factor) Business Area Variable 1 2 3
Developing brand identification (DBI) 0.658 0.255 -0.163 Using new marketing techniques/methods (NMT/M) 0.809 0.142 0.045 Controlling channels of distribution (CCD) 0.724 0.000 0.313 Developing new products (DNP) 0.642 0.160 -0.073 Serving special geographic markets (SSGM) 0.667 0.112 0.161 Ability to manufacture specialty products (AMSP) 0.516 0.338 0.070 Promotion and advertising (PA) 0.735 -0.059 0.288 Maintaining a company sales force (MCSF) 0.721 0.108 0.247 Market research (MR) 0.783 0.126 0.095 Investment in new processing equipment (INPE) 0.604 0.229 0.233 Serving particular customer groups (SPCG) 0.555 0.306 0.073 Reputation within industry (RWI) 0.164 0.768 0.067 Providing customer service (PCS) 0.241 0.804 -0.061 Efficient operation of production facilities (EOPF) 0.032 0.630 0.306 Product quality control (PQC) 0.116 0.843 0.085 Providing rapid delivery (RD) 0.422 0.557 0.211 Employing trained/experienced personnel (ET/EP) 0.154 0.576 0.365 Procurement of raw materials (PRM) 0.072 0.484 0.586 Owning timberlands and/or logging operations (OTLO) 0.094 0.055 0.654 Competitive pricing (CP) 0.264 0.220 0.606
The largest values (shown in bold) of each variable was allotted to one factor and
no other factor. The interpretation of each factor is based upon all of the variables that

95
load onto it. The first component was interpreted as the differentiation strategy since
marketing and specialty business area variables loaded onto it. The second component
was interpreted as the focus strategy since these variables are core functions of a
hardwood sawmill and were similar to Bush's (1989) focus factor. The third component
was interpreted as cost leadership since the competitive pricing and procurement of raw
materials variables loaded onto it. Firms that employed this strategy compete upon price
and place importance upon raw material costs which are the largest cost of a sawmill.
These component loadings are similar to those found by Bush (1989) with only minor
differences. A comparison of changes in strategy over time was conducted in Chapter 5.
The factor analysis generated standardized factor scores which are the scores of
each firm on each of the three factors. These standardized factor scores had a total mean
of zero and a standard deviation of 1. These factor scores were analyzed utilizing cluster
analysis to identify strategic groups. Hierarchical cluster analysis was used with the
Ward method and squared Euclidean distance as the measure. A range of cluster
solutions from 2 to 6 was chosen for this clustering method. The cluster variables that
were generated were then analyzed by comparing means. The cluster variables were the
independent variables and the factor scores were the dependent variables. A four cluster
solution was found to adequately classify firms between different strategic orientations
(Table 27). Table 27. Factor Scores for the Strategic Clusters
Cluster Statistic Differentiation Score Focus Score Cost Leadership Score
Mean 0.548 0.071 -0.144 1 (n = 83) Std. Deviation 0.611 0.714 0.522 Mean -1.018 0.175 0.825 2 (n = 43) Std. Deviation 0.572 0.745 0.526 Mean 0.962 0.172 1.135 3 (n = 24) Std. Deviation 0.618 0.34 0.304 Mean -0.51 0.111 -1.088 4 (n = 45) Std. Deviation 0.921 0.768 0.752
Positive factor scores denoted that the firms in that cluster rated the variables
important that loaded onto that factor and negative factor scores indicated that the firms
in that cluster rated the variables not important that loaded onto that factor. The

96
magnitude, direction (positive/negative) and pattern of means on all three strategic factors
were interpreted to infer the strategic orientation of that cluster. The four clusters each
represented a distinct strategic orientation. Cluster 1 had a high mean differentiation
score and low scores on the other two strategic factors. Firms in this cluster were
considered to be employing a differentiation strategy. Cluster 2 firms had a high mean
cost leadership score and a highly negative differentiation score and a low focus score.
Firm in this cluster were considered to be employing a cost leadership strategy. Firms in
the third cluster were found to be utilizing a differentiation and cost leadership strategy
due to the high positive mean scores on both factors. The final cluster of firms was
interpreted to be utilizing a focus strategy since they scored negatively on both
differentiation and cost leadership but positive on the focus factor. A cluster variable was
generated by SPSS and this was utilized as the dependent variable. The performance of
these strategic groups was then compared utilizing ANOVA.

97
Results & Discussion
The results were grouped by each factor and were in order as presented in the
methods section. The first set of results was for the organizational factor.
Organizational Factor
A one-way ANOVA of the vertical integration level of hardwood lumber
companies was significant with a p-value of 0.042. The backward integrated firms had
the highest performance score mean at 47.7 and non-integrated companies had the lowest
performance score mean at 43.7 (Table 28). Table 28. Vertical Integration Performance Score Post-Hoc Comparison
Integration Level
Performance Mean N
Std. Deviation
Mean Differences*
Backward 47.7 18 7.39 A Backward & Forward 47.0 18 7.42
A
Forward 43.9 60 6.36 B Not Integrated 43.7 101 6.78
B
* Means with same letter are not significantly different. LSD (alpha 0.05)
Since the ANOVA found a significant difference, the means were compared with
Fisher's LSD post comparison tests. The LSD showed a difference in performance
between the backward and backward & forward firms and the forward and not integrated
firms. These results suggested that the first group of firms performed better than the
latter group. This evidence strongly supported the hypothesis (H11) which stated that
vertically integrated firms performed better than non-vertically integrated firms and
therefore H11 was accepted. The results indicated that backward integrated and
backward and forward integrated firms performed better than non-integrated or forward
integrated firms. The backward integration may allow firms to control log costs which
are a critical component of a sawmill's total cost.
The performance scores of single sawmill (SS) firms were compared to multiple
sawmill (MS) firms using a t-test. The latter firms performed better than the single

98
sawmill companies. A p-value of 0.072 was weak evidence for a significant difference
between the two firm types (Table 29). Table 29. Firm Type & Performance Score T-test
Firm Type N Performance
Mean Std.
Deviation p-value Single Sawmill 157 44.0 6.69 Multiple Sawmill 39 46.2 7.39 0.072
These results indicated that multiple sawmill firms did perform better however;
the statistical significance was relatively weak. The multiple sawmill firms had on
average three sawmills. These companies may have greater economies of scale and more
bargaining power over suppliers and customers.
The performance scores of NHLA members were compared to non-members
using a t-test. Members of the NHLA reported higher firm performance scores as
compared to non members (Table 30). Table 30. Membership Type & Performance Score T-test
Membership Type N Performance Mean Std. Deviation p-value
NHLA Member 172 45.1 6.50
Non-Member 25 40.3 7.91 <0.01
NHLA member companies had significantly higher performance scores than non-
members. One explanation for the NHLA member companies' higher performance was
that they were more efficient in production, sales, and revenue per output than non
member companies. The non-member firms were smaller as compared to NHLA firms
and this suggested that there were some economies of scale advantages in the industry. It
was likely that NHLA membership was also a proxy for a long term commitment to
producing hardwood lumber whereas non-members could enter and exit lumber
production more readily.
Responding companies were grouped based on their production volume. The
groups were then compared utilizing an ANOVA and it was significant with a p-value of
0.024 (Table 31).

99
Table 31. Firm Size & Performance Score Post-Hoc Comparison
Firm Size N
Performance Score Mean
Std. Deviation
Mean Differences
0 - 0.99 MMBF 18 40.7 7.9 A 1 - 4.99 MMBF 51 43.8 7.1 A B5 - 9.99 MMBF 60 44.9 6.0 A B10 - 19.99 MMBF 32 46.4 6.3 B20 + MMBF 36 46.1 5.8 BMeans with the same letter are not significantly different. Tukey's (alpha 0.5)
The smaller firms, who produced less than 1 million board feet, had the lowest
performance score at 40.7. These firms were significantly different than firms in the two
largest groups. The firms in the two largest groups had the highest performance scores.
These results showed that larger firms performed better than smaller firms. This again
suggested that there are some economies of scale within the industry. These results
suggested that large firms are more competitive than small firms. As competitive
pressures increase, this could lead to fewer sawmills who are larger in size.
Geographic Factor
As was stated in the methods, the responses to the mail survey indicated that only
4 companies had mills in more than one region. Therefore, Hypothesis 5 couldn't be
tested due to a lack of mills with these requisite characteristics. In lieu of the planned
test, a comparison of performance between mills in the 3 different regions was
conducted. The performance scores of firms in each region were compared using
ANOVA as shown in Table 32. Table 32. Geographic Region Performance Score ANOVA
Region Performance Mean N Std. Deviation p-value
Appalachian 45.2 107 6.66
Northern 43.8 60 6.26
Southern 43.4 24 8.65
0.322
The performance means between the three groups were not significantly different.
These results suggested that performance doesn't vary that greatly from region to region.

100
Hardwood lumber producers in a given region were able to perform just as effectively as
those in other regions despite differences in forest resources and species availability.
Production Technology Factor
The performance scores of firms who utilized all of the following: optimized
headrigs, optimized edgers and optimized trimmers were higher than firms who didn't use
these technologies as shown in Table 33. Table 33. Production Technology Level & Performance Score ANOVA
Production Technology Level Performance Mean N
Std.
Deviation
p-value
High 48.1 18 6.12
Low 44.1 179 6.84 0.02
These results indicated that firms who utilized all three advanced production
technologies performed better than those who didn't use advanced production technology.
These results provided strong evidence for the support of Hypothesis 6. These results
were further corroborated by comparing the high and low technology firms on the three
additional measures of performance measured in the survey: production efficiency, sales
efficiency and revenue per output (Table 34).
Table 34. Production Technology Level & Performance Ratio ANOVA
Production Technology Level Sales Per Employee
($Million/employee)
Volume Per Employee
(Million board feet/employee)
Sales Per Volume
(dollar/board foot)
Mean 0.234 0.202 1.386
N 17 17 17 High
Std. Deviation 0.073 0.092 0.870
Mean 0.188 0.226 1.008
N 154 180 152 Low
Std. Deviation 0.098 0.123 0.735
p-value 0.061 0.439 0.050
The results indicated that firms who utilized all of the following: optimized
headrigs, optimized edgers and optimized trimmers had significantly higher sales per

101
employee and sales per volume. There wasn't a significant difference between high and
low tech firms in volume per employee and low technology firms had a higher average
ratio. These results indicated that high tech firms captured more value of their products
by utilizing advanced production technology.
As stated in the methods section, the number of firms classified as high
technology users was low with only 18 out of 197 firms meeting the criteria. This
classification didn't adequately capture the diversity of responses and adoption levels by
responding firms. For example, most firms didn't utilize all three technologies and only
utilized only one or two of them. Therefore, a cluster analysis was conducted to identify
homogeneous groups within the responses. A four cluster solution based on the
optimized headrig (OH), optimized edger (OE), and optimized trimmer (OT) variables
was identified (Table 18). The four clusters were as follows: cluster 1 were firms with
OH and OE but not OT; a majority of cluster 2 firms had OH, OE and OT; cluster 3 firms
had OH only and cluster 4 firms had no OH, OE or OT. These clusters were compared
on performance scores and performance ratios as shown in Table 35.

102
Table 35. Production Technology Clusters & Performance ANOVA
Performance Variable Cluster N Mean
Std. Deviation p-value
1 "OH & OE" 31 45.1 6.95
2 "OH, OE, & OT" 23 43.6 5.30
3 "OH only" 47 45.5 6.59 Performance Score
4 "No Tech" 87 44.1 7.59
0.635
1 "OH & OE" 25 0.191 0.11
2 "OH, OE, & OT" 21 0.232 0.098
3 "OH only" 43 0.191 0.080
Sales Per Employee
($Million/employee)
4 "No Tech" 73 0.184 0.102
0.268
1 "OH & OE" 31 0.234 0.1050
2 "OH, OE, & OT" 24 0.208 0.108
3 "OH only" 46 0.251 0.133
Volume Per Employee
(Million board
feet/employee)
4 "No Tech" 86 0.205 0.111
0.144
1 "OH & OE" 24 0.932 0.485
2 "OH, OE, & OT" 22 1.188 0.858
3 "OH only" 41 0.911 0.400
Sales Per Volume
(dollar/board foot)
4 "No Tech" 73 1.137 0.947
0.319
These results showed no significant difference between the performance means of
the four clusters. While not significant, cluster 2 firms had the highest sales efficiency
and revenue per output. Cluster 2 (OH, OE & OT) firms had the lowest mean
performance score and cluster 4 (No Tech) firms had the lowest sales and production
efficiency. These results indicated that firms who hadn't adopted advanced production
technology performed just as well as firms who had adopted some or all of this
technology. Due to the high cost of these advanced production technologies, high tech
firms may be burdened with large debt payments which could hinder their performance.
This contrasted the results from the earlier technology classification and performance
comparison which showed high tech firms performed better.
These conflicting results prohibited the acceptance of Hypothesis 6 which stated
that firms with advanced production technology perform better than firms without this

103
technology. Firms that have adopted this technology must ensure that they are utilizing it
to it fullest potential. An examination of the differences between the first production
technology classification and the second production technology classification revealed
that 4 firms in cluster 2 didn't utilize optimized headrigs and 6 firms in cluster 2 didn't
utilize optimized edgers. The inclusion of these firms in cluster 2 of this second
classification reduced the performance score mean from 48.1 to 43.6. These firms that
utilized optimized trimmers but not optimized headrigs and edgers performed poorly. It
is recommended that these firms adopt optimized headrigs and edgers in order to improve
their performance. These results demonstrated that higher performance is associated with
use of all three production technologies. However, the results from the second
classification indicated that low tech firms performed just as good as high tech firms.
Information Technology Factor
The performance scores and performance ratios of high information technology
and low information technology firms were compared utilizing ANOVA. Firms
comprising the high technology category (Clusters 1, 2, 3, 4, 6, & 7) utilized one or more
of the computer based log tallying, lumber tallying or inventory control information
technologies. Firms comprising the low technology category (Cluster 5) didn't utilize any
of these information technologies. The results of this comparison are shown in Table 36. Table 36. Information Technology Level & Performance ANOVA
Information Technology Level Statistic
Performance Score
Sales Per
Employee
($Million/employee)
Volume Per
Employee
(Million board feet /
employee)
Sales Per
Volume
(dollar /
board foot)
Mean 45.2 0.209 0.220 1.178
N 147 126 145 126 High Std.
Deviation 6.61 0.098 0.105 0.808
Mean 42.3 0.144 0.237 0.651
N 50 44 51 42 Low
Std. Deviation
7.21 0.077 0.158 0.365
p-value 0.01 <0.01 0.384 <0.01

104
The results showed that high information technology firms had significantly
higher performance than low technology firms on nearly every measure. The firms didn't
significantly differ on the volume per employee performance ratio. The results provided
strong evidence for the acceptance of Hypothesis 7. From these results, it can be
concluded that firms that utilized either computer based log tallying, lumber tallying, or
inventory control performed better than those that did not use these technologies. The
implications of these results are that firms should adopt these technologies in order to
improve their performance. Logs and lumber are sawmill's most costly and valuable
inputs and outputs and therefore, being able to identify and track these materials is of
vital importance to sawmill performance.
Marketing Tactics Factor
Linear regression was conducted to see if a positive relationship existed between
product, customer and promotion diversification and firm performance. The mean
diversification score, adjusted R2, and significance level for each marketing mix variable
are shown in Table 37. Table 37. Marketing Mix Diversification & Performance Correlation
Diversification Variable Mean Std. Deviation N Adjusted R² Significance Product Type Diversification 0.832 0.393 194 0.002 0.233 Species Diversification 0.324 0.190 166 -0.004 0.537 Grade Diversification 1.352 0.364 178 -0.004 0.573 Distribution Channel Diversification 0.749 0.435 191 -0.004 0.629 Promotion Expenditure Diversification 0.543 0.528 121 0.026 0.043
Lumber grade had the highest mean diversification followed by product type and
distribution channel. Species diversification was the lowest of the variables. The
marketing mix diversification variables explained essentially none of the variance in the
performance score dependent variable as shown by the low adjusted R2 values. These
diversification variables were not significantly related to firm performance with the
exception of promotion expenditures. This latter variable did significantly increase the
amount of dependent variable variance that it explained. The promotion expenditure
diversification variable was positively correlated (r = 0.185) with performance scores
meaning that performance increased as promotion expenditure diversification increased.

105
These results indicated that diversification of a firm's marketing mix was generally not
related to their performance with the notable exception of promotion expenditure.
Promotion expenditure diversification was positively correlated with performance.
Therefore, Hypothesis 8 and 9 were rejected and Hypothesis 10 which stated that
promotion diversification is positively related to performance was accepted. Hardwood
lumber sawmills should diversify their promotion expenditures in order to target new
customers and increase their performance.
Firms were grouped utilizing two-step cluster analysis for each of the following
marketing mix variables: product type, species mix, grade mix, and distribution channel.
A cluster variable was generated for each cluster analysis and then an ANOVA was
conducted to detect differences between groups on performance scores and ratios for each
marketing mix variable. The cluster analysis generated a two cluster solution for the
product type variable (Table 20). The first cluster, labeled green, sold mainly rough
green grade lumber and the second cluster, labeled dry, mainly sold rough kiln dried
lumber. The ANOVA between these two clusters is shown in Table 38. Table 38. Product Type Clusters & Performance ANOVA
Performance Variable Cluster N Mean Std. Deviation p-value
1 "green" 112 44.4 6.99 Performance Score
2 "dry" 82 44.5 6.71 0.951
1 "green" 94 0.183 0.095 Sales Per Employee
($Million/employee) 2 "dry" 74 0.206 0.099 0.124
1 "green" 111 0.244 0.122 Volume Per Employee
(Million board
feet/employee) 2 "dry" 82 0.199 0.116
0.011
1 "green" 92 0.775 0.368 Sales Per Volume
(dollar/board foot) 2 "dry" 74 1.388 0.965 <0.01
The two clusters did not differ significantly on the performance score variable nor
on the sales per employee ratio suggesting that firms in either cluster perform equally
well despite differences in the product types that they sell. However, cluster 1 firms had
significantly higher volume per employee ratios and cluster 2 firms had significantly

106
higher sales per volume ratios. Firms that sell mainly rough green grade lumber (cluster
1) had higher production efficiency than those firms that sell mainly rough kiln dried
grade lumber. Firms in cluster 2 should focus on increasing the production efficiency
associated with kiln drying lumber. Firms that sell mainly rough kiln-dried grade lumber
(cluster 2) had higher revenue per output than those firms that sell mainly rough green
grade lumber. Firms in cluster 1 should focus on increasing revenue per output
associated with rough green grade lumber. These results suggested a tradeoff between
production efficiency and revenue per output associated with the product type produced.
The cluster analysis generated a two cluster solution for the grade mix variable
(Table 21). The first cluster (lower grade) produced comparatively lower grade and more
ungraded lumber and the second cluster (higher grade) produced higher grade lumber and
almost no ungraded lumber. The results of the ANOVA between these two clusters are
shown in Table 39. Table 39. Lumber Grade Mix Clusters & Performance ANOVA
Performance Variable Cluster N Mean Std. Deviation p-value
1 "lower grade" 93 43.8 6.79 Performance Score
2 "higher grade" 85 45.6 6.55 0.089
1 "lower grade" 83 0.193 0.107 Sales Per Employee
($Million/employee) 2 "higher grade" 71 0.195 0.089 0.866
1 "lower grade" 94 0.223 0.123 Volume Per Employee
(Million board feet/employee) 2 "higher grade" 83 0.232 0.126 0.622
1 "lower grade" 83 1.009 0.647 Sales Per Volume
(dollar/board foot) 2 "higher grade" 69 1.077 0.862 0.578
Cluster 2 firms performed better than cluster 1 firms on all performance variables
however the differences were not significant. The performance score comparison p-value
was nearly significant (0.089) and provided weak evidence for a significant difference.
These results suggested that firms in cluster 1, who had a lower grade lumber mix along
with a large proportion of un-graded lumber, should increase their production of higher
grade lumber in order to increase their performance. The results also reinforced the
widespread industry perspective that hardwood sawmills must improve grade yield in

107
order to improve performance. Research and technology that improve grade yield will
help to improve the performance of firms in the industry.
A cluster analysis resulted in the identification of a three cluster solution for the
distribution channel variable (Table 22). Cluster 1 firms which were labeled
intermediaries since they distributed their lumber mainly through concentration yards and
wholesale distributors with the remainder going to manufacturers. Firms in cluster two
which were labeled exporters since they exported 36% of their lumber sold in 2007, then
20% went to manufacturers, and nearly equal proportions went to the other three
distribution channels. Firms in the third cluster which were labeled manufacturers since
they sold 76% of their lumber directly to manufacturers and nearly equal parts going to
concentration yards, wholesale distributors and exports. The performance of these three
clusters was compared with ANOVA (Table 40). Table 40. Distribution Channel Clusters & Performance ANOVA
Performance Variable Cluster N Mean Std. Deviation p-value
1 "intermediaries" 101 44.1 6.59
2 "exporters" 32 45.0 8.08 Performance Score
3 "manufacturers" 58 44.7 6.54
0.768
1 "intermediaries" 81 0.194 0.090
2 "exporters" 31 0.214 0.122 Sales Per Employee
($Million/employee) 3 "manufacturers" 52 0.180 0.093
0.327
1 "intermediaries" 100 0.230 0.115
2 "exporters" 32 0.207 0.107
Volume Per Employee
(Million board
feet/employee) 3 "manufacturers" 57 0.228 0.142
0.647
1 "intermediaries" 80 1.000 0.761
2 "exporters" 31 1.242 0.795 Sales Per Volume
(dollar/board foot) 3 "manufacturers" 51 1.018 0.766
0.309
The results indicated that there was no significant difference between the three
clusters of firms. While not statistically significant, it was interesting to note that firms in
cluster 2, who exported and retailed the highest proportion of their lumber of any cluster,
had the highest sales per employee and sales per volume. This suggested that firms in

108
this cluster were able to capture more value from their lumber by utilizing these two
distribution channels. These results indicated that firms perform equally well irrespective
of the distribution channels utilized.
A cluster analysis identified a three cluster solution for the species mix variable
(Table 23). Cluster 1 firms, labeled Northern hardwoods, produced mainly hard maple,
soft maple, red oak, black cherry, ash, and birch. Firms in cluster 2, labeled Appalachian
hardwoods, produced mainly red oak, white oak, and yellow poplar. Companies in the
third cluster, labeled Southern hardwoods, produced other species, red oak, hickory, gum
and black walnut. The performance of these three clusters was compared with ANOVA
(Table 41). Table 41. Species Mix Clusters & Performance ANOVA
Performance Variable Cluster N Mean
Std.
Deviation p-value
1 "Northern hardwoods" 64 45.0 6.71
2 "Appalachian hardwoods" 98 43.9 6.59 Performance Score
3 "Southern hardwoods" 16 44.2 9.34
0.608
1 "Northern hardwoods" 46 0.231 0.115
2 "Appalachian hardwoods" 92 0.172 0.084 Sales Per Employee
($Million/employee) 3 "Southern hardwoods" 14 0.176 0.093
<0.01
1 "Northern hardwoods" 60 0.230 0.100
2 "Appalachian hardwoods" 104 0.221 0.133 Volume Per Employee
(Million board feet/employee) 3 "Southern hardwoods" 13 0.225 0.148
0.898
1 "Northern hardwoods" 48 1.095 0.467
2 "Appalachian hardwoods" 91 1.018 0.865 Sales Per Volume
(dollar/board foot) 3 "Southern hardwoods" 13 1.123 1.126
0.813
The three clusters did not perform significantly different on the performance
variables except in the case of sales per employee. Cluster 1 performed significantly
better than the other two clusters on this variable. Firms in this cluster produced large
proportions of their lumber in species groups such as hard maple, soft maple and black
cherry that were highly valued in the marketplace. The results also suggested that despite

109
differences in species mix across the eastern hardwood region, firms were able to
compete and perform equally well.
Strategy Factor
The business area variables were reduced to three strategic factors. The factors
scores were then clustered to identify strategic groups. The performance scores and
performance ratios of the strategic clusters were then compared utilizing ANOVA (Table
42). Table 42. Strategic Clusters & Performance ANOVA
Performance Variable Cluster N Mean Std. Deviation p-value1 "differentiation" 82 43.7 6.29
2 "cost leadership" 43 43.9 7.31 3 "differentiation &
cost leadership" 24 48.6 7.17 Performance Score
4 "focus" 43 43.9 6.90
0.016
1 "differentiation" 62 0.198 0.118 2 "cost leadership" 37 0.196 0.089 3 "differentiation &
cost leadership" 22 0.189 0.075
Sales Per Employee
($Million/employee)
4 "focus" 40 0.179 0.083
0.821
1 "differentiation" 76 0.204 0.110 2 "cost leadership" 43 0.260 0.163 3 "differentiation &
cost leadership" 21 0.217 0.095
Volume Per Employee
(Million board feet/employee)
4 "focus" 45 0.217 0.095
0.112
1 "differentiation" 61 1.218 0.928 2 "cost leadership" 36 0.927 0.473 3 "differentiation &
cost leadership" 23 1.029 0.625
Sales Per Volume
(dollar/board foot)
4 "focus" 40 0.953 0.779
0.219
There were significant differences between the strategic clusters on the
performance score variable. Cluster 3, the differentiation and cost leadership strategic
group, performed better than the other three clusters. The differences between the means
of the other three performance variables were not statistically significant. Cluster 2, the
cost leadership strategic group, performed the best (mean = 0.260) on the volume per
employee performance variable. This result was logical since economies of scale provide
firms with lower costs per unit and these firms have achieved that by employing the cost
leadership strategy. Cluster 1, the differentiation strategic group, performed the best

110
(1.218) on the sales per volume performance variable. Again, this result was logical
since more value can be captured by understanding customer needs and these firms have
done that by employing the differentiation strategy. There were no large differences
between groups on the sales per employee performance variable. These results do not
provide evidence for acceptance of H1 which stated that firms with a differentiation or
focus strategy perform better than firms with a cost leadership strategy and therefore the
null hypothesis is accepted. The only strategy that performed significantly better was a
combination of differentiation and cost leadership. The cost leadership and
differentiation strategies perform well on performance variables that are aligned with
their strategy. The implications of these results are that firms should employ both a
differentiation and cost leadership strategy. By seeking to control costs and marketing
their products effectively firms can gain competitive advantage.
Conclusions
The influence of firm controlled factors on performance yielded useful results.
On the organizational factor, a number of findings were discovered. The statistical
evidence strongly supported the hypothesis (H11) that vertically integrated firms
performed better than non integrated firms and therefore H11 was accepted. The results
indicated that backward integrated and backward and forward integrated firms performed
better than non-integrated or forward integrated firms. The backward integration may
allow firms to control log costs which are a critical component of a sawmill's total cost.
The results from the company type comparison indicated that multiple sawmill firms
performed better than single sawmill companies however; the statistical significance was
relatively weak. These multiple sawmill companies may have greater economies of scale
and more bargaining power over suppliers and customers. NHLA member companies
had significantly higher performance scores than non-members. One explanation for the
NHLA member companies' higher performance was that they were more efficient in
production, sales, and revenue per output than non member companies. The comparison
of performance and firm size showed that the largest two groups of firms, those
producing 10 million board feet or more, performed better than smallest group of firms,
those producing less than 1 million board feet. These results suggested that large firms

111
are more competitive than small firms. As competitive pressures increase, this could lead
to fewer sawmills who are larger in size. From these results it was concluded that
vertical integration, membership in the NHLA, having multiple sawmills and larger firms
were all associated with higher business performance. The implications for hardwood
sawmills is that they should improve performance by vertically integrating, consolidating
with other sawmills, joining the NHLA and capture more market share to become larger
firms.
The geographic factor was not able to be tested as originally designed. The
responses to the mail survey indicated that only 4 companies had mills in more than one
region. Therefore, Hypothesis 5 couldn't be tested due to a lack of mills that were
geographically diversified. The performance means between mills in the three
geographic regions (Appalachian, Northern, Southern) were not significantly different.
These results suggested that performance doesn't vary that greatly from region to region.
Hardwood lumber producers in a given region were able to perform just as well as those
in other regions despite differences in forest resources and species availability. Firms
should exploit all potential tree species available and develop niche markets within that
region.
The results on the production technology factor were mixed with one analysis
indicating support for H6 and the other analysis lacking support. First, the results of the
performance score comparison between high tech and low tech firms indicated that firms
who utilized all three advanced production technologies performed better than those who
didn't use any advanced production technology. The results also indicated that high tech
firms captured more value of their products by utilizing advanced production technology.
This first analysis provided strong support for acceptance of H6. The results from the
performance comparison between the four clusters (the second classification) indicated
that firms who hadn't adopted advanced production technology performed just as well as
firms who have adopted some or all of this technology. Due to the high cost of these
advanced production technologies, high tech firms may be burdened with large debt
payments which could hinder their performance. This contrasted the results from the
earlier technology classification and performance comparison which showed high tech
firms performed better. These contrasting results prohibited the acceptance of

112
Hypothesis 6 which stated that firms with advanced production technology perform better
than firms without this technology. Firms that have adopted this technology must ensure
that they are utilizing it to its fullest potential. The firms that utilized optimized trimmers
but not optimized headrigs and edgers performed poorly. It is recommended that these
firms adopt optimized headrigs and edgers in order to improve their performance. This
recommendation is reinforced by responses on the open-ended question where the most
frequently cited suggestion for improving performance was to upgrade equipment and
technology. These results demonstrated that higher performance was associated with use
of all three production technologies.
The results on the information technology performance comparison showed that
high information technology firms had significantly higher performance than low
technology firms on nearly every measure. The results provided strong evidence for the
acceptance of Hypothesis 7. From these results, it was concluded that firms that utilized
either computer based log tallying, lumber tallying, or inventory control performed better
than those that did not use these technologies. These technologies enable better tracking
of inputs (logs) and outputs (lumber) which represent large working capital outlays. The
implications of these results were that firms should adopt these technologies in order to
improve their performance.
The results on marketing mix diversification indicated that diversification of a
firm's marketing mix was generally not related to their performance with the notable
exception of promotion expenditure. Promotion expenditure diversification was
positively correlated with performance. Therefore, Hypothesis 8 and 9 were rejected and
Hypothesis 10 was accepted. Hardwood lumber sawmills should diversify their
promotion expenditures in order to target new customers and increase their performance.
On the product type variable, cluster 1 firms, who sold mainly green lumber, had
significantly higher volume per employee ratios and cluster 2 firms, who sold mainly kiln
dried lumber, had significantly higher sales per volume ratios. Cluster 1 firms should
maximize production efficiency and cluster 2 firms should maximize revenue per output.
On the lumber grade mix variable, Cluster 2 firms, the higher lumber grade producers,
performed slightly better than cluster 1 firms, the lower grade lumber producers, on the
performance score variable. Research and technology that improve grade yield will help

113
to improve the performance of firms in the industry. No significant difference was found
between the clusters of firms based on differences in their distribution channel mix.
While not statistically significant, it was interesting to note that firms in cluster 2, who
exported and retailed the highest proportion of their lumber of any cluster, had the
highest sales per employee and sales per volume. This suggested that firms in this cluster
were able to capture more value from their lumber by utilizing these two distribution
channels. Cluster 1 firms, labeled Northern hardwoods, performed significantly better
than the other two clusters on the sales per employee variable but there weren't
significant differences on the other performance variables. It can be concluded that
despite differences in species mix firms performed equally well.
The results on the strategic factor were interesting. Cluster 3, the differentiation
and cost leadership strategic group, performed significantly better than the other three
clusters on the performance score variable. These results do not provide evidence for
acceptance of H1 and therefore the null hypothesis is accepted. The only strategy that
performed significantly better was a combination of differentiation and cost leadership.
The implications of these results were that firms should employ both a differentiation and
cost leadership strategy. By seeking to control costs and marketing their products
effectively to customers, firms can gain competitive advantage.
Of the five firm-controlled factors investigated in this research, four of them were
found to impact firm performance. The geographic factor was not found to influence the
performance of hardwood sawmills. It was recommended that firms vertically integrate,
diversify promotions, adopt all three optimizing production technologies, adopt
information technology, and adjust their marketing mix and business strategy to fit the
markets they serve and the forest resources that are available.

114
References
Booth, D. and I. Vertinsky 1991. Strategic Positioning in a Turbulent Environment: An Empirical Study of Determinants of Performance in the North American Forest Industry. Forest Science 37: 903-923.
Bush, R. 1989. Business-level competitive strategy in the United States hardwood lumber industry. Wood Science & Forest Products. Blacksburg, VA, Virginia Polytechnic Institute and State University. Ph.D.: 209.
Cohen, D. H. and S. A. Sinclair 1992. The Strategic Management Paradigm and the Wood Building Products Industry: A Model of Strategies and Firm Profitability. Forest Science 38: 786-805.
Covin, J. G., J. E. Prescott and D. P. Slevin 1990. The Effects of Technological Sophistication on Strategic Profiles, Structure and Firm Performance. Journal of Management Studies 27(5): 485-510.
Dawes, J. 1999. The relationship between subjective and objective company performance measures on market orientation. Marketing Bulletin 10: 65.
Dess, G. G. and J. Richard B. Robinson 1984. Measuring organizational performance in the absence of objective measures: The case of the privately-held firm and conglomerate business unit. Strategic Management Journal 5(3): 265-273.
Ellefson, P. V. and R. N. Stone 1984. U.S. Wood-Based Industry: Industrial Organization and Performance. New York: Praeger.
Garrison, D. G. 2008. "Factor Analysis, from Statnotes: Topics in Multivariate Analysis." Retrieved March 15, 2008, from http://faculty.chass.ncsu.edu/garson/PA765/factor.htm.
Garrison, D. G. 2008. "Reliability Analysis, from Statnotes: Topics in Multivariate Analysis." Retrieved February 27, 2008, from http://faculty.chass.ncsu.edu/garson/PA765/reliab.htm.
Hayes, T. 2002. Business-Unit-Level Relationship between Employee Satisfaction, Employee Engagement, and Business Outcomes: A Meta-Analysis. Journal of Applied Psychology 87(2): 268-279.
Hoque, Z. and W. James 2000. Linking balanced scorecard measures to size and market factors: Impact on organizational performance. Journal of Management Accounting Research 12: 1.
Kaplan, R. S. and D. P. Norton (1998). The Balanced Scorecard - Measures that Drive Performance. Harvard Business Review on Measuring Corporate Performance. Boston, MA, Harvard Business School Press: 123-147.
Kline, R. B. 1998. Principles and practice of structural equation modeling. New York: Guilford Press.

115
Luppold, W. G. 1984. An Econometric Study of the U.S. Hardwood Lumber Market. Forest Science 30: 1027-1038.
Martin, L., R. Westgren and E. van Duren 1991. Agribusiness Competitiveness across National Boundaries. American Journal of Agricultural Economics 73(5): 1456-1464.
Narver, J. C. and S. F. Slater 1990. The Effect of a Market Orientation on Business Profitability. Journal of Marketing 54(4): 20.
O'Laughlin, J. and P. V. Ellefson 1981. U.S. Wood-Based Industry Structure: Part III - Strategic Group Analysis. Forest Products Journal 31(12): 25-31.
Palepu, K. 1985. Diversification Strategy, Profit Performance and the Entropy Measure. Strategic Management Journal (pre-1986) 6(3): 239.
Pelham, A. M. 1997. Market orientation and performance: the moderating effects of product and customer differentiation. The Journal of Business & Industrial Marketing 12(5): 276.
Pitt, L., A. Caruana and P. R. Berthon 1996. Market orientation and business performance: Some European evidence. International Marketing Review 13(1): 5.
Rapp, A., N. Schillewaert and A. W. Hao 2008. THE Influence of Market Orientation on E-Business Innovation and Performance: The role of top management team. 16(1): 7-25.
Rich, S. U. 1986. Recent Shifts in Competitive Strategies in the U.S. Forest Products Industry and the Increased Importance of Key Marketing Functions. Forest Products Journal 36(7/8): 34-44.
Rumelt, R. R. 1982. Diversification Strategy and Profitability. Strategic Management Journal 3(4): 359-369.
Toby, D. W., M. Jonathan, P. Malcolm and J. W. Stephen 2004. On the Validity of Subjective Measures of Company Performance. Personnel Psychology 57(1): 95.
Van der Stede, W., C. W. Chow and T. W. Lin 2006. Strategy, Choice of Performance Measures, and Performance. Behavioral Research in Accounting 18: 185-205.
West, C. D. and J. R. Cooper 1996. Marketing and Technology - Do They Pay? 24th Annual Hardwood Symposium: Putting Research to Work for the Hardwood Industry: New Technology Available Today. Cashiers, North Carolina, Hardwood Research Council.

116
Chapter 5. Changes in Strategy and Technology Over Time
Introduction
The macro-environment, within which the hardwood lumber industry operates,
has changed dramatically over the past two decades. Globalization and the loss of
domestic furniture manufacturing have severely impacted the industry. The material
substitution of engineered wood products for solid hardwood lumber and the recycling of
pallets have also impacted the industry. The ability of hardwood lumber companies to
adapt to changes was important to their survival. Strategy and technology were two
important factors found to impact hardwood lumber company performance. Therefore,
detecting changes in strategy and technology within the industry over time were
important to understanding its competitive position.
Research into business strategy of the hardwood lumber industry was limited.
Porter’s (1980) three generic strategies have been used extensively in academia and
industry. These strategies acted as protection from the competition. The cost leadership
strategy was characterized by a focus on reducing costs, gaining market share and
maintaining economies of scale. The differentiation strategy was characterized by a
focus on the customer, differentiating the product or service, and brand loyalty. The
focus strategy was achieved by applying either or both the cost leadership or
differentiation strategy to a particular market segment, geographic area or customer
group. Porter’s three generic strategies were used in this research in order to build upon
past research (Bush 1989) and to detect any changes in strategy over time.
Research into the utilization of production technology in the hardwood lumber
industry was limited. Bowe (2000) surveyed the hardwood lumber industry and their
results indicated that most of the companies did not use scanning or optimizing
technology. Of the mills that had adopted new technology, they were found to be
comparatively larger companies. The use of advanced production technologies of
hardwood sawmills was measured in order to detect changes in its use over time.

117
Objectives
The objectives for this chapter were to compare strategy and technology within
the hardwood lumber industry to previous research to detect trends and to determine if
the marketing strategy varies from sub-region to sub-region with the eastern hardwood
region. The following are the specific objectives of this chapter:
1. Compare business strategy and technology utilization of hardwood lumber companies over time.
2. Determine the geographic distribution of business strategy in the eastern
hardwood region.
Methods
A mail survey of hardwood lumber manufacturers was conducted during the fall
of 2009. An adjusted response rate of 19.8% was obtained and the questionnaire
measured demographics, business performance, marketing mix, operations, strategy,
technology, and geographic region. A 20 item business area importance question
developed by Bush (1989) was utilized to measure business strategy. Respondents rated
each business area from 1 (not important) to 7 (important). A factor analysis was then
conducted to identify strategies and generate factor scores. A hierarchical cluster
analysis then grouped firms into strategic clusters using the factors scores. The number
of firms in a given group was divided by the total number of firms to calculate the
proportion of firms utilizing that strategy.
The production technology was measured by utilizing an equipment list originally
developed by Bowe (2000). Companies indicated whether or not they utilized each piece
of equipment. The proportion of firms utilizing a given technology was calculated by
dividing the number responding yes by the total number of firms. The results from both
Bush and Bowe were compared to results from the mail survey that was conducted.
The proportions of firms considered to be utilizing a particular strategy such as
cost leadership, differentiation or focus were compared with a normal z test. The second
hypothesis (H2) which stated that the hardwood lumber industry has shifted towards a
differentiation and focus strategy from a cost leadership strategy was tested. The null
hypothesis was that there was no change in the proportion of firms utilizing a given

118
strategy. The proportions of firms considered to be utilizing a given strategy from Bush
(1989) and the current research is shown in Table 43. These were the proportions that
were tested. Table 43. Proportion of Firms Following a Strategy in Past and Current Research
Generic Strategy Type Bush Proportion Current Proportion
None 0.250 0
Differentiation 0.220 0.426
Cost Leadership 0.324 0.220
Cost Leadership & Differentiation 0.206 0.231
Focus 0 0.123
The proportions were tested by calculating a z value and then referencing that z
value to a standard normal distribution. The following formula (Garrison 2008) was
utilized to calculate the z value:
z = (P1 - P2)/ √[(P1Q1/n1) + (P2Q2/n2)]
Where:
P1 = proportion from 1st sample P2 = proportion from 2nd sample Q1 = 1-P1 Q2 = 1-P2 n1 = sample size from 1st sample n2 = sample size from 2nd sample The two-tailed probability of the calculated z value was the p-value shown in the
results. A significant p-value was interpreted to indicate a change in strategy over time.
In a similar fashion, the proportion of firms who utilized a particular production
technology was compared with a normal z test. A significant difference between each
proportion indicated a change in technology over time. No hypothesis was developed in
association with this test. However, the null hypothesis would be that no change has
occurred. The proportion of firms utilizing a given technology from Bowe (2000) and
the current research is shown in Table 44. These were the proportions that were tested in
the same manner as the strategy proportions.

119
Table 44. Proportion of Firms Utilizing a Production Technology in Past & Current Research
Production Technology Bowe Proportion Current Proportion
Bucking Optimizer 0.05 0.036
Headrig Optimizer 0.271 0.490
Edger Optimizer 0.101 0.260
Trimmer Optimizer 0.045 0.132
Automated Sort Bins 0.071 0.122
During the theoretical development, it was theorized that geography may
influence strategy. Hypothesis three was developed and it stated that more Southern
hardwood lumber producers have a cost leadership strategy than a focus or differentiation
strategy. Hypothesis 4 was developed and it stated that that more Northern and
Appalachian hardwood lumber producers have a focus or differentiation strategy than a
cost leadership strategy. In order to test these hypotheses, a chi-square test of
independence was conducted. A test of independence compares the frequencies for
different categorical variables to those that would be expected under the null hypothesis
(McDonald 2007).
The frequencies of firms in each category were compared to the null hypothesis.
The null hypothesis in this case was that firms in a particular region would be distributed
equally between the different strategies. For example, there were 24 respondents who
indicate their mills were in the Southern region. The null hypothesis is that there is no
difference between the strategies of firms in this region and therefore, the 24 mills should
be evenly split between the strategies. The frequencies of firms found to be utilizing a
given strategy from each region (Chapter 4) and the frequency of firms expected under
the null hypothesis is shown in Table 45.

120
Table 45. Frequency of Strategy Utilization by Firms in each Region
Appalachian Northern Southern
Strategy Actual(n)
Null(n)
Actual(n)
Null(n)
Actual (n)
Null (n)
Differentiation 41 26 30 15 10 6
Cost Leadership 25 26 13 15 3 6
Cost Leadership & Differentiation 15 26 5 15 4 6
Focus 25 26 12 15 7 6
The chi-square test compared the observed (actual) and expected (null) values.
The calculated chi-square statistic was then compared to the chi-square distribution. All
of these functions were completed by utilizing the chi-square test function in a
spreadsheet for each region. The results of these tests are shown in the results section.
Results
The results from the strategy comparison are shown in Table 46. Table 46. Change in Strategy Utilization Z-test
Strategy Bush Proportion Current Proportion Calculated
z-value p-valueNone 0.25 0 4.7610 <0.01 Differentiation 0.22 0.426 -3.3629 <0.01 Cost Leadership 0.32 0.22 1.6275 0.10 Cost Leadership & Differentiation 0.206 0.231 -0.4353 0.66 Focus 0 0.123 -5.2830 <0.01
The results indicated that there has been a change in strategy over time. The
proportion of companies with no strategy decreased to zero. There has been a significant
shift to a differentiation strategy in the industry with approximately 43% of firms
following this strategy now. The proportion of firms utilizing a focus strategy has also
increased significantly to 12%. There were no significant changes in the firms following
a cost leadership and differentiation strategy. There was a decrease in the proportion of
firms following a cost leadership strategy but it wasn't significant (p-value = 0.103). The
results provided support for the acceptance of Hypothesis 2 and it can be concluded that
the industry has shifted towards a differentiation and focus strategy. These results

121
implied that the industry has made progress in understanding their customers and
pursuing market-driven marketing initiatives.
The results from the technology comparison are shown in Table 47. Table 47. Change in Technology Utilization Z-test
Production Technology Bowe Proportion Current Proportion Calculated
z-value p-value Bucking Optimizer 0.05 0.036 0.4738 0.64 Headrig Optimizer 0.271 0.49 -3.3950 <0.01 Edger Optimizer 0.101 0.26 -3.3139 <0.01 Trimmer Optimizer 0.045 0.132 -2.5034 0.01 Automated Sort Bins 0.071 0.122 -1.3132 0.19
The results showed that there has been a significant increase in the proportion of
hardwood lumber sawmills that utilize headrig, edger, and trimmer optimizers. There
were no significant changes in bucking optimizers and automated sort bins. These results
indicated that more and more firms are utilizing advanced production technology. The
utilization of all three of these technologies was shown to have a positive impact on firm
performance.
The results from the comparison of strategy across each region are shown in
Table 48. Table 48. Strategy & Region Chi-Square Test
Appalachian Northern Southern Actual Null Actual Null Actual NullStrategy
(n) (n) (n) (n) (n) (n) Differentiation 41 26.5 30 15.5 10 6 Cost Leadership 25 26.5 13 15.5 3 6
Cost Leadership & Differentiation
15 26.5 5 15.5 4 6
Focus 25 26.5 12 15.5 7 6 Chi-square 13.09 22.53 5.0 p-value <0.01 <0.01 0.17
The results showed that there were significant differences between the observed
distribution of strategies in each region and the distribution that was expected under the
null hypothesis. In the Appalachian and Northern region there were a significantly larger
number of firms employing a differentiation strategy than was expected under the null

122
hypothesis. Therefore, Hypothesis 4 can be accepted and it can be concluded that more
Northern and Appalachian hardwood lumber producers have a focus or differentiation
strategy than a cost leadership strategy. There were no significant differences between
the observed and expected distribution of strategies in the Southern region. Therefore,
Hypothesis 3 is rejected and it can be concluded that there is no difference in the
prevalence of each strategy among the Southern region. These results indicated that
Northern and Appalachian hardwood sawmills utilized a differentiation strategy more
often than the other types of strategies.
Conclusions
Hypothesis 2 which stated that the hardwood lumber industry has shifted to a
differentiation and focus strategy from a cost leadership strategy was accepted. An
increase in the utilization of generic strategies and the accompanying decrease in no
strategy within the industry is an important development. There has been a significant
increase in the proportion of firms utilizing optimizing headrigs, edgers, and trimmers
and this will help improve performance.
Hypothesis 4 which stated that more Northern and Appalachian hardwood lumber
producers have a focus or differentiation strategy than a cost leadership strategy was also
accepted. Appalachian and Northern mills are more likely to employ a differentiation
strategy. Outreach and extension activities that promote strategic development and
technology adoption would be beneficial for the hardwood lumber industry.

123
References
Bowe, S. 2000. Modeling the Adoption Decision Process of Future Scanning and Optimizing Technology in Hardwood Sawmills. Department of Wood Science & Forest Products. Blacksburg, Virginia Tech. PhD. p. 138.
Bush, R. 1989. Business-level competitive strategy in the United States hardwood lumber industry. Wood Science & Forest Products. Blacksburg, VA, Virginia Polytechnic Institute and State University. Ph.D. p. 209.
Garrison, D. G. 2008. "Normal Curve Tests of Means and Proportions, from Statnotes: Topics in Multivariate Analysis." Retrieved March 22, 2008, from http://faculty.chass.ncsu.edu/garson/PA765/normal.htm.
McDonald, J. 2007. "Chi-squared test of independence." Retrieved October 22, 2007, from http://udel.edu/~mcdonald/statchiind.html.
Porter, M. E. 1980. Competitive strategy: techniques for analyzing industries and competitors. New York, Free Press.

124
Chapter 6. Conclusions, Contributions, Limitations and
Recommendations
Conclusions
The purpose of developing a performance indicator for this research was to
accurately, confidentially, and quickly assess firm performance of hardwood lumber
manufacturers. As indicated by the internal consistency and the split half reliability tests,
the performance indicator reliably measured performance within the hardwood lumber
industry.
The use and implementation of performance measurement systems like the one
developed should help hardwood lumber manufacturers to improve their performance.
The use of performance measurement systems has been associated with higher
performance. Each of the four dimensions within the performance indicator is linked to
the other levels from employees through production and marketing to financial.
Hardwood sawmills that set goals to improve performance and then measure performance
in each dimension will improve overall firm performance. The research has identified
twelve key performance measures that can form the basis of a performance measurement
system. Companies can take the performance indicator, customize it to their operation,
and then begin measuring and tracking their company's performance information.
The marketing mix of hardwood lumber companies including product,
distribution and promotion was measured. The species mix consisted mainly of oak,
maple and poplar. The common grades of lumber accounted for approximately 60% of
lumber production and the upper grades accounted for about 30% of production. The
majority of lumber (61%) sold was rough green lumber or pallet lumber and cants. The
sawmill distribution channels in order of highest sales percentage were manufacturers,
concentration yards and wholesale distributors. Magazines, market reports, and other
mediums were where hardwood sawmills spent most of their promotion expenditures
despite 40% of respondents not having any promotion expenditures. Based on this
information, there is potential for hardwood lumber companies to: sell more value added
products (i.e. dried lumber); advertise and promote themselves better; diversify their
species mix; and consider adding retail distribution channels.

125
The utilization of advanced production technology has increased in the industry.
The proportion of mills utilizing a given technology since the previous study has doubled
in many cases. The results suggested that firms believe that they should adopt optimized
headrigs and optimized edgers to improve their performance. A large majority of
respondents are utilizing the Internet and email whereas a small majority are utilizing log,
lumber and inventory information technology. Information technology was rated
important to performance and firms believe that they should this technology to improve
performance.
The majority of respondents (60%) had dry kiln operations and 49% had a
surfacing mill. The proportion of mills indicating that they utilized dry kilns has
increased from 43.4% in 2000 (Bowe 2000) to 60% found in this research. This indicates
that firms have tried to capture more value associated with higher levels of lumber
processing. Thirty five percent of respondents (71 companies) indicated that their
company was certified by either forest, chain-of-custody, or both certification schemes.
Respondents rated product quality control, efficient operations, customer service and
reputation as the most important areas that they concentrated on.
The distribution of tallied performance scores on the 12 measure performance
indicator was normal and analysis suggested that there was no relationship between firm
size and performance scores. The performance averages for profit and costs were the
lowest of all twelve performance measures and this suggested that firms should focus
improvement upon these measures. There was no apparent relationship between the three
ratios (production efficiency, sales efficiency, and revenue per output) and firm size
based on the scatter plots. These ratios provided benchmarks against which mills may
measure themselves. The results from the open-ended question suggested that mills
should focus on upgrading equipment, lowering costs, increasing efficiency and sales,
and improving their workforce in order to improve their performance.
The influence of firm controlled factors on performance yielded interesting
results. On the organizational factor, a number of findings were discovered. The
statistical evidence strongly supported the hypothesis (H11) that vertically integrated
firms performed better than non integrated firms. The results indicated that backward
integrated firms and firms that were both backward and forward integrated performed

126
better than non-integrated or forward integrated firms. Backward integration may allow
firms to control log costs which are a critical component of a sawmill's total cost. The
results from the company type comparison indicated that multiple sawmill firms
performed better than single sawmill companies. These multiple sawmill companies may
have greater economies of scale and more bargaining power over suppliers and
customers. NHLA member companies had significantly higher performance scores than
non-members. One explanation for the NHLA member companies' higher performance
was that they were more efficient in production, sales, and revenue per output than non
member companies or that successful companies join the NHLA. From these results it
was concluded that vertical integration, membership in the NHLA, and having multiple
sawmills were all associated with higher business performance.
The performance means among mills in the three geographic regions
(Appalachian, Northern, Southern) were not significantly different. These results
suggested that performance doesn't vary that greatly from region to region. Hardwood
lumber producers in a given region were able to perform just as well as those in other
regions despite differences in forest resources and species availability.
The results on the production technology factor were mixed with one analysis
indicating support for H6 and the other analysis lacking support. First, the results of the
performance score comparison between high tech and low tech firms indicated that firms
who utilized all three advanced production technologies performed better than those who
didn't use any advanced production technology. The results also indicated that high tech
firms captured more value of their products by utilizing advanced production technology.
This first analysis provided strong support for acceptance of H6. The results from the
performance comparison between the four clusters (the second classification) indicated
that firms who hadn't adopted advanced production technology performed just as well as
firms who have adopted some or all of this technology. Due to the high cost of these
advanced production technologies, high tech firms may be burdened with large debt
payments which could hinder their performance. This contrasted the results from the
earlier technology classification and performance comparison which showed high tech
firms performed better. These contrasting results prohibited the acceptance of
Hypothesis 6 which stated that firms with advanced production technology perform better

127
than firms without this technology. Firms that have adopted this technology must ensure
that they are utilizing it to its fullest potential. Firms that are utilizing only optimized
trimmers and not optimized headrigs and edgers should adopt these latter technologies
because utilizing all three technologies was associated with higher performance.
The results on the information technology performance comparison showed that
high information technology firms had significantly higher performance than low
technology firms on nearly every measure. The results provided strong evidence for the
acceptance of Hypothesis 7. From these results, it was concluded that firms that utilized
either computer based log tallying, lumber tallying, or inventory control performed better
than those that did not use these technologies. These technologies enable better tracking
of inputs (logs) and outputs (lumber) which represent large working capital outlays. The
implications of these results were that firms should adopt these technologies in order to
improve their performance.
The results on marketing mix diversification indicated that diversification of a
firm's marketing mix was generally not related to their performance with the notable
exception of promotion expenditure. Promotion expenditure diversification was
positively correlated with performance. Therefore, Hypothesis 8 and 9 were rejected and
Hypothesis 10 was accepted. Hardwood lumber sawmills should diversify their
promotion expenditures in order to target new customers and increase their performance.
On the product type variable, cluster 1 firms, who sold mainly green lumber, had
significantly higher volume per employee ratios and cluster 2 firms, who sold mainly kiln
dried lumber, had significantly higher sales per volume ratios. Cluster 1 firms should
maximize production efficiency and cluster 2 firms should maximize revenue per output.
On the lumber grade mix variable, Cluster 2 firms, the higher lumber grade producers,
performed slightly better than cluster 1 firms, the lower grade lumber producers, on the
performance score variable. Research and technology that improve grade yield will help
to improve the performance of firms in the industry. No significant difference was found
between the clusters of firms based on differences in their distribution channel mix.
While not statistically significant, it was interesting to note that firms in cluster 2, who
exported and retailed the highest proportion of their lumber of any cluster, had the
highest sales per employee and sales per volume. This suggested that firms in this cluster

128
were able to capture more value from their lumber by utilizing these two distribution
channels. Cluster 1 firms, labeled Northern hardwoods, performed significantly better
than the other two clusters on the sales per employee variable but there weren't
significant differences on the other performance variables. It can be concluded that
despite differences in species mix firms performed equally well.
The results on the strategic factor were interesting. Cluster 3, the differentiation
and cost leadership strategic group, performed significantly better than the other three
clusters on the performance score variable. These results do not provide evidence for
acceptance of H1 and therefore the null hypothesis is not rejected. The only strategy that
performed significantly better was a combination of differentiation and cost leadership.
The implications of these results were that firms should employ both a differentiation and
cost leadership strategy. By seeking to control costs and marketing their products
effectively to customers, firms can gain competitive advantage.
Of the five firm-controlled factors investigated in this research, four of them were
found to impact firm performance. The geographic factor was not found to influence the
performance of hardwood sawmills. It was recommended that firms vertically integrate,
diversify promotions, adopt all three optimizing production technologies, adopt
information technology, and adjust their marketing mix and business strategy to fit the
markets they serve and the forest resources that are available.
There have been a number of important changes in the hardwood lumber industry.
Hypothesis 2 which stated that the hardwood lumber industry has shifted to a
differentiation and focus strategy from a cost leadership strategy was accepted. An
increase in the utilization of strategies and the accompanying decrease in no strategy
within the industry is an important development. There has been a significant increase in
the proportion of firms utilizing optimizing headrigs, edgers, and trimmers and this will
help improve performance.
Hypothesis 4 which stated that more Northern and Appalachian hardwood lumber
producers have a focus or differentiation strategy than a cost leadership strategy was also
accepted. Appalachian and Northern mills are more likely to employ a differentiation
strategy. Outreach and extension activities that promote strategic development and

129
technology adoption would be beneficial for the hardwood lumber industry. A summary
of all eleven hypothesis is shown in Table 49. Table 49. Hypothesis Testing Summary
Hypothesis Number Hypothesis Description Rejected /
Accepted 1 Firms with a focus or differentiation strategy perform better than firms
with a cost leadership strategy. Rejected
2 The hardwood lumber industry has shifted towards a differentiation and focus strategy from a cost leadership strategy.
Accepted
3 More Southern hardwood lumber producers have a cost leadership strategy than a focus or differentiation strategy.
Rejected
4 More Northern and Appalachian hardwood lumber producers have a focus or differentiation strategy than a cost leadership strategy.
Accepted
5 Hardwood lumber producers who are geographically diversified perform better than those firms who have geographically limited operations.
Not able to be tested
6 Hardwood lumber producers who utilize advanced production technology perform better than firms who do not utilize advanced production technology.
Not accepted
7 Hardwood lumber producers who utilize advanced information technology perform better than firms who do not utilize advanced information technology.
Accepted
8 Product diversification is positively related to performance of hardwood lumber producers.
Rejected
9 Customer diversification is positively related to performance of hardwood lumber producers.
Rejected
10 Promotion diversification is positively related to performance of hardwood lumber producers.
Accepted
11 Vertically integrated firms perform better than non-vertically integrated firms.
Accepted
Contributions
The contribution of this research to the understanding of business performance of
hardwood lumber manufacturers is significant. It was discovered that the utilization of
production and information technology influence business performance. This discovery
is congruent with knowledge from the broader scientific community. Larger firms,
vertically integrated firms, and those with multiple sawmills performed better. The
empirical confirmation of this information will be beneficial to those who suspected this
based on anecdotal evidence. The increased utilization of strategy and technology in the
industry is an important trend along with the shift in the type of strategy utilized. The
utilization of a cost leadership and differentiation strategy was associated with higher
130
performance. The use of strategy varied from region to region giving support to the idea
that forest resource availability influences strategy.
This study was unique in connecting to previous studies so that longitudinal data
on the industry could be developed. The use of the same measurement variables enables
direct comparisons with previous research. The theoretical driven approach of this study
will enable future researchers to examine new variables and their relationship to business
performance. Likewise researchers can develop new measurement methods and data
collection techniques to retest hypotheses that were rejected. The research also
demonstrated that the collection of sensitive information was possible from privately held
firms in a highly competitive industry. The research has likely spurred many firms to
realize that business performance is a larger concept than previously thought.
Limitations
There are important limitations to the interpretation and generalization of the
results of this study. First, hardwood lumber manufacturers (i.e.: sawmills) were the
target respondents and no information was collected from other manufacturers or
distributors within the hardwood value chain. The performance indicator was developed
specifically for hardwood sawmills and therefore can't be utilized for other types of
hardwood lumber companies. The performance measurement of the responding firms
was limited by its temporal nature. The measurement of performance on a sustained
yearly basis in conjunction with firm-level changes in technology, strategy, tactics, and
organizational factors would provide more robust findings. The ability and resources to
carry this out was beyond the scope of this research. The performance indicator
measured subjective performance data that was self-reported by respondents. While
previous research has shown a high correlation between subjective and objective
performance measurement, the level of correlation between these two types of data is
unknown for this research. The vast majority of respondents were NHLA members and
therefore caution is urged in interpreting the results for non-member sawmills and
companies dissimilar to the typical respondent. Despite these limitations, the findings of
the research are widely applicable to hardwood lumber manufacturers. The limitations of
this research also serve to inform future research opportunities as described next.

131
Recommendations
Continued research into performance in the hardwood lumber industry is
imperative to enable firms to improve their performance. First, similar studies on firm
performance for other segments of the hardwood lumber value chain such as
concentration yards and distributors should be conducted. Performance indicators for
these segments should be developed. Research into the relationship between the
subjective performance indicator and objective performance measures would yield
productive results. A longitudinal and more in-depth study on the use of performance
measurement systems in the industry could detect frequency of and changes in use. Firm
performance and the use of multiple measure performance indicators are likely to become
more important for hardwood lumber companies.
Future research in this industry may want to revisit these and other factors and
attempt to collect more business performance information. Case studies comparing the
performance of firms in each of the identified clusters would yield interesting results. In
relation to the geographic factor, forest resource availability, transportation efficiency,
market size and customer base are variables that could be related to firm performance. A
case study of sawmill utilization of the log tallying, lumber tallying and inventory control
information technologies could determine exactly how firm performance is improved. Is
it through greater working capital efficiency, less inventory, more inventory turnover? A
longitudinal study on firm performance of hardwood lumber manufacturers is important
for all stakeholders. The firms studied in this research project were all in business and
therefore performance comparisons were relative. A study on failed hardwood sawmills
could identify new knowledge about factors that influence performance not covered here.
Hardwood sawmills have the potential to utilize this information in order to
improve their operations. They can utilize the 12 key performance measures in their
operations. Mills should understand the relationship of improving all areas of
performance. Employee satisfaction leads to improved productivity leads to better
customer fulfillment and customer loyalty. These can in turn increase profitability by
reducing costs and increases sales. It is important that hardwood lumber manufacturers
see this linkage. Hardwood sawmills can utilize the up-to-date information on the current
marketing mix, demographic profile, technology utilization, strategy utilization, and

132
operations information in this report to make decisions about their company. Mills
should utilize the production efficiency, sales efficiency, and revenue per output ratios to
benchmark the performance of their company. After knowing where they stand in
comparison to the industry average, mills can set goals to increase their efficiency. If
there is a fit with their company, mills can vertically integrate operations; acquire other
mills to gain economies of scale; increase the diversity of their promotions; increase their
use of production technology; increase the use of information technology; and pursue a
cost leadership and differentiation strategy in order to improve their performance.

133
Appendix A. List of Hypotheses
H1: Firms with a focus or differentiation strategy perform better than firms with a cost leadership strategy.
H2: The hardwood lumber industry has shifted towards a differentiation and focus strategy from a cost leadership strategy.
H3: More Southern hardwood lumber producers have a cost leadership strategy than a focus or differentiation strategy.
H4: More Northern and Appalachian hardwood lumber producers have a focus or differentiation strategy than a cost leadership strategy.
H5: Hardwood lumber producers who are geographically diversified perform better than those firms who have geographically limited operations.
H6: Hardwood lumber producers who utilize advanced production technology perform better than firms who do not utilize advanced production technology.
H7: Hardwood lumber producers who utilize advanced information technology perform better than firms who do not utilize advanced information technology.
H8: Product diversification is positively related to performance of hardwood lumber producers.
H9: Customer diversification is positively related to performance of hardwood lumber producers.
H10: Promotion diversification is positively related to performance of hardwood lumber producers.
H11: Vertically integrated firms perform better than non-vertically integrated firms.

134
Appendix B. Statistical Test Summary
Hypothesis Comparison Independent Variable
Dependent
Variable Statistical Test
Signifance
Levels
H1 Means Strategy Performance ANOVA 0.1 - 0.01
H2 Proportions Time Strategy normal z-test 0.1 - 0.01
H3 Frequencies Geographic Region Strategy
chi-square test of
independence 0.1 - 0.01
H4 Frequencies Geographic Region Strategy
chi-square test of
independence 0.1 - 0.01
H5 Means Geographic Region Performance ANOVA 0.1 - 0.01
H6 Means
Production
Technology Performance ANOVA 0.1 - 0.01
H7 Means
Information
Technology Performance ANOVA 0.1 - 0.01
H8 Coefficients Product Diversification Performance Linear Regression 0.1 - 0.01
H9 Coefficients
Customer
Diversification Performance
Linear Regression 0.1 - 0.01
H10 Coefficients
Promotion
Diversification Performance
Linear Regression 0.1 - 0.01
H11 Means Vertical Integration Performance ANOVA 0.1 - 0.01

135
Appendix C. Phone Survey Questions
1. Do you manufacture hardwood lumber? YES NO
2. What indicator(s) do you used to measure the performance of your company?
3. Do you think it is important to measure performance from different viewpoints?
4. What influences the performance of your company?
5. What things would you change to improve the performance of your company?

136
Appendix D. Fax Survey Questionnaire

137

138

139
Appendix E. Mail Questionnaire
Opportunities for Improving the Performance of Eastern Hardwood Lumber Manufacturers
Center for Forest Products Marketing and Management Department of Wood Science and Forest Products
Virginia Tech Blacksburg, VA 24061
If you have any questions, please contact
Brian Perkins Phone: 540-231-4406 Cell: 540-558-8320 Fax: 540-231-8868
Email: [email protected]

140
1. Does your company manufacture hardwood lumber?
___ No Stop. Thank you, please return questionnaire.
___Yes Continue to next question.
2. Is your sawmill a single facility or part of a larger multi-facility company?
______ Single Sawmill
______ Multiple Facility Company
3. Please estimate the total volume of hardwood lumber your sawmill (single facility) and/or corporation (multiple facilities) produced in 2007.
Single Sawmill __________________BF
Whole Company _________________BF
4. What is the total number of employees at your single sawmill and/or in the entire corporation in 2007?
Single Sawmill _________________
Whole Company ________________
5. Please estimate the total sales at your sawmill (single facility) and/or corporation (multiple facilities) in 2007.
$ _________________ Single Sawmill
$ _________________ Whole Company
6. Which of the following wood residues does your company sell and what is their selling price at the mill?
Yes No Chips ________$/ton
Yes No Sawdust ________$/ton
Yes No Bark ________$/ton
Yes No Shavings ________$/ton
7. What is the percentage of hardwood lumber produced in 2007 in each of the following species as part of total lumber production?
Red Oak _______________%
White Oak _______________%
Yellow Poplar _______________%
Hard Maple _______________%
Soft Maple _______________%
Black Cherry _______________%
Ash _______________%
Black Walnut _______________%
Aspen _______________%
Basswood _______________%
Beech _______________%
Hickory _______________%
Birch _______________%
Gum _______________%
Other _______________%
TOTAL 100%
8. What percentage of hardwood lumber sold in 2007 was in each of the following products as part of total solid wood production?
Rough, green grade lumber ___________%
Rough, air-dried grade lumber ___________%
Rough, kiln-dried grade lumber ___________%
Planed, kiln-dried grade lumber ___________%
Pallet cants and/or lumber ___________%
Railroad ties ___________%
Other: _______________ ___________%
TOTAL 100%
9. Which region do you primarily label and market your lumber as?
Appalachian ________
Southern ________
Northern ________
The purpose of this study conducted by Virginia Tech is to find out how factors that companies control influence their business performance. By better understanding how companies perform, we shall identify opportunities for the entire industry to improve its business performance. Your responses to this survey are confidential because no company information will be disclosed. Filling out the survey will only take a few minutes. Thank you for your time and willingness to participate.

141
Forest | Custody
10. What percentage of hardwood lumber produced in 2007 was sold through each distribution channel?
Sold to concentration yards ___________%
Sold to wholesale distributors ___________%
Sold to retail operations ___________%
Sold to manufacturers ___________%
Exported ___________%
Other: _______________ ___________%
TOTAL 100%
11. What percentage of hardwood grade lumber produced in 2007 was in the following grades?
FAS/1F ___________%
Select & Better ___________%
No. 1 Common ___________%
No. 2 Common ___________%
No. 3 Common ___________%
Framestock ___________%
Custom Graded ___________%
Un-graded ___________%
Other ___________ ___________%
TOTAL 100%
12. Please indicate with an X if your company is certified by one of the following certification programs: Forest Stewardship Council _____|_____
Sustainable Forestry Initiative _____|_____
American Tree Farm System _____|_____
Other:____________________ _____|_____
Our company is not certified _____|_____
13. What percentage of promotion and advertising expenditures in 2007 was spent in:
Magazines ___________%
Tradeshows ___________%
Brochures ___________%
Internet Advertising ___________%
Giveaways ___________%
Market Reports ___________%
Direct Mailings ___________%
Other ___________ ___________%
TOTAL 100%
14. Please indicate with an X which operation(s) other than the sawmill your company has.
Forestland Holdings ______________
Logging Operations ______________
Dry Kilns ______________
Planer/Surfacing Mill ______________
Trucking Operations ______________
Dimension Manufacturing ______________
Pallet Manufacturing ______________
Treating Facility ______________
Concentration Yard ______________
Cogeneration Boiler ______________
Flooring Manufacturing ______________
Other Secondary Mfg. ______________
Pellet Mill ______________
Distribution Facilities ______________
Mulch Coloring Operation ______________
Other________________ ______________
15. Please indicate the number of sawmills your company has in each region.
Northern Region _________
Appalachian Region _________
Southern Region _________

142
16. Please indicate by circling Yes (Y) or No (N) which type of advanced production technology your company uses and how long it has been in use. Also, please estimate how important that piece of equipment is to your company’s performance.
Equipment/Technology Years in Use Not Important Very Important Optimized Headrig Y N ___________ 1 2 3 4 5
Ring Debarker Y N ___________ 1 2 3 4 5
Bucking Optimizer Y N ___________ 1 2 3 4 5
Optimized Edger Y N ___________ 1 2 3 4 5
Optimized Trimmer Y N ___________ 1 2 3 4 5
Automated Sort Bins Y N ___________ 1 2 3 4 5
Real-time Lumber Dimension Control Y N ___________ 1 2 3 4 5
17. Please indicate by circling Yes (Y) or No (N) which type of advanced information technology your company uses and how long it has been in use. Also, please estimate how important that piece of equipment/technology is to your company’s performance.
Equipment/Technology Years in Use Not Important Very Important Computer-Based Log Tallying Y N ___________ 1 2 3 4 5
Computer-Based Lumber Tallying Y N ___________ 1 2 3 4 5
Computer-Based Inventory Control Y N ___________ 1 2 3 4 5
Internet Y N ___________ 1 2 3 4 5
Website Y N ___________ 1 2 3 4 5
Email Y N ___________ 1 2 3 4 5
Internet selling Y N ___________ 1 2 3 4 5
18. If your company uses computer based log tallying, lumber tallying, or inventory control please indicate with an X which type of device you use. If you don’t use these technologies, go to the next question.
Log Tallying Lumber Tallying Inventory Control
Hand Held Device ________ ________ ________
Voice Recorder ________ ________ ________
Other: _________________ ________ ________ ________
19. If your company uses the Internet, please circle which functions it is used for. If you don’t use the internet, go to the next question.
Sales Promotion Y N
Market Research Y N
Order Status Y N
Shipping Notice Y N
Order Tracking Y N
Inventory Tracking Y N
Logistics Y N
Purchasing Products Y N
Data Transfer Y N
Customer Inquiry Y N
Internet Sales Y N
Other:_______________ Y N

143
Not
Important
Important
Very
Important
Developing new products 1 2 3 4 5 6 7
Providing customer service 1 2 3 4 5 6 7
Efficient operation of production facilities 1 2 3 4 5 6 7
Product quality control 1 2 3 4 5 6 7
Employing trained/experienced personnel 1 2 3 4 5 6 7
Competitive pricing 1 2 3 4 5 6 7
Developing brand identification 1 2 3 4 5 6 7
Using new marketing techniques/methods 1 2 3 4 5 6 7
Controlling channels of distribution 1 2 3 4 5 6 7
Procurement of raw materials 1 2 3 4 5 6 7
Serving special geographic markets 1 2 3 4 5 6 7
Ability to manufacture specialty products 1 2 3 4 5 6 7
Promotion and advertising 1 2 3 4 5 6 7
Maintaining a company sales force 1 2 3 4 5 6 7
Owning timberlands and/or logging operations 1 2 3 4 5 6 7
Providing rapid delivery 1 2 3 4 5 6 7
Market research 1 2 3 4 5 6 7
Investment in new processing equipment 1 2 3 4 5 6 7
Serving particular customer groups 1 2 3 4 5 6 7
Reputation within the industry 1 2 3 4 5 6 7
20. Most companies do not have the resources to become the industry leader in every area of doing business. Instead they concentrate on a few key areas that are important to their company. Which of the following areas are presently the most and least important to your company?
(Please circle the number that best corresponds to the importance of each area.)

144
21. Companies measure performance in many different areas and below is a list of 12 performance measures. Please think of how well your company has performed on each measure and then rate it from low to high The responses to these questions are confidential and will not be disclosed.
(Please circle the number that best corresponds to your company’s performance.)
22. A company’s performance is influenced by numerous external factors such as the economy among many others. Please think of how well your company has performed in response to each external factor and then rate your company’s performance from low to high. The responses to these questions are confidential and will not be disclosed.
(Please circle the number that best corresponds to your company’s performance.)
Low
Performance High
Performance Lumber yield 1 2 3 4 5 Don’t know Number of orders received 1 2 3 4 5 Don’t know Employee Satisfaction 1 2 3 4 5 Don’t know Sales 1 2 3 4 5 Don’t know Product quality 1 2 3 4 5 Don’t know Employee turnover rate 1 2 3 4 5 Don’t know Costs 1 2 3 4 5 Don’t know Customer satisfaction 1 2 3 4 5 Don’t know Profit 1 2 3 4 5 Don’t know Board feet per shift 1 2 3 4 5 Don’t know Number of worker injuries 1 2 3 4 5 Don’t know Selling Price 1 2 3 4 5 Don’t know
Low
Performance High
Performance
Loss of domestic customers 1 2 3 4 5 Not Applicable Stagnant/declining lumber prices 1 2 3 4 5 Not Applicable Lack of skilled labor 1 2 3 4 5 Not Applicable Increasing energy prices 1 2 3 4 5 Not Applicable Shortage of loggers 1 2 3 4 5 Not Applicable High raw material prices 1 2 3 4 5 Not Applicable Increased operating costs 1 2 3 4 5 Not Applicable Demand for certified lumber 1 2 3 4 5 Not Applicable Decrease in lumber production 1 2 3 4 5 Not Applicable Demands of international customers 1 2 3 4 5 Not Applicable Changes in secondary manufacturing 1 2 3 4 5 Not Applicable International competition 1 2 3 4 5 Not Applicable Increased transportation costs 1 2 3 4 5 Not Applicable

145
23. What would you change to improve the performance of your company?
24. Comments and Suggestions. Please use the space below to let us know what else you think is important regarding performance of hardwood lumber manufacturers.
Thank you for completing the questionnaire. Please fold, tape, and return the questionnaire. Please indicate if you would like to receive a summary of the results. Yes, send results by email. My email address is ___________________________________ Yes, send results by mail to same address as this questionnaire. Yes, send results by mail but send to this address: _____________________________________ No thanks, don’t send me the results.

146
Appendix F. Curriculum Vitae
Education Doctorate in Philosophy in Forest Products, Virginia Tech, Blacksburg, VA. Area of Concentration: Business and Utilization. GPA: 3.77. May 2009. Master in Science in Forest Products, Virginia Tech, Blacksburg, VA. Area of Concentration: Business and Utilization. GPA: 3.72. December 2006. Bachelor in Science in Forestry, Wood Science, Processing Option. West Virginia University, Morgantown, WV. May 2001. GPA: 3.49. Associate in Science in Forest Technology. Glenville State College, Glenville, WV. May 1997. GPA: 3.17. Career Graduate Research Assistant. Department of Wood Science & Forest Products. Virginia Tech, Blacksburg, VA.
Performed research on forest products business and utilization. Edited two newsletters: Center Focus (quarterly) & Research Update (biannual). Designed and maintained a website. Wrote and published scientific peer-reviewed articles and trade journal articles. (9 to date) Followed macroeconomic and global trends in numerous segments of the forest products industry such as hardwood lumber, wood furniture, cabinetry, millwork, flooring, softwood lumber, structural panels, and bioenergy. Made presentations at various conferences and attended industry meetings. Conducted phone, fax, mail and internet surveys as part of my research. Collected information and data on forest products companies. Analyzed data and trends using statistics. Developed and wrote proposals and reports. Participated and served on the Energy & Sustainability committee where I was able to communicate and interact with senior executives at Virginia Tech.
Workshop Manager. Westminster Woodworks, Winchester, VA.
Supervised seven shop employees and one draftsperson. Managed custom cabinetry projects from design to installation. Solved problems by communicating with all employees. Developed people management skills.
Outside Salesperson. Winchester Woodworking Corporation, Winchester, VA.
Sold windows, doors, trim, columns and custom millwork. Managed over one half million dollars in sales in 2002. Interacted with customers and suppliers to ensure satisfaction. Developed project management skills.
Process Control Technician. Georgia Pacific, Mt. Hope, WV. Worked full-time during summers of 1998, 1999, & 2000. Performed quality control tests on oriented strand board. Monitored flake thickness, geometry and percent fines. Worked as a team to fix any quality problems.
Student Waiter & Manager. West Virginia University, Morgantown, WV.

147
Worked part-time during 4 years of WVU education. Trained and supervised student waiters. Worked with employees and customers to solve problems. Scheduled and audited student employment. Developed people and management skills during this time.
Forestry Aide, W.V. Division of Forestry, Beckley, WV.
Worked during summers of 1996 & 1997. Cruised timber and calculated volume of stands. Marked timber, boundaries and road layout. Assisted foresters and forest rangers.
Teaching Teaching Assistant. Introduction to Natural Resources (NR 1114). Fall 2004. Teaching Assistant. Forest Products Business Management (WOOD 4634). Fall 2007. Publications Perkins, Brian and Al Schuler. 2009. The Financial Crisis and the Wood Products
Industry. Timberline. February. Volume 15. Number 2. P. 21-22. Perkins, Brian and Al Schuler. 2009. Examining the Causes and Proper Responses to the
Current Global Financial Crisis. Pallet Enterprise. February. Volume 29. Number 2. p. 24-27.
Perkins, Brian and Al Schuler. 2009. Financial Cobweb: The financial entities entangled
themselves, the U.S. housing industry, and every mom and pop on main street. here’s how it happened. Timber Processing. January/February. Volume 34 Number 1. p. 14-17.
Perkins, Brian and Brian Bond. 2008. Scragg Mill Low-Down. Southern Lumberman.
September Vol. 126 No. 6. p. 22-23. Perkins, Brian, Bob Smith and Philip Araman. 2008. Analyzing the Feasibility of
Utilizing Small Diameter Hardwood Timber for Solid Wood Products and Residues. USDA Forest Service, Southern Research Station. General Technical Report. GTR-SRS-111. p. 6
Perkins, Brian. 2008. Managing Energy Costs, Opportunities. Pallet Profile Weekly.
May 16. Perkins, Brian, Robert Smith, and Brian Bond. 2008. Case Study of the Economic
Feasibility of a Red Oak Small Diameter Timber Sawmill and Pallet Part Mill. Wood & Fiber Science. 40(2): 258-270.
Perkins, Brian, Robert L. Smith and Brian Bond. 2008. Solid Wood and Residue Yield
Analysis of Small-Diameter Red Oak Logs. Forest Products Journal. 58(1/2): 97-100.
Perkins, Brian and Robert Smith, 2008. A Look at the Woodworking Industry’s
Response to Globalization. Wood & Wood Products. January.

148
Perkins, Brian and Robert Smith, 2007. Virginia Tech Survey Shows Companies
Responding, Adapting to Globalization. Pallet Enterprise. November. Vol. 27 No. 11. p. 28-29.
Proposals Funded Benchmarking Factors that Determine Marketing and Firms Performance of Eastern
Hardwood Lumber Manufacturers Investigator(s): Smith, Robert L. and Brian R. Perkins Sponsor: Wood Education Resource Center of USDA Forest Service Amount: $63,916 June 27, 2007 - June 1, 2008
Presentations Perkins, Brian, Robert L. Smith, Gerry Jackson, and Susan LeVan-Green. 2005.
Evaluating Markets for Small-Diameter Timber: A Case Analysis in Northern Mississippi. 59th Forest Products Society International Convention. Quebec City, Canada. June 19-22. FPS Poster
Perkins, Brian, Robert L. Smith, and Charlie Becker. 2006. A Business Model for a
Small-Diameter Processing Facility in Southwest Virginia. Presented at the 60th Forest Products Society International Convention. Newport Beach, CA. June 25-28, 2006.
Perkins, Brian R. and Robert L. Smith. 2006. A Business Model for a Small Diameter
Processing Facility in Southwest Virginia. Presented to the Research Review team from the U.S. Forest Service Southern Station out of Atlanta for the Virginia Department of Forestry Review held at Blacksburg on August 16.
Perkins, Brian R. and Robert L. Smith. 2007. Opportunities for Business Development
Utilizing Small-Diameter Timber. Poster presentation at the 61st International Convention of the Forest Products Society, Knoxville, TN, June 10-13, 2007.
Perkins, Brian R. and Robert L. Smith. 2007. Globalizations Impact on the Marketing and
Management of Forest Products Firms in the U.S. Presentation at the 61st International Convention of the Forest Products Society, Knoxville, TN, June 10-13, 2007.
Perkins, Brian R. and Robert L. Smith. 2008. Opportunities for Business Development
Utilizing Small-Diameter Timber. Poster presentation at the Smallwood 2008 Conference, Madison, WI. May 13-15, 2008.
Perkins, Brian R. and Robert L. Smith. 2008. Factors that Influence Firm Performance of
Eastern Hardwood Lumber Manufacturers. Poster presentation at the 62nd Forest Products Society International Convention at St. Louis, MO. June 22-24.

149
Perkins, Brian R. 2008. Overview of Hardwood Utilization in the United States by Market Segment. Presented at the 62nd Forest Products Society International Convention at St. Louis, MO. June 22-24.
Reports Perkins, B., Casselman, C., Bonsi, R., and Leonard, T., 2005. Marketing Plan for Turman Log Homes. Final Report. 43 p. Department of Wood Science & Forest Products, Forest Products Marketing Class. Perkins, B., Smith, B., and Jackson, G., 2005. Potential Utilization of Small Diameter Timber in Northern Mississippi. Final Report. 66 p. Department of Wood Science & Forest Products, Center for Forest Products Marketing & Management, Virginia Polytechnic Institute & State University Blacksburg, VA. Perkins, Brian, Robert L. Smith, Brian Bond, A.L. Hammett, and Philip Araman, 2006. A Business Model for a Red Oak Small Diameter Timber Processing Facility in Southwest Virginia. M.S. Thesis. 149 p. Newsletters Perkins, Brian (Editor). Center Focus. March 2005 to present. Quarterly. Center for
Forest Products Marketing & Management, Department of Wood Science & Forest Products, Virginia Polytechnic Institute & State University Blacksburg, VA.
Perkins, Brian (Editor). Research Update. March 2005 to present. Biannual. Center for
Forest Products Marketing & Management, Department of Wood Science & Forest Products, Virginia Polytechnic Institute & State University Blacksburg, VA.
Service Member of the University Energy & Sustainability Committee. Fall 2006 to current. Delegate to the Graduate Student Assembly. Spring 2005 to Summer 2008. Wood Magic volunteer. 2005, 2006, & 2007. Awards Member #271 of National Honor Society for Forest Technology. Andersen Tully Management Scholarship recipient. 2005. Appalachian Hardwood Manufacturer’s, Inc. Scholarship recipient. 2006. Steven Sinclair Forest Products Marketing Scholarship 2007.