MODELING DYNAMIC BUILDING ENVELOPE BACHELOR THESIS … · 2016-02-29 · MODELING DYNAMIC BUILDING...
49
Modeling Dynamic Building Envelope Lisa Molling Lisa MOLLING MODELING DYNAMIC BUILDING ENVELOPE BACHELOR THESIS submitted at LEOPOLD-FRANZENS-UNIVERSITÄT INNSBRUCK FACULTY OF ENGINEERING SCIENCE in association with EUROPEAN ACADEMY OF BOZEN/BOLZANO (EURAC) GROUP FOR ENERGY MANAGEMENT IN BUILDINGS in fulfillment of the thesis requirement for the degree of BACHELOR OF SCIENCE Lecturer: Univ.-Prof. Dipl.-Phys. Dr.-Ing. Wolfgang Feist Dipl.-Ing. Michele Bianchi Janetti Dipl.-Ing. Matthias Werner additional Supervisor: Dipl.-Ing. Stefano Avesani (EURAC) Innsbruck, November 2014
Transcript of MODELING DYNAMIC BUILDING ENVELOPE BACHELOR THESIS … · 2016-02-29 · MODELING DYNAMIC BUILDING...

Modeling Dynamic Building Envelope Lisa Molling
Lisa MOLLING
MODELING DYNAMIC BUILDING ENVELOPE
BACHELOR THESIS
submitted at
LEOPOLD-FRANZENS-UNIVERSITÄT INNSBRUCK
FACULTY OF ENGINEERING SCIENCE
in association with
EUROPEAN ACADEMY OF BOZEN/BOLZANO (EURAC)
GROUP FOR ENERGY MANAGEMENT IN BUILDINGS
in fulfillment of the
thesis requirement for the degree of
BACHELOR OF SCIENCE
Lecturer:
Univ.-Prof. Dipl.-Phys. Dr.-Ing. Wolfgang Feist
Dipl.-Ing. Michele Bianchi Janetti
Dipl.-Ing. Matthias Werner
additional Supervisor: Dipl.-Ing. Stefano Avesani (EURAC)
Innsbruck, November 2014

Modeling Dynamic Building Envelope Lisa Molling
i
Ringraziamenti
A questo punto vorrei ringraziare tutti coloro che mi hanno sostenuto nel periodo di lavoro per la
redazione della mia tesi di laurea:
in primo luogo vorrei ringraziare Wolfram Sparber, Direttore di EURAC Istituto per le Energie Rinnovabili,
e Roberto Lollini, capo del gruppo di ricerca per la gestione dell'energia negli edifici, per avermi dato
l’opportunità di svolgere lo stage presso EURAC e di aver così potuto elaborare il presente lavoro. Un
enorme ringraziamento va anche ai miei due supervisori, Stefano Avesani e Michele Bianchi Janetti, che
mi hanno dispensato sempre consigli e aiutato molto anche a livello pratico. Ringrazio anche tutti i
dipendenti dell'istituto per il sostegno e la buona collaborazione e ricordare in particolare Anna Maria
Belleri, che è considerata la specialista di ventilazione dell´ EURAC. Infine ringrazio Pascal Vullo ed
Alessio Passera, che hanno lavorato con me al progetto.
Alla fine, ma non di meno importanza, vorrei ringraziare di cuore la mia famiglia che mi ha sostenuto
durante lo studio e durante la preparazione della tesi.

Modeling Dynamic Building Envelope Lisa Molling
ii
Kurzfassung
Die vorliegende Arbeit entstand während eines Praktikums am EURAC-Institut für erneuerbare Energien.
Das Ziel dieses Praktikums war es mithilfe der Gebäudesimulationssoftware EnergyPlus ein Modell einer
Doppelglasfassade zu entwerfen. Im Folgenden werden die Hintergründe des Projekts erklärt, in dem
diese Arbeit entstand und es wird eine genaue Definition der Doppelglasfassade gegeben. Danach wird
das Modell und die dafür benötigten theoretischen Grundlagen im Detail erklärt. Die Funktionsweise des
Modells wird an einer Reihe von Plausibilitätstests gezeigt, da keine Messdaten verfügbar waren.

Modeling Dynamic Building Envelope Lisa Molling
iii
Abstract
The present work was done during an internship at the EURAC Institute for Renewable Energy. The goal
of this internship was to develop a model of a Double Skin Façade using the building simulation software
EnergyPlus. In the following the background of the project is explained, in which this work was
generated and it will be given a precise definition of the Double Skin Façade. Thereafter, the model and
the needed theoretical basis are explained in detail. The functionality of the model is shown in a series
of plausibility tests, because no measurement data is available.

Modeling Dynamic Building Envelope Lisa Molling
iv
Table of Contents
1 Introduction .......................................................................................................................................... 1
2 Project „Capitolato Prestazionale Facciate” ......................................................................................... 2
2.1 Background ................................................................................................................................... 2
2.2 Reference buildings and locations ................................................................................................ 3
2.3 Approach ....................................................................................................................................... 4
3 Double Skin Facade (DSF)...................................................................................................................... 5
3.1 Definition of DSF ........................................................................................................................... 5
3.2 Types of double skin facades ........................................................................................................ 6
3.3 Building physic .............................................................................................................................. 7
3.3.1 Heat flow ............................................................................................................................... 7
3.3.2 Airflow ................................................................................................................................. 12
3.3.3 Other physical phenomena ................................................................................................. 15
4 Building Simulation ............................................................................................................................. 16
4.1 Building simulation software ...................................................................................................... 16
4.1.1 State-of-the-art-report about modeling Double Skin Facades (DSF) in EnergyPlus ........... 17
4.1.2 Main characteristics of the model ...................................................................................... 18
4.1.3 Boundary conditions: Weather file and DesignDays .......................................................... 23
4.1.4 Modeling air flow in the cavity (Airflow Network) ............................................................. 24
4.2 Simulation results ....................................................................................................................... 25
4.2.1 Zones in the cavity .............................................................................................................. 25
4.2.2 Façade height ...................................................................................................................... 27
4.2.3 Driving forces for airflow .................................................................................................... 28
4.2.4 Heat flow ............................................................................................................................. 32
4.2.5 Temperatures ...................................................................................................................... 35
4.2.6 Shading device .................................................................................................................... 38
5 Conclusion & Recommendations ........................................................................................................ 40
5.1 Conclusion ................................................................................................................................... 40
5.2 Further work ............................................................................................................................... 40
Modeling Dynamic Building Envelope Lisa Molling
1
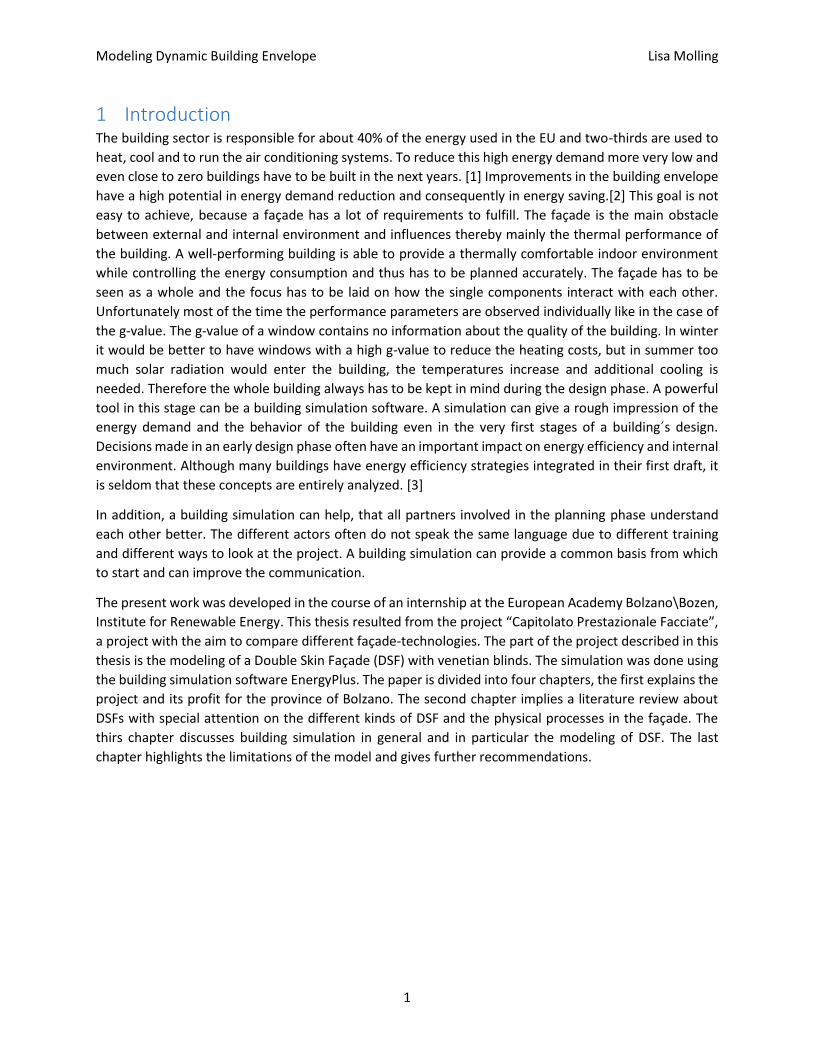
1 Introduction The building sector is responsible for about 40% of the energy used in the EU and two-thirds are used to
heat, cool and to run the air conditioning systems. To reduce this high energy demand more very low and
even close to zero buildings have to be built in the next years. [1] Improvements in the building envelope
have a high potential in energy demand reduction and consequently in energy saving.[2] This goal is not
easy to achieve, because a façade has a lot of requirements to fulfill. The façade is the main obstacle
between external and internal environment and influences thereby mainly the thermal performance of
the building. A well-performing building is able to provide a thermally comfortable indoor environment
while controlling the energy consumption and thus has to be planned accurately. The façade has to be
seen as a whole and the focus has to be laid on how the single components interact with each other.
Unfortunately most of the time the performance parameters are observed individually like in the case of
the g-value. The g-value of a window contains no information about the quality of the building. In winter
it would be better to have windows with a high g-value to reduce the heating costs, but in summer too
much solar radiation would enter the building, the temperatures increase and additional cooling is
needed. Therefore the whole building always has to be kept in mind during the design phase. A powerful
tool in this stage can be a building simulation software. A simulation can give a rough impression of the
energy demand and the behavior of the building even in the very first stages of a building´s design.
Decisions made in an early design phase often have an important impact on energy efficiency and internal
environment. Although many buildings have energy efficiency strategies integrated in their first draft, it
is seldom that these concepts are entirely analyzed. [3]
In addition, a building simulation can help, that all partners involved in the planning phase understand
each other better. The different actors often do not speak the same language due to different training
and different ways to look at the project. A building simulation can provide a common basis from which
to start and can improve the communication.
The present work was developed in the course of an internship at the European Academy Bolzano\Bozen,
Institute for Renewable Energy. This thesis resulted from the project “Capitolato Prestazionale Facciate”,
a project with the aim to compare different façade-technologies. The part of the project described in this
thesis is the modeling of a Double Skin Façade (DSF) with venetian blinds. The simulation was done using
the building simulation software EnergyPlus. The paper is divided into four chapters, the first explains the
project and its profit for the province of Bolzano. The second chapter implies a literature review about
DSFs with special attention on the different kinds of DSF and the physical processes in the façade. The
thirs chapter discusses building simulation in general and in particular the modeling of DSF. The last
chapter highlights the limitations of the model and gives further recommendations.

Modeling Dynamic Building Envelope Lisa Molling
2
2 Project „Capitolato Prestazionale Facciate”
2.1 Background In announcements for the realization of facades there is a lack of detailed indications about the prevalent
performance and the effect of the façade to the behavior of the building in terms of energy demand and
indoor comfort (e.g. energy use for heating and cooling, situation of discomfort in striking distance of the
façade due to temperature differences between indoor air and internal surface of the façade and so forth).
The idea behind this project is to help all the actors involved in the design and realization process of a
building to understand each other better and to give them an idea of the effects their decisions have in
the long term. More precisely this means to develop a tool, which is able to calculate the rough building
energy demand and factors of indoor comfort depending on the façade selected. So one problem of the
early design face, that the actors, namely employer, designer, manufacturer, draftsman, producer of
facades, construction supervisor and the acceptance inspector often don´t speak the same language,
could be amended. Some aspects like statics, security or acoustics are not considered in the project, not
because they would not be important, but because the focus lies on energy demand and indoor comfort.
On the market there are available already a spate of building simulation programs to simulate energy
demand and indoor comfort like PHPP, Trnsys or EnergyPlus. This programs require a detailed knowledge
of building physics and the building investigated. Carrying out such a simulation is rather time consuming
and therefore they are not suited well to confront different technologies because the whole model has to
be changed. The tool resulting from the project shall give the possibility to confront easily different façade
technologies which are add to reference buildings.
In this study only facades suitable for public buildings are taken into consideration. The idea of the project
is to cover as many façade configurations as possible so that the user can find the technological concept
he has in mind, differentiating between wall/façade and openings/glazing. Based on the type of façade
mostly used in the province there can be identified three macro groups:
Conventional façade realized in opera or semi-prefabricated (massive solution)
Ventilated façade
Curtain wall and double skin facade
The user of the calculation tool can change the type of façade and define the properties choosing from
the provided solutions. In the case of the conventional façade the position of the insulation and the
materials can be selected. In case of the ventilated façade the ventilation slot and its position is an
additional unknown to define. The tool includes a list of materials of brickwork, insulation, plasterwork
and claddings with all used information for the calculation like the value for conductivity and density to
cover as many possibilities as possible, but it´s obvious, that not all cases can be considered.
In case of the Double Skin Façade only one model was developed, which shall be kept generally, because
the simulation is very complex and some modifications, like the adjustment of the openings, could be
realized only with many modifications on the model.
Due to the great band width of Double Skin Facades, which is described in chapter “3.2 Typed of Double
Skin Facades”, only one possible Double Skin Façade is modeled that shall give the user a clue of the
energetic behavior.

Modeling Dynamic Building Envelope Lisa Molling
3
2.2 Reference buildings and locations For the territory of the province meteorological data have to be defined to use as boundary conditions
for the simulation. A correct building design always has to observe carefully the area in which the building
is located to find the best strategy for obtaining adequate the indoor temperature and minimizing the
energy demand. A good example to understand the importance of the location for the design process is
the width of the insolation. The insolation is usually dimensioned to guarantee comfortable indoor
temperature during winter.
On the other hand it is important to keep low the number of meteorological data, so that not too many
simulations have to be launched. After investigating the climate in the province, four locations have been
selected which are most representative for this area:
1. Bolzano for the lowest locations
2. Bressanone for most locations under 1200 m
3. Silandro for the dry locations in Val Vanosta
4. Dobbiaco for the high locations over 1200 m
Figure 1: Reference locations in the province of Bolzano
The meteorological data contain information about solar radiation (Wh/m²), dry-bulb temperature (°C),
relative humidity (%), direction (°) and speed (m/s) of the wind and the temperature of the surrounding
(°C). Under dry-bulb temperature is understood the temperature of air measured by a thermometer freely
exposed to the air but shielded from radiation and moisture.
1) Bolzano
(262 m)
3) Silandro
(721 m)
2) Bressanone
(559 m)
4) Dobbiaco
(1256 m)

Modeling Dynamic Building Envelope Lisa Molling
4
Beside the meteorological data reference buildings have to be defined, on which the different façade
forms can be applied in the next step. Seen that it is a public project the reference buildings are: school,
office buildings and hospital, representative for the buildings in public domain.
The reference buildings are taken from the DOE – database. [4] One limitation of the project is that this
buildings are fictive and don´t correspond to the building the user is going to build. But, like mentioned
before, the tool should support the designer and the public authorities in an early design phase to get a
first idea of the energy demand and the indoor comfort depending on the façade selected.
2.3 Approach All configurations for the facades described above are applied to the three reference buildings and an
annual simulation is launched using the building simulation software EnergyPlus (see “4.1 Building
simulation software”). An assortment of the results (energy demand and parameters of indoor comfort)
is saved in an Excel-file. The tool permits the user to define the characteristics of the façade and searches
in the Excel-file the corresponding results. So the user is not carrying out directly a simulation, but the
tool permits to specify the façade and shows the results of a simulation that has been launched before.
One question that appears when hearing this approach is why the user is not doing the simulation in the
first place, so he could get the results for his own project and not for a reference building. Building
simulations are very time-consuming, even more when the user is not an expert with the software. This
tool permits everyone even without the appropriate knowledge to confront different façade technologies
with each other and to find so the best solution for his task. Once the façade has been chosen a more
detailed simulation for that specific building has to be performed with a genuine building simulation
software like PHPP, Trnsys or EnergyPlus in order to determine the energy demand.

Modeling Dynamic Building Envelope Lisa Molling
5
3 Double Skin Facade (DSF)
3.1 Definition of DSF The Belgian Building Research Institute defines Double Skin Facades as the following:
“A facade covering one or several stores constructed with multiple glazed skins. The skins can be air tight
or not. In this kind of facade, the air cavity situated between the skins is naturally or mechanically
ventilated. The air cavity ventilation strategy may vary with time. Devices and systems are generally
integrated in order to improve the indoor climate with active or passive techniques. Most of the time such
systems are managed in semi-automatic way via control systems.” [5]
A spate of façade forms are contained by this definition, but three elements stay the same: a DSF is always
composed of two glazing separated by an air gap. Usually the outer skin is a fully transparent single glazing,
whereas the inner skin is a not completely, insulation glazed double pane fenestration. The distance
between the two skins varies from 200 mm to more than 2 m. [6] Regarding the ventilation mode there
are five different ventilation modes:
1. Outdoor air curtain
2. Indoor air curtain
3. Air supply
4. Air exhaust
5. Air buffer
Figure 2: Ventilation classification diagram [7]

Modeling Dynamic Building Envelope Lisa Molling
6
3.2 Types of Double Skin Facades Beside the driving force of the ventilation and the ventilation mode a classification of Double Skin Facades
can also be done through the geometrical partitions the air cavity may present. We can distinguish
between: [8]
Multi story Double Skin Facade or curtain wall
The air cavity extends over the total height of the building and there is no separation at the single
stories. (See Figure 3)
Corridor façade
The cavity is divided via horizontal partitions, which has advantages in acoustics, fire protection
and security. (See Figure 4)
Box window façade
The air channel has horizontal partitions at each floor and vertical partitions on each windows, so
that small independent boxes emerge. In and outlet openings have to present at each level.
(See Figure 5)
Shaft box type
The façade is a combination of a multi-story cavity with a box window façade. The box windows
discharge at both sides of the central shaft air into the central zone. In the central zone the air is
heated, raises due to the stack effect and leaves at the top level of the shaft. (See Figure 6)
Figure 3: Curtain wall Figure 4: Corridor facade
Figure 5: Box window façade Figure 6: Shaft box type

Modeling Dynamic Building Envelope Lisa Molling
7
3.3 Building physic
3.3.1 Heat flow In a Double Skin Façade are present a lot of different heat transfer processes, which interact with each
other. They have different driving forces and depend heavily on the boundary conditions. Thereby the
heat flow is rather complex, this issue can be observed in the flowpath diagram. (See Figure 7 and Table
1) All arrows are pointing in one direction, but of cource the heat transport could occure also in the
opposite direction, except for the irradiation. The sun always shines from outdoors to the façade. Another
possibility to show the same processes is via a resistance model like in Figure 8.
Figure 7: Flowpath diagram referring to [9]
Qr,sky
Itrans2
Itrans1
Qconv,is
Iref3_2
Iref2_1
Iref3
Qconv,c
Iref1
1
Qr,e
Qr,1c_2c
Qr,3_2
Qr,2_3
Qconv,i
Itrans3
Iinc
Iabs1
Iabs2
Iabs3
S1e
S1c
S2c
S2 S
3i
Single glazing Cavity Double glazing
Qvent
Iref2
Qconv,e
Qconv,c
Qr,2c_1c
Q
r,i
Qcond1 Qcond2
Qcond3
EXTE
RIO
R
INTE
RIO
R
S3
Qr,ground
Qr,indoor
Legend:
Convection
Short wave radiation
Long wave radiation
Absorbed radiation α*I
Airflow
Conduction

Modeling Dynamic Building Envelope Lisa Molling
8
Table 1: Legend to flowpath diagram
Heat Fluxes [W] Description
Qr,sky long-wave radiation from sky to facade
Qr,ground long-wave radiation from ground to facade
Qr,e long-wave radiation from single glazing to external surfaces
Qr,1c_2c long-wave radiation from single glazing to double-glazing
Qr,2c_1c long-wave radiation from double-glazing to single glazing
Qr,2_3 , Qr,3_2 long-wave radiation in the intermediate space of the double glazing
Qr,i long-wave radiation from double glazing to internal surfaces
Qr,indoor long-wave radiation from internal surfaces to double glazing
Qcond1 , Qcond2 , Qcond3 heat transport due to conduction in the glass pane
Qconv,e heat transport due to convection to outdoor air
Qconv,c heat transport due to convection to the air in the cavity
Qconv,is heat transport due to the air in the intermediate space
Qconv,i heat transport due to convection to indoor air
Iinc incoming solar radiation to facade
Itrans1, Itrans2, Itrans3 transmitted solar radiation
Iref1, Iref2, Iref3 reflected solar radiation
Iabs1, Iabs2, Iabs3 absorbed solar radiation
Iref2_1, Iref3_2 reflected reflected solar radiation
Figure 8: Resistance model for the Double Skin Facade
If we only look at the irradiance, on every glass panel happens the following: The incoming irradiance I
impignes the glass panel, one part of the irradiance is directly reflected ρ*I, where ρ is the dimensionless
reflection coefficient. The second part of the irradiance is transmitted τ*I, where τ is the transmission
coefficient, this part of the irradiance leaves the glass panel on the opposite side. The last part of the
irradience is absorped α*I, where α is the absorption coefficient (Figure 9). The following applies:
𝜌 + 𝜏 + 𝛼 = 1 (1)
𝛼 = 𝜀 (2)

Modeling Dynamic Building Envelope Lisa Molling
9
Figure 9: Irradiance on a glass panel
The absorped irradience heats the glass panel, and the panel emits energy in form of head radiantion. In
fact also the surronding air emits infrared radiation, but if the temperature of the glazing is higher, the
heat radiation coming from the glass pane is higher and so heat flows from the glass pane to the
surroundings. If the temperature of the glazing is lower than the temperature of the surrounding air, the
heat transport happens from the air to the glass pane. The heat flow due to heat radiation can be
described with the linearized Stefan-Boltzmann law for grey emitter:
�̇� = 𝜀 ∗ 𝜎 ∗ ( 𝑇𝑔4 − 𝑇𝑠4) (3)
where 𝑞 ̇ is the local heat flow density [W/m²], ε the dimensionless emissivity, Tg is the temperature of the
glass panel [K] and Ts is the temperature of the surroundings [K]. Radiative heat transfer occurs also with
the ground, the sky and the interior, what is shown in Figure 7 through Qr,sky , Qr,ground and Qr,indoor.
Conduction always occurs due to a temperature difference between the surfaces of a material.The heat
tansfer through a material due to conduction is decribed by Fourier´s law:
�̇� = −𝑘 ∗ ∆𝑇 (4)
where �̇� is the local heat flow density [W/m²], k is the material´s density [W/(mK)] and ∆T is the
temperature difference [K/m]. The minus indicated the heat flow direction is directed against the
temperature gradient.
Transmitted irradiance τ*I
Reflected irradiance ρ*I
Incoming irradiance I Absorped
irradiance
α*I

Modeling Dynamic Building Envelope Lisa Molling
10
The last heat transfer phenomena happening in the façade is convection. Convection implies the transport
of heat from a surface to a fluid what flows over, so it is always connected to the transport of particles,
who are carrying thermal energy. Convection can´t be avoided in liquids and gases like air. Convection is
generated by streaming and can be either natural or forced. If the fluid or gas is put in motion by fans or
pumps, the process is called forced convection.
Boundary heat transfer due to convection can be described with Newton´s Law of cooling:
𝑞 = ℎ ( 𝑇𝑠 − 𝑇∞) (5)
where h is the convective heat transfer coefficient [W/(mK)], Ts is the temperature of the surface [K] and
T∞ is the temperature of the flowing fluid [K]. The heat transfer coefficient is a function of the velocity of
the fluid, the kind of fluid, geometrical conditions and surface texture. [10]
A possibility to calculate the convective heat transfer coefficient provides the TARP algorithm developed
by Walton. [11] The total convection coefficient is the sum of forced and natural components.
h = hf + hn (6)
The forced convection component can be calculated with the correlation by Sparrow, Ramsey and Mass:
hf = 2.537 * Wf * Rf * (P*v/A) 0.5 (7)
where WF is the dimensionless wind direction modifier, what is 1 for windward surfaces and 0.5 for
leeward surfaces, Rf is the dimensionless surface roughness multiplier, P the perimeter of surface [m], v
the local wind speed [m/s] and A the surface area [m²]. Leeward is defined as an orientation greater than
100 degrees from being normal. The surface roughness multiplier can be read from the following table.
Table 2: Surface Roughness Multipliers [11]
Roughness Index Rf Example Material
1 (very rough) 1,17 Stucco
2 (rough) 1,67 Brick
3 (medium rough) 1,52 Concrete
4 (medium smooth) 1,13 Clear pine
5 (smooth) 1,11 Smooth plaster
6 (very smooth) 1,00 Glass

Modeling Dynamic Building Envelope Lisa Molling
11
For vertical surfaces the following equation for the natural part of the convection coefficient can be used:
hn = 1.31 | ΔT |0.33 (8) [11]
The last happening phenomena, that influences the thermal behavior of the façade, is the airflow, what
exchanges heat with both surfaces facing the cavity. This process can be described by the following
formula:
�̇� = 𝑐 ∗ �̇� ∗ ( 𝑇𝑜𝑢𝑡𝑙𝑒𝑡 − 𝑇𝑖𝑛𝑙𝑒𝑡) (9)
where c is the thermal capacity of air [J/(kg*K)] , �̇� the mass flow rate [kg/s], Toutlet is the temperature the
air has when leaving the cavity [K] and Tinlet is the temperature of the air entering the cavity [K]. [9]
One advantage of double skin facades is surely that they do not have or have only little thermal bridges.
Thermal bridges are a problem during the heating period because the heat losses lead to a higher heating
demand. In conventional facades we have to face thermal bridges in areas where the insulation is
interrupted at the junctions between partitions, separating walls and openings. During winter the
openings of the cavity are closed and the cavity works as a heat buffer. The outer layer of glazing, in our
case a single glazing, minimizes thermal bridges by mitigating any heat transfer that might have occurred
at those junctions. [12]

Modeling Dynamic Building Envelope Lisa Molling
12
3.3.2 Airflow The thickness of the cavity in a DSF can vary from 20 cm until 2 m, the nature of the air channel allows to
use different strategies to regulate the performance of the envelope. [8] The origin of the airflow is an
important characteristic of a DSF because it largely influences the eventual average cavity temperature
and consequently also the performance of the façade [13]. In the present work the choice was made to
model a DSF that uses inlet air from to outdoors and the destination of the outlet air is again outdoors
(See Figure 10). This choice has been made, because it was found that this configuration is a widely used
one and the ventilation air is not integrated to the HVAC system of the building and so the façade can be
applied to all kinds of buildings.
Figure 10: Principle of the Double Skin Façade ( DSF ) [14]
The cavity can be ventilated either mechanically or naturally. Natural ventilation was chosen, because it
can provide an environmental friendly atmosphere and no energy is used to generate the airflow in the
cavity. Natural ventilation involves a spate of risks that have to be considered in an early design stage.
There could occur door-opening-problems due to pressurization. If the air path is not considered
adequately, the solar heat in the cavity will not be removed effectively and the temperature in the cavity
will rise. The inlet and outlet openings have to be sized and configured correctly to insure that the airflow
can be developed in the way intended. Otherwise, the hot air in the air channel will radiate to the interior,
and opening the inner layer window in summer will introduce a burst of hot air. Another problem, that is
to face if the DSF is located in an urban environment, is noise transmission and pollution, what could lead
to uncomfortable indoor environments in extreme weather condition. [15]
The driving force behind natural ventilation is a difference in pressure. Pressure difference can be caused
by wind or the buoyancy effect created by temperature differences. A third cause could also be difference
in humidity, but this occasion will be neglected, because the effect is too low. The total pressure across
an opening is found as a summation of the pressure created by wind and buoyancy.

Modeling Dynamic Building Envelope Lisa Molling
13
When only the wind effect is considered, the pressure difference is created by the wind speed and the
direction of wind. Wind generates an overpressure at the windward side of the building and a depression
at the leeward side. The pressure difference between a wind exposed and a wind-protected location can
be described with:
ΔpWIND = 0.5 * CP * ρAIR * vREF2 (10)
where ΔpWIND is the pressure difference due to wind effects [Pa], CP is the dimensionless wind pressure
coefficient, ρAIR is the density of the air [kg/m³] and vREF is the local wind speed [m/s]. The CP-coefficient
takes into account the shape of the building, the wind direction and the surrounding terrain. [16]
If thermal buoyancy is the driving force behind ventilation, different densities create the pressure
difference between warm and cold air at the bottom and the top of the cavity. The sun heats the air in
the cavity; it rises due to the lower density comparing to the surrounding air and leaves the cavity through
the outlet opening. The pressure difference is increased with the height between the openings. The
pressure at a point z above the reference height can be calculated as:
p = pO – ρ * g * z (11)
where pO is the surrounding air pressure [Pa], ρ is the air density at z and g is the gravity acceleration
[m/s²]. [16]
The air density in the formula above can be calculated according to:
𝜌 = 𝜌𝑜 ∗𝑇𝑜
𝑇 (12)
where 𝜌𝑜 is the air density at reference point level and temperature [kg/m³], To is the reference
temperature [273,15 K] and T is the temperature at z level [K]. Buoyancy forces can be used only for
natural ventilation when outdoor temperature is lower than the temperature in the cavity, what occurs
most of the time in a Double Skin Façade, because the sun heats the air in the cavity.
The effective pressure profile under example conditions is shown in Figure 11. It can be seen that air
enters through the lower inlet opening raises and leaves the cavity through the outlet opening. However,
in the same time air enters through the upper outlet opening, decreases and it’s transported above again
by the raising air. This is due to wind that is presented also at the upper outlet opening and triggers air to
enter the cavity.

Modeling Dynamic Building Envelope Lisa Molling
14
Figure 11: Pressure profile in the cavity [9]
The airflow in function of the pressure can be calculated according to Bernoulli´s equation. This methodology is also implemented in the building simulation program EnergyPlus described below (chapter “4 Building simulation”). Bernoulli´s equation reads as follows:
𝑝 + 1
2∗ 𝜌 ∗ 𝑣2 + 𝜌 ∗ 𝑔 ∗ 𝑧 = 𝑐𝑜𝑛𝑠𝑡𝑎𝑛𝑡 (13)
where p in the pressure at z level [Pa], ρ is the air density [kg/m³], v is the air velocity [m/s] and g is the
gravity acceleration [m/s²]. [11]
Another possibility to calculate the airflow in function of the pressure difference is the power function of
Kronval:
𝑄 = 𝐶 ∗ ∆𝑃𝑛 (14)
where Q is the volume flow rate [m³/s], C the dimensionless leakage component related to the size of the opening, ΔP the pressure difference [Pa] and n the dimensionless flow exponent varying from 0.5 for fully turbulent and 1.0 for fully laminar flow. [17] In this equation is visible that the airflow rate depends also from the geometry of the opening and the phase of the flow.

Modeling Dynamic Building Envelope Lisa Molling
15
3.3.3 Other physical phenomena
3.3.3.1 Lightning
Natural daylighting has always been one of the key points in architectonical design because of his positive effect on humans. Double Skin Façades can provide a daylight area of greater than 53% of the total floor space. This lead to a lower lightning energy consumption. [18] The glazed area is larger, but on the other hand, the additional glazing diminishes light transmission by 10 up to 20% compared to traditional facades. The additional effective room depth, the framing of the exterior surface and shading equipment reduce the daylight even more.
3.3.3.2 Problems related to moisture
Another typical problem of DSF is the risk of surface condensation in the cavity. Surface condensation
occurs if the surface temperature of the exterior pane is lower than the dew point temperature of the
cavity air. For a cavity ventilated with exterior air the risk of condensation is low, because the cavity is
usually warmer than the incoming air, but condensation still can happen if the air has a too high water
vapor content. [13]
Modeling Dynamic Building Envelope Lisa Molling
16
4 Building Simulation During the last 20 years the use of building simulation has spread more and more and it has become a
standard feature in building design. Due to the high attention energy demand has these days, most
building regulations require an estimation of the annual energy demand. [19] Energy simulation tools
estimate the energy performance of a building and the thermal comfort for its residents. Building
simulation helps to understand how a given building operates and enables to compare different design
solutions. [20]
Building simulation is a very useful tool if it is about to estimate the real-life energy processes of a default
building, but when it comes to describe complex environments it involves a high degree of simplification
and abstraction. [5] A simulation is always a virtual image of real physical phenomena and simplification
are a crucial point in the approach. In other words, a building has to be simplified without neglecting the
primary processes. [21]
4.1 Building simulation software Today there is a plenty of building simulation software available on the market and they differ in many
ways like the thermodynamic model, the purpose of use, the life-cycle application and possibility to
change data with other software.
Nearly all building simulation programs are built up on an engine, which enables detailed thermal
simulations based on text-based input and output files. These engines calculate the energy performance
solving mathematical and thermodynamic algorithms. Every tool has his own limitations and so to solve
one problem with one program instead of another could be more appropriate. It´s very important to
understand certain basic principles of energy simulation. [20]
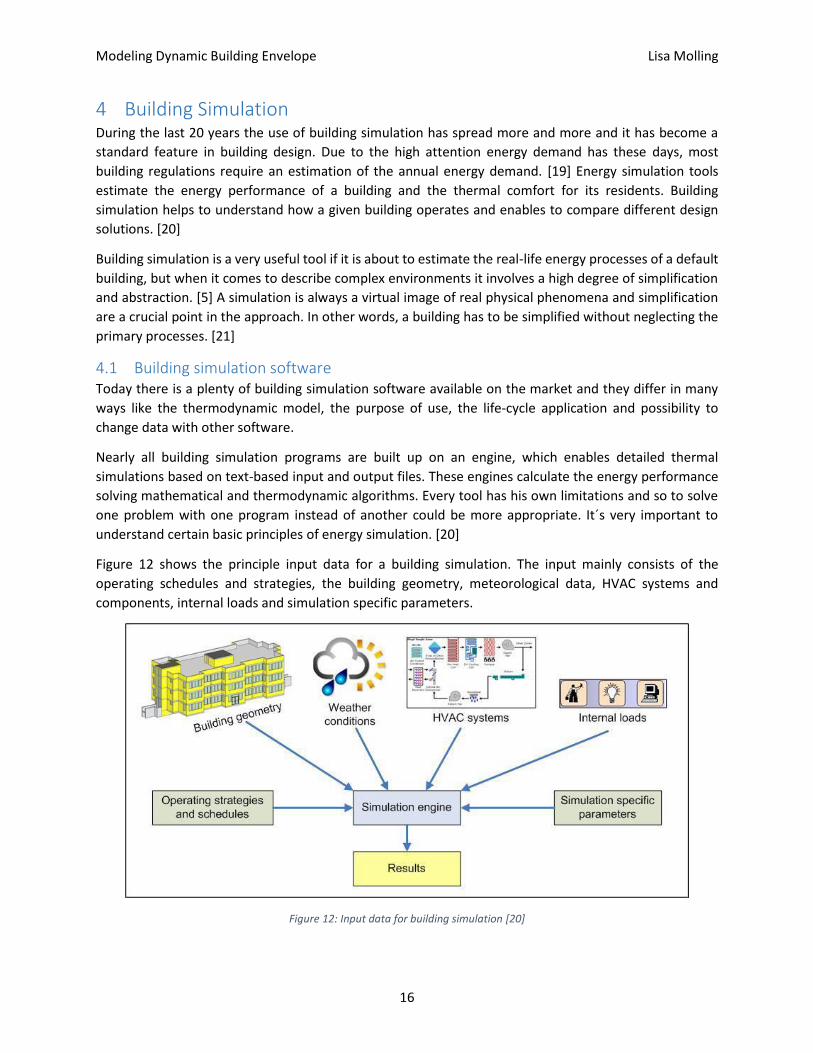
Figure 12 shows the principle input data for a building simulation. The input mainly consists of the
operating schedules and strategies, the building geometry, meteorological data, HVAC systems and
components, internal loads and simulation specific parameters.
Figure 12: Input data for building simulation [20]

Modeling Dynamic Building Envelope Lisa Molling
17
The simulation presented in this thesis was carried out using EnergyPlus, an open-source building
simulation software developed by the United States Department of Energy. EnergyPlus works on test
input and output, and the EnergyPlus engine processes the input data and outputs the results in a text-
file. The reason for the increasing use of EnergyPlus is the availability of several privately developed
software interfaces for the thermal simulation engine. For this thesis no graphical user interface was used
to better understand how the engine itself works and to see the single commands used. Only for
visualization the idf-files have been opened in Google SketchUp.
4.1.1 State-of-the-art-report about modeling Double Skin Facades (DSF) in EnergyPlus In the last years great effort has been made to determine accurately the behavior of Double Skin Facades.
Nevertheless there is still no panacea for someone who tries to model a DSF due to the complex physical
phenomena which have to be taken into account. There are many heat transfer processes which interact
with each other. In addition the results of the simulation depend on the tool that is used, because in each
simulation program there are different algorithms implemented, which handle the processes in a different
way. This lack of consensus leads to a low reliability of the predictions. [22] If we observe studies about
modeling DSF the energy savings vary from 50% to negative energy savings depending on the modeling
tools that get used, the base for comparison and the intent of the research. [23]
Most common for a DSF is the use of a double glazing as an internal glass layer and a single pane of float
glass as an outer glass layer, like it has been recommended by the Belgian Building Research Institute.
All modeling approaches found in papers have subdivided of the cavity. [5, 6, 19, 24–26] The air cavity is
divided into several zones and each zone is associated with an AirflowNetwork node. The zones are
coupled via AirflowNetwork. Dickson [5] points out in his thesis, that if for a four-storied building the cavity
is modeled with only one single thermal zone instead of four, cooling is overestimated by 20%.
For the external environment two nodes are presented, one in front of the inlet opening and the other at
the top of the building in front of the outlet opening. Air infiltration through the façade from the exterior
to the internal of the building in horizontal direction can be considered via EffectiveLeakageArea like it
has been done in [19]. Values for the leakage areas have been gathered from ASHRAE´s leakage area
values. Using this command the parameters have to be chosen accurately so that the error considering
infiltration is not larger than the one neglecting this phenomena. The AirflowNetwork extends to the
rooms behind the façade, so not only the infiltration from the outdoor environment to the cavity but also
the infiltration from cavity to indoor is investigated. At the bottom and the top of the façade a thermal
zone is located representing the in- and outlet region, which are connected to the room behind with a
damper. The single thermal zones in the cavity are divided through fictitious surfaces, which have the
characteristics of air. [26]
Regarding the determination of the convective heat transfer coefficients a lot of different modeling
approaches can be used. In some papers the algorithms implemented in the EnergyPlus engine are used,
e.g. MoWitt for interior heat transfer coefficient [25] and TARP as an algorithm for the convection to the
interior. [19] Alternatively, empirical correlations can be used like the correlation by Bar Cohen &
Rohsenow [5, 26] or by Alamdari & Hammond [5, 24].

Modeling Dynamic Building Envelope Lisa Molling
18
4.1.2 Main characteristics of the model The EnergyPlus model of the Double Skin Façade has been realized as façade section covering the height
of a three-storey building. A three-storey office zone has been modeled as reference room behind the
Double Skin Façade, the zone has the dimensions of 6x8x8.1 m, which are representative for office rooms.
(See Figure 13) All surfaces of the office zone are adiabatic except the one containing the façade. Adiabatic
means that no energy flows through the surface, nevertheless the surface has a temperature and it
interacts with the room air, so heat transport in form of long wave radiation and convection happens.
Using this approach the facade itself can be modeled without taking into account the building behind.
Figure 13: Facade section
The DSF itself consist of two glass panes separated by the air cavity. The cavity is divided into five thermal
zones (one for the inlet region one for the outlet region and one for each floor) using a virtual material
with a constantly open window, displayed in Figure 13. This configuration was mostly found in papers.
(See chapter “4.2.1 State-of-the art-report about modeling Double Skin Facades in EnergyPlus”) Each
thermal zone in the cavity allows to correctly calculate the thermal behavior of the zone. The surfaces
bordering the zone are used as boundary conditions to determine the temperature of the zone air node.
For the zones in the cavity these boundary conditions are: (see Figure 14)
Front and back glazed surface ( one exposed to outdoors the other to the internal room)
Top and bottom virtual surfaces with constantly open EnergyPlus windows
Adiabatic side surfaces

Modeling Dynamic Building Envelope Lisa Molling
19
Figure 14: Thermal zone in the cavity
In case of the inlet and outlet zones one virtual surface is disposed towards outdoors representing the
opening and a second one is at the top of the zone in case of the inlet opening and at the bottom for the
outlet opening. The floor and the roof surface are defined as adiabatic. Every virtual surface contains a
window that is constantly open to allow an airflow through the surface. (See window AF in Figure 14) A
surface must not be covered entirely by a window, but a rest of the base surface must remain. Hence, for
a vertical base surface this remain is 1 mm at each side, in the case of a horizontal surface 10 cm at each
side must stay uncovered. (See surface AF in Figure 15)
Figure 15: Thermal zone in the inlet area
The distance in the air cavity between the two glass panes was set to 1.2 meter, what leads to an effective
opening of 1 meter, because 20 cm are covered by the base surface of the glazing. The distance between
the glass panes is so wide to allow internal cleaning. A façade cross-section is illustrated in Figure 16,
where all dimensions can be read.

Modeling Dynamic Building Envelope Lisa Molling
20
Figure 16: Facade cross-section
All materials and constructions used are taken from DOE-datasheets to get as representative data as
possible, the datasheets are included in the installation file. [4] (See Table 3) Only the properties of the
base surfaces for the windows separating the thermal zones in the cavity are user-defined, this material
is set to have the same properties as air. Materials defined in this way are fully opaque and so undesired
shading effects occur in the cavity. As outer glass pane a single glazing was used and as inner pane a
double-glazing. The properties of the glazing can be seen in Table 4. In contrast to regular materials for a
glazing optical properties have to be defined.
Table 3: Properties of the materials
Material Name Roughness [-] Thickness [m] Conductivity
[W/m*K] Density [kg/m³]
Specific Heat [J/kg*K]
Thermal absorptance [-]
Solar absorptance [-]
Visible absorptance [-]
Virtual Material VerySmooth 0.0001 0.024 1.225 1012 0.000001 0.000001 0.000001
Plasterboard MediumSmooth 0.012 0.16 950 840 0.9 0.6 0.6
Fiberglass Quilt Rough 0.066 0.04 12 840 0.9 0.6 0.6
Wood siding Rough 0.009 0.14 530 900 0.9 0.6 0.6
Table 4: Properties of the glazing
Glazing Name Clear 6MM
Optical Data Type Spectral Average
Thickness [m] 0.006
Solar Transmittance at Normal Incidence 0.775
Front Side Solar Reflectance at Normal Incidence 0.071
Back Side Solar Reflectance at Normal Incidence 0.071
Visible Transmittance at Normal Incidence 0.881
Front Side Visible Reflectance at Normal Incidence 0.08
Back Side Visible Reflectance at Normal Incidence 0.08
Infrared Transmittance at Normal Incidence 0
Front Side Infrared Hemispherical Emissivity 0.84
Back Side Infrared Hemispherical Emissivity 0.84
Conductivity [W/m*K] 0.9

Modeling Dynamic Building Envelope Lisa Molling
21
To calculate the heat transfer due to convection the convection the surface convection algorithm TARP -
described in chapter “3.2.2 Heat flow” - was selected. The heat balance algorithm chosen to calculate heat
and moisture transfers through the glass was “ConductionTransferFunction”. This selection is a sensible
heat only solution and does not take into account moisture storage or diffusion in the construction
elements. For a Double Skin facade this assumption is legitimate, because the water vapor diffusion
resistance of glass is infinitely high. A further basis input to launch a simulation is the number of timesteps
per hour. On every timestep the EnergyPlus engine solves the energy balance equations. The number of
timesteps was set to 6, meaning that the calculation is done every 10 minutes. This timestep is reasonable
considering the speed of variation of the boundary conditions: outdoor, indoor temperatures and global
radiation on façade plane can be well represented on 10 minutes basis.
A DSF offers the ideal conditions for the application of a shading device. The shading can be installed in
the cavity where it is protected from outdoor environmental conditions. Venetian blinds are used as
shading device: they are activated when the solar radiation to the horizontal pane exceeds 300 W/m².
The shading device is located immediately behind the single glazing and so the shading control setpoint
refers to the incoming solar radiation to the single glazing.
The internal temperature is set to constant 25°C to simulate an indoor environment used as office and to
fix a boundary condition in the simulation. This was done by using the EnergyPlus command
“IdealLoadsAirSystem”.
The wheatear file was selected according to the locations in the project proposal; the investigation of the
façade section was done using meteorological data of Bolzano.
The walls of the office zone are facing the four cardinal points. The double skin façade is add either to the
east-façade or to the south façade, depending on the simulation intention. The orientation is chosen in
order to maximize the effect of the particular physic phenomena under investigation. The east façade
shows the highest air flow rates because the irradiation is highest in the morning, when the outdoor
temperatures are rather low and this fact generates a high pressure drop driving the air flow rate in the
DSF. The irradiation impinging to the façade section during the day for different orientations is illustrated
in Figure 17 for the 20 July in Bolzano.

Modeling Dynamic Building Envelope Lisa Molling
22
Figure 17: Solar radiation on the façade plane at 20 July in Bolzano
The daily average radiation on vertical surfaces varies during the year depending on the orientation,
whereas the radiation is highest during summer for the east and west facing facades, a façade oriented
against south gets most radiation during the mid-seasons. (See Figure 18) This fact is connected to
Figure 17: the south façade is irradiated mostly around the middle of the day; in summer the sun stands
to high at this time of the day and so the solar angle is very low. Whereas during the midseason the
solar angle is nearly rectangular for the south façade and most radiation impinges the Double Skin
Façade. The east- and the west- façade are irradiated mostly during the morning and the evening, when
the angle between the sun rays and the surface is nearly 90° during the summer.
Figure 18: Daily average irradiation on differently orientated vertical surfaces
0
5
10
15
20
25
30
0
100
200
300
400
500
600
0,00 3,00 6,00 9,00 12,00 15,00 18,00 21,00 24,00
Tem
per
atu
re [
°C]
Inco
min
g ir
rad
ian
ce t
o t
he
faca
de
[W/m
²]
Time [hh.mm]East South West Outdoor temperature
0
20
40
60
80
100
120
140
160
01/01 01/31 03/02 04/01 05/01 05/31 06/30 07/30 08/29 09/28 10/28 11/27 12/27
Dai
ly a
vera
ge ir
rad
iati
on
[W
/m²]
Date [mm/dd]
South West East

Modeling Dynamic Building Envelope Lisa Molling
23
4.1.3 Boundary conditions: Weather file and DesignDays Two sets of outdoor boundary condition were used:
Run Period: A selected part of the weather file for Bolzano is used as input.
Design Day: A one day simulation is performed under meteorological conditions defined by the
user. The position of the sun during the day is dynamic and calculated from the date and the
location.
Table 5: DesignDays for Bolzano
Name Date
Maximal diffuse irradiance on
horizontal level [W/m²]
Maximal beam irradiance on
horizontal level [W/m²]
Maximal temperature
[°C]
Temperature range [°C]
Wind speed [m/s]
Sky clearness*
DesignDay1 15-Jul 0 750 30 0 0 1
DesignDay2 15-Jul 0 500 30 15 0 0
DesignDay3 15-Jul 0 500 30 15 1 0
DesignDay4 01-Jan 0 300 10 0 0 1
DesignDay5 01-Jan 0 200 10 15 0 0
DesignDay6 01-Jan 0 200 10 15 1 0
*1.0 represents a clear sky, 0 a cloudy one
The properties of the DesignDays are determined to show one particular impact factor to the façade, and
they do not represent real existing outdoor conditions. For example, during DesignDay1 there is no
temperature difference during the day because this is useful to show the solar radiation impact on the
modeled physical phenomena. Nevertheless, the boundary conditions described with the DesignDays
shall be representative for the conditions in Bolzano. The irradiation in DesignDay1 represents a sunny
day during summer, in nearly 6 percent of the time when the sun is shining the radiation is higher than
750 W/m² on the horizontal pane. (See Figure 19) The irradiation for the DesignDay2 and DesignDay3 is
set to 500 W/m², radiation between 400 and 600 W/m² is present in Bolzano at 18.5% of the year. The
same considerations are made for the winter case and so the irradiation is determined for the DesignDays
4-6.
Figure 19: Frequency distribution of beam solar radiation rate in Bolzano
0,0
0,5
1,0
1,5
2,0
2,5
3,0
3,5
0 150 300 450 600 750 900 1050
Freq
uen
cy [
%]
Solar radiation rate [W/m²]

Modeling Dynamic Building Envelope Lisa Molling
24
The lower radiation in the cases 2,3,5,6 is a result of the clouds (sky clearness is set to 0), whereas the
DesignDays 3 and 6 have a constant wind speed of 1 m/s and the wind is directed against the façade. In
45% of the cases, the wind speed lies between 0 and 2 m/s (see Figure 20). Even is the wind lies in most
of the time in the lower region, there can be reached peak wind speeds of 35 m/s, an event that is not
shown in the diagram due to legibility.
Figure 20: Frequency distribution of wind speed
4.1.4 Modeling air flow in the cavity (Airflow Network) The AirflowNetwork model gives the possibility to simulate the energetic performance of natural or
mechanical ventilation. The model inputs consist of five objects: simulation control, multizone data, node
data, component data and linkage data. The simulation control input includes basic data for the airflow
calculation such as the airflow network control. The control was set to “MultizoneWithoutDistribution”
because the airflow is not driven by a mechanical equipment, the driving forces are wind and stack effect.
The wind pressure coefficients are calculated by the program. The alternative solution would be a user-
defined wind coefficient array, this approach can be used to eliminate the wind effects of an existing
wheatear file or to specify the effects of the wind on a building with complex geometry. All remaining
inputs in the simulation control tab are set to be default: they affect the calculation convergence tolerance
and they have therefore not been taken into account. The input “multizone data” contains the zones,
which are connected through the AirflowNetwork, and the surfaces through which effectively the air
flows. All components in the AirflowNetwork are windows, which are constantly open. For the inlet and
outlet openings the command “DetailedOpening” and for the surfaces separating the thermal zones in
the cavity “HorizontalOpening” was chosen. Next to the input, that determines the behavior of the
windows when open, the infiltration for the closed window has to be specified. These values are set to be
as low as possible, even if this case never occurs. The distribution part in the definition of the
AirflowNetwork is omitted for natural ventilation. The EnergyPlus engine automatically creates a node in
each zone specified and even for outdoors if a surface specified as component in the AirflowNetwork is
facing outdoors, what occurs in our case two times for the inlet and outlet opening.
The model calculates pressure at each node and airflow through each component based on the pressure
versus airflow relationship defined for each component. Therefore, the airflow network is a simplified
model, compared to detailed models such as those used in computational fluid dynamics models.
0,0
2,0
4,0
6,0
8,0
10,0
12,0
14,0
0,00 2,00 4,00 6,00 8,00 10,00
Freq
uen
cy [
%]
Wind speed [m/s]

Modeling Dynamic Building Envelope Lisa Molling
25
4.2 Simulation results Model validation and an eventual calibration have not been possible due to the lack of measured values:
Simulations’ goal was to verify the model plausibility. In order to do this, the impact on the façade thermal
behavior of the parameters and boundary conditions reported in Table 6 have been investigated.
Table 6: Model variations
Chapter Object of investigation Meteorological boundary condition
4.2.1 Zones in the cavity Impact of number of zones to airflow rate DesignDay1
4.2.2 Façade height Impact of facade height to airflow rate DesignDay4
4.2.3 Driving forces for airflow Correlation between pressure difference and airflow rate 20th July
Impact of wind and temperature difference to airflow rate 20st July
Impact of constant wind speed to airflow rate DesignDay2 and DesignDay3
Impact of irradiance to airflow rate DesignDay1 and DesignDay2
4.2.4 Heat flow Heat and air flow 15th July at 6PM, 12PM and 6AM
4.2.5 Temperatures Temperature profile in the middle of the facade DesignDays1-6 and DesignDays4-6 (closed cavity)
Temperatures in the cavity DesignDays1-6 and DesignDays4-6 (closed cavity)
4.2.6 Shading device Temperature profile in the middle of the facade with shading device DesignDay1 and DesignDay2
Frequency distribution of temperatures at outside face of facade Summer period (21.07 - 23.09)
4.2.1 Zones in the cavity According to the approaches highlighted in the chapter “4.1.2 Main characteristics of the model” the
cavity model has been set with one zone for the inlet and outlet area and one for each floor, so for a
three-story building this implies 5 zones in the air channel. Nevertheless it is investigated what impact the
number of zones has to the behavior of the façade. The height of the façade section remains constant (8.1
m) but the number of zones in the cavity is varied: 1 zone, 3 zones, 5 zones and 7 zones, as shown in Figure
21.
Figure 21: Number of zones in the air channel varying from 1 to 7
As expected, the time necessary to perform the simulation increases with more zones. This fact can be
observed in Figure 22, the simulation was launched for DesignDay1 with a dual core processor at 2.16
GHz.

Modeling Dynamic Building Envelope Lisa Molling
26
Figure 22: Connection between number of zones and time for DesignDay1
The simulations with one and three zones overestimate the airflow rate (See Figure 23), there are present
one respectively three temperatures in the cavity and so Bernoulli is determined three respectively five
times. The simulations with five and seven zones show a similar development, so a division of the cavity
in more than five zones seems not necessary. What causes the difference after 09.00 AM is not clear and
needs further investigation. Then the airflow rate nears to zero, high fluctuation can be observed,
probably this is a numeric problem and could be eliminated by augmenting the number of timesteps, so
that the calculation is done in shorter intervals. This explanation is only an assumption as has to be proven
by further simulations.
Figure 23: Course of airflow during DesignDay1 for different number of zones in the air channel with a constant timestep of 6 (calculation is done every 10 minutes)
0
5
10
15
20
25
30
Tim
e [s
ek]
1 3 5 7Number of zones
-600
-400
-200
0
200
400
600
800
1000
-0,80
-0,60
-0,40
-0,20
0,00
0,20
0,40
0,60
0,80
1,00
1,20
1,40
0,00 3,00 6,00 9,00 12,00 15,00 18,00 21,00 24,00
Irra
dia
nce
on
fac
ade
[W/m
²]
Air
flo
w r
ate
[m³/
s]
Time [hh.mm]
1zone 3zones 5zones 7zones IrradiationNumber of zones

Modeling Dynamic Building Envelope Lisa Molling
27
4.2.2 Façade height The height of the façade changes strongly the behavior of the building. A higher façade increases the
contact surface for the solar irradiation: hence, the temperature of the glass panes and the air in the cavity
rise as well as the air flow driving force (temperature difference between cavity and outdoor air).
Therefore, the volume flow rate in the cavity increases in a higher façade. (See Figure 24 ) For this
calculation the height of one floor is set to be 2.7 m, what the façade of the single-storey building is 2.7
m high, the two-storey 5.4 m and the three-storey 8.1 m.
Figure 24: Correlation between height of the building and airflow rate at DesignDay4
0
100
200
300
400
500
600
700
800
0,00
0,10
0,20
0,30
0,40
0,50
0,60
0,70
0,80
0,00 5,00 10,00 15,00 20,00
Irra
dia
tio
n o
n f
acad
e [W
/m²]
Air
flo
w r
ate
[m³/
s]
Time [hh.mm]
SingleStoreyBuilding DoubleStoreyBuilding TribleStoreyBuilding Irradiation [W/m²]

Modeling Dynamic Building Envelope Lisa Molling
28
4.2.3 Driving forces for airflow In the chapter “3.2.2 Airflow” the driving forces for the airflow are described in detail. The airflow results
as a difference in pressure generated by wind or by a temperature difference, since the air density
decreases with increasing temperature. Figure 25 shows the relation between the pressure difference and
the generated volume flow rate. This relation characterizes the façade like an air channel. In the following
diagrams a positive airflow rate means, that air is entering at the bottom and leaves the cavity at the top.
Negative values imply an airflow in the opposite direction.
Figure 25: Connection between pressure difference and airflow at 20/07
The wind increases with the height over the ground level. (See Figure 26)
Figure 26: Wind profile above the ground (source: http://searchdatacenter.techtarget.com)
-1,25
-1,00
-0,75
-0,50
-0,25
0,00
0,25
0,50
0,75
1,00
1,25
1,50
0,00 3,00 6,00 9,00 12,00 15,00 18,00 21,00 24,00
Pre
ssu
re d
iffe
ren
ce [
Pa]
Vo
lum
e fl
ow
[m
³/s]
Volume flow [m³/s] Pressure difference Inlet-Outdoor

Modeling Dynamic Building Envelope Lisa Molling
29
So wind triggers air to enter at the top of the façade and decreases the airflow. This fact can be observed
in the following diagram (see Figure 27), which shows the correlation between wind pressure and airflow
in the cavity for an east facing facade. The simulation was carried out for a period of the weather file of
Bolzano, because in a DesignDay no varying wind speed can be inserted, as example day the 20 July is
chosen. In the early morning hours a nearly constant airflow is present, it results from the difference of
pressure due to the difference in temperature of the incoming air and the hotter double-glazing. The
indoor temperature is set constantly to 25°C and so the temperature of the double glazing is near to this
setpoint. The incoming air is heated by the glazing and flows upwards. When the sun rises (around 4.30
AM), the air in the cavity is heated additionally by the irradiance and the airflow increases further. After
11:00 AM wind effects on the airflow can be noticed: on one side, a positive wind pressure causes a
reverse airflow (just before 15:00); on the other side, a negative wind pressure causes a positive airflow
(after 15:00). After 18.30 when neither wind nor irradiation is present the airflow is nearly constant
around 0.5 m³/s due to the higher temperature of the indoor environment.
Figure 27: Correlation between wind pressure and airflow at 20/07
For the grey highlighted period (from 0.00 AM to 11.00 AM) the relation between airflow rate and
pressure difference is illustrated in Figure 28, in the diagram only this period is displayed because no wind
effects are present. The pressure difference is calculated for the node in the inlet zone behind the inlet
opening minus the external node in front of this opening. All values are lying on one line, which can be
described by a power function. Comparing this power function with Kronval´s law ( See chapter “3.3.2
Airflow”), the factor C is 1.5731 and the exponent n is 0.5138 and lies therefore between 0.5 and 1 like
required from the formula. In contrast if we look at the correlation between pressure difference and
airflow rate during the whole day, the values without wind lie on one line (grey and orange points in Figure
29), whereas a big deviation can be observed from the values where wind is present. (Blue points in Figure
29) This deviation occurs because wind and temperature effects are superposponed and the have a
different importance to the airflow.
-5
-4
-3
-2
-1
0
1
2
3
4
5
-2
-1,5
-1
-0,5
0
0,5
1
1,5
2
0,00 3,00 6,00 9,00 12,00 15,00 18,00 21,00 24,00
Tem
per
atu
re d
iffe
ren
ce [
°C]
airf
low
rat
e [m
³/s]
-w
ind
pre
ssu
re [
Pa]
Time [hh.mm]
Airflow Wind Pressure Toutlet - Tout

Modeling Dynamic Building Envelope Lisa Molling
30
When wind effects are present the pressure difference can become negative and the air is triggered to
enter the cavity at the top what leads to a negative air flow rate. In the diagram two points are present
with a negative pressure difference but a positive airflow rate, this cases need further investigation and
they cannot be explained with the theoretical assumptions present in this work. For this diagram the
pressure difference was calculated for the inlet zone minus the outlet zone, the two nodes at the top and
the bottom of the façade. The pressure at the outdoor nodes is influenced too much by the wind effects.
Figure 28: Correlation between airflow rate and pressure difference without wind effects
Figure 29: Correlation between airflow rate and pressure difference
The effect of constant wind speed is displayed in the following diagram (Figure 30) for DesignDay2 and
DesignDay3, which only vary in the presence of a constant wind speed in DesignDay3. DesignDay3 has a
lower airflow due to the wind pressure: with a lower airflow rate the air stays longer in the cavity and is
heated more by the glass panes. Therefore, the difference between outlet air temperature and outdoor
temperature is higher for DesignDay3.
y = 1,5734*x^(0,5139)
0
0,2
0,4
0,6
0,8
1
0 0,05 0,1 0,15 0,2 0,25 0,3 0,35 0,4
Air
flo
w r
ate
[m³/
s]
Pressure Difference Outdoor - Inlet [Pa]
-1,50
-1,00
-0,50
0,00
0,50
1,00
1,50
-0,60 -0,40 -0,20 0,00 0,20 0,40 0,60 0,80
Air
flo
w r
ate
[m³/
s]
Pressure difference Inlet - Outlet [Pa]
11.00 - 18.00 0.00 - 11.00 18.00 - 24.00

Modeling Dynamic Building Envelope Lisa Molling
31
Figure 30: Effect of wind and temperature difference to airflow
The temperature difference between outlet and outdoor air results also from the heating of the single
glazing due to solar radiation. Thus, the air inside the cavity is heated from both sides, by heat transfer
from the single glazing and from the internal double glazing. This fact can indirectly be seen in Figure 31,
where the airflow was calculated for DesignDay1 with a temperature range during the day of 15°C and for
DesignDay2. This two DesignDays vary only in the amount of solar radiation impinging on the façade.
Therefore, the airflow is identic until the sun comes out (at 06.30) then the scenario with higher irradiation
reaches a higher airflow rate. The very low and even negative airflow rated in the afternoon can be
explained with the high temperature of the incoming outdoor air. When the air enters the cavity it gets in
contact with the cooler double-glazing, it cools down and sinks. So a negative airflow, entering at the top
and leaving the cavity at the bottom is stimulated. The indoor temperature is set constantly to 25°C and
so the temperature of the double-glazing is not far from this setpoint, because the indoor air is in direct
contact with the double-glazing.
Figure 31: Effect of temperature difference and irradiance on airflow
-4
-3
-2
-1
0
1
2
3
4
5
-0,8
-0,6
-0,4
-0,2
0,0
0,2
0,4
0,6
0,8
1,0
0,00 3,00 6,00 9,00 12,00 15,00 18,00 21,00 24,00
Tem
per
atu
re d
iffe
ren
ce [
°C]
Air
flo
w r
ate
[m³/
s]
Time [hh,mm]Airflow no wind [m³/s] Airflow with wind [m³/s]Toutlet - Tout no wind Toutlet - Tout with wind
-200
-100
0
100
200
300
400
500
600
700
800
-0,001
-0,0005
0
0,0005
0,001
0,0015
0,002
0,0025
0,003
0,0035
0,004
0,00 3,00 6,00 9,00 12,00 15,00 18,00 21,00 24,00
Irra
dia
tio
n o
n f
acad
e [W
/m²]
Air
flo
w r
ate
[m³/
s]
Time [hh.mm]Airflow DesignDay1 (Temperature range = 15°C) Airflow DesignDay2Irradience DesignDay1 [W/m²] Irradience DesignDay2 [W/m²]

Modeling Dynamic Building Envelope Lisa Molling
32
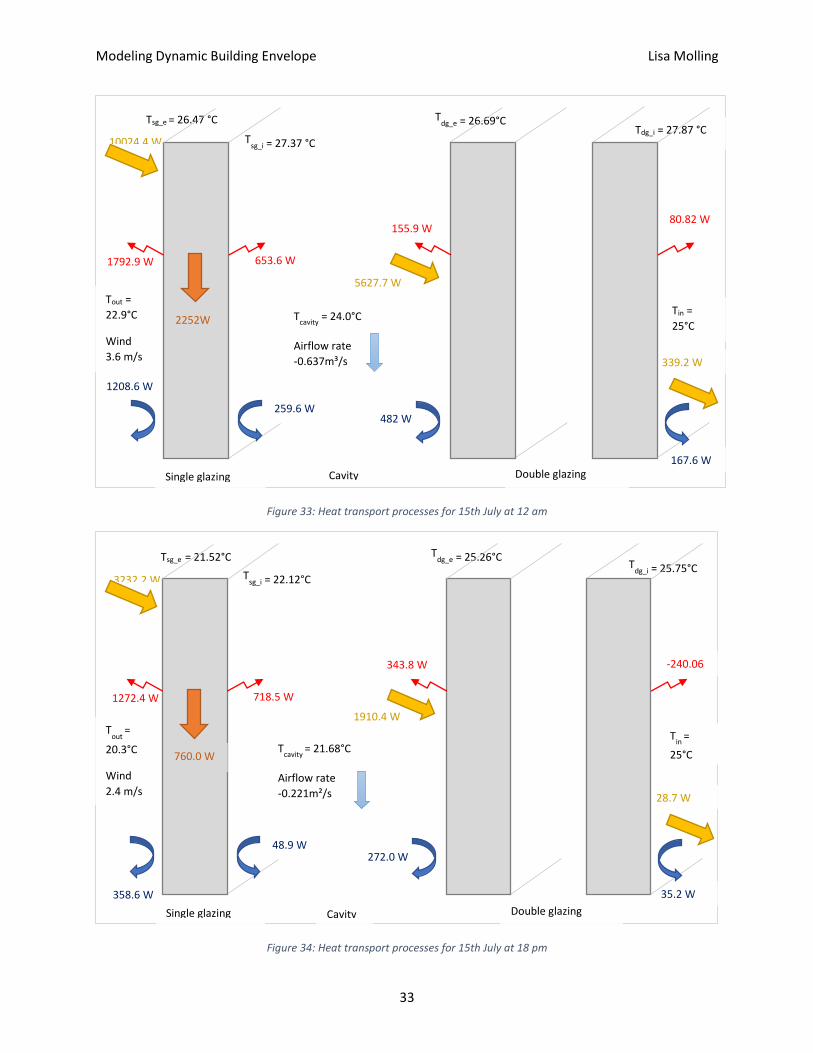
4.2.4 Heat flow The following diagrams (Figure 32, Figure 33 and Figure 34 ) show for the 15th July the heat flows in the
east facing façade. Positive values indicate that the heat flows is in the direction the arrows point,
negative values present a heat flow in the opposite direction. All heat flows are in relation to the surface
area of the façade, so with incoming irradiation the impugning irradiation to the whole facade area is
meant. The following figures are like a snap-shot of the façade to three different times of the day
showing the heat transfer processes and the boundary conditions they are caused. All convective and
radiative heat flows are positive when the temperature of the surface is hotter than the surrounding air,
because heat is transferred from the surface to the air. A negative value occurs only once for these three
scenarios, at 6 o´clock the double-glazing is heated by the indoor air that is set constantly to 25 °C. For
all other cases, the following applies: the glazing is radiated by the sun, grows warm and transfers heat
to the surrounding air due to convection and to the surrounding surfaces due to long-wave radiation.
The radiation incoming to the single glazing is in part reflected, absorbed and transmitted. The
transmitted radiation is the radiation incoming to the double-glazing. The heat transfer processes the
inside of the double glazing are not shown in detail: the two panes interact with each other and
exchange heat in form of long wave radiation, convection, conduction and reflected radiation.
Figure 32: Heat transport processes for 15th July at 6 am
Double glazing
21.8 W
Tout
= 16.9
°C
No wind
Tgd_i= 23.02°C
Tsg_i
= 19.0 °C
Tsg_e
= 18.55 °C
435.9 W
113.2 W
3835.8 W
2300.8 W
272.5 W
1254.7 W 478.0 W
-104.0W
910.8 W
Tdg_e = 21.8°C
Single glazing Cavity
72.1 W
-350.28
Tout
=
25 °C T
cavity = 17.55°C
Airflow rate
0.533m³/s
Modeling Dynamic Building Envelope Lisa Molling
33
Figure 33: Heat transport processes for 15th July at 12 am
Figure 34: Heat transport processes for 15th July at 18 pm
339.2 W
Tout =
22.9°C
Wind
3.6 m/s
Tdg_i = 27.87 °C
167.6 W
1208.6 W
10024.4 W
5627.7 W
482 W
1792.9 W 653.6 W
2252W
Tsg_e = 26.47 °C
Tsg_i = 27.37 °C
Tdg_e = 26.69°C
Single glazing Cavity Double glazing
259.6 W
155.9 W 80.82 W
Tin =
25°C T
cavity = 24.0°C
Airflow rate
-0.637m³/s
28.7 W
358.6 W
Tdg_i = 25.75°C
Tout
=
20.3°C
Wind
2.4 m/s
3232.2 W
1910.4 W
272.0 W
1272.4 W 718.5 W
35.2 W
760.0 W
Tsg_e = 21.52°C
Tsg_i = 22.12°C
Tdg_e = 25.26°C
Single glazing Cavity Double glazing
48.9 W
343.8 W -240.06
W
Tin
=
25°C Tcavity
= 21.68°C
Airflow rate
-0.221m²/s
Modeling Dynamic Building Envelope Lisa Molling
34
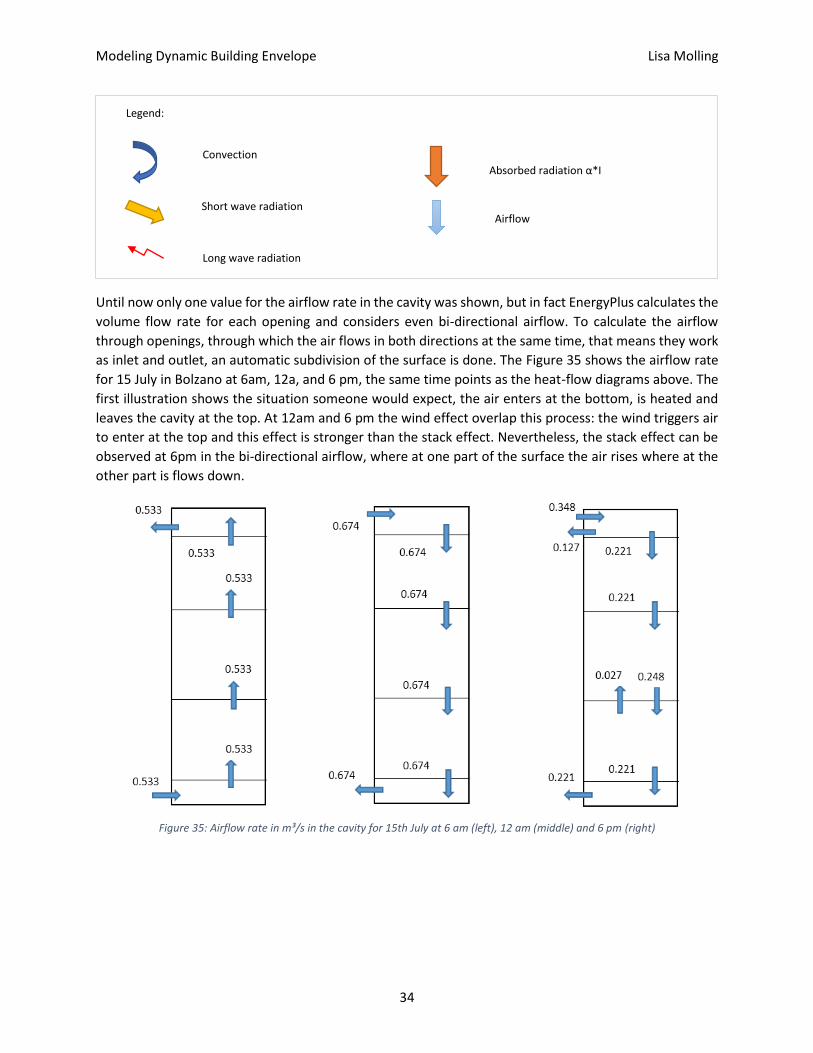
Until now only one value for the airflow rate in the cavity was shown, but in fact EnergyPlus calculates the
volume flow rate for each opening and considers even bi-directional airflow. To calculate the airflow
through openings, through which the air flows in both directions at the same time, that means they work
as inlet and outlet, an automatic subdivision of the surface is done. The Figure 35 shows the airflow rate
for 15 July in Bolzano at 6am, 12a, and 6 pm, the same time points as the heat-flow diagrams above. The
first illustration shows the situation someone would expect, the air enters at the bottom, is heated and
leaves the cavity at the top. At 12am and 6 pm the wind effect overlap this process: the wind triggers air
to enter at the top and this effect is stronger than the stack effect. Nevertheless, the stack effect can be
observed at 6pm in the bi-directional airflow, where at one part of the surface the air rises where at the
other part is flows down.
Figure 35: Airflow rate in m³/s in the cavity for 15th July at 6 am (left), 12 am (middle) and 6 pm (right)
Legend:
Convection
Short wave radiation
Long wave radiation
Absorbed radiation α*I
Airflow

Modeling Dynamic Building Envelope Lisa Molling
35
4.2.5 Temperatures The following diagrams show the behavior of a south facing façade and not oriented towards east like in
the previous simulations. This decision was made, because usually large window areas are facing south.
First, temperatures at height 4.05, in the middle of the façade section, are examined. Figure 36 shows the
temperature profile for the DSF under summer conditions (for DesignDay1, DesignDay2 and DesignDay3
at 12 AM and 2 PM). The temperatures at the surfaces of the glasses are the highest, especially for
DesignDay1 the temperature of the single glazing is nearly 10 degrees hotter than the outdoor
temperature due to the high radiation. The temperatures in the cavity are lower due to the airflow, the
movement of the air in the cavity removes part of the heat. The temperatures during DesignDay3 are
lower than the ones in DesignDay2 due to the wind effect.
Figure 36: Temperatures at 4.05 under different summer conditions
Under winter conditions airflow due to stack effect occurs: during this time of the year this behavior is not
desirable as the airflow leads to lower temperatures of the glazing, and so more energy is needed to keep
the indoor temperatures at a comfort level (Figure 37). The situation is improved if the openings are closed
and the cavity works like a buffer (Figure 38) without any airflow so that the heat is captured in the facade.
Whereas the temperature at DesignDay5 and DesignDay6 at 12 pm for the operating cavity is only 9.24°C,
it is under the same circumstances with a closed opening 22 °C.
24
26
28
30
32
34
36
38
40
Tem
per
atu
re [
°C]
DesignDay1_12am DesignDay2_12am DesignDay3_12am
DesignDay1_2pm DesignDay2_2pm DesignDay3_2pm
CavityExterior Interior
Single Glazing Double glazing

Modeling Dynamic Building Envelope Lisa Molling
36
Figure 37: Temperatures at 4.05 m height under different winter conditions
Figure 38: Temperature profile at 4.05 m height during winter conditions with closed cavity
Next, the temperatures in the cavity are observed. The air temperature in the five cavity thermal zones
located at different height is shown as well as the outdoor temperature and airflow rate as boundary
conditions. The increase in temperature in the three central cavity zones is nearly linear, because the
difference in height between them is constant. The difference in temperature between DesignDay2 and
DesignDay3 in Figure 39 can be explained with the lower temperature of the single glazing due to the
presence of wind and so the air in the cavity is not heated so much. This effect is stronger than the effect
of the lower airflow, what would tend the temperature to rise, because less heat can he transferred to
the overflowing air. Under winter conditions the situation is the same (See Figure 40), even if the
temperature in the cavity is slightly higher than outdoor it is still far away from the temperature indoor.
0
5
10
15
20
25
30Te
mp
erat
ure
[°C
]
DesignDay4_12am DesignDay5_12am DesignDay6_12am
DesignDay4_2pm DesignDay5_2pm DesignDay6_2pm
Exterior Cavity Interior
Single glazing Double glazing
0
4
8
12
16
20
24
28
32
Tem
per
atu
re [
°C]
DesignDay4_12am DesignDay5_12am DesignDay6_12am
DesignDay4_2pm DesignDay5_2pm DesignDay6_2pm
Exterior Cavity Interior
Single glazing Double glazing

Modeling Dynamic Building Envelope Lisa Molling
37
An improvement can be undertaken by closing of the inlet and outlet openings. (See Figure 41) Through
this modification the airflow is hampered, the air is heated in the cavity by the sun and stays there.
Comparing to outdoors the air in the cavity is much hotter, a difference in temperature of 18°C for
DesignDay4 and 14°C for DesignDay5 and DesignDay6. The temperature in the cavity is nearly constant
because the circulation of air is limited to the cavity. The temperature in the outlet zone in case of the
closed cavity is higher because hot air tends to rise and so the hotter air is located at the top of the cavity.
Figure 39: Temperature profile in the cavity during summer conditions
Figure 40: Temperatures in the cavity during winter conditions
0
5
10
15
20
25
30
35
40
DesignDay1_12am DesignDay2_12am DesignDay3_12am
Tem
per
atu
re [
°C]
Outdoor Inlet Cavity1 Cavity2 Cavity3 Outlet
airflow rate 0.001280 m³/sIrradience 380.74 W/m²
airflow rate 0.000634 m³/sIrradience 253.83 W/m²
airflow rate 0.000587 m³/sIrradience 253.73 W/m²
0
5
10
15
20
25
30
35
40
DesignDay4_12am DesignDay5_12am DesignDay6_12am
Tem
per
atu
re [
°C]
Outdoor Inlet Cavity1 Cavity2 Cavity3 Outlet
airflow rate 0.00200 m³/sIrradience 278.8 W/m²
airflow rate 0.00166 m³/sIrradience 198.16 W/m²
airflow rate 0.00159 m³/sIrradience 198.16 W/m²

Modeling Dynamic Building Envelope Lisa Molling
38
Figure 41: Temperatures in the cavity during winter conditions with closed cavity
4.2.6 Shading device The shading device increases the temperature of the single glazing, because part of the transmitted
irradiance is reflected from the blinds and heats the single glazing. (See Figure 42)
Figure 42: Temperature profile at 4.05 m height with and without shading
For the outside face of the double-glazing the temperatures are higher in case no shading device is used,
because less irradiance reaches the glass layer. (See Figure 43) This simulation was carried out for the
meteorological summer, from the 21th June to the 23th September. The first peak is at 21°C, identic for
both cases with and without shading: it represents the condition of rolled up shading because the solar
radiation level impinging the façade is still low.
0
5
10
15
20
25
30
35
40
DesignDay4_12am DesignDay5_12am DesignDay6_12am
Tem
per
atu
re [
°C]
Outdoor Inlet Cavity1 Cavity2 Cavity3 Outlet
No airflowIrradience 278.8 W/m²
No airflowIrradience 198.16 W/m²
No airflowIrradience 198.16 W/m²
23
25
27
29
31
33
35
37
39
41
43
45
Tem
per
atu
re [
°C]
DesignDay1_WithoutShading DesignDay2_WithoutShading
DesignDay1_WithShading DesignDay2_WithShading
Exterior Cavity Interior
Single glazing Double glazing

Modeling Dynamic Building Envelope Lisa Molling
39
When the temperature is higher than 25 °C differences in frequency can be observed, the shading
device is activated. In the scenario without shading device the temperature of the double glazing tends
to be higher, in the frequency distribution a second peak can be seen around 36.5°C.
Figure 43: Frequency distribution of temperature of double-glazing with and without shading during summer months
0
1
2
3
4
5
6
7
8
9
10 15 20 25 30 35 40 45
Freq
uen
cy [
%]
Temperature at the outside face of the double glazing [°C]
Without shading Blinds with sensor at 300 W/m²

Modeling Dynamic Building Envelope Lisa Molling
40
5 Conclusion & Recommendations
5.1 Conclusion The aim of the preset work was to develop a model of a Double Skin Facade. The plausibility tests are
corresponding well with the reality, every phenomena is treated in the correct way, even if there cannot
be made a statement if the values gathered from the simulations are correct. Observations indicate, that
the dimension of the results is realistic. Looking at the simulation results especially at the temperature
profiles at the middle of the facade it is obvious, that DSFs bear the risk of overheating in summer. In
winter the use of DSF facades leads to a higher heating demand if the air cavity is not closed. So from an
energetic and building physical point of view a DSF is not advisable. This fact is knows since decades,
nevertheless this facade form is still build for aesthetic reasons. In addition the DSF has a high space
requirement due to the wide air cavity. The positive aspects are that a DSF offers a good protection for
the shading device and high natural daylighting.
5.2 Further work Like mentioned in the chapter "Building simulation", a model is only an image of the reality and at the
bottom of every model are a lot of simplifications and approximations. Therefore a model is subject to
several restrictions and limitations. Depending on the theoretical background a model cannot be used in
every situation. For the model described in the previous chapters there are some issues that could be
improved, they are the following:
A window cannot cover the total area of its base surface. For a vertical window the rest of the
base surface is found to be 1 mm at each side, for a horizontal window this rest accounts the
hundredfold. This fact leads to an error in the simulation that cannot be avoided. Due to point 1 the width of the cavity was set to 1.2 m having an effective width of 1 m due to the
losses of 10 cm of each side to the base surface. The error following this approach is negligible,
because the calculation in the AirflowNetwork refers to the effective opening area and no losses
of the airflow are taken into account for the fictitious openings, because they don´t exist in reality.
The rest of the base surface separating the thermal zones in the cavity lead to unintentional
shading effects. This effect emerges four times in the cavity and so the transmitted irradiation
reaching the interior according to the simulation is lower than in reality.
The properties of the “virtual material” is only an approximation, because density and heat
capacity are set to be constant and not calculated in function of the temperature and pressure
like normally for in the program.
On the other hand there are a few points which are not investigated further in this thesis, because it
is out of the scope of this work, but it could be the topic of a further work:
Thermal bridges are neglected, it is a minor error like mentioned in “3.3.1 Heat flow”,
nevertheless the fault increases with the façade area and so for the simulation of a whole building
this parameter should be taken into account.
The behavior of the DSF could be improved by coating the glass panes. It has to be investigated
where this coating should be placed and which coating is most suitable.

Modeling Dynamic Building Envelope Lisa Molling
41
The impact of the number of timesteps to the calculation could be topic of further work. The
number of timesteps is the assumed reason for the high fluctuation of the airflow when if nears
zero.
The façade section is placed in the open country without taking into account shading effects
occurring from adjacent buildings or trees. This assumption is never justified when modeling a
real existing building. So for the simulation of a real existing building with a DSF this additional
factor has to be taken into account.
To make a statement of the quality of the model further calibrations are needed, this can be done by
comparing the simulation results with measured data. The airflow is only calculated approximately in the
AirflowNetwork, with a CFD the results could be validated. In addition the results of a DSF could be used
as input to improve the simulation results.

Modeling Dynamic Building Envelope Lisa Molling
42
References 1. DIRECTIVE 2010/31/EU OF THE EUROPEAN PARLIAMENT AND OF THE COUNCIL of 19 May 2010 on
the energy performance of buildings. DIRECTIVE 2010/31/EU. In: http://www.epbd-ca.eu/ (2010)
2. Cabeza, L.F., Castell, A., Medrano, M., Martorell, I., Pérez, G., Fernández, I.: Experimental study on
the performance of insulation materials in Mediterranean construction. Energy and Buildings 42(5),
630–636 (2010). doi: 10.1016/j.enbuild.2009.10.033
3. Pollock, M., Roderick, Y., McEwan, D., Wheatley, C. (eds.): Building simulation as an assisting tool in
designing an energy efficient building: a case study. IPBSA Building Simulation conference,
Glasgow, UK, July 27-30 (2009)
4. U.S. Department of Energy: EnergyPlus Download (2014)
5. Allan Dickson: Modelling Double-Skin Facades. Master’s dissertation, University of Strathclyde
(2004)
6. Chan, A., Chow, T.T., Fong, K.F., Lin, Z.: Investigation on energy performance of double skin façade
in Hong Kong. Energy and Buildings 41(11), 1135–1142 (2009). doi: 10.1016/j.enbuild.2009.05.012
7. Belgian Building Research Institute: Ventilation classification diagram
8. Débora Faggembauu: Heat transfer and Heat transfer and fluid-dynamics in double and single skin
facades. Doctoral Thesis, Universitat Politècnica de Catalunya (2006)
9. Mazzarella, L.: L’involucro edilizio ventilato e trasparente: parametri sintetici e modelli per il calcolo
delle prestazioni. SCUOLA ESTIVA DI FISICA TECNICA, Politecnico di Milano, Luglio 2008.
http://www.scuolaestivafisicatecnica.ing.unisannio.it/materiale_didattico/Prof_Mazzarella/Mazzar
ella_2.pdf. Accessed 8 April 2014
10. Häupl, P., Homann, M., Kölzow, C., Riese, O., Maas, A., Höfker, G., Nocke, C., Willems, W. (eds.):
Lehrbuch der Bauphysik. Springer Fachmedien Wiesbaden, Wiesbaden (2013)
11. US Department of Energy: Engineering Reference. EnergyPlus Documentation (2013)
12. Maryruth Belsey Priebe: Smarter Façades for Fine-Tuned Comfort Control. In: IQPC
13. Dirk SAELENS: ENERGY PERFORMANCE ASSESSMENT OF SINGLE STOREY MULTIPLE-SKIN FACADES.
Post-doctoral qualification (habilitation), University of Leuven (2002)
14. Weller, B., Fahrion, M.-S., Horn, S., Pfuhl, A.-M.: Doppelfassaden im Zeichen des Klimawandels.
Bauphysik 36(2), 68–73 (2014). doi: 10.1002/bapi.201410018
15. Li, S.-S.: A Protocol to Determine the Performance of South Facing Double Glass Façade System. A
Preliminary Study of Active/Passive Double Glass Façade Systems. Master´s Thesis, Virginia
Polytechnic Institute (2001)
16. Tine Steen Larsen: Natural Ventilation Driven by Wind and Temperature Difference. PhD Thesis,
Aalborg University (2006)
17. Lstiburek, J.W.: Toward an Understanding and Prediction of Air Flow in Buildings. PhD Thesis,
University of Toronto (2000)
18. Shameri, M.A., Alghoul, M.A., Sopian, K., Zain, M. Fauzi M., Elayeb, O.: Perspectives of double skin
façade systems in buildings and energy saving. Renewable and Sustainable Energy Reviews 15(3),
1468–1475 (2011). doi: 10.1016/j.rser.2010.10.016
19. Mateus, N.M., Pinto, A., Graça, Guilherme Carrilho da: Validation of EnergyPlus thermal simulation
of a double skin naturally and mechanically ventilated test cell. Energy and Buildings 75, 511–522
(2014). doi: 10.1016/j.enbuild.2014.02.043

Modeling Dynamic Building Envelope Lisa Molling
43
20. Maile, T., Fischer, M., Bazjanac, V.: Building energy performance simulation tools – a life-cycle and
interoperable perspective. Working paper (2007)
21. Manz, H., Frank, T.: Thermal simulation of buildings with double-skin façades. Energy and Buildings
37(11), 1114–1121 (2005). doi: 10.1016/j.enbuild.2005.06.014
22. Kalyanova, O., Heiselberg, P.: Empirical Validation of Building Simulation Software: Modelling of
Double Facades. DCE Technical Report(030) (2008)
23. Pappas, A., Zhai, Z.: ENERGY SIMULATION OF A DOUBLE SKIN FAÇADE: A PROCESS USING CFD AND
ENERGYPLUS (2006)
24. Hensen, J., Bartak, M., Drkal, F.: Modeling and Simulation of a Double-Skin Façade System. ASHRAE
Transactions 108, part 2 (2002)
25. Kim, D.-W., Park, C.-S.: Difficulties and limitations in performance simulation of a double skin
façade with EnergyPlus. Energy and Buildings 43(12), 3635–3645 (2011). doi:
10.1016/j.enbuild.2011.09.038
26. Høseggen, R., Wachenfeldt, B.J., Hanssen, S.O.: Building simulation as an assisting tool in decision
making. Energy and Buildings 40(5), 821–827 (2008). doi: 10.1016/j.enbuild.2007.05.015

Modeling Dynamic Building Envelope Lisa Molling
44
Verpflichtungs- und Einverständniserklärung
Ich erkläre, dass ich meine Bachelorarbeit selbständig verfasst und alle in ihr verwendeten Unterlagen,
Hilfsmittel und die zugrundegelegte Literatur genannt habe.
Ich nehme zur Kenntnis, dass auch bei auszugsweiser Veröffentlichung meiner Bachelorarbeit der
Arbeitsbereich und das Institut sowie die Leiterin bzw. der Leiter der Lehrveranstaltung, im Rahmen derer
die Bachelorarbeit abgefasst wurde, zu nennen sind.
Ich nehme zur Kenntnis, dass meine Bachelorarbeit zur internen Dokumentation und Archivierung sowie
zur Abgleichung mit der Plagiatssoftware elektronisch im Dateiformat „pdf“ ohne Kennwortschutz bei der
Leiterin bzw. beim Leiter der Lehrveranstaltung einzureichen ist, wobei auf die elektronisch archivierte
Bachelorarbeit nur die Leiterin bzw. der Leiter der Lehrveranstaltung, im Rahmen derer die Bachelorarbeit
abgefasst wurde, und das studienrechtliche Organ Zugriff haben.
Innsbruck, am 04.11.2014 ……….………………………………..
Lisa MOLLING