Modeling demand for catastrophic ood risk insurance in ... · PDF fileEnvironment and...
23
Environment and Development Economics http://journals.cambridge.org/EDE Additional services for Environment and Development Economics: Email alerts: Click here Subscriptions: Click here Commercial reprints: Click here Terms of use : Click here Modeling demand for catastrophic ood risk insurance in coastal zones in Vietnam using choice experiments Roy Brouwer, Bui Duc Tinh, Tran Huu Tuan, Kristin Magnussen and Ståle Navrud Environment and Development Economics / Volume 19 / Issue 02 / April 2014, pp 228 - 249 DOI: 10.1017/S1355770X13000405, Published online: 07 October 2013 Link to this article: http://journals.cambridge.org/abstract_S1355770X13000405 How to cite this article: Roy Brouwer, Bui Duc Tinh, Tran Huu Tuan, Kristin Magnussen and Ståle Navrud (2014). Modeling demand for catastrophic ood risk insurance in coastal zones in Vietnam using choice experiments . Environment and Development Economics, 19, pp 228-249 doi:10.1017/S1355770X13000405 Request Permissions : Click here Downloaded from http://journals.cambridge.org/EDE, IP address: 84.49.66.203 on 14 May 2014
Transcript of Modeling demand for catastrophic ood risk insurance in ... · PDF fileEnvironment and...

Environment and DevelopmentEconomicshttp://journals.cambridge.org/EDE
Additional services for Environment andDevelopment Economics:
Email alerts: Click hereSubscriptions: Click hereCommercial reprints: Click hereTerms of use : Click here
Modeling demand for catastrophic ood riskinsurance in coastal zones in Vietnam usingchoice experiments
Roy Brouwer, Bui Duc Tinh, Tran Huu Tuan, Kristin Magnussen and Ståle Navrud
Environment and Development Economics / Volume 19 / Issue 02 / April 2014, pp 228 - 249DOI: 10.1017/S1355770X13000405, Published online: 07 October 2013
Link to this article: http://journals.cambridge.org/abstract_S1355770X13000405
How to cite this article:Roy Brouwer, Bui Duc Tinh, Tran Huu Tuan, Kristin Magnussen and Ståle Navrud(2014). Modeling demand for catastrophic ood risk insurance in coastal zones inVietnam using choice experiments . Environment and Development Economics,19, pp 228-249 doi:10.1017/S1355770X13000405
Request Permissions : Click here
Downloaded from http://journals.cambridge.org/EDE, IP address: 84.49.66.203 on 14 May 2014

Environment and Development Economics 19: 228–249 © Cambridge University Press 2013doi:10.1017/S1355770X13000405
Modeling demand for catastrophic flood riskinsurance in coastal zones in Vietnam usingchoice experiments
ROY BROUWERDepartment of Environmental Economics, Institute for EnvironmentalStudies, VU University Amsterdam, De Boelelaan 1087, 1081 HV,Amsterdam, The Netherlands. Email: [email protected]
BUI DUC TINHCollege of Economics, Hue University, Vietnam. Email: [email protected]
TRAN HUU TUANCollege of Economics, Hue University, Vietnam.Email: [email protected]
KRISTIN MAGNUSSENVista Analyse, Norway. Email: [email protected]
STALE NAVRUDSchool of Economics and Business, Norwegian University of Life Sciences,Norway. Email: [email protected]
Submitted 26 September 2010; revised 24 October 2012, 18 April 2013; accepted 16 June 2013;first published online 7 October 2013
ABSTRACT. In a choice experiment, households in Vietnam are offered flood insuranceto mitigate increasing catastrophic flood risks due to climate change. Participants areasked to choose their most preferred insurance policy given expected future flood andmortality risks, insurance cover and associated insurance premiums. Although notaffordable to everyone, there exists substantial demand for flood insurance. Insurancedemand is spatially differentiated, non-linear in flood probabilities and mortality risks,and subject to significant preference heterogeneity. Since respondents are unfamiliarwith the concept of flood insurance and education levels are low, choice consistencytests were conducted. These show that choice consistency depends on a combination ofrespondent characteristics, such as gender and education level, and experimental designcharacteristics.
This paper is based on a case study carried out under the European Commis-sion 6th Framework Research Programme funded project MICRODIS: IntegratedHealth Social and Economic Impacts of Extreme Events: Evidence, Methods andTools (Contract No. GOCE-CT-2007-036877).

Environment and Development Economics 229
1. IntroductionThe impact of natural catastrophes on societies and economies is likely toincrease in the future. Climate change is expected to increase the frequencyand severity of climate-related catastrophic events (IPCC, 2007). Vietnam isone of the countries in the world most prone to the effects of climate changeand natural disasters. With 3,000 km of coastline and sea level expected torise as a result of climate change, it faces natural hazards of various kinds,most importantly tropical storms such as cyclones and typhoons, floods,landslides and droughts. The country is expected to become more vulnera-ble in the future as a result of an increase in the frequency of some of thesenatural hazards, especially flooding, and its fast growing economy (around7 per cent annually over the past decade) and population (about 2 per centannually over the past decades) (GSO, 2008).
Embankments are the dominant approach to flood control in Vietnam(Do and Bennett, 2008). However, besides physical infrastructures, ‘microinsurance’ is also increasingly considered worldwide as a complementaryflood catastrophe mitigation mechanism. The body of literature related tocatastrophe insurance, and crop insurance in particular, is vast and rapidlygrowing (e.g., Hazell, 1992; Kunreuther, 1996, 2006; Kleindorfer and Kun-reuther, 1999; Browne and Hoyt, 2000; Vandeveer, 2001; Botzen and vanden Bergh, 2008, 2012; Brouwer and Schaafsma, 2013). It has been arguedthat crop insurance can play a vital role as a risk management instrument toenable poor farmers in developing economies to cope with weather-relatedproduction risk, hence contributing to poverty alleviation (e.g., Hazell,2001).
However, empirical evidence of demand for catastrophe insurance andhousehold risk aversion is limited in a developing country context (Akteret al., 2011). In this study, a choice experiment was therefore developed toinvestigate household willingness and ability to pay for micro insuranceto reduce socioeconomic vulnerability and increase the coping capacityof residents living in different flood-prone coastal zones in Vietnam. Thedesign of the choice experiment is an extension of previous research onmicro insurance conducted in Bangladesh (Brouwer and Akter, 2010). Thenovelty of the study is found in the estimation of the economic value ofpreventing a fatality, generally referred to as the value of a statistical life(VSL), under different catastrophic flood probabilities. This is to our knowl-edge the first stated preference study trying to estimate the VSL related tocatastrophic flooding. Most stated preference studies of VSL refer to mor-tality risks due to air pollution, road safety or general environmental risks(Dekker et al., 2011).
The choice experiment was preferred over the contingent valuationapproach since it allowed testing of the conditions under which house-holds favor micro flood insurance. The contingent valuation method islimited in the number of possible terms and conditions that can be pre-sented to respondents. Although still hypothetical, the choice experimentresults provide important indications of household demand for micro floodinsurance under different contractual design and provision conditions,such as insurance sum and premium. Moreover, compared to the ‘one shot’contingent valuation approach, through choice repetition respondents are

230 Roy Brouwer et al.
expected to be capable of making more precise and consistent decisions:they learn about the survey format, the associated hypothetical market andtheir own preferences (e.g., DeShazo and Fermo, 2002).
The paper is organized as follows. Section 2 presents the design of thechoice experiment and section 3 the underlying econometric model. Section4 introduces the case study area and describes the survey conducted tocollect the empirical data. The choice experiment results, including willing-ness to pay (WTP) for micro flood insurance and the VSL under differentcatastrophic flood probabilities, are presented in section 5. Finally, section6 concludes.
2. The choice experimentStated preference methods are rarely used in flood risk valuation stud-ies (Brouwer et al., 2009; Botzen and van den Bergh, 2012). Demand forflood insurance has mainly been examined using existing actuarial datain countries where flood insurance exists (e.g., Kunreuther et al., 2009;Michel-Kerjan and Kousky, 2010).
In stated preference research, the general expectation underlying WTP isthat people are risk averse when their decision involves potential lossesunder low probability–high impact conditions, and corresponding indi-vidual choice behavior is motivated by a desire for security (Tversky andKahneman, 1979). In this study, respondents are faced with a situationwhere catastrophic events occur frequently with devastating effects onpoor rural populations, and we test if risk aversion also holds under thesecircumstances. In theory, WTP for a reduction in risk exposure dependson: (i) the realized level of risk R, which is determined by exogenous riskX and self-protection activities SP; (ii) individual characteristics such asdisposable income Y to be able to protect oneself against risk; and (iii) anindividual’s disutility from risk exposure (risk aversion) and hence utilityS from a risk reduction (Bateman et al., 2005). This is shown in equation (1).
WTPi = f (Yi , Si , R(X, SPi )) (1)
Most environmental risks faced by individuals are to a degree endoge-nous, since people can take actions to reduce the likelihood of an unde-sirable event occurring (self-protection) and the costs of the event tothem if it occurs (self-insurance) (Shogren and Crocker, 1991). In equi-librium, individuals equate the marginal benefits of self-protection orinsurance (expected avoided disutility) with the marginal costs (price ofself-protection or insurance), subject to their budget constraint. In the caseof fatal risks, i.e., where people run the risk of dying, for instance due tocatastrophic flooding, the concept of VSL can be used to measure the rateat which people are willing to trade off money income for reductions inmortality risk (Alberini and Chiabai, 2007). The VSL is calculated by divid-ing the maximum amount of money an individual is willing to pay for areduction in mortality risk by the change in the probability of dying.
Demand for flood insurance is expected to increase as the frequencyof catastrophic flooding increases, for instance due to climate change.

Environment and Development Economics 231
In the choice experiment, respondents are asked to value increases in catas-trophic flood probabilities from their initial (baseline) level. Included in thedescription of these exogenously driven future risk levels in the choiceexperiment is also the probability of dying as a result of a catastrophicflood. This allows us to estimate a VSL for different fatality probabilitiesdue to catastrophic flooding. In general, WTP to reduce mortality risk isexpected to increase when the latter is higher (Lindhjem et al., 2011). SinceWTP is divided by the mortality risk to find the VSL, the VSL decreaseswith increasing mortality risk. Following Brouwer and Schaafsma (2013),social disruption is included to represent the immaterial damage cost dueto catastrophic flooding.
The variation in the endogenous component of realized risk is found inthis study in the offered insurance schemes in the choice experiment. Theseinsurance schemes are offered to respondents after they are first presentedwith different states of the world in terms of catastrophic flood probabil-ity, fatality and social disruption. The insurance schemes are subsequentlydescribed in terms of insurance provider, cover and premium. In this way,we are able to value both the characteristics of different states of the worldand the characteristics of the insurance policy.
The insurance coverage sum, i.e., the loss paid directly to the insured bythe insurer for first-party coverage, varies from VND (Vietnamese Dong)25 million to VND 100 million per catastrophic flood event. In accordancewith previous findings (Brouwer and Akter, 2010), risk adverse householdsare expected to prefer higher damage cover. Furthermore, the catastrophicflood insurance can be provided either by a public (government) or pri-vate operator (insurance company of the respondent’s own choice). No apriori expectations exist regarding household preferences for either publicor private insurance provision. The premium for the insurance consists ofmonthly household installments varying from VND 2,500 to VND 20,000.
The experimental design is summarized in table 1. Baseline conditionsfor catastrophic flood probabilities, including mortality risks, are includedin the design to test if the VSL is increasing in the level of baseline risk(e.g., Eeckhoudt and Hammitt, 2001). In the case of catastrophic floodingthe baseline level is once every 100 years and for the probability of a fatalitythis is one in every 10,000 people. Due to climate change these probabilitiesare expected to increase in the case study area.
Alternative states of the world and insurance schemes are created bycombining the six variables presented in table 1 based on their levels.Because respondents cannot be shown all possible combinations, the num-ber of choice options is reduced to 16 sets of eight choice tasks each basedon a D-efficient fractional factorial design using the software Sawtooth.Hence, respondents are asked to choose between 256 alternatives presentedin pairs on 128 choice cards, which are divided over 16 sets of eight cards.Each respondent is randomly shown one of these 16 sets of eight differentchoice cards.
Finally, one of the main assumptions underlying stated preferenceresearch is that respondents know their preferences and that these prefer-ences are stable and coherent (e.g., Brown et al., 2008). Hence, from a set of

232 Roy Brouwer et al.
Table 1. Experimental design
Attributes Units Levels
1. Flood return period Once in every x years 100-50-20-102. Probability of fatality One in every x persons 10,000-5,000-2,000-1,0003. Length of social
disruptionWeeks 1-2-4-8
4. Insurance provider Public or private Government-Insurancecompany
5. Insurance cover Million VND/catastrophic event
25-50-75-100
6. Insurance premium Monthly installment inVND
2,500-5,000-7,500-10,000-15,000-20,000
alternative insurance policies given for future states of the world, the indi-vidual is assumed to be capable of selecting the most preferred insurancepolicy based on its characteristics. However, lack of familiarity and experi-ence with flood risk insurance may undermine these a priori assumptions(Shaikh et al., 2007). We examine choice consistency by presenting respon-dents with the same choice task at the beginning and the end of the choiceexperiment. So, a ninth card is added to each choice set, which is identicalto the first choice card. Based on theory, choice behavior at the start of theexperiment is expected to be consistent with choice behavior at the end ofthe experiment (Brouwer et al., 2010).
3. Econometric modelThe design of the choice experiment can be translated into the followingindirect utility function:
Vi j = β0 + β1FPi j + β2MRi j + β3SDi j + β4 Ii j + β5Ci j + β6 Pi j + εi j (2)
where indirect utility V of respondent i is measured through his or herobserved choice for alternative j and an unobservable random term ε. Thislatter term is assumed to have an independent and identically ExtremeValue Type I error distribution (e.g., Train, 2003).
Each alternative j is described with the help of a vector of k attributes,where β is the corresponding coefficient vector. In this case study, theparameters β1 to β3 represent the various states of the world: the exoge-nous increase in catastrophic flood probability (FP), mortality risk (MR)and social disruption (SD) due to climate change, while β4 to β6 refer tothe characteristics of each insurance alternative j to mitigate the impacts ofcatastrophic flood risks: the insurance provider (I ), damage cover (C) andinsurance premium (P).
Respondent preferences and hence demand for micro insurance areexpected to be higher when risk exposure is higher. Under the assump-tion that households are risk averse, they are expected to prefer higher

Environment and Development Economics 233
indemnity coverage. The insurance premium is expected to have a negativeeffect on choice behavior: the higher the premium, the lower the probabilitythat someone will want to buy insurance. The expected direction ofinfluence of the attributes included in equation (2) is summarized below:
∂V /∂FP < 0; ∂V /∂MR < 0; ∂V /∂SD < 0; ∂V /∂C > 0; ∂V /∂ P < 0. (3)
Affordability is expected to play an important role in this specific devel-oping country context too. Household income is theoretically expected tosignificantly influence choice behavior. Lower income groups are less likelyto be able to afford and hence choose insurance with higher premiums.Interactions between attributes and individual socioeconomic characteris-tics can be included in the utility function to account for such preferenceheterogeneity. The utility function is estimated using mixed logit regres-sion models (e.g., Train, 2003; Hynes et al., 2008), which allow us to capturethe expected heterogeneity in respondent preferences due, among others,to differences in risk exposure as a result of the different locations whererespondents live.
4. Survey implementationThe study presented in this paper was conducted in the province QuangNam in Central Vietnam, about 300 km south of the old capital city, Hue.Quang Nam is a tropical coastal highland with an average temperature of25.4 C and an average annual rainfall of 2,580 mm. The climate of QuangNam knows two seasons: the rainy season from September to Decemberand the hot dry season from February to April. Around 70 per cent ofQuang Nam’s topography is made up of mountains and hills. The coastalzone of Quang Nam is plain land. The rivers Vu Gia, Thu Bon and Tam Kyare the main water providers for socioeconomic activities in Quang Nam(SRV, 2007). In 2007 the province had more than 1.4 million inhabitants, ofwhich 83 per cent lived in rural areas and depended mainly on agricultureand aquaculture for their livelihood (GSO, 2008).
The study area is highly vulnerable to climatic hazards, such as trop-ical storms, floods and droughts, due to its geographic location andtopographic conditions. These hazards cause losses to agriculture, infras-tructure, households and life. Flooding is the most common of all environ-mental hazards, especially in the rainy season due to heavy rainfall. Futureclimate change is expected to worsen the situation. The most prominentfloods in the last decades were those of 1999 and 2007. The most recentcatastrophic flood in 2007 is used in this study as a point of reference. Thisextreme flood also caused by far the highest damage costs. The total esti-mated damage costs were around US$87 million and about 70,000 peoplehad to be evacuated (Scarpa et al., 2005). The floods furthermore killed 39people, while 339 people were seriously injured.
Within Quang Nam, three different districts were selected, which arelocated downstream from each other along the river Vu Gia: the upland dis-trict Dai Loc, the midland district Dien Ban, and the coastal district Hoi Anwhere the river drains into the sea. In view of the fact that the province has

234 Roy Brouwer et al.
a slope from west to east, during heavy rainfall this causes flooding withinundations especially in downstream areas. Hence, demand and WTP formicro flood insurance across the three risk-prone areas are expected to behigher in the downstream areas Dien Ban and Hoi An.
Due to a lack of information about exact household numbers and lim-ited information about household socio-demographic characteristics at thedistrict level, two communes were randomly selected from each district.Households living in the villages within each commune were subse-quently randomly selected from available lists with household names andaddresses at the commune level. In total, 540 households were selected inthis way, 180 households from each district, equally divided across the twocommunes, which were more or less equally sized in terms of householdnumbers based on the available household lists. The survey consisted offace-to-face interviews lasting about 30 minutes and was conducted over atwo-month time period in August and September 2009 by trained inter-viewers graduated from the University of Hue. The response rate wasclose to 100 per cent. Thirty interviews were dropped due to incompletequestionnaires, which resulted in a total number of 510 observations.
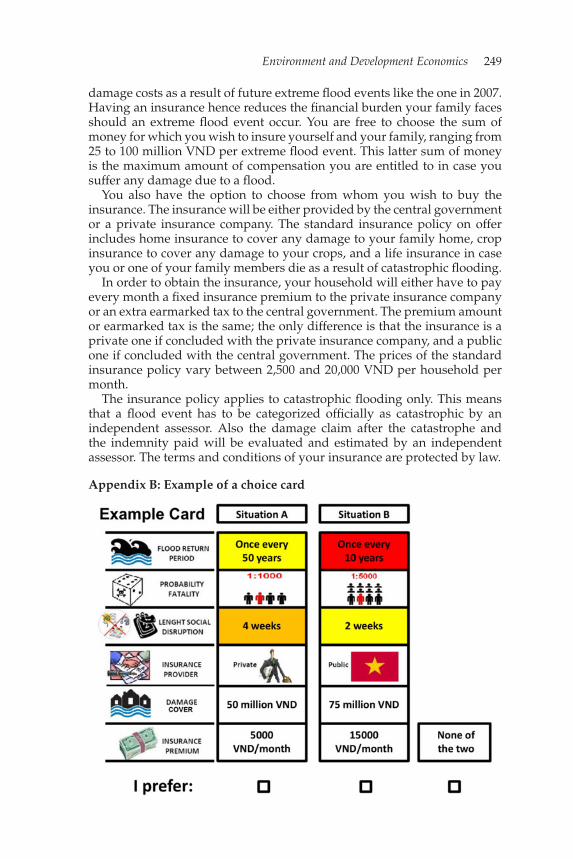
The questionnaire used for the survey consisted of three parts. The firstpart collected information about the household socio-demographic charac-teristics (e.g., age of the household head, household composition, incomesources, etc.). The second part focused on household risk exposure levels,in particular related to the 2007 catastrophic flood event (e.g., frequencyof flooding, inundation levels during regular flood seasons and the catas-trophic 2007 flood, financial damage as a result of the 2007 flood, etc.). Thethird and final part included the choice experiment. The introduction to thechoice experiment is included in Appendix A. Special attention was paid tothe communication of the flood and mortality risks. The questionnaire andthe choice experiment, including the risk levels, were pretested through 50face-to-face interviews in the case study area prior to implementation of thesurvey. Changes were made to the questionnaire and choice experimentafter the pretest, mainly to further clarify questions and the choice task.The survey targeted rural residents with limited education. Therefore, theattributes and their levels were conveyed to respondents on choice cardswith pictographs and as little text as possible. Choice cards were printedon separate sheets of paper, laminated and bound together into a spiralbinder for multiple use.
Each choice card shows two alternatives describing a possible futurecatastrophic flood risk situation and a specific micro insurance schemeto mitigate the possible financial impacts of this future risk on house-hold socioeconomic vulnerability along with the option to choose noneof the two (neither option A or B). The latter ‘opt-out’ option, as it wasexplained to respondents, is the baseline alternative and implies facing theincreasing climate change induced catastrophic flood risks in the futureand choosing not to mitigate them through the purchase of an insurancepolicy. The additional mitigation costs in this opt-out alternative are there-fore zero. The baseline alternative was not further specified since baselineconditions were expected to differ across districts and individual respon-dents. The inclusion of this alternative is instrumental to estimate welfare

Environment and Development Economics 235
measures that are consistent with economic demand theory (Hanley et al.,2001).
An example of a choice card is presented in Appendix B. Respondentswho chose the opt-out were asked in a follow-up question for their reasons.In order to make sure respondents had a clear understanding of the choicetask, they were first asked to make their choice using an instruction card.Here, they were allowed to ask questions about the choice task before thechoice experiment started.
5. Results5.1. Sample characteristicsThe socio-demographic characteristics of the 510 households included inour sample are summarized in table 2. No significant differences are foundfor any of the socio-demographic characteristics between the three districts,except for the share of crop income in total household income.1 Comparedto the limited available regional statistics for the province Quang Nam,the sample is fairly representative in terms of gender (52 per cent of thewhole population is female) and household size (the average in the wholepopulation is five family members).
Most respondents in our sample are female and married (54 per cent).The average age of the respondent is around 40–50 years, with most respon-dents (55 per cent) falling in the age groups between 30 and 50 years and51 and 65 years (26 per cent). The average number of years of schooling issix. Five per cent of the respondents are unable to read and write.
The households consist on average of five members, of which three earnincome. Average household income in the sample is slightly less than thatfor the population as a whole (20 million VND or around $1,000 per yearbased on an average exchange rate in 2009 of 18,465 VND per US$). Lessthan 10 per cent have an annual income level that falls below the NationalPoverty Line fixed by the Ministry of Labour, Invalids and Social Affairsat VND 1,200,000 (US$65) for rural households (MOLISA, 2009). This shareis lowest in Dien Ban and more or less the same in Dai Loc and Hoi An.As for the whole population, most people depend on agriculture, i.e., cropcultivation and livestock holding, for their livelihood. Less than half of thehouseholds in the sample live in a brick house, 8 per cent live in a woodenor bamboo constructed house. Everybody has access to electricity, but only20 per cent to piped drinking water. Most households use tube well water.On average, a household owns only 0.15 ha of land.
Turning to the risk exposure indicators in table 2, all respondents livewithin a radius of 5 km from the nearest river. On average, a house-hold lives less than 1 km from the nearest river, and almost a quarter ofthe respondents (23 per cent) live between 1 and 5 km from the nearest
1 The outcome of the non-parametric Kruskal–Wallis test rejects the null hypothesisof equality across the three districts at the 1 per cent level (KW − χ2 = 9.507; p <
0.009).

236 Roy Brouwer et al.
Table 2. Summary of household characteristics across the three districts
Sample characteristics Dai Loc Dien Ban Hoi An
Socio-demographic characteristicsGender (% male) 39.9 43.6 41.2Average age 46.8 48.0 47.1Average number of years of schooling 6.5 6.4 6.0Average number of household members 4.6 4.5 4.5Average number of working adults 3.0 3.0 2.8Average number of children 1.1 1.2 1.3Average household income (million VND/year) 18.1 19.4 17.9Share households below poverty line (%) 7.7 1.8 6.8Share crop income in total household income (%) 20.3 25.1 17.9
Risk exposure characteristicsAverage distance to nearest river (km) 0.81 0.92 0.84Share living in house with elevated ground
floor (%)24.7 22.4 23.7
Share who has ever been evacuated due to flood (%) 41.0 41.5 44.1Average household flood damage 2007 (million
VND)2.6 5.9 4.6
Mode statistic inundation level in 2007 head shoulder headMode statistic inundation duration in 2007 (days) 3–4 3–4 3–4
Risk coping characteristicsShare taking flood protection measures (%) 91.1 97.6 92.7Average number of recovery days 2007 flood 13.9 18.4 10.7Share borrowing money after the 2007 flood (%) 16.8 11.5 10.1Share stating they cannot cope with flood
disasters (%)16.4 20.7 21.1
Risk perception characteristicsShare who believes floods are main problem (%) 55.7 57.3 56.0Share believing extreme floods increased past 10-20
years (%)79.2 81.2 76.3
Share believing that extreme floods will increase infuture (%)
64.5 66.0 54.3
river. This is the same across all three districts. The only significant dif-ference is found between Dai Loc and Dien Ban.2 Three-quarters of thesample live in a one-storey house, a quarter in a house with an elevatedground floor. The flood disaster in 2007 was more severe than regularflooding during the rainy season, with a majority of the households inall three districts reporting shoulder-high inundation levels. The highestinundation levels were reported in Hoi An, followed by Dien Ban. Most
2 The outcome of the non-parametric Mann–Whitney test rejects the null hypothesisof equal distances to the nearest river between these two districts at the 1 per centlevel (MW − Z = −2.511; p < 0.012).

Environment and Development Economics 237
households suffered from the inundations for 3–4 days, especially in HoiAn and Dai Loc. In most cases, the floods did not last longer than oneweek. Significant differences are found for inundation levels between theupland district Dai Loc and the coastal district Hoi An, and for inun-dation duration between upland Dai Loc and the midland district DienBan.3
The average household flood damage in 2007 was highest in Dien Ban(US$315), followed by Hoi An (US$245) and then Dai Loc (US$140). Despitethe fact that the damage was more than twice as high in Dien Ban thanin Dai Loc, the difference is not statistically significant due to the highstandard deviations. The same applies if the self-reported flood damage isexpressed as a percentage of household income. Only the ranking of mostseverely struck districts changes in that case: the impact of the flood dam-age on household income is highest in the coastal district Hoi An (85 percent) and lowest in the midland district Dien Ban (61 per cent). The shareof the flood damage costs of average household income in Dai Loc is 73per cent. These relative ranks correspond with the ranking of the numberof recovery days after the disaster flood in 2007. The number of recoverydays is significantly higher in Dien Ban than in Hoi An, but not in Dai Loc.4
Between 40 and 45 per cent of all households have experienced evac-uations as a result of flooding and the share of households taking floodprotection measures is also very high. The most important measure beforeand during the flood events is to move property to a safer place. Besidescleaning the house and yard, securing clean drinking water is one of themost important activities after the flood event. Almost half of the sampleare not satisfied with their current level of protection against catastrophicfloods. Around 20 per cent of the sample stated that they are unable to copewith the impacts of flood disasters like the one in 2007. Most frequentlyheard reasons are that (i) they feel they live in an unstable house in a lowlying area close to the river, (ii) they are too old and weak to protect them-selves and have no adult family member to help them, and (iii) they haveinsufficient financial resources to recover from a catastrophic flood. In thelatter case, many respondents reported that they still have unrepaired dam-ages from the flood in 2007. On average, 13 per cent borrowed money afterthe extreme flood in 2007. This share was highest in Dai Loc and more orless the same in Dien Ban and Hoi An.
Finally, a majority of the respondents in all three districts considercatastrophic flooding the most important issue in their region. This is eas-ily understood after examination of the high share of the sample facingcatastrophic flood risks. A majority of 80 per cent of the respondents areof the opinion that catastrophic floods have increased over the past 10–20years. Sixty per cent believe that their frequency of occurrence will increase
3 Mann–Whitney Z values are respectively −2.801 (p < 0.005) and −2.558 (p <
0.011).4 The outcome of the Mann–Whitney Z-statistic is −1.665 (p < 0.096) when com-
paring households from Hoi An and Dien Ban, 0.859 (p < 0.390) for Dai Loc andDien Ban and −0.831 (p < 0.406) for Hoi An and Dai Loc.

238 Roy Brouwer et al.
further in the future. Forty per cent of the sample consider this likely and45 per cent very likely, while 10 per cent are convinced that they will bestruck more often by catastrophic floods in the future.
5.2. Testing equality of choice models across the three districtsOur hypothesis that demand is higher in the downstream areas Dien Banand Hoi An was first tested using the Swait and Louviere (1993) proce-dure. Based on the socio-demographic and risk exposure characteristicspresented in section 5.1, the three districts seem fairly similar. However,in order to ensure that the data collected in the three districts can be com-bined in one aggregate model, we test whether the utility parameters β
presented in equation (2) and the scale parameters μ in the choice model(e.g., Louviere et al., 2000) are equivalent across districts. To this end, apair-wise comparison is performed between the districts. In a first step, themixed logit models of each district provide us with efficient estimates forμ1β1, . . . , μ6β6 in equation (2) and a likelihood function for each district.Then the scale parameter of, for example, the first district is normalized toμ1 = 1 for identification purposes.
In a second step, a pooled model including the first and second districtis estimated, which has the effect of imposing equality on the preferenceparameters (β1 = β2). In this model the relative scale parameter μ2/μ1 is,however, not set equal to 1. A search procedure over a range of relativescale parameters is applied to estimate the combination of scale and pooledpreference parameters providing the best model fit. At each possible rela-tive scale parameter the data for the second district are rescaled such thata mixed logit model can be estimated. After the best fit model has beenidentified, a standard chi-square (Likelihood Ratio) test using the log like-lihoods of the models from step 1 and the best fit model in step 2 can beused to test the difference between the preference parameters in the twodistricts under the null hypothesis that they are the same.
The third step, in which we test for differences in scale across districts,is conditional on accepting the chi-square test in step 2. It requires the esti-mation of a mixed logit model for the same pooled model as in step 2, butwith equality imposed on both preference and scale parameters this time(β1 = β2 and μ1 = μ2). Again, a chi-square test can be applied to comparethe log likelihood of the estimated model to the log likelihood of the pooledmodel with varying scale parameters. The results of this test procedure arepresented in table 3.
Equality of preference parameters is convincingly rejected for the pooledsamples including the highland district Dai Loc (column 6), but cannotbe rejected at the 10 per cent significance level for the two downstreamdistricts Dien Ban and Hoi An. Also equality of scale parameters cannotbe rejected for Dien Ban and Hoi An (last column 9). This implies thatthe choice models for Dien Ban and Hoi An can be estimated using thesame pooled model. However, control has to be included for Dai Loc aspreference and scale parameters are significantly different for respondentsfrom this district.

Environm
entandD
evelopmentE
conomics
239
Table 3. Test results for equality of preference (β) and scale (μ) parameters between districts and between the first and last choice task
Relative RelativeLLCi+j LR-test Reject scale variance LLCi+j LR-test Reject
LLCa LLCb (μCa = μCb)a (12 d.f.) H0: βCa = βCb? (μCb/μCa) (σ 2Cb/σ 2
Ca) (μCa = μCb)b (1 d.f.) H0: μCa = μCb?
Comparison between districtsDai Loc &
Dien Ban−736.983 −715.412 −1472.302 39.8 Yes 1.01 1.61 −1472.31 0.02 No
Dai Loc &Hoi An
−736.983 −779.014 −1528.815 25.6 Yes 0.89 2.08 −1539.91 22.19 Yes
Dien Ban &Hoi An
−715.412 −779.014 −1502.574 16.3 No 1.03 1.55 −1502.64 0.13 No
Comparison between choice tasksTask 1 and 2 −258.981 −261.053 −534.601 29.1 Yes 0.95 1.82 −534.659 0.11 NoTask 1 and 9 −258.981 −172.813 −385.274 93.0 Yes 1.36 0.89 −386.899 3.25 Yes
Notes: LL, log likelihood. Likelihood ratio (LR) tests performed at 10% significance level.aPooled mixed logit model allowing scale parameters to vary; bpooled mixed logit model keeping scale parameters constant.
240 Roy Brouwer et al.
5.3. Choice consistency test resultsIn order to test choice consistency, respondents were shown the firstcard also at the end again without telling them.5 When asked afterwardswhether they were aware of the fact that the first and last choice card werethe same, 38 per cent of the respondents said that they noticed this, andhence most respondents did not know that they were shown the same cardtwice. When furthermore asked if they chose the same alternative on bothchoice occasions, 86 per cent said yes. This is slightly higher than what wasactually observed. Almost 80 per cent of all respondents (78.6 per cent) con-sistently chose the same alternative during the last choice task as they didduring the first choice task. This high share suggests that preferences arestable. However, when comparing the estimated choice models betweenthe first and last choice task using the same Swait-Louviere test procedureas in the previous section, both equality of preference parameters and scaleparameters is rejected at the 10 per cent significance level (table 3).
Comparing the error variance between the first and the last choice taskand between the first two choice tasks, evidence of preference refinement isfound. The error variance is significantly different when comparing choicecards 1 and 9, but not between choice cards 1 and 2. The variance is reducedby more than 50 per cent when going through the choice sequence fromchoice card 1 to choice card 2 and then on to choice card 9. Hence, althoughchoices are consistent in a majority of cases, we find evidence of preferencelearning and refinement.
When regressing the variable as to whether or not a respondent changedhis or her choice during the last choice task on a number of socio-demographic and design characteristics, choice consistency appears to be afunction of both respondent socio-demographic and experimental designcharacteristics (table 4). The explanatory power of the estimated binarylogistic regression model is high, almost 50 per cent. Women are more likelyto change their choice, as well as higher educated respondents and respon-dents who suffered more damage during the catastrophic flood in 2007.
On top of these variables, a significant effect of the experimental designwas also detected. Three of the 16 choice sets appeared to significantlyreduce the likelihood of respondents changing their choice during the lastchoice task compared to what they chose in the beginning. Dummy vari-ables were created for the different choice sets to see if we could finda significant relationship between specific choice sets and choice consis-tency. Examining the levels of the attributes of the alternatives in thesethree choice sets more carefully, the first alternative in the first (and last)choice task consistently had the lowest insurance premium and lowestcatastrophic flood probability (and in two of the three choice sets alsothe highest indemnity cover). In other words, despite randomizing thesequence in which choice cards were shown to respondents, these alter-natives have the appearance of being dominant, hence explaining whyrespondents might have been reluctant to change their choices. We also
5 Following the procedure outlined in Brouwer et al. (2010), the first card in eachchoice set was randomly picked and shown to the respondent by the interviewer.

Environment and Development Economics 241
Table 4. Estimated binary logistic model (1 = changed choice in last choice task)
Parameter StandardVariables Description estimate error
Experimental design characteristicsChoice set 6 Dummy −1.330 0.601∗∗Choice set 7 Dummy −2.926 0.794∗∗∗Choice set 16 Dummy −1.202 0.633∗
Respondent characteristicsGender Dummy (1 = female) 0.955 0.362∗∗∗Education level School years 0.065 0.036∗Flood damage suffered in 2007 Million VND 0.281 0.095∗∗∗
Model summary statistics−2 Log likelihood 179.662Percentage correct predicted 78.8R-square 0.488N 193
Notes: Significance levels: ∗10%, ∗∗5%, ∗∗∗1%, respectively.
tested for possible interviewer effects on choice consistency, but could notfind any.
5.4. Choice experiment and WTP resultsOf the 510 respondents, 62 per cent are interested and willing to pay forflood insurance. Hence, WTP for flood insurance is positive in a majorityof the cases. Of the 194 respondents (38 per cent of the whole sample) whoconsistently chose neither of the two alternatives in the choice experiment,a majority (81 per cent) were either not interested in flood insurance orunable to pay extra for flood insurance given their limited financial income.These are considered legitimate reasons for refusing to choose between oneof the two hypothetical alternatives, because they correspond with theoret-ical expectations (i.e., no preferences for the good in question and lack ofincome). The protest rate in this study is 6 per cent. Protest rates are moreserious, because they provide important clues about the validity and relia-bility of the choice experiment, often related to procedural bias. Althoughno strict guidelines exist in the literature, a protest rate of 6 per cent isconsidered acceptable. The most important reason to protest was that,despite the extensive introduction to flood insurance, respondents wantedmore information before they felt capable of making a decision whetheror not to buy it. When asked after the choice experiment which attributeplayed the most important role in their decision to choose between thetwo alternatives, the catastrophic flood return period was mentioned mostoften (32 per cent), followed by the insurance premium (21 per cent).
The choices were regressed on the choice attributes and other covariatesusing a combined random parameters and error component logit model,which was estimated in NLOGIT version 4.0, accounting for the panel data

242 Roy Brouwer et al.
Table 5. Estimated choice model
StandardParameter Standard deviation Standard
Variables estimate error random pars error
ASC 1.725∗∗∗ 0.232
Choice attributesStates of the world
Flood return period −0.048∗∗∗ 0.004 0.007∗∗∗ 0.001Flood returnperiod-squared
0.0003∗∗∗ 0.00004
Probability fatality −0.0003∗∗∗ 0.00005 0.0001∗∗∗ 0.00002Probability fatality-squared
0.232 · 10−7∗∗∗ 0.398 · 10−8
Social disruption −0.039∗ 0.021 0.230∗∗∗ 0.022
Risk mitigationcharacteristicsInsurance provider −1.173∗∗∗ 0.051 0.041 0.444Insurance cover 0.072∗∗∗ 0.007 0.006∗∗∗ 0.002Insurance cover-squared
−0.0006∗∗∗ 0.00006
Insurance cover x DaiLoc district
0.012∗∗∗ 0.002
Insurance premium −0.00009∗∗∗ 0.000005
Model summary statisticsSigma error component 0.829∗∗∗ 0.120Log likelihood −2463.875Pseudo R-square 0.145N 2,622
Notes: Significance levels: ∗10%, ∗∗5%, ∗∗∗1%, respectively.
structure of the choice experiment. Panel data refer to the fact that wehave multiple choice observations from each individual since each respon-dent answered a sequence of choice tasks in the choice experiment. Theestimated choice model controlled for possible correlation between theobserved choices across choice tasks. For efficiency purposes, the modelwas furthermore estimated using a Halton sequence of 100 replicationsin a quasi-Monte Carlo maximum likelihood simulation (Bhat, 2001). Inour search for the statistically best fit model, we systematically includedinteraction terms between the attributes in our experimental design anddummy variables for respondents living in the three different districts.Only one of these interaction terms appeared to be statistically significant,namely for insurance cover in the upstream district Dai Loc (correspond-ing with our test results in section 5.2). The estimated best fit model ispresented in table 5.
The model is highly significant (outcome of the χ2 is 833.374 with 17degrees of freedom) with a pseudo R2 of around 15 per cent. The outcome

Environment and Development Economics 243
for the error component is significant at the 1 per cent level and indicatesthat respondents evaluated the two hypothetical alternatives distinctlydifferent from the existing situation (e.g., Scarpa et al., 2005). The signifi-cant positive outcome of the alternative specific constant (ASC) suggeststhat respondents prefer a change instead of no change from the currentsituation.
Preference heterogeneity is accounted for by randomizing the choiceattributes across respondents. Different distributional assumptions weretested. A normal distribution produced the statistically best fit for thecontinuous design variables, while a uniform distribution was used forthe dummy variable representing the insurance provider (see Hensheret al., 2005 for guidelines on the appropriate choice of distribution).However, this latter random parameter appeared not to be statisticallysignificant at the 10 per cent level. Once control is included for theserandom effects, no additional significant effects could be detected forany of the other socio-demographic and risk characteristics discussed insection 5.1.
All attribute parameters are statistically significant and have theexpected signs. Respondents dislike higher flood return periods, mortal-ity risks and longer social disruption. A higher return period results ceterisparibus in a lower probability of an alternative being chosen. The sameapplies to a higher mortality risk and longer lasting social disruption. Aninteresting finding is that both the utility attached to catastrophic floodprobability and the probability of dying are non-linear. Their quadraticterms are highly significant. As a consequence, reducing their probabilityresults in deceasing returns. The marginal values are hence not constant,but a function of their levels. This is shown in figures 1a and 1b. MarginalWTP values are negative because the alternatives in the choice experimentrepresent increases in catastrophic flood probabilities and mortality risks,resulting in disutilities.
Especially in the case of mortality risk, the slope of the curve becomesincreasingly steep at higher probabilities of dying, reflecting a higher WTPto avoid increasing mortality risk, but less than proportionally (and hencea lower VSL). Increments in catastrophic flood probabilities from currentbaseline levels are valued significantly less (and are in the case of mortalityrisk even positive). Turning points reflecting saturation levels are locatedat the lower end of the value domain used in the choice experiment: onceevery 92 years in the case of catastrophic flood probability and one in every7,040 people in the case of mortality risk. WTP is VND 15 (US$0.001) perhousehold per year when reducing the probability of dying from one in7,000 persons to one in 8,000 persons per catastrophic flood event, andVND 3,193 ($0.17) per household per year when reducing the probabilityof dying from one in 1,000 persons to one in 2,000 persons.
Turning to the insurance design characteristics, respondents have astrong preference for a government-supplied flood insurance (the dummyvariable for insurance provider has the value 1 if the provider is a privateinsurance company). As expected, a higher insurance premium results in alower likelihood that an alternative is chosen. For insurance cover, both asignificant linear and quadratic effect is found, indicating that this variable

244 Roy Brouwer et al.
Figure 1. (a) WTP for different catastrophic flood probabilities, (b) WTP for differentmortality risks, (c) WTP for different insurance covers in the three districts and Dai Loc
has a saturation level too: VND 61.2 million (US$ 3,314) in the case of allthree districts together and VND 71.5 million (US$ 3,872) for the districtDai Loc. These saturation levels are more than 10 times the average flooddamage reported by households during the last catastrophic flood in 2007(see table 2), suggesting a strong risk aversion. The loss functions for allthree districts together and Dai Loc are presented in figure 1c.
As expected, WTP for flood losses in figure 1c is, ceteris paribus, signif-icantly lower in the upstream district Dai Loc compared to Dien Ban and

Environment and Development Economics 245
Hoi An. Marginal WTP increases most when moving across the lower lev-els of flood damage. Across all three districts, household WTP is VND 685(US$0.04) per year for the first VND 10 million (US$540) damage sufferedas a result of a catastrophic flood. This increases more than proportion-ally to VND 5,506 (US$0.3) per year if the damage cover increases fromVND 10 to 20 million. The increase in marginal WTP then displays dimin-ishing returns from VND 4,170 (US$ 0.23) to VND 160 (US$0.009) per yearif the indemnity cover increases from VND 20 to 30 and ultimately from50 to 60 million per catastrophic flood event, respectively. After the turn-ing point marginal WTP is still positive, but decreases as insurance coverincreases further.
6. Discussion and conclusionsDiscrete choice modeling has become increasingly popular in the economicvaluation domain. However, almost no applications exist related to climatechange and flood risks. This study contributes to the existing literature in anumber of ways. From a practical policy point of view, we show that thereexists substantial demand for flood insurance, even though a considerableshare of the sample population indicate that they are unable to afford topay for such insurance. After excluding these respondents from furtheranalysis, we find no significant effect of household income any more onrespondent choice behavior. Of all insurance design characteristics, onlythe insurance sum is characterized by significant preference heterogeneity.Respondents seem risk averse as they like higher insurance cover, prefer-ably provided by the government, not a private insurance company. How-ever, demand for catastrophic flood insurance has a ceiling. Respondentsdo not wish to insure more than 15 times their self-reported flood damagesuffered during the last catastrophic flood in the case study area. More-over, demand is spatially differentiated and is significantly lower upstreamwhere flood risks are lower than downstream where risks are higher.
The validity of our results is strengthened by the fact that we convinc-ingly manage to embed mortality risks in a clear and understandable wayin the context of catastrophic flood probabilities. Although WTP to insureoneself against the occurrence of catastrophic floods and the probabilityof dying due to a catastrophic flood are not directly comparable (they aremeasured in different units), the relative increase in WTP for flood insur-ance is higher for an increase in catastrophic flood probability than for thesame relative increase in mortality risk compared to current baseline con-ditions. The increase in WTP for flood insurance is non-linear in increasingflood probabilities and mortality risks, and characterized by significantpreference heterogeneity. The former means that catastrophic flood riskvaluation and the derived VSL exhibit decreasing returns in the level ofthe risk reduction. The latter confirms that the WTP welfare measure isnot universally transferable. Risk perception and perspectives differ amongindividuals in the same situation, therefore leading to different decisionsrelated to the purchase of catastrophic flood insurance.
In view of the fact that most respondents are unfamiliar with the con-cept of flood insurance, some degree of learning was expected to influence

246 Roy Brouwer et al.
their decisions during the choice experiment. This was confirmed whencomparing the preference parameters of the estimated choice model acrossthe choice sequence. Although 80 per cent of the sample population passedthe choice consistency test when presented with the same choice task at thebeginning and the end of the experiment, preference parameters appearedto be significantly different and hence unstable during the choice sequence.However, choices in the final choice task were more stable than choices inthe first choice task as measured through the lower error variance. Pref-erence uncertainty is usually characterized by larger variance. From theresponses of those who consistently chose the opt-out in the choice exper-iment, including those who protested, some indication was found thatdecision making in the choice experiment was not easy. Six per cent of thesample asked for more information before they felt capable of making adecision whether or not to buy flood insurance, while another 8 per centsaid they needed more time to think. Future research in this area wouldbenefit from a more detailed assessment of the relationship between choicecomplexity and preference stability.
ReferencesAkter, S., R. Brouwer, P. van Beukering, E. Silver, L. French, S. Choudhury, and S.
Aziz (2011), ‘Exploring the feasibility of private micro flood insurance provisionin Bangladesh’, Disasters 35(2): 287–307.
Alberini, A. and A. Chiabai (2007), ‘Urban environmental health and sensitive pop-ulations: how much are the Italians willing to pay to reduce their risks?’, RegionalScience and Urban Economics 37(2): 239–258.
Bateman, I.J., R. Brouwer, N. Hanley, S. Georgiou, M. Machado, S. Mourato, andC. Saunders (2005), ‘A “natural experiment” approach to contingent valuationof private and public UV health risk reduction strategies in low and high riskcountries’, Environmental and Resource Economics 31: 47–72.
Bhat, C.R. (2001), ‘Quasi-random maximum simulated likelihood estimation of themixed multinomial logit model’, Transportation Research Part B 35: 677–693.
Botzen, W.J.W. and J.C.J.M. van den Bergh (2008), ‘Insurance against climate changeand flooding in The Netherlands: present, future and comparison with othercountries’, Risk Analysis 28(2): 413–426.
Botzen, W.J.W. and J.C.J.M. van den Bergh (2012), ‘Monetary valuation of insur-ance against flood risk under climate change’, International Economic Review 53(3):1005–1025.
Brouwer, R. and S. Akter (2010), ‘Informing micro insurance contract design to mit-igate climate change catastrophe risks using choice experiments’, EnvironmentalHazards 9: 74–88.
Brouwer, R. and M. Schaafsma (2013), ‘Modelling risk adaptation and mitigationbehaviour under different climate change scenarios’, Climatic Change 117: 11–29.
Brouwer, R., S. Akter, L. Brander, and E. Haque (2009), ‘Economic valuation offlood risk exposure and flood risk reduction in a severely flood prone developingcountry’, Environment and Development Economics 14(3): 397–417.
Brouwer, R., T. Dekker, J. Rolfe, and J. Windle (2010), ‘Choice certainty and con-sistency in repeated choice experiments’, Environmental and Resource Economics46(1): 93–109.
Brown, T.C., D. Kingsley, G.L. Peterson, N.E. Flores, A. Clarke, and A. Birjulin(2008), ‘Reliability of individual valuations of public and private goods: choice

Environment and Development Economics 247
consistency, response time, and preference refinement’, Journal of Public Economics92: 1595–1606.
Browne, M.J. and R.E. Hoyt (2000), ‘The demand for flood insurance: empiricalevidence’, Journal of Risk and Uncertainty 20(3): 291–306.
Dekker, T., R. Brouwer, M. Hofkes, and K. Moeltner (2011), ‘The effect of risk con-text on the value of a statistical life: a Bayesian meta-model’, Environmental andResource Economics 49(4): 597–624.
DeShazo, J.R. and G. Fermo (2002), ‘Designing choice sets for stated preferencemethods: the effects of complexity on choice consistency’, Journal of EnvironmentalEconomics and Management 44: 123–143.
Do, T.N. and J. Bennett (2008), ‘Estimating wetland biodiversity values: a choicemodelling application in Vietnam’s Mekong River Delta’, Environment and Devel-opment Economics 14: 163–186.
Eeckhoudt, L.R. and J.K. Hammitt (2001), ‘Background risks and the value of astatistical life’, Journal of Risk and Uncertainty 23(3): 261–279.
GSO (2008), General Statistics Office of Vietnam Statistical Handbook 2008, Hanoi:Statistical Publishing House, [Available at] http://www.gso.gov.vn.
Hanley, N., S. Mourato, and R.E. Wright (2001), ‘Choice modelling approaches: asuperior alternative for environmental valuation?’, Journal of Economic Surveys15(3): 435–462.
Hazell, P.B.R. (1992), ‘The appropriate role of agricultural insurance in developingcountries’, Journal of International Development 4: 567–581.
Hazell, P.B.R. (2001), ‘Potential role for insurance in managing catastrophic riskin developing countries’, Occasional Paper, International Food Policy ResearchInstitute, Washington, DC.
Hensher, D.A., J.M. Rose, and W.H. Greene (2005), Applied Choice Analysis. A Primer,Cambridge: Cambridge University Press.
Hynes, S., N. Hanley, and R. Scarpa (2008), ‘Effects on welfare measures of alter-native means of accounting for preference heterogeneity in recreational demandmodels’, American Journal of Agricultural Economics 90(4): 1011–1027.
IPCC (2007), Climate Change 2007: Impacts, Adaptation and Vulnerability, Cambridge:Cambridge University Press.
Kleindorfer, P. and H. Kunreuther (1999), ‘The complimentary roles of mitigationand insurance in managing catastrophic risks’, Risk Analysis 19: 727–738.
Kunreuther, H. (1996), ‘Mitigating disaster losses through insurance’, Journal of Riskand Uncertainty 12: 171–187.
Kunreuther, H. (2006), ‘Disaster mitigation and insurance: learning from Katrina’,Annals of the American Academy of Political and Social Science 604: 208–227.
Kunreuther, H.C., E.O. Michel-Kerjan, N.A. Doherty, M.F. Grace, R.W. Klein, andM.V. Pauly (2009), At War with the Weather: Managing Large-Scale Risks in a NewEra of Catastrophes, Cambridge, MA: MIT Press.
Lindhjem, H., S. Navrud, N.A. Braathen, and V. Biausque (2011), ‘Valuing livessaved from environment, transport and health policies. A meta analysis’, RiskAnalysis 31(9): 1381–1407.
Louviere, J.J., D.A. Hensher, and J.D. Swait (2000), Stated Choice Methods: Analysisand Application, Cambridge: Cambridge University Press.
Michel-Kerjan, E. and C. Kousky (2010), ‘Come rain or shine: evidence on floodinsurance purchases in Florida’, Journal of Risk and Insurance 77: 369–397.
MOLISA (2009), Information about the poverty line, Ministry of Labour, Invalidsand Social Affairs, [Available at] http://www.unescap.org/pdd/projects/povmap/11b-Vietnam%20poverty%20mapping.doc.
Quang Nam People Committee (2008), Annual Report on Disasters in 2007 andPlanning for Disaster Prevention in 2008, Tam Ky Town, Vietnam.

248 Roy Brouwer et al.
Scarpa, R., S. Ferrini, and K. Willis (2005), ‘Performance of error component mod-els for status-quo effects in choice experiments’, in R. Scarpa and A. Alberini(eds), Applications in Simulation Methods in Environmental and Resource Economics,Dordrecht: Springer, pp. 247–273.
Shaikh, S.L., L. Sun, and G.C. van Kooten (2007), ‘Treating respondent uncertainty incontingent valuation: a comparison of empirical treatments’, Ecological Economics62: 115–125.
Shogren, J. and T. Crocker (1991), ‘Risk, self-protection, and ex ante valuation’,Journal of Environmental Economics and Management 20: 1–15.
SRV (2007), National Strategy for Natural Disaster Prevention, Response and Mitigationto 2020, Hanoi: Socialist Republic of Vietnam.
Swait, J. and J. Louviere (1993), ‘The role of the scale parameter in the estimationand comparison of multinomial logit models’, Journal of Marketing Research 30(3):305–314.
Train, K. (2003), Discrete Choice Methods with Simulation, Cambridge: CambridgeUniversity Press.
Tversky A. and D. Kahneman (1979), ‘Prospect theory: an analysis of decision underrisk’, Econometrica 47: 263–291.
Vandeveer, M.L. (2001), ‘Demand for area crop insurance among litchi producers innorthern Vietnam’, Agricultural Economics 26: 173–184.
Appendix A: Introduction choice experimentI’d like to inform you about the possibility of extreme flood events occur-ring in the future. In the future the frequency of extreme flood events likethe one in 2007 is expected to increase due to climate change. Also thedamage associated with these events is expected to increase due to popula-tion growth and economic development. In order to anticipate these futureflood risks, we would like to ask you to consider a number of descriptionsof possible future situations and measures to mitigate the negative impactsof the increasing risks of flooding. We are interested to find out which ofthese measures you prefer given the expected future situation. All we askyou to do is to look at the presented situation and tell us which situationyou prefer best given the expected increase in flood risk and the proposedmeasures to mitigate these risks. I will present you with an example cardfirst to explain to you what the situations represent. Following this exam-ple card, I will show you nine more of these cards and for each of thesecards you will be asked to indicate which situation you prefer most.
In each future situation the frequency of extreme flood events is expectedto change, from currently once every 100 years to once every 10 years.The chance that someone will die as a result of the extreme flood eventranges between one in ten thousand people to one in one thousand peo-ple. This means that if an extreme flood event occurs, one in ten thousandor one in one thousand persons, including you and your family members,faces the risk of dying. The length of the social disruption during the after-math of the extreme flood event, such as lack of electricity and clean watermay vary between one and eight weeks.
In order to deal with these increased flood risks in the future, aninsurance scheme is proposed in your region to mitigate the financial con-sequences of extreme flood events. The insurance will cover your financial
Environment and Development Economics 249
damage costs as a result of future extreme flood events like the one in 2007.Having an insurance hence reduces the financial burden your family facesshould an extreme flood event occur. You are free to choose the sum ofmoney for which you wish to insure yourself and your family, ranging from25 to 100 million VND per extreme flood event. This latter sum of moneyis the maximum amount of compensation you are entitled to in case yousuffer any damage due to a flood.
You also have the option to choose from whom you wish to buy theinsurance. The insurance will be either provided by the central governmentor a private insurance company. The standard insurance policy on offerincludes home insurance to cover any damage to your family home, cropinsurance to cover any damage to your crops, and a life insurance in caseyou or one of your family members die as a result of catastrophic flooding.
In order to obtain the insurance, your household will either have to payevery month a fixed insurance premium to the private insurance companyor an extra earmarked tax to the central government. The premium amountor earmarked tax is the same; the only difference is that the insurance is aprivate one if concluded with the private insurance company, and a publicone if concluded with the central government. The prices of the standardinsurance policy vary between 2,500 and 20,000 VND per household permonth.
The insurance policy applies to catastrophic flooding only. This meansthat a flood event has to be categorized officially as catastrophic by anindependent assessor. Also the damage claim after the catastrophe andthe indemnity paid will be evaluated and estimated by an independentassessor. The terms and conditions of your insurance are protected by law.
Appendix B: Example of a choice card