Modeling and Simulation for Mission Operations Work … (Sierhuis).pdf · Modeling and Simulation...
79
Modeling and Simulation for Mission Operations Work System Design Maarten Sierhuis 1 , William J. Clancey 2 , Chin Seah 3 , Jay P. Trimble 4 , Michael H. Sims 4 RIACS/USRA 1 IHMC/University of West Florida 2 SAIC 3 Computational Sciences Division 1,2,3,4 NASA/Ames Research Center Moffett Field, CA 94035 {msierhuis, bclancey,cseah, trtimble, msims}@mail.arc.nasa.gov Point of Contact Maarten Sierhuis USRA/RIACS NASA/Ames Research Center M/S T35B-1 Moffett Field, CA USA (650) 604-4917 FAX (650) 962-7772 [email protected] 1 Accepted for publication in the Journal of Management Information Systems (in Press) Funding for this research was provided by the National Aeronautics and Space Administration through the Cross- Enterprises and the Information Systems program
Transcript of Modeling and Simulation for Mission Operations Work … (Sierhuis).pdf · Modeling and Simulation...

Modeling and Simulation for Mission Operations Work System Design
Maarten Sierhuis1, William J. Clancey2, Chin Seah3, Jay P. Trimble4, Michael H. Sims4
RIACS/USRA1 IHMC/University of West Florida2
SAIC3 Computational Sciences Division1,2,3,4
NASA/Ames Research Center Moffett Field, CA 94035
msierhuis, bclancey,cseah, trtimble, [email protected]
Point of Contact
Maarten Sierhuis USRA/RIACS
NASA/Ames Research Center M/S T35B-1
Moffett Field, CA USA
(650) 604-4917 FAX (650) 962-7772
1 Accepted for publication in the Journal of Management Information Systems (in Press) Funding for this research was provided by the National Aeronautics and Space Administration through the Cross-Enterprises and the Information Systems program

Modeling and Simulation for Mission Operations Work System Design
Maarten Sierhuis1, William J. Clancey2, Chin Seah3, Jay P. Trimble4, Michael H. Sims4
RIACS/USRA1 IHMC/University of West Florida2
SAIC3 Computational Sciences Division1,2,3,4
NASA/Ames Research Center Moffett Field, CA 94035
msierhuis, bclancey, cseah, jtrimble, [email protected]
ABSTRACT
Work system analysis and design is complex and non-deterministic. In this paper we describe Brahms, a
multiagent modeling and simulation environment for designing complex interactions in human-machine
systems. Brahms was originally conceived as a business process design tool that simulates work practices,
including social systems of work. We describe our modeling and simulation method for mission operations
work systems design, based on a research case study in which we used Brahms to design mission
operations for a proposed discovery mission to the Moon. We then describe the results of an actual method
application project—the Brahms Mars Exploration Rover. Space mission operations are similar to
operations of traditional organizations; we show that the application of Brahms for space mission
operations design is relevant and transferable to other types of business processes in organizations.
Keywords: business process modeling, multiagent simulation, agent language, work practice, mission
operations design.
Introduction Work systems involve people, machines, tools, documents, and facilities
interacting in activities over time. These activities produce goods, services or—as is the
case in the work system described in this paper—scientific data. Many work systems we
1 Accepted for publication in the Journal of Management Information Systems (in Press) Funding for this research was provided by the National Aeronautics and Space Administration through the Cross-Enterprises and the Information Systems program
encounter everyday have existed over a long period of time. Improvement of such work
systems is often done through business process analysis and reengineering [7, 8, 13]. But
managers must also design work systems de novo.
One of the challenges of work system design is that work systems are often large
and complex and persist over a long period of time. This makes the design process
complex and non-deterministic. In this paper we describe Brahms, a multiagent modeling
and simulation environment for designing complex interactions in human-machine
systems.
Brahms was originally conceived of as a business process modeling and
simulation tool that incorporates the social systems of work, by illuminating how formal
process flow descriptions relate to people’s actual located activities in the workplace. Our
research started in the early nineties as a reaction to experiences with work process
modeling and simulation in the T1-order process redesign project at the NYNEX
corporation [20]. Although an effective tool for convincing management of the potential
cost-savings of the newly designed T1-order process, the modeling and simulation
environment NYNEX used (Sparks™ from Coopers & Lybrand) was only able to
describe work as a normative workflow. However, the social systems, uncovered in work
practices studied by the T1 design team, played a significant role in how work actually
got done in NYNEX organizations. Multi-tasking, informal assistance and circumstantial
work interactions could not easily be represented in a tool with a strict workflow
modeling structure. In response, we began to develop a tool that would have the benefits
of work process modeling and simulation, but be distinctively able to represent the
relations of people, locations, systems, artifacts, communication and information content
2

[5]. In Brahms, we model work processes at the work practice level. We describe our
modeling and simulation method for mission operations work system design, based on a
research case study in which we used Brahms to design mission operations for a proposed
discovery mission to the Moon—the Victoria Mission. We then describe the results of an
actual method application project; the Brahms Mars Exploration Rover (MER) model of
the design of the mission operations work system of the MER robotic mission to Mars
scheduled to be launched in 2003 [6, 11].
Mission operations systems for space missions (robot and human) are comprised
of a complex network of human organizations, information and deep-space network
systems and spacecraft hardware. From the point of view of the MIS community, one of
the problems in mission operations design is how mission information systems are related
to work practices. From this perspective, space mission operations are similar to the
operations of organizations that traditionally are the domain of MIS research. The
application of Brahms for space mission operations design is relevant and, as we discuss
in the conclusions section, transferable to other types of business processes.
Work Practice The concept of work practice originates in the research disciplines of socio-
technical systems, business anthropology, and management science. Work systems
design, as presented here, has its roots in the design of socio-technical systems. This
method was developed in the 1950s by Eric Trist and Fred Emery [10, 19] to understand
and leverage the advantages of the social and technical aspects of work. Work systems
design extends this tradition, focusing on both the informal and formal features of work
and applying ethnography and participant observation [3, 9, 12, 25] [29 , chapter 16].
3

Work practice is defined as the collective activities of a group of people who
collaborate and communicate, while performing these activities synchronously or
asynchronously. Very often, people view work merely as the process of transforming
input to output, which is a Tayloristic view. Sometimes, for example when processing a
customer order, the input and output of the work is necessarily well defined. But often it
is more difficult to describe human interaction. Consider a group of scientists on a
discovery mission. Exploration involves physical search of a landscape, pursuing broad
scientific questions, not processing or searching for preformulated data, as in office work.
To describe scientific work, we must consider how instruments (often remotely
controlled) create data sets, and how distributed teams collaboratively construct
meaningful information.
Work practice includes how people behave in specific situations, at specific
moments in the real world. To describe people’s circumstantial behavior we need to
include ecological (environmental) influences on individual activity (not only problem-
solving behavior), such as collaboration, “off-task” behaviors, multi-tasking, interrupted
and resumed activities, informal interaction, use of tools, and movements [5, 23].
Brahms is a modeling and simulation environment for representing work practice
using a multiagent rule-based activity language; models are simulated using the Brahms
engine. This paper discusses how we are using Brahms to design the work system for
mission operations of robotic space missions to the Moon and Mars. The attentive reader
might question how we can design a work practice? Indeed, a work practice is not
designed, but it emerges over time. The question is; can a model at the work practice
level be useful for the design of mission operations? We hypothesize that the detailed,
4

holistic representation of work will be especially useful for revealing problems of
workflow and timing that a more abstract representation of work would take for granted
[1, 2, 5, 24].
Brahms Language Brahms has a multiagent language for describing agents and/or objects
performing activities. We will briefly explain the modeling concepts of the language. For
a more detailed description of the language see Sierhuis [23] and van Hoof & Sierhuis
[27]. Brahms models are not necessarily as detailed as models of cognitive problem
solving (though a modeler could choose to do this), nor are they as general as functional
models of business processes (see Figure 1).
[FIGURE 1 HERE]
Brahms models describe a work process at the work practice level. The language
embodies assumptions about how to describe social situations, workplaces and work
practice.
Agents and Groups Agents can represent individuals, a group of individuals or model-based systems,
such as “software agents.” Agents can belong to multiple groups (multiple group
inheritance), such that individual behaviors are blends of different norms, belief systems,
roles, etc.
For example, in the domain of missions operations we can represent the science
operations team as a single Brahms agent with the team’s behavior represented by the
agent’s “individual” behavior. The science operation team is actually part of a larger
group called the science team. We can represent the science team as a Brahms group with
5

more “general” behavior. By specifying that the science operations team agent is a
member of the science team group, the agent will have a combined behavioral spectrum
of its individual behavior plus the inherited more general science team behavior. The
definition of agents and groups is completely under control of the modeler and thus the
level at which we model agents is model-specific. We could easily represent agent “Joe”
and “Joanne” as individual agents and members of the science operations team group,
which in turn could be represented as a Brahms group. In such a model we represent
individual team members, which require more detail.
Objects and Classes Objects are representations of artifacts in the world or data objects created by
information processing, etc. Unlike agents, objects do not behave based on their
representations of the world (beliefs), but instead are directly affected by the actual world
state (see Beliefs and Facts section). Objects can be generalized into class-hierarchies.
For example, staying with the mission operations domain we can represent the
actual information flow of the ground-based work process by modeling the mission
operation software systems, as well as the client-computers that the science teams use for
accessing these systems. Brahms allows modeling of object-behavior in a similar way as
modeling agent-behavior (see Activities section). Using objects we can model
information processing behavior of software systems, as well as the human-machine
interaction between (human) agents (e.g. the science teams) and the client-computers
through which they are accessing the software. In general, intelligent agents that act
based on their mental state are represented as Brahms agents, while purely reactive
systems and data objects are most often represented as Brahms objects.
6

Beliefs and Facts Brahms agents and objects represent the world state internally as propositions
called beliefs [14, 18]. For example, agent John believes that his car is the color green.
Perhaps Mary believes that John's car is blue. Facts are actual world states, and are global
in the simulation world. For example, perhaps the world fact states that John's car is
white.
Agent and object beliefs and world facts are the ingredients of a Brahms model
that make agents and objects behave over time, when the model is executed in a
simulation run. During a simulation every agent and object has a belief set that can be
changed by different events: communication, fact detection, reasoning, and activity
performance. Similar to Belief-Desire-Intention (BDI) agent architectures, beliefs can
represent an agent’s beliefs about the world, desires, intentions and goals. Updates in an
agent’s belief set are evaluated by the agent’s reasoning and work-selection engine and
affect an agent’s reasoning state and actions [30]. Object beliefs, on the other hand, are
not representing a mental state of objects, but rather are a representation of data and/or
information processing state. Updates in an object’s belief set are evaluated by the
object’s reasoning engine, representing an object’s information processing capability.
Facts are global to the simulated world, though as in the real world they are only
perceivable locally. As shown in Figure 2, in Brahms there is a separation between the
belief set of an individual agent or object and the fact set of the world being simulated
(i.e. the world state).
[FIGURE 2 HERE]
The purpose is to give the modeler the ability to include each agent/object’s
“interpretation” of the state of the world. Brahms agents interpret facts in the world by a
7

situated fact-detection mechanism (i.e. “detectables”), through which agents can
internalize world facts as beliefs. Consequently, these new beliefs allow an agent to act
(i.e. perform activities; see Activities section). Comparatively, objects are reactive
because their actions are based directly on world facts.
For a more complete description of how the complex agent/object’s reasoning
engine works see chapter 4 in [23].
Activities Every agent or object behavior is represented as an activity. A problem-solving
task is a kind of activity, but there are many other activities of different character. For
example, reading e-mail, answering the phone, having lunch, browsing on the web are
activities, but not usually defined as functions (tasks) and may or may not pose problems
during a person’s performance [4]. An agent’s situation-dependent behavior is therefore
modeled using activities.
Brahms has an activity-based subsumption architecture by which an agent's
activities can be decomposed into subactivities (see Figure 3). An agent engaged in a
low-level activity is still performing the “higher level” activities on the activation path of
the activity tree (e.g., answering the telephone during a meeting). Activities can be
interrupted and resumed, just as humans can multi-task by switching between different
activities. Activities always take time, even a “do nothing” activity. An example of a
long-term composite activity, from the Victoria model, is searching for water ice in a
permanently dark crater. While in this activity, a subactivity is drilling in the lunar
surface. A parent activity above the long-term activity is being on a science mission on
the South Pole of the Moon.
8

Activities are modeler-defined elements. Indeed, a Brahms model is the Brahms
modeler’s interpretation of people’s activities in practice (hence the notion of modeling
work practice). The Brahms language allows for user-defined primitive and composite
activities describing an agent’s behavior. There are a number of pre-defined primitive
activity types with pre-defined semantics, such as communicate, move, create-
object/agent/area, and get and put. Activities may also be written in the Java
programming language.
Primitive activities take time, which may be specified by the modeler as a definite
quantity or a random quantity within a range. Activity duration can also be parameterized
with an agent’s belief (e.g. the agent believes a particular meeting will take an hour,
which is passed as a parameter at the start of the meeting activity). However, because
workframes (see section) can be interrupted and never resumed, when an
activity will finish cannot be predicted from its start time. Primitive activities are atomic
behaviors that are not decomposed. Whether something is modeled as a primitive activity
is a decision made by the modeler. A primitive activity also has a priority that is used for
determining the priority of workframes. An example of a primitive activity in Brahms
source code is1:
Workframes
primitive-activity work-on(Order order)
display: “Working on an order”; \\ a display name
priority: 10; \\ a relative priority
1 The Brahms modeler does not have to write Brahms source code. The Brahms Interactive Development
Environment, developed in Java, provides a graphical interface for model development, Brahms source
code generation, editing and compilation.
9

random: true; \\ the duration is between min and max duration
min_duration: 3600 \\ in seconds
max_duration: 10800 \\ in seconds
resources: order, OrderSystem; \\ resource objects needed
This activity specifies an agent working on a specific order (given by the
parameter order) between one and three hours. It also specifies that besides needing the
order to work on the agent also needs to use the order system as a resource. If we were
interested in more detail about how the agent performs this activity, we could easily
decompose the activity into a composite activity describing how the agent actually works
on the order.
For a more detailed description of primitive and composite activities and how
they are executed see chapter 4 in [23].
Workframes An agent cannot always carry out all activities that are possible, given the agent’s
cognitive state and location. Each activity is therefore associated with a conditional
statement or constraint, representing a condition/activity pair, most of the time referred to
as a rule [22] [30] [17]. If the conditions of a rule are believed by the agent then the
associated activities are performed. In Brahms, such rules are called workframes.
Workframes are situation-action rules derived from production rules, but because they
execute activities, they take time. A workframe precondition tests a belief held by the
agent. An example of a workframe for an agent working on customer orders is:
10
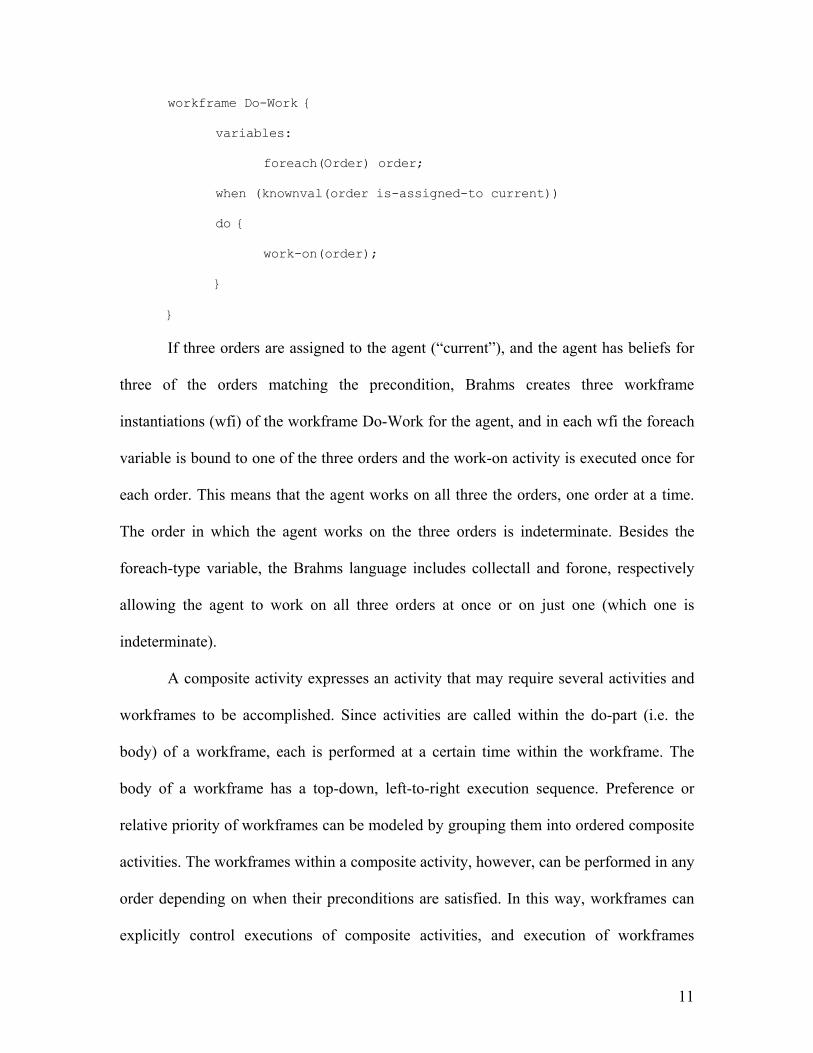
workframe Do-Work
variables:
foreach(Order) order;
when (knownval(order is-assigned-to current))
do
work-on(order);
If three orders are assigned to the agent (“current”), and the agent has beliefs for
three of the orders matching the precondition, Brahms creates three workframe
instantiations (wfi) of the workframe Do-Work for the agent, and in each wfi the foreach
variable is bound to one of the three orders and the work-on activity is executed once for
each order. This means that the agent works on all three the orders, one order at a time.
The order in which the agent works on the three orders is indeterminate. Besides the
foreach-type variable, the Brahms language includes collectall and forone, respectively
allowing the agent to work on all three orders at once or on just one (which one is
indeterminate).
A composite activity expresses an activity that may require several activities and
workframes to be accomplished. Since activities are called within the do-part (i.e. the
body) of a workframe, each is performed at a certain time within the workframe. The
body of a workframe has a top-down, left-to-right execution sequence. Preference or
relative priority of workframes can be modeled by grouping them into ordered composite
activities. The workframes within a composite activity, however, can be performed in any
order depending on when their preconditions are satisfied. In this way, workframes can
explicitly control executions of composite activities, and execution of workframes
11

depends not on their order, but on the satisfiability of their preconditions and the
priorities of their activities (see Figure 3).
[FIGURE 3 HERE]
For a more detailed description of workframes and how they are executed see
[23].
Geography Where people and things are located affects group performance. For example, the
design of the MER mission operation building at JPL affects how long it takes from
people to move from their individual offices to the conference room on the second floor,
where most of the important meetings are held. Time to move to another area is but one
of the factors that influences how things get done. Other location-dependent factors
include co-location or distribution of people and artifacts, and use of communication
tools,
Indeed, the fact that we cannot ignore the influence of location in our real world
activities is one of the reasons conventional workflow models do not represent work
practice. The geography model in Brahms represents where activities occur; hence we
speak of located behaviors. Agents and objects are located in areas and can move from
area to area by performing a move activity. Agents and objects can also carry other
agents and objects using the get- and put activities.
The Brahms language allows for the representation of types of user-defined
locations (called area definitions), such as buildings, rooms, and offices, but also
locations on planets such as craters. Area definitions can be represented hierarchically in
a inheritance (is-a) hierarchy. Areas are specific location instances of area definitions. We
12

can represent a complex hierarchical geography by making areas be part of other areas
(using the part-of relationship). Thus we can represent a building with floors and rooms
using the part-of relation between the areas. For example, the Floor-1 area can be part of
Building-1 area, and Room-1 area can be part of Floor-1. Then, when an agent is located
in Room-1 the agent is also located in Floor-1, as well as in Building-1.
Communications Communication is a special type of activity. When an agent or object
communicates, it either sends or receives beliefs from other agents or objects. In Brahms,
we are specifically interested in what triggers an activity; often it is a communication. We
also model the communication tools as located objects (e.g., telephones, pagers), which
are part of a work practice. For example, in both the Victoria and the MER model we
model the communication delays to the Moon and Mars respectively, as well as the
computer systems used to access and add data to the critical mission operations systems.
Human to human communication is modeled as co-located face-to-face communication
(which means that the agents have to be in the same location to communicate), phone
conversations or e-mail.
Next, we present the Victoria model and simulation outcome.
Mission Operations Work System Design The work involved in robotic space missions is distributed over a number of
human teams and one or more robots. During a mission, teams of scientists, spacecraft
engineers, computer scientists and roboticists work together twenty-four hours per day in
a dedicated work environment. The team of scientists, headed by the principal
investigator (PI), is responsible for deciding what science activity the robot needs to
13
perform. Based on the science objectives for a next command cycle, teams of engineers
decide on the actual command sequence to be “uplinked” to the robot. After the robot
receives the uploaded command sequences it executes the commands. At this time the
ground-based teams are monitoring the health and returned science data from the robot.
Different teams of engineers transform the “downlink” science data into human-readable
form. This can be in the form of three-dimensional surface images taken by stereographic
cameras, or particular scientific instrument readings from the science “payload” onboard
the robot. After the returned science data has been converted and the health of the robot
confirmed, the science team performs the next cycle of science decision-making, based
on the downlink data. Thus, the uplink cycle starts over again.
The science team is a user of the rover, from the perspective that the rover is on
the planetary surface being controlled by the Earth-based science team. But by virtue of
being people’s arms and eyes on the surface, and by having “autonomous” capability to
carry out commands, the rover is more of an assistant than a simple tool. In particular,
the work can be viewed as distributed between people and robot, and we can ask: who is
doing what, where, when, and how?
The Victoria Lunar Mission Victoria is the name of a proposed long-term semi-autonomous robotic mission to
the South Pole region of the Moon. The primary mission objective of Victoria is to verify
the presence of water ice and other volatiles within permanently shadowed regions on the
Moon. This will be accomplished by gathering the necessary lunar data for analyzing the
history of water and other volatiles on the Moon, and by implication in the inner solar
system. The Victoria team has decided to use a high-speed semi-autonomous rover.
14
One of the dominating constraints in any robotic mission is power consumption.
In every activity the rover uses energy, therefore the sequence of activities for the rover is
constrained by the amount of power available to complete the sequence. When the robot's
batteries are low, it needs to return to a sun-exposed spot to recharge its batteries. During
the Victoria mission the rover will traverse into permanently dark regions on the Moon.
During these traverses the rover will use its neutron detector instrument to detect
hydrogen and the Sample Acquisition and Transfer Mechanism (SATM) to drill into the
lunar surface and take surface samples to be investigated using an array of science
instruments.
A basic work system design problem is to configure the mission operations so the
robot’s activities inside the permanent dark region are most efficient (i.e. consume the
least amount of energy, in order to spend as much time collecting science data).
[FIGURE 4 HERE]
Victoria Mission Operations Work System Figure 4 represents the work system elements and their relative location during
the Victoria mission. The Science Team consists of co-located sub-teams: the Science
Operations Team (SOT), the Instrument Synergy Team (IST), and the Data Analysis and
Interpretation Team (DAIT). There are two other supporting teams: The Data and
Downlink Team (DDT) and the Vehicle and Spacecraft Operations Team (VSOT). The
teams communicate with the Victoria rover on the lunar surface using the Universal
Space Network (USN), directly and via a lunar orbiter. The flow of data from the rover
will be dominated by contextual data and science data. This data will come to
NASA/Ames via the Universal Space Network (USN) data connection and will be
15

automatically converted in near real-time to accessible data formats that can be made
available to the teams via data access and visualization applications.
Based on previous experience, the mission designers hypothesized that many
issues will affect the decision cycle of the science team, one of which is data overload
[26]. They therefore specifically addressed the following questions in the work system
design for Victoria:
1. How will science data be gathered collaboratively with the Earth-based science
team, rover teleoperator, and the rover on the lunar surface?
2. How will science data be made available to the science team?
3. What is the effect of a particular work system design on the power
consumption of the rover during a science traverse into a permanent dark
crater?
To answer these questions we developed a model of the activities of the teams,
based on the description of a planned mission traverse.
Purpose of the Victoria model The major limitation of current robot energy modeling tools, apart from model
maintenance, is the inability to include human factors in the calculations of the power
consumption of the rover. Before our case study, the influence of earth-based operations
practice on the energy usage of the rover was unknown. The purpose of the case study
was to a) prove that we could model this complex work system and b) determine the
effect of a particular work system design on the power consumption of the rover during a
science traverse into a permanent dark crater.
16

The model prescribes a work system design by incorporating a model of the
locations and movement of the rover and teams, activities of all the Earth-based teams,
the rover, their communication actions, as well as the hardware and software systems that
are used. Next, we give a brief description of the design of the Victoria work system. For
a more detailed description we refer the reader to chapter 8 in [23].
Agent model Figure 5 shows the group membership hierarchy on which the design of the work
system is based. The agents in the model are the Earth-based human teams and the
Victoria rover, as shown in Figure 4. The teams are represented as single agents, because
at this moment it is not possible to prescribe the composition and practices of each team
in more detail. For example, the “plan a command sequence” activity of the SOT
represents the work of the team, while the individual activities of each team member
remain unspecified.
[FIGURE 5 HERE]
The VictoriaRover is modeled as an agent because it has activities, including
primitive actions that change the world, movements, and communications2.
Table 1 shows a possible distribution of the functions over the Victoria teams
[28]. Details of how different teams collaborate to perform these functions constitute the
work practice, specified in Brahms workframes of the different agents.
[TABLE 1 HERE]
2 Strictly speaking, activities of designed objects are only formal processes. Activities of people
are conceptualizations. However in a Brahms model both are abstractions in a formal language, so the
distinction is how we interpret the model, what it represents, rather than how the simulation operates.
17

An example workframe for the Data Analysis and Interpretation Team (DAIT
agent) is interpreting the hydrogen data being downlinked by the Victoria rover, when it
is detecting hydrogen.
workframe wf_InterpretHydrogenData
variables:
foreach(Data) nd;
when (knownval(current.notifyUser = interpretdata) and
knownval(VisualizationSystem.neutronDetectorData = nd))
do
InterpretHydrogenData(110, nd);
conclude((current.notifyUser = receivedhydrogendata);
The workframe states that if the DAIT agent believes that it needs to interpret
science data and the DAIT agent believes that the data visualization system has neutron
spectrometry data available, the DAIT agent will start the interpretation of the Hydrogen
data. Once it is done with the interpretation it believes that it has received new hydrogen
data, which will make the DAIT agent communicate this information to the SOT agent
(not shown).
Object Model A Brahms object model consists of the classes and instances of physical artifacts,
as well the data objects created during the simulation. The Victoria object model, shown
in Figure 6, includes classes for the science instruments on the rover, as well as other
18

objects contained in the rover, such as the carousel and the battery. The data
communicator class includes the objects for S-band and Uhf communication. The model
also represents software systems that receive, convert, and visualize mission data. The
Data and CoreSample classes dynamically create data instances and lunar core sample
objects during the simulation.
[FIGURE 6 HERE]
For example, the uplink command for the Victoria rover contains a dynamically
created data object containing beliefs that represent the command sequence data being
uplinked.
CommandSequence2 instanceof Data (VictoriaRover.nextActivity = SearchForWaterIceInPermanentDarkAreaActivity); (VictoriaRover.subActivity = projects.victoria.DrillingActivity); (SATM.lengthIntoSurface = 10.0); (SATM.sampleVolume = 1.0);
In the above example the CommandSequence2 data object contains two
commands. The first to tell the rover its next activity is to search for water ice. This will
put the rover in a water ice search state. The second command is a sub-activity command
stating that the rover should start a drilling activity in which it should drill for 10 cm into
the lunar surface and then should take a 1.0cc sample (the SATM object is the lunar
surface drill on the rover).
Geography Model The Victoria geography model, shown in Figure 7, represents locations on the
Earth and Moon (cf. Figure 4). The dotted lines in Figure 7 show class-instance
relationships, whereas the solid lines show part-of relations.
19

[FIGURE 7 HERE]
The Victoria teams and systems are located in Building244; the UsnDish1
satellite dish is located in the area UsnSatelliteLocation. Locations for the simulated
scenario are represented on the Moon (described in the next section):
ShadowEdgeOfCraterSN1 represents the location of the rover at the start of the
simulation (the shadow edge that is in crater SN1). ShadowArea1InCraterSN1 represents
the location in the permanent shadowed SN1 crater where the rover will perform a
drilling activity. The LandingSite area is only represented for completeness.
Victoria Model Simulation Results The simulation provides visibility into the behavior of the work system over time,
that is, activities, communication, and movement of each agent and object. After the
model is developed and compiled, the Brahms simulation engine executes the model. A
relational simulation history database is created, including every simulation event. An
end-user display tool called the AgentViewer uses this database to display all groups,
classes, agents, objects, and areas in a selectable tree view. The end-user can select the
agents and objects he/she wants to investigate. The AgentViewer displays a workframe-
activity hierarchy time line of the agents and objects selected, optionally showing agent
and object communications. Using this view the end-user can investigate what happened
during the simulation (see Figure 8). For an explanation of the AgentViewer see
. Appendix: AGENTVIEWER EXPLANATION SHEET
[FIGURE 8 HERE]
In addition to the timeline output from the AgentViewer, we are able to generate
statistical data graphs based on calculations made during simulation. The same relational
20

simulation history database used for the AgentViewer display was used to generate
graphs. We generated energy consumption of the robot based on the uplink command
from the Vehicle Spacecraft Operations Team in Figure 8 (see Figure 9).
[FIGURE 9 HERE]
The Victoria case study shows how Brahms can be used to model and analyze
operations for new robotic mission proposals. We are able to show the effect of the work
process of Earth-based teams on activities and energy consumption of the rover. By
combining models of work activities, decision-making, communication, location and
movement of people, as well as activities of the robot, mission critical systems and
mission data, we were able to simulate the complex interactions between all the
components in the work system. The benefit of the approach lies in the ability to show
how the relations between all the elements change over time through agent interaction.
The simulation allows mission designers to compare different work system designs
during the proposal phase and provides guidance to mission and robot designers,
replacing a spreadsheet approach by a more transparent, flexible, and reusable multiagent
simulation and work process representation.
Next, we discuss how the Brahms modeling and simulation approach is being
used for mission operations work system design for the next robotic mission to Mars.
Whereas the Victoria mission was in the proposal stage and not selected to become an
actual mission3, the MER mission is a funded mission and is currently in its design and
implementation phase.
3 There are many mission proposals submitted for robotic space exploration. The chance for a
mission proposal to be selected to become a funded NASA mission is less than five percent.
21

MER Mission Operations Work System Design The Mars Exploration Rover (MER) mission to the surface of Mars is a dual-
robot mission with unprecedented capability (Figure 10). With a complement of remote
sensing and in-situ science instruments, and the ability to traverse a distance in one day
roughly equivalent to the distance traversed by Pathfinder’s Sojourner Rover over its
entire mission lifetime, the MER Rovers provide new operational capabilities and
challenges. The MER mission is planned to start in December of 2003 with the launch of
the MER-A rover. One month later the MER-B rover will be launched. The Jet
Propulsion Laboratory (JPL) in Pasadena, CA operates the MER mission (Figure 11). At
the moment of writing this paper, the MER mission operations systems (MOS) design
team is still working on designing and testing some of the mission operations concepts.
[FIGURE 10 HERE]
Based on the results from the Victoria case study, the Brahms team was asked to
model the work process of the MER mission to analyze the design of the mission
operations work system. Initially, analysis reports generated from a Brahms simulation
are being used in two ways: to develop procedures for the different organizational roles
and activities and to verify these procedures during their intermediate operations field
tests at JPL.
[FIGURE 11 HERE]
The next section describes the Brahms MER model design and its use during the
ongoing MER mission operations work system design phase.
MER Mission Operations Challenges The planned operational lifetime of each rover on the surface is ninety days. To
exploit the capability of each rover requires two complete separate teams of scientists and
22

engineers to receive and analyze data, develop science strategies, and uplink movement
and instrument commands on a daily basis. To synchronize the activities on Earth with
those of the rovers on Mars, the mission clock in Pasadena, including the MOS process,
will be on Mars time. With a landing separation of roughly one month, there will be a
significant period of dual rover operations, most likely in different Mars time zones.
The MER MOS team at JPL is responsible for developing an integrated work
system to operate the MER rovers. This system includes the people, operations processes,
procedures, and tools (see Figure 12). Based on daily analysis of newly returned data,
scientists will develop strategies for acquisition of more data. Engineers develop
strategies to operate the rover. Together, they develop time-ordered and constraint-
checked sequences of activities, which are then transformed into commands and uplinked
to the rover. Throughout, the MOS team must keep the rover safe and maximize its
productivity.
[FIGURE 12 HERE]
The challenge facing MOS designers is to make people, processes, tools and
procedures work together in an operational environment that has never been attempted
before—dual rover operations on the Martian surface. To test and verify the system
design, training exercises called operations readiness tests (ORTs) will be performed few
months prior to landing on Mars. At that point it is too late to make any fundamental
changes in the system software design, though procedural changes may still be
accommodated. Given the mission critical nature of the operations system, and the
limited opportunities for early testing and verification, an effective set of tools to aid in
the development and verification of the system early in the design process—when
23

fundamental design changes are still possible—could greatly increase the efficiency and
productivity of a mission operations system. Current tools create static representations of
people, procedures and events, and do not take into consideration dynamic interactions
among different elements of the work system. An integrated view of the relationship of
the ground system design to the space system design is also not possible with current
tools.
A more complete representation of work system elements, simulating the
interactions between people, objects and geography in a complete work system, including
a model of the rover, has the potential to assist mission operations system designers in
creating designs that are safer and more efficient. The next section describes our human-
centered approach to the design of the MER work system. The approach is based on
socio-technical systems approaches from the sixties and seventies, as well as the
participatory design approaches from the eighties [25].
Participatory Design A number of work design approaches have been described in the past decade.
Most of them are developed through qualitative research in interdisciplinary academic
fields that combine social science with systems analysis [15]. The wave of Scandinavian
participatory design projects in the late eighties [9] epitomizes this approach.
In redesigning a work system the designers have to understand how the work is
actually performed. In the case of the MER mission operations this is difficult, because
the work system will be largely new. Therefore, we apply the central principle of
participatory design by forming a joint design team [12]. Because computer scientists are
largely unknowledgeable about mission operations for robotic missions, including
24

experienced JPL mission operations personnel in the redesign process is essential for
influencing and successfully designing MER operations. Indeed, our JPL colleagues
might say the converse is true, too, that they require the methods of work systems design,
modeling, and simulation to succeed.
Given that the MER MOS exists only as a design specification that is still
evolving and changing rapidly, how do we model and simulate it? We considered
building the model based on high-level work process specifications from JPL, however
this had several shortcomings, including the rapidly changing nature of the design and the
difficulty in keeping the documentation up to date. This is a well-known problem in
software engineering, and is one of the reasons why a model-based design approach is
helpful [16]. The modeling effort not only documents the design, it also drives the
analysis and design process itself [21]. We decided to conduct interviews with key MER
team members, asking them to describe their future MER job activities, information
needs, interfaces and tools. Based on this data we were able to build a simulation model
showing the key MOS positions as agents, their interactions with other agents and
objects, and the need for specific information during their activities.
After the first model was developed, we went back to the team members to verify
the model. In our first model, by comprehensively relating multiple agents acting at
different times and places, we were already able to reveal some discrepancies in what the
different team members described as their work activities and information needs.
Specifically the interaction between key people during meetings and informal
information exchanges was shown to be problematic (described below).
25

A key aspect of our participatory design approach is to have the simulation be
actively used by the MER team during mission operations reenactments. During these
reenactments the output from the simulation (activities, timelines, information flow and
communication) is shown on a large computer-based white board called the MERBoard
(see Figure 13).
[FIGURE 13 HERE]
Scientists and engineers can use this display to display the simulation, verify their
personal activities, and correct the model. Thus, the output from the simulation model
serves two purposes; 1) it serves as a reminder of what the person is supposed to be
doing—much like a procedure, and 2) it allows the MER MOS team to change the design
of the work system during the reenactment, by directly annotating the simulation output.
In summary, we apply a participatory approach to simulation-based work systems
design. As is common in work environments, it is not possible to add to the JPL team’s
workload. Developing the simulation model so it is integrated with and supports the
already occurring design process enables modelers to participate in the design process,
and provides the MER team with data that they would otherwise not have. Because our
model is based on the team’s own perceptions of the work as described in interviews and
during reenactments, the team has an inherent interest in seeing the results, and
participates in refining the design through the model. Others have described this problem
in business reengineering projects a decade ago [20].
Modeling and Simulation Tools for Mission Operations Design and Support
In this last section of the paper, we describe the design of the MER Brahms model
in more detail. We contrast each MER model component with the Victoria model. The
26

reader is reminded that the Victoria model was a first case study of using Brahms for
designing a work system for a robotic mission. Given the positive result of this case
study, we started to apply our method to MER, an actual mission. Although we were
confident that we could model and simulate the mission operations for the MER mission,
we had no experience in affecting a real work systems design effort. We started the effort
with the Victoria model as our guiding principle, changing this model to represent more
detailed mission practices. Hence, it is useful in describing the MER model to draw
contrast with Victoria. The last subsection presents the output of the MER MOS
simulation and discusses what it reveals.
Agent Model The agent model is based on JPL’s organizational design of the MER mission
operations team. The group membership hierarchy of the model is shown in Figure 14.
Like the Victoria model, the agents modeled are within the Earth-based mission
operations teams and the Athena rover. Only key positions within each team are modeled
as agents, because the details of the composition of each team are still being identified as
the design of the MER MOS continues. Also, the work practices of these key team
members are not completely known at this time. However, in contrast with agents
representing whole teams in the Victoria model, agents in the MER model represent
specific individuals. Five Science Theme Groups lie within the Science Ops Working
Group. Each serves as a forum for discipline-specific science analysis, discussion, and
planning. Only two of the five science theme groups are modeled currently; the
anticipated work practice of the other groups is assumed to be similar. As in the Victoria
27

model, the Athena rover is modeled as an agent because it has activities, including
primitive actions that change the world, movements, and communications.
[FIGURE 14 HERE]
As in the Victoria model, MER agents participate in two main processes—
downlink and uplink. The downlink process consists mainly of collection, enhancement
and analysis of data returned by the rover. Besides building commands for the rover to
execute, the uplink process also includes decisions and trade-offs to satisfy both science
and engineering goals, based on available image and instrument data. Table 2 shows the
functional activities distributed among the MER Operations teams in each process. As in
the Victoria model, the details of agent activities constitute the work practice, specified in
workframes.
[TABLE 2 HERE]
On close inspection of the MER and the Victoria agents’ functional activities,
similarities can be seen in respective groups. The MER and the Victoria group hierarchies
are almost equivalent ( ). Table 3
[TABLE 3 HERE]
The Victoria agent model is less detailed than the MER agent model, because of
the proposal stage of the Victoria project. MER is an actual mission, so more operations
have been thought through and documented.
Object Model As in the Victoria model, the object model for MER consists of classes for
physical objects, artifacts and data, plus dynamically created instances of data (
):
Figure
15
28
• Science instruments and the instrument deployment device on the rover, which all
consume energy.
• Communication devices for both S-Band and UHF data, between the Earth-based
team and the rover on Mars.
• Software systems (Ground Data Systems) to receive data from the rover, convert
data for analysis and archival by the Earth-based team, and send command data to
the rover.
• Information about rover health and measurements taken by instruments on board.
[FIGURE 15 HERE]
The MER object model expands upon Victoria by replacing the Data Conversion
System with the Data Acquisition Command Subsystem and the Operations Product
Generation Subsystem, based on the actual systems being developed (c.f. Figure 6). Also,
Victoria’s Tele-Operation System is contained within the Engineering Analysis
Subsystem and Victoria’s Visualization System is part of the Activity Planning
Sequencing Subsystem, which provides both visualization and rover activity planning
and sequencing functionality.
[TABLE 16 HERE]
Figure 16 shows a further expansion of Victoria’s data object model for MER. In addition
to the objects representing data returned by the rover, the model now includes
representations of statically and dynamically created reports and activity plans by the
Earth-based teams. The model will eventually include the fields contained in these
reports and how this information could affect rover activity planning
29

Agent Beliefs Unlike the agents in the Victoria model, the agents in the MER model are individual
people (there names are invented and do not denote real people at JPL). Consequently,
the MER model has a higher level of detail, which results in a larger belief set for the
individual agents. Figure 17 shows part of the inherited attributes for the geology science
theme lead agent (MA_Geology_Lead). Attributes are used to define what beliefs (and
facts) can be created about the agent. For example, agents that are members of the
MER_Mission_Team group can have beliefs about the time of day on Earth
(perceivedHour, perceivedMinute in Figure 17), as well as the current and previous Mars
Sol number (thisSolNum, prevSolNum).
[FIGURE 17 HERE] AND [FIGURE 18 HERE]
Figure 18 shows the initial beliefs that the MA_Geology_Lead agent gets at the
start of a simulation4. Since the MA_Geology_Lead agent is a member of the
MER_Mission_Team group, it inherits all the initial beliefs defined at that group level.
The initial beliefs of agents and objects define the start state of a simulated scenario.
Figure 18 shows that the agent believes that the simulation starts at midnight on Mars and
at Mars Sol two (i.e. the second mission day on Mars).
Activities and Workframes Space withholds us from giving an extensive overview of the agent and object’s
activities and workframes. We will only give one example so that the reader gets an idea
of the detailed agent behavior in the model.
4 This and the next three figures are screenshots of the MER Agent Model, displayed in the
Brahms IDE.
30

Every science theme lead needs to be at the Science Ops Working Group
(SOWG) meeting that is held at 7pm every Sol. The SOWG meeting is the meeting
where the science team decides what to do in the next Sol.
[FIGURE 19 HERE] AND [FIGURE 20 HERE]
Figure 19 shows the SOWG_Meeting composite activity in the
Science_Theme_Lead group. Every member agent of the group will inherit the activity
and thus has the ability to attend and participate in the SOWG meeting. As described in
the Brahms Language section, an agent cannot just execute an activity. The
SOWG_Meeting activity needs to have a workframe that constraints when the activity
can be performed. Figure 20 shows this SOWG_Meeting workframe also defined in the
Science_Theme_Group. The preconditions state that when the agent believes that the
clock in the his office (“clk.location = current.MyOffice” in ) shows that it is
7pm (“clk.hour = 19”), the workframe becomes active and based on priority scheduling
of the engine the agent will perform the SOWG_Meeting activity. This simulates that the
agent must actually “see” (i.e. detect) that the clock’s time shows 7pm, which means that
the agent must be in his office to actually get this belief. It also means that if the agent
does not detect the time the agent will not be at the meeting, and if the agent detects the
clock’s time late (i.e. after 7pm) the agent will be late for the meeting. Thus, whether the
agent shows up for the meeting and when is a consequence of the dynamics of the
simulation. The principal science investigator told us that if he is chairing the meeting,
the SOWG meeting will start on time regardless who is there. This behavior is
implemented in the model, and the simulation shows the influence of this practice.
Figure 20
31

Geography Model As in the Victoria model, locations on Earth and Mars are represented.
[FIGURE 21 HERE
Figure 21 shows Hematite, the planned landing site of the Athena rover. At the
start of the simulation, the rover is located at this landing site. The Earth-based teams are
housed in Building A and Building B5. The engineering team is in a large room in
Building A. The instrument or “payload” teams and the science teams are in Building B.
Each instrument team has a separate room, however science teams are placed together in
a single large room. The conference room, where the science teams, engineering teams
and the instrument teams meet, is located on a separate floor within Building B.
Modeling an agent’s location and movement within Building B has required a more
detailed representation than in Victoria model; part of the representation is shown in
. Figure 22
[FIGURE 22 HERE]
The geography model includes the travel time between each room in and between
buildings. In this way, the simulation can keep track of each agent’s travel time to
meeting rooms, showing the influence of the layout design of the buildings on operations
efficiency.
MER Simulation Scenario As for Victoria simulation, the objective of the MER simulation is to understand
the communication and interactions between people holding key positions within the
5 Due to the sensitivity of the information, the actual MER Building names and numbers are changed.
32

earth-based mission operations teams for a twenty-four hour period, outlined in this
scenario:
The rover has been at the planned landing site called “Hematite” for one sol (a Martian day). During
that sol, the rover used its panoramic camera, henceforth known as the Pancam, to take a picture of its
surroundings and also uses its Mini-Thermal Emission Spectrometer, henceforth known as the Mini-TES, to
penetrate through dust coatings, looking for carbonates, silicates, organic molecules and minerals that are
formed in water on the surface of Martian rocks. As evening approaches on Mars, the rover sends the
panoramic image taken by the Pancam and data gathered by its Mini-TES back to the mission operations
team on Earth.
The data is first received by the engineering and payload teams for enhancement. After data
enhancement, analysis of the data is carried out by these teams to determine what health and configuration
activities needs to be carried out by the rover and its payload for the next sol.
At the same time, the data is made available to the two different discipline-specific science teams. Each
discipline-specific science team analyzes the data for possible scientific investigations to be carried out in
the next sol. The two discipline-specific science teams get together to discuss their respective science
discoveries and together they identify a science target for the next sol. The science target is picked because
the initial panoramic Mini-TES data indicates the possible existence of a mineral formed in water on its
surface.
After analysis by the engineering, payload and science teams is completed, they get together to
exchange information. The engineering and payload teams share information about the health and safety
constraints of the rover and its payload while the science team give their scientific intent for the next sol.
With the understanding of the information presented by the engineering and payload teams, the science
teams present their rational to approach the target identified previously in order to get a closer image and
Mini-TES reading.
At the end of the discussion various people leave the room and only a core group of people from the
engineering, payload and science teams remain behind. This core team discusses the final combination of
the various activities, proposed by each team, for the rover to perform in the next sol. Trade-offs between
33

engineering and science activities are discussed and a final sequence of high-level commands for execution
are formed. The sequence of high-level commands will then be translated into lower-level commands that
the rover understands.
By the time this sequence of high-level commands is formed, most people would have worked
approximately ten hours and a second group of people will come to take over the translation of commands
and transmission to the rover. Each person in a key position will go off and hand over information to their
corresponding person in the same position before heading home.
Finally, the second shift of people build and transmit the commands to the rover.
Simulation Results As in the Victoria model, the simulation provides a visible representation of the
activities in the work system over time. Using the AgentViewer tool to show events that
happen during the simulation on a timeline format has revealed interesting
communications behavior in the initial design of MER operations.
Communication Activities Synchronizing communication between key personnel was identified as being
important during the collaborative modeling effort between the Brahms modeler and the
mission operations design team. Indeed, the simulation output showed some problems.
shows that, after performing an initial “quick health check of rover”, the
Tactical Downlink Lead tries to “confer with SOWG” Chair to provide an update of the
status of the rover’s health. Unfortunately, the Science Ops Working Group (SOWG)
Chair is still at home and not available to receive this update. When the SOWG Chair
arrives at the Science Work Room, the SOWG Chair tries to “understand state of rover”
by requesting information from the Tactical Downlink Lead who is not available, because
(s)he is busy trying to get a “preliminary engineering activity plan update” from the
Figure 23
34

engineers in the Mission Support Area. Without information about the status of the
rover—information that may be crucial when problems occur—the simulation shows the
SOWG chair nevertheless proceeding to meet with the science theme group members to
decide about the science investigations for the next sol.
[FIGURE 23 HERE]
Handover Activities The mission operations design team has been concerned about the fatigue of
people in key positions. These people will work about ten hours from the moment they
receive data from the rover until making a decision about what the rover should do for the
next sol. The mission operations design team decided that a second shift of people
fulfilling the same key positions will be necessary to relieve the duties of the first shift.
Considerable work systems design effort focuses on providing the second shift with the
contextual information they need to quickly take over the duties of the first shift. One of
the early recommendations from this study is to provide the second shift not only with a
verbal face-to-face update, but also to hand over a report. shows the verbal
face-to-face communication of information in the Science Work Room between the
SOWG Chair and the Science Uplink Representative during “Debrief shift 2.” The
SOWG Chair tells the Science Uplink Representative what science investigations the
science team has agreed upon and what rover and payload activities need to be carried
out in the next sol. All this information was previously discussed during the “SOWG
Meeting” and documented in the “MER A Sol 2 Science Activity Plan,”
Figure 24
[FIGURE 24 HERE]
35

Movement Activities The mission operations design team is aware that locating people who need to
interact with each other in close proximity will be important during the mission. In the
design, the engineering team is in Building A and the science team on the Xth floor of
Building B. The conference room, where meetings are held, is on the Zth floor of
Building B. The simulation reveals, as shown in Figure 25, how people spend a
significant amount of time traveling to the conference room to hold a meeting, which is
two floors above the floor where they perform most of their work. The facility plans
mention that during the mission, security devices will be installed on doors to restrict
access from floor to floor within a building. These security doors will further increase the
time required for people to move. In light of the simulation, the mission operations design
team decided to move the engineering team from Building A to the Xth floor in Building
B, the same building and floor as the science team.
[FIGURE 25 HERE]
Reports Generated A relational database, including every simulation event, is created when Brahms’
simulation engine executes the model. This database allows reports and statistical
information to be generated for analysis. In particular, the mission operations design
team requested a daily schedule for every key position, which we provided from the
simulation output by using database queries. For example, Figure 26 shows every activity
that the Tactical Downlink Lead position will perform during a day of mission
operations.
[FIGURE 26 HERE]
36

Besides scheduling activities for every key position, the mission operations design
team also wants to ensure that information and reports that each key position needs are
available when required. Another report was generated from the Brahms simulation
database to assist in the mission operations design team’s effort, shown in Figure 27.
[FIGURE 27 HERE]
Conclusions In this paper we described how Brahms is used to design a work system for semi-
autonomous robotic mission operations. The simulations show the influence of the work
practice of Earth-based teams on activities and energy consumption of the rover and
allow mission designers to compare different work systems, before critical mission
decisions have been implemented.
The multiagent, object-oriented activity-based approach of Brahms, including
explicit representations of geography, systems, and data, reveals the interaction of facility
layouts, schedules, reports, handovers, and procedures.
We have presented a collaborative work system design methodology
incorporating simulation of work practices. The Brahms modeling framework provides
guidance to mission and robot designers, replacing a spreadsheet and informal design
approach by a participatory approach that represents the total work system in a formal
model with adjustable levels of detail. We illustrated the representational capabilities of
the Brahms environment by describing its use for both the Victoria proposal and the
actual MER mission design.
The purpose of the simulations is to show the dynamics and interactions between
individual entities (people and machines) in the work system, as well as calculate
37

duration time, energy consumption and other relevant statistics. Being able to show how
a work system will behave over time before it has been implemented provides work
system designers with a powerful design tool. Formalizing and then simulating work
practice descriptions creates a deeper understanding of the dynamic relationships that
exist in the system. Indeed, being able to show the obvious in excruciating detail can be a
powerful reminder of how the design influences how the system with its problems
develops over time. The results from the MER simulation shown in the previous sections
might seem obvious to the reader, and one might question its benefits. Indeed, the
problems are not especially complex and might have been discovered without the
simulation. However, the fact remains that dysfunctional work systems are
commonplace. Our intent is to provide a tool for reflecting on a design and anticipating
problems. For example, before the simulation included the geography model the MER
mission operation designers did not believe that separating the teams and conference
rooms into different buildings would cause difficulty. They may have noted the distance
and security doors that had to be negotiated, but they accepted the design without
concern. The simulation calculates how much time is actually lost, and thus is able to
characterize and formalize the implications of this "obvious" feature. Without a
simulation, interacting tradeoffs are difficult to evaluate, and only opinions prevail. The
simulation output has brought this to the mission design team’s attention. The building
design is being changed in part due to the simulation.
The models described in this paper might not at first seem relevant for more
traditional organizations. Indeed, the mission operations work systems for robotic
missions are non-existing, special-case, short-term organizations that exist only for the
38
duration of a mission (in case of the MER mission only for 90 days). However, we have
shown that both the organizational and information management issues are similar to
those in conventional business organizations. The SOWG meeting example in the MER
model can be seen as any daily business meeting in a traditional organization, similarly
for the use of the information systems. We are therefore convinced, besides the fact that
Brahms research was from the start grounded in the telephone company domain, that the
Brahms framework is directly applicable to other types of organizations. In particular,
when an organization already exists a descriptive modeling phase is possible. This
enables analyzing organizational change by showing the effects of a process redesign on
the existing organization at the level of the work practice (as opposed to only showing a
static normative workflow).
We emphasize that our approach, using Brahms, provides substantive grounding
when a design team includes people who will be doing the future work. Combining
modeling with participatory socio-technical design allows both teams—the modelers and
the workers—to engage in a joint design effort. Without the notion of partnership and co-
design from the start, the Brahms model could not have meaningful content and the
results might not be examined and used. Hence, the Brahms tool is not just a way of
representing work, but an instrument for forming and sustaining an effective
multidisciplinary team.
39

Appendix: AGENTVIEWER EXPLANATION SHEET
[FIGURE 28 HERE]
a) Using the menu-bar, the end-user can parse the simulation history data into a history
database, and open a history database for viewing.
b) When the database is opened all the agents and objects are loaded into the tree view.
Using the tree view, the end-user can select which agents and/or objects (s)he wants
to view in the time-line view.
c) By selecting to view the agent/object communication, the (blue) arrows show all the
communication activities, and the direction of the communication (sender and
receivers). The communicated beliefs are also accessible by clicking on the square at
the top of the sender side of the communication arrow.
d) For each agent/object the ”current” location is shown. When the agent/object moves
to a new location, it is shown as a change in the location name and color.
e) The time-line can show the time in different time-intervals, therewith zooming in and
out.
f) The tool-tip pops up when the mouse is moved over “hot spots”. The hot spots are
those areas where more information is available than can be shown on the screen. By
moving the mouse over those areas the hidden information pops up in a tool-tip, such
as the name of a workframe or activity.
g) The Activity-Context Tree is the central piece of the agent/object time-line. It shows
the workframe and activities hierarchy of the agent or object.
40

h) The touch-object line is a (yellow) line that is shown when the agent/object is using
certain objects in its activity. “Touch objects” are used to calculate the time those
objects are used in activities.
i) The explanation facility view is used to display more detailed information about the
execution of workframes. By clicking on any workframe (light blue in color), an
explanation facility window is opened for the workframe at hand.
j) By selecting the “Active” tab in the explanation facility view, the executed statements
in the workframe body are shown.
k) You can select the statements in the workframe body to get more info.
l) When you select a statement in the body of the workframe, the total time the activity
was active is shown. Using the other tabs in this view, you can find out the exact time
the workframe became available, as well as the exact time it became active and
ended.
m) Workframes are situated-action rules that execute activities. The top of a Activity-
Context tree is always a workframe. You can recognize a workframe by the “wf:”
symbol, followed by the name of the workframe. When the zoom-level is too high to
contain the name of the workframe it is left out of the display. Using the tool-tip the
user can find out the name.
n) Composite Activities are executed by workframes, and contain lower-level
workframes. You can recognize Composite Activities by the “ca:” symbol followed
by the name of the activity. When the zoom-level is too high to contain the name of
the activity it is left out of the display. Using the tool-tip the user can find out the
name.
41

o) Primitive Activities are executed by workframes, and are always at the bottom of the
Activity-Context Hierarchy. You can recognize Primitive Activities by the following
symbols, depending on the type of primitive activity: “pa:” (for a primitive activity),
“mv:” (for a move activity), “cw” (for a communicate activity), “co:” (for a create
object activity), followed by the name of the activity. When the zoom-level is too
high to contain the name of the activity it is left out of the display. Using the tool-tip
the user can find out the name.
42

References 1.Clancey, W., J. Situated Cognition: On Human Knowledge and Computer
Representations. Cambridge University Press, 1997.
2.Clancey, W.J. The Conceptual Nature of Knowledge, Situations, and Activity, in P.
Feltovich, R. Hoffman, and K. Ford, ed., Human and Machine Expertise in Context,
Menlo Park, CA: The AAAI Press, 1997, 247-291.
3.Clancey, W.J. Developing learning technologies in practice, in C. Bloom and R.B.
Loftin, ed., Facilitating the Development and Use of Interactive Learning Environments,
Hillsdale, NJ: Lawrence Erlbaum Associates, 1998, pp. 3-20.
4.Clancey, W.J. Simulating Activities: Relating Motives, Deliberation, and Attentive
Coordination. Cognitive Systems Research, 3, 3, (2002), 471-499.
5.Clancey, W.J.; Sachs, P.; Sierhuis, M.; and van Hoof, R. Brahms: Simulating practice
for work systems design. International Journal on Human-Computer Studies, 49, (1998),
831-865.
6.Cornell, http://athena.cornell.edu/. 2001, Cornell University:
7.Davenport, T.H. Process Innovation: Re-engineering Work through Information
Technology. Boston, MA: Harvard Business School Press, 1993.
43

8.Davenport, T.H. The fad that forgot people, Fast Company, Vol. 1995, No. 1,
November 1995 (1995),
9.Ehn, P. Work-Oriented Design of Computer Artifacts. Stockholm, Sweden:
Arbetslivcentrum, 1988.
10.Emery, F.E., and Trist, E.L. Socio-Technical Systems, in C.W. Churchman, ed.,
Management Sciences, Models and Techniques, London: Pergamon, 1960.
11.Goodall, K., http://mars.jpl.nasa.gov/missions/future/2003.html. 2002, JPL:
12.Greenbaum, J., and Kyng, M., ed., Design at Work: Cooperative design of computer
systems, Hillsdale, NJ.: Lawrence Erlbaum, 1991.
13.Hammer, M., and Champy, J. Re-engineering the Corporation. New York, NY:
Harper Collins Publishers, Inc., 1993.
14.Hintikka, J. Knowledge and Belief. Ithaca, NY: Cornell University Press, 1962.
15.Holtzblatt, K., and Jones, S. Contectual Inquiry: A Participatory Technique for System
Design, in A. Namioka D. Schuller, ed., Participatory Design: Principles and Practices,
Hillsdale, NJ.: Lawrence Erbaum Associates, 1993, p. 177-210.
44
16.Jacobson, I. Object-Oriented Software Engineering: A Use Case Driven Approach.
Object Technology Series, Reading, MA: Addison-Wesley Publishing Company, 1994.
17.Konolige, K. A first-order formalization of knowledge and action for a multi-agent
planning system, in J.E. Hayes, D. Mitchie, and Y. Pao, ed., Machine Intelligence, Vol.
10, Chichester, England: Ellis Horwood, 1982, 41-72.
18.Konolige, K. A Deduction Model of Belief. San Mateo, CA: Morgan Kaufmann, 1986.
19.Pava, C.H.P. Managing New Office Technology: An Organizational Strategy. New
York: The Free Press, 1983.
20.Sachs, P. Transforming Work: Collaboration, Learning, and Design. Communications
of the ACM, 38, 9, (1995), pp. 36-44.
21.Schreiber, G.; Akkermans, H.; Anjewierden, A.; Hoog, R.d.; Shadbolt, N.; Velde,
W.v.d.; and Wielinga, B. Knowledge Engineering and Management: The CommonKADS
Methodology. Cambridge, MA: The MIT Press, 2000.
22.Shoham, Y. Agent-oriented programming. Artificial Intelligence, 60(1), (1993), 51-92.
45

23.Sierhuis, M. Modeling and Simulating Work Practice; Brahms: A multiagent
modeling and simulation language for work system analysis and design, Ph.D. thesis,
University of Amsterdam, SIKS Dissertation Series No. 2001-10, (2001).
24.Sierhuis, M., and Clancey, W.J., Knowledge, Practice, Activities, and People, Brian
Gaines. 1997, Proceedings of AAAI Spring Symposium on Artificial Intelligence in
Knowledge Management: Stanford University, CA. 142-148.
25.Sierhuis, M., and Clancey, W.J. Modeling and Simulating Work Practice: A human-
centered method for work systems design. IEEE Intelligent Systems, Volume 17(5),
Special Issue on Human-Centered Computing, (2002),
26.Thomas, G.; M. Reagan; E. A. Bettis III; N. Cabrol; and Rathe, A. Analysis of science
team activities during the 1999 Marsokhod rover field experiment: Implications for
automated planetary surface exploration, The University of Iowa, (1999).
27.van Hoof, R., and Sierhuis, M., Brahms Language Reference,
http://www.agentisolutions.com/documentation/language/ls_title.htm, 2000,
NASA/Ames Research Center:
28.Wall, S.D., and Ledbetter, K.W. Design of Mission Operations Systems for Scientific
Remote Sensing. London: Taylot & Francis, 1991.
46

29.Weisbord, M.R. Productive Workplaces: Organizing and Managing for Dignity,
Meaning, and Community. San Francisco, CA: Jossey-Bass Inc., Publishers, 1987.
30.Wooldridge, M. The logical Modelling of Computational Multi-Agent Systems, Ph.D.
thesis, Department of Computation, UMIST, (1992).
47

Cognitive Model
(inference)
Business Process Model
(functions)
Brahms Model
(activities)
Figure 1. Relation of Brahms models to other models
48

World FactsBeliefs of Agt A
Beliefs of Agt B
Beliefs of Agt C
Beliefs of Agt D
Figure 2. Beliefs and facts Venn diagram
49

Workframe W1
Activity A1.1(primitive)
Activity A1.2(composite)
Workframe W1.2.1 Workframe W1.2.n...........
Activity A1.2.1.2(primitive)
Activity A1.2.1.1(composite)
...... Activity A1.2.n.1(primitive)
Workframe W1.2.1.1.1
Activity A1.2.1.1.1.1(primitive)
Current Activity
Current Activity
Current Activity
Current WorkframeInstantiation
Figure 3. Workframe-Activity hierarchy
50

Figure 4. Victoria mission operations work system
51

MyBaseGroupGroup
Victoria TeamGroup
Science TeamGroup
Data and Downlink TeamAgent
Vehicle and SpacecraftOperations Team
Agent
Science Operations TeamAgent
Instrument Synergy TeamAgent
Data Analysis andInterpretation Team
Agent
DataCommunicatorGroup
VictoriaRoverAgent
RoverGroup
Figure 5. Victoria Agent Model
52
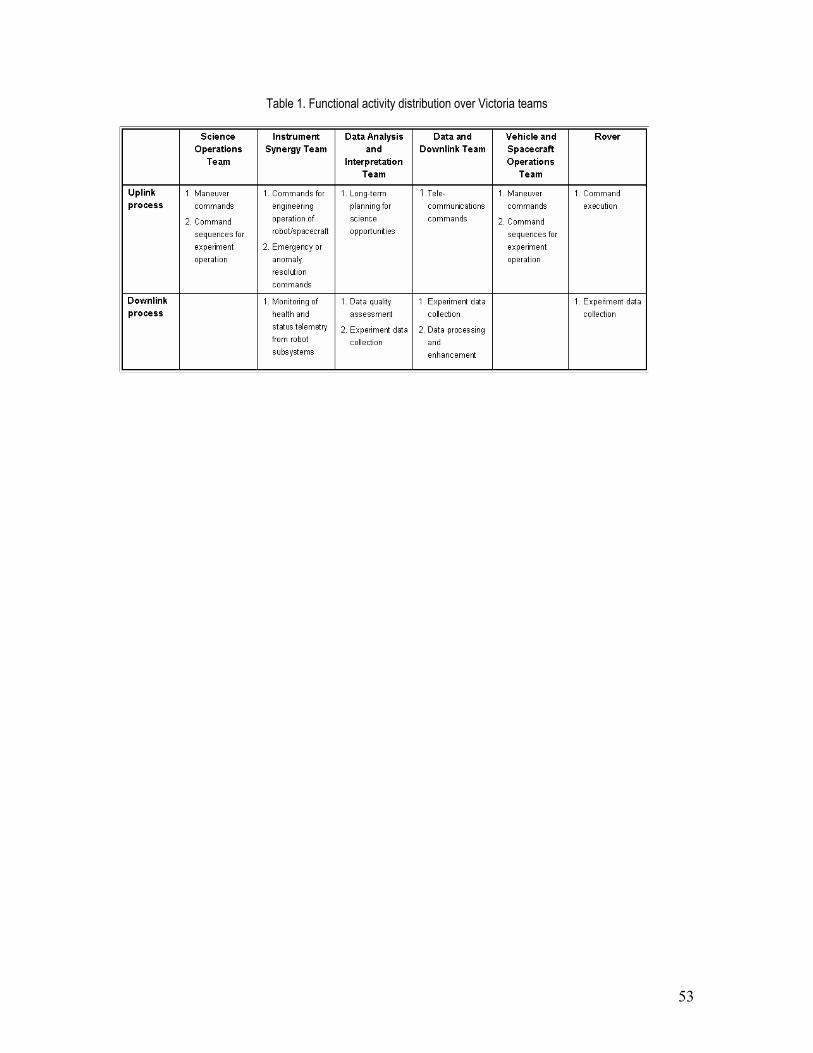
Table 1. Functional activity distribution over Victoria teams
53

Figure 6. Victoria Object Model
54

Universe
BaseAreaDef
Planet Location City Building
VictoriaGeography : Universe Earth : Planet Moon : Planet
*1 *1 *1
*1
Initial Agent LocationInitial Object Location = UsnDish1
UsnSateliteLocation : Location
NasaAmes : City Initial Agent Location = SOT, IST, VSOT DAIT, DDTInitial Object Location = Teleoperation System, Real-Time Data Convertion System, Data Access/Visualization System DVD Storage
Building244 : Building
Initial Agent Location = VictoriaRoverInitial Object Location
ShadowEdgeOfCraterSN1 : Location
ShadowArea1InCraterSN1 : Location
LandingSite : Location
Figure 7. Victoria Geography Model
55

Figure 8. Simulation of downlink and second uplink command activities
56

Figure 9. Energy consumption graphed from the simulation history database
57

Figure 10. The MER mission’s Athena rover showing remote sensing and in-situ instruments
58

Figure 11. The science team on Earth receives data from the rovers and sends commands on a daily basis
59
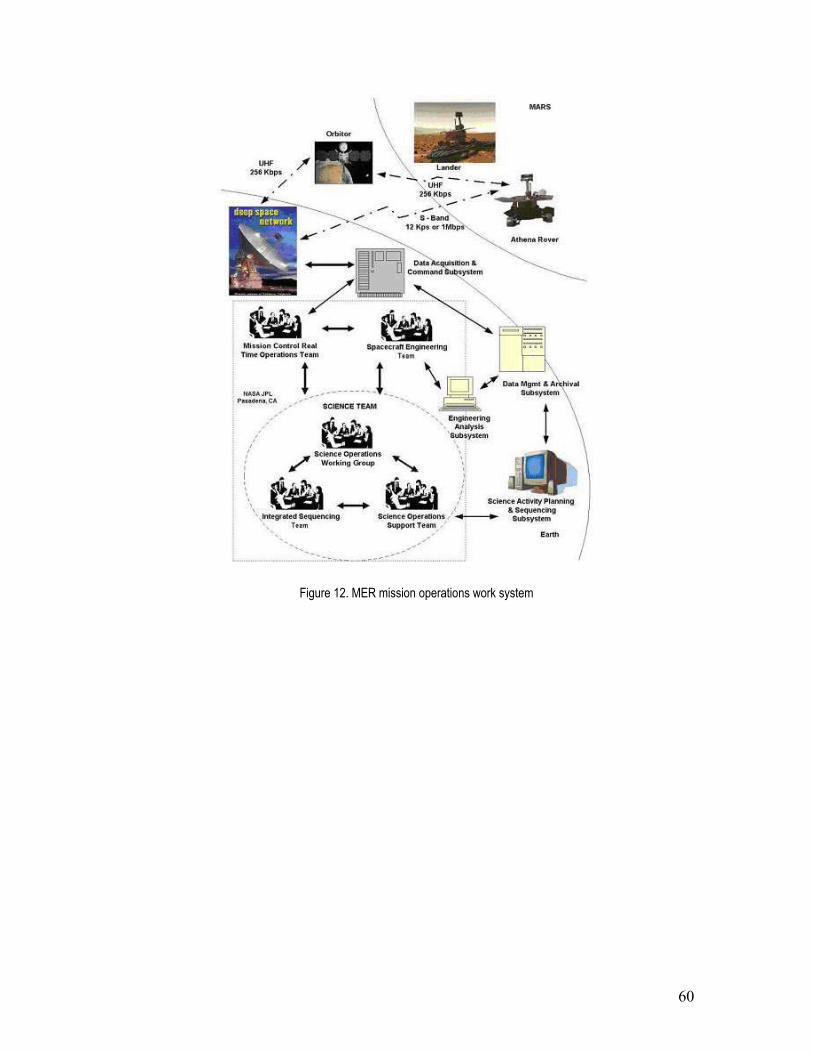
Figure 12. MER mission operations work system
60

Figure 13. MERBoard, a computer-based white board designed to facilitate science team collaborations during the MER mission.
61

.
Figure 14. MER Agent Model
62

Table 2. Functional Activity Distribution over MER Mission Operations Team
Downlink Process Uplink Process
MIPL Team • Collection of rover, image and
payload/instrument data.
• Enhancement of image data.
Spacecraft Engineering Team • Analysis of rover data.
• Identification of expected rover data not
returned.
• Build rover commands for science and
rover maintenance.
• Build rover commands for emergency
or anomaly resolution.
Science Ops Support Team • Enhancement of payload/instrument data.
• Analysis of payload/instrument data.
• Identification of payload/instrument
expected data not returned.
• Build payload/instrument commands
for science or calibration.
• Build payload/instrument commands
for emergency or anomaly resolution.
Geochemistry Theme Group • Scientific analysis of image and
payload/instrument data.
• Recommend both rover and
payload/instrument commands for
science experiments.
Long Term Planning Theme
Group
• Scientific analysis of image and
payload/instrument data.
• Integrate returned data with long term
scientific goals.
• Recommend rover and
payload/instrument commands to
fulfill long-term scientific goals.
• Mission Control Team • Telecommunications between Earth &
Mars.
• Telecommunications between Earth &
Mars.
• Radiation of commands to Rover.
• Rover • Transmission of data. • Execution of commands
63

Table 3. MER and Victoria Agent Model Equivalence
Victoria Agent Model MER Agent Model
Victoria Team MER Mission Team
Instrument Synergy Team Science Ops Support Team
Science Operations Team Science Ops Working Group
Data Analysis and Interpretation Team Spacecraft Engineering Team & Science Ops
Support Team
Vehicle and Spacecraft Operations Team Spacecraft Engineer Team & Mission Control
Team
Data and Downlink Team MIPL Team
Data Communicator Data Communicator Group
Rover Rover
64

Figure 15. MER Physical Object Model
65

Figure 16. MER Data Object Model
66

Figure 17. Group attributes
67

Figure 18. Group initial beliefs
68
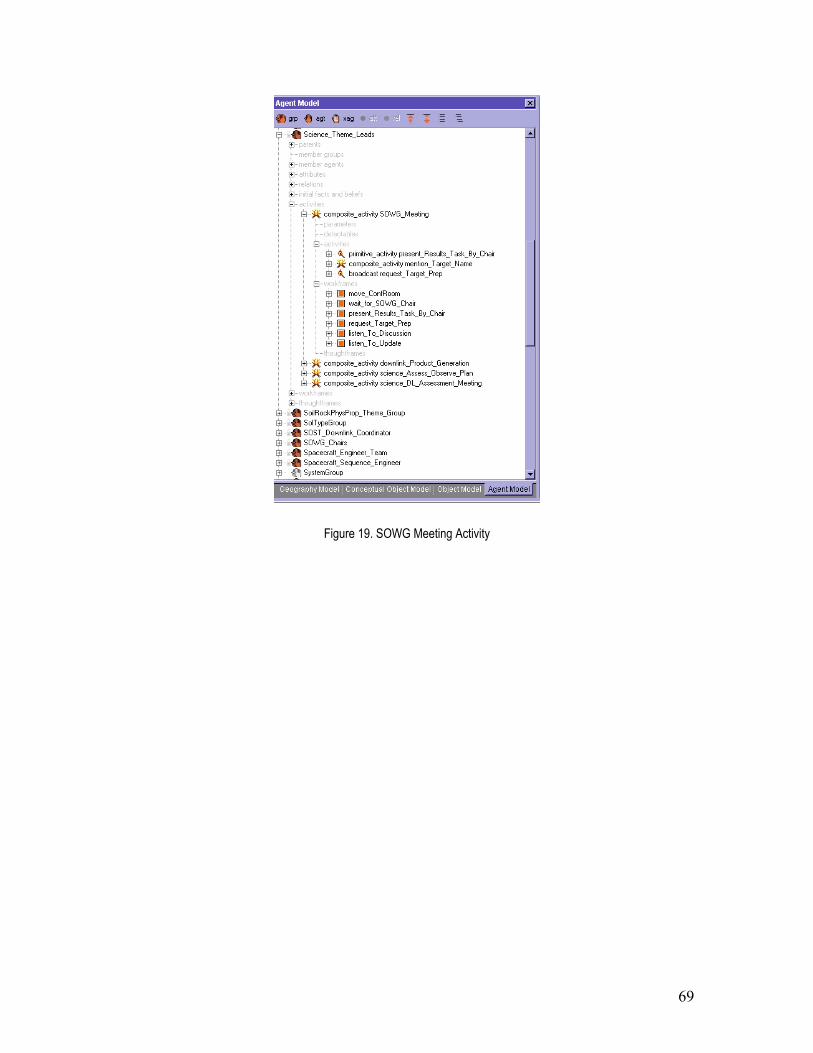
Figure 19. SOWG Meeting Activity
69

Figure 20. SOWG meeting workframe
70

Figure 21. MER Geography Model
71

Figure 22. Building B’s Geography Model
72

Figure 23. Unsynchronized Communication Activities
73

Figure 24. Handover of Information Activities
74

Figure 25. Simulation of Move Activities
75
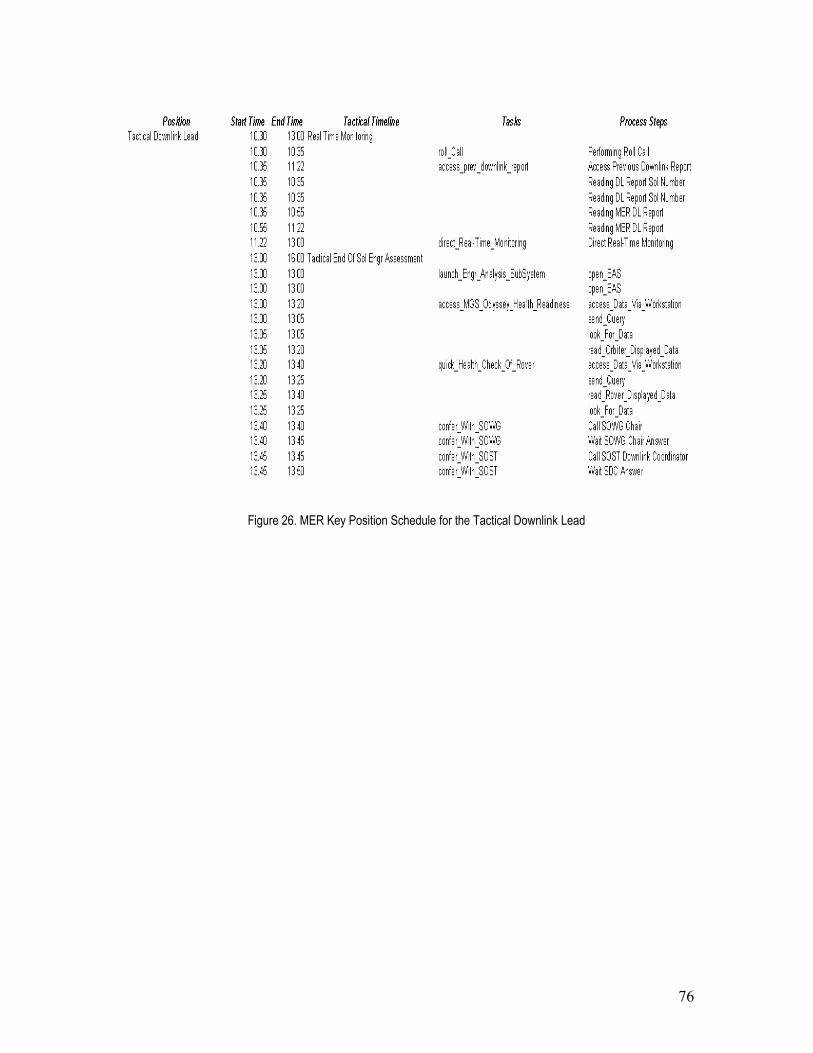
Figure 26. MER Key Position Schedule for the Tactical Downlink Lead
76

Figure 27. MER Reporting Schedule
77

Figure 28. AgentViewer Explanantion
78